
Experimental Investigation of the Flow, Noise, and Vibration Effect on the Construction and Design of Low-Speed Wind Tunnel Structure


Abstract
:1. Introduction
2. Materials and Methods
2.1. Wind Tunnel Design and Construction
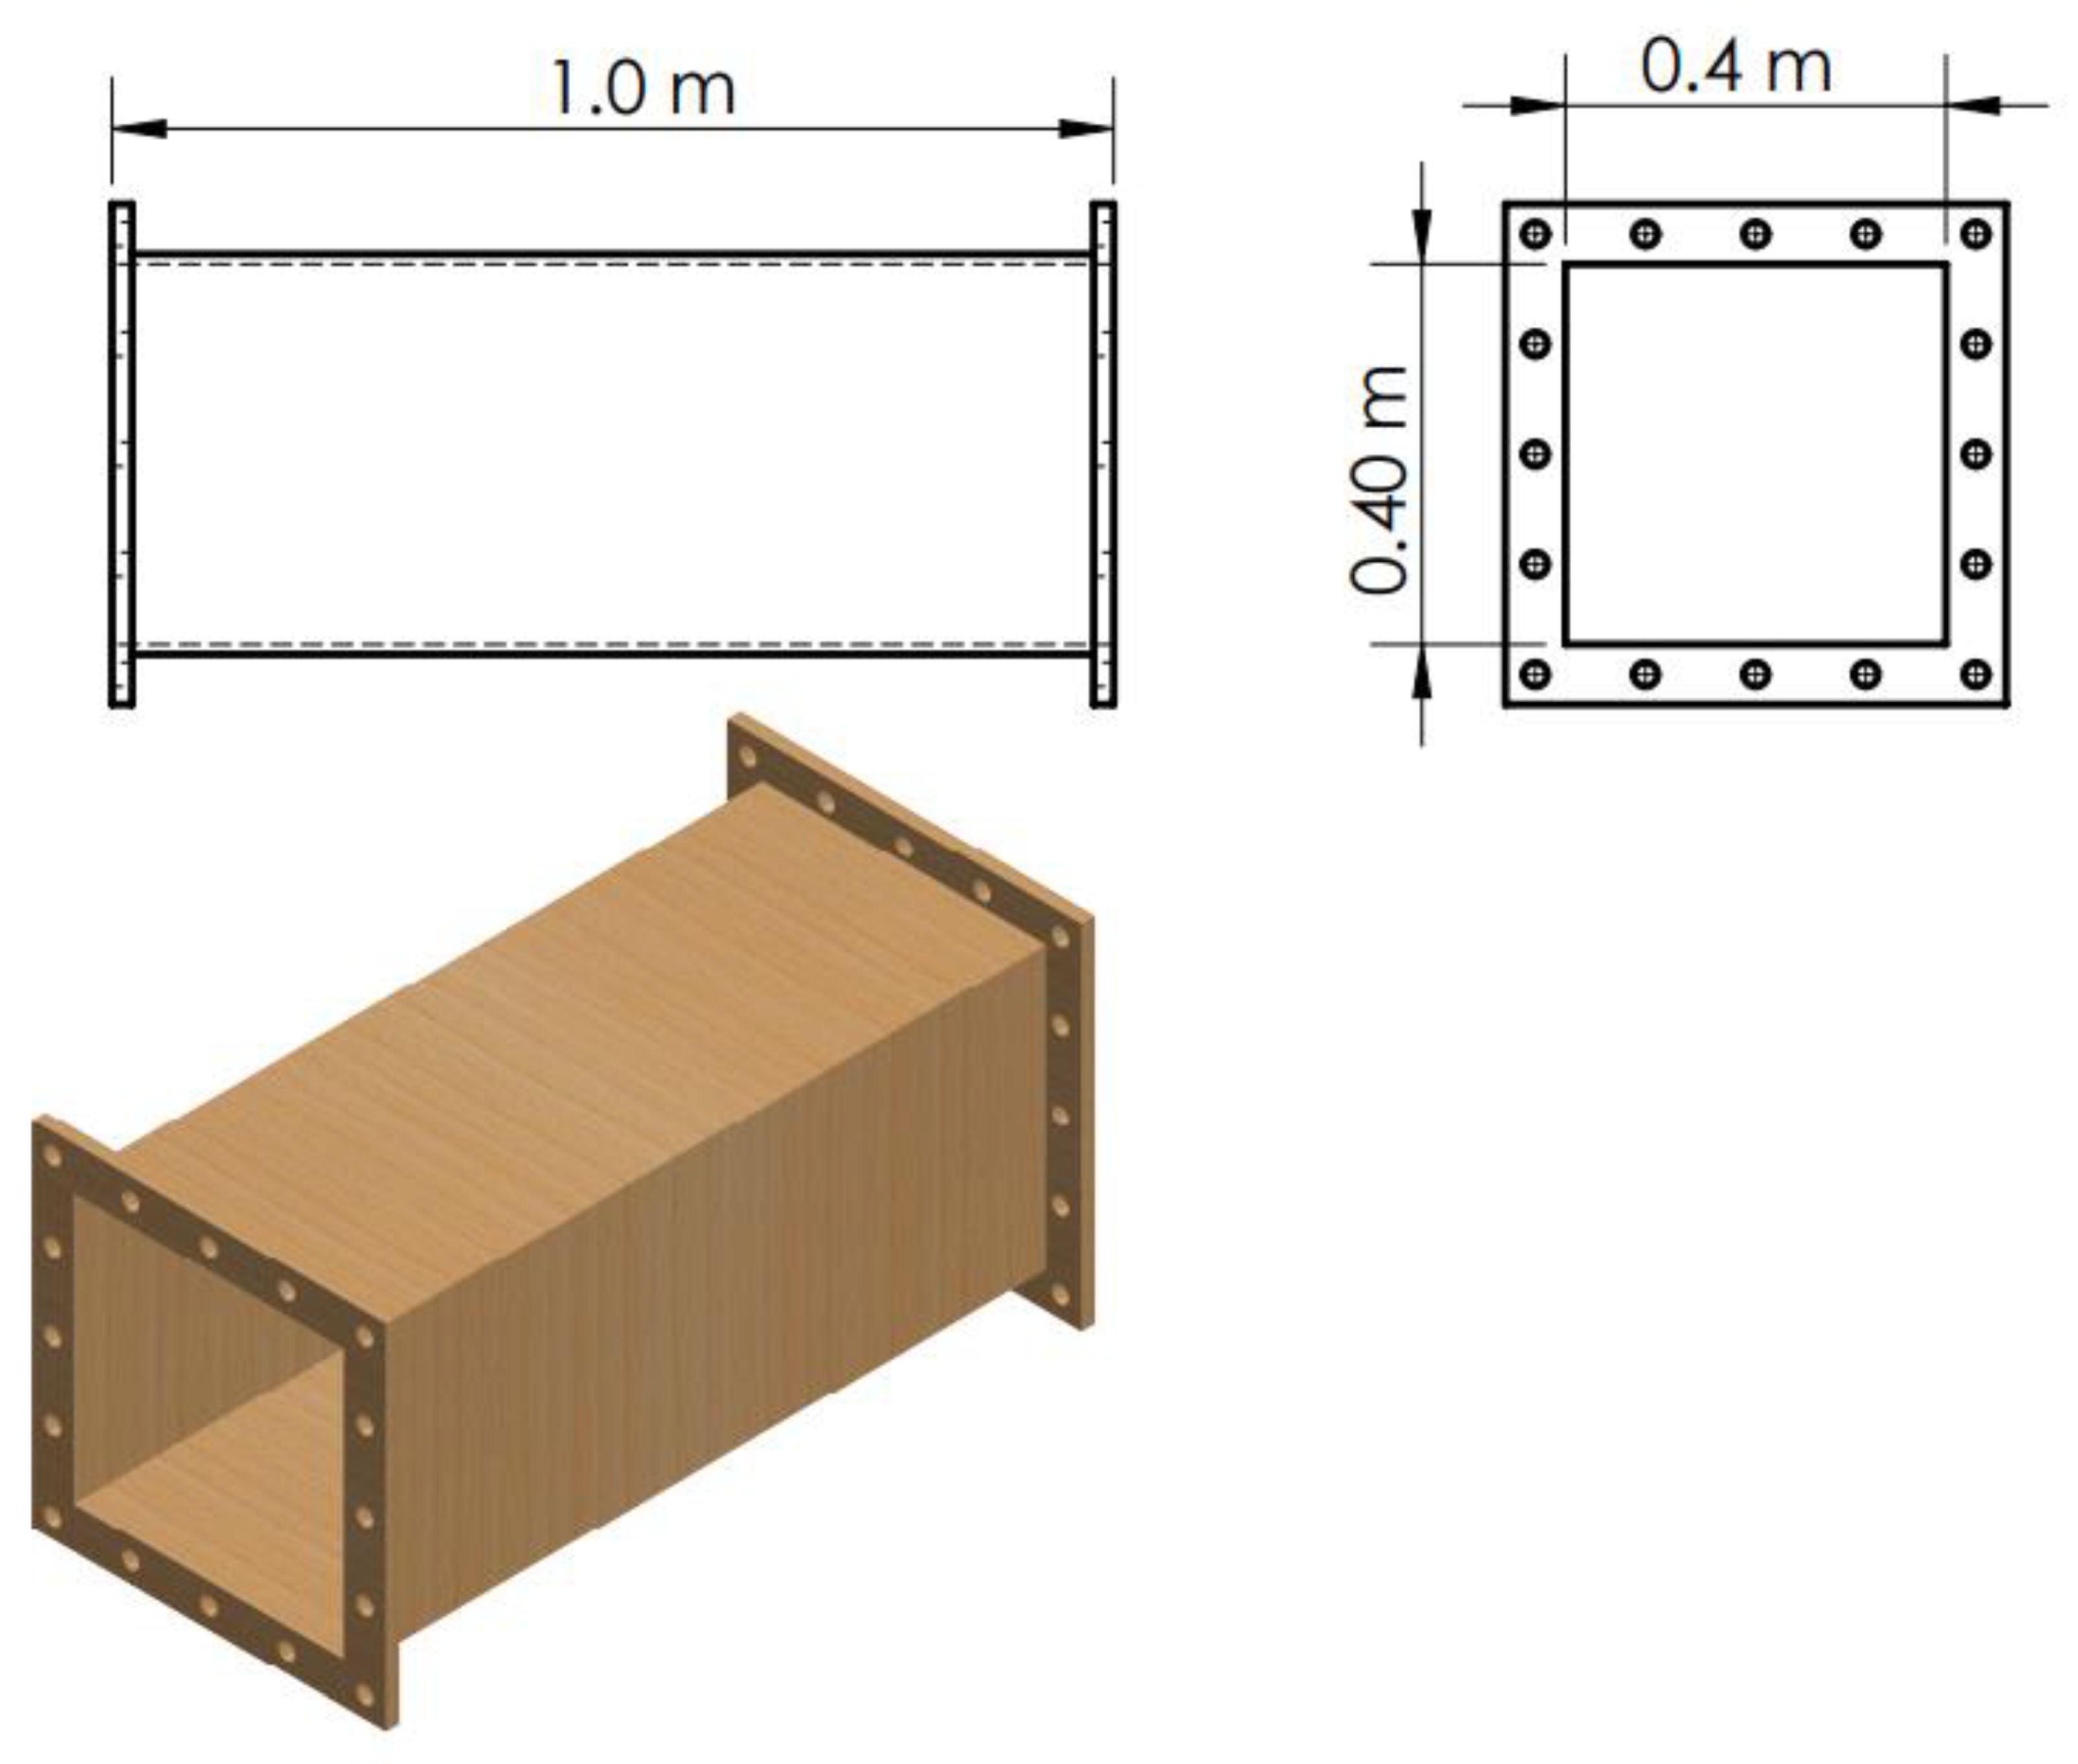
2.1.1. Test Section
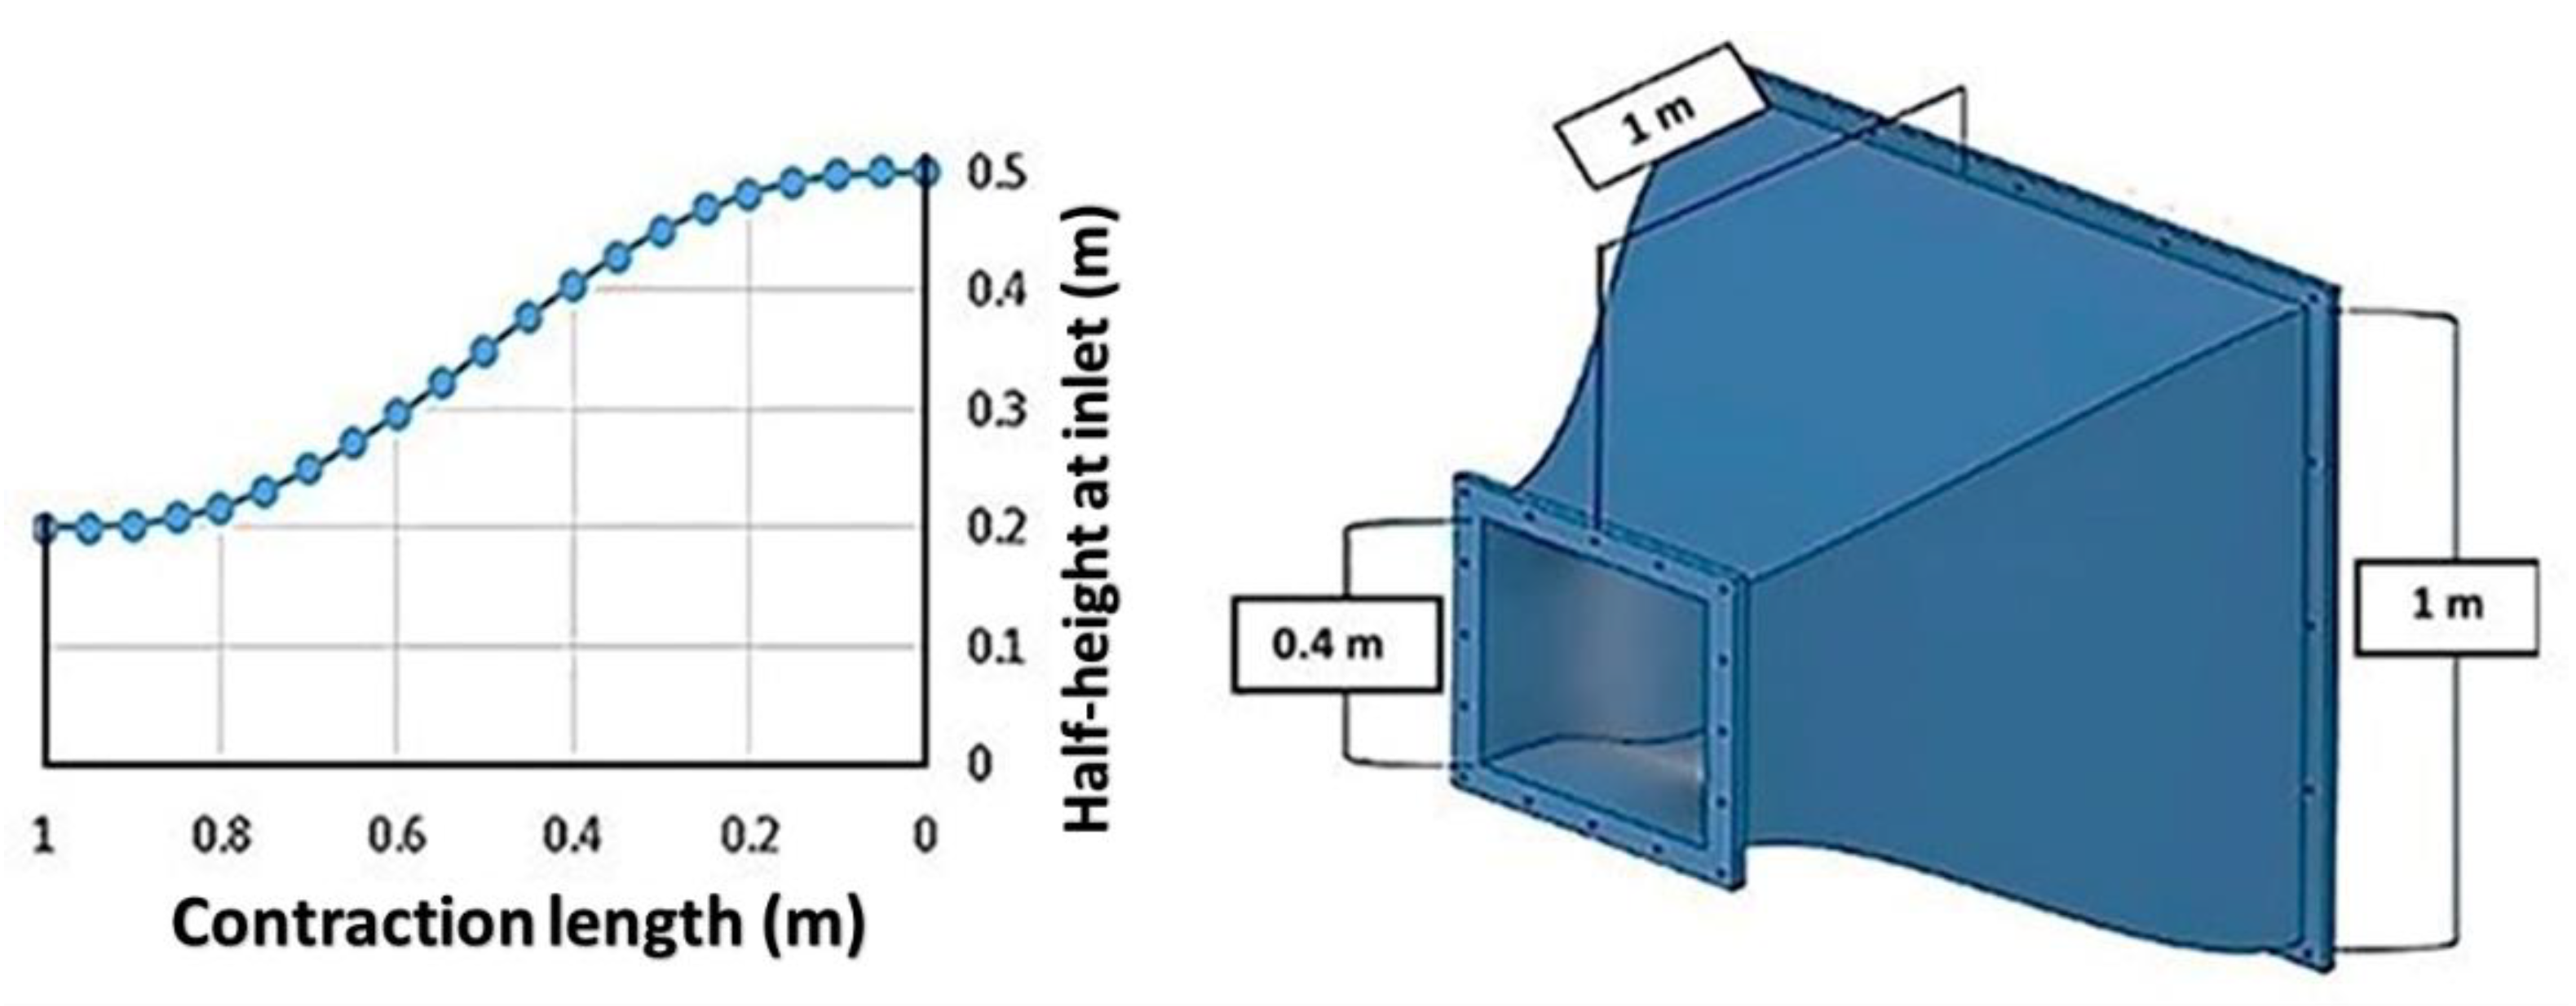
2.1.2. Contraction Cone
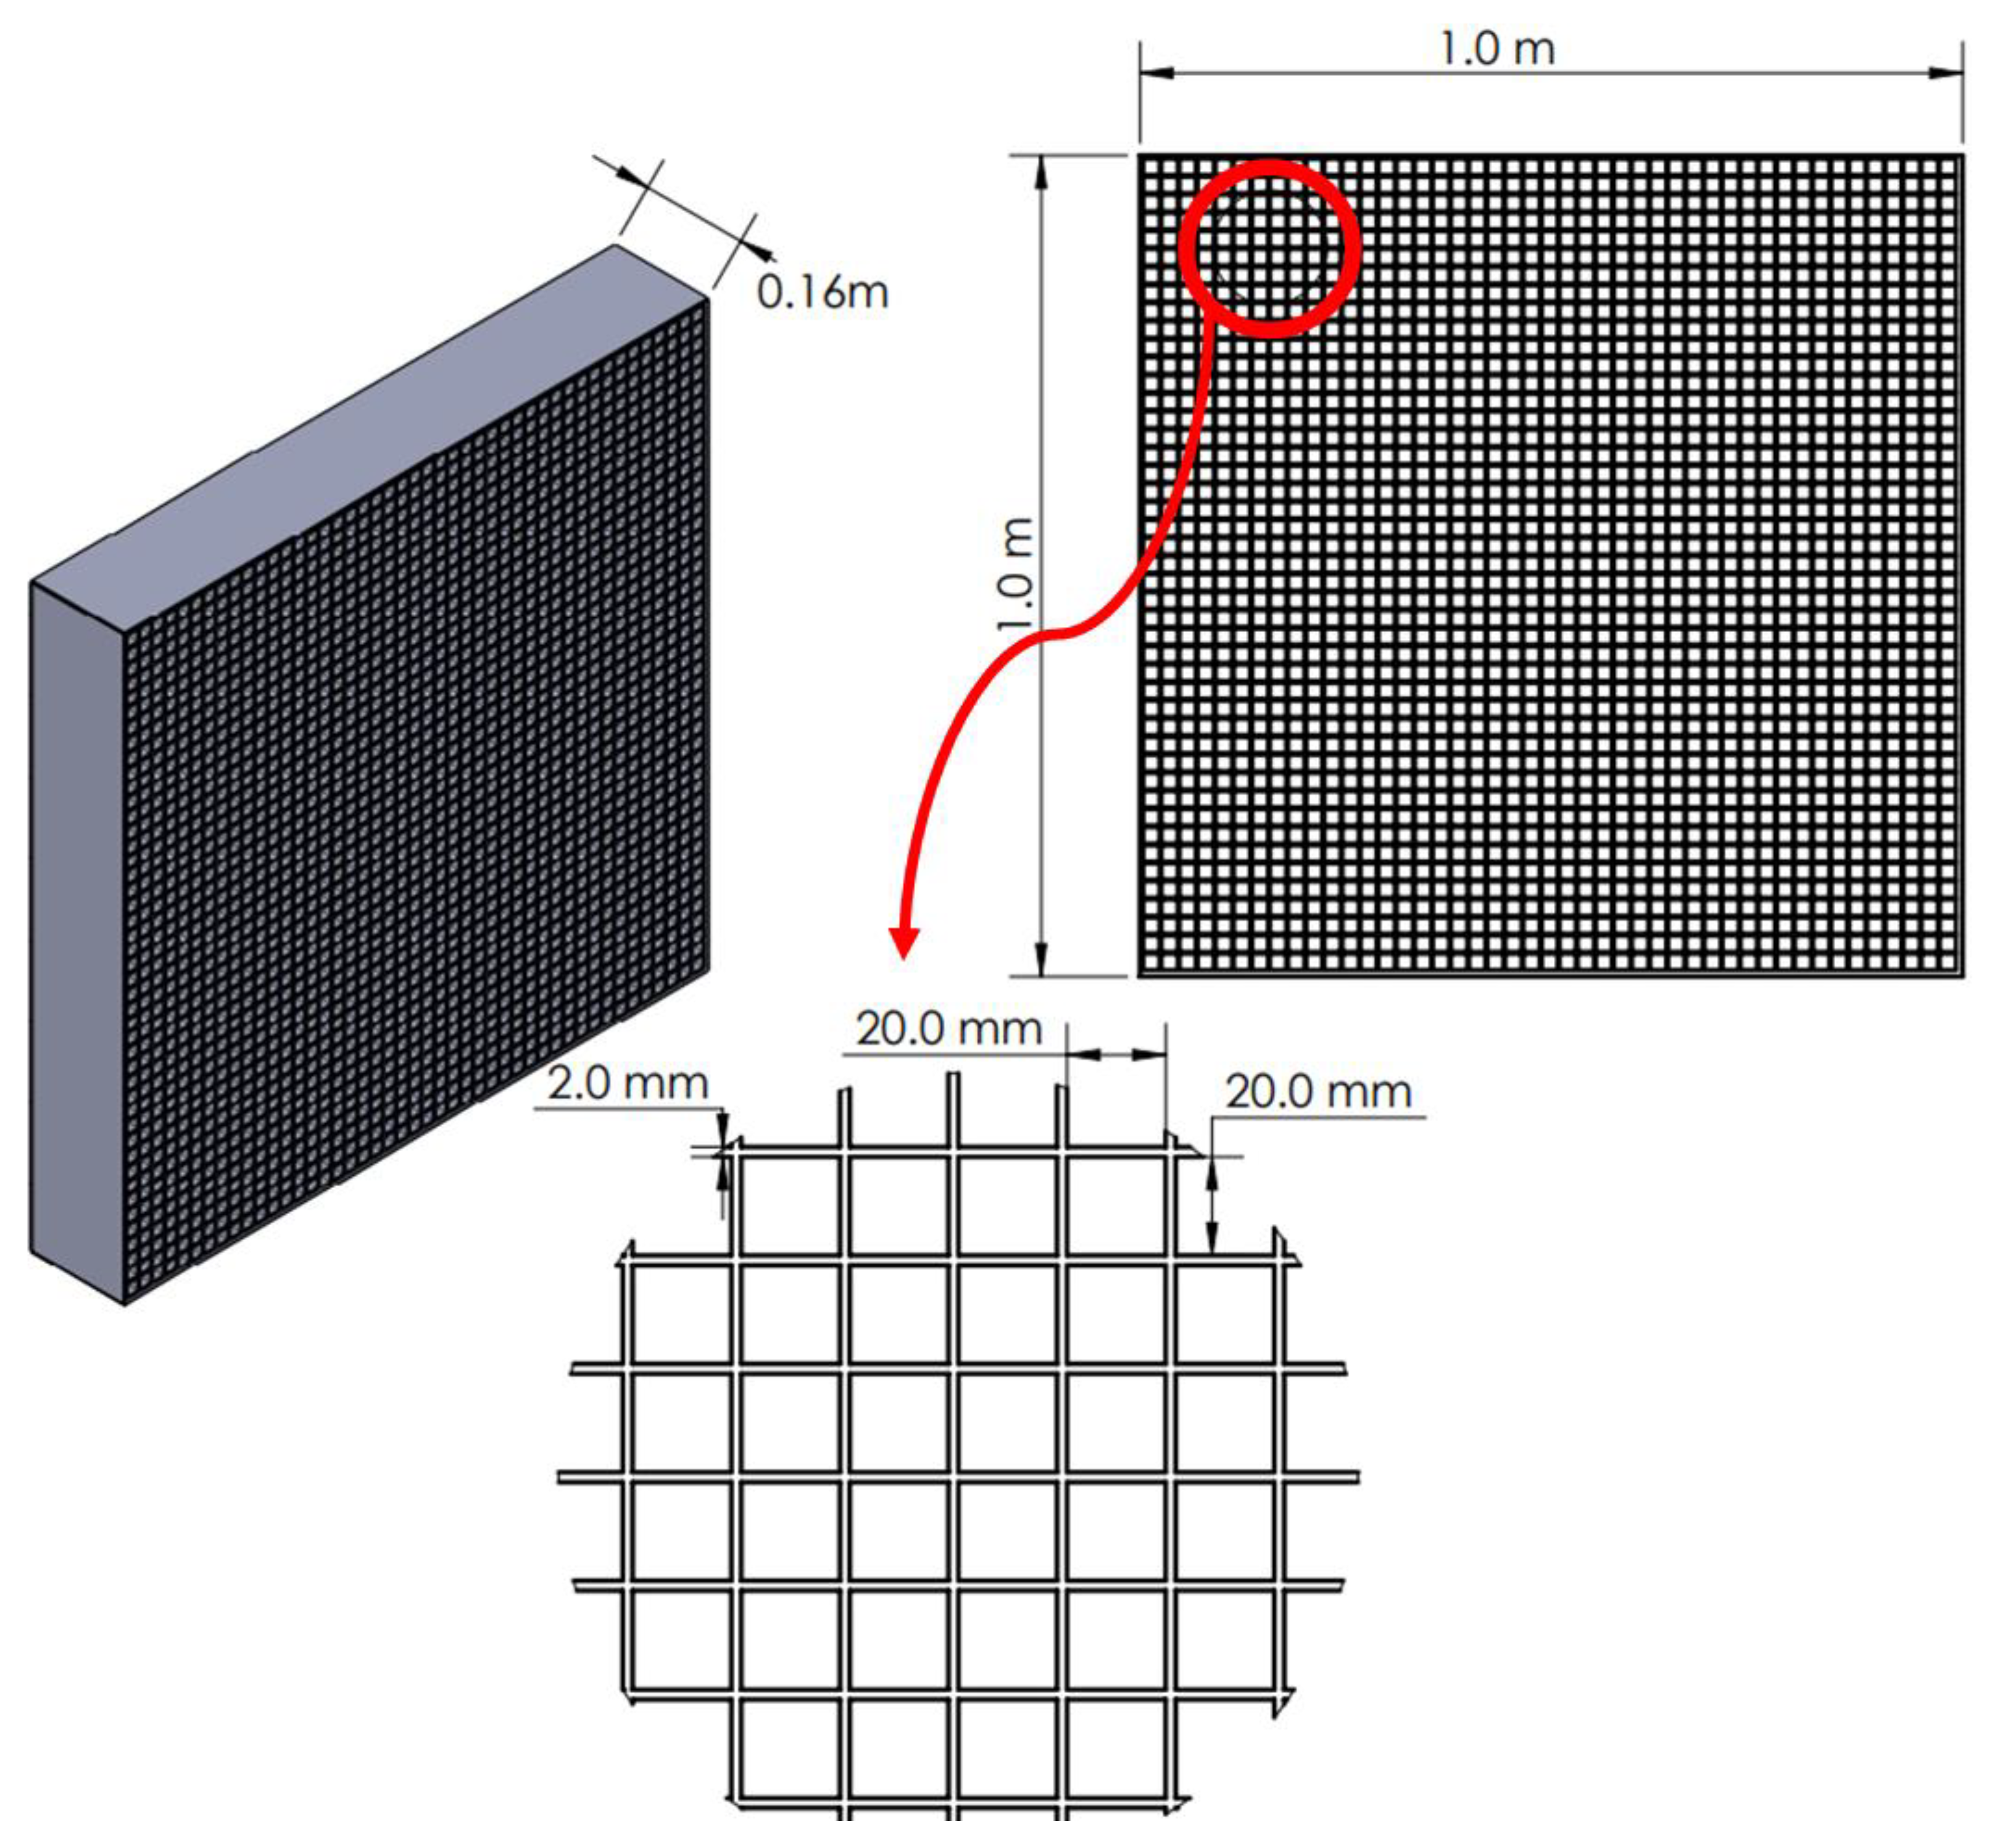
2.1.3. Settling Chamber (Honeycomb and Mesh Screens)
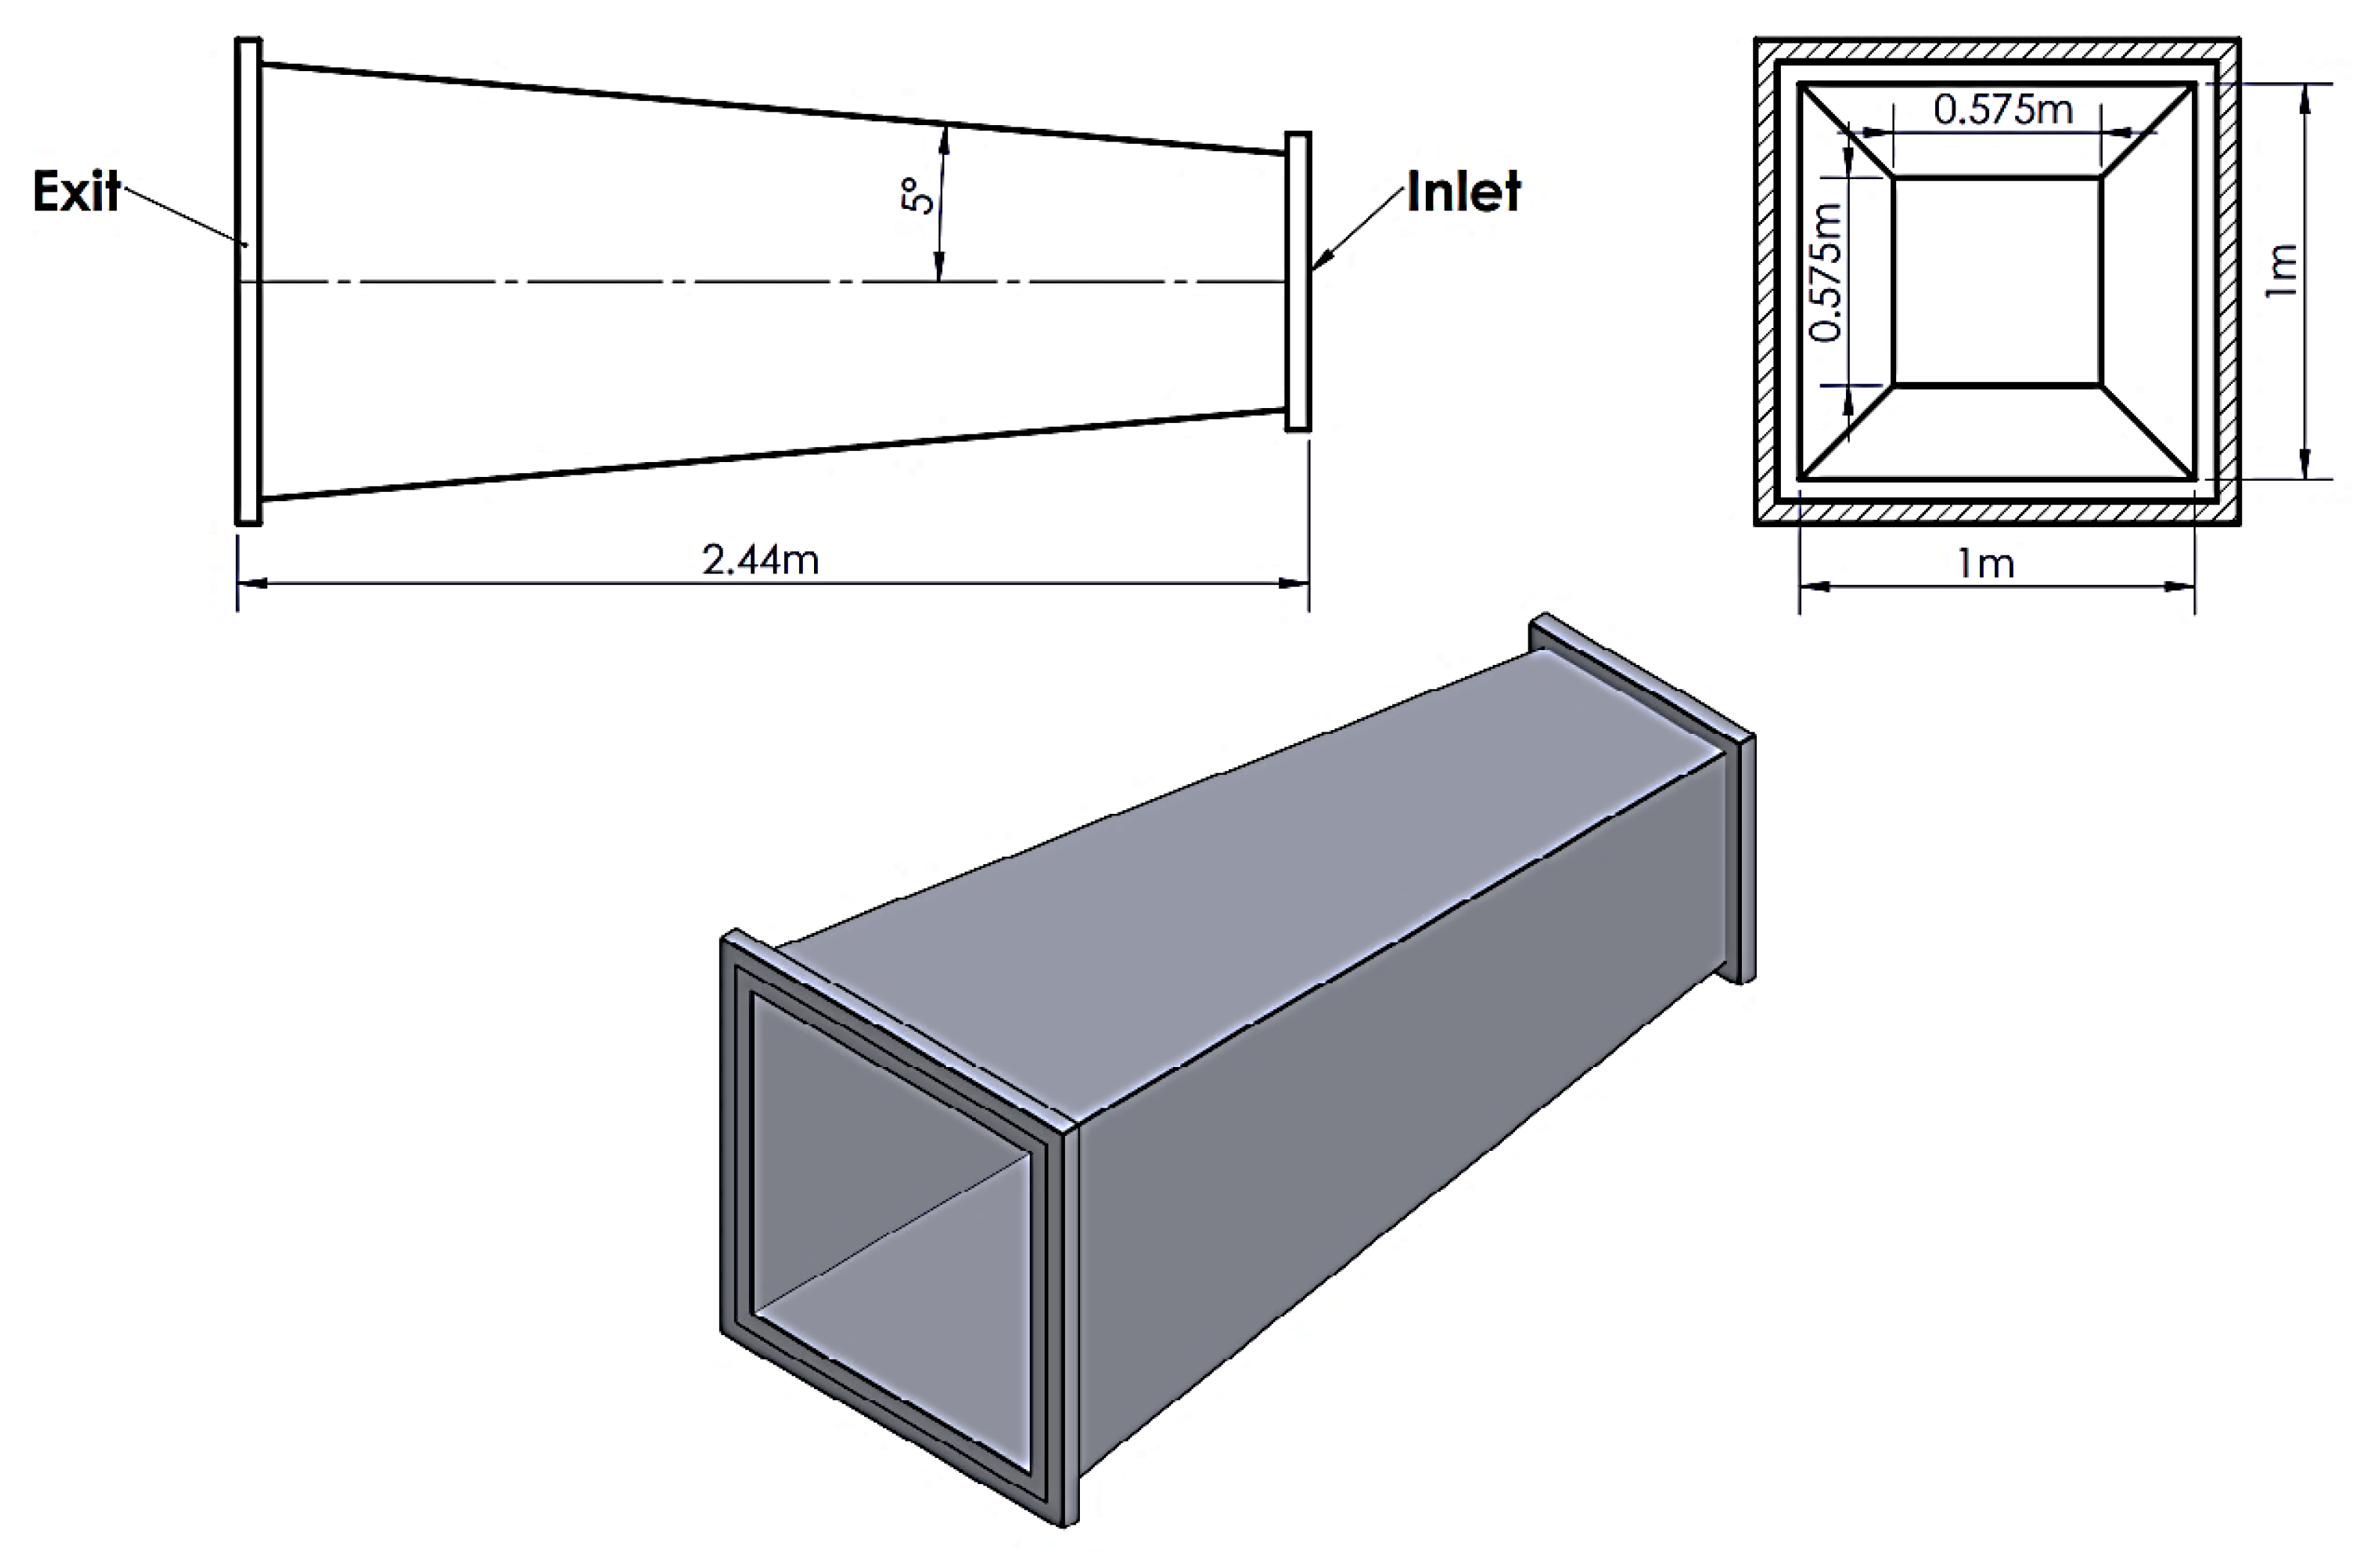
2.1.4. Diffuser
2.2. Analytical Model
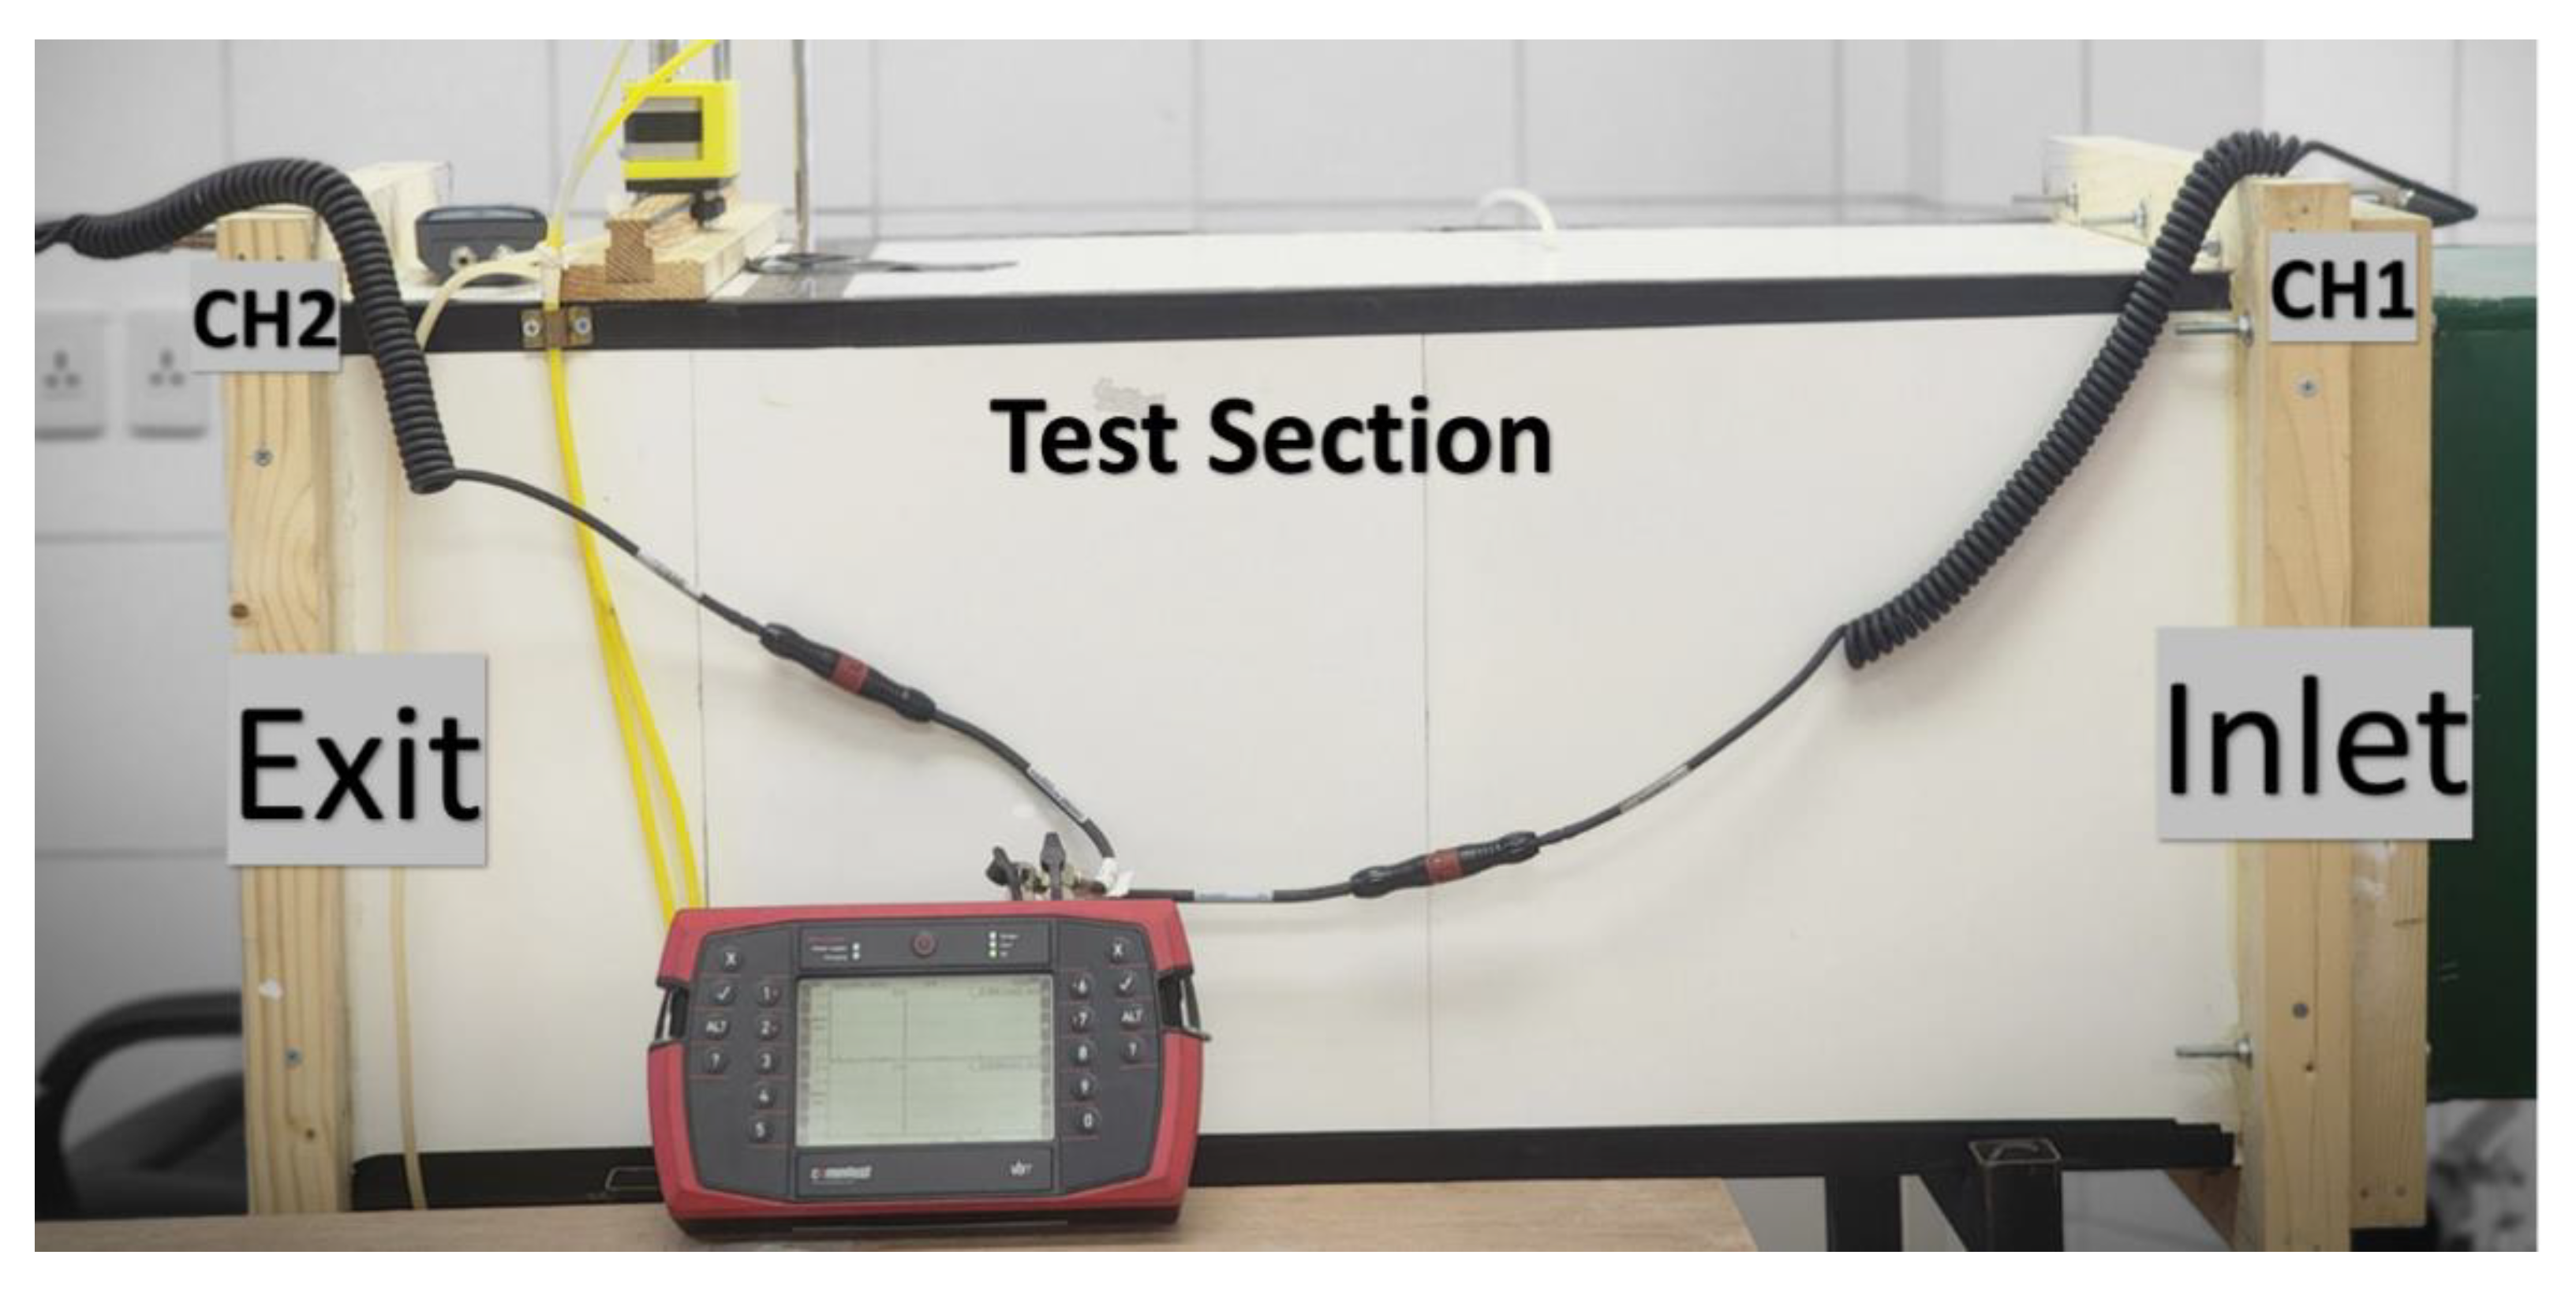
2.3. Wind Tunnel Measurements
3. Results and Discussion
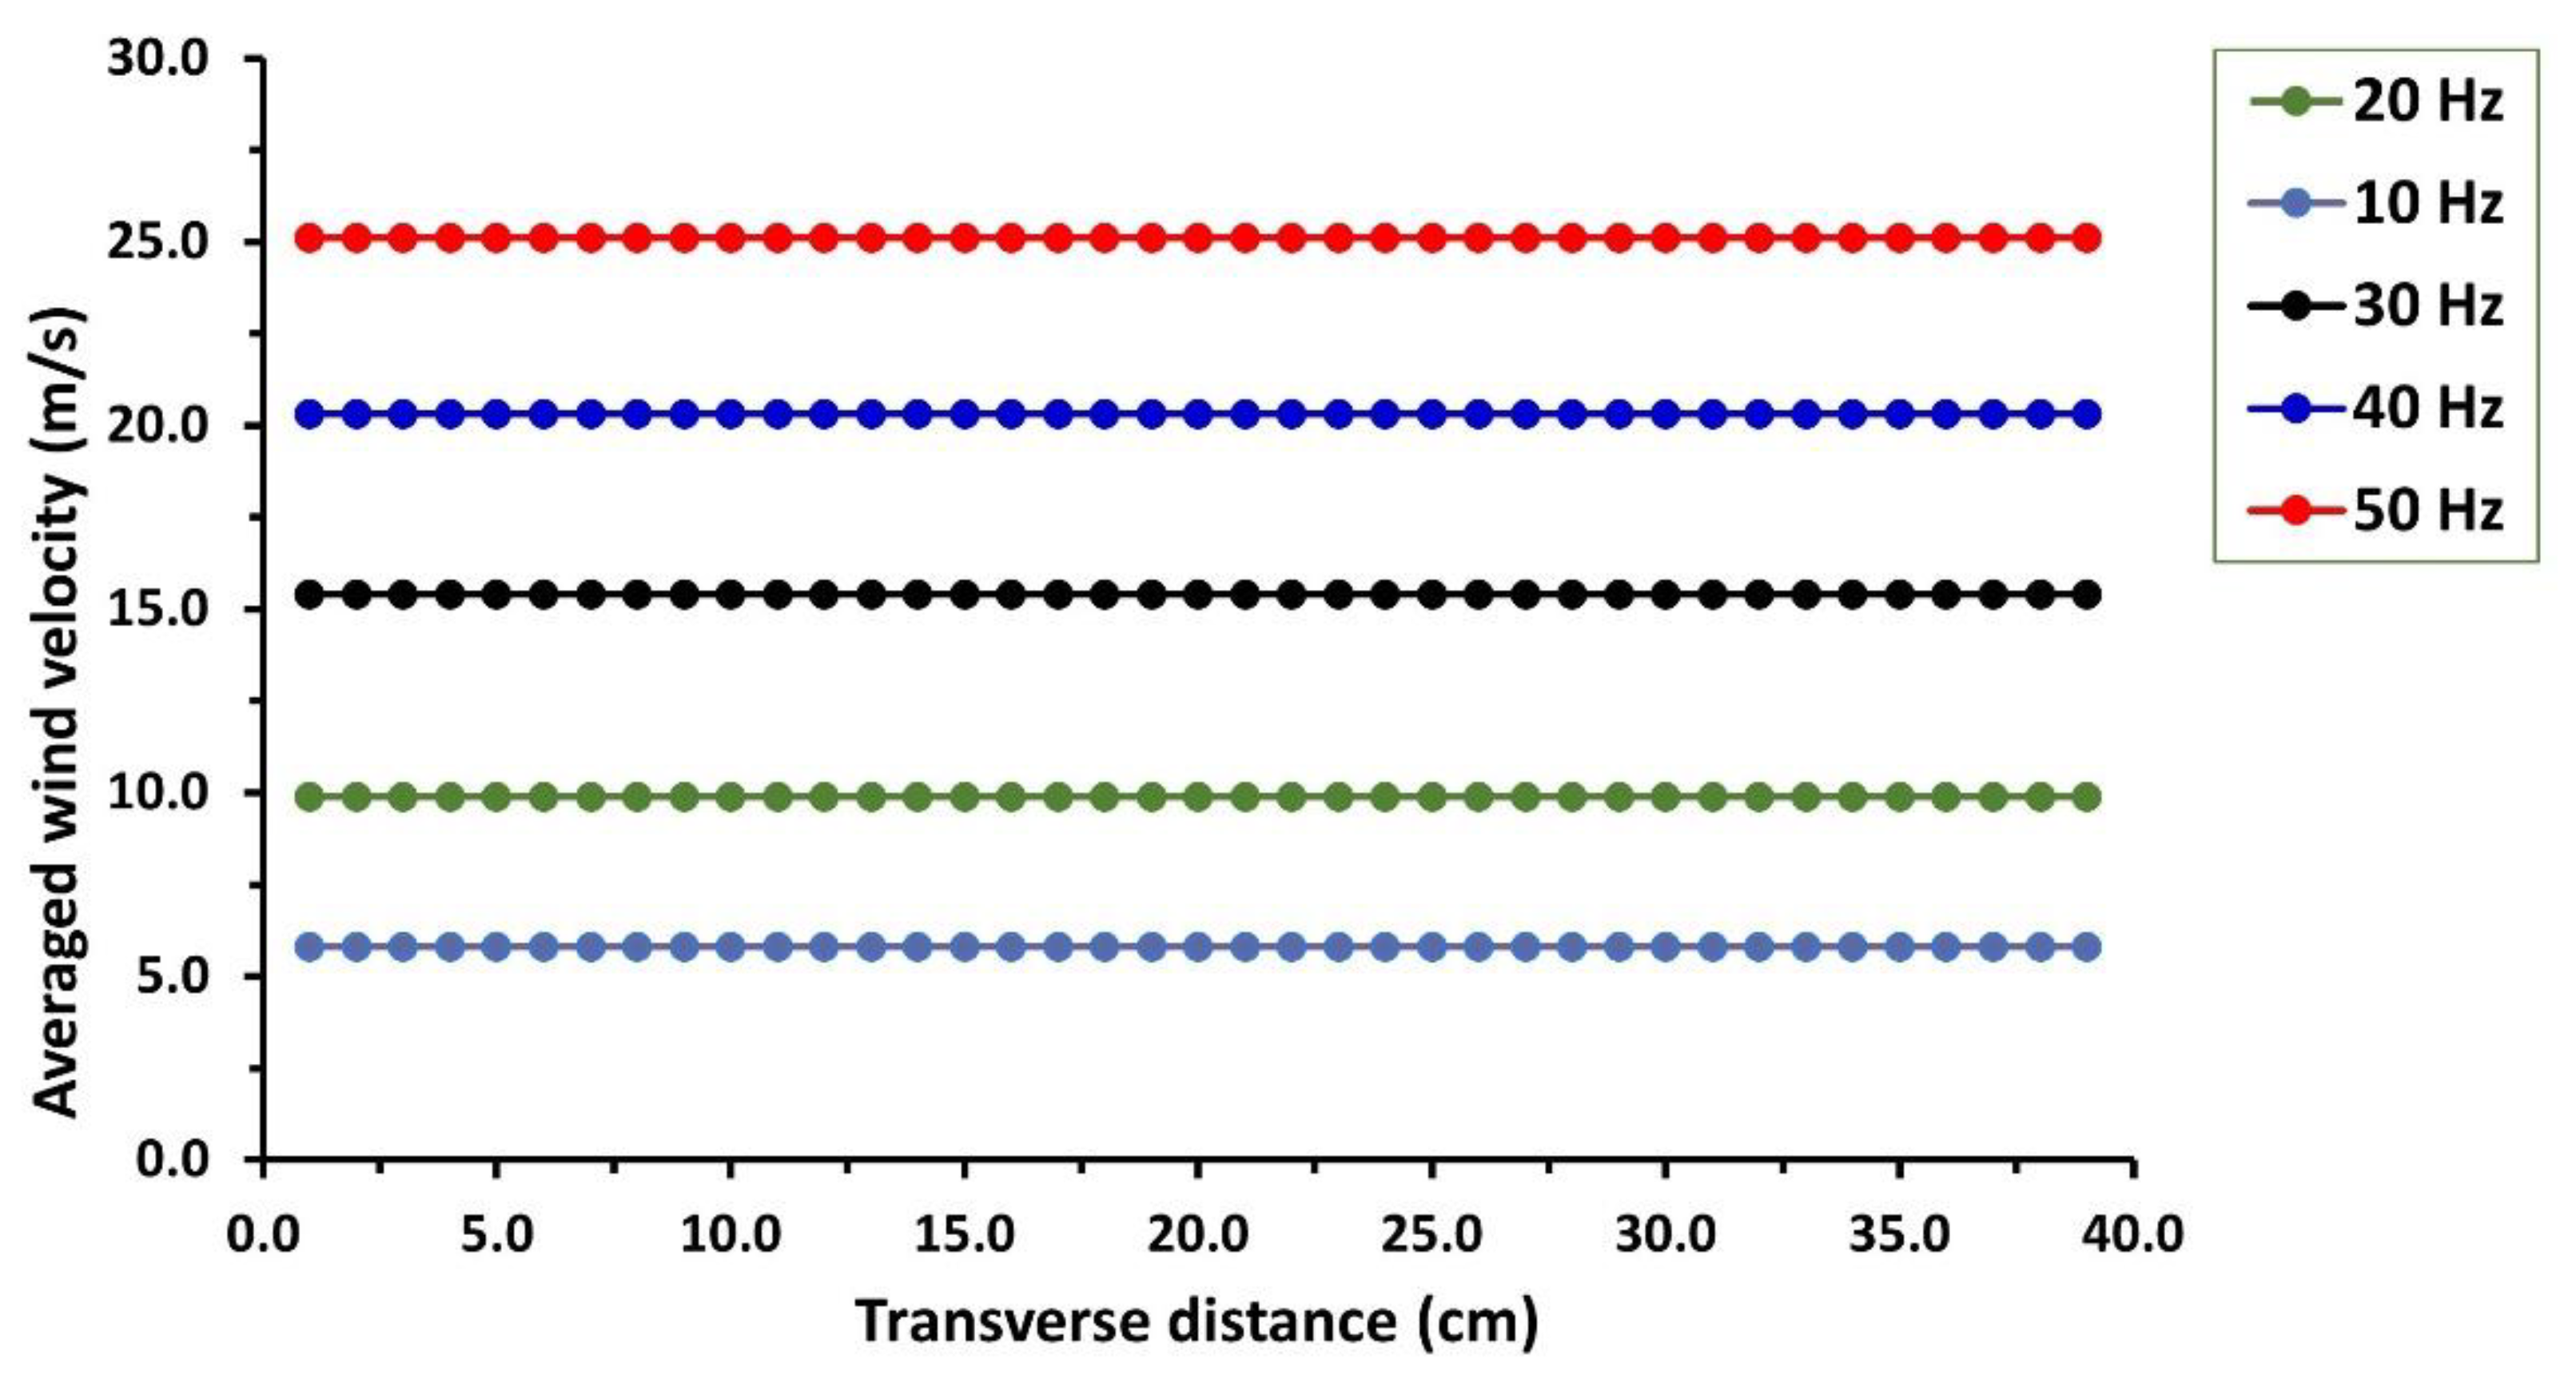
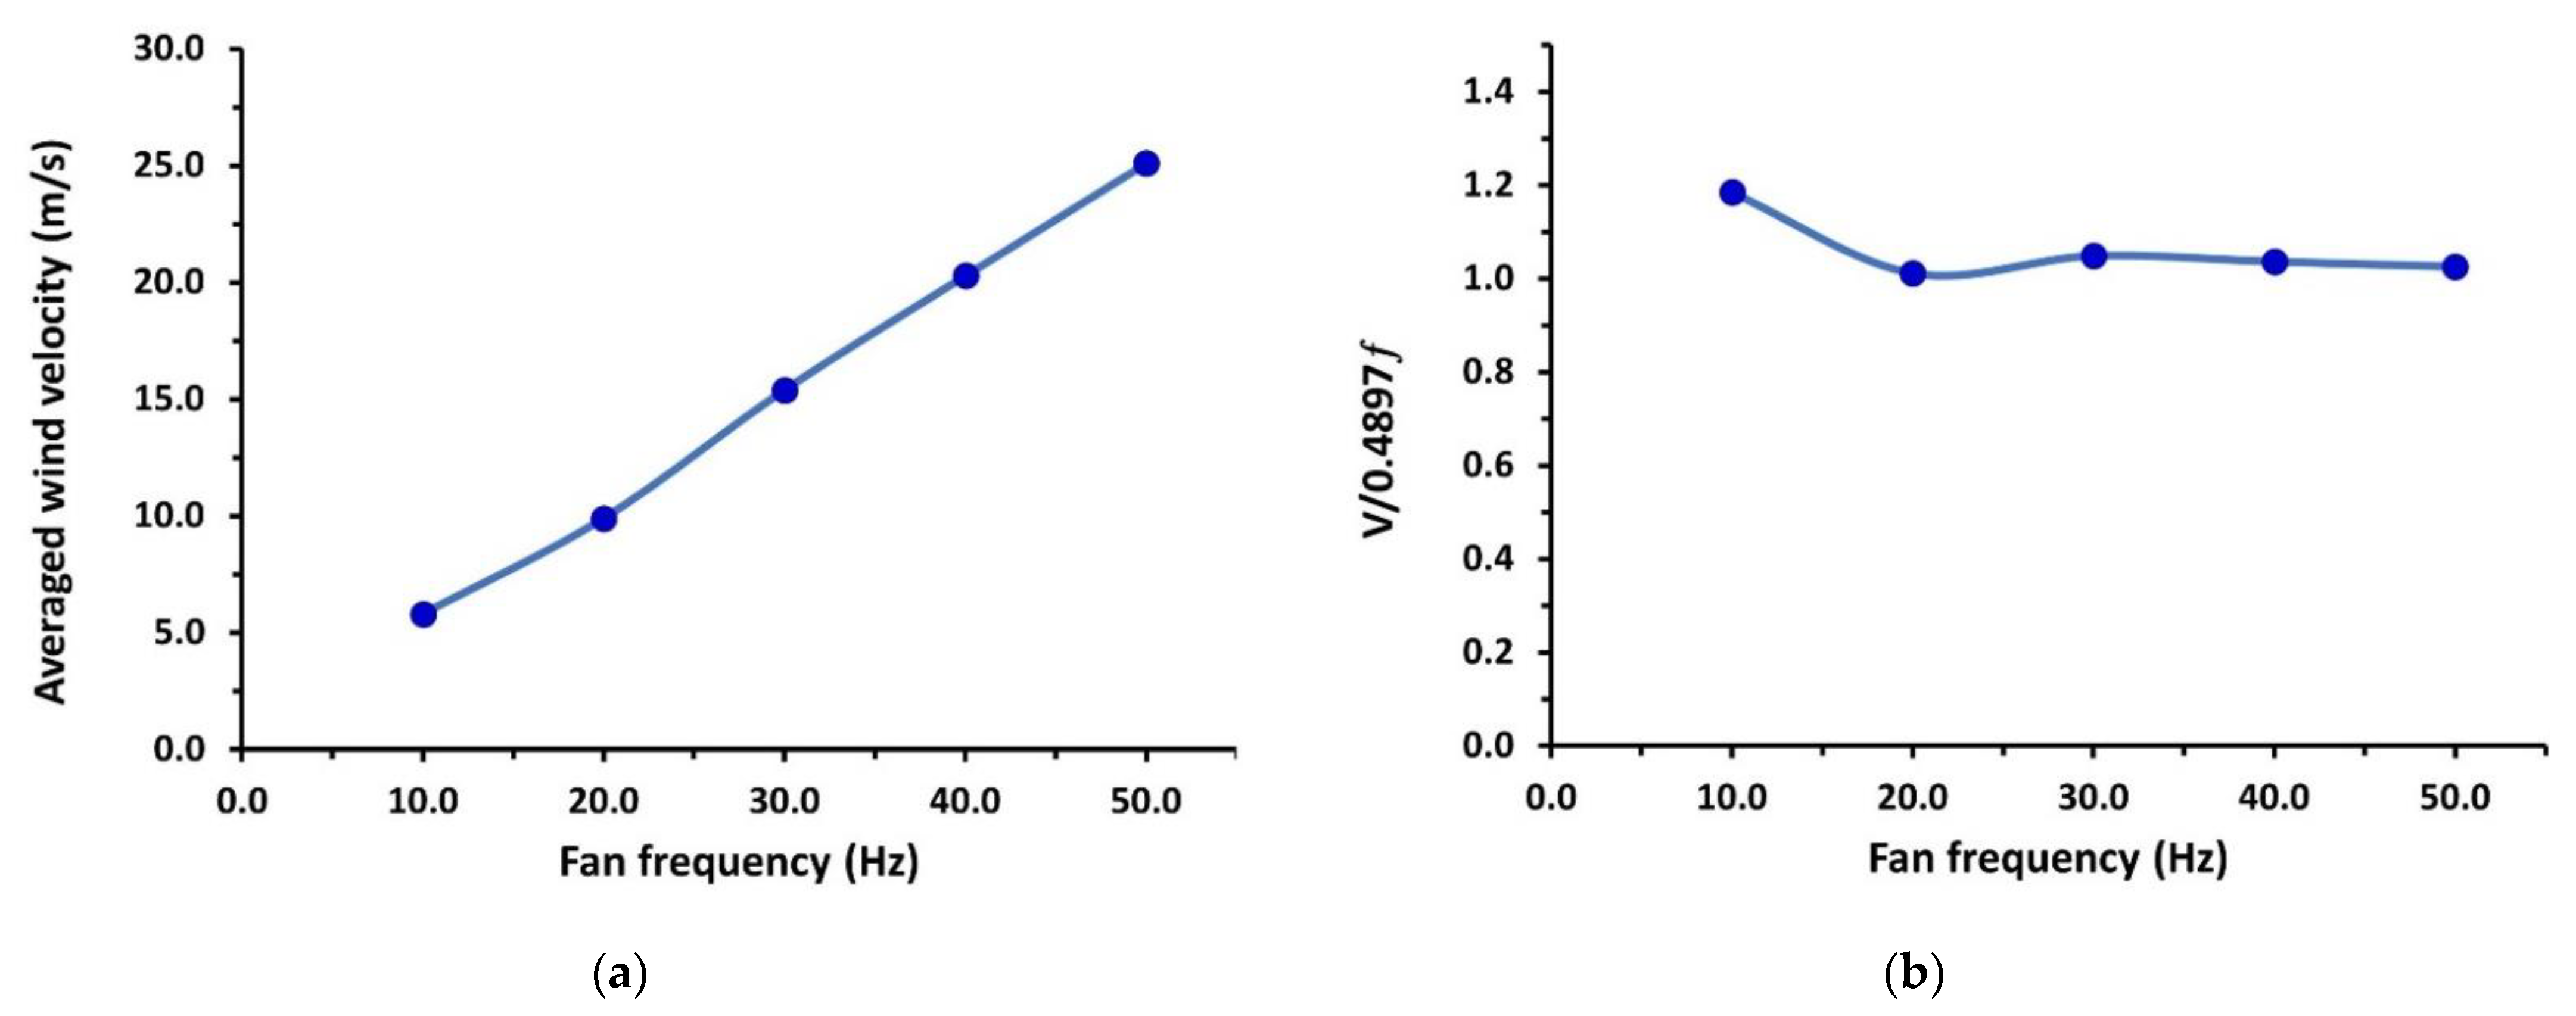
3.1. Wind Speed Analysis
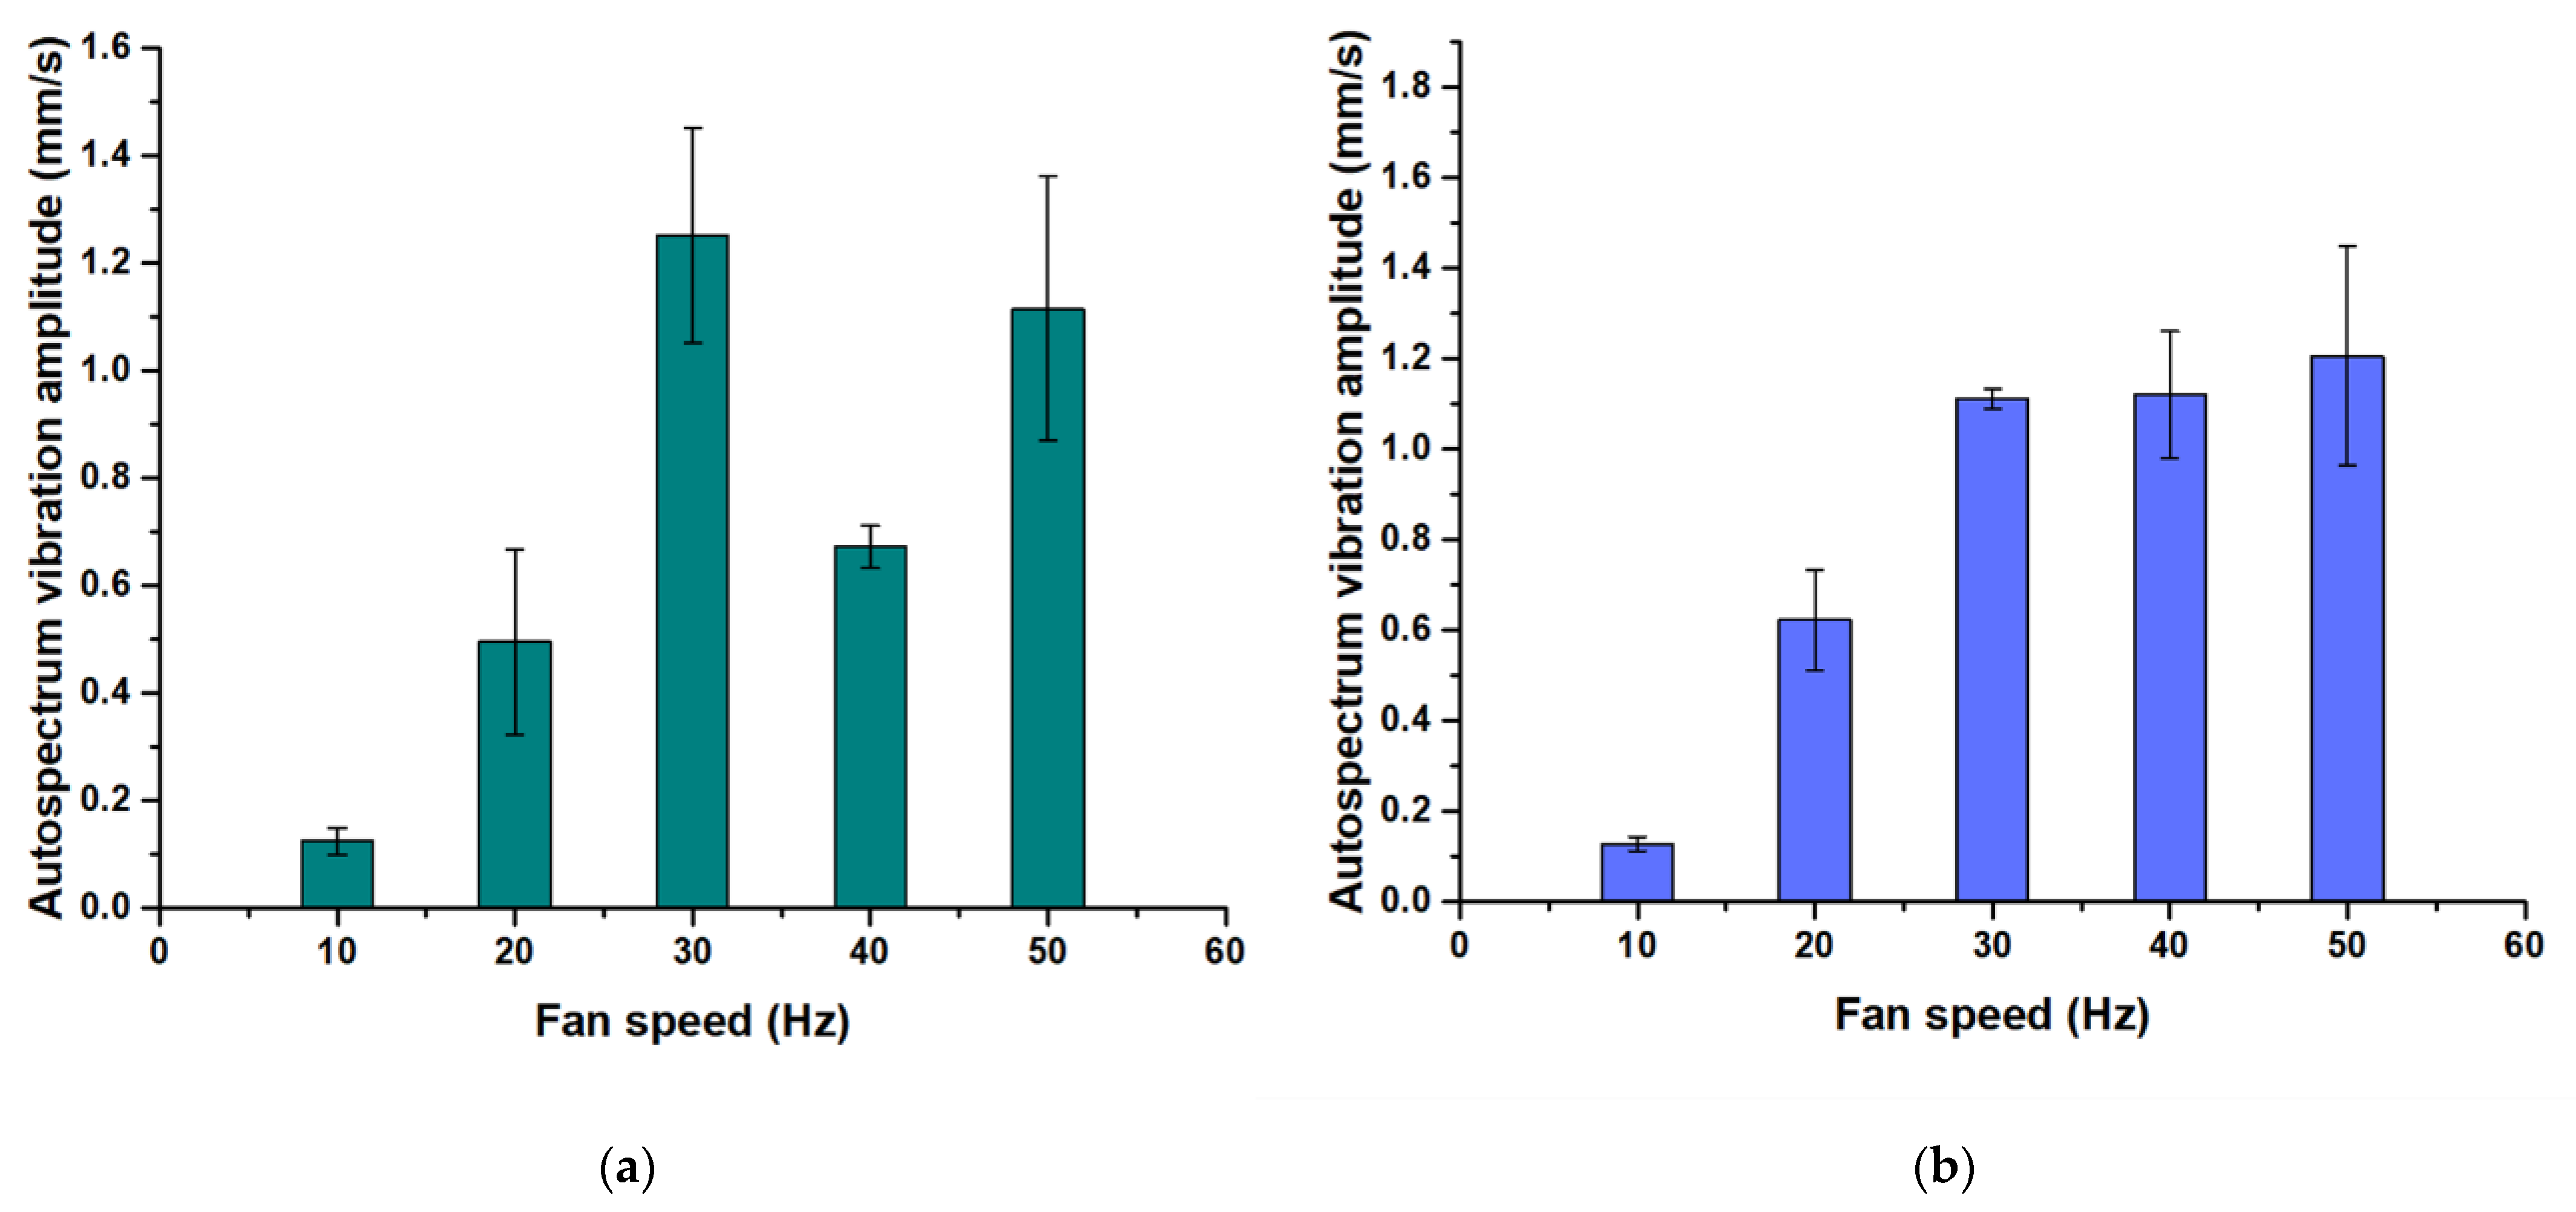
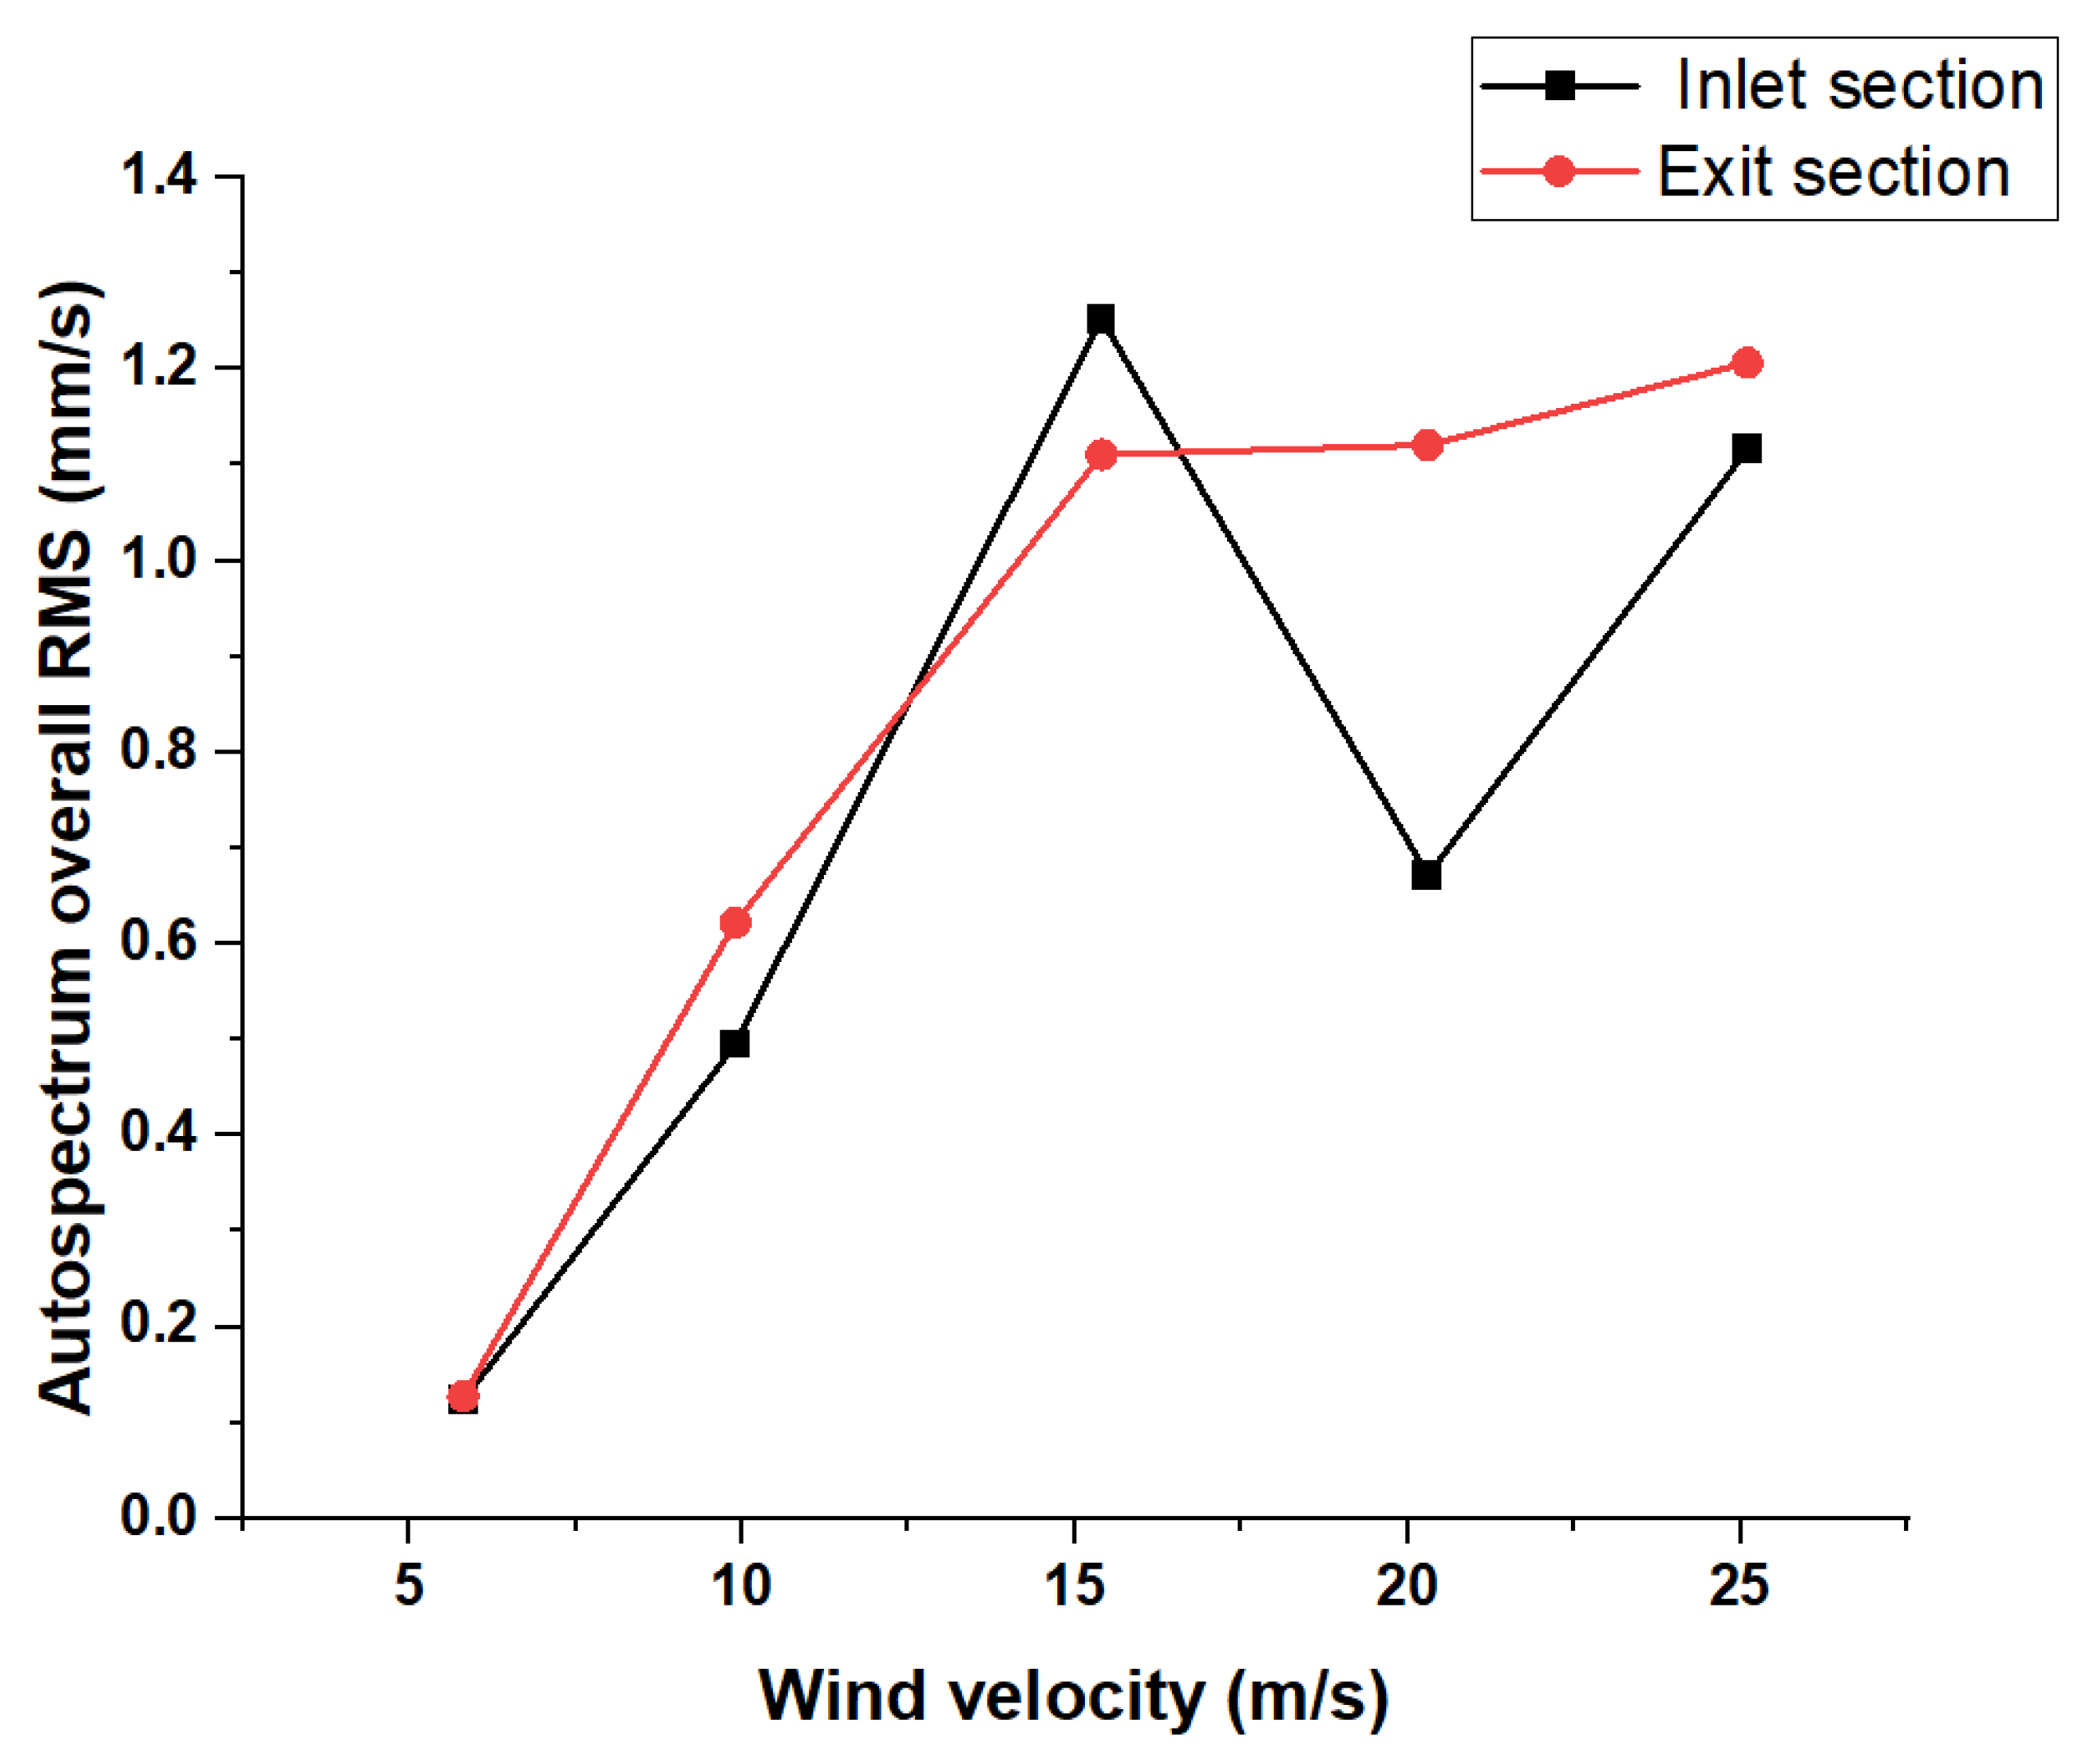
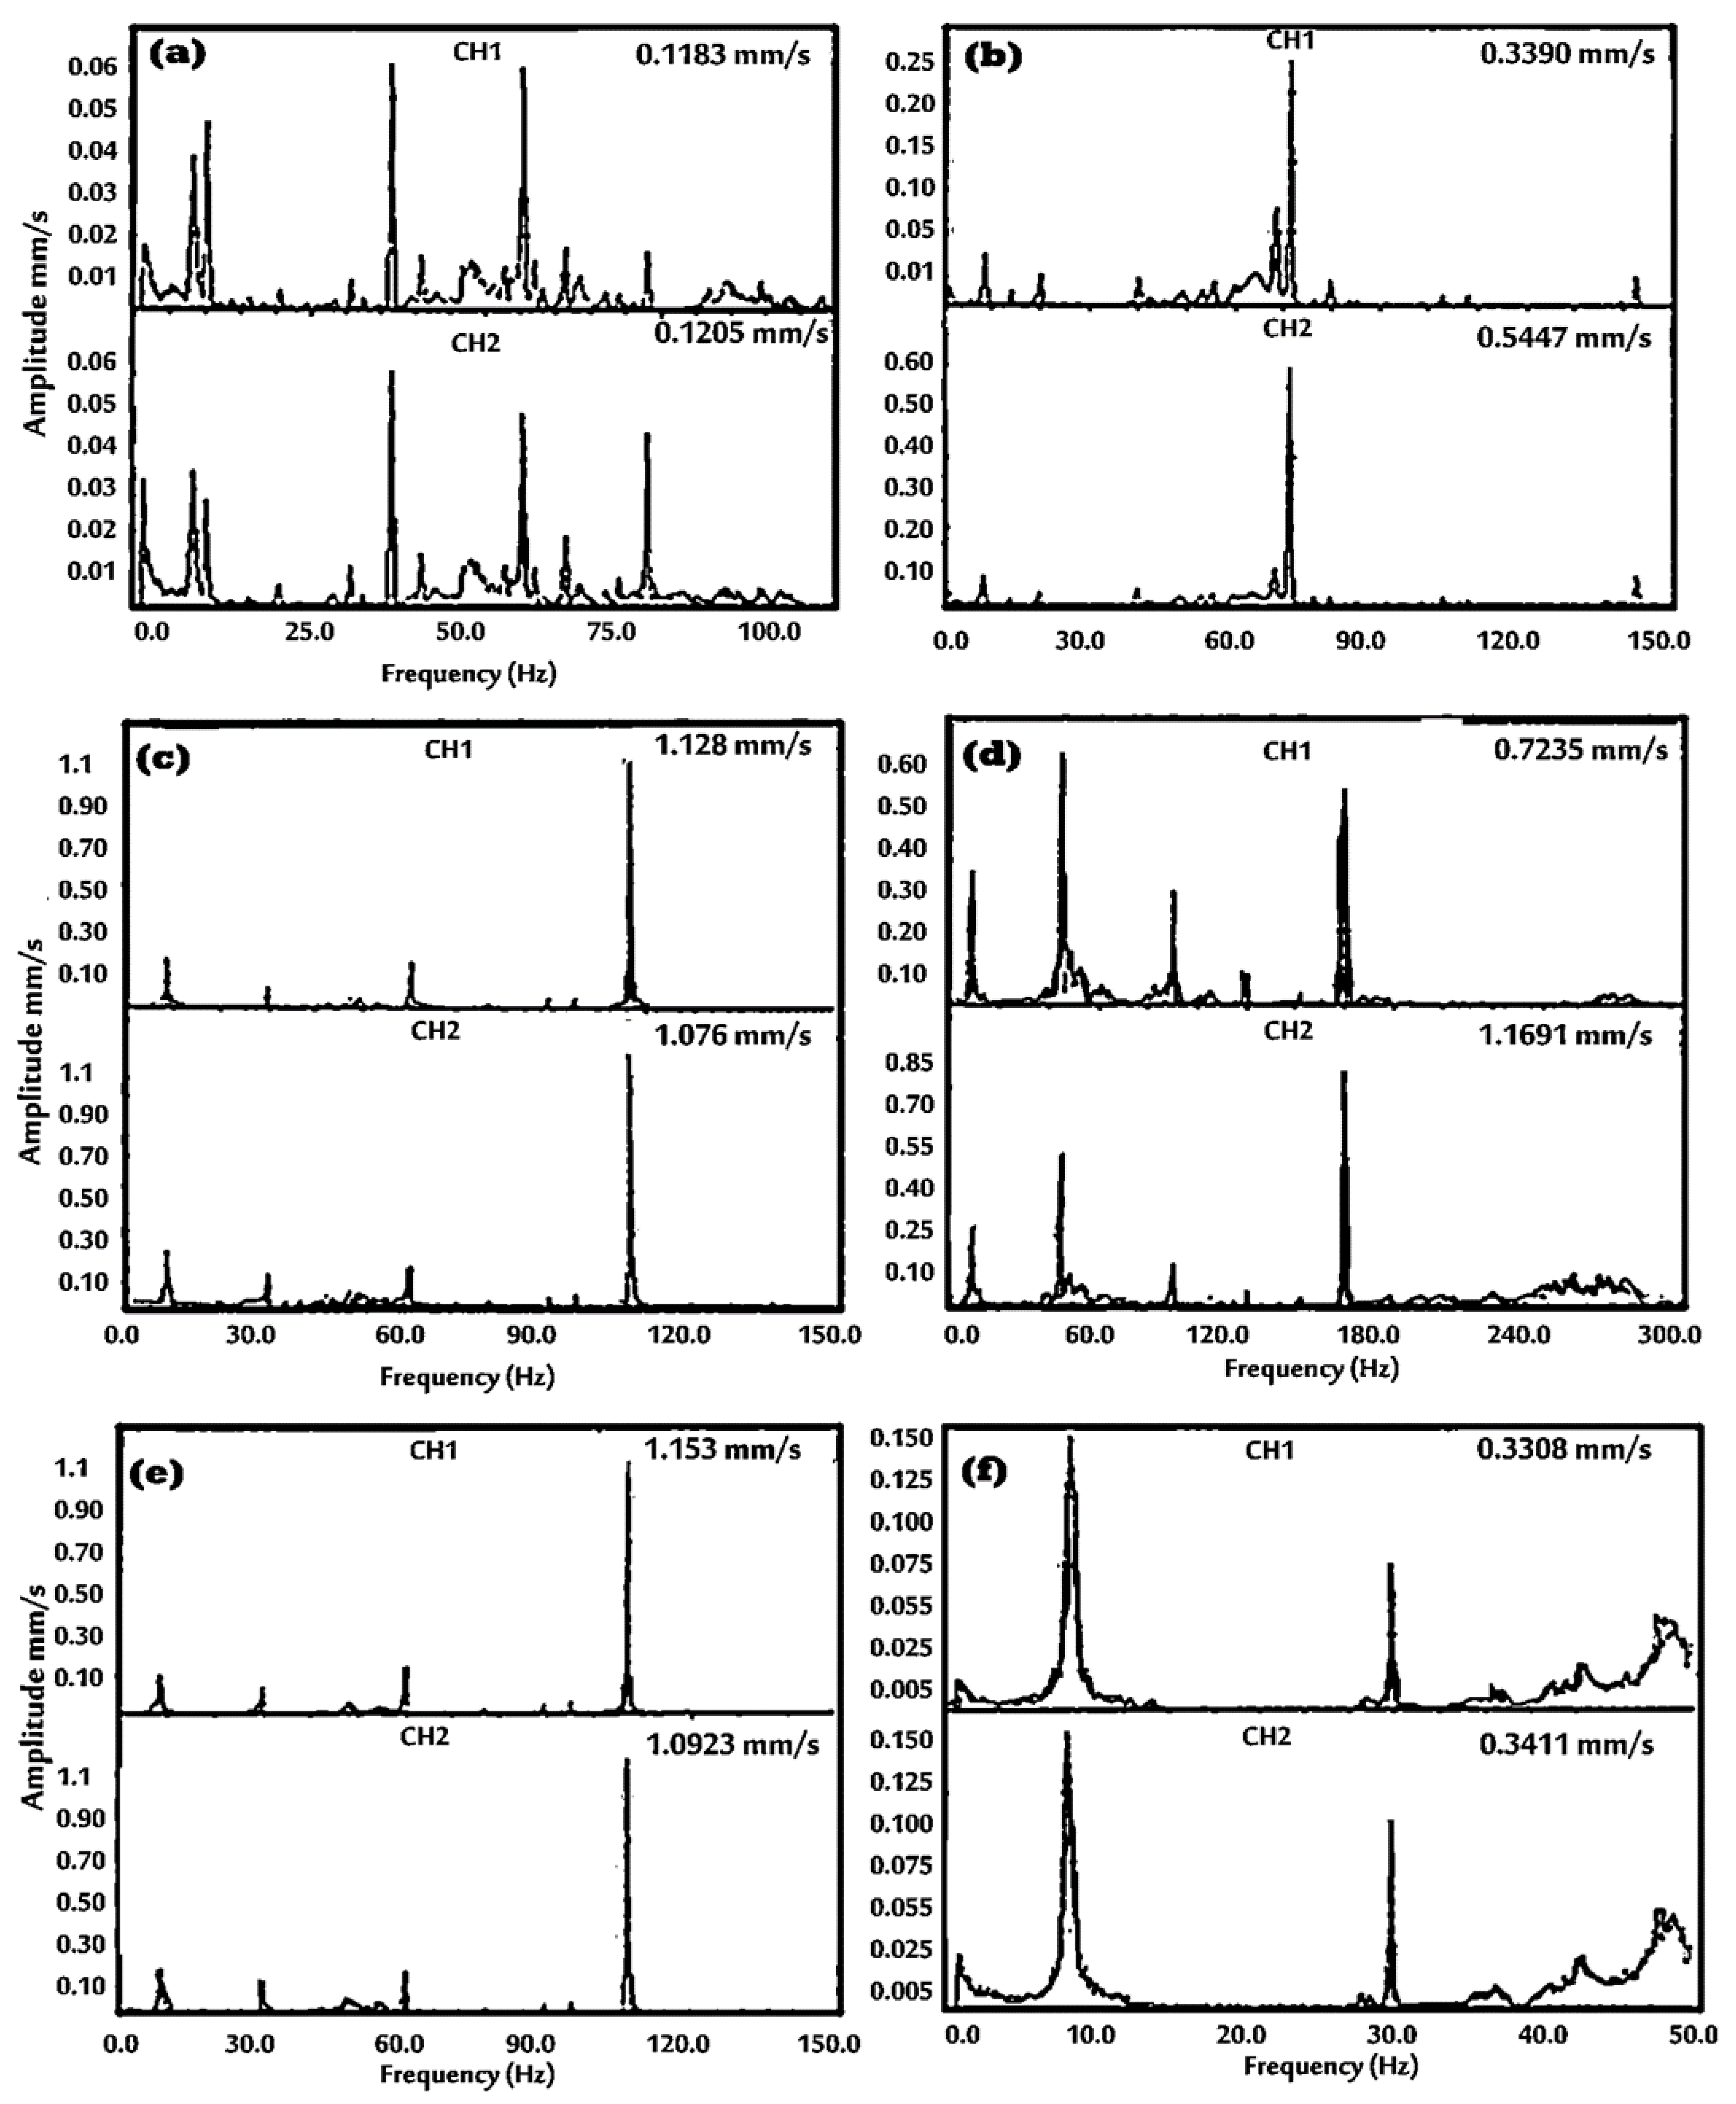
3.2. Structural Vibration Analysis
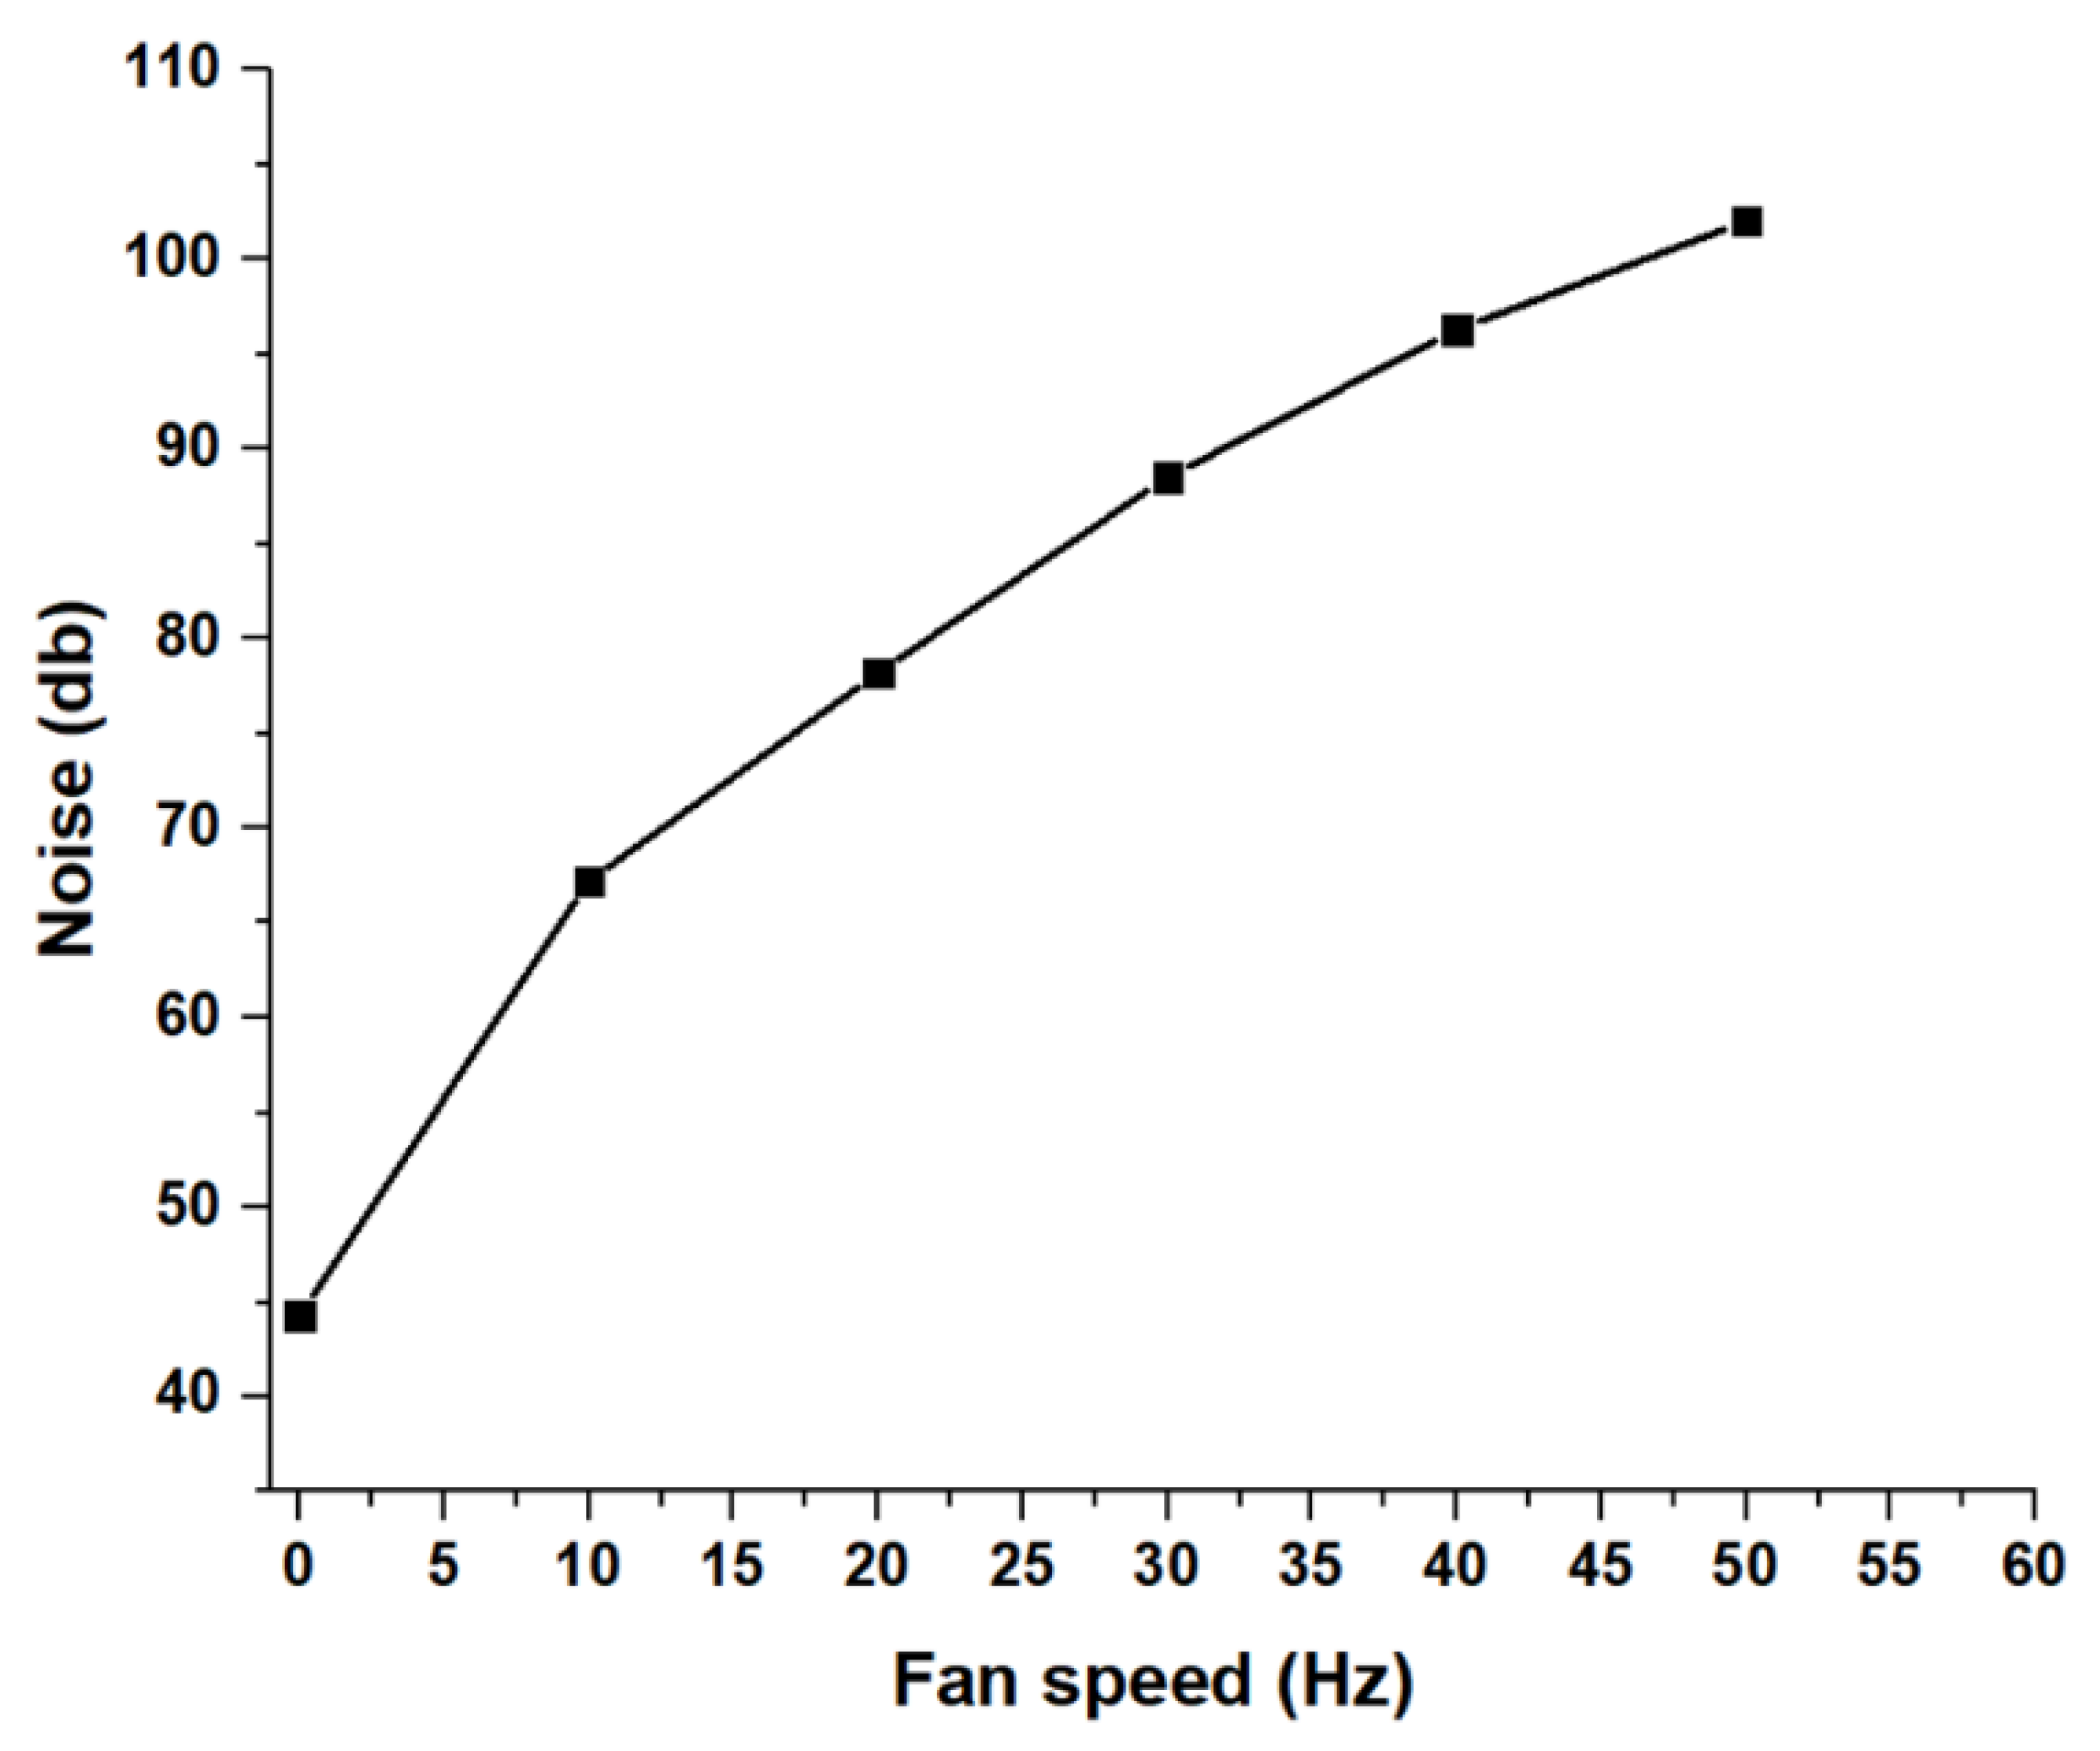
3.3. Noise Analysis
4. Conclusions
Author Contributions
Funding
Data Availability Statement
Acknowledgments
Conflicts of Interest
References
- Rau, M.; Bächlin, W.; Plate, E. Detailed design features of a new wind tunnel for studying the effects of thermal stratification. Atmos. Environ. Part A Gen. Top. 1991, 25, 1257–1262. [Google Scholar] [CrossRef]
- Xie, D.; Xiao, P.; Cai, N.; Sang, L.; Dou, X.; Wang, H. Field and Wind Tunnel Experiments of Wind Field Simulation in the Neutral Atmospheric Boundary Layer. Atmosphere 2022, 13, 2065. [Google Scholar] [CrossRef]
- Hegade, K.P.N.; Natalia, R.; Wehba, B.; Mittal, A.; Bhat, R.B.; Packirisamy, M. Design and study of mini wind tunnel for microsystems fluid interaction under low Reynolds number flows. SN Appl. Sci. 2020, 2, 850. [Google Scholar] [CrossRef] [Green Version]
- Qu, X.; Ren, Z.; Yang, W.; Luo, Y. The axial fan design and commissioning test with nonuniform inlet flow. J. Phys. Conf. Ser. 2022, 2280, 012026. [Google Scholar] [CrossRef]
- Castegnaro, S. Aerodynamic Design of Low-Speed Axial-Flow Fans: A Historical Overview. Designs 2018, 2, 20. [Google Scholar] [CrossRef] [Green Version]
- Yong, T.H.; Dol, S.S. Design and Development of Low-Cost Wind Tunnel for Educational Purpose. IOP Conf. Ser. Mater. Sci. Eng. 2015, 78, 012039. [Google Scholar] [CrossRef] [Green Version]
- Hussain, I.Y.; Ali, A.H.; Majeed, M.H.; Sarsam, W.S. Design, Construction and Testing of Low Speed Wind Tunnel with Its Measurement and Inspection Devices. J. Eng. Univ. Baghdad 2011, 17, 1550–1565. [Google Scholar]
- Chanetz, B. A century of wind tunnels since Eiffel. Comptes Rendus Mécanique 2017, 345, 581–594. [Google Scholar] [CrossRef]
- Yanovych, V.; Duda, D.; Horáček, V.; Uruba, V. Research of a wind tunnel parameters by means of cross-section analysis of air flow profiles. In AIP Conference Proceedings; AIP Publishing: Usti nad Labem, Czech Republic, 2019; Volume 2189. [Google Scholar] [CrossRef]
- Ismail, E.; Pane, A.; Rahman, R.A. An open design for a low-cost open-loop subsonic wind tunnel for aerodynamic measurement and characterization. HardIwareX 2022, 12, e00352. [Google Scholar] [CrossRef]
- Verma, N.; Baloni, B.D. Numerical and experimental investigation of flow in an open-type subsonic wind tunnel. SN Appl. Sci. 2019, 1, 1384. [Google Scholar] [CrossRef] [Green Version]
- Leifsson, L.; Koziel, S. Simulation-driven design of low-speed wind tunnel contraction. J. Comput. Sci. 2015, 7, 1–12. [Google Scholar] [CrossRef]
- Fang, F.-M.; Chen, J.; Hong, Y. Experimental and analytical evaluation of flow in a square-to-square wind tunnel contraction. J. Wind. Eng. Ind. Aerodyn. 2001, 89, 247–262. [Google Scholar] [CrossRef]
- Almeida, O.D.; Miranda, F.C.D.; Ferreira Neto, O.; Saad, F.G. Low Subsonic Wind Tunnel-Design and Construction. J. Aerosp. Technol. Manag. 2018, 10. [Google Scholar] [CrossRef]
- Abdelhamed, A.; Yassen, Y.-S.; ElSakka, M. Design optimization of three dimensional geometry of wind tunnel contraction. Ain Shams Eng. J. 2015, 6, 281–288. [Google Scholar] [CrossRef] [Green Version]
- Celis, B.; Ubbens, H.H. Design and Construction of an Open-circuit Wind Tunnel with Specific Measurement Equipment for Cycling. Procedia Eng. 2016, 147, 98–103. [Google Scholar] [CrossRef] [Green Version]
- Khan, D.; Bjernemose, J.H.; Lund, I.; Bebe, J.E. Design and construction of an open loop subsonic high temperature wind tunnel for investigation of SCR dosing systems. Int. J. Thermofluids 2021, 11, 100106. [Google Scholar] [CrossRef]
- Yi, W.; Zhou, P.; Fang, Y.; Guo, J.; Zhong, S.; Zhang, X.; Huang, X.; Zhou, G.; Chen, B. Design and characterization of a multifunctional low-speed anechoic wind tunnel at HKUST. Aerosp. Sci. Technol. 2021, 115, 106814. [Google Scholar] [CrossRef]
- Niu, X.; Chen, H.; Li, Y.; Jia, X.; Zhang, Y.; Yong, X.; Li, C. Design and performance of a small-scale acoustic wind tunnel at Wenzhou University for aerodynamic noise studies. Appl. Acoust. 2022, 199, 109010. [Google Scholar] [CrossRef]
- Bian, H.; Tan, Q.; Zhong, S.; Zhang, X. Assessment of UAM and drone noise impact on the environment based on virtual flights. Aerosp. Sci. Technol. 2021, 118, 106996. [Google Scholar] [CrossRef]
- Lilley, G. The Prediction of Airframe Noise and Comparison with Experiment. J. Sound Vib. 2001, 239, 849–859. [Google Scholar] [CrossRef]
- Teff-Seker, Y.; Berger-Tal, O.; Lehnardt, Y.; Teschner, N. Noise pollution from wind turbines and its effects on wildlife: A cross-national analysis of current policies and planning regulations. Renew. Sustain. Energy Rev. 2022, 168, 112801. [Google Scholar] [CrossRef]
- Katinas, V.; Marčiukaitis, M.; Tamašauskienė, M. Analysis of the wind turbine noise emissions and impact on the environment. Renew. Sustain. Energy Rev. 2016, 58, 825–831. [Google Scholar] [CrossRef]
- Vitalii, Y.; Daniel, D. Structural Deformation of a Running Wind Tunnel Measured By Optical Scanning. Stroj. Časopis-J. Mech. Eng. 2020, 70, 181–196. [Google Scholar] [CrossRef]
- Abbas, A.; Elwali, W.; Haider, S.; Dsouza, S.; Sanderson, M.; Segan, Y. CAE Cooling Module Noise and Vibration Prediction Methodology and Challenges; SAE International: Warrendale, PA, USA, 2020; Available online: https://www.sae.org/publications/technical-papers/content/2020-01-1262/ (accessed on 6 February 2023).
- Mo, J.-O.; Choi, J.-H. Numerical Investigation of Unsteady Flow and Aerodynamic Noise Characteristics of an Automotive Axial Cooling Fan. Appl. Sci. 2020, 10, 5432. [Google Scholar] [CrossRef]
- Brooks, T.F.; Pope, D.S.; Marcolini, M.A. Airfoil Self-Noise and Prediction. In Technical Report; Hampton, V., Ed.; NASA Reference Publication USA: Washington, DC, USA, 1989; p. 1218. Available online: https://ntrs.nasa.gov/citations/19890016302 (accessed on 6 February 2023).
- Park, S.M.; Ryu, S.-Y.; Cheong, C.; Kim, J.W.; Park, B.I.; Ahn, Y.-C.; Oh, S.K. Optimization of the Orifice Shape of Cooling Fan Units for High Flow Rate and Low-Level Noise in Outdoor Air Conditioning Units. Appl. Sci. 2019, 9, 5207. [Google Scholar] [CrossRef] [Green Version]
- Rynell, A.; Chevalier, M.; Åbom, M.; Efraimsson, G. A numerical study of noise characteristics originating from a shrouded subsonic automotive fan. Appl. Acoust. 2018, 140, 110–121. [Google Scholar] [CrossRef]
- Franzke, R.; Sebben, S.; Bark, T.; Willeson, E.; Broniewicz, A. Evaluation of the Multiple Reference Frame Approach for the Modelling of an Axial Cooling Fan. Energies 2019, 12, 2934. [Google Scholar] [CrossRef] [Green Version]
- Cattafesta, L.; Bahr, C.; Mathew, J. Fundamentals of Wind-Tunnel Design. In Encyclopedia of Aerospace Engineering; 2010. Available online: https://www.researchgate.net/profile/Louis-Cattafesta/publication/230271809_Fundamentals_of_Wind-Tunnel_Design/links/5a0d7a51a6fdcc39e9bfe324/Fundamentals-of-Wind-Tunnel-Design.pdf (accessed on 6 February 2023).
- Liu, P.; Xing, Y.; Guo, H.; Li, L. Design and performance of a small-scale aeroacoustic wind tunnel. Appl. Acoust. 2017, 116, 65–69. [Google Scholar] [CrossRef]
- Barlow, J.B.R.; Pope, A.W.H. Low-Speed Wind Tunnel Testing. In Aerospace Engineering/Mechanical Engineering; John Wiley & Sons: Hoboken, NJ, USA, 1999; Volume 3. [Google Scholar]
- Kao, Y.-H.; Jiang, Z.-W.; Fang, S.-C. A Computational Simulation Study of Fluid Mechanics of Low-Speed Wind Tunnel Contractions. Fluids 2017, 2, 23. [Google Scholar] [CrossRef] [Green Version]
- Mehta, R.D.; Bradshaw, P.M.D. Design rules for small low speed wind tunnels. Aeronaut. J. 1979, 83, 443–453. [Google Scholar]
- Bell, J.H.; Mehta, R.D. Contraction Design for Small Low-Speed Blind Tunnels; Stanford University: Stanford, CA, USA, 1989; p. 39. [Google Scholar]
- Kulkarni, V.; Sahoo, N.; Chavan, S.D. Simulation of honeycomb–screen combinations for turbulence management in a subsonic wind tunnel. J. Wind. Eng. Ind. Aerodyn. 2011, 99, 37–45. [Google Scholar] [CrossRef]
- Hamzah, H.; Jasim, L.M.; Alkhabbaz, A.; Sahin, B. Role of Honeycomb in Improving Subsonic Wind Tunnel Flow Quality: Numerical Study Based on Orthogonal Grid. J. Mech. Eng. Res. Dev. 2021, 44, 352–369. [Google Scholar]
- Pereira, J.D. Wind Tunnels: Aerodynamics Models and Experiments; Nova Science Publisher’s: Hauppauge, NY, USA, 2011. [Google Scholar]
- Mehta, R. The aerodynamic design of blower tunnels with wide-angle diffusers. Prog. Aerosp. Sci. 1979, 18, 59–120. [Google Scholar] [CrossRef]
- Munson, B.R. Fundamentals of Fluid Mechanics, 7th ed.; John Wiley & Sons: Hoboken, NJ, USA, 2013. [Google Scholar]
- Idelchik, I.E. Handbook of Hydraulic Resistance; Research Institute for Gas Purification: Moscow, Russia, 2008. [Google Scholar]
- Wattendorf, F.L. Factors Influencing the Energy Ratio of Return Flow Wind Tunnels. In Proceedings of the Fifth International Congress for Applied Mechanics, Cambridge, UK, 29 July 1938. [Google Scholar]
- Eckert, W.T.; Mort, K.W.; Jope, J. Aerodynamic Design Guidelines and Computer Program for Estimation of Subsonic wind Tunnel Performance; 1976. Available online: https://ntrs.nasa.gov/citations/19770005050 (accessed on 6 February 2023).
- Benedetti, D.M.; Veras, C.A.G. Wind-Tunnel Measurement of Differential Pressure on the Surface of a Dynamically Inflatable Wing Cell. Aerospace 2021, 8, 34. [Google Scholar] [CrossRef]


| Axial Fan Unit | Variable Frequency Drive (VFD) | ||
|---|---|---|---|
| Specification | Value | Specification | Value |
| Motor supply | 3-phase | Input voltage | 220 V (±15%) AC |
| Motor Power | 7.5–8.6 kW | Output voltage | 380 V/AC |
| Max motor frequency | 60 Hz | Input frequency | 0–50/60 Hz |
| Number of fan blades | 10 | Output frequency | 0–650 Hz |
| Inner diameter | 0.57 m | The input stage | 1 phase for 220 V |
| Outer diameter | 0.63 m | The output stage | 3 phases for 380 V |
| Casing length | 0.67 m | Model | 9100-1T3-00750G |
| Pressure rise Δp | 970 Pa | Manufacturer | Shenzhen NFlixin Electric Co., Ltd. (Guangdong, China) |
| Flow rate, Q | 16,740 m3/h | ||
| Manufacturer | Gebhardt Ventilatorren—D-74638 Waldenburg | ||
| Type | ARMF2-580-2D-22 | ||
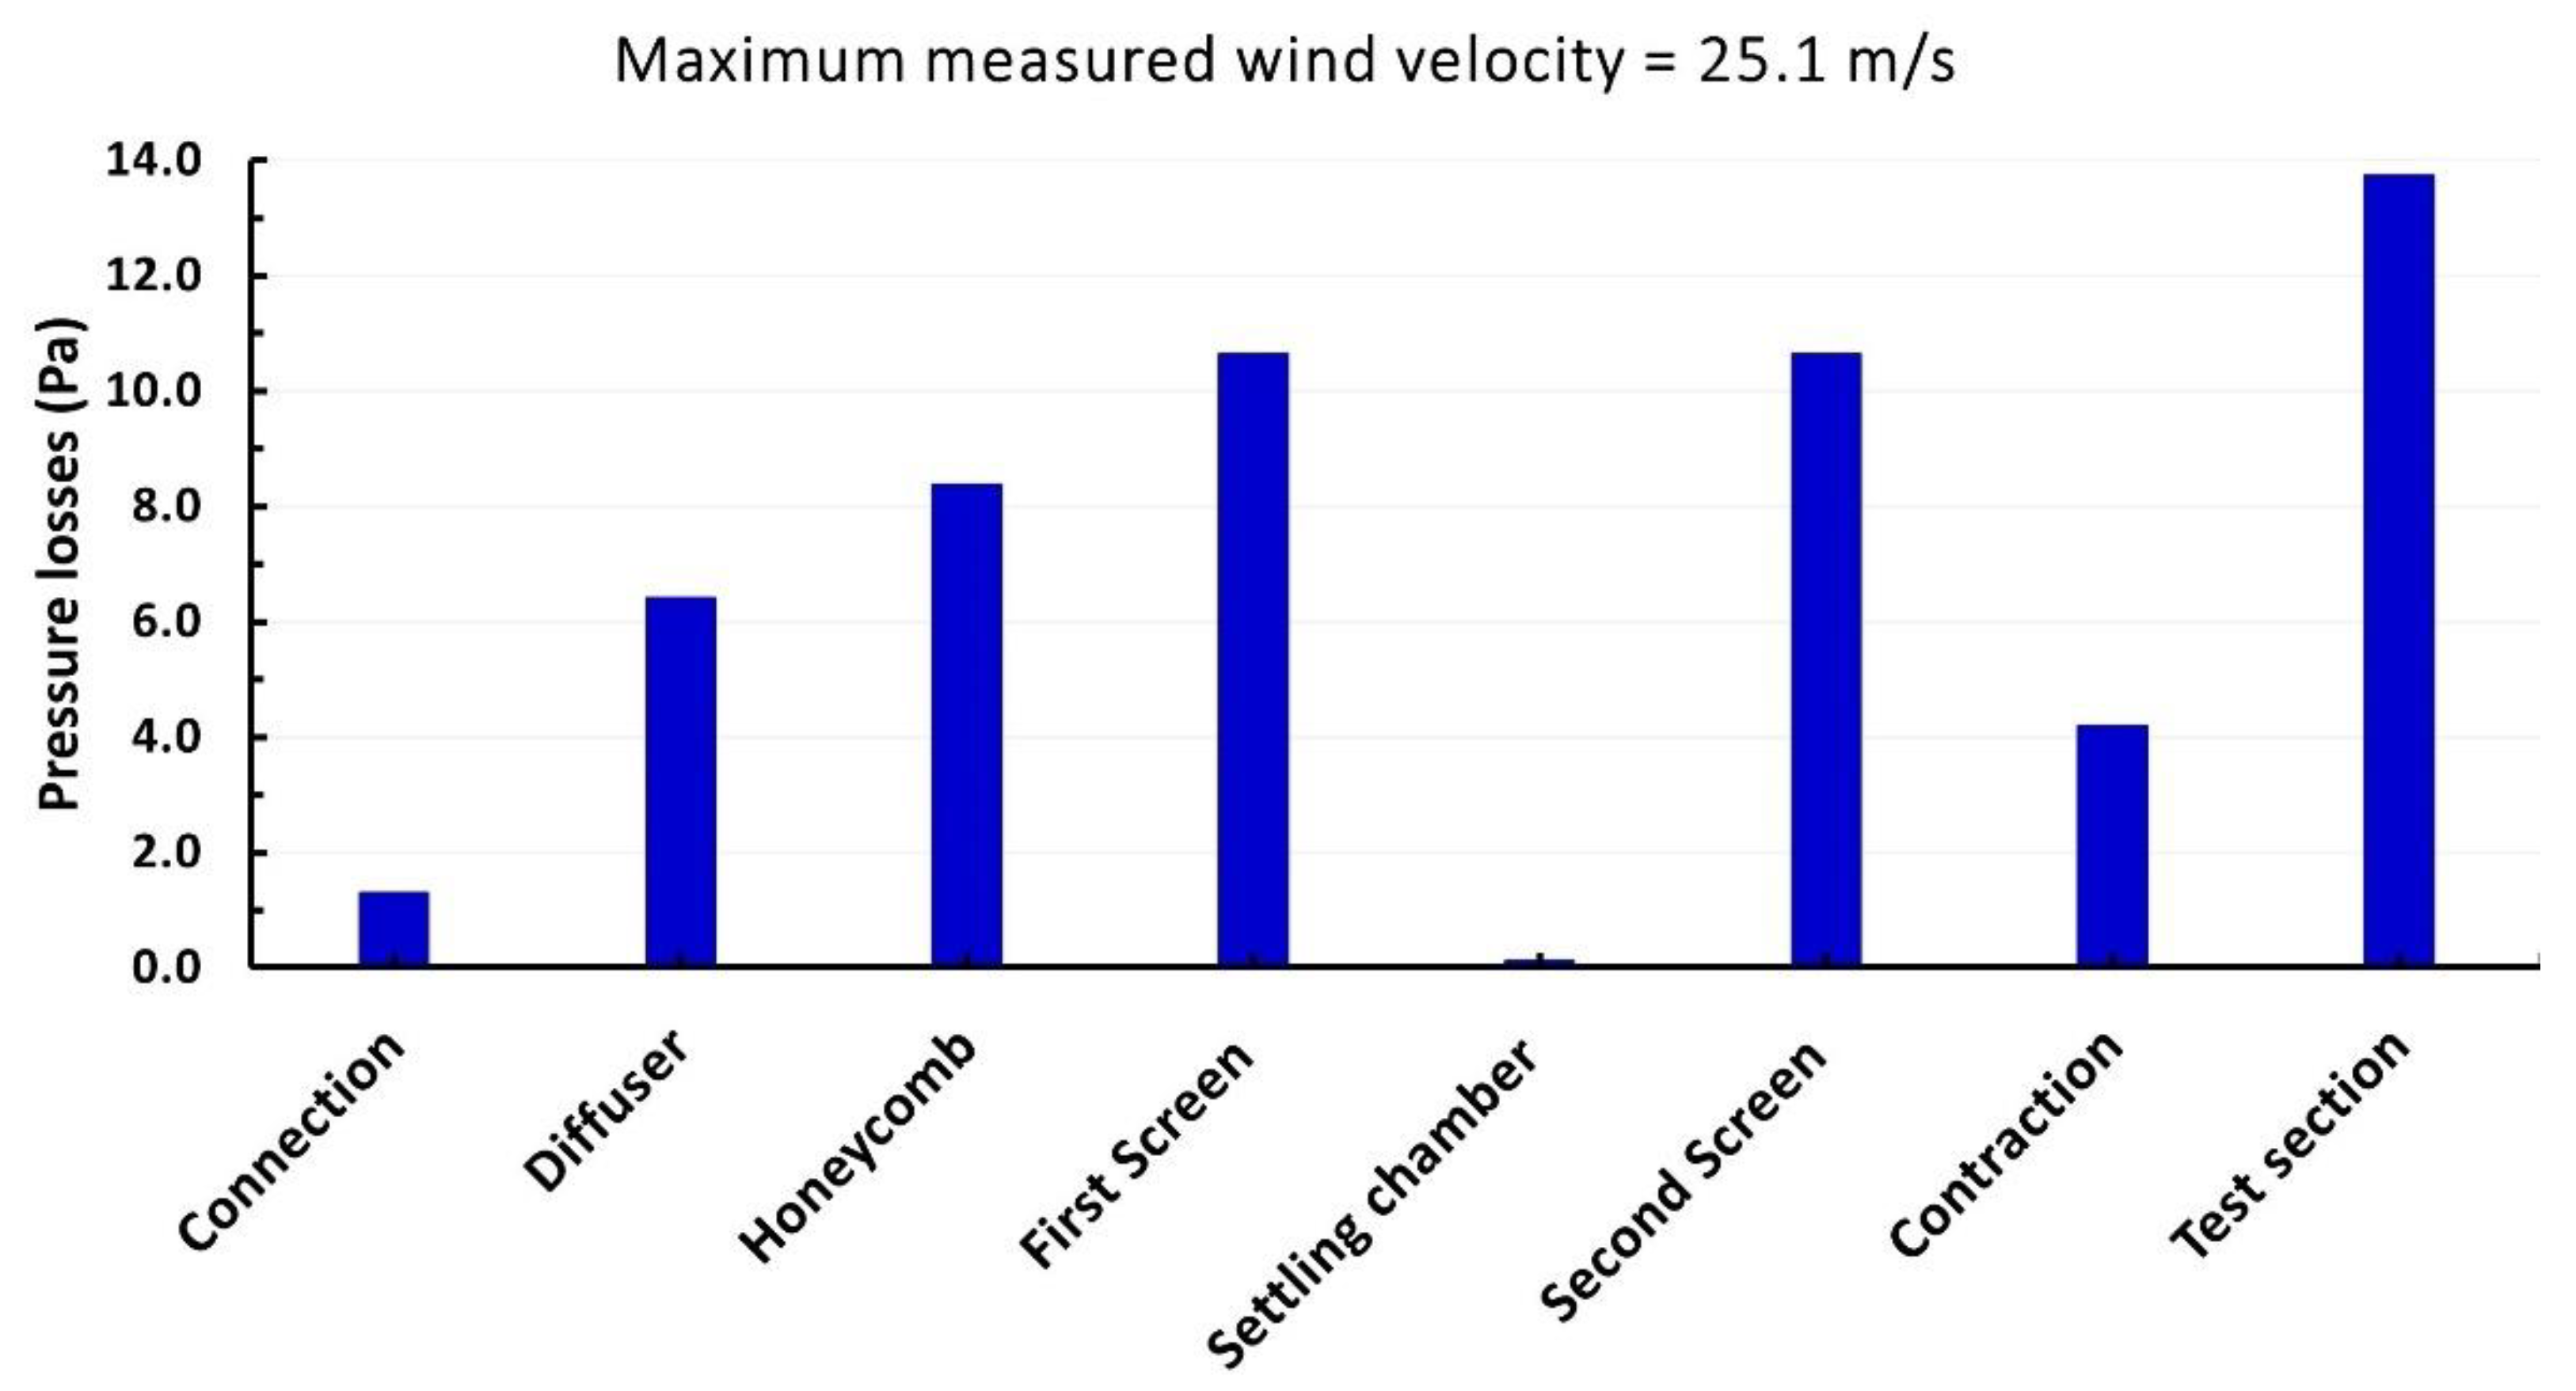
| Wind Tunnel Component | KL,i | ΔpL,i (Pa) |
|---|---|---|
| Connecting | 0.015 | 1.289 |
| Diffuser | 0.073 | 6.413 |
| Settling chamber (empty part) | 0.013 | 0.126 |
| Honeycomb | 0.597 | 8.372 |
| First screen | 1.113 | 10.643 |
| Second screen | 1.113 | 10.643 |
| Contraction cone | 0.011 | 4.187 |
| Test section | 0.037 | 13.738 |
| The components’ total pressure loss, ΔpL,comp (Pa) | 55.412 | |
Disclaimer/Publisher’s Note: The statements, opinions and data contained in all publications are solely those of the individual author(s) and contributor(s) and not of MDPI and/or the editor(s). MDPI and/or the editor(s) disclaim responsibility for any injury to people or property resulting from any ideas, methods, instructions or products referred to in the content. |
© 2023 by the authors. Licensee MDPI, Basel, Switzerland. This article is an open access article distributed under the terms and conditions of the Creative Commons Attribution (CC BY) license (https://creativecommons.org/licenses/by/4.0/).
Share and Cite
Abdel Aziz, S.S.; Moustafa, E.B.; Salem Said, A.-H.S. Experimental Investigation of the Flow, Noise, and Vibration Effect on the Construction and Design of Low-Speed Wind Tunnel Structure. Machines 2023, 11, 360. https://doi.org/10.3390/machines11030360
Abdel Aziz SS, Moustafa EB, Salem Said A-HS. Experimental Investigation of the Flow, Noise, and Vibration Effect on the Construction and Design of Low-Speed Wind Tunnel Structure. Machines. 2023; 11(3):360. https://doi.org/10.3390/machines11030360
Chicago/Turabian StyleAbdel Aziz, Salem S., Essam B. Moustafa, and Abdel-Halim Saber Salem Said. 2023. "Experimental Investigation of the Flow, Noise, and Vibration Effect on the Construction and Design of Low-Speed Wind Tunnel Structure" Machines 11, no. 3: 360. https://doi.org/10.3390/machines11030360