
Implementing Digital Twins That Learn: AI and Simulation Are at the Core

1
SAS Institute, 100 SAS Campus Dr, Cary, NC 27513, USA
2
School of Industrial Engineering and Mitchell E. Daniels School of Business, Purdue University, 315 N. Grant Street, West Lafayette, IN 47907, USA
*
Author to whom correspondence should be addressed.
Machines 2023, 11(4), 425; https://doi.org/10.3390/machines11040425
Submission received: 15 February 2023
/
Revised: 12 March 2023
/
Accepted: 16 March 2023
/
Published: 27 March 2023
(This article belongs to the Special Issue Advances in Digital Twins for Manufacturing)
Abstract
:As companies are trying to build more resilient supply chains using digital twins created by smart manufacturing technologies, it is imperative that senior executives and technology providers understand the crucial role of process simulation and AI in quantifying the uncertainties of these complex systems. The resulting digital twins enable users to replay history, gain predictive visibility into the future, and identify corrective actions to optimize future performance. In this article, we define process digital twins and their four foundational elements. We discuss how key digital twin functions and enabling AI and simulation technologies integrate to describe, predict, and optimize supply chains for Industry 4.0 implementations.
1. Introduction
IoT and digital twin adoption are expected to unlock USD 5.5 trillion–USD 12.6 trillion across the globe by 2030 [1]. Thus, it is critical to understand what a digital twin is and how digital twin technology could enable an organization’s digital transformation. A digital twin is a virtual representation of a physical entity or a process. Driven by real-time IoT data, digital twins change throughout the life cycles of entities and processes. An example of a physical entity may be an individual asset such as an industrial machine. It may also represent a sub-system of a machine as well as a collection of sub-systems depending on the complexity of the machine. In each of these cases, the digital twin is called an “asset twin” (or “product twin”). A digital twin can also represent a process flow in a system of individual assets. An example is a manufacturing process flow an entity follows in a factory as it travels from one machine to another and is gradually transformed from raw material into a finished good. In this case, the digital twin is called a “process twin”. The focus of this article is on process twins built for factories and supply chains. Thus, we refer to it as “factory twin” and “supply chain twin” in the remainder of the article.
We assume factory twin to consist of virtual representations of physical manufacturing resources and processes that would exist in a supply chain’s factory. A factory twin can be developed for an existing manufacturing facility and used for enhancing the resilience of its supply chain. Alternatively, it can be developed for a factory that has not been built yet but is under design. In this case, the factory twin is used for the management of the risk involved in making strategic investment decisions for the entire supply chain. The twin enables profit-optimal decisions despite the complexity of the manufacturing process flow and the high operational risk affecting cost and service. However, the role of the factory twin does not cease with strategic planning. A digital twin evolves, learns, and improves over time throughout the life cycle. Thus, any strategic long-term planning is followed by efforts of operationalization. A semiconductor manufacturing use case introduced in [2] demonstrates this aspect of factory digital twins. The decision timelines span from strategic to operational phases of planning and optimizing equipment, process, and people management to achieve an optimal unit cost of production and a level of product quality to successfully compete in the market. The key takeaway from this use case is that a digital twin built for a manufacturing system does not remain static; instead, it changes as a direct result of operating in an evolving, learning, and improving environment. The objective of using digital twin technology in manufacturing and supply chain settings is to utilize the data collected from machines and processes for bridging the gap between factory and supply chain operations and their virtual models. Furthermore, insights are derived about the optimal factory and supply chain management using those virtual models, and tangible actions are determined to enhance the key performance indicators (KPIs), including throughput, quality, cost, on-time delivery, sustainability, and resiliency [3].
We complement our digital twin definitions with the characterization provided by the Digital Twin Consortium [4]. Founded in 2020, the consortium brings corporations, innovators, academia, and governments together to accelerate the development, adoption, and widespread use of twin technology for digital transformation. With a steering committee composed of Dell Technologies, GE Digital, Microsoft, Northrop Grumman, and Johnson Controls, the consortium hosts working groups on topics ranging from aerospace and defense and healthcare and life sciences to manufacturing, mobility and transportation, and financial technology. The consortium defines a digital twin as a virtual representation of real-world entities and processes, synchronized at a specified frequency and fidelity. Thus, a factory digital twin is required to have four main characteristics: (1) a physical (factory) representation; (2) a virtual representation of assets and manufacturing processes in the factory; (3) synchronization between these physical and digital representations at a pre-specified frequency and fidelity; and (4) the ability to learn and adapt, leading to improved virtual models and enhancements in the physical representation of the factory.
In this article, we discuss the importance of a closed feedback loop between physical and digital representations explicitly modeling the process flow of the factory (“process twin”). However, if the objective were to identify the optimal operating settings of specific machinery by directly modeling the relation between the facility inputs and outputs via machine learning (ML) without the explicit modeling of the process flow, we would call the virtual representation of the entire manufacturing facility an asset twin. This is beyond the scope of this article; we refer the reader to [5] for a use case where prediction models are used to estimate product quality for line operators in real time, while optimization models are deployed to ensure the optimal operation of production lines. Another topic that is beyond the scope of this article is the use of digital twin technology to support product design. We refer the reader to [6] for a study discussing how to utilize computer-aided design (CAD) models and manufacturing simulations to optimize product design. In the remainder of the article, we focus on the role of discrete-event factory simulation, machine learning, and reinforcement learning to optimize manufacturing process design and operations.
The reader may wonder whether every factory simulation is a digital twin since factory simulations are built and validated by using historical data sets, and the validated models can be used to replay history and provide insights about how to optimize the factory KPIs. We do not consider all simulations a digital twin because synchronization and learning are required for the simulations to serve as true digital twins. The digital twins build on a combination of real-time and historical data to represent the past and present and predict the future. They are further adapted to use cases, powered by integration, and guided by domain knowledge.
A good resource for a discussion of digital twins and enterprise adaptation is the tutorial by Kulkarni et al. [7]. More recently, Grieves discussed the development and management of complex systems using intelligent digital twins [8]; Biller et al. presented an introductory digital twin tutorial with a focus on the role of simulation in supply chain digital twin development [9]. Applications of digital twins have also been widely discussed in connection with Industry 4.0 [10]. We further refer the reader to [11,12] for digital twin technology in smart manufacturing [13], in production logistics; and [14], in material handling. In this article, we focus on factory twin development and discuss how key digital twin functions and enabling technologies make it possible to describe, predict, and optimize a factory’s KPIs. Focusing on the role of simulation augmented by machine learning (ML) and reinforcement learning (RL), we touch on several challenges that arise in industrial twin use cases and how they can be overcome. The common theme across all these studies is that the adoption of emerging technologies such as IoT and edge and cloud has accelerated digital twin development and that digital twins be a critical enabler of digital transformation in the foreseeable future.
The remainder of the article is organized as follows: Section 2 introduces the foundational elements of factory and supply chain twins. Section 3 presents two examples of digital twin development frameworks, one of which is built on the foundational elements. Section 4 discusses building and operationalizing digital twins. Section 5 focuses on the role of simulation, ML, and RL in the twin development while Section 6 presents evaluation criteria to support factory simulation software design and/or selection. Section 7 discusses several different challenges that may arise in industrial process twin use cases where simulation plays a key role in execution, followed by the conclusion in Section 8.
2. Factory and Supply Chain Twin Foundational Elements
In this section, we discuss the foundational elements of factory and supply chain digital twins. This is important because the foundational elements may aid the reader when trying to differentiate between different digital twin approaches and various vendor offerings. We recommend identifying the differentiators with respect to the four foundational elements of digital twin development: Data, Domain, Analytics, and Outcome.
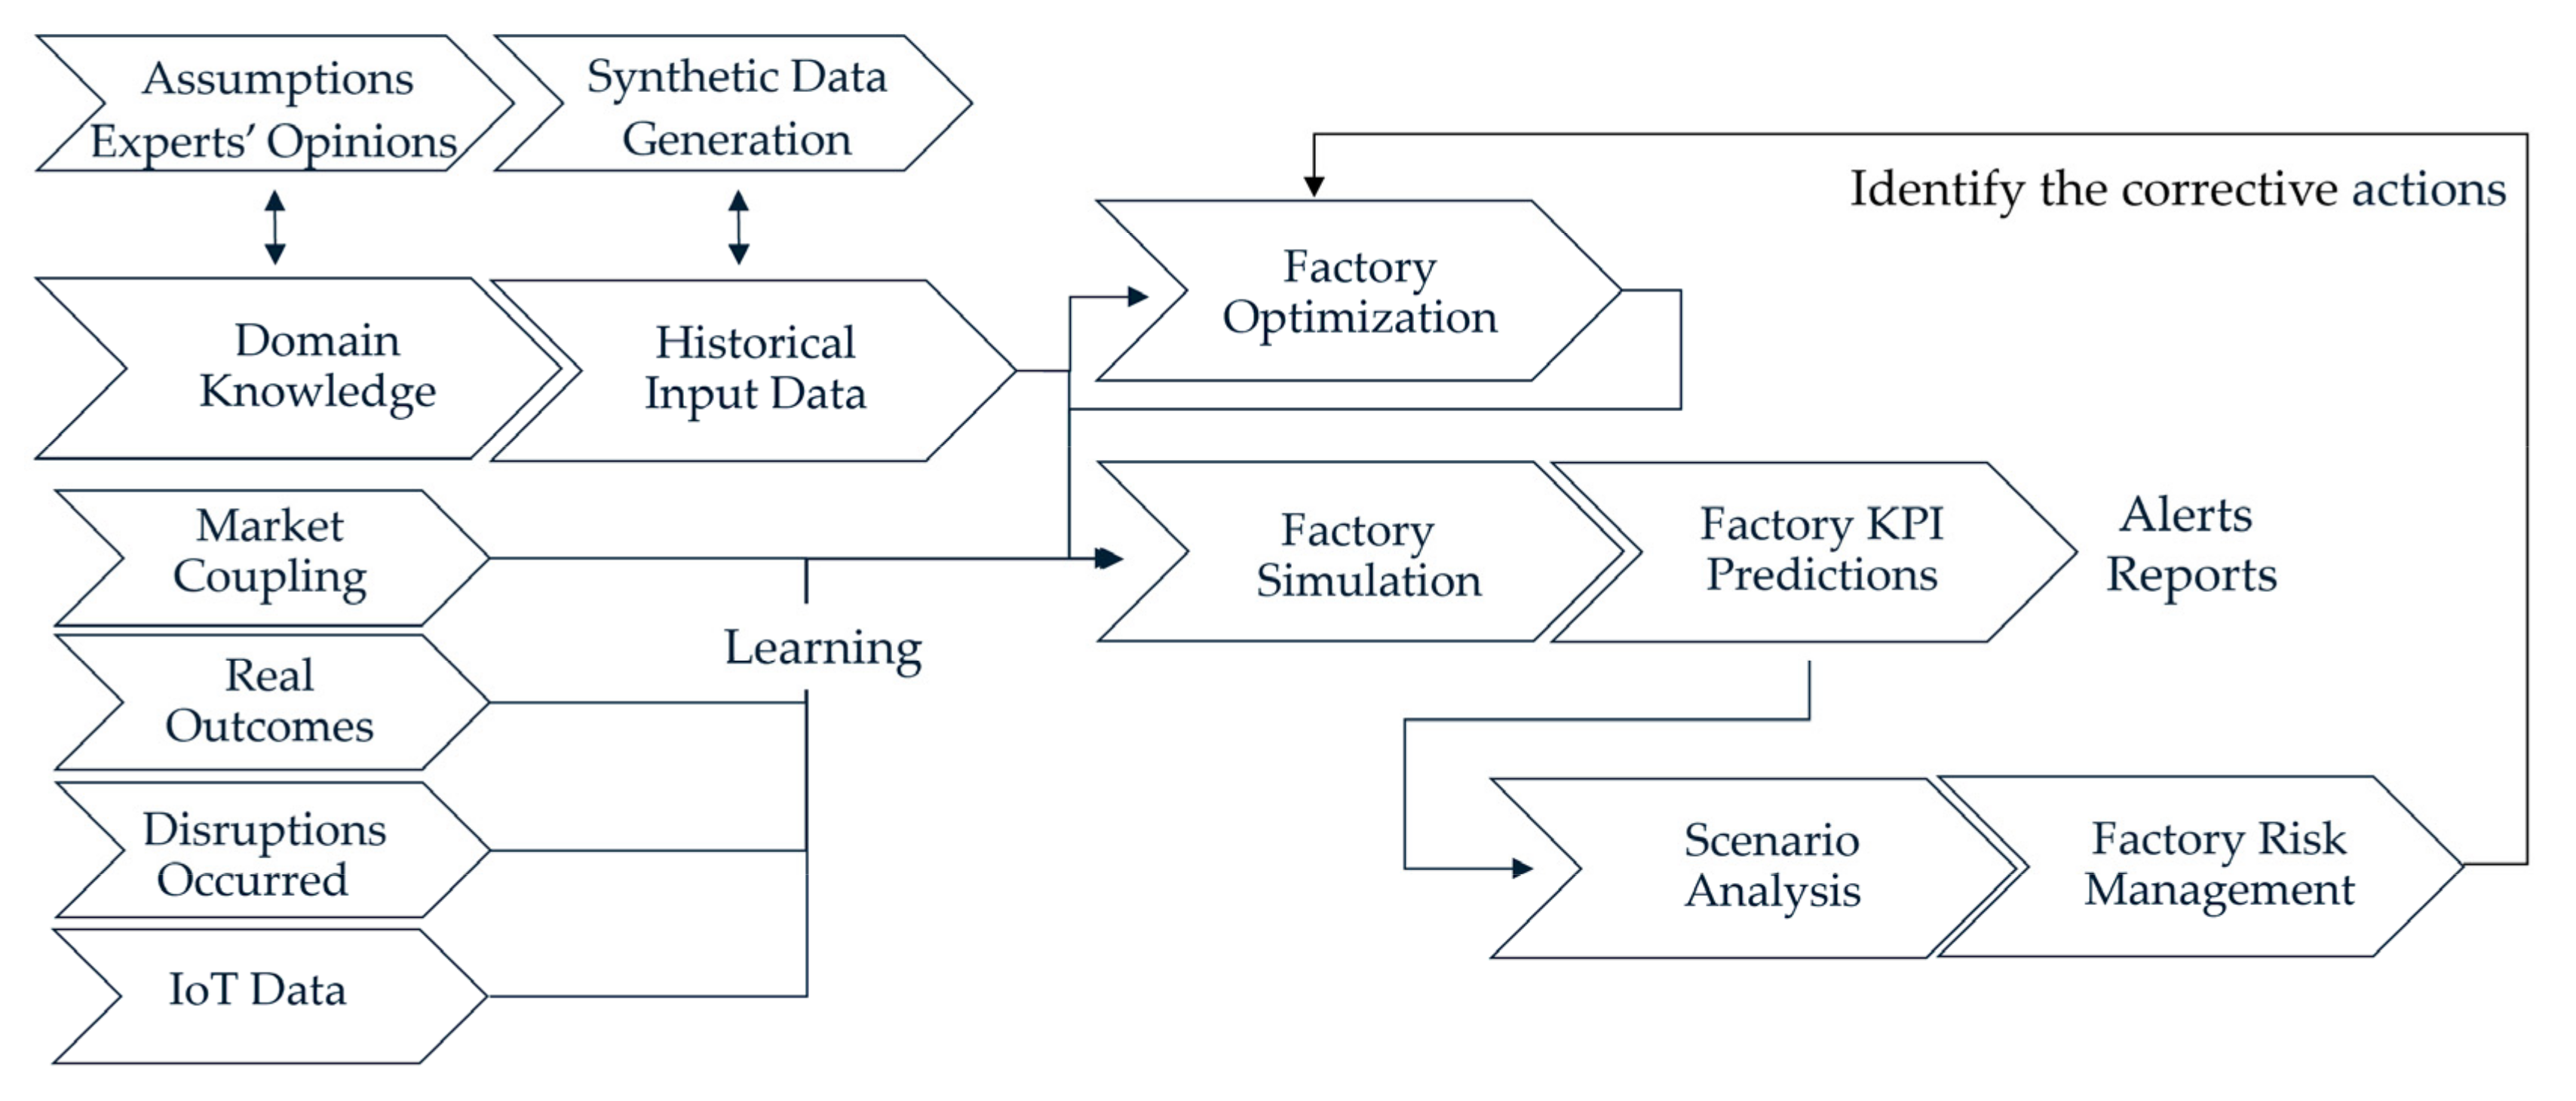
The Data element includes all categories of data such as (i) engineering and design (product life cycle management (PLM) data); (ii) experts’ opinions; (iii) historical data from enterprise asset management (EAM), manufacturing execution system (MES) and enterprise resource planning (ERP); (iv) sensor IoT data; and (v) texts, images, videos, and audio. It is critical that this list also encapsulates market coupling and includes outcomes that are associated with the decisions implemented in previous periods. As illustrated in Figure 1, these data sets flow into the factory twin solution periodically and drive the learning process. Augmentation of the data sets may be needed, based on the content of the data collected. An artificial intelligence (AI) technique known as “synthetic data generation” may be the method of choice in that case [9]. Combinations of different categories of data are used to describe the factory configuration and state and to capture the uncertainty in the input processes such as part interarrival times, machining times, and times to transport work-in-process inventory. The granularity of the input data and the unit of time assumed by the factory digital twin may range from seconds, minutes, and hours to months, quarters, and years. Ultimately, the value chosen for the unit of time depends on the frequency of decision making.
The Domain element combines physics-based modeling of the processes with domain expertise. The areas of expertise may include thermodynamics, computational fluid dynamics (CFD), failure mode and effects analysis (FMEA), plant maintenance, material analysis, mechanical design, and operational management. It is also important to consider the current life cycle phase (designing, planning, operating, or retiring).
The Analytics element includes key digital twin functions, enabling technologies, learning, and control. Technologies, such as advanced analytics supporting digital twin development, often include IoT and event stream processing, big data analytics, statistical modeling and time series forecasting, visual analytics, AI, ML, RL, natural language processing, computer vision, simulation, and optimization. Factory twin development requires integration of these analytics to achieve target factory KPIs through replaying history, conducting bottleneck and what-if analyses, and performing resilience testing. For example, SAS Institute develops AI solutions for real-time queue monitoring and resource control by integrating simulation with IoT, event stream processing, computer vision, and reinforcement learning [15,16,17]. Siemens builds factory twins using a combination of plant simulation and IoT capabilities to improve production efficiency and quality [18].
It is important to note that any factory is part of a supply chain. Thus, the use cases of the Analytics element may include promotion optimization, demand forecasting, production scheduling, and optimization of inventory, supply, and logistics. Furthermore, the expected impact associated with the Outcome element may range from performance monitoring and data accuracy enhancements to increased financial outcomes, service improvements, and increased resilience. The focus of this article is on the development of factory twins. Bringing the resulting factory twins together in a supply chain network model would enable end-to-end system analysis. Consequently, we would gain enhanced visibility not only into factory performance but also into the effectiveness of production, inventory, and delivery plans across the entire network of suppliers, plants, distribution centers, and customers. We refer the reader to [2,9] for a high-level description of how the digital twin enabling technologies could further support the supply chain digital twin development.
3. Digital Twin Development Frameworks
Factory and supply chain twins are expected to accelerate the holistic understanding of factory and supply chain operations and challenges, identify optimal solutions, and provide effective shop floor and supply chain network control. The scope of the digital twin development is motivated by the target KPIs and tailored to the use case. However, on the journey to digital transformation, the use case evolves over time. Therefore, it is important to modularize the digital twin development to allow new solutions to build on and learn from previous solutions. Such a modular approach can be enabled by a digital twin framework composed of modular development steps. This framework enables clarity of thought and communication, transparency of actions, and reduction of development time.
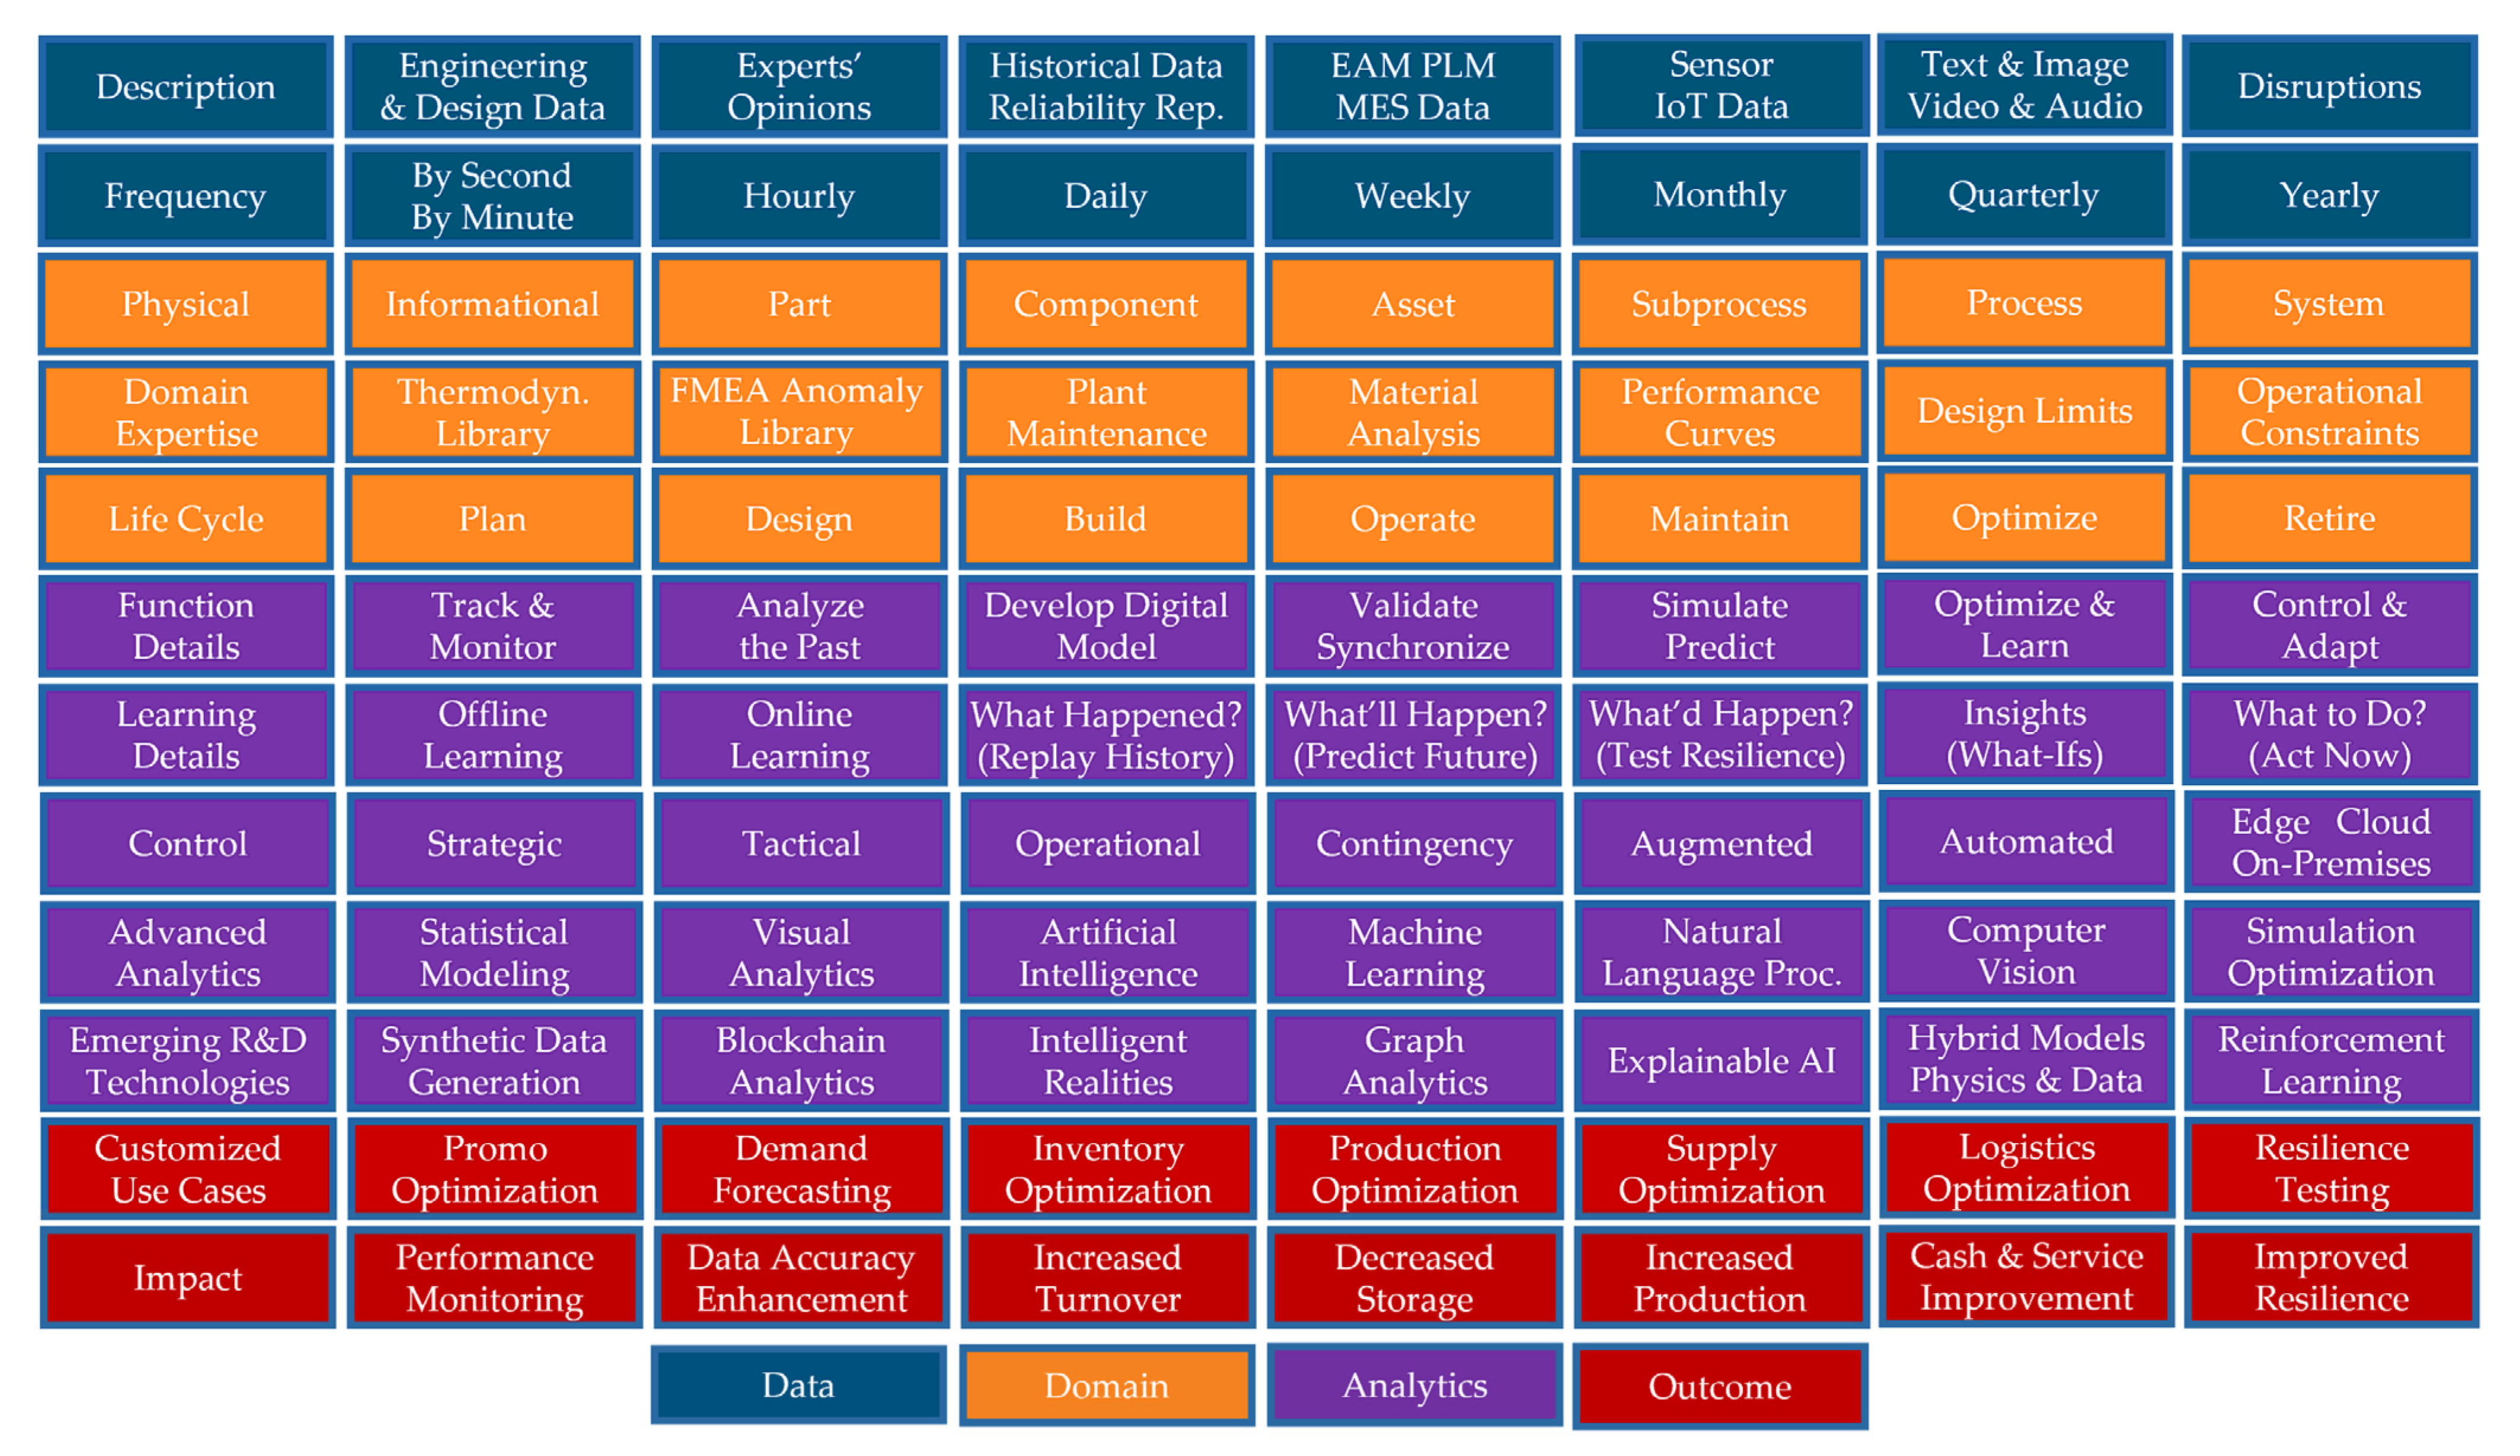
In this section, we present two digital twin development frameworks. The first framework builds on the four foundational elements (Data, Domain, Analytics, and Outcome) [9]. It is designed to distinguish among the scopes of different digital twin developments. The second framework is the digital twin capabilities periodic table [19] designed to highlight capability requirements and solution features.
3.1. Framework I
Figure 2 illustrates a digital twin development framework based on the Data, Domain, Analytics, and Outcome elements introduced in Section 2. The association with each foundational element is color-coded for clarity. In the leftmost column of the illustration, the framework assigns “Description” and “Frequency” categories to the Data element; “Physical”, “Domain Expertise”, and “Life Cycle” categories to the Domain element; “Function Details”, “Learning Details”, “Control”, “Advanced Analytics”, and “Emerging R&D Technologies” categories to the Analytics element; and “Customized Use Cases” and “Impact” categories to the Outcome element. Digital twin functions, which will be discussed in Section 4, is covered under the categories of function and learning details in Figure 2. Similarly, the digital twin enabling technologies, which will be introduced in Section 4, are included in the rows of advanced analytics and emerging R&D technologies. Finally, high-level descriptions of the factory and supply chain use cases are captured by the Outcome element.
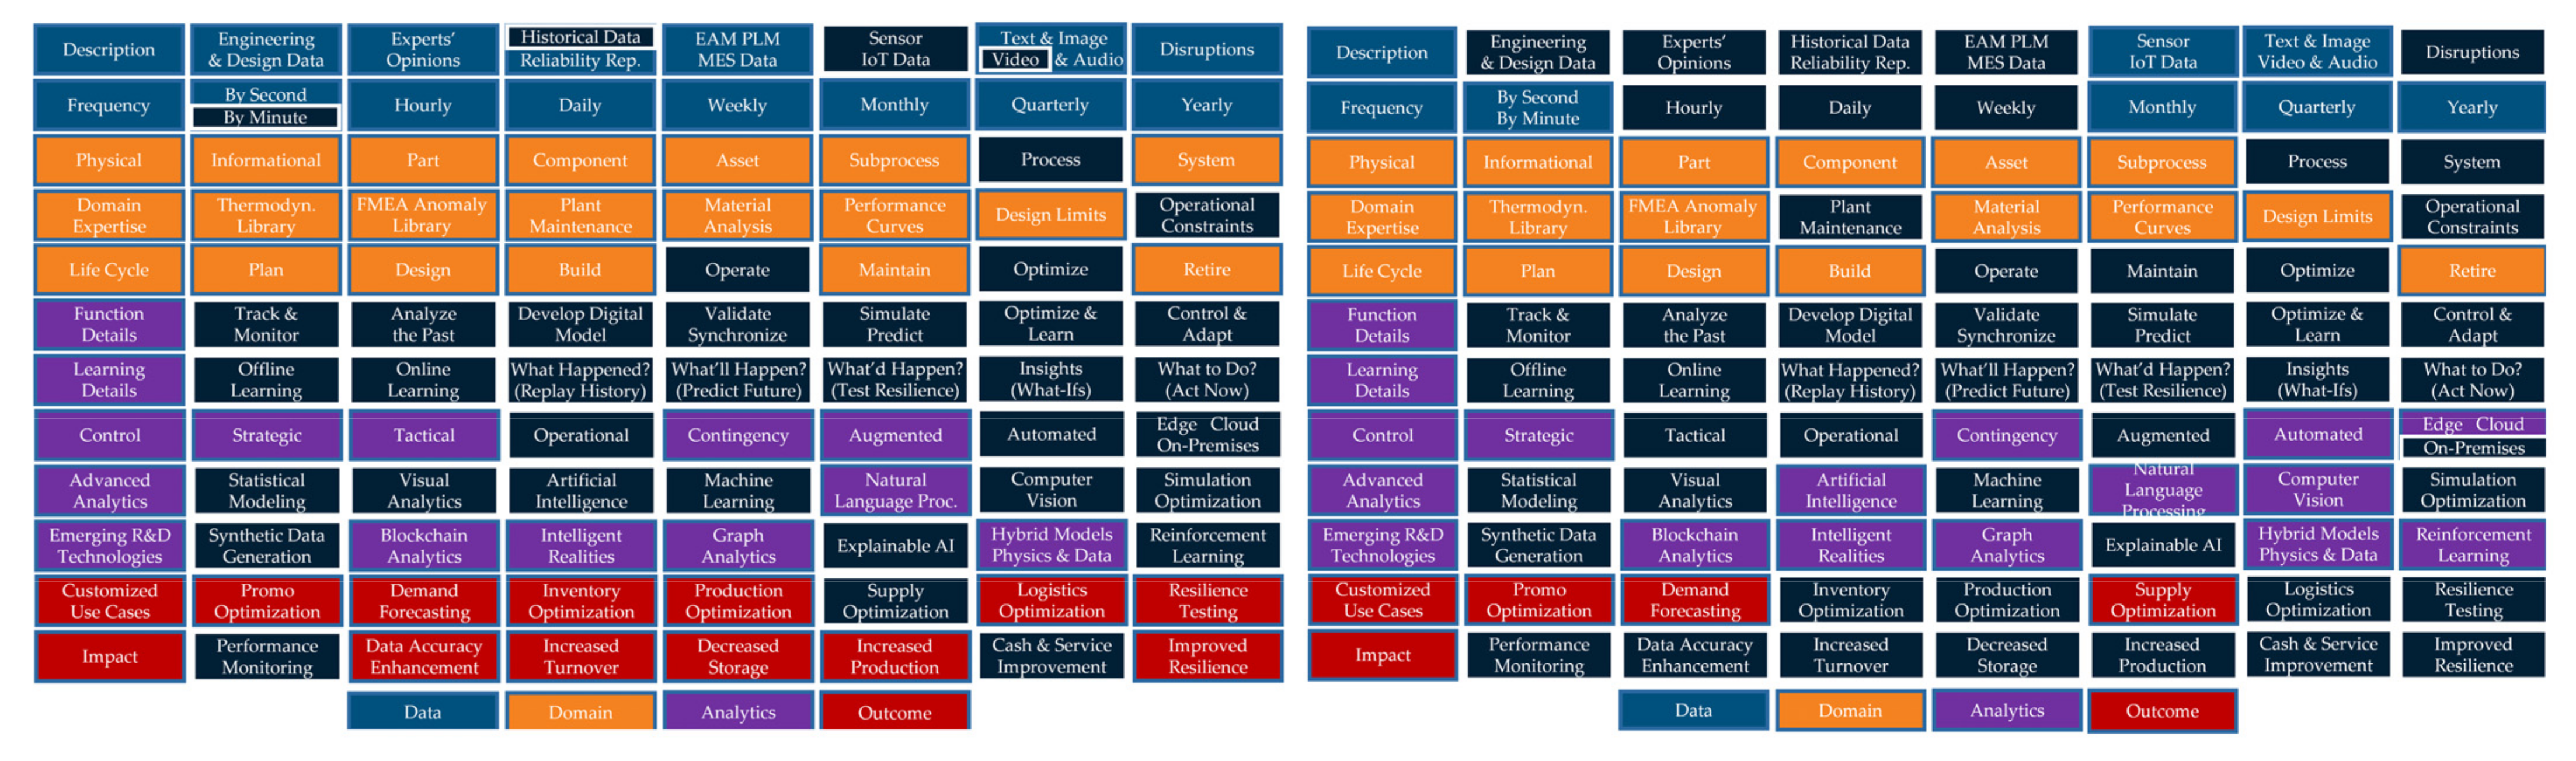
It is important to note that a use case may not necessarily utilize every component illustrated in Figure 2. Two different use cases may utilize some of the same components of the framework but still choose different analytical tools and aim to reach different KPI targets. We illustrate this point in Figure 3 by highlighting the development components with the black color for two different use cases: a factory twin supporting real-time queue monitoring and resource control (on the left-hand side) and a supply chain digital twin (on the right-hand side). Featuring the components relevant to each use case enhances communication among the stakeholders and brings transparency to how the target KPIs can be achieved. In addition, we see which development tasks of the two digital twin solutions overlap and carry over from one twin development to another. The extraction of this information from Figure 3 is important because transferring learning from one twin development to another reduces the development time, identifies collaboration opportunities between the development teams, and improves staff utilization.
3.2. Framework II
Another excellent framework is the digital twin capabilities periodic table proposed in [19] and illustrated in Figure 4. In this framework, the digital twin capabilities periodic table represents the features of digital twin technology solutions and identifies the necessary capabilities to meet the digital twin required characteristics.
The digital twin capabilities periodic table builds on six different categories, each with a role in digital twin development: (1) data services, (2) integration, (3) intelligence, (4) user experience (UX), (5) management, and (6) trustworthiness. In Figure 4, we highlight the simulation and AI/ML technologies of the data services and intelligence categories. Data services connect the factory (physical) representation with its simulation (virtual representation) by using the data collected from equipment sensors and control systems; integration enables factory twin communication; intelligence represents the services associated with developing and deploying factory twin solutions; user experience interacts with factory twins and visualizes their data; management represents ecosystem control; and trustworthiness handles security, privacy, safety, reliability, and resilience. Furthermore, Schalkwyk defines security as the ability to protect digital twins from unintended and unauthorized access, ensuring the availability, integrity, and confidentiality of equipment and system information. Reliability is, on the other hand, described as the ability of the digital twin (or any component of the digital twin) to perform its required functions—such as delivering a quality of service and/or a level of accuracy—under pre-specified conditions for a predetermined period. We refer the reader to [20] and [21] for further discussion on the topics of digital twin security and reliability.
We conclude this section by noting that every digital twin solution does not require the use of every capability in Figure 4. However, it is still critical for a company on a journey of digital transformation to hit a high percentage of the components in the digital twin capabilities periodic table. This can be done by offering either core functionality or a solution with partners. The percentage of capabilities covered may vary from one use case to another based on complexity and resource availability.
4. Building and Operationalizing Digital Twins
Having developed the digital twin framework with all stakeholders, we next outline the three primary functions of building process digital twins: (1) Offline Model Development, (2) Real-Time Synchronization, and (3) Online Learning.
The Offline Model Development function involves building a virtual representation of the factory and validating it with static data representing the history of the factory operations (process simulation). The validated model can be used for two main purposes: (i) to replay history; (ii) to provide insights about how to optimize factory performance. The Real-Time Synchronization function updates the model parameters and calibrates the factory simulation with the most recent data at a suitable frequency; consequently, the factory and its digital representation are synchronized. The synchronization frequency is based on the timeline of decision making and the requirements of learning and adaptation. The next function is Online Learning, which involves factory monitoring and tracking the past, prediction of the factory performance, and identification of the best course of action using optimization. At this phase of the development, the factory twin is expected to provide enhanced visibility into the future, enable playing operational what-if games, and offer decision support for optimal performance.
Figure 5 provides an illustration of the key factory twin functions with AI/ML, simulation, forecasting, optimization, econometrics, visual analytics, and streaming analytics as selected enabling technologies. We note that learnings obtained from the online-learning phase of the development are not just insights. They are the actions that are recommended to control the factory floor and establish a closed feedback loop between physical and digital representations. The outcomes realized in response to these controls on the shop floor and in the supply chain are fed back into the digital model as inputs to learn and adapt to the changing factory and supply chain environment.
Next, we notice that both Offline Model Development and Online Learning have their “prediction” components. Simulation plays a key role in equipping a digital twin with prediction capability. However, there is one major difference between simulations developed during Offline Model Development and Online Learning. In the former case, the input models characterizing the uncertainty in the stochastic processes on the factory floor (for example, processing times of various parts on different machines) are built from domain expertise, assumptions, and static historical data sets. Factory simulations that combine the manufacturing process-flow logic with these stochastic input-model characterizations typically start in an idle state, and the steady-state simulation design and analysis methodology [22] is utilized for making long-term KPI predictions. In the latter case, the data collected from sensors, real-time location system (RTLS) tags, and other streaming sources present a snapshot reflecting the system state at that point in time. The use of these data sets to hot start the simulation is what primarily distinguishes a simulation developed during Online Learning from that created during Offline Model Development. Snapshots of the system are taken several times each day and fed into the model to hot start the supporting simulation with the current state of the factory (see, for example, a General Electric use case in a healthcare setting [23]).
There are several obstacles to the successful operationalization of the factory twins. One of these obstacles relates to the use of big data analytics for the simultaneous management of multiple factory twins in the supply chain network as well as the twins of the assets involved in the system’s manufacturing process flows. Because the value chosen for the unit of time in a digital twin depends on the frequency of decision making and every digital twin operates in an evolving environment, the scale of time would likely not be the same in different digital twins, despite them being parts of the same supply chain network. For example, emergency maintenance decisions are typically made within minutes, while inventory adjustments might be considered every week or month. Furthermore, some data sets may be highly sparse, while others may require the collection of high-frequency data. Coordination of the data-collection activities and implementation of suitable data analytics approaches are among the key challenges of operationalizing digital twins. We discuss the former case in Section 7.2 and describe industrial solutions for the manufacturing domain. For a more general discussion of developing input models for factory twins, we refer the reader to [22]. Another obstacle to operationalizing digital twins relates to internet connectivity and data security. This topic is covered in the digital twin capabilities periodic table, illustrated in Figure 4, under the category of trustworthiness. This discussion is beyond the scope of this article; we refer the interested reader to [19,20,21] to learn about this important topic.
5. Role of Simulation in Factory Twin Development
Simulation is one of the key enabling technologies that lie at the heart of factory digital twin development. Figure 6 presents the primary modules of factory twin simulations: (i) data; (ii) market coupling; (iii) factory analytics; (iv) financial; and (v) valuation. Specifically, the data module collects all relevant data sets associated with the Data element covered in Section 2. It then prepares the corresponding data sets to be utilized by the market coupling, factory analytics, and financial modules.
Market coupling includes the consideration of exogenous drivers such as market demand, price, competition and substitution, and raw material cost. This module may further utilize previously conducted market analyses that present future demand and competition projections [24]. The financial module considers the demand, price, and raw material cost fluctuations quantified by the market coupling module and the production capacity risk profile obtained from the factory analytics module and uses Monte Carlo simulation to generate the output data for economic and risk-and-return valuations. In the remainder of the section, we first elaborate on factory analytics, financial, and valuation modules. Then, we describe challenges that may arise as the focus of digital twin development changes from a factory to a supply chain network. Finally, we discuss why we should consider developing factory twin simulations as outlined in Figure 6 instead of just using an ML model to predict the factory KPIs.
5.1. Factory Analytics Module
The domain expertise, combined with shop floor and supply chain data on system configuration, process flow, and operating policies, drives the factory simulation. Generally, the inputs of this simulation include equipment portfolio, operators, inventory, factory layout, product portfolio, manufacturing process flow, raw-material release policy, rules of lead-time, inventory, and bottleneck management, production plans, and shift-based schedules of the factory staff (see the Factory Analytics Module in Figure 6). It is important to note that operating policies, for example, production plans and operator schedules, are often obtained by solving production scheduling and operator staffing problems prior to simulating the factory operations. Although factory inputs such as set-up times, loading and unloading times, machining times, equipment time-to-failure and repair times, duration of transportation within the facility, and production yield are uncertain (i.e., they have variability), the scheduling and staffing problems are solved deterministically by replacing these random variables with their average values. Then, the factory simulation captures the uncertainty in each of these stochastic input processes, determines the performance of production and staffing plans under uncertainty, and quantifies the risk in the factory KPI predictions. The statistical analysis of these findings often provides guidance toward building improved production plans and operator schedules.
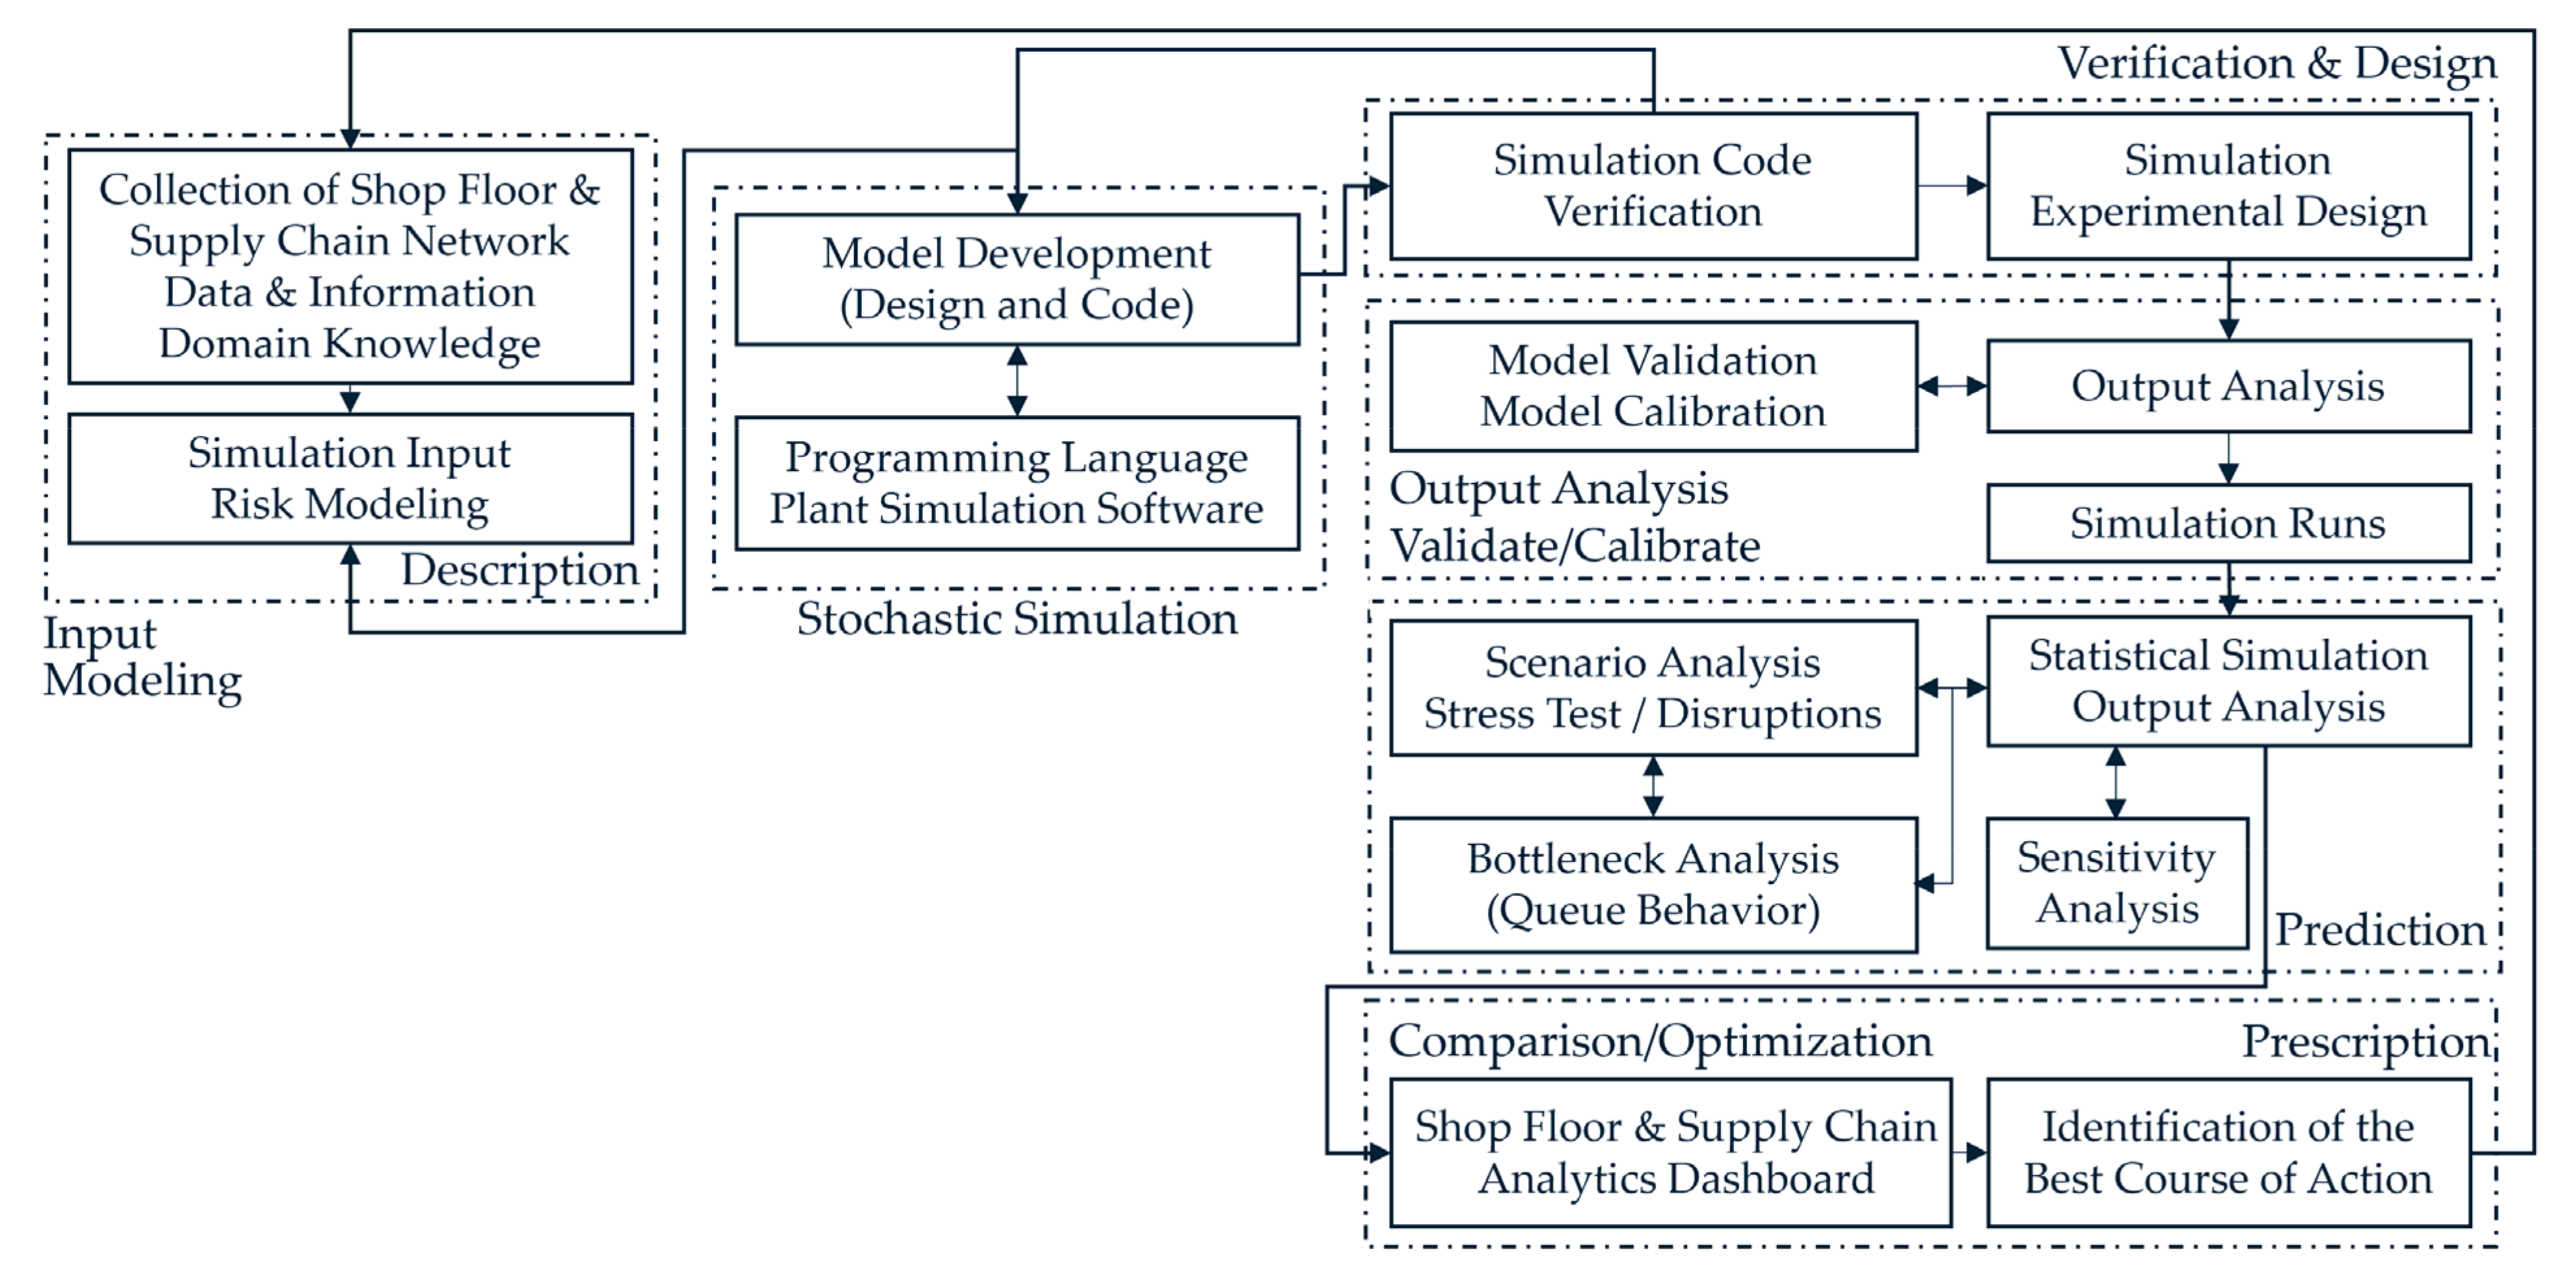
Figure 7 shows a flowchart for a more detailed view of the steps necessary to conduct factory simulations. It identifies the key steps as (i) input modeling; (ii) stochastic simulation; (iii) verification and experimental design; (iv) output analysis, validation, and calibration; (v) prediction involving statistical factory KPI estimation, bottleneck identification, scenario analysis, stress testing, and disruption impact assessment; and (vi) prescription including dashboard visualization and determination of the best course of action. The successful completion of this sequential series of tasks results in optimal factory control. It is evident from Figure 7 that simulation digital twin development goes beyond building a simulation code that captures the logic of the manufacturing process flow. It requires integration with the digital twin enabling technologies such as AI/ML, forecasting, optimization, and visual analytics to support the key steps in (i)–(vi). Figure 7 also indicates the necessity of a closed feedback loop between the decisions made and the shop floor and supply chain data collected after the implementation of those decisions.
The factory twin simulation and the output data set it generates can be used to identify the key drivers of risk for the successful management of the factory operations. Example questions in this context are: (1) If the mean processing time spent at a station decreased by one hour, what would be the impact on the mean flow time? (2) What would be the impact if the standard deviation of the processing time decreased by one hour? These questions can be answered using a specific type of sensitivity analysis technique known as the local sensitivity analysis, quantifying the sensitivity of the KPIs to mean and standard deviations of the random inputs. It helps to identify the key risk drivers and allows the plant manager to focus on the most critical inputs enabling effective factory control. We refer the reader to [25] for a high-level discussion of this technique to determine the key drivers of risk in a semiconductor manufacturing setting.
Other important benefits of a factory digital twin are to stress-test the factory management plans and identify the best courses of action when faced with disruptions. Examples of disruptions may include loss of inventory or capacity due to natural disasters or disturbances such as fires, site contaminations, and equipment shutdowns. However, the objective of the stress-testing activity would not be to predict when and what type of disruptions may occur. Instead, we would enforce them in the factory simulation and search for an optimal way of mitigating their impact on the system.
5.2. Financial Module
The financial model uses the output data generated by the factory simulation to quantify the cost of uncertainty and the financial impact of operational decisions. It tracks the cost of factory operations considering four primary categories: (1) direct labor cost; (2) direct material cost; (3) production overhead; and (4) non-production overhead. We refer the reader to [2] for an example financial pro forma that supports manufacturing investment projects.
The total cost of production in a factory can be calculated by adding the costs associated with direct labor, direct material, and production overhead. The division of the total production cost by the total number of finished goods departing the production line (after the removal of the scrap) presents the unit cost of production, as one of the key KPIs assessing the profitability of the factory operations. However, it is also important to decompose the total cost for each step of the manufacturing process flow to understand how to reduce the unit cost of production to meet the cost target. This practice is known as activity-based costing; we refer the reader to [26] for a description of how General Electric implemented this practice for a battery manufacturing plant. Thus, a factory digital twin must integrate factory operations modeling with a financial module.
5.3. Valuation Module
The factory simulation, which integrates factory configuration, process flow, and operating policies with randomness in various input processes, generates many future sample paths for raw materials, work in process, finished goods, location in the factory, and time. Thus, simulation outputs contain time-stamped data that may be observed across many different realizations of the future. Hence, simulation can be considered as a large data generation program capturing many possibilities about how the future may unfold. The resulting granular and rich data sets are post-processed to obtain both operational and financial performance risk profiles. Examples of operational KPIs are throughput, quality, inventory, fulfillment, and utilization of equipment, operators, and space. Examples of financial KPIs are cost, break-even probabilities, and minimum and maximum losses. The ultimate goal is to find an optimal balance among all operational and financial KPIs to create a sustainable and resilient factory and supply chain network.
5.4. From Factory Digital Twins to Supply Chain Digital Twins
The focus of this article is largely on the development of factory digital twins. However, the right-hand side of Figure 3 illustrates a framework for developing a digital twin of a supply chain network. Extending the modular framework of Figure 6 to the supply chain increases complexities. The configuration would become significantly more complex; the scale of the problem would become much higher; performing the validation and calibration steps of Figure 7 would be more challenging. For a more detailed discussion, we refer the reader to the tutorial in [9] on supply chain digital twins and the critical role simulation and AI play in their development.
5.5. Building Simulations and Using Machine Learning for KPI Prediction
Simulation and machine learning are two complementary tools to create digital twins of complex production systems. The reader may wonder whether we really need to develop stochastic factory simulations whose development requires time and effort. Two key capabilities make factory simulations critical for digital twin development: (1) uncertainty modeling and (2) explainable analytics. These two capabilities clarify when and why we need to develop factory simulations.
Because simulation propagates the randomness characterized by the input models throughout the entire manufacturing process flow and supply chain network, it enables the prediction of the mean values of KPIs together with the risk surrounding the predictions. Thus, simulation can be viewed as both a KPI generation and a risk quantification tool. Because simulation also generates the sample path of each entity flowing through the manufacturing facility, statistical analysis of the simulation output data can determine the reason for poor performance and/or high variability. We can then design experiments to simulate the manufacturing and supply chain process flows under the assumption of different operational policies. This allows us to determine how to mitigate the impact of variability and improve the system performance. Hence, simulation is also a risk management tool.
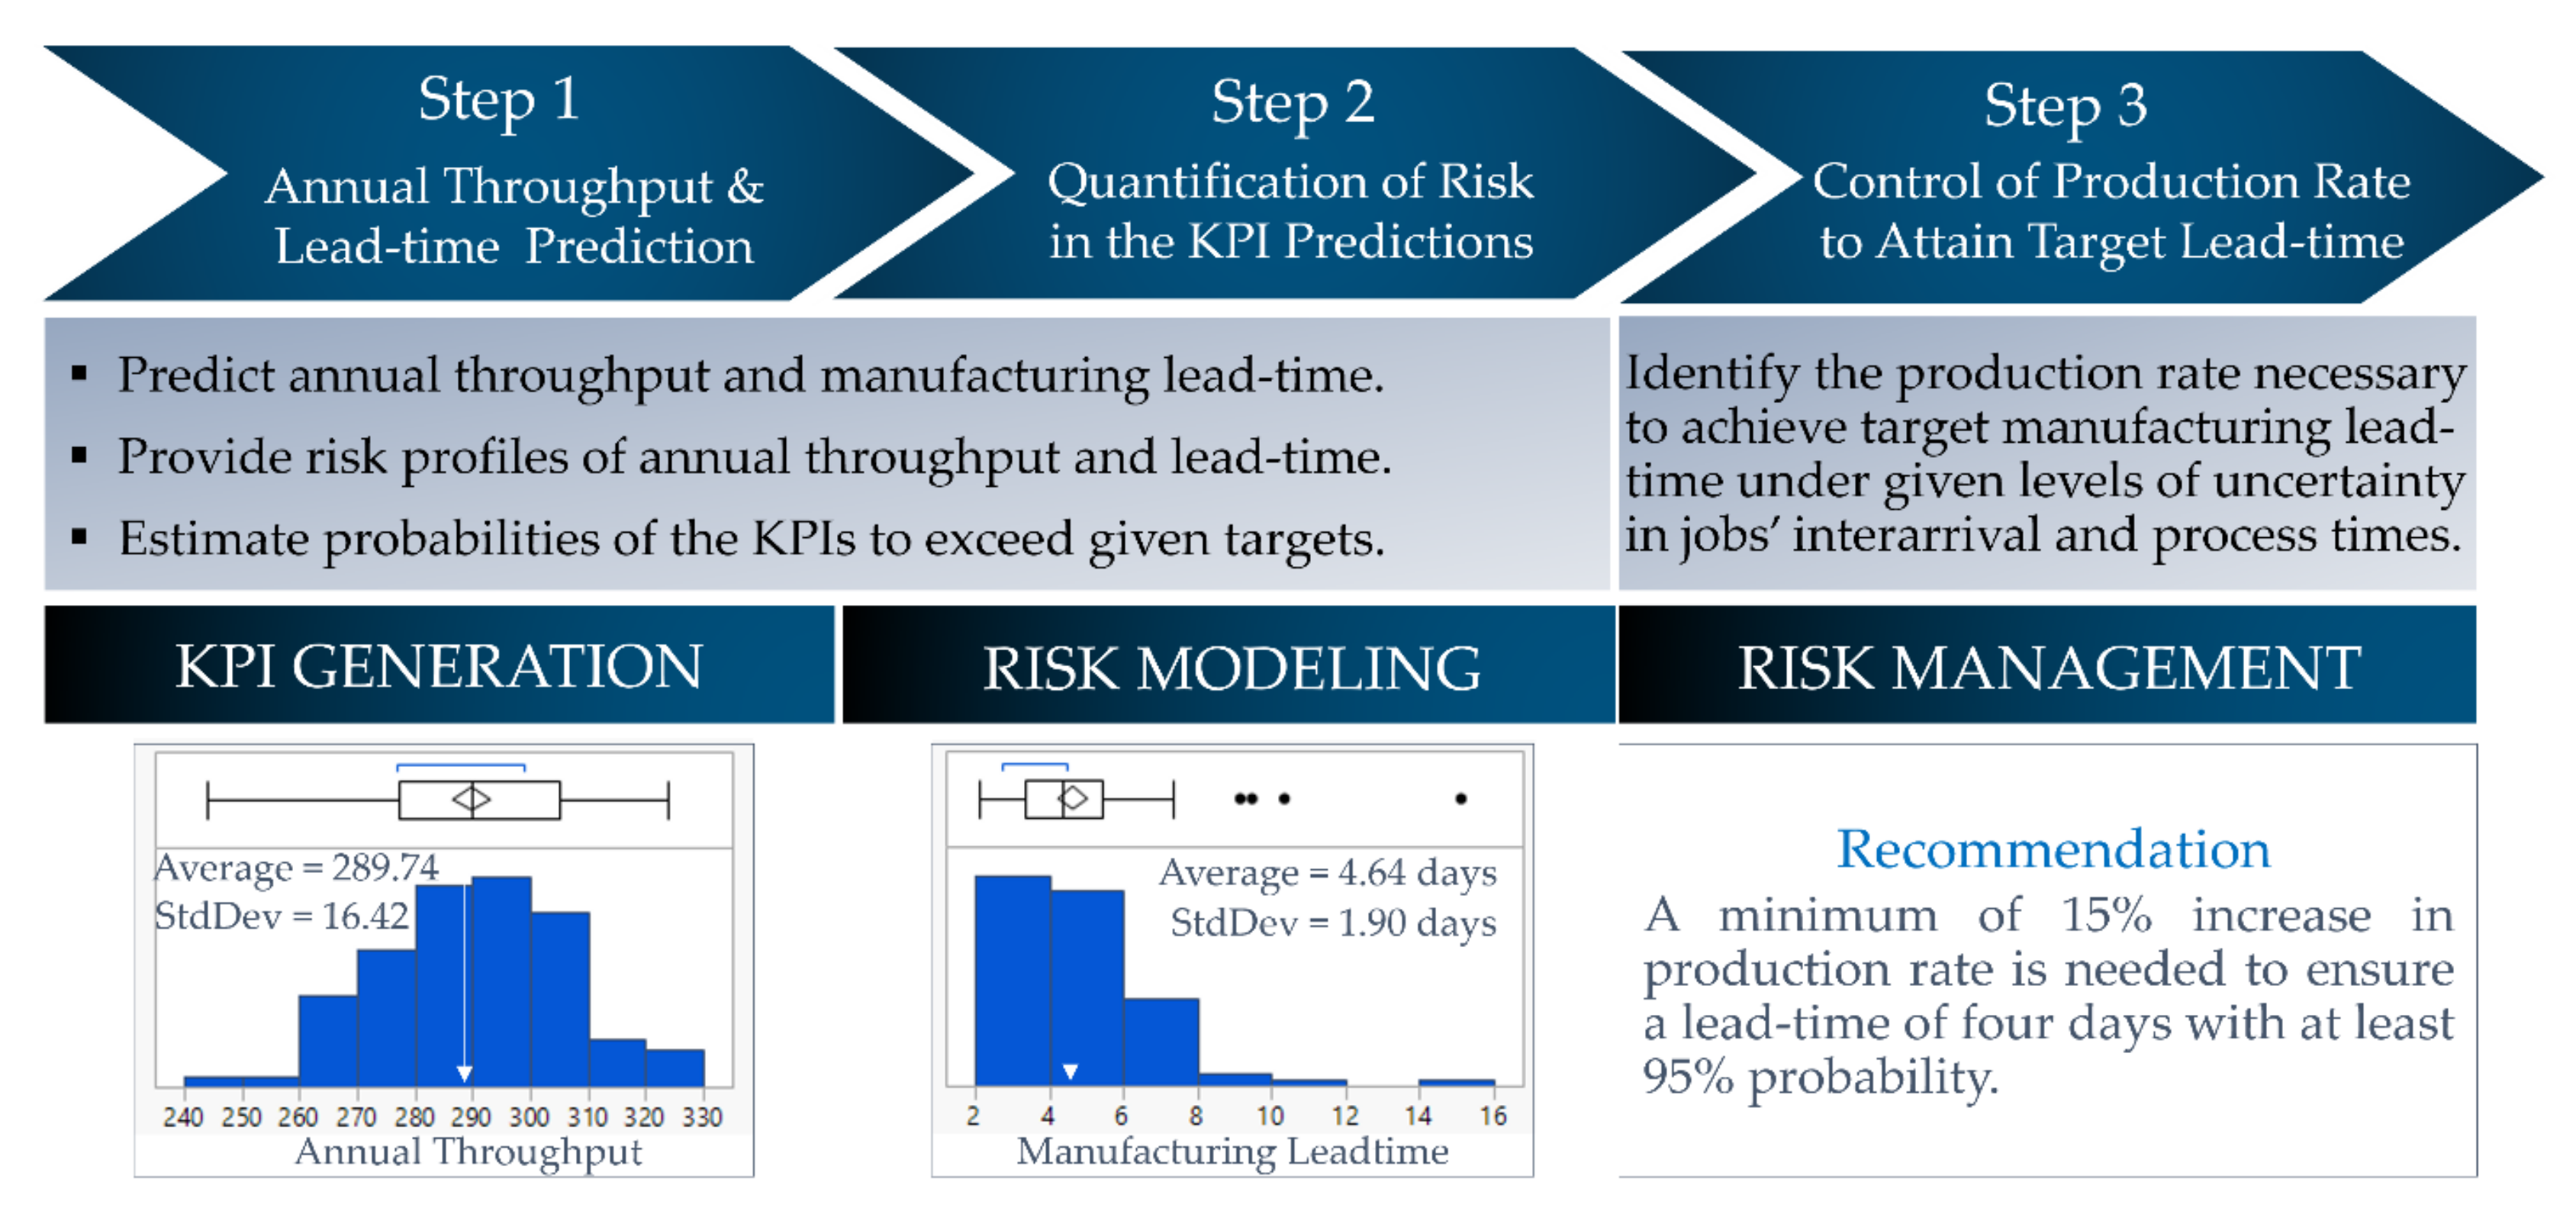
As a use case, consider a manufacturing plant where jobs arrive every 1.25 days on average. The jobs are processed one at a time on a first-come, first-served basis. If a job is already being processed, then the job that has just arrived joins a queue. The processing of any job lasts an average of 1 day. Upon completion, jobs are shipped to the distribution center. The objective is two-fold: (i) to predict annual throughput and manufacturing lead-time; (ii) to control the plant’s production rate to meet a target manufacturing lead-time of 4 days. A discrete-event simulation of this manufacturing facility would be a suitable choice for achieving the case objectives.
Figure 8 connects the case objectives to the following three digital twin simulation characteristics: (1) annual throughput and lead-time prediction (i.e., KPI generation); (2) quantification of risk in the KPI predictions (i.e., risk modeling); (3) control of production rate to attain target lead-time (i.e., risk management). We design a simulation with a 365-day length and 100 replications. The analysis of the output data generated from this simulation predicts average annual throughput and average manufacturing lead-time to fall between 286 jobs and 293 jobs and between 4.26 days and 5.02 days, respectively, each with a probability of 95%. The simulation output analysis also identifies a 59% chance that the manufacturing lead-time exceeds the target lead-time. Integrated use of simulation with statistics and optimization further finds that a 95% guarantee of a manufacturing lead-time less than or equal to four days requires a 15% increase in the plant’s production rate. Thus, simulation can also be viewed as a risk management tool. These characteristics together with the benefits of uncertainty quantification and explainable analytics separate simulation from other prediction tools and make it a critical component of digital twin development.
6. Criteria to Evaluate Factory Simulation Software Design and Selection
Different simulation modeling methods can be used to meet the needs of manufacturing system complexity: Monte Carlo (MC) simulation, discrete-event simulation (DES), agent-based simulation (ABS), continuous simulation, and system dynamics (SD). Random variate sampling is the building block of all these modeling methods. Today, there exists well-established literature on random variate sampling [22], and it offers the freedom to build flexible multivariate input models to drive digital twin simulations.
DES represents operations as a discrete sequence of events; it is the most suitable and intuitive modeling method to use when there is a clearly defined process flow, where the lack of infinite resources leads to the forming of queues. In our industrial projects, the discrete-event modeling method has delivered scalable, data-driven, and flexible system simulations with automated KPI collection capability in a wide variety of industries ranging from healthcare and life sciences and consumer goods to aerospace and defense. We also assume the use of DES for developing factory simulations in this article; however, there may be a need to use combinations of the simulation modeling methods to equip the user with the flexibility needed. This is known as the hybrid approach, which is frequently utilized in industrial projects. For example, the end-to-end execution of the modules illustrated in Figure 6 requires the joint use of MC simulation and DES.
Next, we switch our focus to the criteria that can be used to evaluate different software packages offering similar simulation modeling methods to develop factory simulations. Our simulation software design and selection criteria can be divided into the following categories: (1) simulation in the cloud; (2) modeling method; (3) model design and flow visualization; (4) modeling functionalities; (5) system configuration scale; (6) input modeling and output analysis; (7) simulation hot start (using IoT data); (8) experimental design and scenario analysis; (9) machine learning and optimization in simulation; and (10) business user experience. Concerning the last category, it is natural to expect plant managers to want solutions to be accessible through an easy-to-interpret user interface (UI), available via an application or a web browser. Figure 9 provides snapshots of an application developed in Microsoft Power Apps for a production shop to solve equipment portfolio selection problems. As the quality of software architecture improves, the future trend in simulation is expected to lean towards more frequent use of mobile and touch-based devices [27].
7. Industrial Digital Twin Use Cases: Challenges and Solutions
In this section, we discuss five major challenges of digital twin development:
- Building data-driven simulations from video, MES, and EAM data;
- Identifying factory bottlenecks under input parameter uncertainty;
- Accelerating what-if analysis to perform risk-and-return trade-off;
- Providing an environment to train reinforcement learning agents;
- Addressing standardization and globalization in digital twin integration.
For further discussion on the challenges of developing digital twin simulations for industrial use cases, we refer the reader to [9] where the focus is on synthetic data generation, zone of confidence, fast sensitivity analysis, and simulation and optimization. Biller et al. discuss research streams that are relevant to overcoming those four specific development and implementation challenges.
7.1. Building Data-Driven Simulations from Video, MES, and EAM Data
A non-traditional type of input data that is increasingly utilized for building digital twin simulations is video. The first step is to process the video data using computer vision (CV) AI techniques so that they can be transformed into a time-stamped data set. The resulting data set is then processed to characterize the random input processes. Thus, CV AI plays the role of an input data generator to enable simulation development [15,16]. Depending on the nature of the time-stamped data, it may be challenging to directly apply simulation input modeling techniques to characterize the randomness in the input processes. As an example, consider a camera collecting data to support real-time queue monitoring and resource control to minimize wait time and operating costs. Assume that the CV AI collects data via both person tracking and queue tracking and provides information on the length of the queues as well as queue entry and queue exit times. Building a simulation requires characterizing the interarrival and service times. Identifying the service time distribution may pose a challenge because the time-stamped data may not explicitly represent the queueing times. Hence, algorithms customized to the use case must be able to accurately characterize both arrival and service input processes.
Similarly, manufacturing execution systems (MESs) and enterprise asset management (EAM) systems support factory twin development by providing time-stamped process data. However, it must be deduced from this data set which entity flows through the factory at what times and what the realizations of setup times, maintenance intervals, and downtimes are. This is very similar to the data that will be generated from the factory simulation; however, this is not the type of data that would be driving a discrete-event stochastic simulation. This laborious deduction of flows, location, downtimes, and process times is often overlooked and is a very crucial step of digital twin simulation development. A well-executed transformation from MES and EAM data to simulation input processes increases the likelihood of validation and the success of the project.
7.2. Identifying Factory Bottlenecks under Input Parameter Uncertainty
A major issue that affects the decisions driven by factory twins is the impact of the simulation input risk on the factory KPI predictions. This situation arises when the input distributions and their parameters are unknown and the historical input data available for their estimation are limited. Biller et al. investigated whether an equipment portfolio identified as optimal would still be recommended if there were deviations from the process-step assumptions that had to be made [24]. They accounted for the impact of the parameter uncertainty (i.e., the uncertainty that is due to the estimation of the input-model parameters from limited data) in the probability distribution characterizations of processing times, loading and unloading times, traveling times, repair times, and times between failures on the factory KPI predictions. It was found that up to a 50% change in the distribution parameters of the process-step details would underestimate the mean annual throughput by no more than 10% with a probability of 95%.
Accounting for the impact of input uncertainty in factory simulations is important not only to support equipment portfolio decisions but also to accurately identify the bottlenecks along the production line. Considering a multi-stage production system, Biller and Gupta investigated the impact of the uncertainty in interarrival-time and service-time distribution parameters on the KPI predictions [28]. They identified cases where it was not clear which machine was the factory bottleneck. The way to overcome this issue, which arises due to the high uncertainty level, is to design data-collection plans in a way to reveal production bottlenecks in a fast and accurate manner.
7.3. Accelerating What-If Analysis to Perform Risk-and-Return Trade-Off
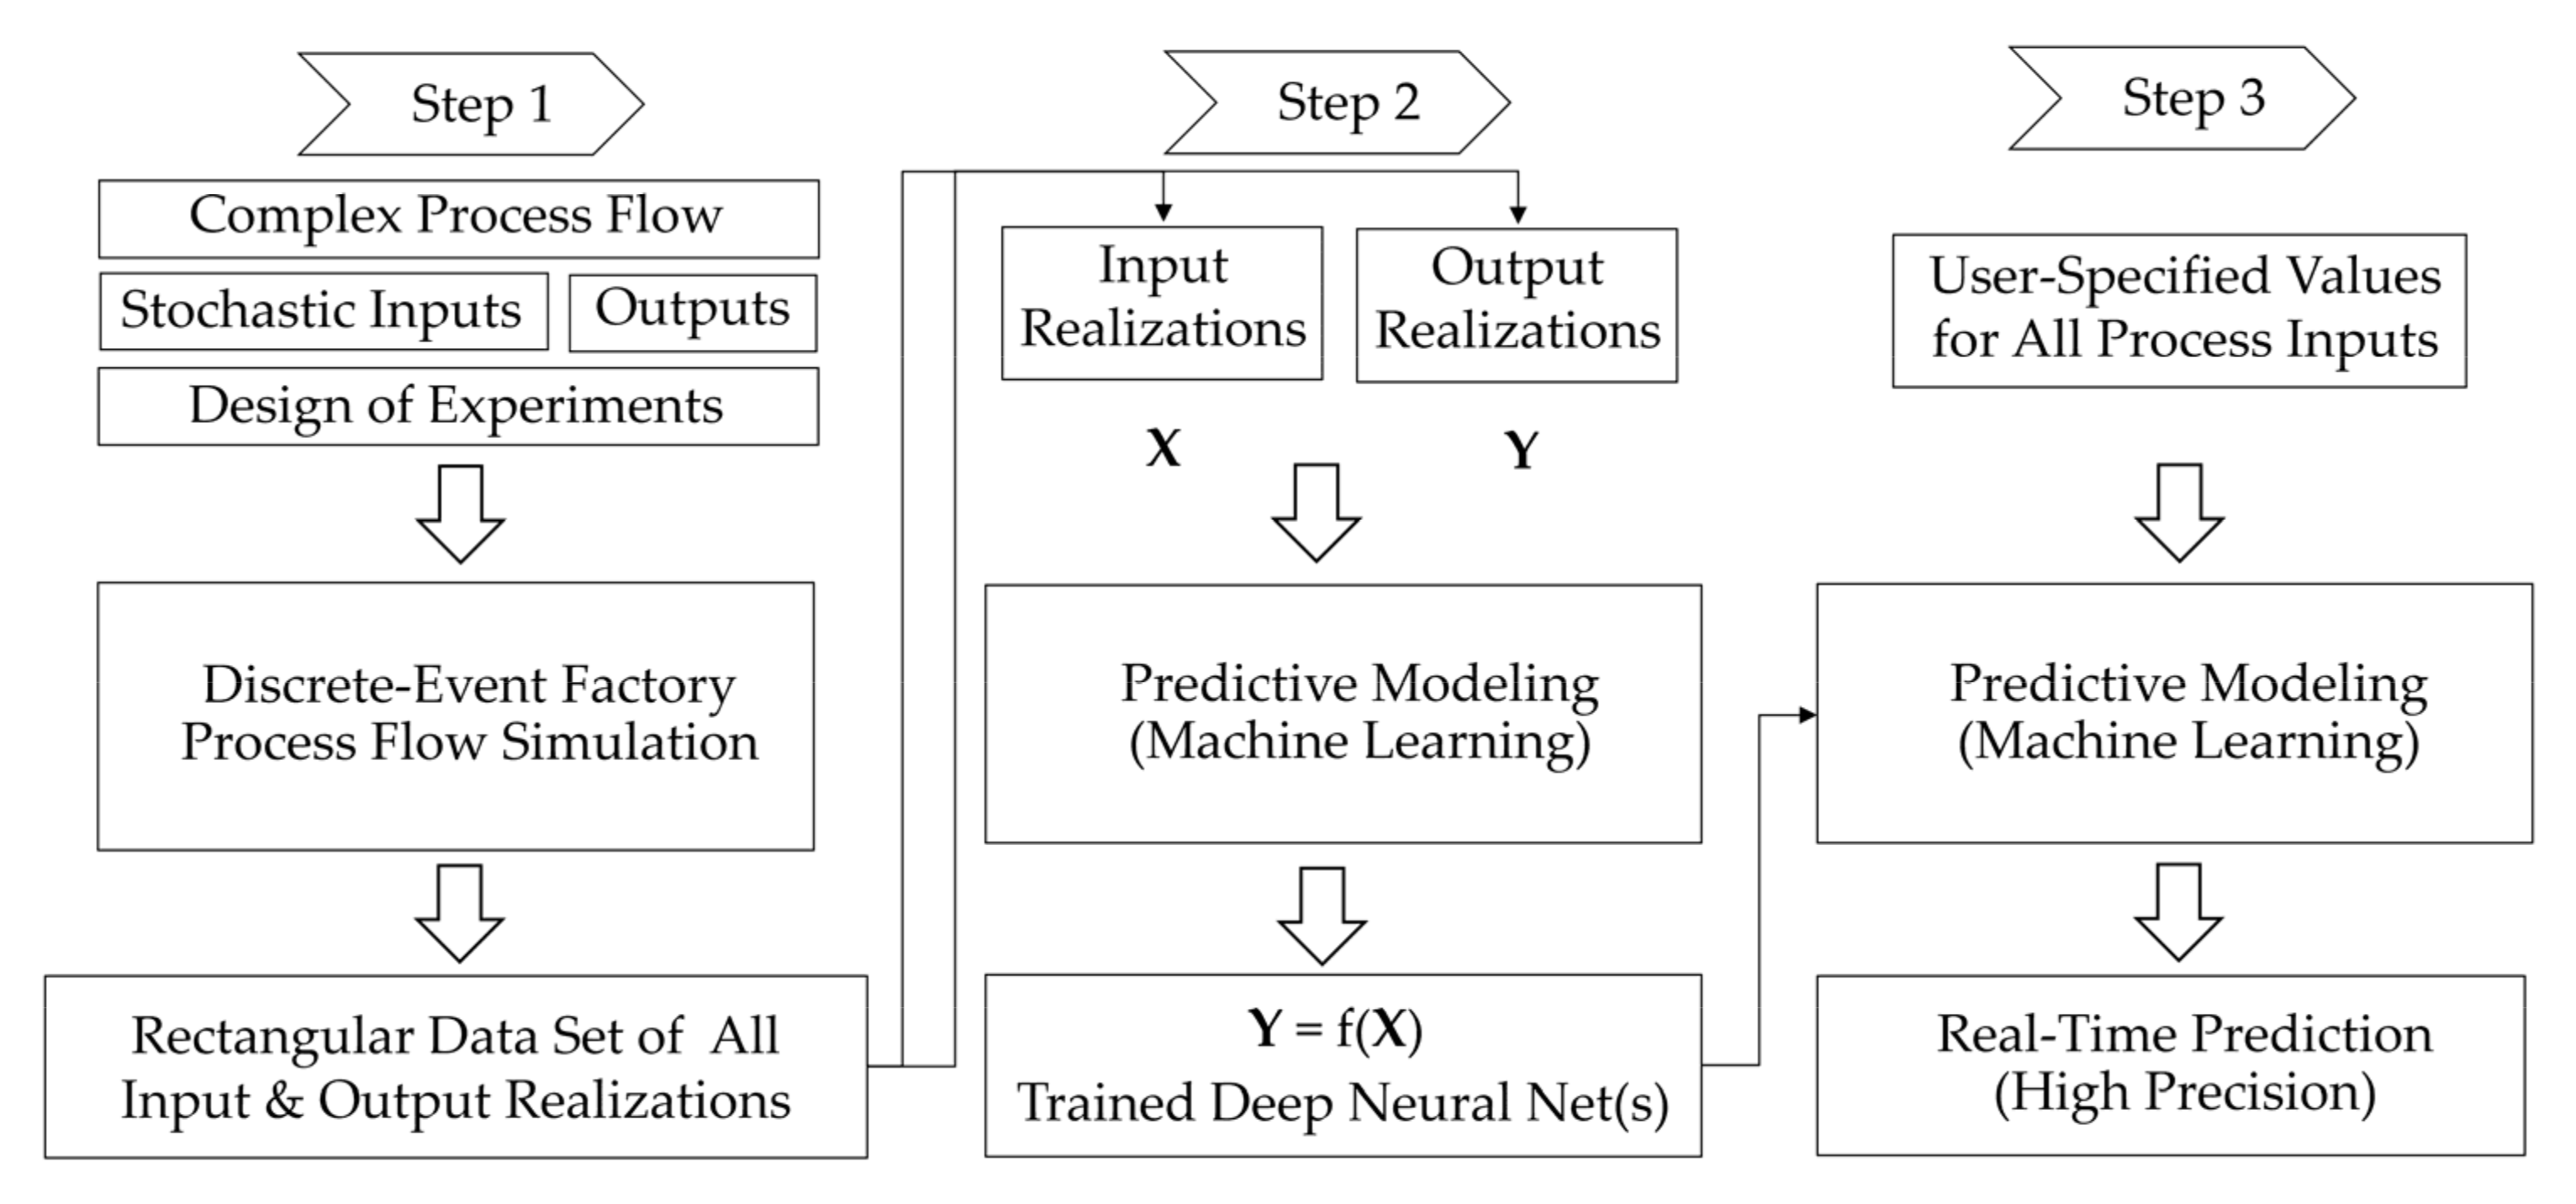
Digital twin simulations enable sophisticated what-if analysis. Because we may have to answer many what-if questions using the simulation-generated data, it is important to conduct fast scenario analyses. A way of accelerating what-if analysis is via the integrated use of simulation and machine learning in three steps. First, the factory simulation is run, and the simulation output data are saved in a rectangular data set of all input and output realizations. Second, an ML model is fit to the simulation-generated data set. Third, the model is evaluated for the specific input parameter values indicated by the what-if questions. In [29], Biller outlines the steps of accelerating what-if analyses using simulation-generated data and machine learning for real-time prediction as illustrated in Figure 10. Additional steps can be added to the workflow here by embedding the machine learning models in an optimization problem formulation to represent the objective function and/or the constraints. In [30], Biller et al. provide hands-on instructions about how these steps can be conducted via an integrated use of simulation, machine learning, and optimization.
7.4. Providing an Environment to Train Reinforcement Learning Agents
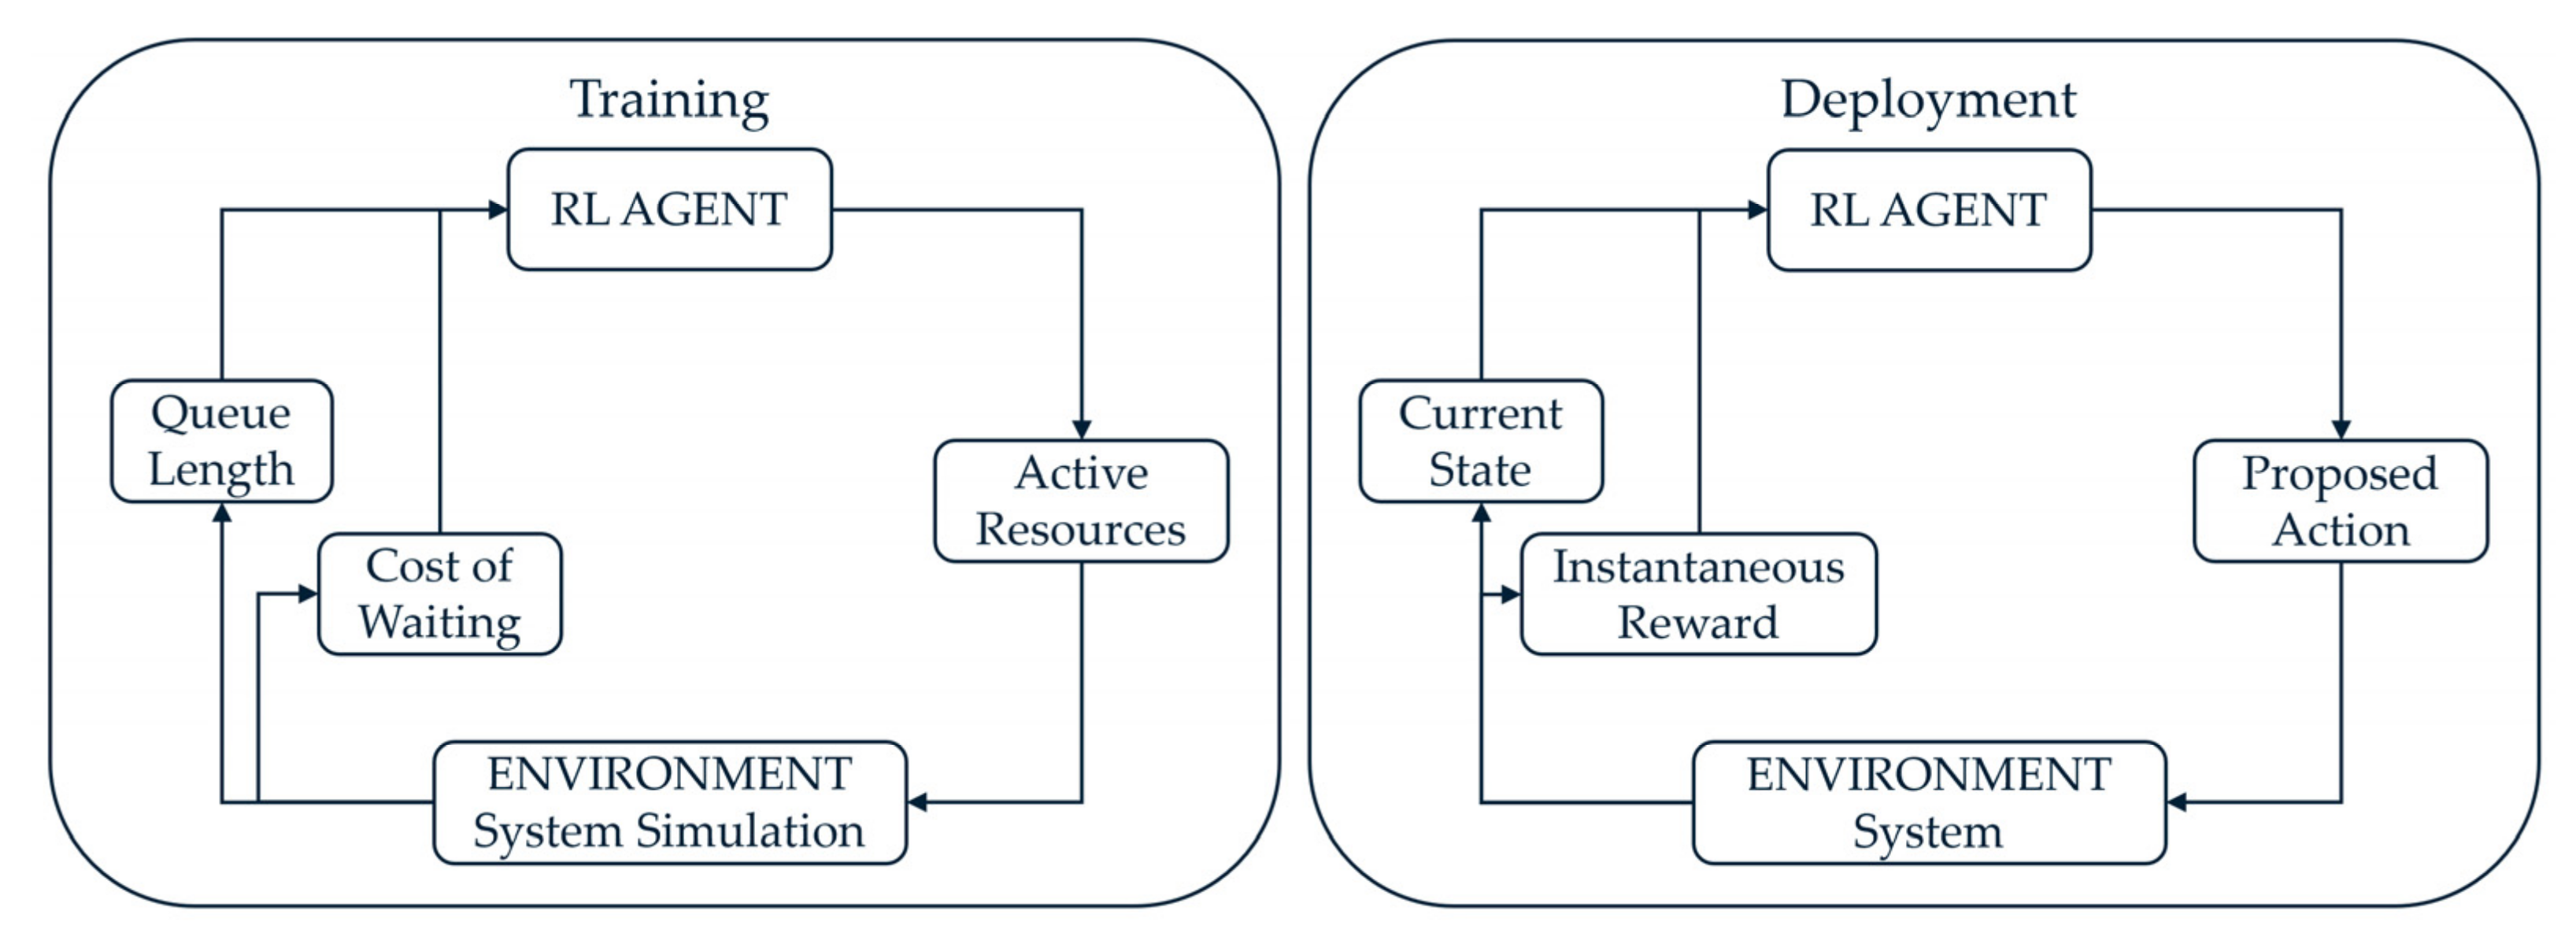
In this section, we revisit the use case introduced in Section 7.1 for real-time queue monitoring and resource control. We assume that the CV AI has already transformed the entity and queue tracking data into queue entry and exit times and queue lengths, from which stochastic input models have been developed to drive a simulation of the system. The next step is to develop recommendations about the number of active resources for part processing, in real time, with the objective of minimizing operating costs and waiting time. The digital twin development framework for this use case is given in the left-hand side of Figure 4.
The method that enables real-time control of queues and resources is reinforcement learning (RL). Figure 11 illustrates the corresponding RL framework and the role of simulation in it. Specifically, simulation is used to mimic the real environment, generating a big data set. This data set is used to train the RL agents in the simulated environment. Once the training of the RL agents is completed, they can be deployed into the real environment where they make real-time recommendations about queue and resource control.
7.5. Addressing Standardization and Globalization in Digital Twin Integration
It is natural to expect standardization to accelerate digital twin development and simplify the management of digital twins over the life cycles of the products and processes. However, digital twin development has been motivated by use cases, requiring a certain level of customization to meet the customer requirements. Thus, the topic of standardization remains a challenge in digital twin development. Nevertheless, attempts have been made to modularize the digital twin development effort; the goal is to transfer learning from one development to another, reducing the overall development time. Section 3 provided frameworks to overcome today’s challenge of customization in developing digital twins.
Every factory simulation should be accompanied by a data model describing all (regular and resource) entities and their attributes. This data model also describes how the attributes of an entity are updated throughout its flow in the manufacturing facility and how the attributes of multiple entities relate to each other. The data model concludes with the presentation of the output data, defining every sample path generated by the factory simulation. The creation of a good simulation data model requires expertise and experience. However, this is still a challenging task even for an expert as there appears to be a need to combine these factory simulation data models in a supply chain network simulation data model. Managing the resulting digital twin simulation data model in coordination with all stakeholders over the life cycle of products and processes remains one of the key challenges of process digital twin development.
8. Conclusions
This article described how digital twins, built on manufacturing process flow simulations, machine learning, and reinforcement learning, can help companies replay history, gain predictive visibility into the future, and optimize manufacturing and supply chain performance. First, we discussed the four foundational elements of digital twin development—Data, Domain, Analytics, and Outcome—to help the reader differentiate between different digital twin development approaches and solution offerings. Then, we presented digital twin development frameworks built on the Data, Domain, Analytics, and Outcome elements. After a discussion of building and operationalizing digital twins and outlining Offline Model Development, Real-Time Synchronization, and Online Learning as the three primary digital twin functions, we focused on simulation’s role in factory twin development. We presented the primary modules of factory twin simulations and explained why digital twin simulation is a KPI generation, a risk quantification, and a risk management tool. We further shared our evaluation criteria to design and select factory simulation software. We concluded with several different challenges that often arise in industrial process twin use cases, waiting for simulation methodologists, AI, ML, and RL scientists, and practitioners to provide innovative solutions.
Author Contributions
Conceptualization, B.B. and S.B.; methodology, B.B. and S.B.; formal analysis, B.B. and S.B.; investigation, B.B. and S.B.; resources, B.B. and S.B.; writing—original draft preparation, B.B.; writing—review and editing, B.B. and S.B.; visualization, B.B.; supervision, B.B. and S.B.; project administration, S.B. All authors have read and agreed to the published version of the manuscript.
Funding
This research received no external funding.
Data Availability Statement
The References section provides the source of every type of data supporting reported results. Whenever available, links are presented to increase access to the content.
Conflicts of Interest
The authors declare no conflict of interest.
References
- McKinsey & Company. The Internet of Things: Catching up to an Accelerating Opportunity; McKinsey & Company: New York, NY, USA, 2021; pp. 1–90. [Google Scholar]
- Biller, S.R.; Biller, B. Integrated Framework for Financial Risk Management, Operational Modeling, and IoT-Driven Execution. In Innovative Technology at the Interface of Finance and Operations; Babich, V., Birge, J.R., Hilary., G., Eds.; Springer Series in Supply Chain Management; Springer: Cham, Switzerland, 2022; Volume 2, pp. 131–145. [Google Scholar]
- Biller, S.R. Digital Twins: Smart Manufacturing’s DNA for a Bright Future. Available online: https://purdueengineering.medium.com/960882ab03ad (accessed on 29 January 2023).
- Digital Twin Consortium. Available online: https://www.digitaltwinconsortium.org/ (accessed on 6 March 2023).
- Reed, P. USG Corporation Relies on SAS to Improve Its Manufacturing Process and Reduce Downtime, Costs, and Energy Consumption. Customer Success Stories. Available online: https://www.sas.com/en_us/customers/usg.html (accessed on 21 April 2022).
- Anbalagan, A.; Shivakrishna, B.; Srikanth, K.S. A Digital Twin Study for Immediate Design/Redesign of Impellers and Blades: Part 1: CAD Modelling and Tool Path Simulation. Mater. Today Proc. 2021, 46, 8209–8217. [Google Scholar] [CrossRef]
- Kulkarni, V.; Barat, S.; Clark, T. Towards Adaptive Enterprises using Digital Twins. In Proceedings of the 2019 Winter Simulation Conference, Washington, DC, USA, 5–8 December 2019. [Google Scholar]
- Grieves, M. Intelligent Digital Twins and the Development and Management of Complex Systems. Digital Twin. Opinion Article. Available online: https://digitaltwin1.org/articles/2-8 (accessed on 29 January 2023).
- Biller, B.; Jiang, X.; Yi, J.; Venditti, P.; Biller, S.R. Simulation: The Critical Technology in Digital Twin Development. In Proceedings of the 2022 Winter Simulation Conference, Singapore, 11–14 December 2022. [Google Scholar]
- Thelen, A.; Zhang, X.; Fink, O.; Lu, Y.; Ghosh, S.; Youn, B.D.; Todd, M.D.; Mahadevan, S.; Hu, C.; Hu, Z. A Comprehensive Review of Digital Twin—Part 1: Modeling and Twinning Enabling Technologies. Struct. Multidiscip. Optim. 2022, 65, 1–75. [Google Scholar] [CrossRef]
- Shao, G.; Jain, S.; Laroque, C.; Lee, L.H.; Lendermann, P.; Rose, O. Digital Twin for Smart Manufacturing: The Simulation Aspect. In Proceedings of the 2019 Winter Simulation Conference, Washington, DC, USA, 5–8 December 2019. [Google Scholar]
- Lee, J.; Azamfar, M.; Singh, J.; Siahpour, S. Integration of Digital Twin and Deep Learning in Cyber-Physical Systems: Towards Smart Manufacturing. Short Communication. IET Collab. Intell. Manuf. 2020, 2, 34–36. [Google Scholar] [CrossRef]
- Flores-García, E.; Jeong, Y.; Wiktorsson, M.; Liu, S.; Wang, L.; Kim, G. Digital Twin-based Services for Smart Production Logistics. In Proceedings of the 2021 Winter Simulation Conference, Phoenix, AZ, USA, 12–15 December 2021. [Google Scholar]
- Sharotry, A.; Jimenez, J.A.; Wierschem, D.; Mediavilla, F.A.M.; Koldenhoven, R.M.; Valles, D.; Koutitas, G.; Aslan, S. A Digital Twin Framework for Real-time Analysis and Feedback of Repetitive Work in the Manual Material Handling Industry. In Proceedings of the 2020 Winter Simulation Conference, Virtual, 14–18 December 2020. [Google Scholar]
- The U.S. Patent and Trademark Office. Real-Time Spatial and Group Monitoring and Optimization. Patent No. 11,176,691, 2021. [Google Scholar]
- The U.S. Patent and Trademark Office. Real-Time Concealed Object Tracking. Patent No. 11,176,692, 2021. [Google Scholar]
- The U.S. Patent and Trademark Office. Discrete-Event Simulation with Sequential Decision Making. Patent No. 11,055,861, 2021. [Google Scholar]
- Siemens (Global Cloud Practice, Berlin, Germany). Closed Loop Plant Simulation Solution Presentation. 2020.
- Schalkwyk, P.V. Digital Twin Capabilities Periodic Table for Composable Digital Twins; Consortium Webinar: Boston, MA, USA, 2022. [Google Scholar]
- Hirsch, F.; Richter, D.; Robkin, M.; Zahavi, R. IoT Security Maturity Model Digital Twin Profile; Consortium Webinar: Boston, MA, USA, 2022. [Google Scholar]
- Richter, D. Digital Twin Supported Trustworthiness of Complex Systems—Dynamic Environments; Consortium Webinar: Boston, MA, USA, 2023. [Google Scholar]
- Law, A.M. Simulation Modeling and Analysis; McGraw-Hill Higher Education: New York City, NY, USA, 2014; Volume 5e. [Google Scholar]
- Akbay, K.; Dulgeroglu, O.; Toledano, D. Designing, Improving and Efficiently Operating Hospitals with Help from General Electric’s Generic Modeling Toolkit. In Proceedings of the INFORMS 2011 Healthcare Conference, Montreal, QC, Canada, 20–22 June 2011. [Google Scholar]
- Biller, B.; Hartig, M.; Minnick, A.; Olson, R.J.; Sandvik, P.; Trant, G.; Sui, Y. General Electric Uses Simulation and Risk Analysis for Silicon Carbide Production System Design. INFORMS J. Appl. Anal. 2019, 49, 117–128. [Google Scholar] [CrossRef]
- Biller, B.; Jiang, X. Risk Driver Analysis for Complex Supply Chains. SAS R&D Data Science Blog. Available online: https://blogs.sas.com/content/subconsciousmusings/2022/11/01/risk-driver-analysis-for-complex-supply-chains/ (accessed on 29 January 2023).
- Johnson, C.; Biller, B.; Wang, S.; Biller, S.R. Analytics Approach for Incorporating Market Demand into Production Design and Operations Optimization. In Advances in Battery Manufacturing, Service, and Management Systems, 1st ed.; Li, J., Zhou, S., Han, Y., Eds.; Wiley-IEEE Press: Hoboken, NJ, USA, 2017; Volume 1, pp. 99–126. [Google Scholar]
- Desai, P.; Sealy, A.; Tedman, S.; Wright, L.; Biller, B. How Simulation will Impact the Future of Healthcare and Life Sciences. In Proceedings of the PharmaSUG 2021, Virtual, 24–27 May 2021. [Google Scholar]
- Biller, B.; Mokashi, A. Propagation of Input Uncertainty in Manufacturing Process Flow Simulations. In Proceedings of the 2018 Winter Simulation Conference, Gothenburg, Sweden, 9–12 December 2018. [Google Scholar]
- Biller, B. Accelerating What-If Analysis with Machine Learning. SAS R&D Data Science Blog. Available online: https://blogs.sas.com/content/subconsciousmusings/2022/12/14/accelerating-what-if-analysis-with-machine-learning/ (accessed on 29 January 2023).
- Biller, B.; Mokashi, A.; Oliveira, I.; Pathan, S.; Yi, J.; Box, J. Time Travel into the Future of Clinical Trial Enrollment Design. In Proceedings of the 2019 SAS Global Forum, Dallas, TX, USA, 28 April–1 May 2019. [Google Scholar]
Figure 1.
Illustration of an evolving, learning, and improving digital twin environment.

Figure 2.
A digital twin development framework built on the four foundational elements [9].
Figure 2.
A digital twin development framework built on the four foundational elements [9].

Figure 3.
A factory digital twin (on the left-hand side) and a supply chain digital twin (on the right-hand side).
Figure 3.
A factory digital twin (on the left-hand side) and a supply chain digital twin (on the right-hand side).

Figure 4.
The digital twin capabilities periodic table [19].
Figure 4.
The digital twin capabilities periodic table [19].

Figure 5.
Key factory digital twin functions and enabling technologies.

Figure 6.
Primary modules of factory twin simulations.

Figure 7.
Factory analytics module.

Figure 8.
Connecting case objectives to digital twin simulation characteristics.

Figure 9.
An application of production shop simulation in Microsoft Power Apps.


Figure 11.
Illustrating RL framework for real-time queue monitoring and resource control.

Disclaimer/Publisher’s Note: The statements, opinions and data contained in all publications are solely those of the individual author(s) and contributor(s) and not of MDPI and/or the editor(s). MDPI and/or the editor(s) disclaim responsibility for any injury to people or property resulting from any ideas, methods, instructions or products referred to in the content. |
© 2023 by the authors. Licensee MDPI, Basel, Switzerland. This article is an open access article distributed under the terms and conditions of the Creative Commons Attribution (CC BY) license (https://creativecommons.org/licenses/by/4.0/).
Share and Cite
MDPI and ACS Style
Biller, B.; Biller, S. Implementing Digital Twins That Learn: AI and Simulation Are at the Core. Machines 2023, 11, 425. https://doi.org/10.3390/machines11040425
AMA Style
Biller B, Biller S. Implementing Digital Twins That Learn: AI and Simulation Are at the Core. Machines. 2023; 11(4):425. https://doi.org/10.3390/machines11040425
Chicago/Turabian StyleBiller, Bahar, and Stephan Biller. 2023. "Implementing Digital Twins That Learn: AI and Simulation Are at the Core" Machines 11, no. 4: 425. https://doi.org/10.3390/machines11040425
Note that from the first issue of 2016, this journal uses article numbers instead of page numbers. See further details here.