
Drivetrain Response Prediction Using AI-Based Surrogate and Multibody Dynamics Model

School of Mechanical Engineering, Aristotle University of Thessaloniki, 54124 Thessaloniki, Greece
*
Author to whom correspondence should be addressed.
Machines 2023, 11(5), 514; https://doi.org/10.3390/machines11050514
Submission received: 24 March 2023
/
Revised: 19 April 2023
/
Accepted: 24 April 2023
/
Published: 28 April 2023
(This article belongs to the Special Issue Vibration and Acoustic Analysis of Components and Machines)
Abstract
:Numerical models, such as multibody dynamics ones, are broadly used in various engineering applications, either as an integral part of the preliminary design of a product or simply to analyze its behavior. Aiming to increase the accuracy and potential of these models, complex mechanisms are constantly being added to existing methods of simulation, leading to powerful modelling frameworks that are able to simulate most mechanical systems. This increase in accuracy and flexibility, however, comes at a great computational cost. To mitigate the issue of high computation times, surrogates, such as reduced order models, have traditionally been used as cheaper alternatives, allowing for much faster simulations at the cost of introducing some error to the overall process. More recently, advancements in Artificial Intelligence have also allowed for the introduction of Artificial Intelligence-based models in the field of surrogates. While still undergoing development, these Artificial Intelligence based methodologies seem to be a potentially good alternative to the high-fidelity/burden models. To this end, an Artificial Intelligence-based surrogate comprised of Artificial Neural Networks as a means of predicting the response of dynamic mechanical systems is presented in this work, with application to a non-linear experimental gear drivetrain. The model utilizes Recurrent Neural Networks to accurately capture the system’s response and is shown to yield accurate results, especially in the feature space. This methodology can provide an alternative to the traditional model surrogates and find application in multiple fields such as system optimization or data mining.
1. Introduction
The analysis of mechanical systems has always been an integral part of the design process for engineering applications. While initially carried out on paper, advancements in computer science made it possible for the development of powerful numerical models of machines, enabling the simulation of their operation and estimating their response before their actual manufacture. The obvious advantage of these models is the significant reduction of costs due to the reduced needs for prototyping and experimenting with a physical set-up. Regardless of the developments in computers, however, the simultaneous advancement of the numerical simulation methods to more complex and sophisticated ones, allowing for detailed and highly accurate simulations of a system, has also led to increasingly costly models in terms of the amount of computations necessary.
Aiming to reduce this increasing cost, surrogate models of various means have been developed throughout the years, with the most recent additions including the use of Artificial Intelligence (AI) methods such as Artificial Neural Networks (ANNs) [1,2,3,4,5,6]. These models allow for admirable reductions in the simulation times necessary while also maintaining the high level of fidelity required from a numerical model for it to be useful for further analysis.
While ANNs have proven to be universal approximators, selecting the AI algorithm most suitable for each application is a crucial task. ANNs in general are considered “naïve” in the sense that, while capable of approximating the mapping between inputs and outputs, they are unaware of the underlying mechanics of each problem and the potential interdependencies of the data, such as continuity when predicting a mechanical system’s response in the time domain. To include this temporal dynamic behavior of time series data, Recurrent Neural Networks (RNNs), a subclass of ANNs, were examined as a surrogate for mechanical models in various applications [1,3,7]. The main feature of RNNs is the retainment of previous information as a means of forecasting future values in sequential data such as time series. Ye et al. [1] and Han et al. [3] demonstrated the potential of RNNs in accurately predicting the responses in vehicle-track systems. Singh et al. [8] successfully utilized a RNN in predicting rail-wheel contact parameters for a vehicle system. Greve et al. [7] examined the capacity of RNNs in predicting the time response of Finite Element (FE) model nodes. Pan et al. [9] showcased the prediction of the dynamic behavior of mechanical systems using Machine Learning (ML) methods and Choi et al. [6] and Nie et al. [10] presented equally sufficient results in MBD applications using Deep Learning (DL) methods, also examining applicability in a drivetrain system.
In this work, an RNN was developed as means of predicting a MBD model’s acceleration response on a total of eight different locations of its structure, with the goal of reducing the computations time necessary to produce said response, while also accounting for singularities in the simulations arising from model errors such as redundancies. The novelty in this work is the application of an RNN-based method in predicting the response of a large, computationally expensive, and highly nonlinear MBD system of a gear drivetrain containing a large number of detailed contact forces, extending the application of the existing framework for predictions on less complex numerical models to a more complex one. The contributions of the present work can be summarized as follows:
- (1)
- The framework for predicting the response of numerical models is extended to a complex and highly nonlinear system, providing much needed insight into the obstacles that arise during the process.
- (2)
- A means of reducing the computations necessary to extract the response of an MBD system is provided through the use of the RNN. This, in turn, results in significant advantages in computation time, especially when considering iterative processes such as model optimization or data mining.
- (3)
- The proposed framework provides a solution for obtaining a smoother time-response of an MBD system by dealing with singularities arising from redundancies in the models.
The rest of this paper is structured as follows: In Section 2, the gear transmission system which was used as the basis for the MBD model is presented along with its numerical counterpart. The system’s response key characteristics are also defined in this section; Section 3 introduces the concept of RNNs as a means of predicting the MBD model’s response, explaining its key components and the way of operation of an RNN in the process; in Section 4, the experimental and MBD system responses are shown in comparison as a means of proving the validity of the MBD model and its adherence to the actual system; Section 5 presents the results of this work, comparing the predictions of the RNN by two different methods and validating the proposed methodology by showing the RNN’s accuracy in capturing the key features of the system’s response as well as leading to a reduction in computation time of about 45% when compared to running full simulations of the MBD model; last, in Section 5 and Section 6, the findings of the presented work are discussed along with various propositions for future works as ways to improve certain shortcomings of the method, and the conclusions derived from the presented applications are drawn.
2. Gear Transmission System
Gear drivetrains are perhaps the most common means of mechanical transmission, allowing for the largest possible torque transmission compared to other methods such as belt or chain transmission. Gear transmission systems are present in most of modern day machinery, including ground vehicles such as cars or motorcycles, wind turbines, and aerial vehicles such as helicopters etc. In most applications, gear drivetrains comprise a critical component of the machine, with potentially dire consequences in cases of failure. The severity of the damage varies between applications but it almost always includes large financial losses, such as when a production line may be abruptly stopped due to the failure of a machine, for example, or even injury and loss of human life. As such, the field of Condition Monitoring (CM) and damage detection of gear transmission systems has always been an integral part of processes including rotary systems [11,12,13,14,15,16,17].
2.1. Vibration Response Analysis
Due to the periodic nature of a rotary system’s response, vibration analysis has been widely used for signal analysis in gear drivetrains and rotary systems in general [11,12,18,19,20,21]. Changes in a system’s properties, such as the failure of a bearing or a gear producing vibrations in the system, can be detected in certain characteristic frequencies of the system’s response. For gear related faults in particular, this characteristic frequency is called Gear Mesh Frequency (GMF) and it is proportional to the rate at which two gears mesh with one another and, as such, with their frequency of rotation. For meshing between two gears, the GMF can be estimated as:
Here, denotes the number of teeth of one of the meshing gears and denotes its rotation frequency in Hz. For a planetary gear system, the characteristic frequency can be estimated as:
is the number of gear teeth, denotes the rotating frequency in Hz and the subscripts , denotes the sun and ring gears respectively.
As far as bearings are concerned, vibrations arise during their rotation, which can appear due to even minor defects in their race or rolling element surfaces. The bearing characteristic frequencies can be estimated as:
where and are the ball pass frequencies of the outer and inner race, respectively, and , are the ball spin and fundamental train frequencies of the bearing. denotes the rotating frequency of the bearing, is the number of rolling elements, , denote the rolling element and pitch diameters, and denotes the contact angle of the bearing.
2.2. Experimental Gear Drivetrain
In this work, the Drivetrain Prognostics Simulator (DPS) of Spectra Quest Inc. (Richmond, VA, USA) was used as the basis for formulating the corresponding MBD model used as the ground truth in the analysis. The system is comprised of six major components, namely two electric motors (1,5), a load stabilization system comprised of two gear boxes (4), an electric control unit (6), a two-stage gear system (3), and a planetary gear system (2). The device is shown in Figure 1. The main focus of this work was the planetary and two-stage gearboxes, a breakdown of which is shown in Figure 2. For the planetary box, which is shown on the left side of the figure, numbers 1, 10 and 9 denote the caps and case respectively, numbers 2 and 6 denote the bearings of the system and numbers 3 and 8 indicate the pinion shaft and carrier respectively. Last, numbers 4, 5 and 7 point to the sun gear, planets and ring gear respectively. For the two-stage box, which is shown on the right side of the figure, numbers 1 and 11 indicate the cap and case, numbers 6 and 9 denote the bearings of the system, numbers 5 and 7 point to the shafts of the two stages of the box and numbers 2–4 and 8 indicate the helical gears of the system Last, number 10 points to the inlet shaft, which is also the carrier (8) of the planetary box.
The system’s acceleration response was measured from eight different locations using piezoelectric sensors. Accelerometers 1 and 2, henceforth denoted as A1 and A2, were placed on the planetary box while accelerometers 3 to 8, henceforth denoted as A3–A8, were placed on the two-stage box. The sensor configuration is shown in Figure 3. The various characteristics of the gears and bearings of the system, which are necessary for analyzing the system’s response, are shown in Table 1. The system’s accelerations were sampled at 10,240 Hz, with the system operating at 612 RPM.
2.3. Gear Drivetrain Multibody Dynamics Model
This work focused on the planetary and two-stage gearbox systems. This model was constructed as part of a previous work [22], with the goal of generating synthetic data to train a Convolutional Neural Network for supervised damage detection. To simulate the system’s response, an MBD model was built in MSC Adams. The gearboxes were modelled as flexible bodies, as accelerations were extracted from them at the same locations as the physical system, and their flexibility severely affects the measured response. Since the gear meshing phenomena were of interest, detailed contact forces were defined between the gears of the two boxes. A total of ten contacts were defined between the sun, ring and planet gears of the planetary gearbox while two more were defined between the helical gears of the two-stage gearbox. To maintain a manageable simulation time, the bearings that connect the shaft ends to the gearboxes were modelled as linear bushings of constant stiffness and damping values as adding more contacts through a detailed bearing model would make simulation virtually impossible. This simplification was possible here due to the fact that focus was placed on the gear meshing phenomena and the effects of the bearing contact forces were neglected. The MBD model of the two gearboxes is shown in Figure 4.
While there are various contact force models in the literature [23,24], the one used in this case was the Hertzian contact force model coupled with a hysteresis damping factor. This is the default contact force model of MSC Adams, with the contact force estimated using the following equations:
Here, denotes the total contact force as a sum of the contact normal force and the friction force . and denote the contact stiffness and damping ratio, is the nonlinear exponent rendering the force nonlinear, and is the penetration depth between the contacting geometries. The friction force is estimated using the signum function denoted as and a step function denoted as . Last, and denote the velocity and coefficient of friction while the subscripts denote the static and dynamic phases of the contact. A graphic explanation of the contact normal and friction force is given in Figure 5.
The contact force parameters of the model are shown in Table 2. These values were selected by optimizing the model in order to better fit the experimental system. More details on the optimization process can be found in [23,24,25,26].
Given the model’s complexity and high nonlinearity of the contacts, the average simulation time for this model is about 2596 s on a computer with a 32 core Intel (R) i7 processor and 64 GB of RAM. It is easily understood that when multiple simulations are required, such as during data mining, this large an amount of time hinders the overall process. As such, computationally cheaper alternatives are sought via use of AI methods.
3. RNN-Based Surrogate Model
NNs are globally recognized as universal approximators in the sense that, given enough data, they are capable of fitting to virtually any problem. The specific type of network best fit to each problem, however, is crucial to yielding the best possible results and identifying the most suitable NN variant. For this particular application, an RNN was used as a means of reducing the simulation time for the MBD model of the drivetrain system. First, an initial number of simulation steps were performed and, after some minor preprocessing, they were fed to the RNN for training. The RNN was then expected to be able to predict the remaining number of steps required to complete the data mining. The proposed framework is described in the flowchart of Figure 6.
3.1. Recurrent Neural Networks
RNNs are a special type of ANNs that are suitable for cases where data are characterized by temporal behavior [1,27]. The outputs of from one of the network’s nodes can affect the input of the subsequent nodes in a cyclic manner. In a sense, RNNs have memory, which makes them ideal for modeling cases containing time series, such as the ones produced by the MBD model. This cyclic operations of an RNN are shown in Figure 7. In the flowchart of Figure 7, denotes the input data while denotes the outputs of each node using the input data of time step . and are the node’s weight and bias. Last, and denote the recurrent layer and feedforward layers of the network.
Similar to other ANNs, RNNs are trained via backpropagation, minimizing the error between the predicted and ground truth values of the desired output. In this work, the Mean Squared Error (MSE) was selected during training, as it allows for directly comparing the outputs of the RNN for each step with the corresponding one from the MBD simulations. The MSE between the predicted and true values can be estimated as:
where and denote the true and predicted values at time step .
The output of each neuron of a layer is estimated by passing the inputs through an activation function of the form:
where are the neuron’s weights, denotes the input features provided by the previous layers and is the neuron’s bias. During training, the network updates its neurons’ weight and bias values with the goal of minimizing the error between the true and predicted outputs.
3.2. RNN Type and Data Pre-Processing
Depending on how they operate, RNNs are characterized as one-to-one, one-to-many, many-to-one and many-to-many type networks. In this work, a many-to-many type network was used, which received the first half steps from the system’s acceleration response as measured from the virtual sensors and predicts the subsequent simulation steps. Each accelerometer measures data in three channels from the eight different accelerometer locations, resulting in a total of 24 features for the network to be trained and predict on.
The RNN makes predictions of future values based on a specific number of past steps. For this application, the system’s two past steps were used as input to the network and, as such, the data must be reshaped and manipulated in the proper manner. For a total of simulation steps, the input data to the network were reshaped as where the first dimension denotes the number of samples, the second the number of past steps used for future predictions, and the third the number of features. In this application, the network predicted the future outputs of the simulation in a looped manner, where the outputs of the step were used as inputs for the step. Algorithm 1 explains this looped prediction process. It is worth mentioning here that the number of previous steps used for predicting the response of the system affects the network’s performance in a manner similar to the rest of its hyperparameters. In this work, only the two previous steps were used for predicting the next one, as an increase in the number steps used increases the computations time further, since the number of input features becomes larger without providing any significant improvements in performance. The process of identifying the optimal number of steps used is an iterative one and was omitted since it is beyond the scope of the present work.
| Algorithm 1: Rolling prediction process |
|
3.3. RNN-Based Model Surrogates
In this work, a Simple RNN (SRNN), a Long Short-Term Memory (LSTM) model, and a Gated Recurrent Unit (GRU) model were examined as potential AI surrogates of the MBD model. SRNNs were the first type of RNN developed and, while promising, they commonly suffered from the vanishing gradient problem, that is, the error gradient becoming exponentially smaller as the length of predictions increases. LSTMs were developed as a means of dealing with the vanishing gradient problem that RNNs suffer from [27]. Last, GRUs are a variant of LSTMs, usually requiring less training parameters, rendering them more computationally efficient and performing similarly to the LSTMs. The three networks’ structure is shown in Table 3 and they were constructed using the open-source library Keras [28].
Each network’s hyperparameters were fine-tuned manually, aiming to minimize the validation loss and thus ensuring that the final RNN would be able to generalize to unseen data. Each was trained for 100 epochs, using a batch size of 100 samples, aiming to achieve an optimal performance while maintaining a relatively low training time. The Adaptive Moment Estimation (Adam) optimizer was selected for the training process as it is perhaps the most versatile optimization algorithm, achieving good results in a large number of applications. Last, the learning rate was set to 0.001. The network was trained on data produced by running a simulation for half the steps required for the final dataset, that is, = 2560 steps, resulting in a training dataset of size 2558 × 2 × 24. The training and validation loss curves for all networks are shown in Figure 8. As expected, the validation loss is slightly larger than the training loss but the difference is minor and, as such, the networks are considered adequately trained. Maintaining the training loss value at a small yet constant value, even after continuing the training process up to 100 epochs, hints to the network’s robustness, that is, the network is expected to be consistent when making predictions on unseen data while also avoiding overfitting to the training dataset, allowing it to generalize to new datasets.
4. Experimental and MBD System Responses
For the planetary and two-stage gearbox system, Figure 9 displays a brief analysis of the acceleration response as measured on the X and Y axes (the radial ones) of A1. As shown in the figure, two peaks can be identified as the dominant characteristic of the response, which corresponds to the GMF of the planetary gearbox and its first harmonic. Two more GMFs that appear due to the gears meshing in the two-stage box are present in the system’s response but are not visible in the graphs as they are of a minor amplitude compared to the GMF of the planetary system. Similarly, while present, the characteristic frequencies of the bearings are also of minor amplitude and as such are not visible in the figure. For reference, Table 4 contains the values of the GMFs while the characteristic frequencies of the bearings have been omitted as they serve no purpose in this particular application and would only clutter the presented work.
As mentioned, the MBD model was previously calibrated in order to better match the experimental system’s response. This was carried out in order for the model to be able to provide the high-fidelity date necessary for further analyses of the system, with its response adhering to the experimental one. Comparison between the experimental and MBD system response PSDs for channels 22 and 23, which are the radial axes of accelerometer A8, is indicatively shown in Figure 10. As shown in the figure, the MBD model is capable of fitting to the experimental data and mainly to the planetary GMF, which is the dominant feature of the system’s response.
5. RNN-Surrogate Response Predictions
In this section, the three RNN models’ performance was initially assessed by comparing the MSE between the true MBD model responses and the network’s rolling predictions for all three models in order to identify the one best suited for the current application. After selecting the best suited model, its accuracy when predicting directly on the test data was also assessed in order to compare the two methods as well as assess the error inherent in the rolling predictions method.
5.1. System Response Rolling Predictions
For the proposed methodology to allow for a predicted response estimation without any prior knowledge on the future steps that are to be predicted, a rolling prediction process was required. As previously mentioned, these kinds of predictions were performed by using the last two steps produced by the MBD model simulation and sequentially predicting the next step, shifting the sequence forward in the process. The value of this methodology in data generation comes in two respects. First, a significant reduction in the computation time is required for each model. The MBD model simulation time can at times be significantly large, which is especially critical in cases where repetitive simulations are required, such as when generating data or when optimizing the model. Second, MBD models with their high nonlinearities are prone to errors arising from singularities due to various reasons such as redundant constraints. These errors are also usually more severe as the simulation time proceeds. Replacing the MBD model with its AI-surrogate at an early stage of the simulation can help avoid such errors and allow for seamless data mining.
In order to conclude to the best-suited RNN model for the present application, Figure 11 shows a comparison of the MSE values of all measurement channels among the three RNN models. On the left graph of the figure, the error values are shown for each channel separately, while on the right graph, the mean error of each model is presented through a box plot. As shown, all RNN models perform similarly, with the MSE values estimated as 0.162, 0.149, and 0.153 for the three models, respectively. Common trends can also be observed among them, such as the rise in the MSE values for channels 20–21 and 24. Since the performance of the RNNs is similar but the LSTM model displayed the smallest error between the true and predicted responses, it was selected as the surrogate for the MBD model. This, however, is not to say that the two other RNN models would perform poorly when predicting the system’s response but rather that, while the results would be similar, choosing the optimal network type for this application will result in the best performance currently possible. For the remainder of this work, all results presented pertain to the predictions of the LSTM model as the surrogate for the MBD model.
More significant insight can be obtained by analyzing the error between the true and predicted responses in the frequency domain, which is also the main goal of this particular application. By plotting the frequency domain MSE for the frequency range of interest, the mean error between the true and predicted responses can be estimated for each frequency value. This comparison is shown in Figure 12 where the MSE of the PSD estimates of the true response, generated by the optimal MBD model, and the predicted one, generated by the RNN, is shown. As stated before, the dominant features of this signal are the GMF of the planetary gearbox as well as its 1st harmonic. A shown in the figure, the network is able to accurately capture the magnitude of the GMF and its 1st harmonic with a minor error. The PSD comparison between true and predicted data is also shown in Figure 13 for channels 22–24 which correspond to accelerometer A8. A8 was selected as it is the accelerometer that is placed the furthest from the planetary box and, as such, the measured response contains more spectral noise due to the various rotating components, as opposed to the one at A1. However, similar characteristics can be observed for all other accelerometers and channels, as the planetary GMF’s and its 1st harmonic’s magnitude are the largest in all cases. It should be noted that the PSD responses were converted in decibels for both figures so as to allow for a better inspection of the quantities displayed.
The residual error between the true and predicted responses is shown in Figure 14 for accelerometer A8. As shown in the figure, while some error can be observed between the two responses, the error value is minor on the frequencies of interest and especially on the GMF, where it is almost 0. It should be noted here that the large negative values close to the GMF are in decibels, meaning that they are also minor in terms of magnitude. The residual plots are only shown for A8 in order to declutter the text here. For transparency reasons, the average residual values between the true data and predictions are shown in Table 5 for all measurement channels. It should be noted that both Figure 14 and Table 5 show the residual values in decibels.
As seen from Table 5, the average error values are relatively large for most channels, especially for channels 9–10 and 17–18, where the RNN shows the least accuracy in predicting the system response. These values, however, were estimated using the entire response which, as mentioned, is characterized by a relatively significant residual error. When focusing on the area near the GMF, however, which is the feature of the response that we are mainly interested in, one can see that the error drops significantly. This is further proof that the network was able to accurately capture the model’s behavior with regards to the GMF of the planetary box.
Here, since one of the benefits of the proposed methodology is time reduction and faster data generation, it is important to also evaluate the RNN’s performance with respect to the time reduction in the overall data mining process. As far as the MBD simulations are concerned, an average time of 2596 s is required to run a full 5 s simulation. On the other hand, to implement the proposed methodology, half that time is required to generate the training data for the RNN, plus an average of 118 s to generate the data via the rolling predictions method, resulting in a total time of 1416 s. This means that the proposed methodology resulted in a reduction of about 45% in the computations time. The time required to train the RNN is omitted here, as training is almost instantaneous. It is also important to ensure that the level of error introduced by the use of the AI surrogate does not exceed the benefits resulting from the reduction in computations. The mean error percentage averaged along all measurement channels amounts to 23.77% when considering the entire frequency spectrum, while the same error when estimated in the range around the features of interest, that is, the GMFs, is equal to a about a third of that, at about 7.19%. It is therefore obvious that the error introduced in the produced response is balanced by a reduction in the computations time. A good tradeoff between the two, however, should always be sought. As shown, when one considers the entire frequency spectrum, the error is quite large, hinting at the potential need for further optimization of the RNN’s structure in order to reduce the error and further increase the method’s accuracy. When focusing on the features of interest, however, the error drops significantly, leading to an advantageous ratio between the introduced error and the savings in time. The level of acceptable error is always case-specific, and while a small error is always desired, a good tradeoff between it and the time savings, when further improvement cannot be obtained, may allow for application of the presented method to a wide range of problems. For this application in particular, while the overall error is 23.77%, since the GMFs are of interest and the 7.19% error is considered adequately small, the 45% reduction in computations time is of much greater significance to the overall process.
5.2. Predictions on Test Data
In the previous subsection, the results were based on the rolling predictions of the network. Here, the same results are shown, with the difference that the RNN now predicts on existing test data, which were produced by running a full simulation using the MBD model and splitting the data to training and test subsets. Similar to the case of the rolling predictions, Figure 15 shows the MSE between the true and predicted values in the time domain, averaged along all predicted timesteps. The error here is only shown for the LSTM model as it was considered the best suited one for this particular application.
By comparing the MSE values of Figure 15 with those of Figure 11, it can be seen that the overall predictions are now improved compared to the rolling predictions that were previously presented. A better comparison can be given by Figure 16, where the PSDs of the true and predicted responses measured on A8 are compared. As shown in the figure, the network accurately captures the GMF and its 1st harmonic, similarly to the rolling predictions case, but it now also makes more accurate predictions on the entirety of the spectrum. It should be noted that A8 was selected to adhere to the comparison made for the rolling predictions method, as similar results can be observed for the rest of the measurement locations.
The improvement in the method’s accuracy can be made more clearly visible by the residuals plot of Figure 17 as well as the residual values of Table 6. As shown in the table, the error is reduced compared to the rolling predictions case, which also holds true for the entirety of the frequency spectrum. The majority of the good predictions are still focused around the areas of interest, that is, the area around the GMF and its 1st harmonic, but the results are now much more accurate. This can also be seen by the residuals plot of Figure 17, where all values are now much closer to 0.
This change in the accuracy of the results can most likely be traced back to the accumulation of error when performing the rolling predictions method to generate the data. While an MBD model’s system response would not be available to make predictions directly in a real case, as shown here, the error is much smaller compared to the previous method, which, however, in this application is the only one available.
6. Discussion
In this work, the potential for an AI-based surrogate for a complex, highly non-linear MBD system was presented as a means of reducing the time necessary to mine data by shortening the simulations time and avoiding singularities that arise from common errors in MBD simulations. Using the RNN resulted in a significant reduction in the computations time necessary to complete one full model simulation with the drawback of adding error in the overall process. Based on this error to time savings ratio, the areas of application of the proposed framework can easily be defined. Application of the method in iterative processes, such as data mining, which require a large number of simulations, can lead to significant advantages, as the larger the number of simulations required for a process, the greater the overall reduction in computation time. The proposed framework was developed through the need for faster data generation, as cases requiring a large number of datasets, such as model optimization through parameter updating [23] and AI-based CM [22], will benefit greatly from the proposed methodology since cases requiring days or even weeks may then only require a fraction of that time. It is important, however, to ensure that the error between the true and AI generated responses is kept a low as possible throughout the process as the quality of the data generated is also of major interest in these applications.
At this point, it is important to state the limitations of the proposed methodology with regards to the applications it can be used in. In this case, while training and predictions were performed on data in the time domain, frequency domain data were actually of interest. The network was built in a manner allowing it to predict the time series data as a means of having that data available, should it be necessary. The frequency domain data in this case had discernable features which were also the desired targets of the data generation process and, as such, one might argue that the presented method would not be as successful at other applications with more subtle differences in the data or that refining the network even further to improve its accuracy would be mandatory. While this may hold true, at least up to a certain level, successful application of the proposed method on rotary systems alone is no small feat and hints to its great potential. Furthermore, for gear related faults, damage detection and identification in particular has previously been proven possible by using only the area of the frequency spectrum encapsuling the GMF frequencies of the system [22]. Based on the abovementioned points, one can deduce that the conditions for the proposed methodology to be successfully implemented and for adding value to a particular application are quite subjective and depend on each application’s demands. To begin with, the data produced by the process must be temporally related in the sense that for an RNN to map such dependencies and be used to its full potential, these dependencies must exist in the first place. Furthermore, one must know the features he is interested in beforehand, as even in cases were the relative error between the true and predicted values is small, the features that are of interest must be accurately captured by the network. Last, considering that the use of a surrogate model is bound to introduce error into the process, the advantage in time savings resulting from said use must be significant. The suggestion that the method is well-suited for iterative processes such as data mining or model optimization is derived from this concluding remark, that is, if one is only interested in a small number of simulations, the accuracy of the results would most likely be of much greater significance than the time required to run these simulations and the proposed method would therefore become obsolete.
As far as the results are concerned, there are various solutions that could be investigated as part of future works in order to reduce the error introduced to the data generation process by the RNN. One such alternative that is currently being investigated is Physics Informed Neural Networks (PINNs) [29,30]. PINNs are ANNs which have certain physics-based rules embedded in them, helping turn an otherwise naive network into one that takes into account the physical constraints governing a system. This type of network is currently undergoing significant investigation and could very well be used as an alternative in the near future.
Another solution to the accumulation of error could be the introduction of an AI-based corrector operating in a manner similar to the ones in the predictor–corrector integration schemes. The AI-based corrector could be trained on the residual error between the true and predicted responses and be introduced to the final result.
Last, the nature of one of the subcategories of RNNs could provide a means of performing direct predictions on a system’s response. Should a time dependent input be available for an MBD system, that input could be used to produce both training data and test data for the RNN and allow for direct predictions without the need for the rolling predictions scheme. For this, however, the RNN would have to be able to map the relationship between inputs and outputs of different types, such as the input forces (input) that result in excitations (output) in a system. RNNs, however, are a powerful prediction tool and the existence of one-to-many and many-to-many RNNs hints at the possibility of using them in such a manner.
Overall, the presented case acts as proof of the applicability of the presented method and yields strong evidence of the worth of its extension to other applications, as well as the exploration of different network types and architectures.
7. Conclusions
In this work, an AI-based surrogate for an MBD model of a gear drivetrain was introduced as a means of predicting the system’s response. The nature of the problem at hand allowed only for predictions in a sequential manner, where the past steps of the model’s response were used as data for an RNN to make predictions on and generate the future steps of the simulation.
Use of the proposed framework in the present application resulted in a reduction of about 45% in the computations time required, adding a maximum error of 23.77% to the overall process. Focus in the areas of interest, however, indicated that the percentage error around the significant features of the system’s response amounted to 7.19%, which is a considerable reduction compared to the error of the overall process. This indicates that the RNN was capable of identifying the major temporal relation (the periodicity of the gear meshing in this case) inherent in the system’s response.
While the network’s performance showed errors in the majority of the system’s response, its key features were accurately captured by the network, hinting at the potential of the method. Furthermore, comparison between the method’s accuracy between the actual and ideal predictions produced by the rolling and direct prediction methods, respectively, indicates that the RNN’s accuracy could be improved further by introducing a means of reducing the error accumulation during its prediction step. This, along with the significant improvement in the computations time, hints at the method’s potential and is worth investigating further.
The proposed methodology may find application in cases where a large amount of simulation data is required, such as when mining data or when running multiple iterations of the same model in order to identify the parameters of a system. The presented application acts as a benchmark case with which to extend the application and improve its generalizability, improving the RNN’s performance in the process.
Author Contributions
Conceptualization, J.K.; Methodology, J.K. and D.G.; Software, J.K.; Validation, J.K. and D.G.; Investigation, J.K.; Resources, D.G.; Data curation, J.K. and D.G.; Writing—original draft, J.K.; Writing—review & editing, D.G.; Visualization, D.G.; Supervision, D.G.; Project administration, D.G. All authors have read and agreed to the published version of the manuscript.
Funding
This research received no external funding.
Data Availability Statement
Data are available after request.
Conflicts of Interest
The authors declare no conflict of interest.
References
- Ye, Y.; Huang, P.; Sun, Y.; Shi, D. MBSNet: A deep learning model for multibody dynamics simulation and its application to a vehicle-track system. Mech. Syst. Signal Process. 2021, 157, 107716. [Google Scholar] [CrossRef]
- Han, S.; Choi, H.-S.; Choi, J.; Choi, J.H.; Kim, J.-G. A DNN-based data-driven modeling employing coarse sample data for real-time flexible multibody dynamics simulations. Comput. Methods Appl. Mech. Eng. 2020, 373, 113480. [Google Scholar] [CrossRef]
- Han, X.; Xiang, H.; Li, Y.; Wang, Y. Predictions of vertical train-bridge response using artificial neural network-based surrogate model. Adv. Struct. Eng. 2019, 22, 2712–2723. [Google Scholar] [CrossRef]
- Dye, J.; Lankarani, H. Hybrid Simulation of a Dynamic Multibody Vehicle Suspension System Using Neural Network Modeling Fit of Tire Data. In Proceedings of the ASME 2016 International Design Engineering Technical Conferences and Computers and Information in Engineering Conference, Charlotte, NC, USA, 21–24 August 2016. [Google Scholar] [CrossRef]
- Hegedüs, F.; Gáspár, P.; Bécsi, T. Fast Motion Model of Road Vehicles with Artificial Neural Networks. Electronics 2021, 10, 928. [Google Scholar] [CrossRef]
- Choi, H.-S.; An, J.; Han, S.; Kim, J.-G.; Jung, J.-Y.; Choi, J.; Orzechowski, G.; Mikkola, A.; Choi, J.H. Data-driven simulation for general-purpose multibody dynamics using Deep Neural Networks. Multibody Syst. Dyn. 2020, 51, 419–454. [Google Scholar] [CrossRef]
- Greve, L.; van de Weg, B.P. Surrogate modeling of parametrized finite element simulations with varying mesh topology using recurrent neural networks. Array 2022, 14, 100137. [Google Scholar] [CrossRef]
- Singh, S.K.; Das, A.K.; Singh, S.R.; Racherla, V. Prediction of rail-wheel contact parameters for a metro coach using machine learning. Expert Syst. Appl. 2023, 215, 119343. [Google Scholar] [CrossRef]
- Pan, Y.; Sun, Y.; Li, Z.; Gardoni, P. Machine learning approaches to estimate suspension parameters for performance degradation assessment using accurate dynamic simulations. Reliab. Eng. Syst. Saf. 2023, 230, 108950. [Google Scholar] [CrossRef]
- Nie, X.; Min, C.; Pan, Y.; Li, Z.; Królczyk, G. An Improved Deep Neural Network Model of Intelligent Vehicle Dynamics via Linear Decreasing Weight Particle Swarm and Invasive Weed Optimization Algorithms. Sensors 2022, 22, 4676. [Google Scholar] [CrossRef]
- Ye, Z.; Yu, J. Deep morphological convolutional network for feature learning of vibration signals and its applications to gearbox fault diagnosis. Mech. Syst. Signal Process. 2021, 161, 107984. [Google Scholar] [CrossRef]
- Sun, R.-B.; Yang, Z.-B.; Yang, L.-D.; Qiao, B.-J.; Chen, X.-F.; Gryllias, K. Planetary gearbox spectral modeling based on the hybrid method of dynamics and LSTM. Mech. Syst. Signal Process. 2020, 138, 106611. [Google Scholar] [CrossRef]
- Rafiee, J.; Arvani, F.; Harifi, A.; Sadeghi, M. Intelligent condition monitoring of a gearbox using artificial neural network. Mech. Syst. Signal Process. 2007, 21, 1746–1754. [Google Scholar] [CrossRef]
- Azamfar, M.; Singh, J.; Bravo-Imaz, I.; Lee, J. Multisensor data fusion for gearbox fault diagnosis using 2-D convolutional neural network and motor current signature analysis. Mech. Syst. Signal Process. 2020, 144, 106861. [Google Scholar] [CrossRef]
- Shi, J.; Peng, D.; Peng, Z.; Zhang, Z.; Goebel, K.; Wu, D. Planetary gearbox fault diagnosis using bidirectional-convolutional LSTM networks. Mech. Syst. Signal Process. 2022, 162, 107996. [Google Scholar] [CrossRef]
- Wang, T.; Han, Q.; Chu, F.; Feng, Z. Vibration based condition monitoring and fault diagnosis of wind turbine planetary gearbox: A review. Mech. Syst. Signal Process. 2019, 126, 662–685. [Google Scholar] [CrossRef]
- Wang, C.; Li, H.; Zhang, K.; Hu, S.; Sun, B. Intelligent fault diagnosis of planetary gearbox based on adaptive normalized CNN under complex variable working conditions and data imbalance. Measurement 2021, 180, 109565. [Google Scholar] [CrossRef]
- Sinha, J.K.; Elbhbah, K. A future possibility of vibration based condition monitoring of rotating machines. Mech. Syst. Signal Process. 2012, 34, 231–240. [Google Scholar] [CrossRef]
- Elbhbah, K.; Sinha, J.K. Vibration-based condition monitoring of rotating machines using a machine composite spectrum. J. Sound Vib. 2013, 332, 2831–2845. [Google Scholar] [CrossRef]
- Lu, S.; Zhou, P.; Wang, X.; Liu, Y.; Liu, F.; Zhao, J. Condition monitoring and fault diagnosis of motor bearings using undersampled vibration signals from a wireless sensor network. J. Sound Vib. 2018, 414, 81–96. [Google Scholar] [CrossRef]
- Ruiz-Cárcel, C.; Jaramillo, V.; Mba, D.; Ottewill, J.; Cao, Y. Combination of process and vibration data for improved condition monitoring of industrial systems working under variable operating conditions. Mech. Syst. Signal Process. 2016, 66–67, 699–714. [Google Scholar] [CrossRef]
- Koutsoupakis, J.; Seventekidis, P.; Giagopoulos, D. Machine learning based condition monitoring for gear transmission systems using data generated by optimal multibody dynamics models. Mech. Syst. Signal Process. 2023, 190, 110130. [Google Scholar] [CrossRef]
- Arailopoulos, A.; Giagopoulos, D. Nonlinear constitutive force model selection, update and uncertainty quantification for periodically sequential impact applications. Nonlinear Dyn. 2020, 99, 2623–2646. [Google Scholar] [CrossRef]
- da Silva, M.R.; Marques, F.; da Silva, M.T.; Flores, P. A compendium of contact force models inspired by Hunt and Crossley’s cornerstone work. Mech. Mach. Theory 2021, 167, 104501. [Google Scholar] [CrossRef]
- Seventekidis, P.; Giagopoulos, D. A combined finite element and hierarchical Deep learning approach for structural health monitoring: Test on a pin-joint composite truss structure. Mech. Syst. Signal Process. 2021, 157, 107735. [Google Scholar] [CrossRef]
- Giagopoulos, D.; Arailopoulos, A. Computational framework for model updating of large scale linear and nonlinear finite element models using state of the art evolution strategy. Comput. Struct. 2017, 192, 210–232. [Google Scholar] [CrossRef]
- Hewamalage, H.; Bergmeir, C.; Bandara, K. Recurrent Neural Networks for Time Series Forecasting: Current status and future directions. Int. J. Forecast. 2020, 37, 388–427. [Google Scholar] [CrossRef]
- Chollet, F. Keras. GitHub. Available online: https://github.com/fchollet/keras (accessed on 1 July 2021).
- Lai, Z.; Mylonas, C.; Nagarajaiah, S.; Chatzi, E. Structural identification with physics-informed neural ordinary differential equations. J. Sound Vib. 2021, 508, 116196. [Google Scholar] [CrossRef]
- Cao, Z.; Yao, W.; Peng, W.; Zhang, X.; Bao, K. Physics-Informed MTA-UNet: Prediction of Thermal Stress and Thermal Deformation of Satellites. Aerospace 2022, 9, 603. [Google Scholar] [CrossRef]
Figure 1.
Drivetrain Prognostics Simulator (DPS) from Spectra Quest Inc. [22].
Figure 1.
Drivetrain Prognostics Simulator (DPS) from Spectra Quest Inc. [22].
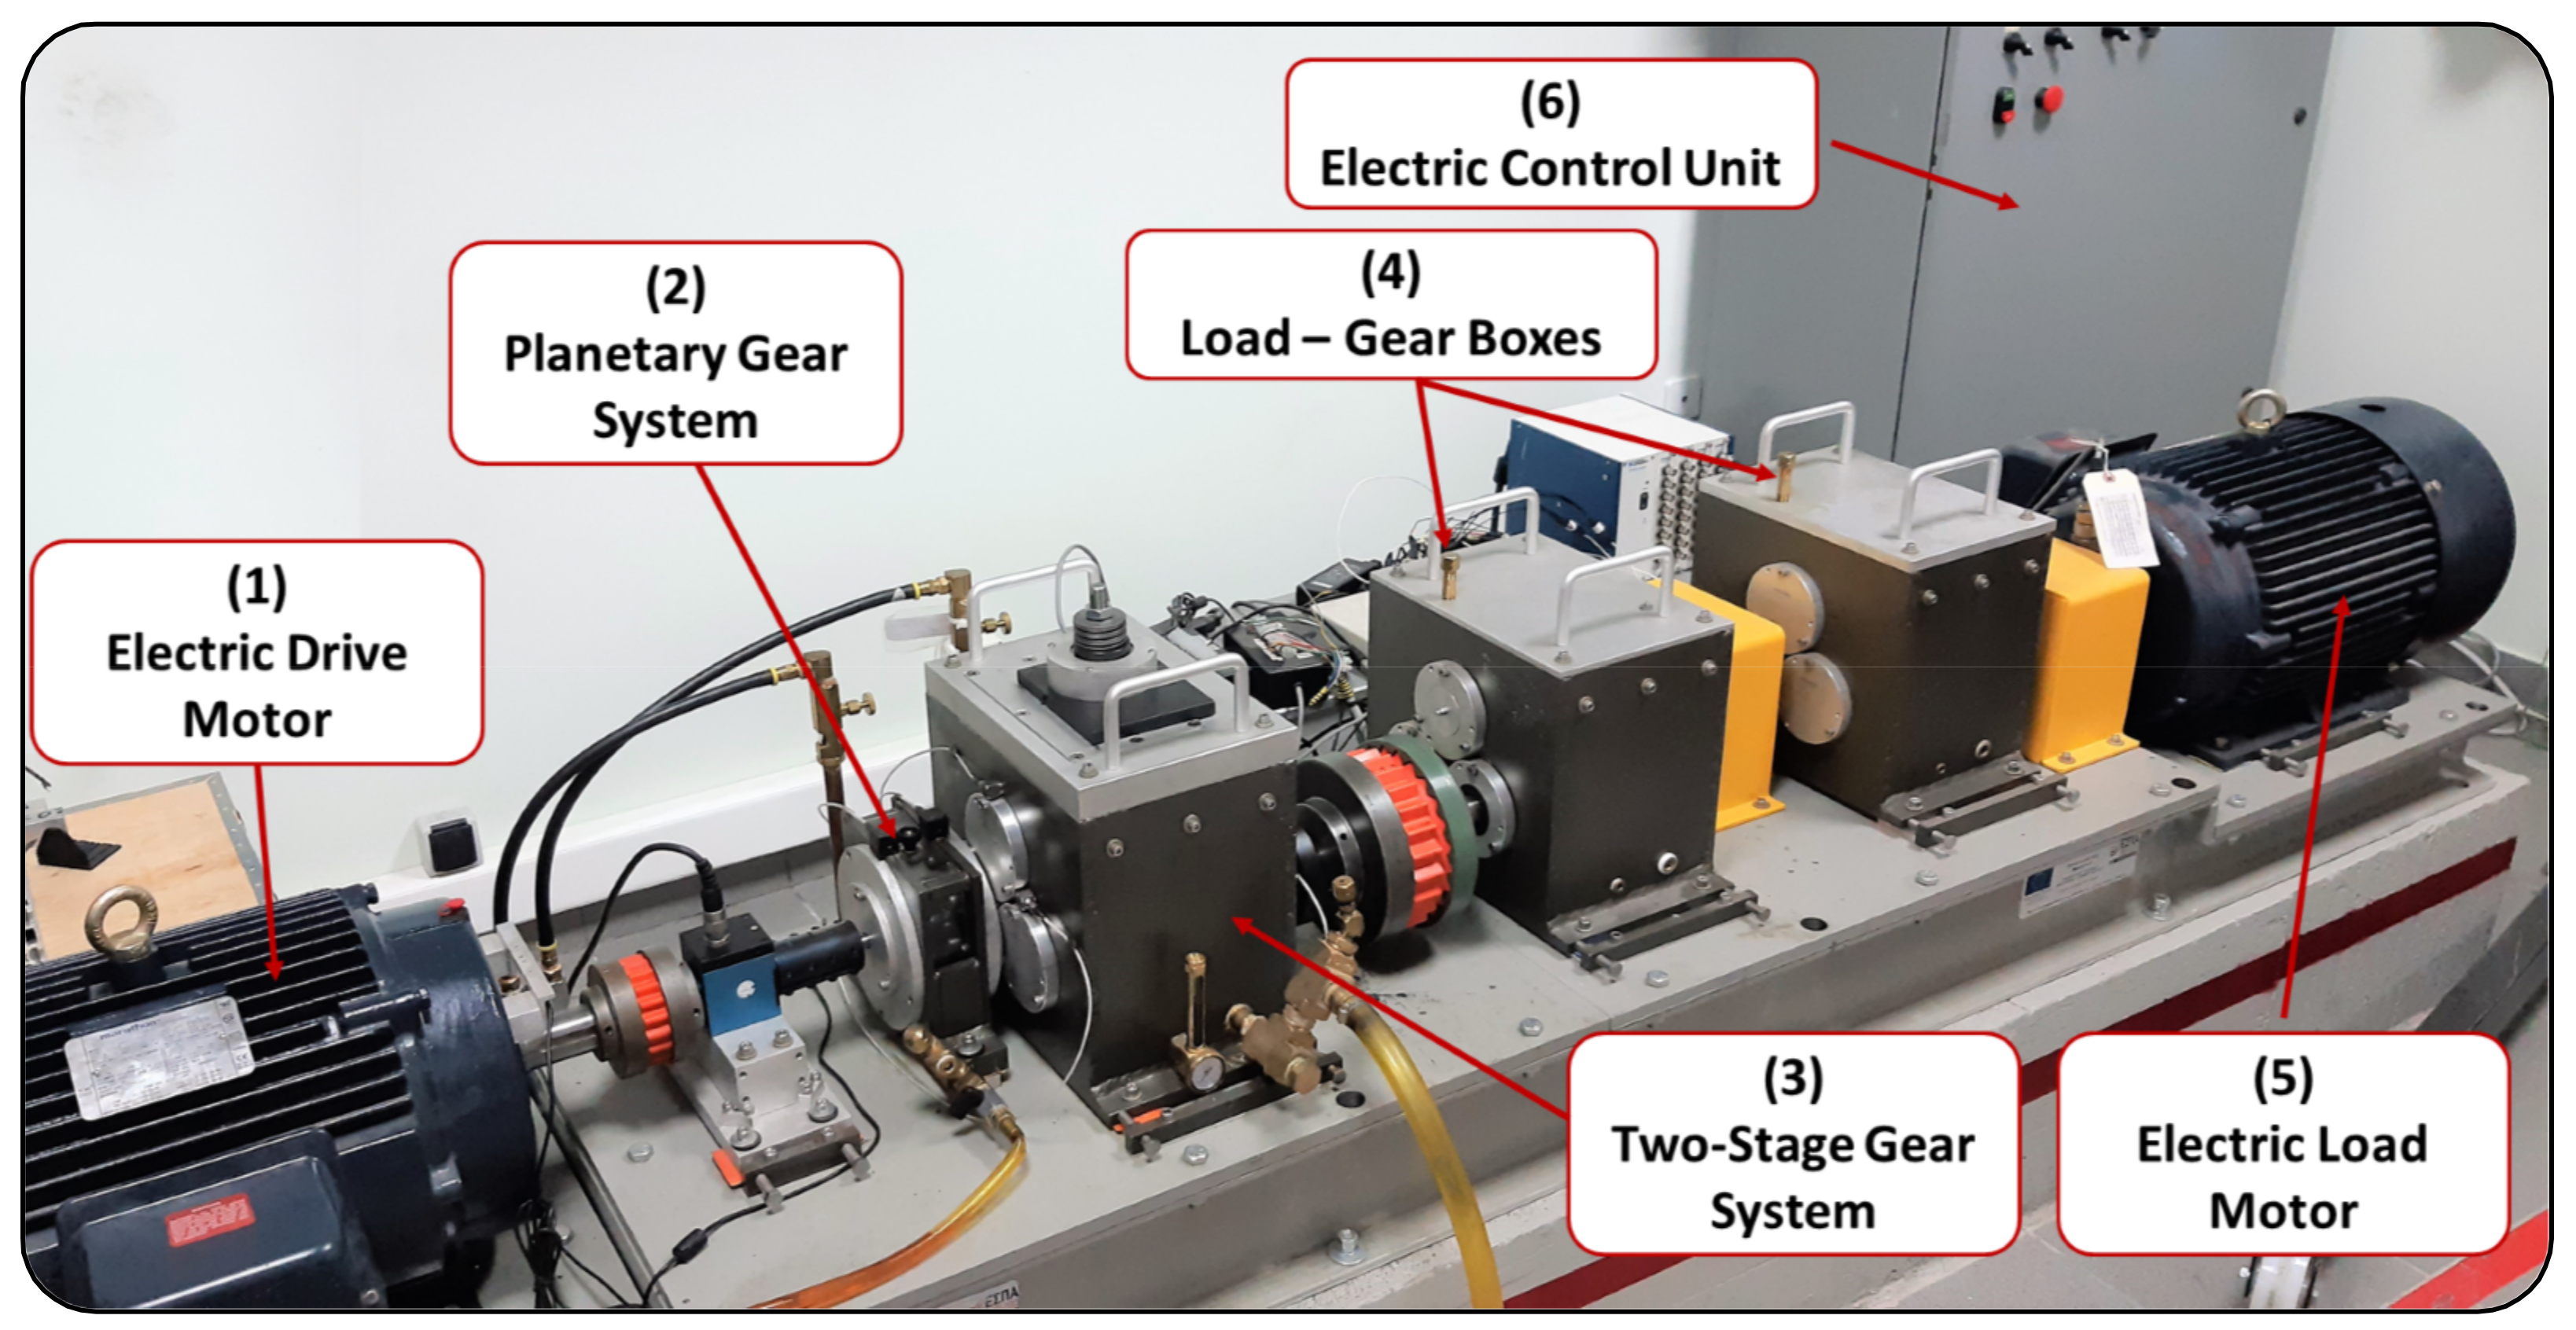
Figure 2.
Planetary and two-stage gearbox exploded view [22].
Figure 2.
Planetary and two-stage gearbox exploded view [22].
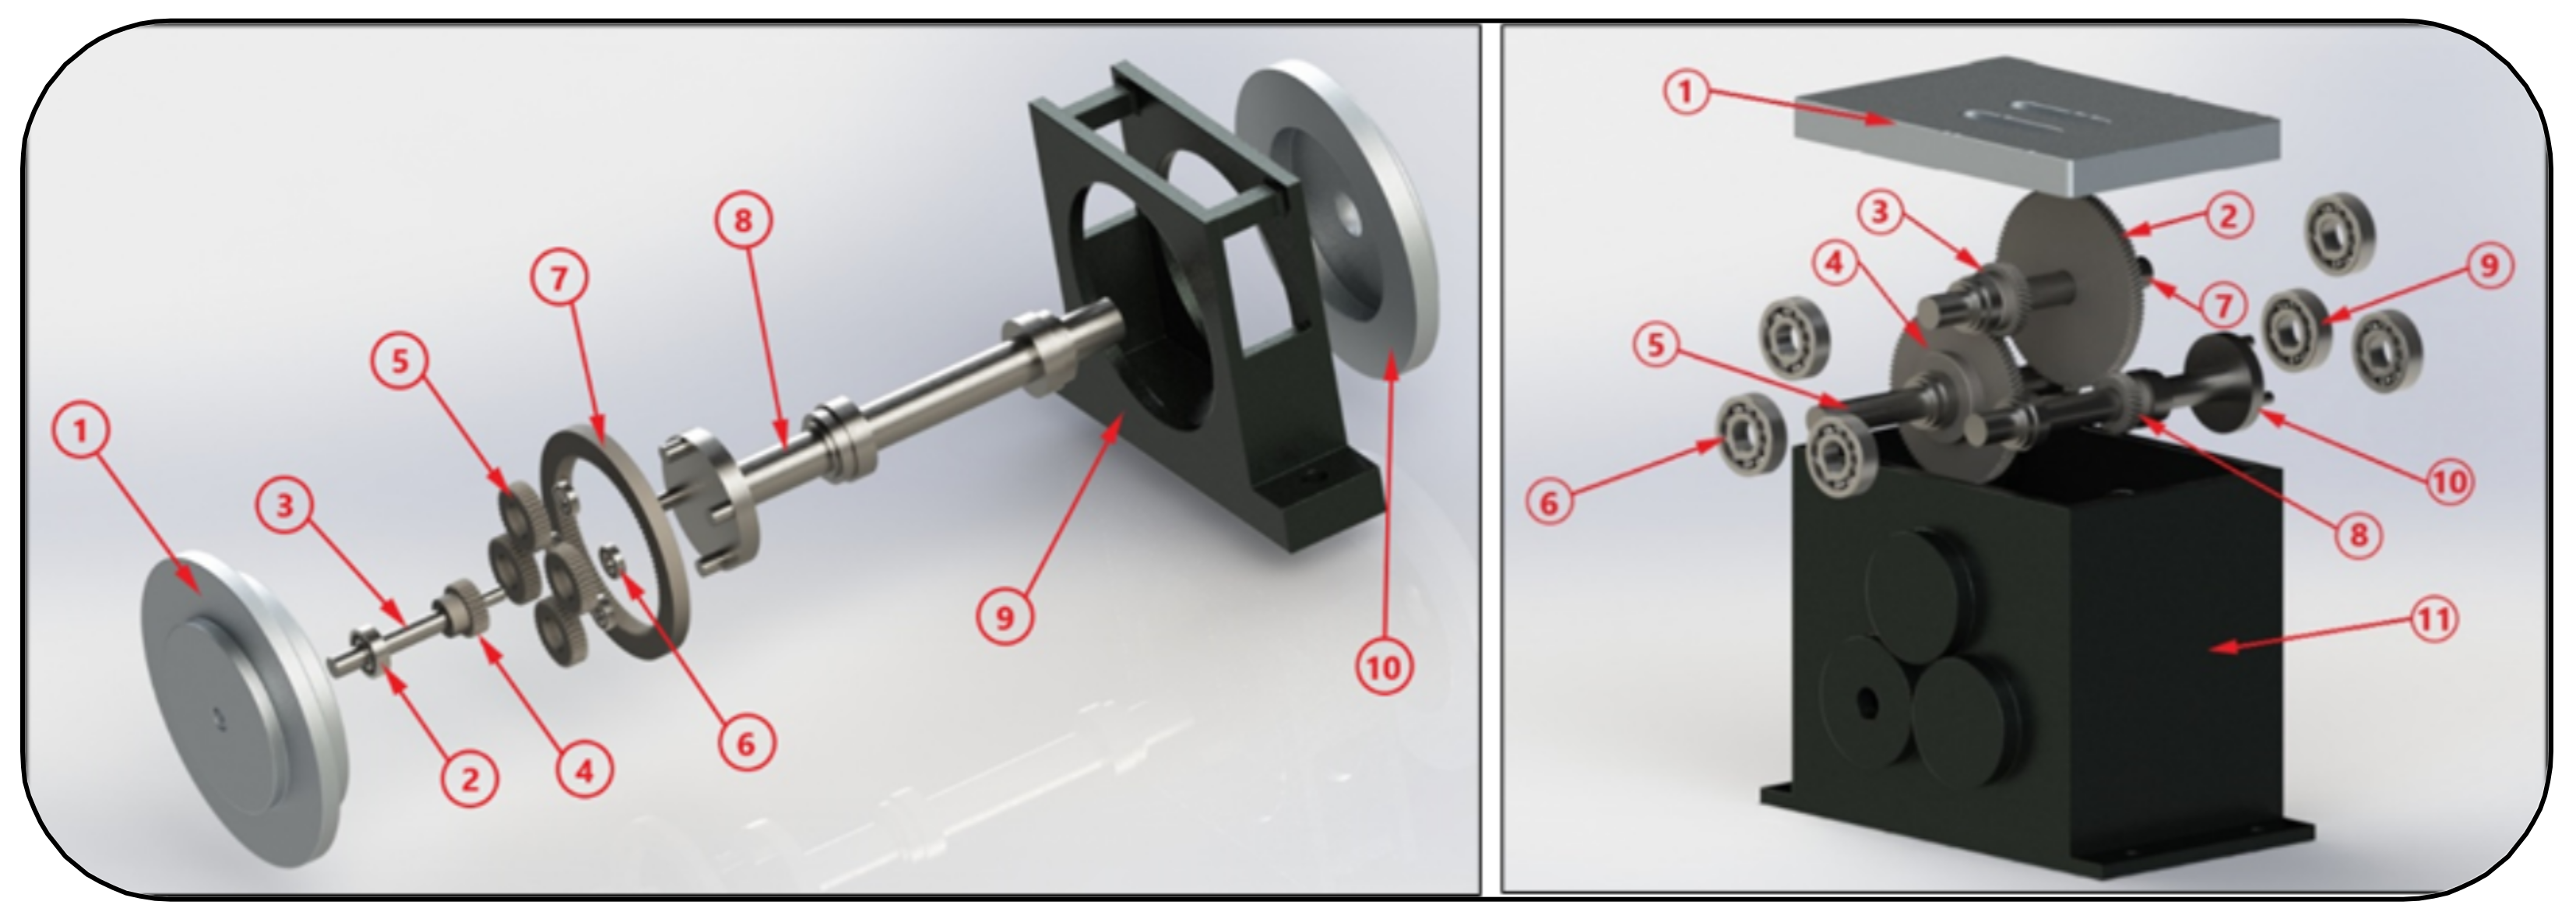
Figure 3.
Accelerometer sensor positions on the planetary and two-stage gearboxes.
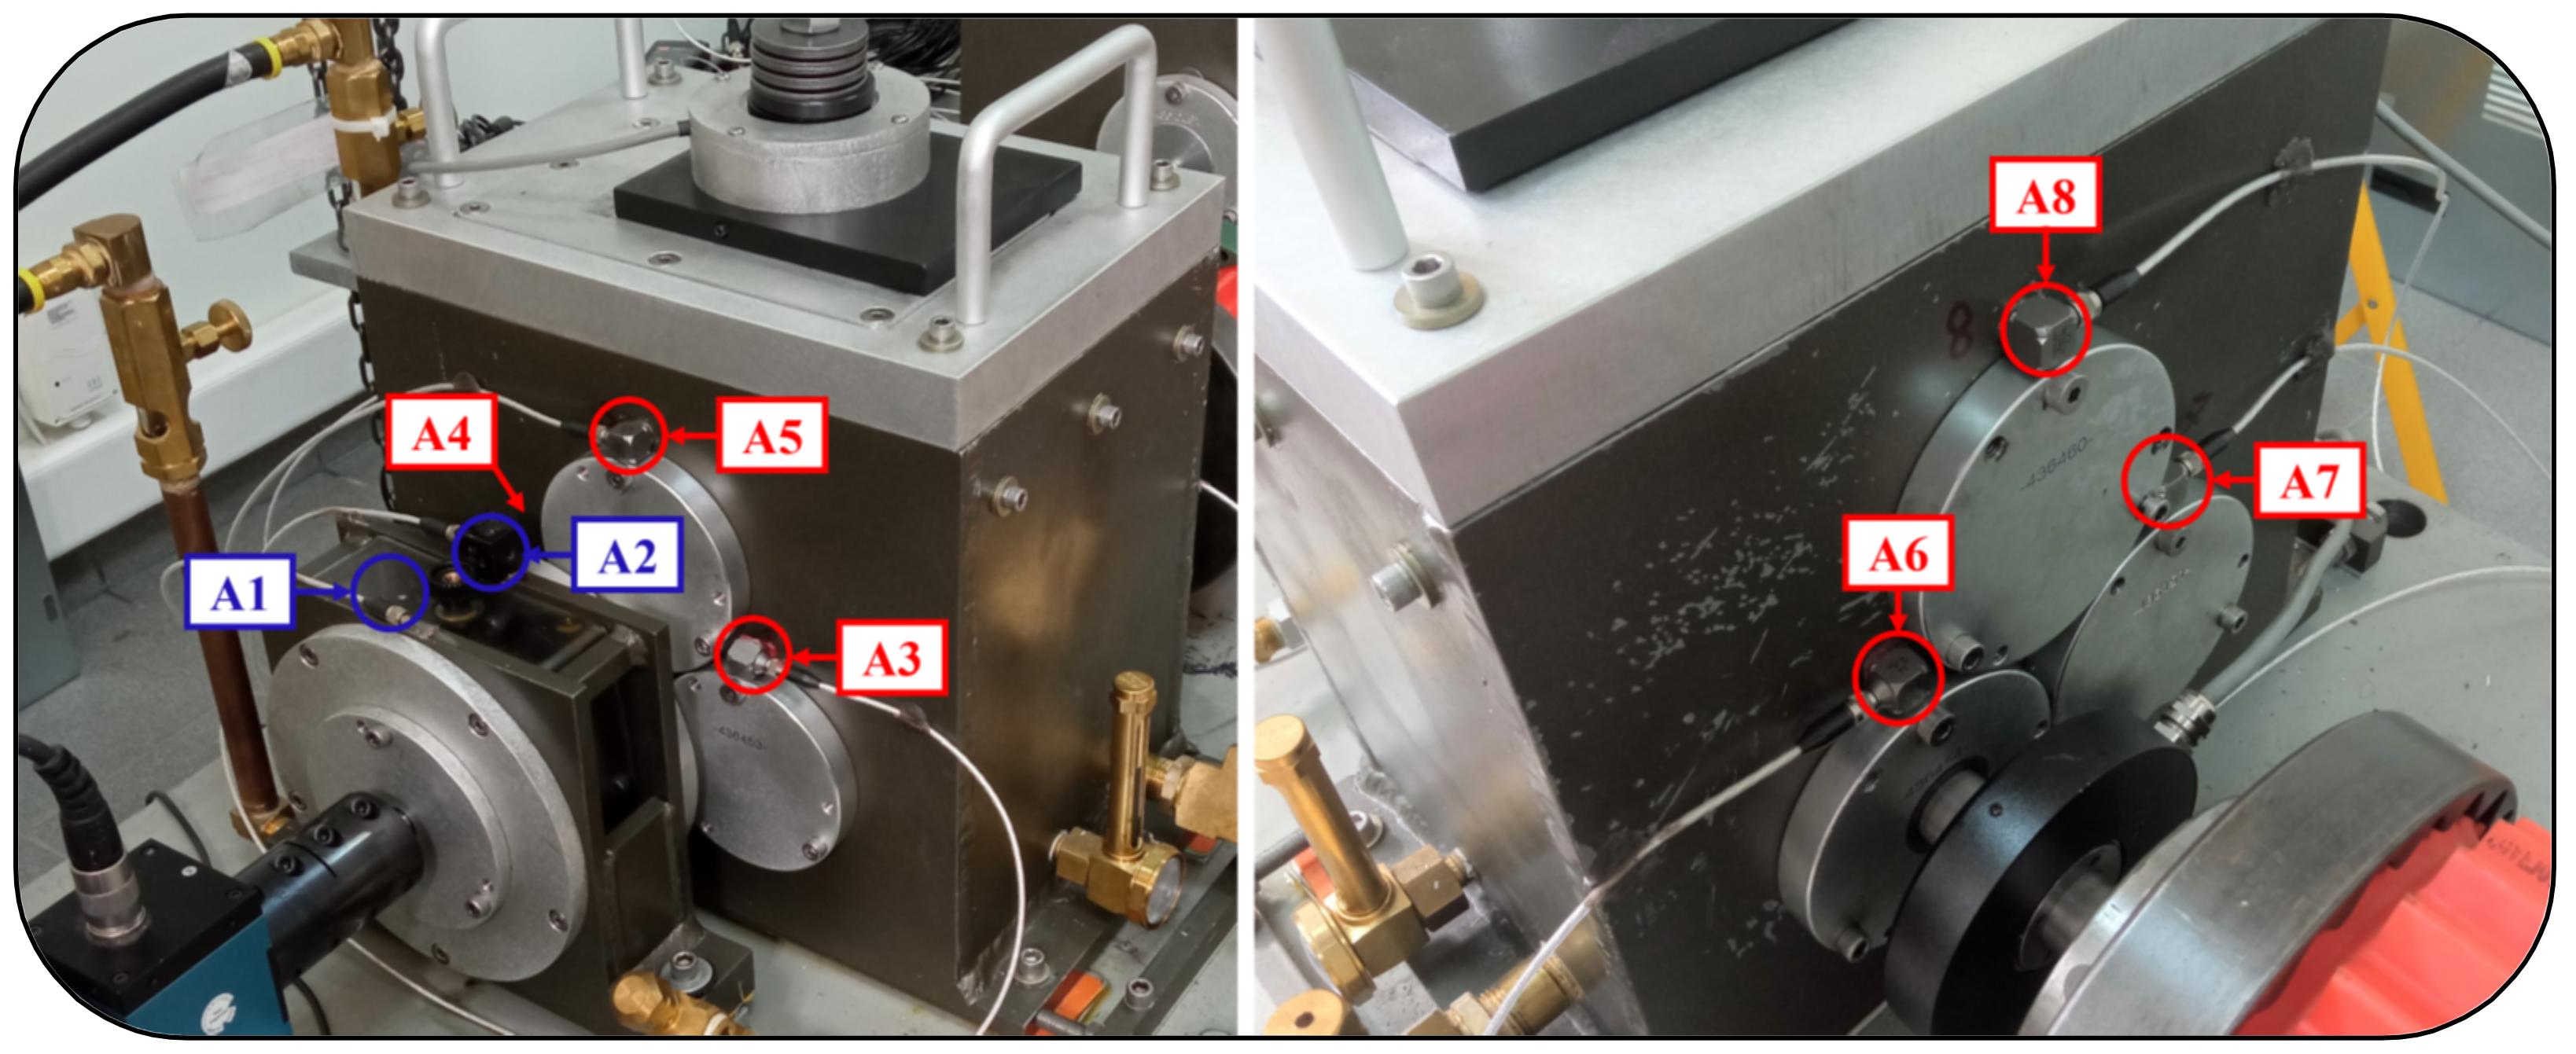
Figure 4.
Two-stage and planetary gearboxes rigid-flexible MBD model [22].
Figure 4.
Two-stage and planetary gearboxes rigid-flexible MBD model [22].

Figure 5.
Contact normal (Left) and friction (Right) forces [22].
Figure 5.
Contact normal (Left) and friction (Right) forces [22].

Figure 6.
RNN-based surrogate framework.

Figure 7.
RNN operations. (a) Folded representation; (b) Unfolded representation.
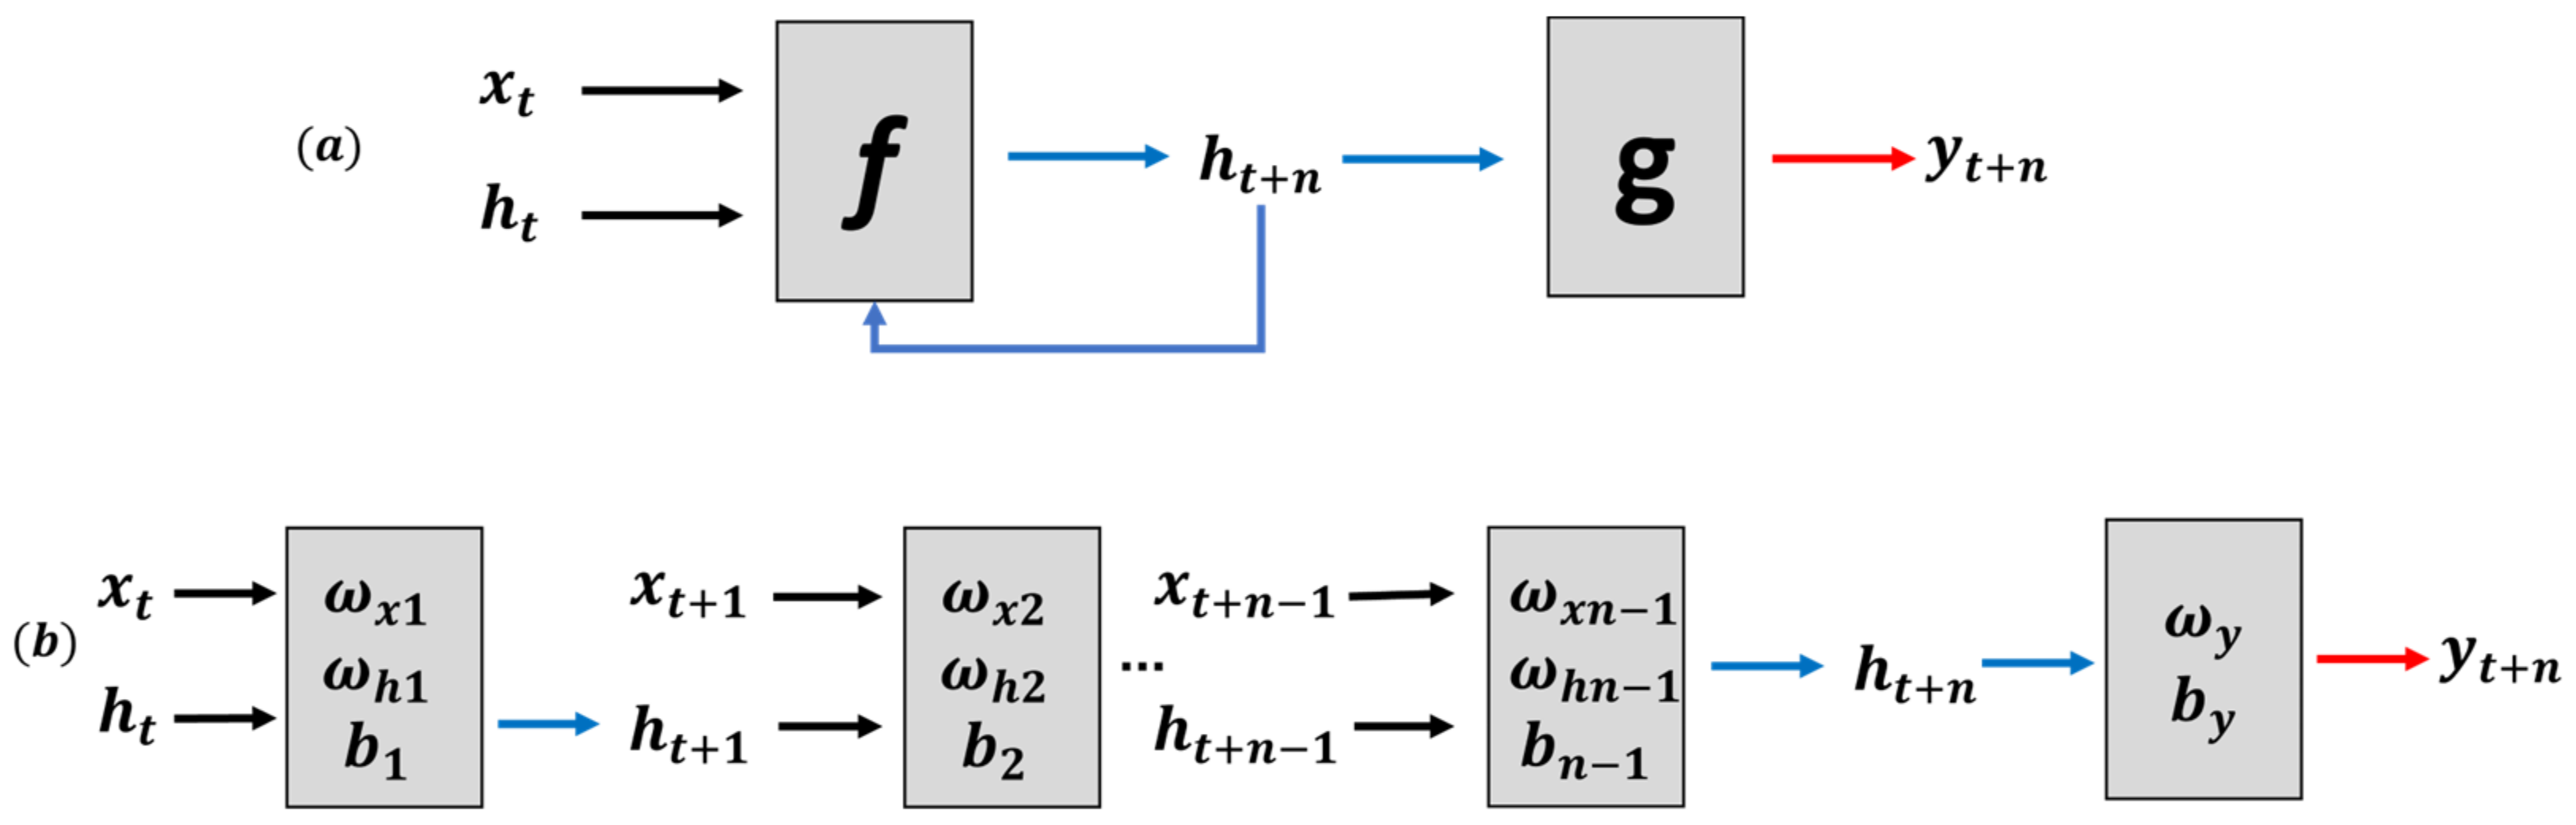
Figure 8.
Training and Validation loss curves during training.
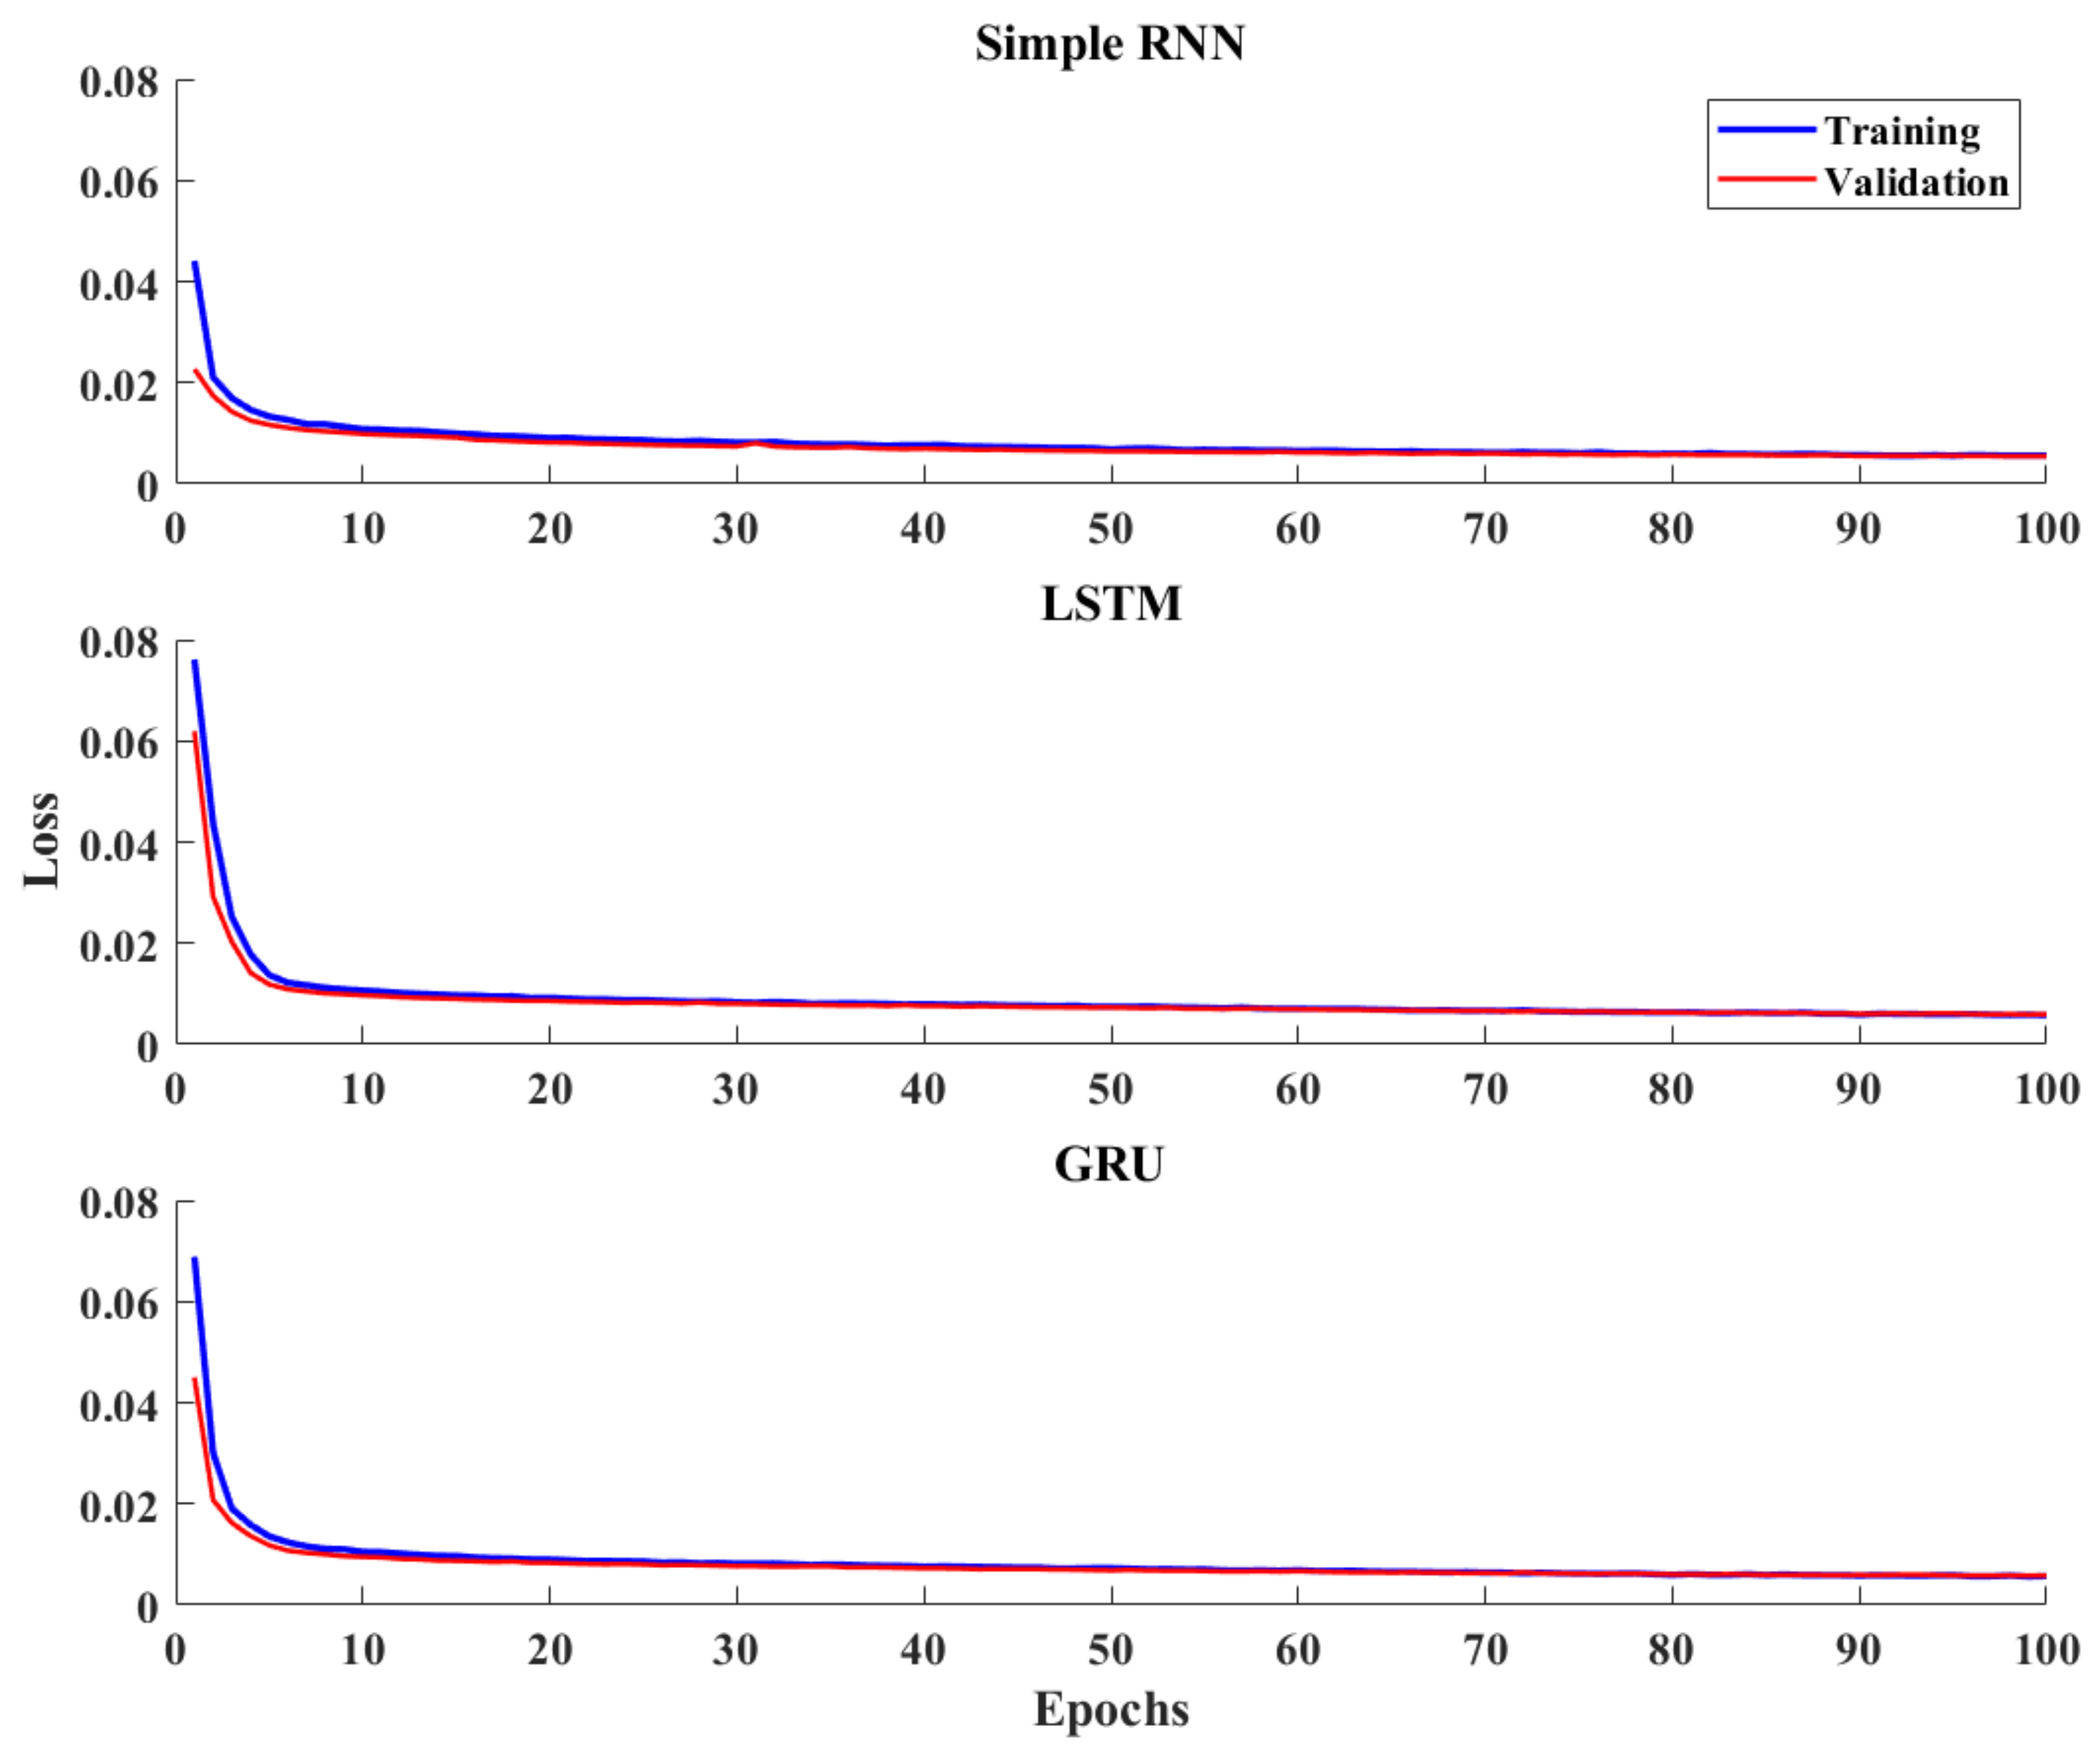
Figure 9.
Acceleration PSD at the X and Y axes of A1.
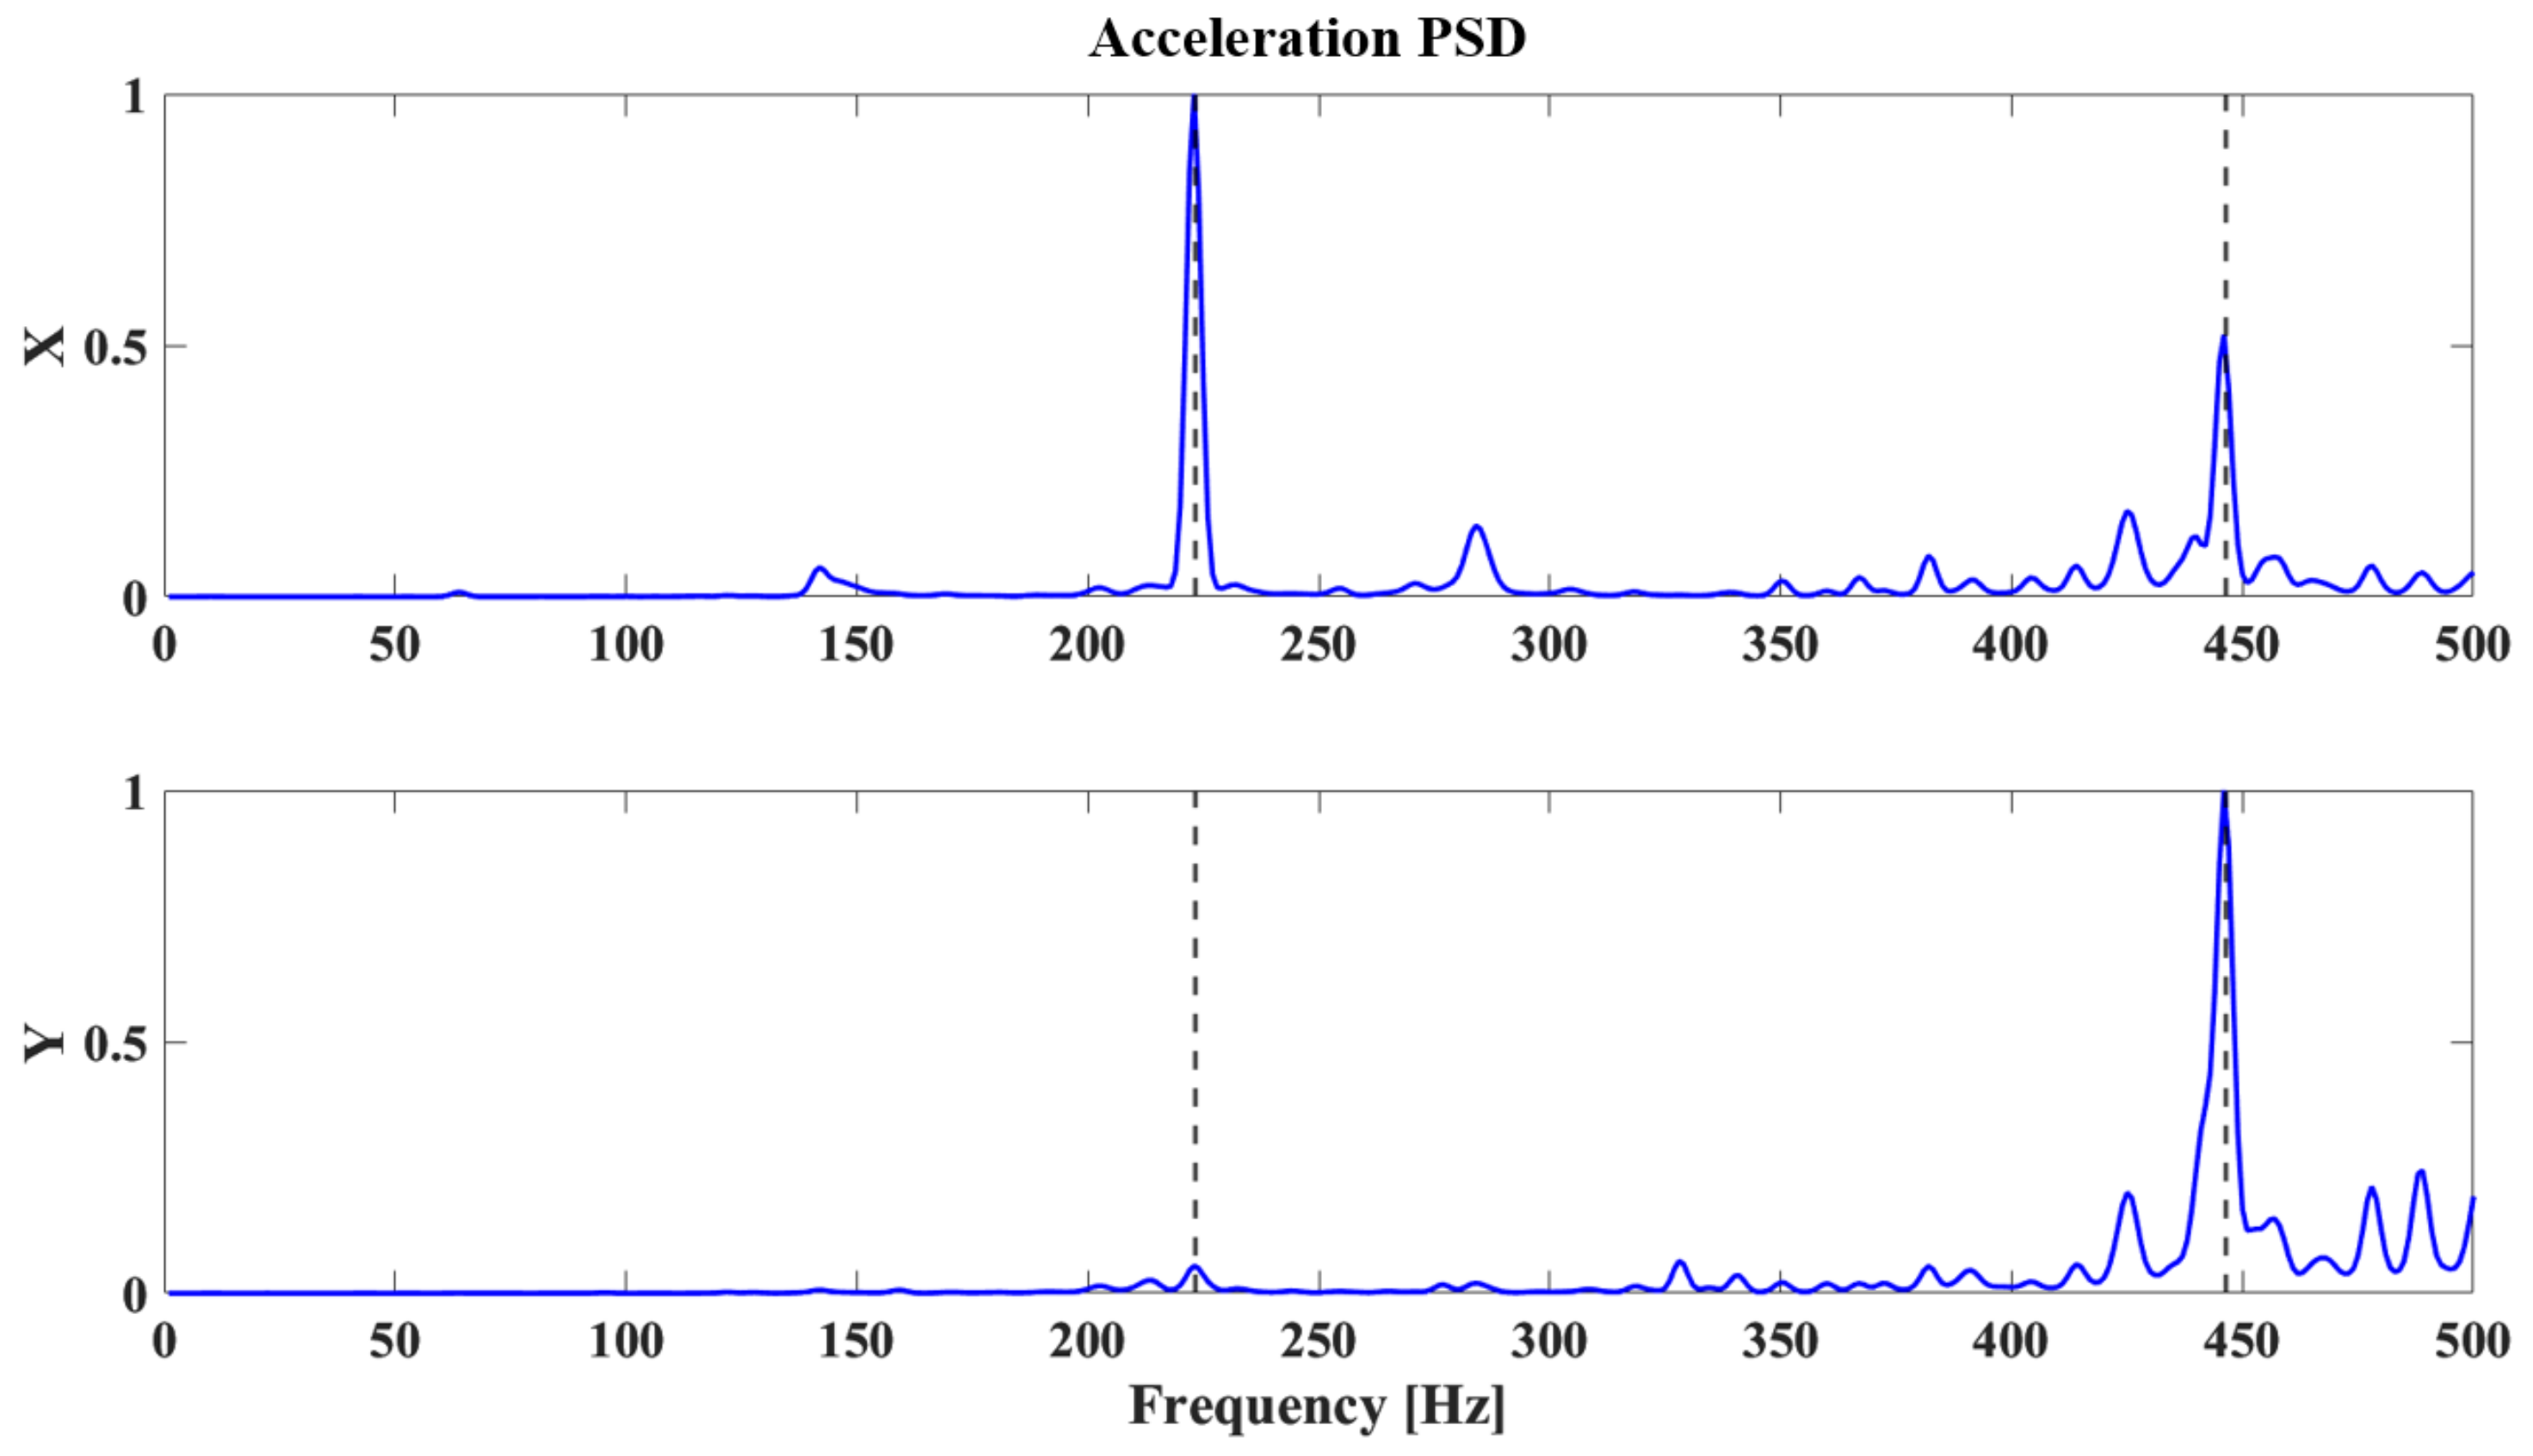
Figure 10.
Acceleration PSD comparison between the experimental and MBD system for the radial measurement channels of accelerometer A8.
Figure 10.
Acceleration PSD comparison between the experimental and MBD system for the radial measurement channels of accelerometer A8.
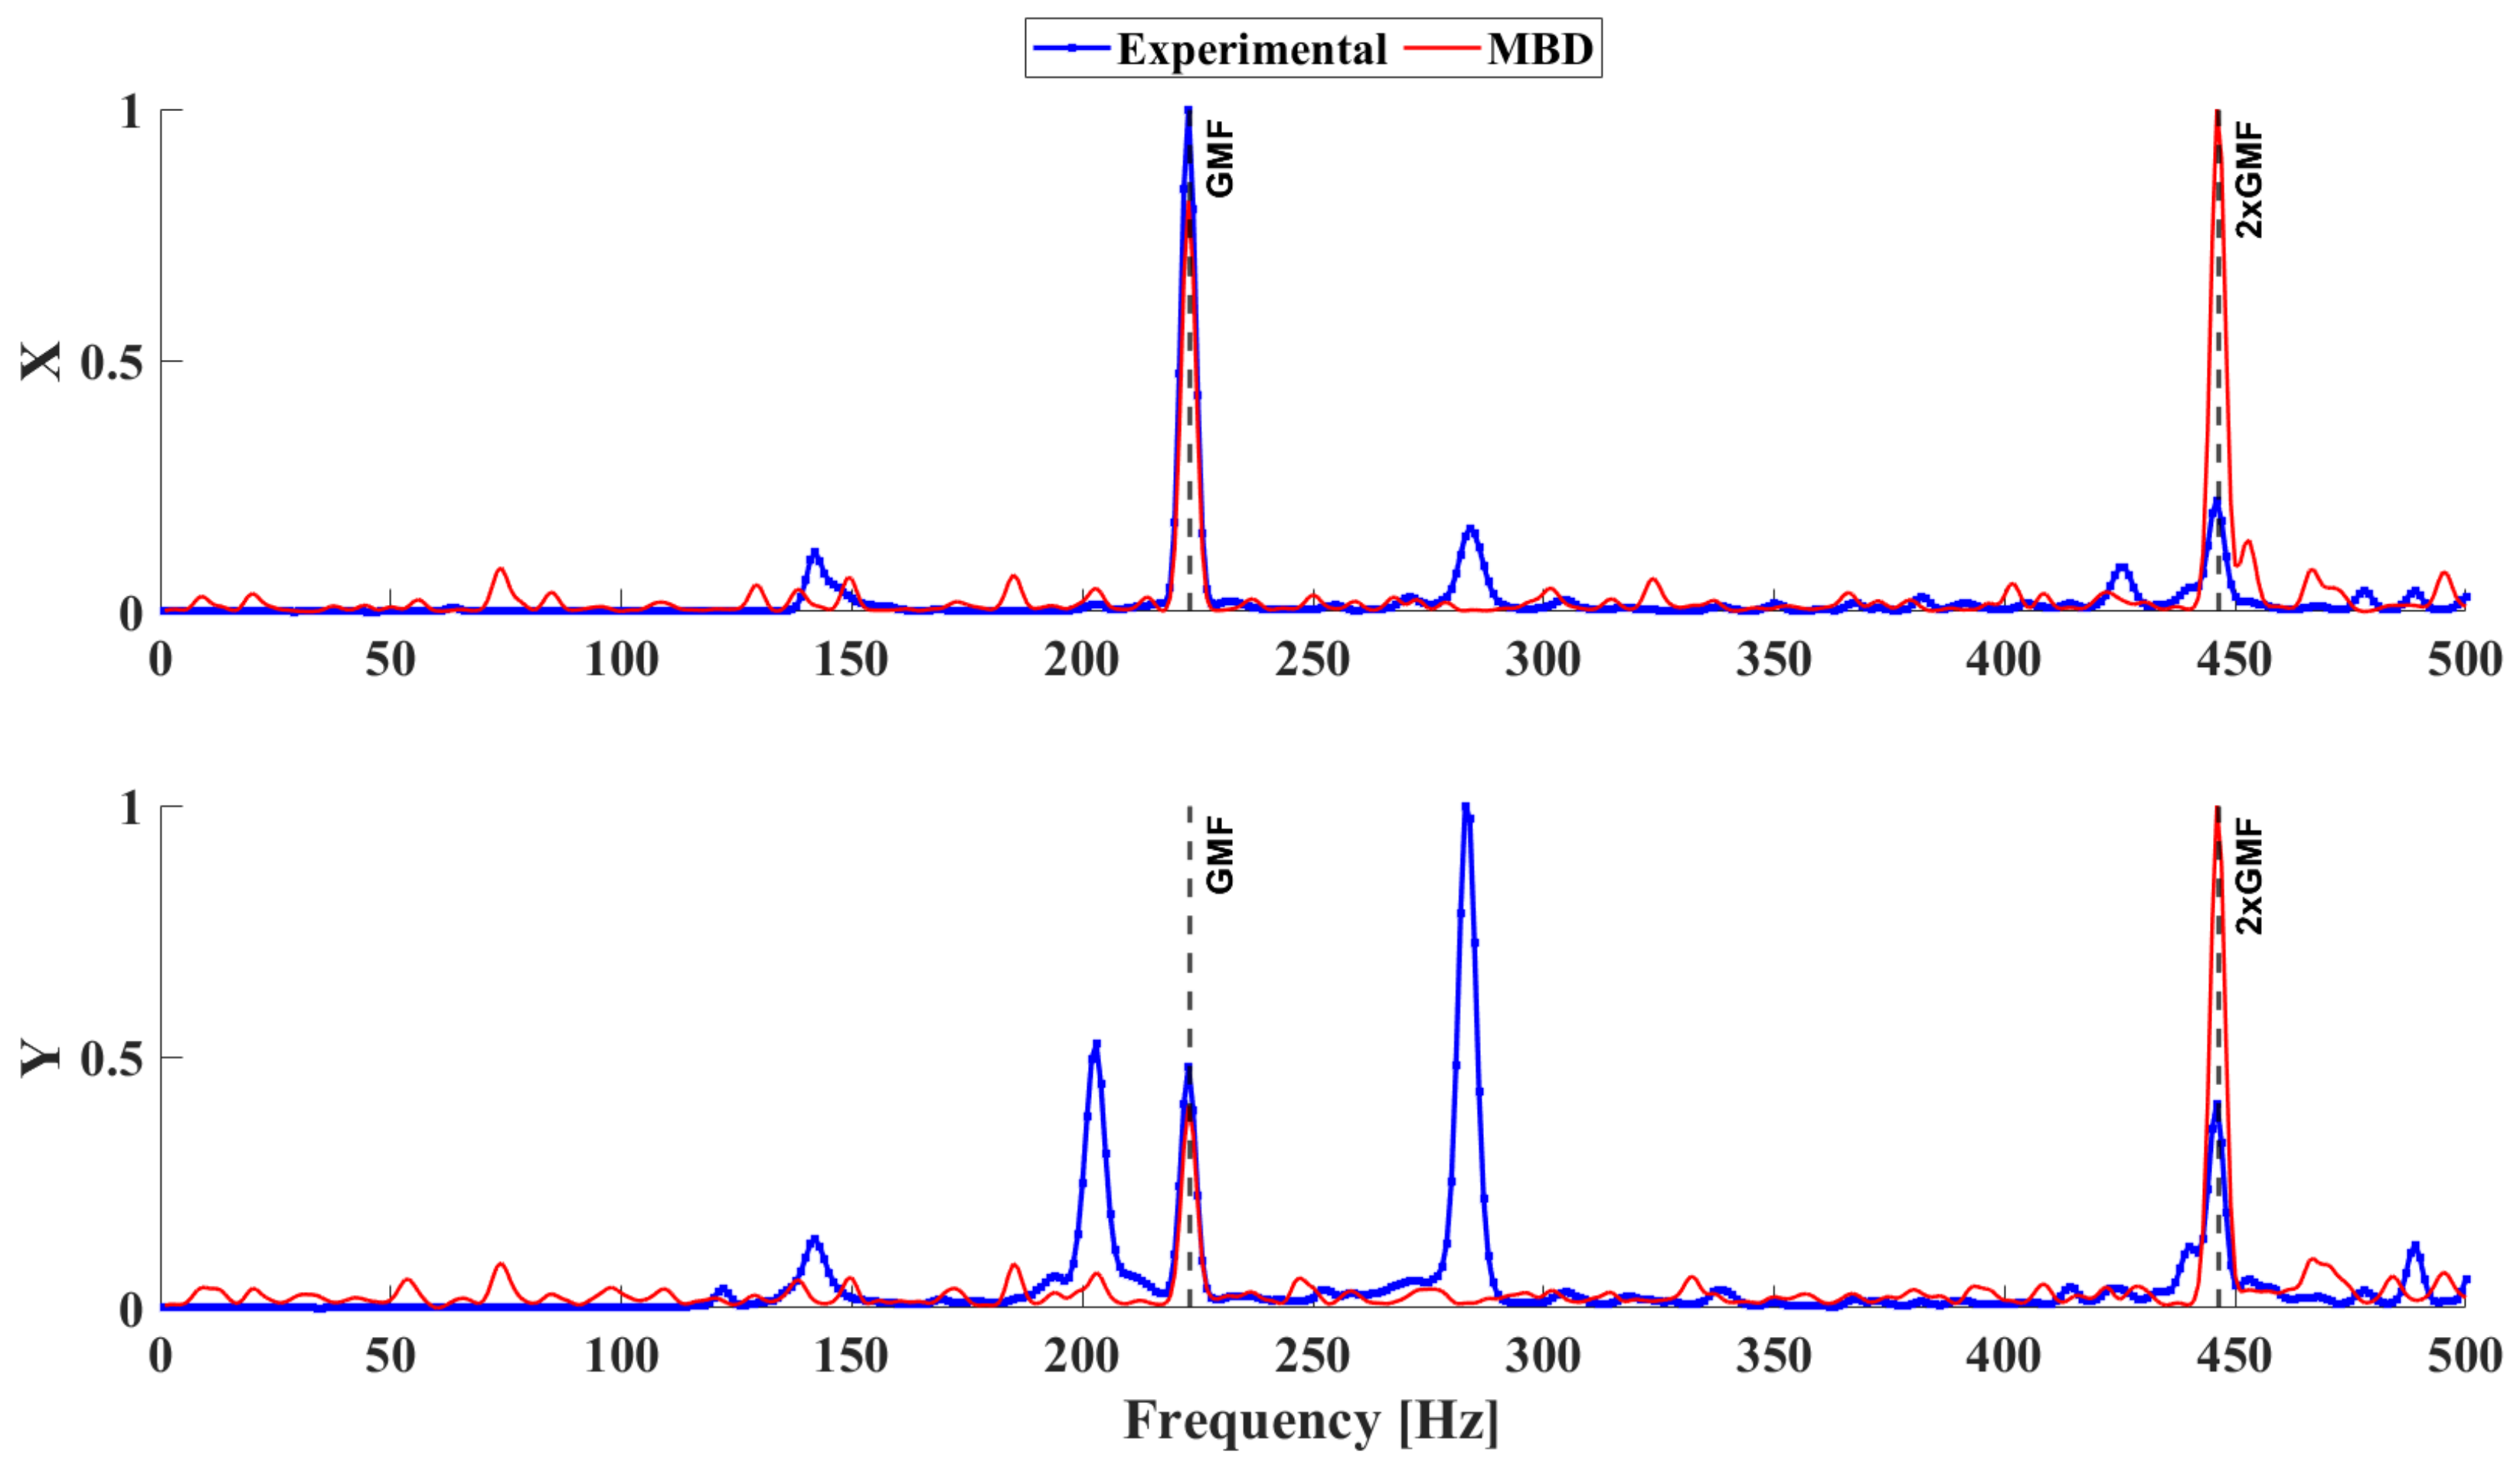
Figure 11.
MSE between the true and predicted response values for all three RNN models. Comparison of the MSE per channel (left) and box plot of the MSE per model (right).
Figure 11.
MSE between the true and predicted response values for all three RNN models. Comparison of the MSE per channel (left) and box plot of the MSE per model (right).
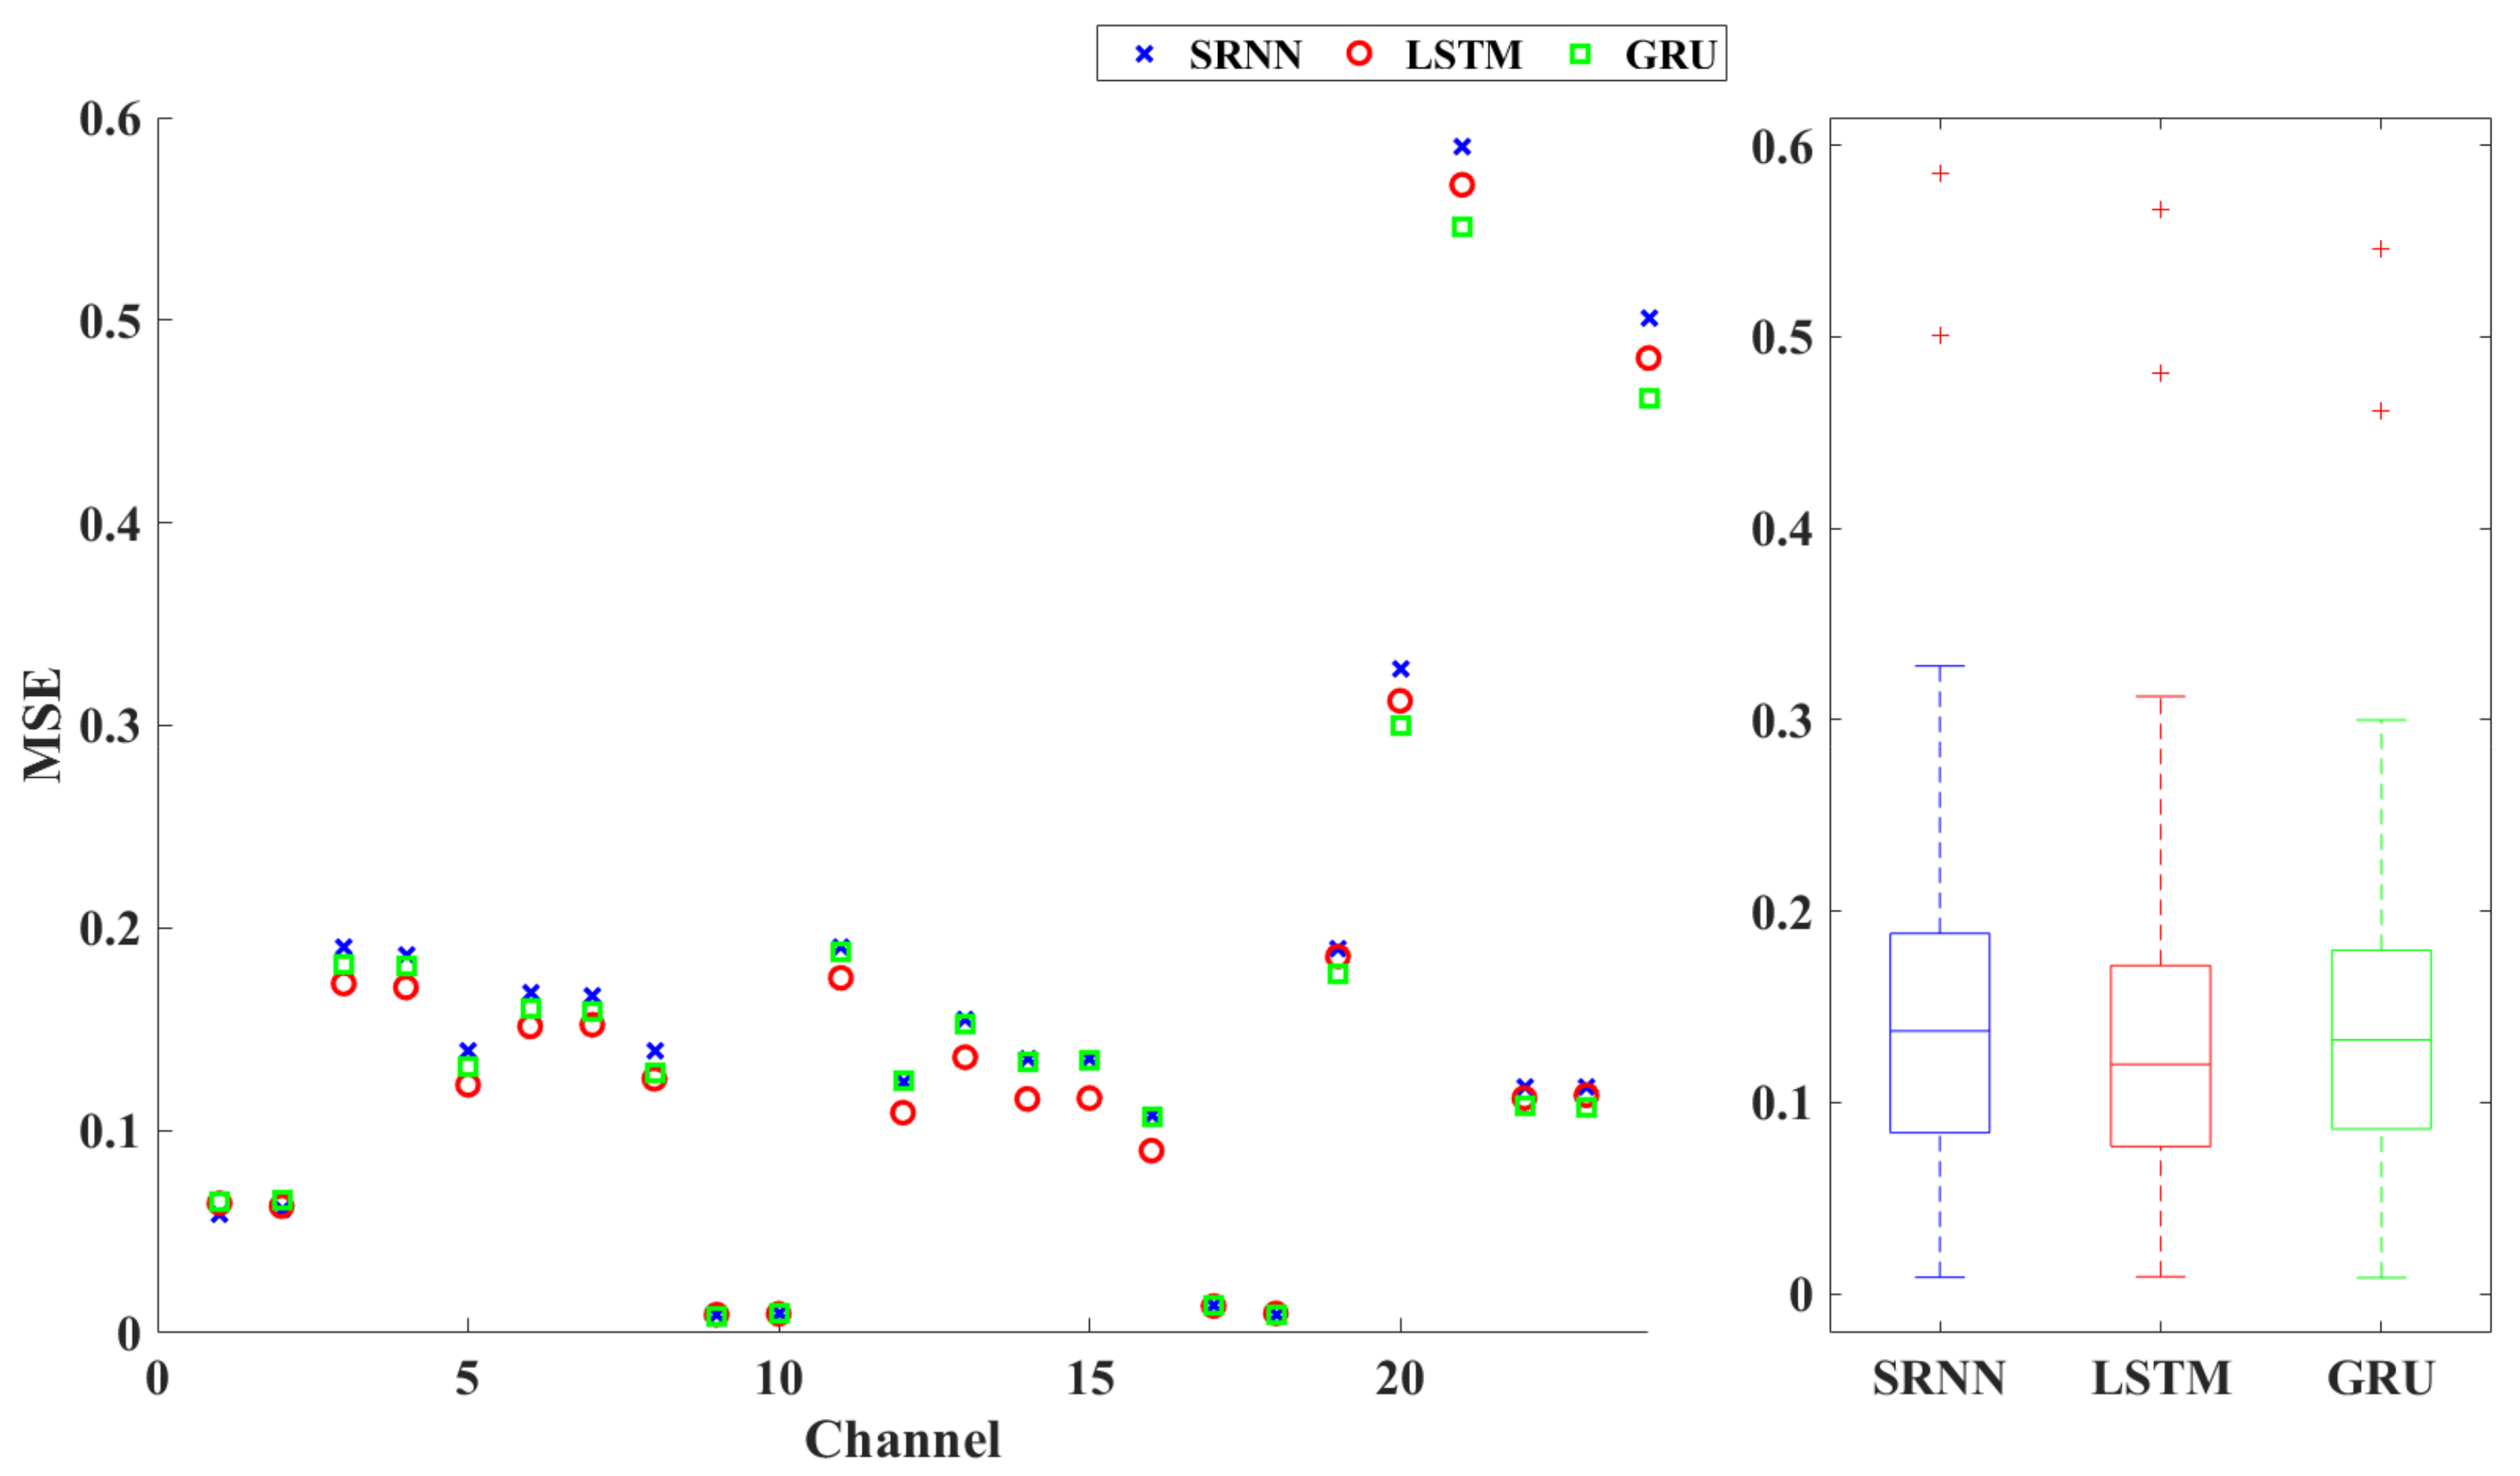
Figure 12.
PSD MSE between the Optimal MBD and LSTM generated data averaged along the 24 measurement channels.
Figure 12.
PSD MSE between the Optimal MBD and LSTM generated data averaged along the 24 measurement channels.
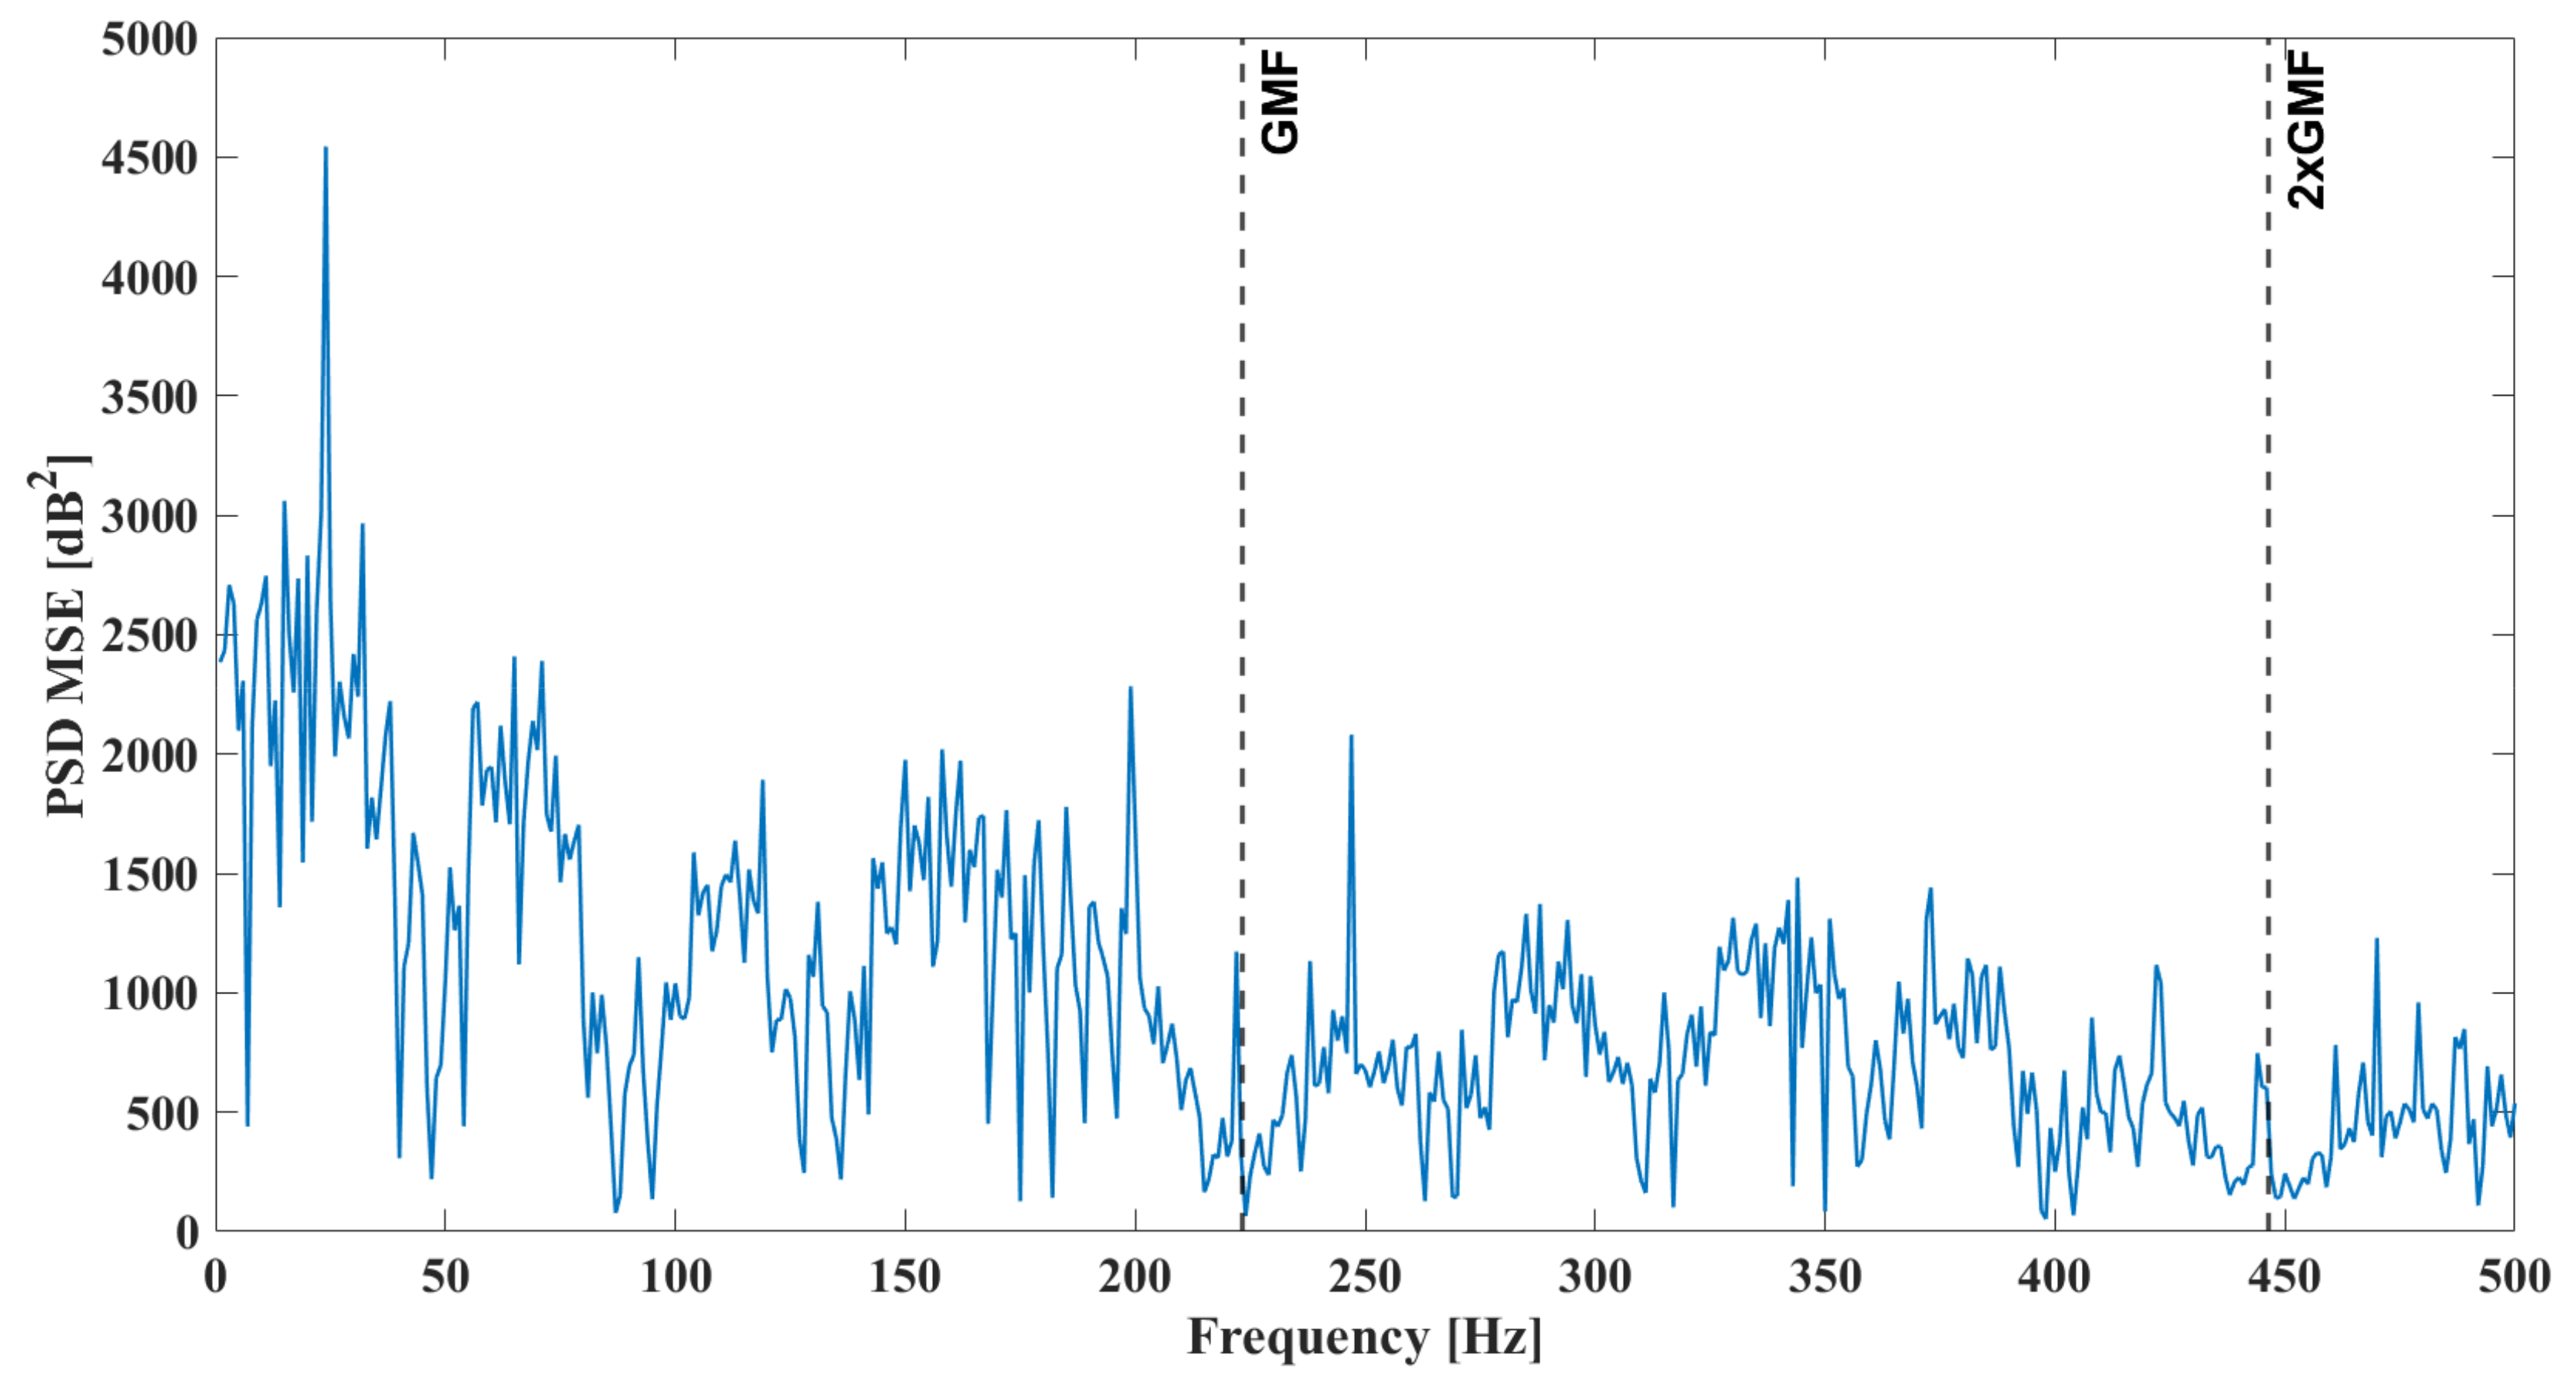
Figure 13.
Acceleration PSD comparison between the Optimal MBD and RNN generated data—A8 location.
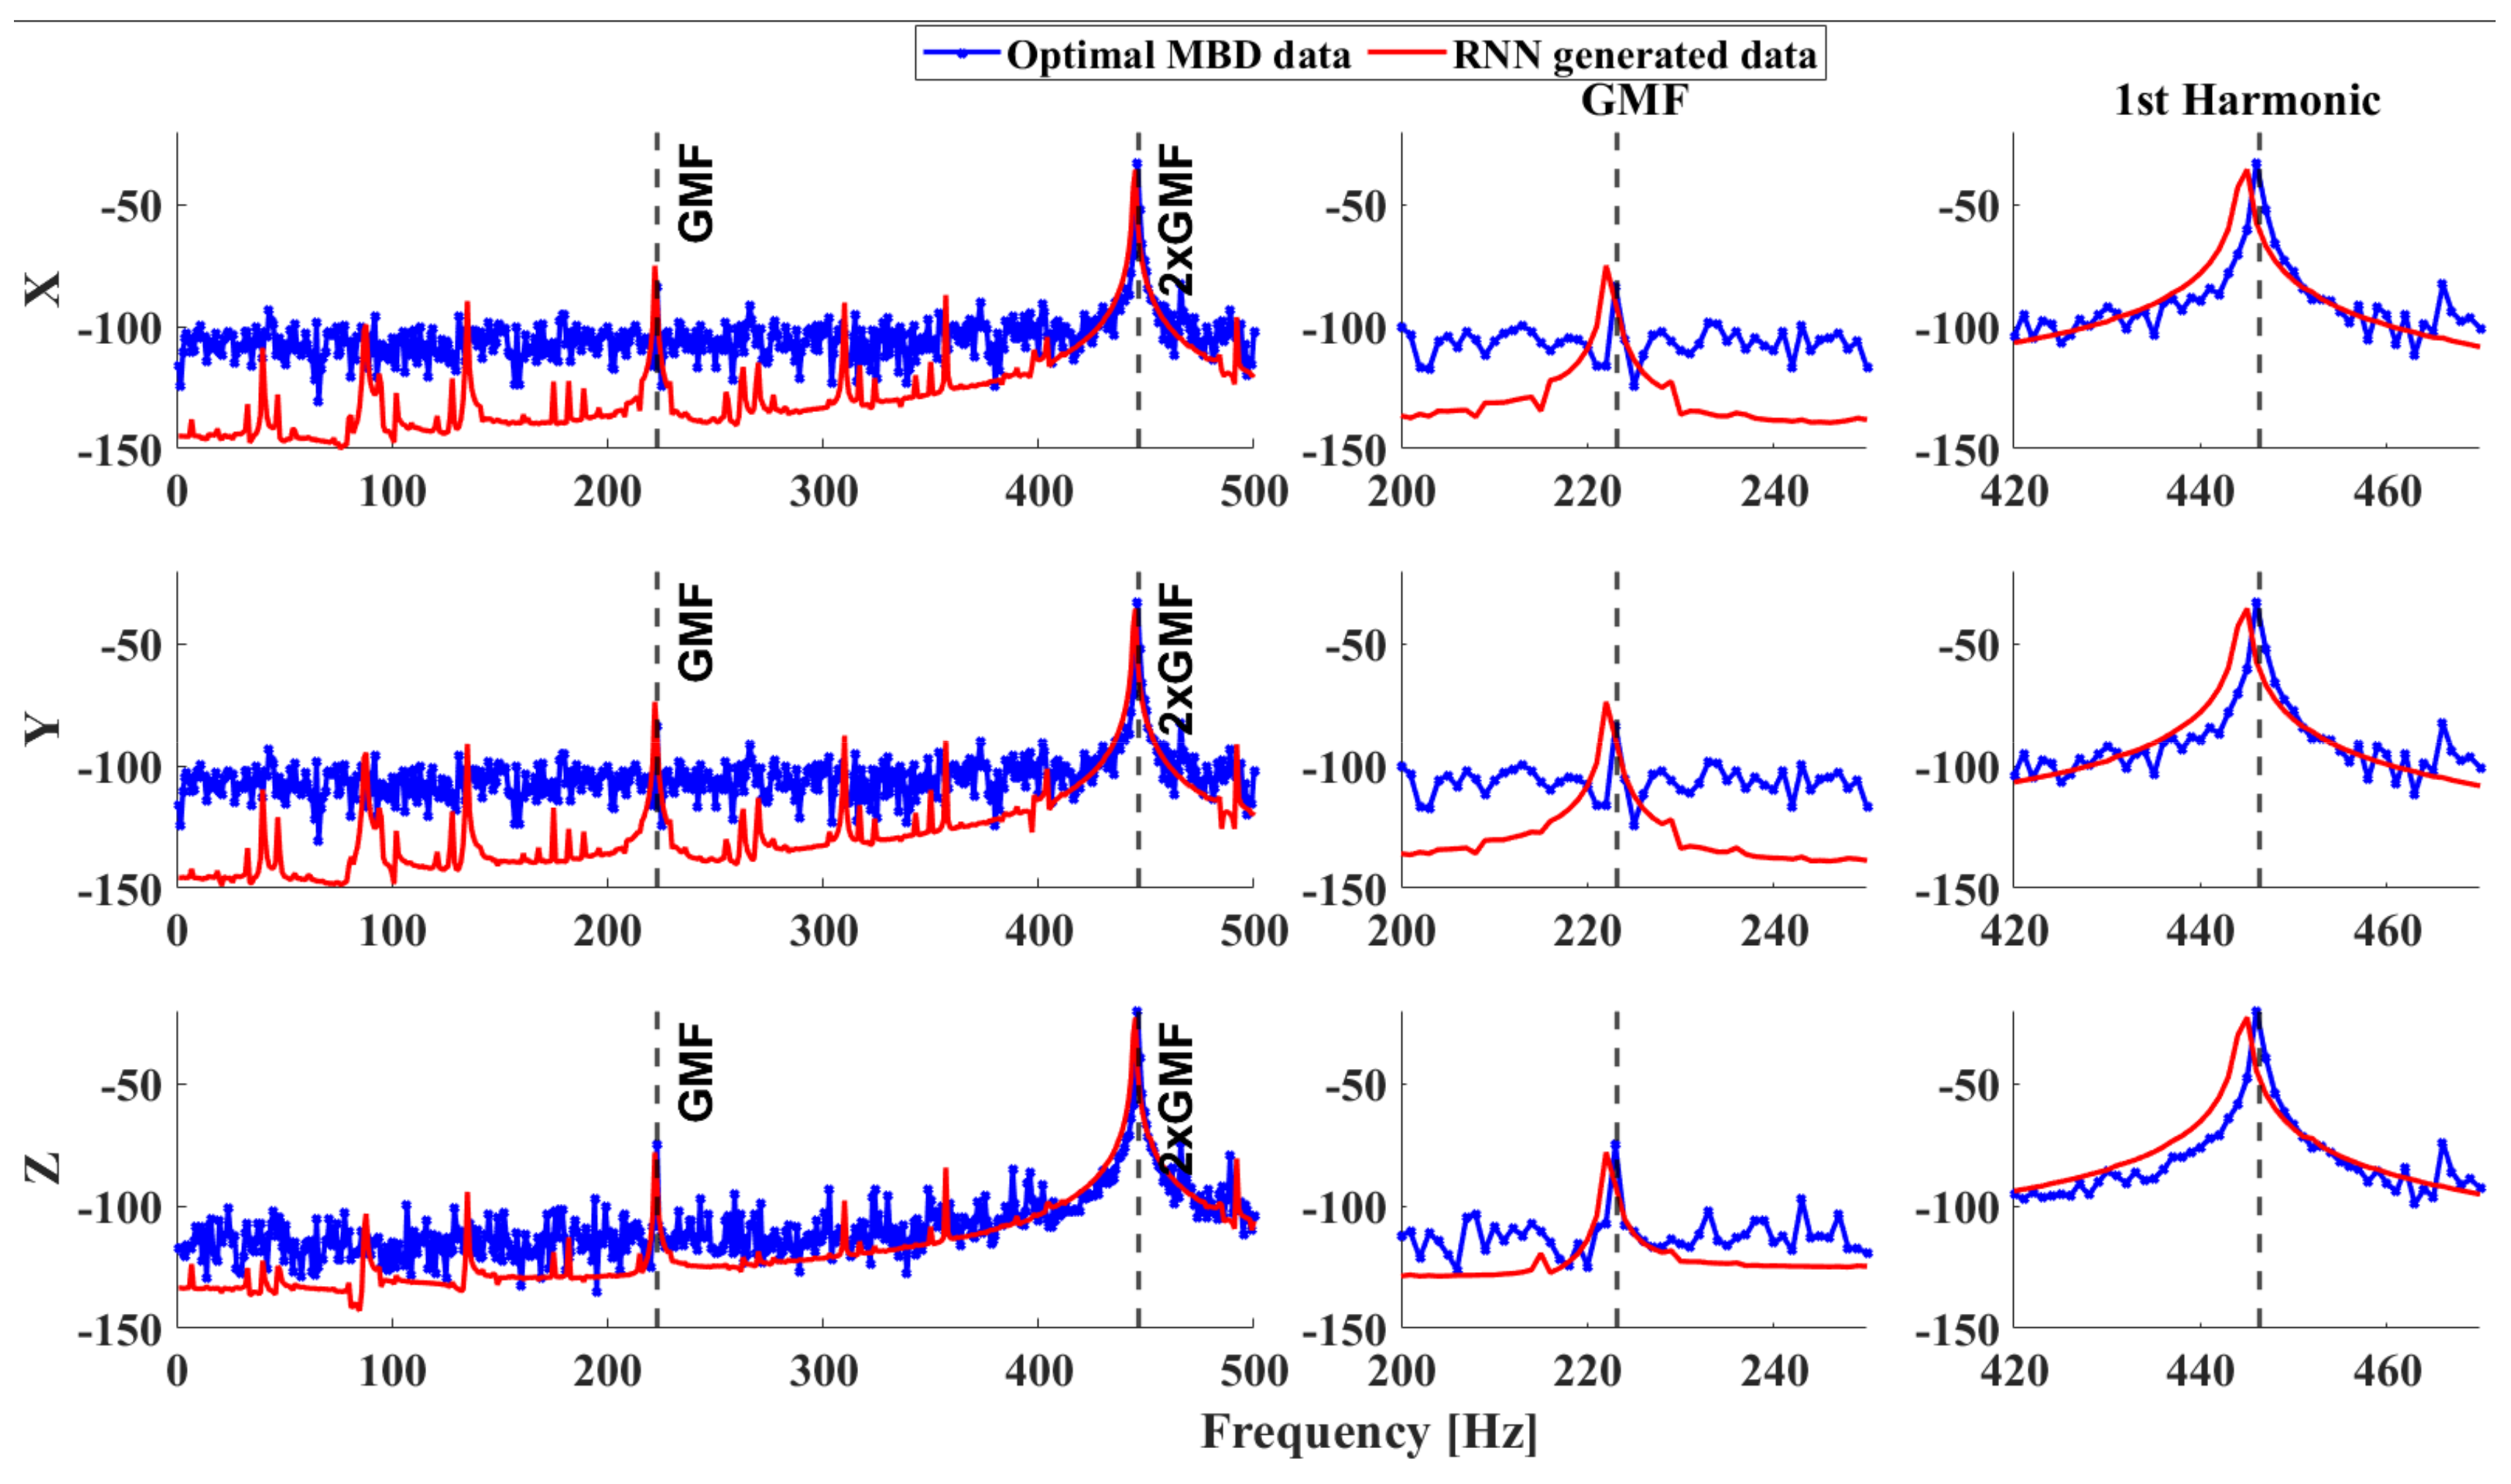
Figure 14.
Residuals between the Optimal MBD and RNN generated data—A8 location.

Figure 15.
MSE between the true and predicted response values produced by predicting directly on the test subset. Comparison of the MSE per channel (left) and box plot of the MSE per model (right).
Figure 15.
MSE between the true and predicted response values produced by predicting directly on the test subset. Comparison of the MSE per channel (left) and box plot of the MSE per model (right).
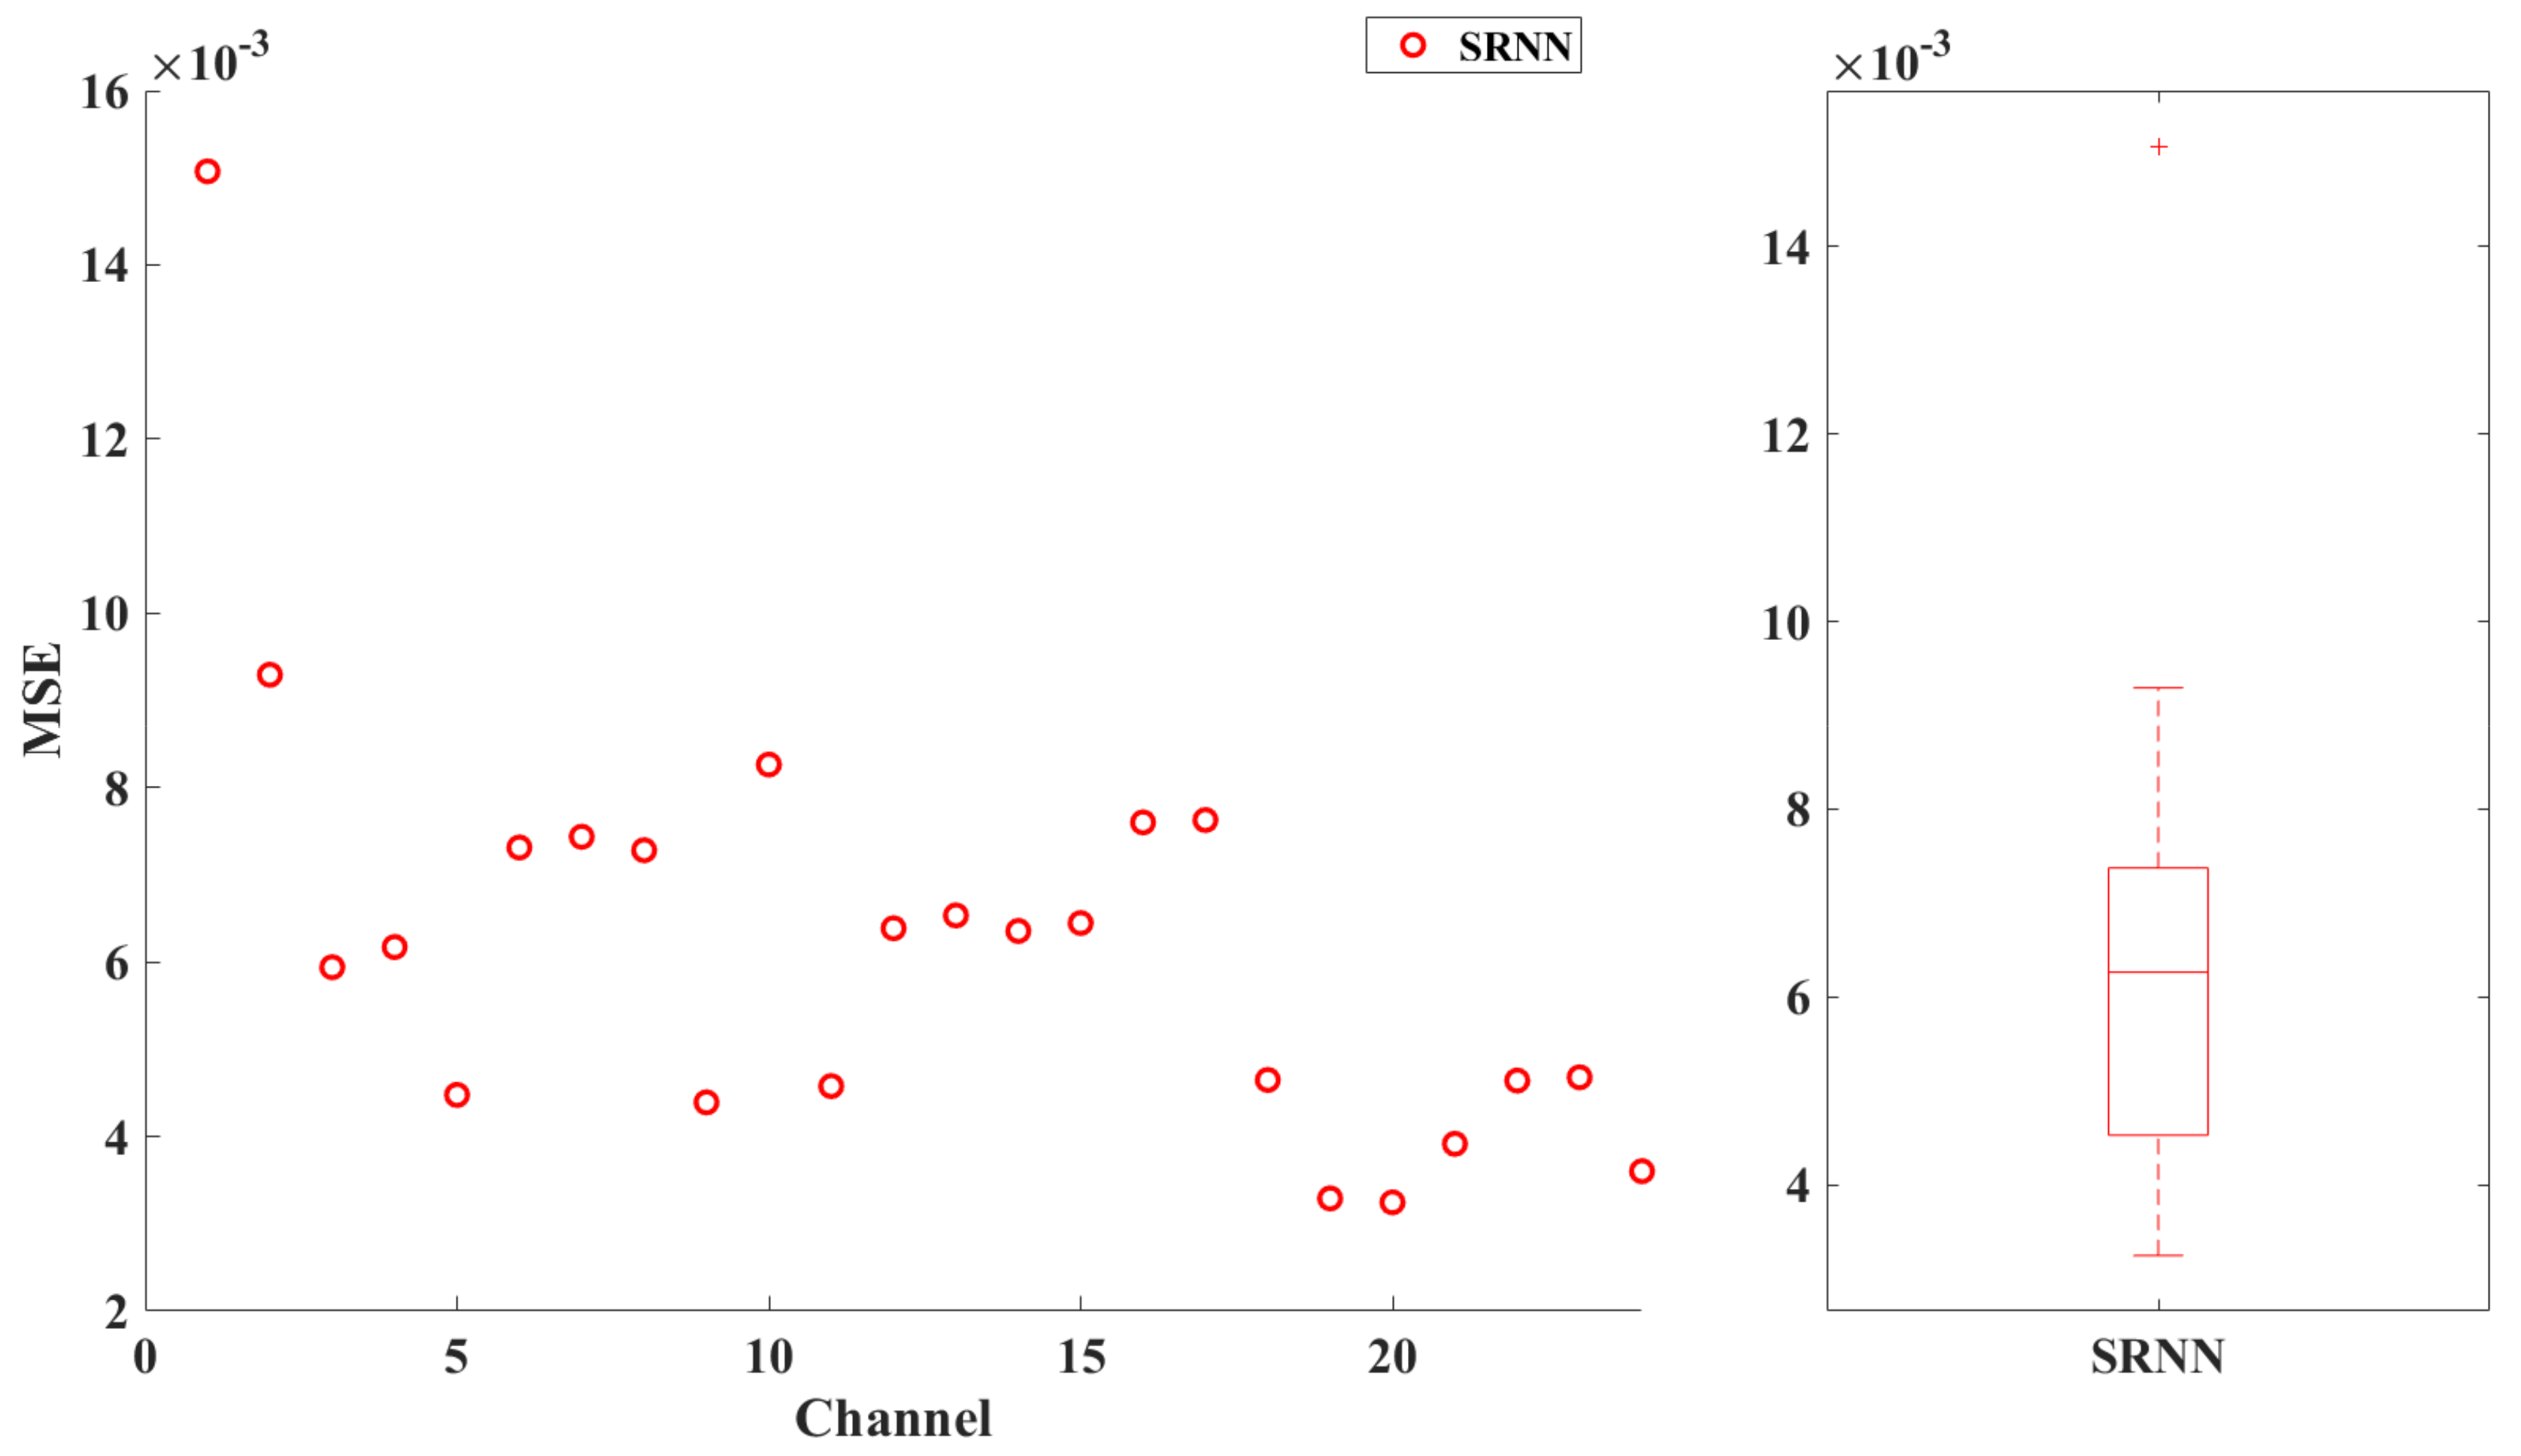
Figure 16.
Acceleration PSD comparison between the Optimal MBD and RNN generated data by predicting directly on the test subset—A8 location.
Figure 16.
Acceleration PSD comparison between the Optimal MBD and RNN generated data by predicting directly on the test subset—A8 location.
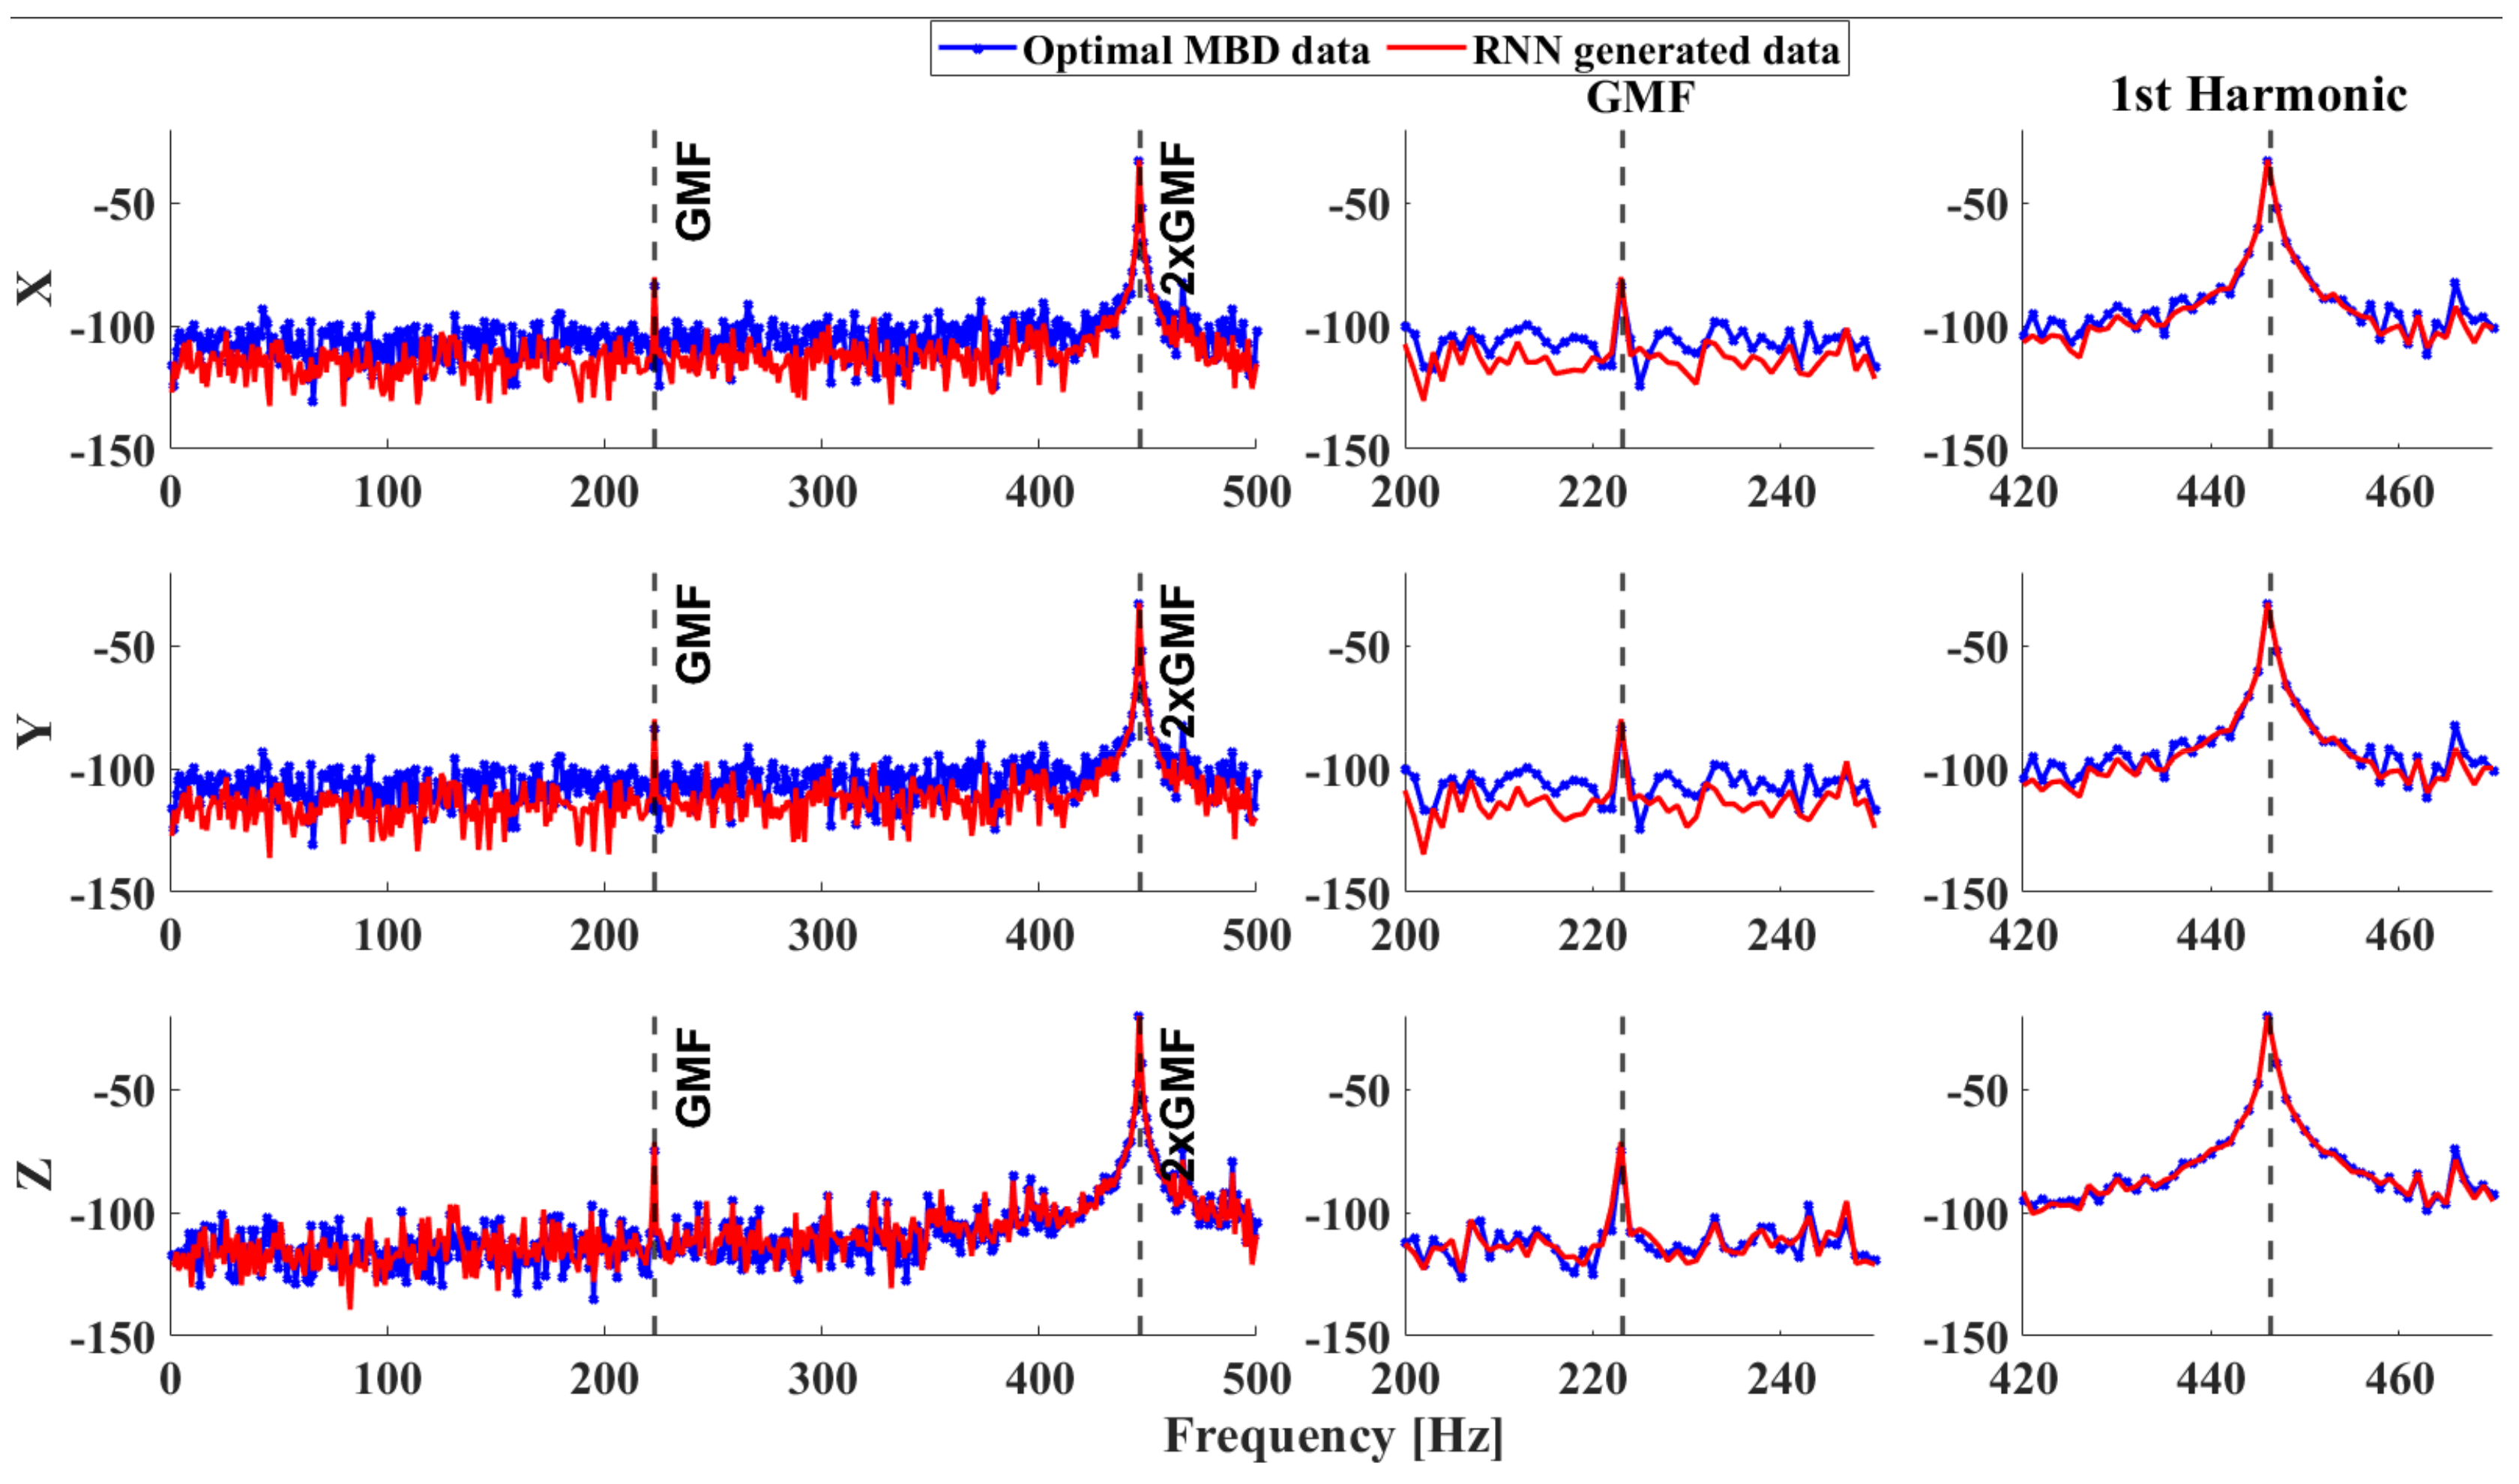
Figure 17.
Residuals between the Optimal MBD and RNN generated data by predicting directly on the test subset—A8 location.
Figure 17.
Residuals between the Optimal MBD and RNN generated data by predicting directly on the test subset—A8 location.


Table 1.
Gear and bearing characteristics.
| Gears | Teeth | Bearings | Rolling Elements | Rolling Element Diameter | Pitch Diameter |
|---|---|---|---|---|---|
| Sun | 28 | SKF No. 6200 | 8 | 4.762 | 20 |
| Planets | 36 | SKF No. 6800 | 10 | 2.381 | 14.5 |
| Ring gear | 100 | SKF ER-16K | 9 | 7.937 | 38.5 |
| Inlet gear | 29 | ||||
| Middle gear 1 | 100 | ||||
| Middle gear 2 | 36 | ||||
| Outlet gear | 90 | ||||
The contact angle is zero for all bearings.
Table 2.
Contact force parameters.
| Parameter | Two-Stage Gearbox (Contacts 1, 2) | Planetary Gearbox (Contacts 3–10) |
|---|---|---|
| [] | 3.4 × 10⁵ | 1 × 10⁶ |
| [] | 7 | 3.6 |
| [] | 4.7 × 10⁻³ | 6 × 10⁻³ |
| [-] | 2 | 2.2 |
| [-] | 0.15 | 0.15 |
| [-] | 0.081 | 0.081 |
Table 3.
RNN model structures.
| Model | Layer | Activation | No Units/Rate | Output Shape |
|---|---|---|---|---|
| SRNN | SRNN | tanh | 16 | [-,16] |
| Dropout | - | 0.05 | [-,16] | |
| Dense | LeakyReLU | 64 | [-,64] | |
| Dense | LeakyReLU | 64 | [-,64] | |
| Dense | tanh | 24 | [-,24] | |
| LSTM | LSTM | tanh | 16 | [-,16] |
| Dropout | - | 0.05 | [-,16] | |
| Dense | LeakyReLU | 64 | [-,64] | |
| Dense | LeakyReLU | 64 | [-,64] | |
| Dense | tanh | 24 | [-,24] | |
| GRU | GRU | tanh | 16 | [-,16] |
| Dropout | - | 0.05 | [-,16] | |
| Dense | LeakyReLU | 64 | [-,64] | |
| Dense | LeakyReLU | 32 | [-,32] | |
| Dense | tanh | 24 | [-,24] |
Table 4.
GMF frequencies of the planetary and two-stage system as 612 RPM.
| Two-Stage—f1 | Two-Stage—f2 | Planetary—f3 |
|---|---|---|
| 23.251 | 64.442 | 223.125 |
Table 5.
Average residual error for channels 1–24.
| Ch. | Avg. Error [dB] | Avg. Error [%] | GMF Avg. Error [%] | Ch. | Avg. Error [dB] | Avg. Error [%] | GMF Avg. Error [%] |
|---|---|---|---|---|---|---|---|
| 1 | 30.89 | 31.52 | 2.51 | 13 | 20.56 | 20.20 | 4.05 |
| 2 | 27.83 | 28.27 | 3.25 | 14 | 20.39 | 20.39 | 5.78 |
| 3 | 20.93 | 20.44 | 6.35 | 15 | 20.38 | 20.37 | 5.88 |
| 4 | 21.33 | 20.90 | 5.91 | 16 | 22.23 | 22.29 | 5.85 |
| 5 | 20.86 | 19.92 | 7.69 | 17 | 43.34 | 43.23 | 15.72 |
| 6 | 25.02 | 25.23 | 8.29 | 18 | 40.85 | 39.56 | 25.86 |
| 7 | 25.26 | 25.47 | 7.87 | 19 | 16.33 | 15.069 | 1.82 |
| 8 | 25.90 | 25.99 | 8.87 | 20 | 11.61 | 10.61 | 0.08 |
| 9 | 40.371 | 38.73 | 21.16 | 21 | 8.15 | 7.56 | 2.27 |
| 10 | 46.81 | 45.87 | 2.97 | 22 | 22.29 | 21.36 | 9.13 |
| 11 | 17.69 | 16.95 | 4.32 | 23 | 21.96 | 21.05 | 10.46 |
| 12 | 21.65 | 21.37 | 4.07 | 24 | 8.69 | 8.03 | 2.44 |
Table 6.
Average residual error for channels 1–24 produced by predicting directly on the test subset.
Table 6.
Average residual error for channels 1–24 produced by predicting directly on the test subset.
| Ch. | Avg. Error [dB] | Avg. Error [%] | GMF Avg. Error [%] | Ch. | Avg. Error [dB] | Avg. Error [%] | GMF Avg. Error [%] |
|---|---|---|---|---|---|---|---|
| 1 | 11.54 | 12.05 | 0.61 | 13 | 4.85 | 4.95 | 0.36 |
| 2 | 9.26 | 9.59 | 0.25 | 14 | 4.30 | 4.48 | 1.40 |
| 3 | 3.93 | 4.03 | 0.35 | 15 | 4.35 | 4.53 | 1.49 |
| 4 | 4.28 | 4.39 | 0.10 | 16 | 5.37 | 5.58 | 1.78 |
| 5 | 3.58 | 3.61 | 0.68 | 17 | 11.84 | 11.93 | 0.48 |
| 6 | 6.89 | 7.07 | 1.88 | 18 | 8.80 | 8.64 | 4.60 |
| 7 | 6.73 | 6.91 | 1.65 | 19 | 4.21 | 3.98 | 1.02 |
| 8 | 7.24 | 7.40 | 0.91 | 20 | 2.76 | 2.63 | 2.30 |
| 9 | 10.16 | 9.83 | 7.49 | 21 | 0.06 | 0.17 | 3.06 |
| 10 | 18.73 | 18.54 | 8.75 | 22 | 7.18 | 6.98 | 0.66 |
| 11 | 3.04 | 3.10 | 0.26 | 23 | 7.33 | 7.12 | 1.22 |
| 12 | 5.46 | 5.54 | 0.35 | 24 | 0.18 | 0.02 | 4.19 |
Disclaimer/Publisher’s Note: The statements, opinions and data contained in all publications are solely those of the individual author(s) and contributor(s) and not of MDPI and/or the editor(s). MDPI and/or the editor(s) disclaim responsibility for any injury to people or property resulting from any ideas, methods, instructions or products referred to in the content. |
© 2023 by the authors. Licensee MDPI, Basel, Switzerland. This article is an open access article distributed under the terms and conditions of the Creative Commons Attribution (CC BY) license (https://creativecommons.org/licenses/by/4.0/).
Share and Cite
MDPI and ACS Style
Koutsoupakis, J.; Giagopoulos, D. Drivetrain Response Prediction Using AI-Based Surrogate and Multibody Dynamics Model. Machines 2023, 11, 514. https://doi.org/10.3390/machines11050514
AMA Style
Koutsoupakis J, Giagopoulos D. Drivetrain Response Prediction Using AI-Based Surrogate and Multibody Dynamics Model. Machines. 2023; 11(5):514. https://doi.org/10.3390/machines11050514
Chicago/Turabian StyleKoutsoupakis, Josef, and Dimitrios Giagopoulos. 2023. "Drivetrain Response Prediction Using AI-Based Surrogate and Multibody Dynamics Model" Machines 11, no. 5: 514. https://doi.org/10.3390/machines11050514
Note that from the first issue of 2016, this journal uses article numbers instead of page numbers. See further details here.