1. Introduction
The efficacy of ultraviolet C-band germicidal irradiation (UV-C, 200–280 nm) against bacteria, viruses, and fungi has been well established since the 20th century thanks to the availability of mercury lamps [
1]. However, mercury lamps have limitations (e.g., slowness in reaching steady-state radiative power after ignition, significant drop in emitted radiative power over time, considerable fragility, and bulkiness) that can reduce the effectiveness of irradiation and make their use uneasy. Moreover, according to the United Nations Environment Programme, the production of mercury-containing products after 2020 is banned [
2]. In this regard, the availability of solid-state UV-C sources such as LEDs offers a viable alternative to mercury lamps, because their characteristics make them competitive with lamps in several applications of practical interest besides surface sanitization [
2,
3,
4,
5,
6,
7]. A comprehensive review of the scientific literature regarding air sanitization and surfaces disinfection is described in [
2,
3]. The mechanism of microbial inactivation by UV light is shown in [
4], while [
5] presents an overview of the UV LED technology inherent in the water photodisinfection, with a comparison between the effects of the different wavelength ranges (UV-A, UV-B, and UV-C). According to the paper, the UV-C is better suited to damage DNA and RNA while longer wavelengths are useful to prevent cells from self-repairing. This result is also confirmed by [
6], which examines the advantages of using UV-C LEDs for the disinfection of the Coronavirus. The light distribution is also an important parameter, because it may influence the irradiation results [
5]. Finally, some applications of UV-C LEDs in the food industry are described in [
7].
However, the difficult thermal management and resulting poor long-term stability of UV-C emission may limit their use. Measuring the temperature of the p-n junction of the LEDs is crucial to prevent their performance degradation [
8], and an effective cooling system is needed to avoid excessive temperature rise [
9]. The board material, the number of installed sources, their configuration, and the distances between them influence the LEDs temperature [
10]. Therefore, a correct design must take into account several parameters.
In particular, a good illumination uniformity can be achieved by using many sources close to each other, but this leads to a high power density which implies tight temperature control.
Here, we present the electrical and optical design, thermal management and experimental characterization of two compact arrays of UV-C LEDs, achieving long-lasting irradiations without appreciable deterioration in UV-C emission. We have tested their performance in half a day of irradiation (4 h of effective lighting), such as to activate hormesis in plants and fruits, i.e., biosynthesis of defensive metabolites that enhance the plant’s resistance to any pathogen attack.
These LED arrays, equipped with automatic controls, could be used on mobile robots in the open field to improve plant resistance to pathogens, as a sustainable alternative to pesticides which harm plants and the environment [
11,
12], and also for achieving rapid sanitization of surfaces from viruses.
2. Materials and Methods
2.1. Optical Design
In order to size the LEDs array properly, we first estimated the UV-C dose able to generate a hormetic effect in plants and fruits. The published results are often dissimilar, due to different experimental conditions, e.g., the specific plant, the pathogen, infection degree, time and methods for final infection evaluation, and UV-C wavelength [
11,
12,
13,
14]. Finally, we assessed an average of 300 J·m
−2 as the minimum dose required to achieve a hormetic effect in the wavelength range of 270–280 nm. Selecting the exposure time in the range of 3–30 s, which is short enough for rapid treatment of crops, the UV-C intensity on the target needs to be in the range of 10–100 W·m
−2. Based on the literature [
15], the same UV-C intensity range is also capable of achieving a 3-log reduction in the active concentration of most viruses, including SARS-CoV-2, in a relatively short exposure time of 1–10 s [
3,
4].
We have chosen the Luminus XBT-3535-UV LED [
16] which emits 35 mW at 275–280 nm when supplied with a current of 0.35 A, with a minimum forward voltage of 6.5 V. The wide 130° emission angle on the one hand greatly reduces the intensity with the distance from the LED, and on the other hand shortens the minimum distance to achieve a good uniformity of the intensity spatial distribution emitted by an array of LEDs. Consequently, these LEDs are particularly suitable for irradiances with high spatial uniformity in the near-field—that is, at a relatively short distance. For the definition of near- and far-field in the case of LED arrays, see, for example, [
17].
2.2. Simulation Code
To design an LEDs array optimized for 10–100 W·m−2 irradiances in the near-field, we need a ray-tracing code that can calculate, point by point, the distribution of the power density provided by a generic light source on a plane at any distance. Rather than using commercial software that are expensive, stiff, and focused on the design of general-purpose optical systems, we developed a dedicated software so as to minimize the required variables, enter only the LED device characteristics, and streamline the output of the calculation to the parameters of our interest.
The code requires as input data the radiation power and angular distribution emitted by the single source, the geometry of the multiple source array (x, y, z coordinates and tilt angles to the z-axis of each source), the distance along z of the target plane where the intensity is calculated, and the size of the output window. LEDs can be arranged in any configuration, not necessarily symmetrical, nor necessarily in the same plane. The normal to the surface of each LED can be oriented in any direction relative to the z-axis. The angular distribution of UV-C intensity of the single LED can be provided by a mathematical formula or by manually entering the relative distribution values, and thus, it can have any shape; the radiant flux can differ from LED to LED; the code can handle the presence of a diffractive and/or absorbing element such as a plate or a grid between the source and the target and can calculate the released dose point by point even in the case of relative motion, at a constant velocity, between the source and target plane, as long as they are kept parallel to each other. This feature is particularly useful when the LED lamp is used on a conveyor to illuminate moving objects. Finally, output data can be provided at any value of z both numerically and graphically, with average profiles along the x- and y-axes in the target plane and with a top view, grayscale, or false-color representation. It is also possible to obtain the 3D-intensity result using a proper viewer.
Figure 1 shows the block diagram of the main algorithm of the ray-tracing code and some screenshots of the software user interface and typical outputs.
The software is written in Visual C++ in the Windows 11 operating environment. As shown in the next sections, it provides results in excellent agreement with experimental data and can be used to test the performance of LED arrays optimized for specific applications. Although this software does not currently provide an automatic method for optimizing the uniformity or intensity on a plane, as for example in [
18,
19], it has some advantages: it allows to arrange any desired configuration of LEDs; it takes into account only the key parameters of the array, so that manual optimization is sped up; and its source code can be easily modified and adapted if other needs arise.
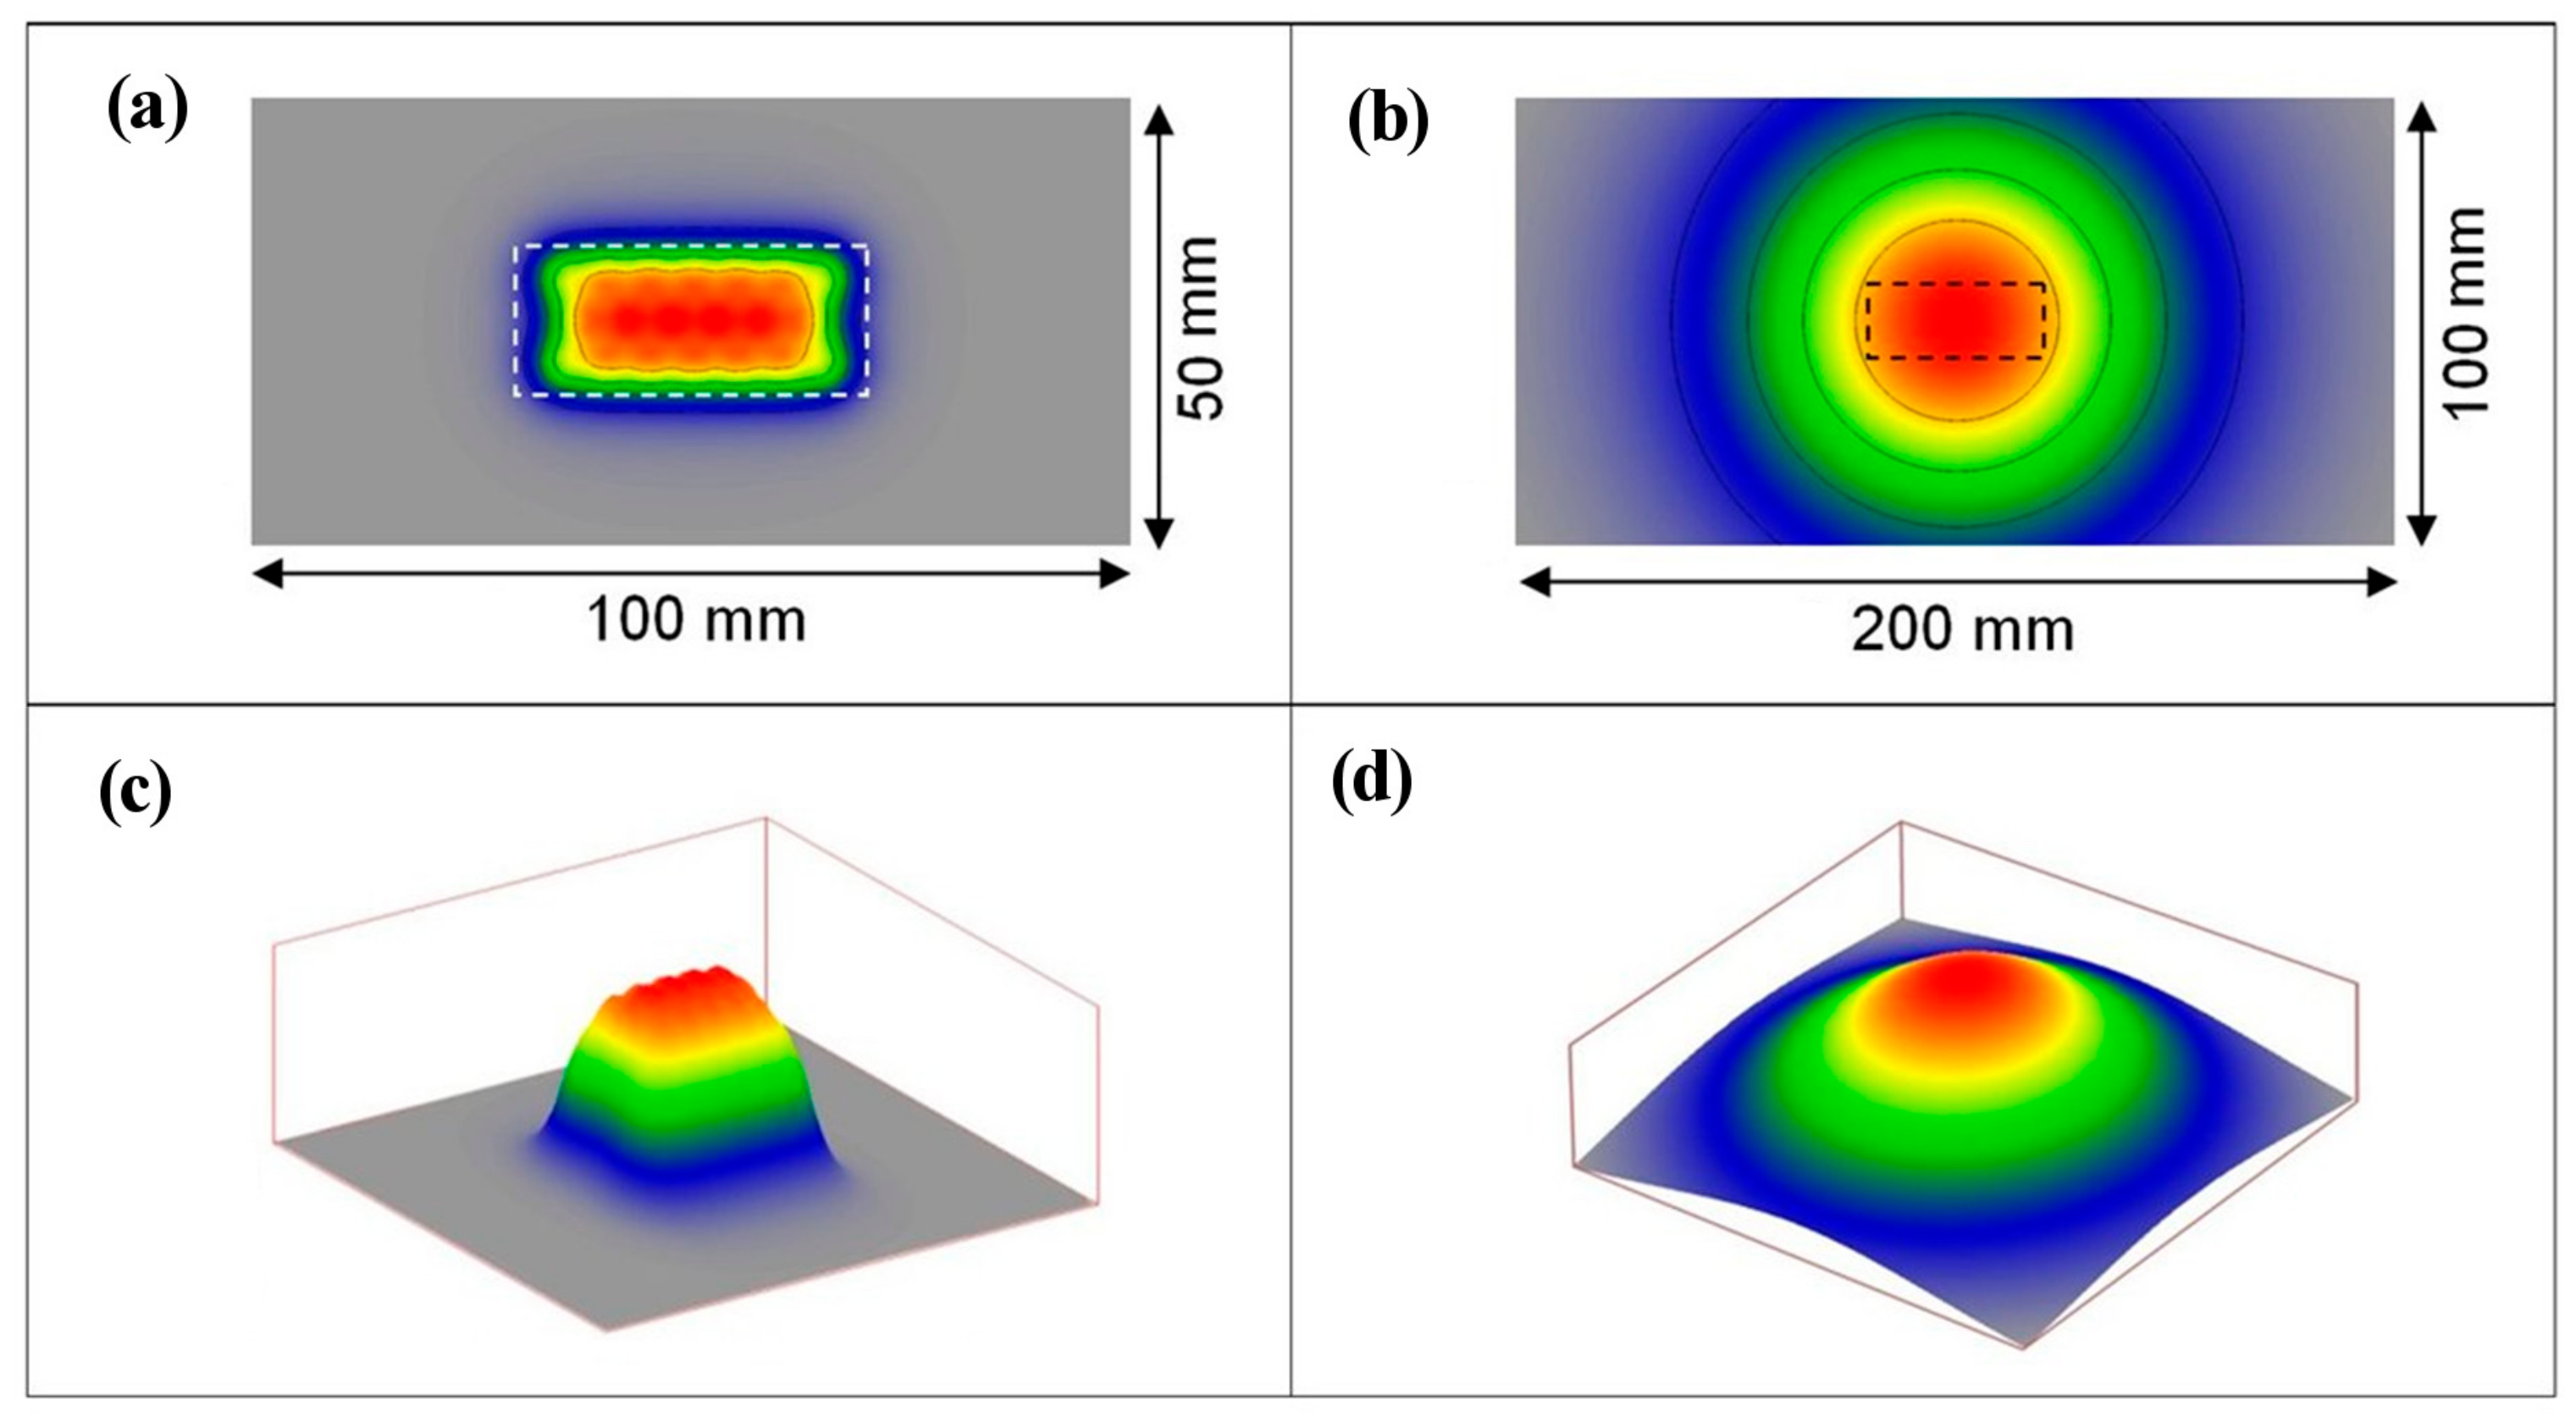
The final goal was to realize two arrays: one capable to deliver an intensity of at least 100 W/m2 over an area of 80 × 80 mm2 at a distance of 50 mm, suitable for irradiations from a few millimeters up to several centimeters distances; and the other capable to deliver an intensity of at least 70 W/m2 under the same conditions. A common requirement was to reduce the size of the devices into a compact box containing the printed circuit board (PCB), the temperature probe, and the air-cooling system.
Based on the results of the code, we assembled two planar LED arrays with, respectively, 38 (array A) and 20 (array B) LEDs, each mounted on an aluminum PCB. The spacing between LEDs in array A is 6.5 mm and 7 mm in array B (see
Figure 2).
2.3. Power Supply Design
Each array is powered by a single 48 V constant current power supply. The power supplies of arrays A and B drive six and three electrical lines respectively, each of which delivers 0.35 A to groups of 5 to 7 LEDs.
Due to the low electrical-to-radiation conversion efficiency, the LEDs experience a temperature rise that may alter the junction voltage and consequently decrease the emitted radiation. However, if the LED driver circuit delivers a constant current, the decrease in light output due to the change in junction voltage is significantly limited [
20]. To fine-tune the current and ensure that it remains constant, we used the LM324 integrated circuit equipped with 4 rail-to-rail type operational amplifiers in combination with a TIP122 Darlington transistor.
For safety reasons, the time interval in which the LED array remains on must be predetermined, unintentional switch-on must be prevented, and an emergency stop button must be provided. To this end, the circuit included the ATMEGA328P microcontroller, the MIC2982 integrated circuit acting as an electronic switch (
Figure 3), and a suitable user interface allowing to select the duration of power on and standby before power on. The control circuit is designed to allow the emitted UV-C power to be varied from 0 to 1.4 W or 0.8 W for arrays A and B, respectively, making them adaptable to the needs of different requirements.
2.4. Thermal Management
More than 97% of the UV-C LEDs’ input power is converted into thermal energy. In our case, the 38-LEDs array A consumes about 100 W of electrical power, of which 97 W is dissipated in heat. Thus, the nominal heat flux of array A is 32 kW·m
−2, necessitating thermal management to avoid the deterioration of optical performance (e.g., reduction in emitted power and shift in peak wavelength) as temperature increases [
16].
Peltier-effect thermoelectric coolers and water coolers enable relatively good thermal management of LED arrays but at the expense of complexity and equipment footprint. Another answer to the heat dissipation problem is to increase the spacing among LEDs, but this crude solution reduces the number of LEDs per unit area, thus limiting the total light output intensity. To maintain high UV-C radiant emittance from a compact array with a simple equipment, we have chosen to mitigate the thermal problem with a fan-integrated pin fin heat sink [
21] on the back of the PCB (see
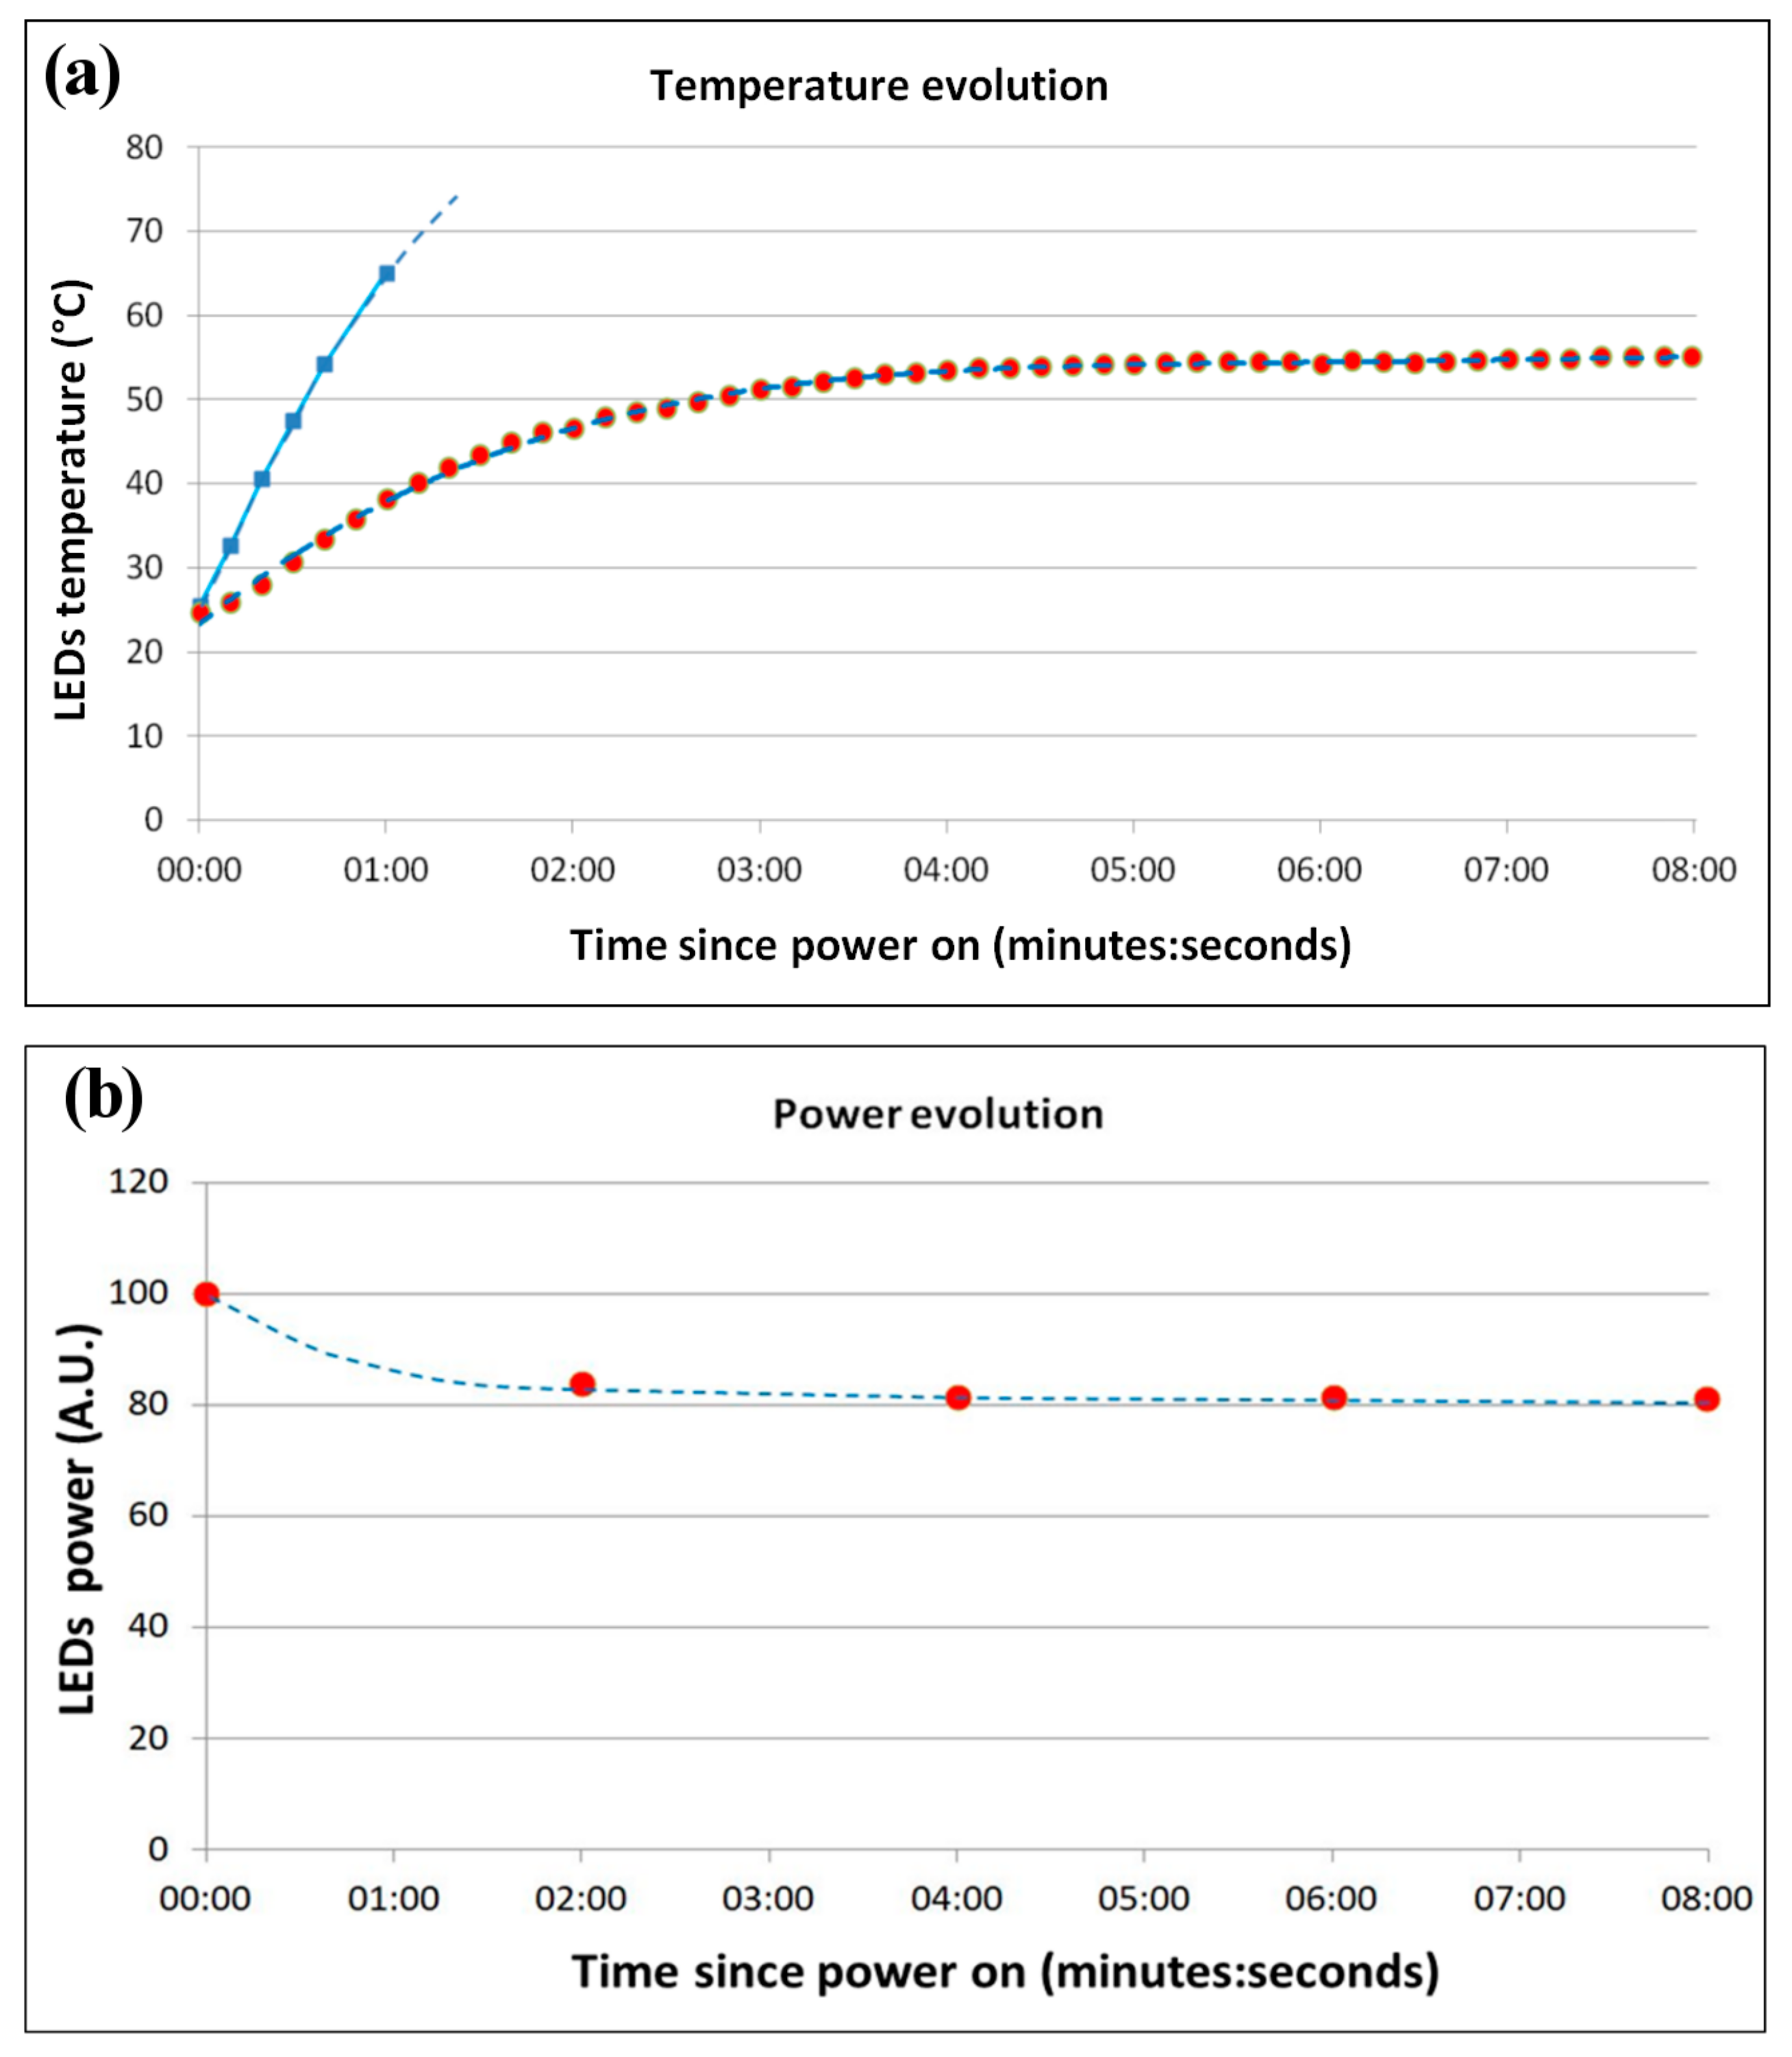
Figure 2), incorporating a 3 mm thick Al plate as a heat reservoir. A thin layer of thermal grease interposed between the interfaces increases the contact areas, thus accelerating heat transfer. Temperature measurements with and without the Al plate and/or heat sink made by two thermistors soldered on the LED boards (on array A) and by a DS18B20 digital probe (on array B) have shown that this solution is effective in reducing the temperature gradient vs. time, thus limiting the power decay of the LEDs due to the temperature increase; see, e.g.,
Figure 4, where a comparison between using or not using the pin-fin heat sink is shown.
In the case of the array A, where the power density of the PCB is rather burdensome, a further limitation to temperature rise can be offered by the operation in bursts, with a duty cycle of, e.g., 50%. As an example,
Figure 5 shows the thermistors’ response during the operation of 38-LEDs array A for a 15-cycles run (2-s-on/2-s-off). When the power is turned off, the temperature drops, and the array is ready to restart for another run. At the end of the 15 cycles, the UV-C emitted power is above 94% of the initial power.
2.5. Optical Measurements
The spectrum emitted by the LED arrays, as measured by the spectrometer [
22], is peaked at 276 ± 5 nm (FWHM).
In order to predict the intensity distribution of the LED arrays, we first measured the angular distribution of the UV-C power by rotating, with a step-motor, the single LED around a vertical axis lying on the LED emitting surface while keeping the photodetector stationary. Assuming that all LEDs emit the same power and have the same angular distribution, knowing both the position of each LED and the emission of a single LED, the simulation code provides the total power emitted by the array and its angular distribution.
Next, we experimentally verified the model results using a Si detector [
23] calibrated with a UV absolute power meter [
24]. The active area of 0.8 mm
2 of the detector ensured good spatial resolution of the measured intensity distribution.
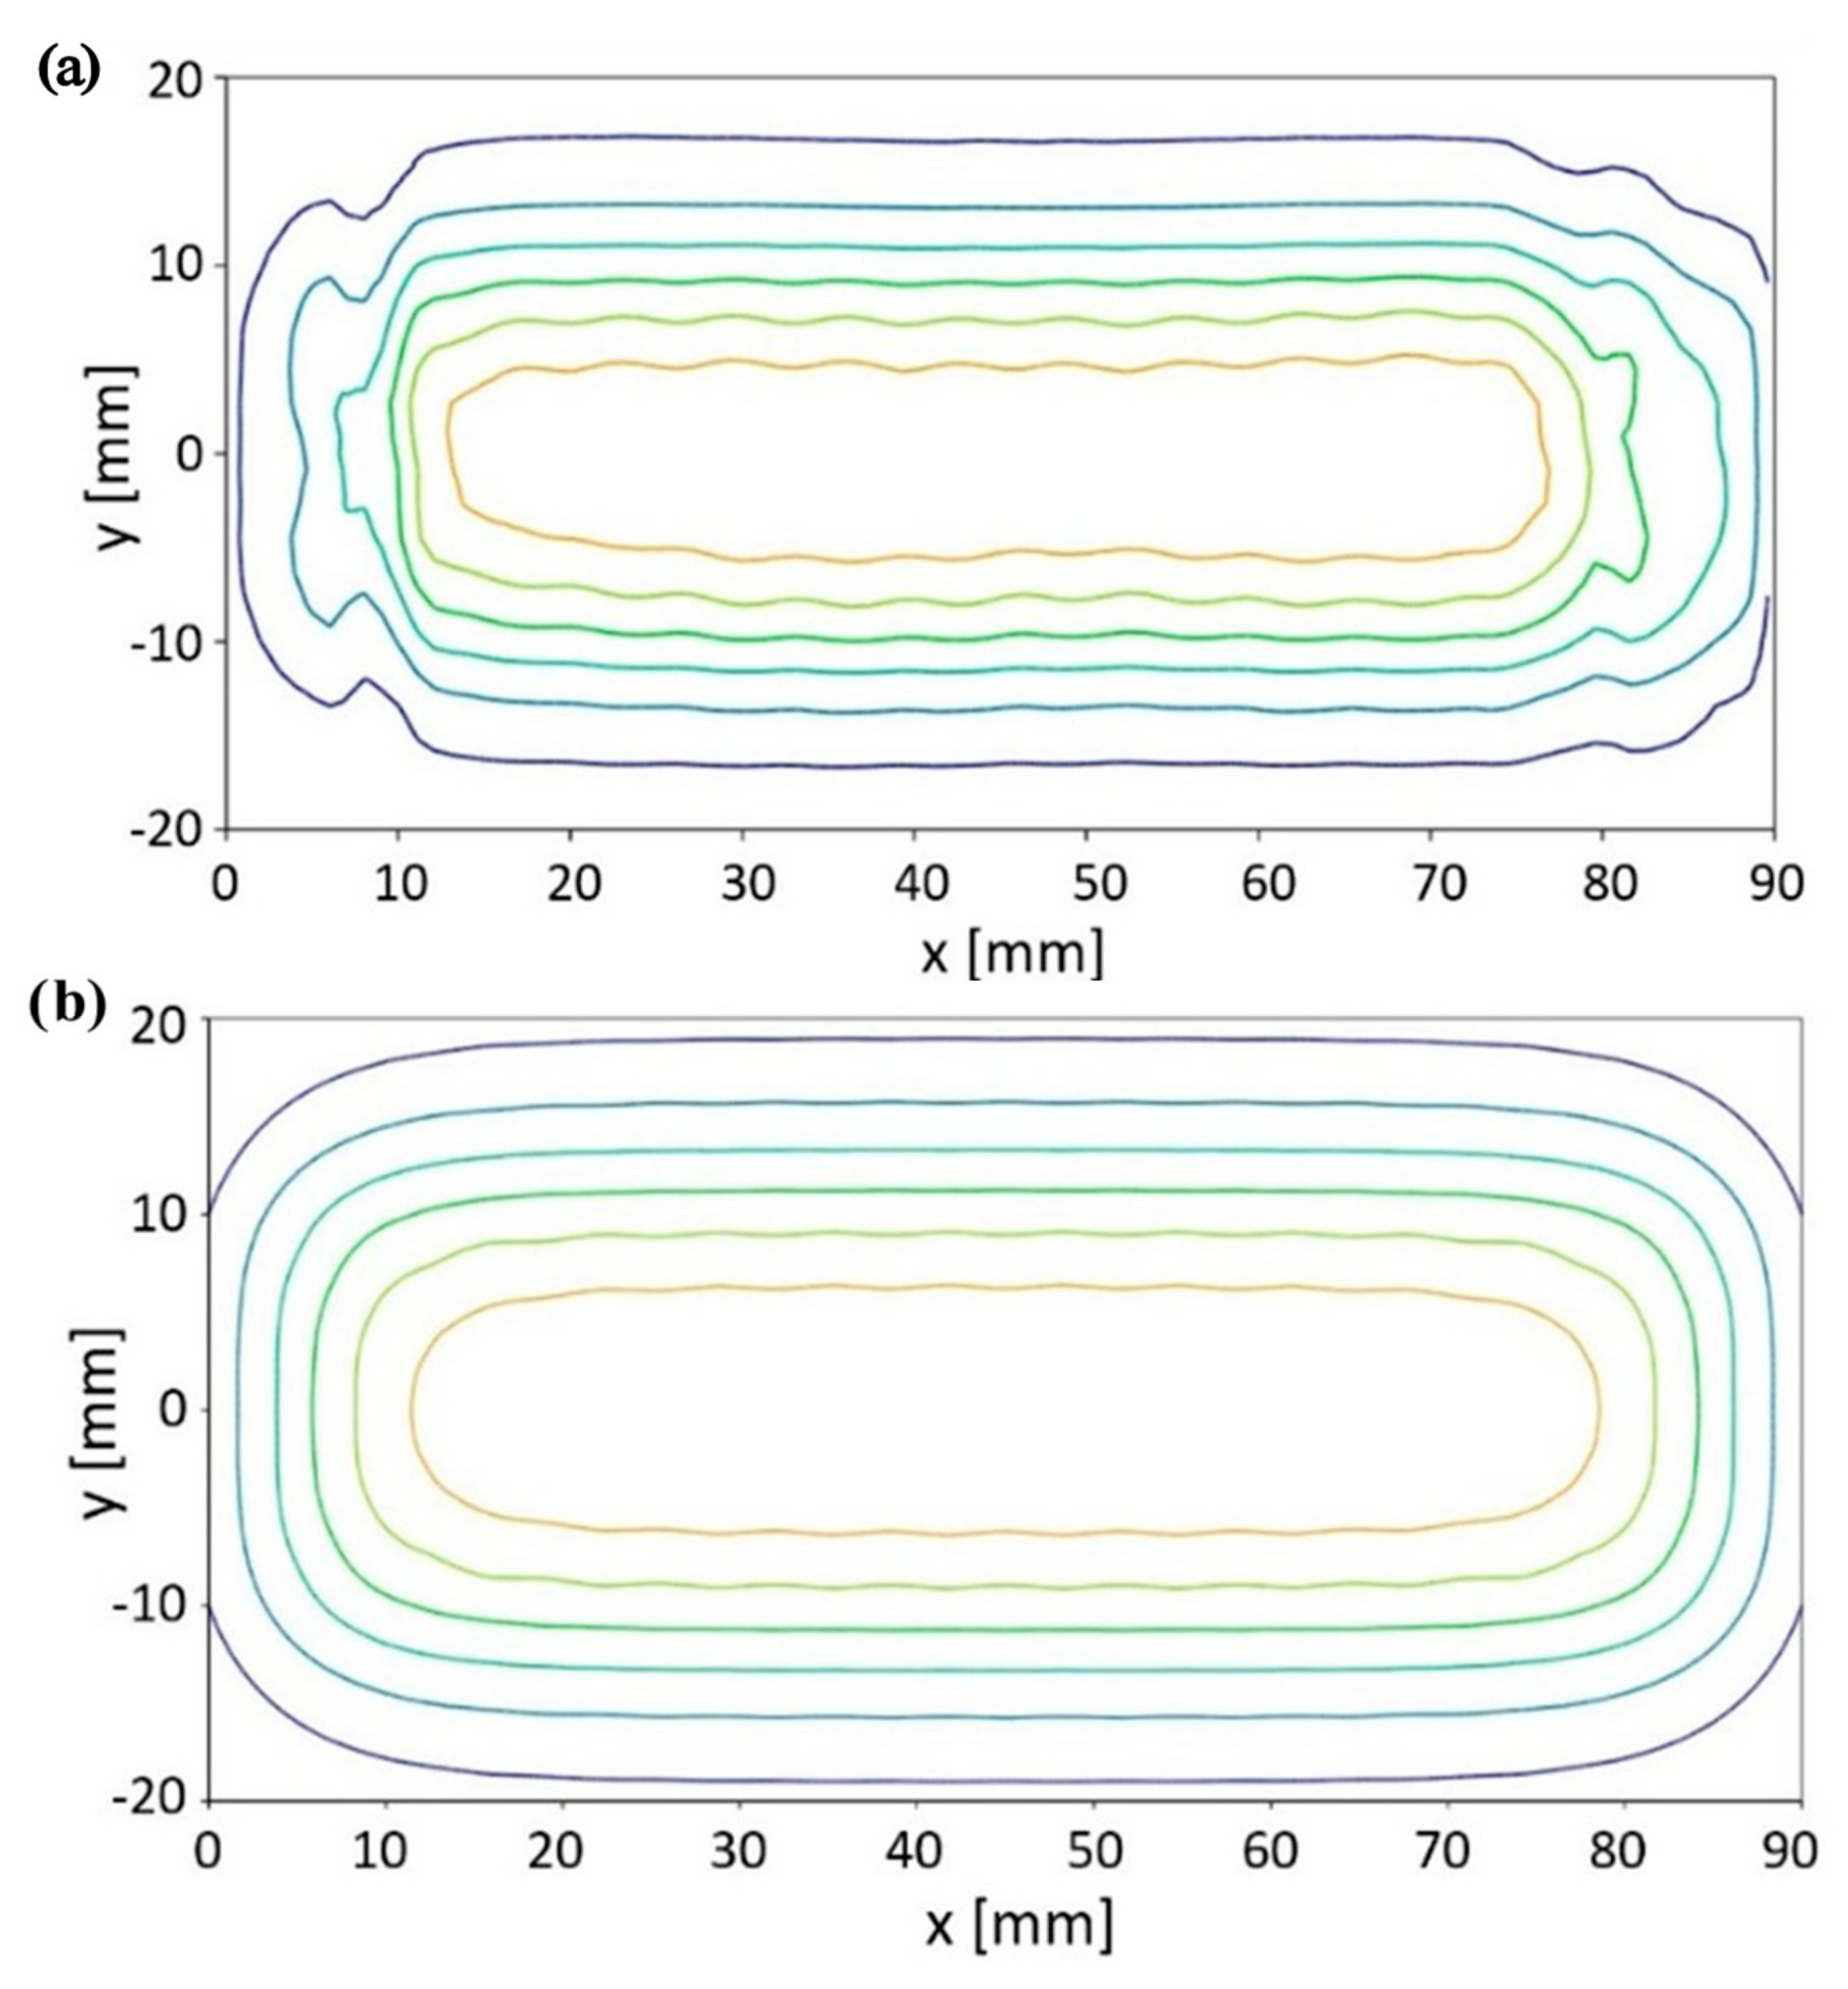
The intensity spatial distribution in the near-field has been measured using a remotely controlled 2-D scanning system [
25], which moved the photodetector along a plane parallel to the array surface at the fixed distance of 8.2 mm, as shown in
Figure 6.
The photodetector was moved along the x-direction at a predetermined speed, recording its signal on an oscilloscope. The x-scan was performed at different y-values spaced 2 mm apart. Two thin metal strips 74 mm apart provided a spatial reference for the beginning/end of the array along the x-direction. One of them is visible in
Figure 6.
In processing the experimental data, we took into account the initial acceleration and final deceleration of the linear scan when converting the oscilloscope time signal of photodetector into x-values.
The next section describes the results of this measurement.
4. Discussion
Irradiation of biological samples represents a severe test for the long-lasting operation of LED arrays, since it is necessary to consecutively irradiate dozens of targets with the same UV-C dose value to obtain sufficient statistical data to compensate for the intrinsic fluctuation in the biological response to the same dose.
A promising biological application of UV-C radiation is the irradiation of fruits and plants at hormetic doses, which stimulates the biosynthesis of defensive secondary metabolites with antimicrobial and antioxidant activity that helps them resist pathogen attack after irradiation [
11,
12,
13]. In practice, hormesis could help reduce the use of pesticides in agriculture.
We used both arrays A and B for these tests: the former to irradiate postharvest lemons, apples, and preharvest basil plants; and the latter to irradiate kiwi plants.
As an example, after near-field irradiation with a dose of 330 ± 30 J·m
−2 released in a time interval ranging from 3 to 14 s, lemons were exposed to the pathogen Penicillium digitatum, while apples and basil were infected by Botrytis cinerea. The results show a marked increase in resistance to inoculated pathogens compared with non-irradiated controls; see, e.g.,
Figure 10. In the case of basil, a dose of 300 ± 30 J·m
−2 induced hormetic metabolic changes as detected through fluorometric analysis [
26].
The effect of the UV-C irradiation on Kiwi plants by the array B are still in progress and will be presented in a paper we are currently drafting that will be devoted to the biological process of hormesis [
27]. Here, we wish to underline that the decrease in UV-C intensity after half a day of irradiation (4 h of effective exposure) was negligible. It is also worth mentioning that the number of total days of use of the arrays is of the order of several weeks, during a period greater than one year. The performance of these arrays has not shown any failures or decreases, so although this cannot be considered as a lifetime test, nevertheless it is an indication of a stable and reliable operation over the long term.
These results show that this compact UV-C LED source could be a viable alternative to fight crop pathogens in a sustainable way without the side effects of pesticides, such as soil, water, and air pollution.
Automatic devices for health monitoring of horticultural crops and UV light illumination of greenhouse plants [
28,
29] are a promising topic in the agriculture field. In the case of UV-C irradiation, however, mercury lamps are generally used which are bulky and fragile, and their emitted power drops rapidly, forcing operators to continuously vary the irradiation time to hold the delivered dose on the plants constant.
A robotic system equipped with a suitable LED array, capable of illuminating fruit trees in the field, based on the study reported here, is expected in the next future. In fact, the use of LEDs in field irradiations is facilitated by the availability of driverless, automated irradiation systems that currently use mercury lamps [
30], as the replacement of mercury lamps with arrays of LEDs is straightforward. All parameters of the irradiation machine (size, displacement velocity, etc.) remain essentially unchanged.
Similarly, the vast majority of pest control machines in the food industry [
31] that use mercury lamps can be easily implemented by replacing the lamps with appropriately sized LED arrays.
Finally, the preliminary results of fast inactivation of SARS-CoV-2 through irradiation with our arrays are also promising and will be presented elsewhere.
5. Conclusions
We illustrated the software-assisted design, implementation, and experimental validation of two compact LED arrays suitable for long-lasting near-field UV-C irradiation. The arrays respectively consist of 20 and 38 LEDs, both powered by constant current and with active and passive control systems; see
Figure 2 and
Figure 3. They emit maximum powers of 0.8 W and 1.4 W, respectively, at a wavelength of 276 ± 5 nm (FWHM). The LEDs driver circuit is designed to allow the emitted UV-C power to be varied so that the devices can be adapted to the needs of users. The total cost of the components of the prototype array B (
Figure 2), including the power supply, was about
$500, but a mass-produced version would cost much less.
The design characteristics of the arrays have been confirmed through experimental measurements, and the results are in very good agreement with a novel, dedicated simulation software, which has shown to be a powerful tool for designing arrays optimized for specific applications.
The control of the temperature, by means of the combination of a fan-integrated pin-fin heat sink and a 3 mm thick Al plate, allowed an effective thermal management of the heat flux of 32 kW·m−2, keeping the temperature of the LEDs below 40 °C even for half a day of irradiation, demonstrating that it is possible to compact a 0.8 W (array B) and 1.4 W (array A) UV-C continuous light source, with good uniformity of light distribution, in a box of just 100 × 3 × 2 cm³.
The arrays have been used for successfully generating the hormesis effect in apples, lemons, basil, and kiwi. A UV-C dose of 300 J·m
−2 released on fruits and vegetables elicited metabolites that inhibited pathogen growth (
Figure 10). Details on the obtained results will be given in a forthcoming paper [
27]. As a result, preventive irradiation with our UV-C LED arrays can be used for integrated control of crop diseases, thereby reducing the pesticides amount used in intensive agriculture.
We are planning to use LED arrays on an already existing autonomous (driverless) robotic system by replacing its current mercury lamps [
29], making it capable of radiating UV-C light on plants in the open field and/or sanitizing surfaces or instruments in hostile environments.


 ,
, 


