
Using the AIDA Method in the Design of New Elements for the Photovoltaic Mounting Structures
by
 , ,
, ,
Vlad Andrei Ciubotariu
1 ,
,
Cosmin Constantin Grigoras
2,* ,
,
Valentin Zichil
2 and 
Bogdan Alexandru Chirita
1 1
Department of Industrial Systems Engineering and Management, “Vasile Alecsandri” University of Bacău, 157 Calea Mărășești, 600115 Bacău, Romania
2
Department of Engineering and Management, Mechatronics, “Vasile Alecsandri” University of Bacău, 157 Calea Mărășești, 600115 Bacău, Romania
*
Author to whom correspondence should be addressed.
Machines 2024, 12(3), 211; https://doi.org/10.3390/machines12030211
Submission received: 11 February 2024
/
Revised: 15 March 2024
/
Accepted: 18 March 2024
/
Published: 21 March 2024
(This article belongs to the Special Issue Selected Papers from OPROTEH 2023: 18th International Conference of Constructive Design and Technological Optimization in Machine Building)
Abstract
:To address diverse challenges and accelerate the adoption of PV technology, innovative and cost-effective PV assemblies are essential. The Analysis of Interconnected Decision Areas—the AIDA method—offers a promising approach to achieving this goal by providing a structured framework for identifying, assessing, and optimizing the design of PV assemblies. The aim is to demonstrate how AIDA can be effectively used to identify and assess potential improvements in PV assembly design, leading to the development of more efficient, cost-effective, and environmentally friendly PV systems. For this, out of 54 combinations, 10 of them were retained, so that in the end only two possible solutions obtained by applying AIDA remained. Both structures were assessed by applying FEM, analysing data regarding equivalent von Mises stresses and displacements but also the existence of stress hotspots. A design insight study was also carried out. Also, the models were first built by additive manufacturing (3D printing). These models were evaluated by a manufacturer so that the evaluation matrix and criteria satisfaction matrix could be successfully completed. Therefore, AIDA can be successfully used in solving problems in product design in the field of mounting structures for PV panels. Depending on the manufacturer’s capabilities, the intended functions can be adapted quickly, because AIDA is quite simple to apply if the data of the problem are known very well. Following the application of the FEM it was concluded that the surfaces as simple as possible are to be followed in the design of components. Also, an assessment of environmental impact was successfully undertaken by means of software assistance. The decision to use one option or another is a subjective one. If the technical data are followed, then one type of structure is the one that the manufacturer should adopt as a solution to the problem. However, if the manufacturer considers that the impact on the environment is important and dedicates resources in this direction, then a different type of structure should be adopted.
1. Introduction
Photovoltaic (referred to as PV) technology has emerged as a promising solution to the global energy crisis, offering a clean and sustainable alternative to conventional energy sources. PV assemblies, the core components of PV systems, play a critical role in converting sunlight into electricity. However, the current state of PV assemblies faces several limitations, including low efficiency, high cost, and high environmental impact [1,2]. To address these challenges and accelerate the adoption of PV technology, it is crucial to develop innovative and cost-effective PV assemblies.
The global energy landscape is undergoing a transformative shift towards renewable energy sources, with PV technology at the forefront. PV assemblies, the heart of PV systems, are critical components in harnessing solar energy for electricity generation. However, current PV assemblies face several limitations that hinder their widespread adoption and commercialisation. These limitations include low efficiency—conventional PV modules typically achieve conversion efficiencies of around 20%, leaving significant room for improvement [3]; high cost—PV modules are relatively expensive, limiting their accessibility to a wider range of consumers and regions; environmental impact—the manufacturing and disposal of PV modules can have environmental consequences, requiring sustainable production processes and materials [4].
To address these challenges and accelerate the adoption of PV technology, innovative and cost-effective PV assemblies are essential. The AIDA method offers a promising approach to achieving this goal by providing a structured framework for identifying, assessing, and optimizing the design of PV assemblies.
The AIDA method, an acronym for Analysis of Interconnected Decision Areas, is a structured technique for decision-making in engineering projects [5,6]. It provides a systematic approach to identify, evaluate, and optimise interactions between different decision areas, leading to more informed and effective choices.
Although originally created for the specific fields of urban planning and architecture, the AIDA method has proven to be a valuable tool in many decision-making environments. It is particularly useful in engineering design because it allows designers to fully examine decision fields and relate the interdependencies between the various options available, an ability not seen among other established design methods. The AIDA method has been successfully applied in various engineering fields, including product development, system design, and process optimisation [6,7,8,9,10,11]. Traditionally, AIDA is used in complex projects to see how decisions in one area affect options in others. For instance, in the field of product designing: a choice of material (decision area 1) might limit the manufacturing methods (decision area 2) feasible for that material. AIDA helps identify these interactions early on [9,10]. By identifying incompatible combinations of decisions upfront, AIDA helps eliminate a significant number of options that would not work together. This streamlines the decision-making process and reduces the number of combinations that need to be evaluated in detail.
AIDA promotes a more holistic approach to problem-solving, considering the ripple effects of decisions across different areas. This can lead to more robust and well-integrated solutions.
In this study, we explore the application of a slightly modified AIDA method in the context of innovation in PV assemblies. The aim is to demonstrate how AIDA can be effectively used to identify and assess potential improvements in PV assembly design, leading to the development of more efficient (by identifying design improvements that enhance the light absorption and conversion efficiency of PV modules [12,13]) cost-effective (by facilitating the selection of materials, processes, and components that reduce the overall cost of PV modules [14,15,16,17]), and environmentally friendly PV systems (by promoting the use of sustainable materials and manufacturing processes to minimise the environmental impact of PV modules [18,19,20]). By developing more efficient, cost-effective, and environmentally friendly PV systems, the AIDA method can contribute to a more sustainable energy future and help address the global energy crisis.
Cost-effectiveness in PV systems is a multifaceted concept that encompasses various factors, including material costs, manufacturing processes, technological advancements, and long-term economic considerations. To define cost-effectiveness, it is essential to establish clear metrics and indicators that capture the overall economic viability of PV components [21,22,23]. These metrics may include initial cost, lifespan, maintenance costs, energy output, levelized cost of energy—a comprehensive measure of the overall cost of generating electricity from a PV system, considering all upfront and ongoing costs [24,25,26,27,28,29,30].
Within the PV system, certain components play a more significant role in determining the overall cost-effectiveness of the system, such as solar cells, inverters, and balance of system components—the various components that support the operation of the solar panels, such as mounting structures, wiring, and junction boxes [12,15,26].
The AIDA method, with its emphasis on understanding interactions between decision areas, is particularly well-suited for addressing the challenge of cost-effective PV components. This study is focused on the balance of system components, especially on the mounting structures. Through systematic analysis, AIDA can help identify trade-offs between cost, efficiency, and other factors. So, these trade-offs can be analysed and viable solutions that balance cost constraints with desired performance goals can be identified [31]. Also, this method encourages the exploration of unconventional materials and processes that could potentially reduce costs while maintaining or improving performance. Finally, the impact of component choices on system-level cost can be evaluated. AIDA considers the interactions between different components and their impact on the overall cost of the PV system. This allows for a holistic approach to cost optimisation.
The product life cycle issue was also addressed in this study considering that for a high-quality product, different materials were used for different components of the clamping subassemblies. Therefore, each material leaves a different footprint on the environment in the medium- and long-term.
According to [32] for all instruments targeting European markets, the impact assessment methodology is CML–IA 2012, which is the methodology required by the European standards EN 15978 and EN 15804. The CML methodology was created by Leiden University in the Netherlands in 2001.
When determining the environmental impact of a product, the Life Cycle Assessment looks at what happens in the production, use, and final disposal of the product. This even includes the impact of transportation that takes place between stages. Decisions about the material used, how it is manufactured, and other factors can result in very different effects on the environment [33].
2. Methods and Procedures
The research which forms the basis for this study aims to identify and compare all solutions compatible with the given problem, in the present case: obtaining new components for the mounting structures of PV systems.
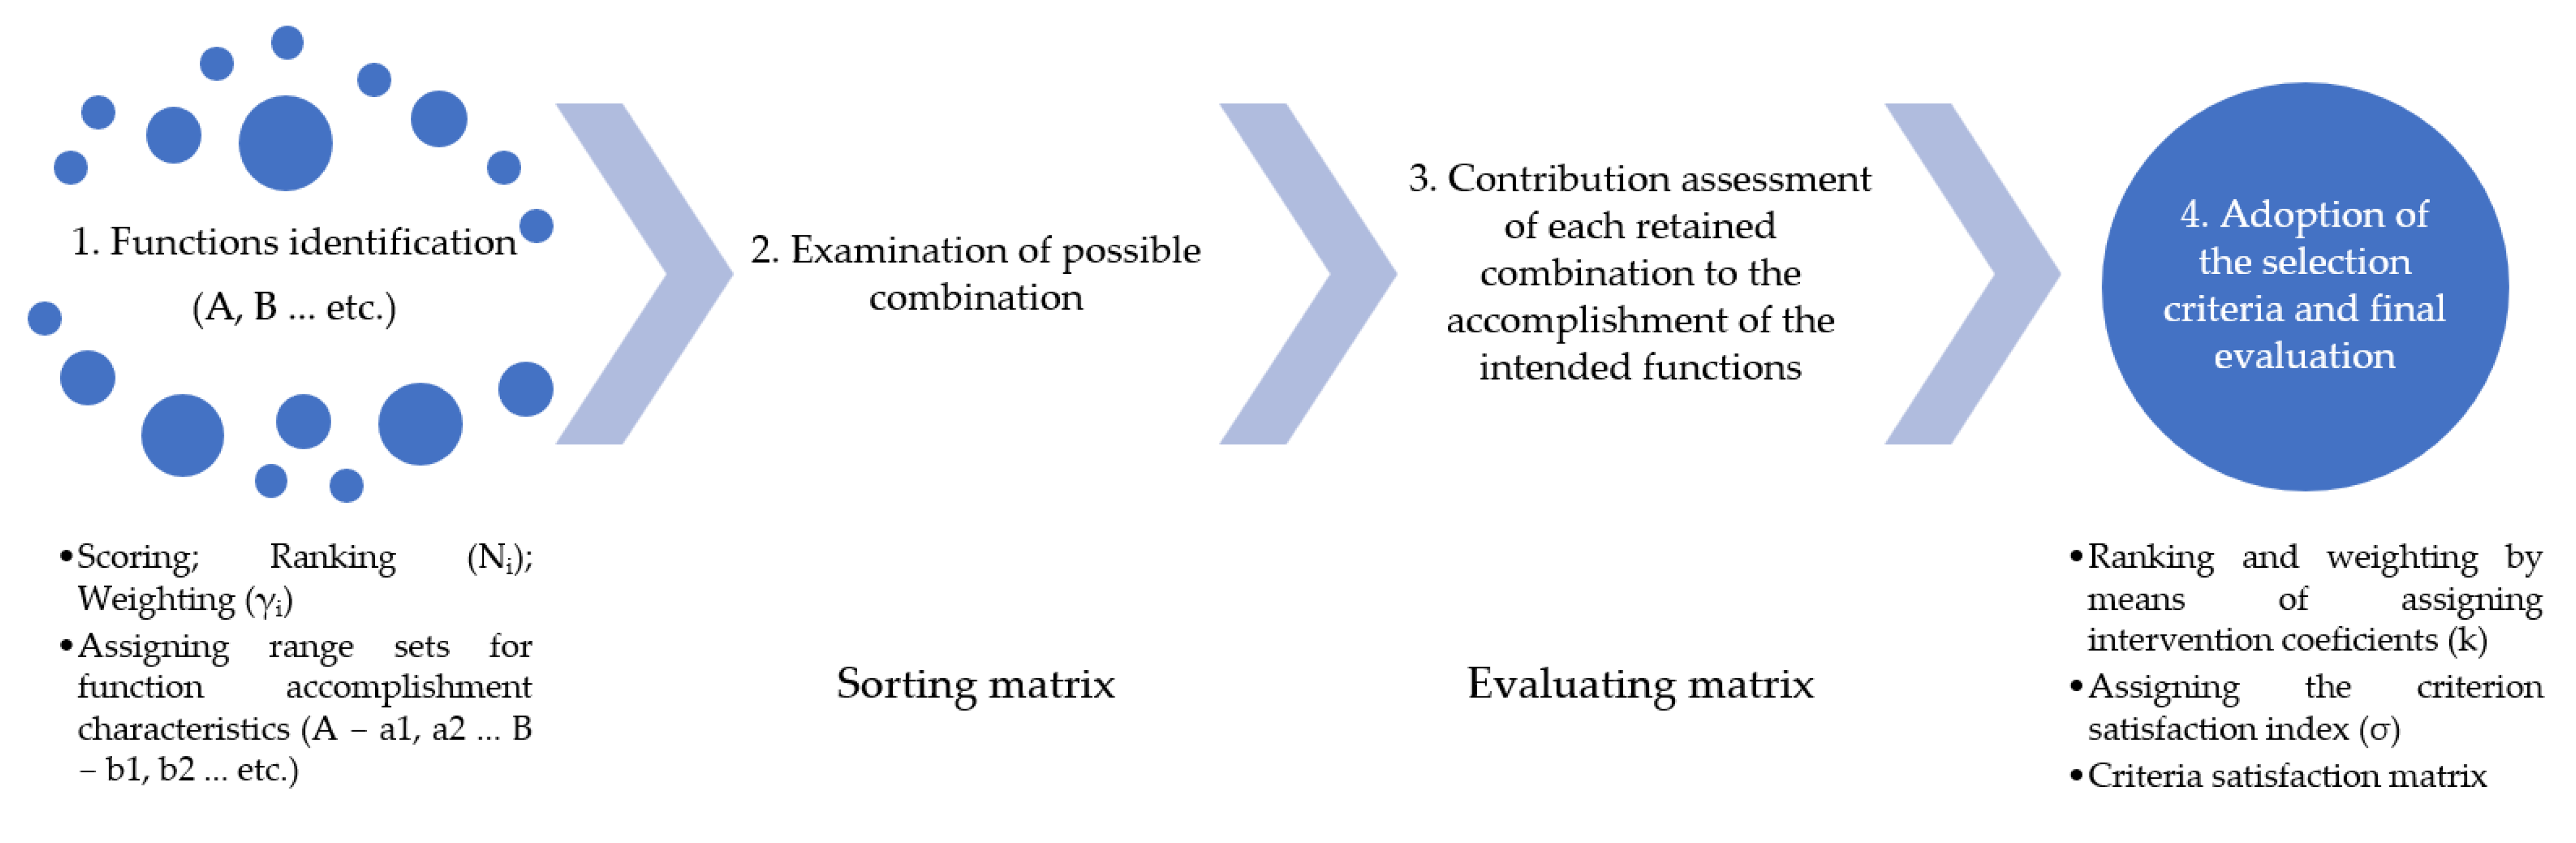
In a simplified approach, the procedure used in this study boils down to the 4 steps depicted in Figure 1. By following these steps, at the end of this process the election of the optimal solution in relation to the intended functions and the adopted criteria will be possible [34]. This involves predefining the key steps, objectives, and data needed to reach an optimal conclusion. Without solid planning, the analysis risks being disorganised, overlooking important factors, and leading to inconclusive results.
Procedure planning in AIDA is associated with benefits like increased analysis accuracy, improved efficiency, the facilitation of analysis replication, and the identification of potential issues or data gaps. The method’s steps are designed to guide the analysis in a logical and systematic manner, reducing the risk of neglecting important factors or introducing errors. Adhering to the protocol also ensures consistency and comparability of results with other AIDA analyses conducted on similar topics.
To obtain a range of possible solutions, it is first necessary to identify the functions of the new product. Several defining functions are sought for the analysed product, which in this case are (A) the mounting method onto the rigid support; (B) the transfer of the clamping force to the crossbar of the PV panel; (C) simple and fast assembly; and (D) operational safety. The ranking and weighting of the functions thus identified is usually performed with a three values matrix.
On the matrix, N elements (criteria, functions, etc.) are compared one by one, each with each other (including with themselves). Matrices are usually n = 3 values, where the scoring is 0—less important than; 0.5—equally important; and 1—more important than.
This matrix is drawn up through mutual consultation by a team of 3–4 designers, which in this case were the authors of this study.
Importance indices (Ni) are usually assigned by another non-meeting collective of 5–6 people and are scored on an importance rating scale unrelated to the previous score on the matrix [35], as can be seen in Table 1. These indices can be assigned in the range of 0–10 or any other range of a fixed amount: 25, 30, 50, 100, etc. The least important function is assigned a benchmark importance index (Ni = 1), the other functions having, consequently, over-unit values resulting from the above-mentioned collective assessments.
The weighting coefficient (γj) can be calculated with the “Frisco” equation [36]:
where p is the sum of points obtained on the line by element j; ∆p is the difference between the score of element j and the score of the element ranked last; m is the number of elements outranked by element j in conjunction with the importance index Ni; and ∆p’ is the difference between the score of element j and the score of the element ranked first (0 or <0).
Even though function A and C scored equally, they did not receive the same importance index because from a technical point of view the mounting method onto the rigid support is somewhat dependent on the idea of quick and easy assembly. In the case of function A, reference is made to the mechanical effect that components have on the assembly method, and in the case of function C, reference is made rather to the number of components involved in the mounting system. It can also be seen from the matrix that they have quite close weighting coefficients.
The identified, ranked, and weighted functions can be accomplished by means of several A (a1, a2, ..., ai), B (b1, b2, ..., bj), etc., types of range sets. The total number of possible combinations is actually [37]:
where Ai is the total number of elements from the range set A; Bj is the total number of elements from the range set B; and Xn is the total number of elements from the range set X.
Achieving the above functions can be accomplished in several ways, as depicted in Table 2. So, there are 3 × 3 × 3 × 2 = 54 possible combinations from which possible solutions can be retained.
The second important step in this endeavour is the examination of possible combinations. This is carried out by inputting a sorting matrix one of the three distinct situations in which one combination of elements can exist. Thus, incompatible combinations are marked with “x”, while 0 is existing or trivial combinations and 1 is interesting combinations. The sorting matrix is shown in Table 3 below.
After an analysis through the mutual consultation between both the manufacturers’ representatives and the designing team that scored the identified functions, 10 combinations considered compatible (interesting) are retained: a1b2c2d2, a1b3c2d2, a1b3c3d2, a2b2c2d2, a2b3c1d2, a2b3c2d2, a2b3c3d2, a3b2c2d2, a3b3c2d2, and a3b3c3d2.
The third step in the present study is the evaluation of the contribution of the retained combinations to the accomplishment of the functions. This is undertaken through the sum of the products qi × γi for each individual combination, a value that will later be used to finalise the solution. The qi coefficient is the score of the contribution of each combination to the accomplishment of the intended functions. Instead of the weight coefficient γi, the importance index Ni can be used without problems, although this is not recommended in situations where there are several (>3) possible solutions.
By means of an additional method, in this case 6-3-5 (which is the subject of another study), and through simple collective consultation of the designing team, each of the retained combinations were evaluated according to the functions established previously. Following the evaluation, points from 1 to 10 were assigned for each retained combination. Also, a matrix in which all scores are entered is used, as can be seen in Table 4.
Once a preliminary result has been obtained, in which the possible solutions have been ranked in order of importance, from an engineering point of view, the next step involves adopting the selection criteria and final evaluation.
Also, through collective consultation between both the manufacturers’ representatives and the designing team, the following evaluation criteria were adopted:
α—manufacturing cost: This depends on the materials used and the difficulties of industrial production.
β—commercial attractiveness: This depends on α, the novelty of the solution, and its practicality.
λ—withstanding the market: The duration of market success depends on many factors and especially on the prospects of progress in that particular field and on the probability of appearance, sooner or later, of more “attractive” products.
ψ—reliability: Full performance over a certain period of all the designed functions. The goal is not maximum reliability but optimal reliability, which should be equal to a certain share of the duration of the product’s market acceptance, which, as already mentioned, is very difficult to assess objectively.
The ranking and weighting of the evaluation criteria was accomplished by means of assigning intervention coefficients (k) from the team that proposed them. In the case of this study, this was carried out as in the case of the importance indices (Ni). Therefore, the following coefficients were established: kα = 3; kβ = 2; kλ = 1; and kψ = 4.
Each possible solution satisfies to a lesser or greater degree each of the criteria adopted for the final option. The most unfavourable combination, according to a certain criterion, is assigned the benchmark criterion satisfaction index (σi = 1), with the other combinations exhibiting, consequently, over-unit weights.
The combination that best satisfies the criteria requirements is the one where the product (Sop) is maximum [37].
where qi is the contribution score of each combination to the accomplishment of the intended function, γj is the weighting coefficient of the intended function, ki is the intervention coefficient of the evaluation criteria, and σji is the satisfaction index according to a certain criterion.
To establish the optimal solution, the criteria satisfaction matrix is drawn up, as can be seen in Table 5.
As shown in Table 5, of all the combinations considered as possible solutions, those positioned at the top of the ranking stand out, obtaining more than 3000 points. Therefore, the combinations a2b2c2d2, which has 3642.72 points, is compared to a1b2c2d2, which has 3309.68 points.
The difference between the first two ranked combinations is much smaller compared to the combination ranked third, so the possible solutions ranked below third place will not be taken into consideration.
After the assessment of compatible combinations since the second step of AIDA, models were built, firstly, by additive manufacturing. These models were taken over by the manufacturer to be evaluated in the following steps, so that the evaluation matrix (Table 4) and criteria satisfaction matrix (Table 5) could be completed successfully. Figure 2 depicts both possible solutions used for comparison according to the intended functions and the combined elements from Table 4. Both the crossbars and the rigid supports have common profiles.
Regarding additive manufacturing—also known as 3D printing—an Ultimaker 3 terminal was used for the components. Consequently, the construction material was in the form of filament, and in this study Ultrafuse PLA PRO1 filament, also called Tough PLA was used.
According to data provided by the filament manufacturer BASF, this material is an extremely versatile material made for professionals and is capable of printing at high speeds, high strength, or with excellent exterior surface finish. To make high speed or high strength components, the print settings recommended by the filament manufacturer were used, according to Table 6.
Considering that the local manufacturers in this field (from the area where our university is located), consider the results of the latest versions of SolidWorks Simulation to be satisfactory for the preliminary evaluation of their products, this study is based on the linear static structural analysis performed on SolidWorks 2023 SP5 Premium. The above-mentioned combinations are compared with each other using finite element method (referred to as FEM) regarding the main loading encountered in operation, caused by the wind and gravity. In this case, the loading occurs on the crossbars to which the PV panels are attached and through which the fixing to the rigid support is carried out, as can be seen in Figure 3.
It is generally known that PV panel mounting structures are tested at a load of 20 kgf for each clamping subassembly. Depending on the operating conditions, more or fewer such subassemblies are mounted. The value of 20 kgf is considered sufficient for gravity loading and medium-intensity winds.
All components of the mounting system were considered solid bodies, discretised using a solid mesh with global interactions and surface-to-surface interaction properties. The solid mesh was a blended curvature-based mesh with 29 Jacobian points, a maximum element size of 6 mm, and a minimum element size of 0.3 mm. The percentage of elements with an aspect ratio <3 was 98.2–98.5%, and for >10, it was just 0.553–0.797%. The total number of nodes was 119,076 for the a1b2c2d2 possible solution and 167,075 for the a2b2c2d2 possible solution.
Regarding environmental impact assessment, SolidWorks provides an add-in capable of performing such an action. SolidWorks Sustainability Add-in shows these environmental impacts calculated using CML (Centrum voor Millikunde Leiden) and impact assessment methodologies and helps to improve future projects.
The elements considered relevant in CML impact assessment methodology are 6 in number and are as follows: air acidification, carbon footprint, total energy consumed, water eutrophication, life cycle assessment, and material financial impact.
In order to meet environmental impact requirements, this is an invaluable tool for engineers and designers who want to make informed decisions about material selection, design choices, and manufacturing processes to minimise environmental impact; meet sustainability goals and comply with environmental regulations; and communicate the environmental benefits of the designs to the final beneficiaries.
For the assessment of the mounting system, only the components that were obtaind by applying the AIDA method were considered.
3. Results
3.1. Possible Solutions Obtained by Applying the AIDA Method
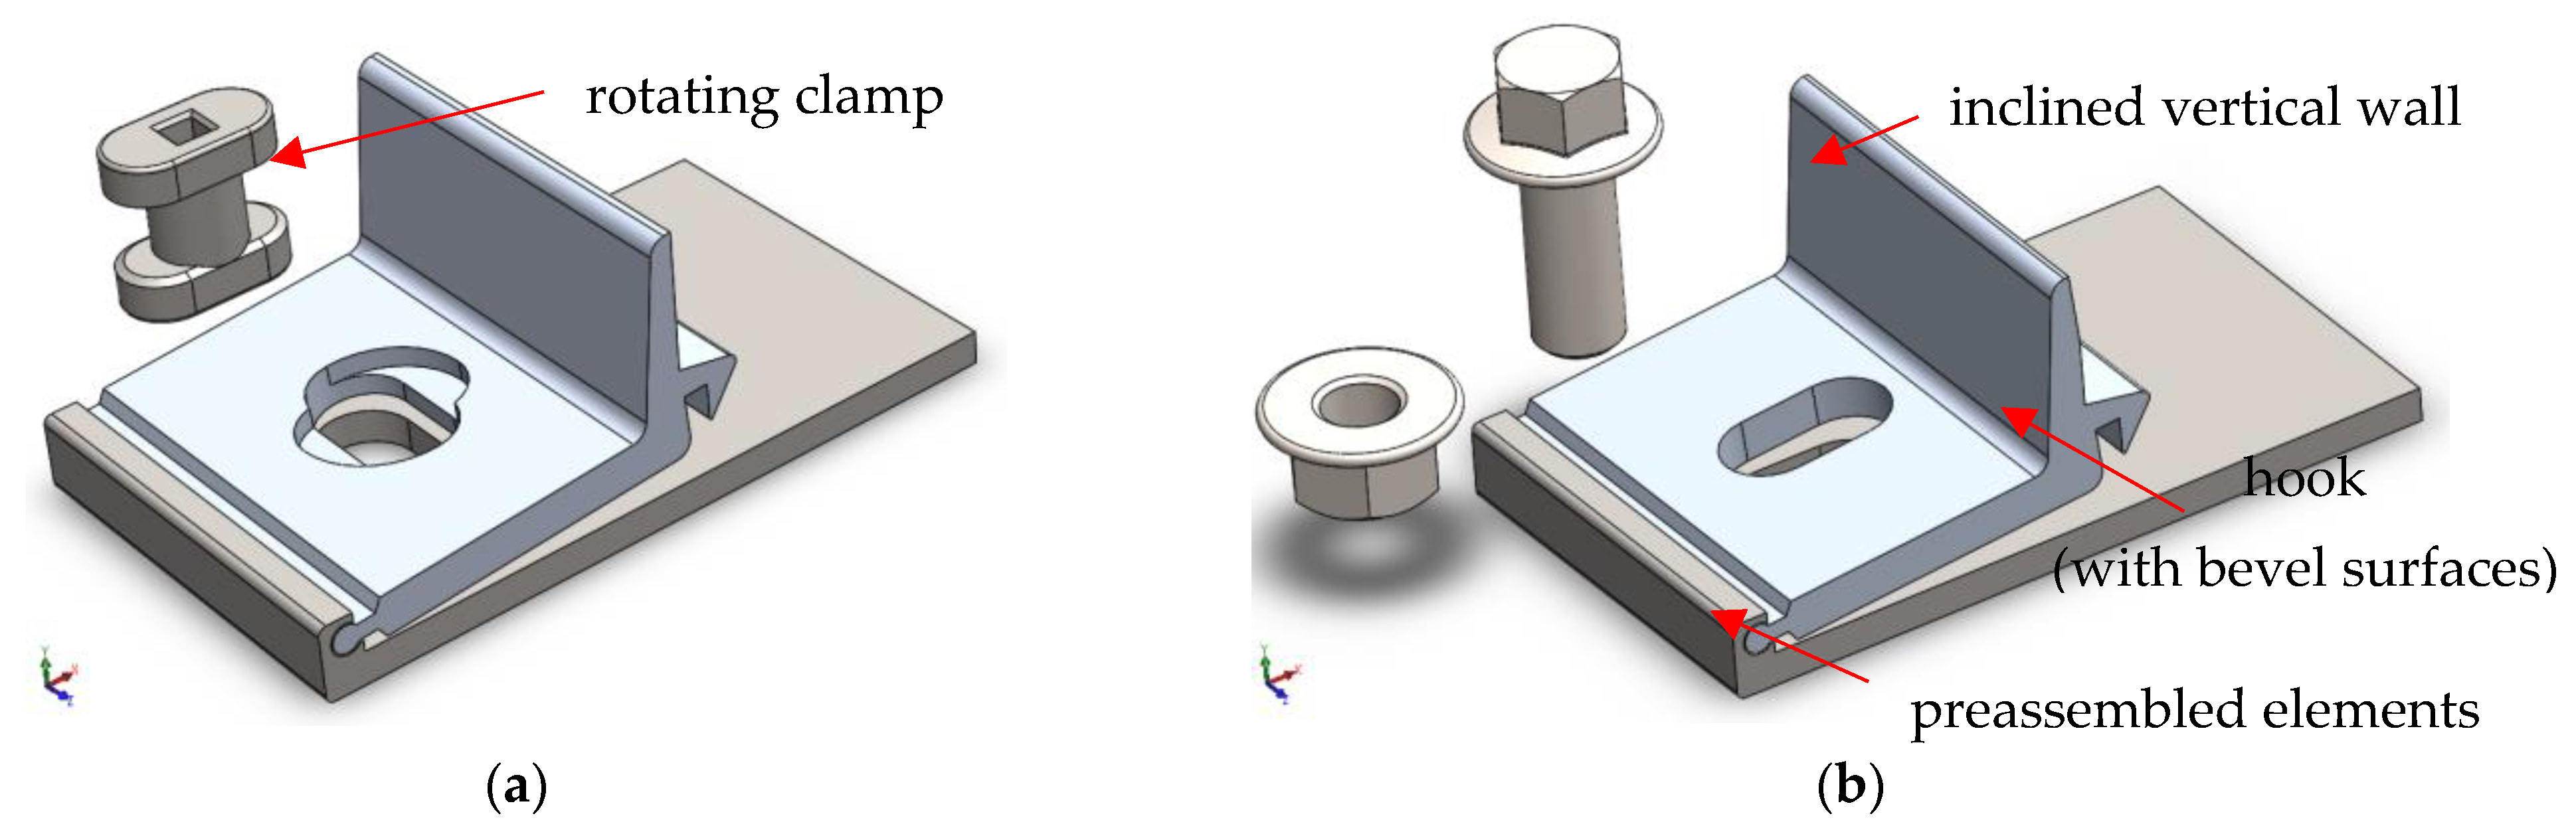
According to the characteristics of each individual function, it can be presumed that the best option—a2b2c2d2—is a preassembled mounting system that is fixed on the rigid support with bolts and the transfer of the clamping force to the crossbar of the PV panel is achieved indirectly by means of a lever, with each component being made of a different material according to its purpose. On the other hand, the second best possible solution—a1b2c2d2—assumes similar functions except for fixing to the rigid support, which is achieved by means of a rotating clamp, which requires a special tool for mounting.
Figure 4 shows the models of both products created according to the identified functions and the combined elements from Table 3.
The preassembly option involves the use of a hinge type system, which favours the extrusion of the material in one direction, thus simplifying the manufacturing process and not just the exploitation process. After extruding the two elements, they must be further processed through the milling operation, obtaining either the cavity required for the rotating clamp, or the clearance required to insert the bolt.
Depending on the operating conditions, both elements can be made of the same aluminium alloys, or the plate-type element can be made of a harder aluminium alloy.
In the case for the a1b2c2d2 option, the rotary clamp is obtained by casting, and it is also the most expensive component of the entire subassembly, given the required geometry, compared to the other elements. This component is made of cast carbon steel. On the other hand, the a2b2c2d2 option involves the use of standard bolts without special requirements, made of plain carbon steel.
The transfer of the clamping force to the crossbar is achieved by three mechanical effects, namely the pushing of the crossbar on the upper side by the slightly inclined forward vertical wall, the holding of the crossbar by the hook with bevel surfaces to facilitate the crossbar grip, and finally, by pressing the hook element down by turning the clamp to the right-hand side or tightening the bolt.
3.2. Assessment of Both Structures by Applying FEM
As shown in Figure 3, generally, two loadings occur on the crossbar, one in the upward direction and one along the PV panel. This involves two stresses on the hook element of the mounting structure, as is shown in Figure 5.
To obtain a resulting load of 20 kgf on the hook like profile of the upper component of the structure, a load of 7.25 kgf was assigned to the longitudinal direction and a value of 17 kgf was assigned to the upward direction. Both components of the structure were made of the same type of material (6061 AL alloy) and cast carbon steel was attributed to the rotating clamp. The bolt used in the other mounting structure type was made from standard alloy steel.
Through the FEM analyses, more information was obtained, of which only four type of results were retained: equivalent von Mises stresses, displacements, hot spot stress, and design insight. The last two types of results are needed in the overall assessment of the assemblies in question and are generally used to improve the design of the required components.
The maximum von Mises equivalent stresses do not occur on the loaded area but on the clamping area between the two components and the rotating clamp or bolt, respectively. The values are quite different but fall within the admissible yielding limits for the materials from which the components are made. A graphical representation of these data can be found in Figure 6.
Regarding the a1b2c2d2-type structure, the equivalent von Mises stresses reached a value of 174.5 MPa, while the a2b2c2d2-type structure presents a value of these stresses of 45.4 Mpa, which is about 3.8 times lower than the previous value.
It can be noted that in the case of the a1b2c2d2-type the structure, the stresses are distributed both in the upper component and in the rotating clamp.
This indicates that in the event of overloading or premature fatigue, one of those components is prone to failure.
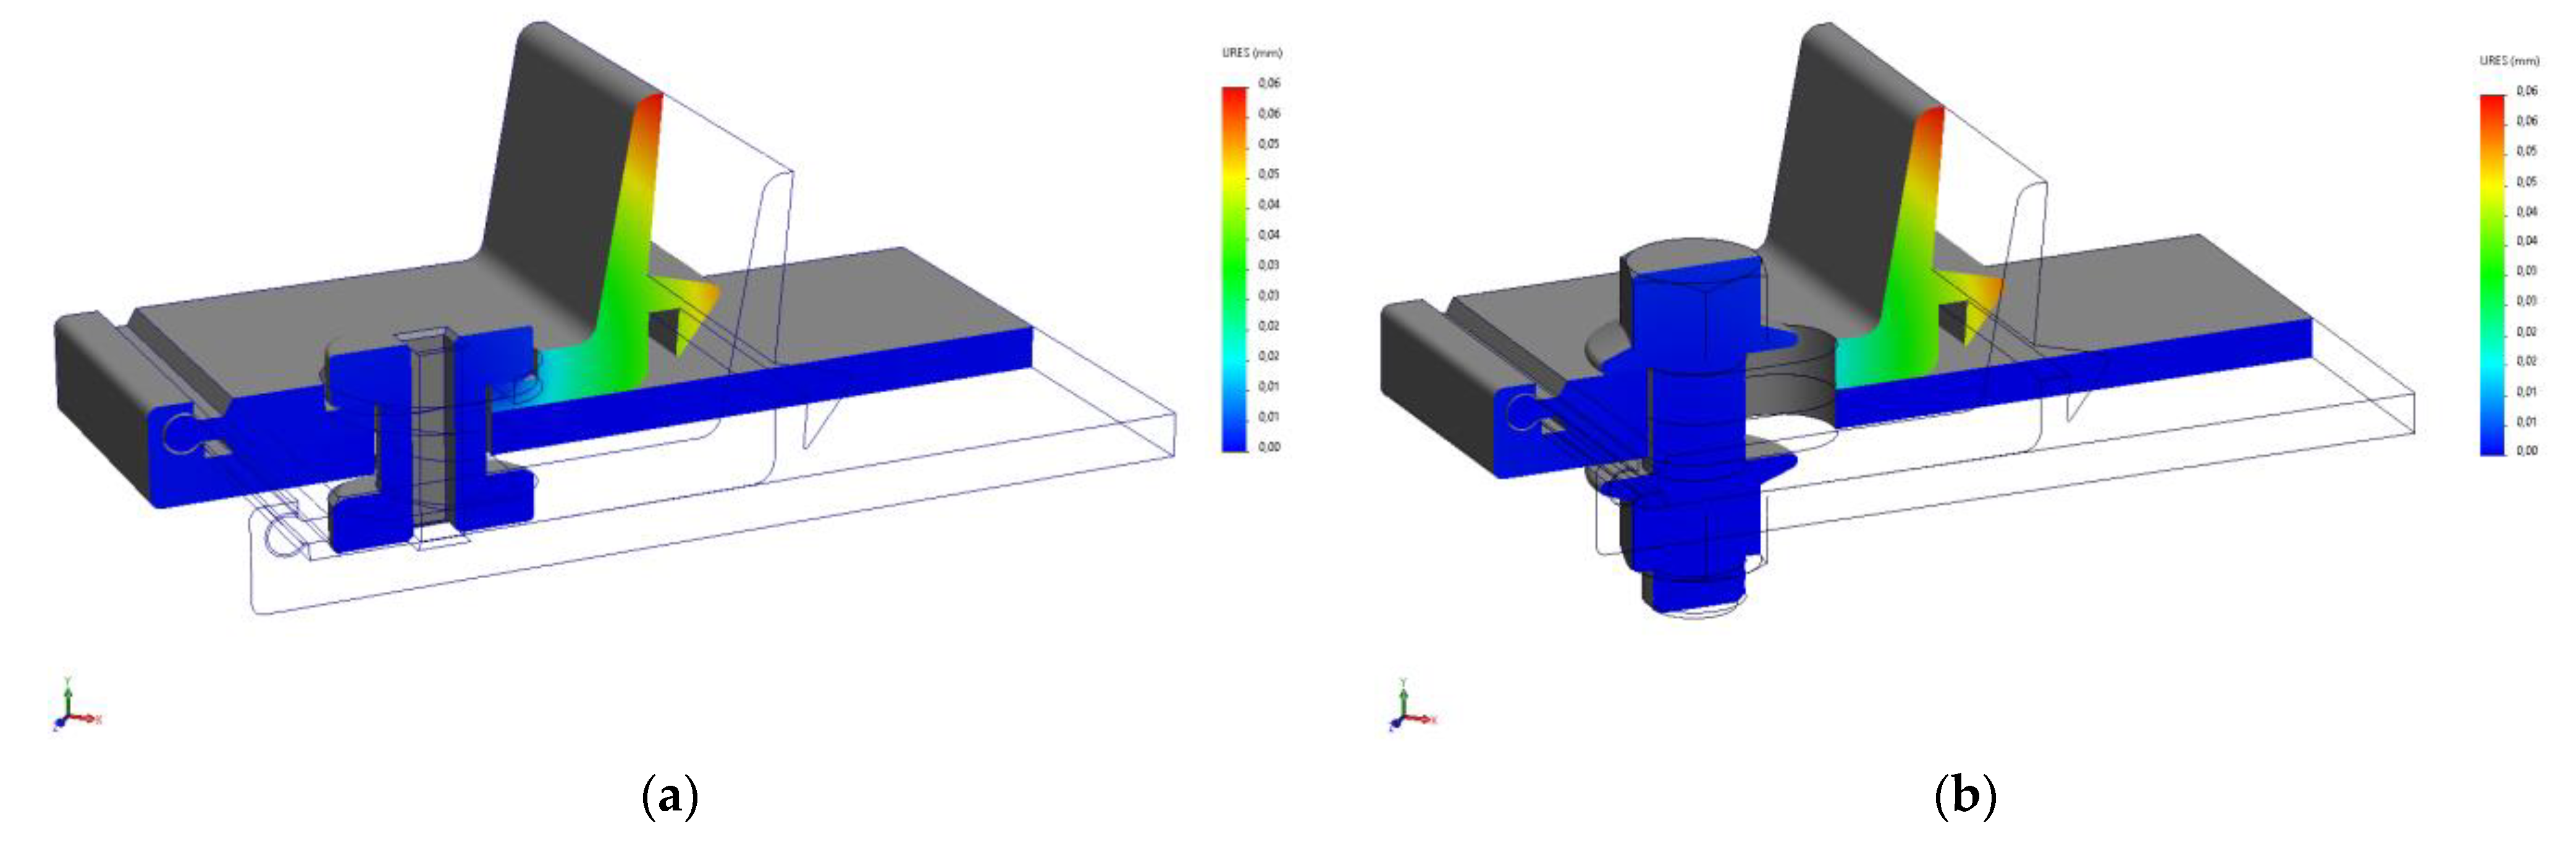
The same cannot be said for the data regarding the displacements recorded by the components following the applied loading. This time, in both situations, it can be noted that the maximum displacement occurred on the upper side of the inclined wall, as presented in Figure 7. For both types of structures, the same value of 0.06 mm was recorded. This value is an extremely small one, which suggests that the upper component is quite stiff.
Regarding the analysis of hot spot stress, it can be seen that the a1b2c2d2-type structure presents a higher density of regions with irregular stress gradients compared to the other type of structure, as presented in Figure 8a. Although these areas may indicate potential stress singularities, in this case they are legitimate high-stress areas.
On the other hand, in the case of the a2b2c2d2-type structure, few hotspots with irregular stress gradients were identified near sharp geometric edges (without fillets) and regions with fixed boundary conditions (preventing free expansion/contraction), as presented in Figure 8b. These situations are generally found in the spaces required to insert the nuts and bolts, as is the case with the a2b2c2d2-type structure.
It should be mentioned that the characteristic sensitivity level of the hot spot analysis was set to 75%, as this value is generally accepted by the manufacturers of such mounting systems.
The maximum value reached in the case of the a1b2c2d2-type structure was 99.9 MPa, about 42.7% lower than the maximum equivalent von Mises stresses, and 25.7 MPA, about 43.4% lower than the maximum equivalent von Mises stresses, for the a2b2c2d2-type structure.
The results of the design insight analysis are plotted in Figure 9.
This analysis enables the visualisation of the load path inside the model, highlighting regions that carry the load most efficiently. Also, in this instance, the slider control to view varying load levels and focus on specific regions was set to medium.
From the analysis of both structures, it can be seen that in the a1b2c2d2-type structure, the contact area between the rotating clamp and the upper component of the structure is a delicate area that needs a lot of attention in the design process.
3.3. Assessment of Environmental Impact
SolidWorks Sustainability is an add-in that allows the assessment of the environmental impact of designs during the early stages of development. As mentioned previously, this assessment is based on CML methodology, which considers the input data shown in Table 7. After running the program for the a1b2c2d2-type structure, the results presented in Figure 10 were obtained. Consequently, the components of this structure contributing most to the four areas of environmental impact are plotted in Figure 11.
After running the program for the a2b2c2d2-type structure, the results shown in Figure 12 were obtained. As in the previous case, the components of this structure that contributed most to the four areas of environmental impact are plotted in Figure 13.
It is important to note that the a1b2c2d2-type structure weighs 101.38g, while the a2b2c2d2-type structure weighs 124.52 g, which is 22.8% more than the first structure. This can be attributed to the extra volume of the bolt and nut compared to the rotating clamp, despite both being made of roughly the same material.
4. Discussion
The AIDA method being a multi-criteria method of conception and decision fits very well with the field of product design. In this study, this method was approached together with an analytical technique for stimulating creative thinking, namely the morphological technique through flat sorting matrices (Table 3).
Generally, analytical techniques have the disadvantage of being time-consuming to use, but the results obtained are good, especially if mutual consultation between design teams is reached.
Although by combining all the features a total of 54 possible solutions were obtained, only 10 were considered compatible and interesting, especially for the manufacturers in this field. Through the stages that followed, many of the options were eliminated when it was decided that the proposed functions were not fully fulfilled. Thus, the first two options were retained as their obtained scores were significantly higher than those of the others. Therefore, the present study is based on the evaluation of these two options, both by applying FEM and through an overall environmental impact assessment.
For the use of the AIDA method in a current context regarding the development of the computing technique, we aimed to implement it in the form of a software application that will significantly shorten data processing time. Of course, solving the problem can be achieved through various methods of implementation.
The evaluation of maximum equivalent von Mises stresses, displacements, hot spot stress points, and the overall design insights was carried out by applying FEM.
Following the analysis of the results of the mechanical stresses, it was concluded that the a2b2c2d2-type structure exhibits only 45.4 MPa, which means that only 26% of the value was recorded by the a1b2c2d2-type structure, i.e., 174.5 MPa. Also, these stresses have a uniform distribution in the body of the upper component of the analysed assembly.
Regarding the displacements obtained from the analysis, it can be concluded that the values are extremely small—only 0.06 mm—in both cases and that they are not influenced by the fastening method applied to the components in the studied assemblies.
The results obtained from the hot spot stress analysis show that the maximum equivalent von Mises stresses are correctly assessed in both cases. This conclusion follows the fact that hotspots with irregular stress gradients were identified with a much higher density in the case of the a1b2c2d2-type structure. In the case of the a2b2c2d2-type structure, these hot spot stress points appeared only near sharp geometric edges and regions with fixed boundary conditions in very small numbers.
Design insight is a tool that provides a colour-coded visualisation of the load path, where blue indicates regions with high load transfer efficiency and translucent colour represents the original model geometry. It is worth mentioning that the translucent portion of the design insight plot carries the applied load less effectively than the solid portion. These translucent areas may be removed with more confidence in pursuit of a reduced weight design if the functionality of the components remains at a high level.
Analysing both assemblies, it can be concluded that the a1b2c2d2-type structure has a very sensitive contact area between the rotating clamp and the upper part of the assembly. This area requires a lot of attention in the design process because it presents the risk of premature fatigue due to the stress concentration in both the rotary clamp and the upper part of the assembly.
Regarding the assessment of the environmental impact, it can be observed that the a2b2c2d2-type structure seems to be more harmful, leaving a somewhat more significant environmental footprint than the other structure. Four of the six components of the CML methodology are presented in this study, with a more detailed assessment being the subject of another study.
In all four assessed criteria, the a1b2c2d2-type structure is at an advantage because it benefits from much lower material consumption compared to the other structure. If the a1b2c2d2-type structure weighs 101.38 g, the other one weighs 22.8% more, i.e., 124.52 g. This difference, as well as the volume of the fastening element, makes the a2b2c2d2-type structure less desirable from this point of view. The characteristic indices for each component show that the bolt used in the assembly is more damaging compared to the rotary clamp, a fact shown in Figure 14.
To better understand what these environmental impact assessment criteria represent, below is a brief presentation of each of them.
- Air acidification—Sulphur dioxide, nitrous oxides, and other acidic emissions into air cause an increase in the acidity of rainwater, which in turn acidifies lakes and soil. This impact is typically measured in units of kilograms of sulphur dioxide equivalent (SO2).
- Carbon footprint—Carbon dioxide and other gasses which result from the burning of fossil fuels accumulate in the atmosphere and in turn increase the Earth’s average temperature.
- Total energy consumed—A measure of the non-renewable energy sources associated with the component’s life cycle in units of megajoules (MJ). This impact includes not only the electricity and fuels used during the product’s life cycle but also the upstream energy required to obtain and process these fuels and the embodied energy of materials which would be released if burned.
- Water eutrophication—When an overabundance of nutrients is added to a water ecosystem, eutrophication occurs. Nitrogen and phosphorous from wastewater and agricultural fertilizers cause an overabundance of algae to bloom, which then depletes the water of oxygen and results in the death of both plant and animal life. This impact is typically measured in kilograms of phosphate equivalent (PO4).
Considering all the data presented so far, the decision to use one option or another is a subjective one. If the technical data are followed, then the a2b2c2d2-type structure is the one that manufacturers should adopt as a solution to the problem at hand. However, if a manufacturer decides that the impact on the environment is important and dedicates resources in this direction, then the a1b2c2d2-type structure the option that should be adopted.
5. Conclusions
Concluding this study, some conclusions can be drawn regarding the data analysed and discussed above:
- The AIDA method can be successfully used in solving problems in product design in the field of mounting structures for PV systems.
- Depending on the manufacturer’s capabilities, the intended functions can be adapted quickly, because AIDA is quite simple to apply if the data of the problem are known very well.
- Following the application of the FEM, surfaces that are as simple as possible should be utilised in component design.
- The displacements do not depend on the shape of the crossbar retaining element nor on the method of clamping to the rigid support.
- Avoiding stress hotspots is more important if more compact and lighter structures are chosen as solutions to the problem at hand.
- The total energy consumed is higher in the case of assemblies with somewhat larger volumes, even if their geometry is simpler.
- The carbon footprint has inferior values to assemblies with smaller and more compact components.
Compared to the already well-known mounting systems, the two variants proposed in this study have a common characteristic, namely that they are very compact and stiff. This fact makes the assembly procedure significantly simpler, maintaining a high level of safety in terms of both PV systems as well as the human factor involved in mounting of these systems.
The AIDA method, while offering a structured approach to research, has some limitations when applied to PV mounting systems regarding the data-dependence of results or scope limitations. Regarding data-dependence, it can be said that the effectiveness of AIDA relies heavily on the quality and comprehensiveness of the data used. In the case of PV mounting systems, data on factors like wind loads, material properties, and environmental conditions might be limited or location-specific. Regarding scope limitations, AIDA focuses on identifying optimal solutions within a predefined set of decision areas. This might restrict the exploration of innovative designs or materials that fall outside the established framework.
Despite these limitations, AIDA holds promise for PV mounting systems research by addressing several directions, such as integration with other methods—combining AIDA with simulations, machine learning, or life cycle analysis can provide a more holistic understanding of the system’s performance; dynamic modelling—developing dynamic AIDA that can account for changing environmental factors or system degradation over time would provide more realistic insights; standardisation of data—creating standardised data repositories for PV mounting systems would improve the accuracy and generalizability of AIDA models; and expanding decision areas—broadening the scope of AIDA to include factors like aesthetics, recyclability, or social impact can lead to more sustainable and socially responsible designs.
By addressing these limitations and exploring new possibilities, the AIDA method can continue to be a valuable tool for optimizing PV mounting systems and driving innovation in the field of solar energy.
Author Contributions
Conceptualisation, V.A.C. and V.Z.; methodology, V.A.C.; software, C.C.G.; validation, V.A.C., V.Z., and B.A.C.; formal analysis, B.A.C.; investigation, V.A.C. and C.C.G.; resources, V.Z.; data curation, B.A.C.; writing—original draft preparation, V.A.C.; writing—review and editing, C.C.G.; visualisation, V.A.C.; supervision, V.Z.; project administration, V.A.C.; funding acquisition, V.Z. All authors have read and agreed to the published version of the manuscript.
Funding
This research was funded by the Ministry of Education and Research, through the National Council for the Financing of Higher Education, Romania, grant number CNFIS-FDI-F-2023-0085.
Data Availability Statement
No new data were created or analyzed in this study. Data sharing is not applicable to this article.
Acknowledgments
The authors would like to give their sincere thanks to the technical and administrative stuff of the company Eco Trading SRL in Bacău, Romania, for the technical support provided in applying the AIDA method.
Conflicts of Interest
The authors declare no conflicts of interest.
References
- Ibrahim, T.; Akrouch, M.A.; Hachem, F.; Ramadan, M.; Ramadan, H.S.; Khaled, M. Cooling Techniques for Enhanced Efficiency of Photovoltaic Panels—Comparative Analysis with Environmental and Economic Insights. Energies 2024, 17, 713. [Google Scholar] [CrossRef]
- Palladino, V.; Di Somma, M.; Cancro, C.; Gaggioli, W.; De Lucia, M.; D’auria, M.; Lanchi, M.; Bassetti, F.; Bevilacqua, C.; Cardamone, S.; et al. Innovative Industrial Solutions for Improving the Technical/Economic Competitiveness of Concentrated Solar Power. Energies 2024, 17, 360. [Google Scholar] [CrossRef]
- Worku, M.Y.; Hassan, M.A.; Maraaba, L.S.; Shafiullah, M.; Elkadeem, M.R.; Hossain, M.I.; Abido, M.A. A Comprehensive Review of Recent Maximum Power Point Tracking Techniques for Photovoltaic Systems under Partial Shading. Sustainability 2023, 15, 11132. [Google Scholar] [CrossRef]
- Maniscalco, M.P.; Longo, S.; Miccichè, G.; Cellura, M.; Ferraro, M. A Critical Review of the Environmental Performance of Bifacial Photovoltaic Panels. Energies 2024, 17, 226. [Google Scholar] [CrossRef]
- Geldermann, J.; Lerche, N.; Sepulveda, J.D. Combining multi-criteria decision analysis and design thinking. Eur. J. Ind. Eng. 2018, 12, 708–739. [Google Scholar] [CrossRef]
- Andriani, D.P.; Wijayanti, F.; Rahmani, I.V.; Aini, A.P.N. Manufacturing Industry Performance Appraisals: Multi-Criteria Decision-Making Model. Int. J. Integr. Eng. 2022, 14, 28–37. [Google Scholar] [CrossRef]
- Paradowski, B.; Shekhovtsov, A.; Bączkiewicz, A.; Kizielewicz, B.; Sałabun, W. Similarity Analysis of Methods for Objective Determination of Weights in Multi-Criteria Decision Support Systems. Symmetry 2021, 13, 1874. [Google Scholar] [CrossRef]
- Alfares, H.K.; Duffuaa, S.O. Simulation-Based Evaluation of Criteria Rank-Weighting Methods in Multi-Criteria Decision-Making. Int. J. Inf. Technol. Decis. Mak. 2016, 15, 43–61. [Google Scholar] [CrossRef]
- Di Grazia, S.; Tina, G.M. Floating photovoltaic technology definition aided with multi-criteria decision analysis: A case study. Int. J. Sustain. Energy 2022, 41, 1938–1957. [Google Scholar] [CrossRef]
- Al-Anzi, A.; Al-Amiri, M.; Al-Bahar, A.S. Analysis of Interconnected Decision Areas for Innovation in Photovoltaic Assemblies. Appl. Energy 2017, 205, 1118–1126. [Google Scholar]
- Silva, J.S.; Alves, P.F.; Rocha, A.M.A.; Costa, J.A.F. AIDA Method: A Structured Approach for Decision-Making in Photovoltaic Systems Design. Renew. Energy 2019, 142, 738–747. [Google Scholar]
- Khan, A.Y.; Ahmad, Z.; Sultan, T.; Alshahrani, S.; Hayat, K.; Imran, M. Optimization of Photovoltaic Panel Array Configurations to Reduce Lift Force Using Genetic Algorithm and CFD. Energies 2022, 15, 9580. [Google Scholar] [CrossRef]
- Kaiser, J.; Hawkridge, G.; Mukherjee, A.; McFarlane, D. Evaluating the Effectiveness of Designs for Low-Cost Digital Manufacturing Systems. Appl. Sci. 2023, 13, 12618. [Google Scholar] [CrossRef]
- Fay, C.D.; Wu, L. Cost-Effective 3D Printing of Silicone Structures Using an Advanced Intra-Layer Curing Approach. Technologies 2023, 11, 179. [Google Scholar] [CrossRef]
- Demir, B.E. A New Low-Cost Internet of Things-Based Monitoring System Design for Stand-Alone Solar Photovoltaic Plant and Power Estimation. Appl. Sci. 2023, 13, 13072. [Google Scholar] [CrossRef]
- Al-Swailem, M.M.; Al-Amiri, M.A.; Al-Bahar, A.S. Cost-Effective PV System Design Using AIDA Method: Case Study of a Residential Installation. Energy Conserv. Manag. 2017, 144, 239–248. [Google Scholar]
- Haldar, B. Enhancing Dimensional Accuracy in Budget-Friendly 3D Printing through Solid Model Geometry Tuning and Its Use in Rapid Casting. Machines 2023, 11, 1020. [Google Scholar] [CrossRef]
- Görçün, Ö.F.; Zolfani, S.H.; Küçükönder, H.; Antucheviciene, J.; Pavlovskis, M. 3D Printer Selection for the Sustainable Manufacturing Industry Using an Integrated Decision-Making Model Based on Dombi Operators in the Fermatean Fuzzy Environment. Machines 2024, 12, 5. [Google Scholar] [CrossRef]
- Bozoklar, E.; Yılmaz, E. Designing Sustainable Flexible Manufacturing Cells with Multi-Objective Optimization Models. Appl. Sci. 2024, 14, 203. [Google Scholar] [CrossRef]
- Lindfors, A. Assessing sustainability with multi-criteria methods: A methodologically focused literature review. Environ. Sustain. Indic. 2021, 12, 100149. [Google Scholar] [CrossRef]
- Benti, G.B.; Aidanpää, J.-O.; Gustavsson, R. Cost-Effective Design Modification of a Sleeve Bearing with Large Bearing Clearance. Appl. Sci. 2024, 14, 1214. [Google Scholar] [CrossRef]
- Wu, K.-Y.; Tai, T.-C.; Li, B.-H.; Kuo, C.-C. Dynamic Energy Management Strategy of a Solar-and-Energy Storage-Integrated Smart Charging Station. Appl. Sci. 2024, 14, 1188. [Google Scholar] [CrossRef]
- Mykytyuk, P.; Brych, V.; Manzhula, V.; Borysiak, O.; Sachenko, A.; Banasik, A.; Kempa, W.M.; Mykytyuk, Y.; Czupryna-Nowak, A.; Lebid, I. Efficient Management of Material Resources in Low-Carbon Construction. Energies 2024, 17, 575. [Google Scholar] [CrossRef]
- Pan, W.; Zhang, Y.; Jin, W.; Liang, Z.; Wang, M.; Li, Q. Photovoltaic-Based Residential Direct-Current Microgrid and Its Comprehensive Performance Evaluation. Appl. Sci. 2023, 13, 12890. [Google Scholar] [CrossRef]
- Ahmed, S.; El Attar, M.E.; Zouli, N.; Abutaleb, A.; Maafa, I.M.; Ahmed, M.M.; Yousef, A.; Ragab, A. Improving the Thermal Performance and Energy Efficiency of Buildings by Incorporating Biomass Waste into Clay Bricks. Materials 2023, 16, 2893. [Google Scholar] [CrossRef] [PubMed]
- Restrepo-Herrera, D.; Martinez, W.; Trejos-Grisales, L.A.; Restrepo-Cuestas, B.J. A Holistic Approach for Design and Assessment of Building-Integrated Photovoltaics Systems. Appl. Sci. 2023, 13, 746. [Google Scholar] [CrossRef]
- Praveenkumar, S.; Agyekum, E.B.; Kumar, A.; Ampah, J.D.; Afrane, S.; Amjad, F.; Velkin, V.I. Techno-Economics and the Identification of Environmental Barriers to the Development of Concentrated Solar Thermal Power Plants in India. Appl. Sci. 2022, 12, 10400. [Google Scholar] [CrossRef]
- de la Rocha Camba, E.; Petrakopoulou, F. Economic Analysis of a Zero-Water Solar Power Plant for Energy Security. Appl. Sci. 2021, 11, 9639. [Google Scholar] [CrossRef]
- Pereira, L.; Cavaleiro, J.; Barros, L. Economic Assessment of Solar-Powered Residential Battery Energy Storage Systems: The Case of Madeira Island, Portugal. Appl. Sci. 2020, 10, 7366. [Google Scholar] [CrossRef]
- Arsalis, A.; Georghiou, G.E. Thermoeconomic Optimization of a Hybrid Photovoltaic-Solid Oxide Fuel Cell System for Decentralized Application. Appl. Sci. 2019, 9, 5450. [Google Scholar] [CrossRef]
- El-Tamimi, A.M.; El-Sherbeny, S.A.; El-Khateeb, A.E. Application of AIDA to Optimize the Cost-Effectiveness of Photovoltaic Systems. J. Eng. Sci. Technol. 2016, 11, 1583–1596. [Google Scholar]
- Available online: https://oneclicklca.zendesk.com/hc/en-us/articles/360015036980-Impact-Assessment-Categories-CML-TRACI-and-PEF (accessed on 8 February 2024).
- Mikosch, N.; Dettmer, T.; Plaga, B.; Gernuks, M.; Finkbeiner, M. Relevance of Impact Categories and Applicability of Life Cycle Impact Assessment Methods from an Automotive Industry Perspective. Sustainability 2022, 14, 8837. [Google Scholar] [CrossRef]
- Awad, H.A.; Farag, S.A.M.; Hassan, T.M.M. AIDA Method for the Optimization of Low-Cost Photovoltaic Systems and Application to Rural Areas in Egypt. Int. J. Energy Res. 2015, 39, 10925–10938. [Google Scholar]
- Agarski, B.; Budak, I.; Vukelic, D.; Hodolic, J. Fuzzy multi-criteria-based impact category weighting in life cycle assessment. J. Clean. Prod. 2016, 112, 3256–3266. [Google Scholar] [CrossRef]
- Repanovici, R.; Nedelcu, A. Mobile emergency notification apps: Current state, barriers and future potential. Mater. Sci. Eng. 2021, 1009, 012049. [Google Scholar] [CrossRef]
- Paicu, G. Creativitatea—Fundamente, Secrete și Strategii, 2nd ed.; PIM: Iasi, Romania, 2011; ISBN 978-606-13-0502-5. [Google Scholar]
Figure 1.
Phasing of the AIDA method for the optimal election of solutions in product design.

Figure 2.
Both possible solutions used for comparison were constructed by means of 3D printing: (a) a1b2c2d2-type structure; (b) a2b2c2d2-type structure.
Figure 2.
Both possible solutions used for comparison were constructed by means of 3D printing: (a) a1b2c2d2-type structure; (b) a2b2c2d2-type structure.

Figure 3.
Wind loading on the crossbars to which the PV panels are attached.

Figure 4.
Possible solutions for the mounting system obtained by applying the AIDA method and considered for the environmental impact assessment: (a) a1b2c2d2-type structure; (b) a2b2c2d2-type structure.
Figure 4.
Possible solutions for the mounting system obtained by applying the AIDA method and considered for the environmental impact assessment: (a) a1b2c2d2-type structure; (b) a2b2c2d2-type structure.

Figure 5.
Loading on the hook element of the upper component.

Figure 6.
Equivalent von Mises stresses of the components under total loading of 20 kgf: (a) a1b2c2d2-type structure; (b) a2b2c2d2-type structure.
Figure 6.
Equivalent von Mises stresses of the components under total loading of 20 kgf: (a) a1b2c2d2-type structure; (b) a2b2c2d2-type structure.

Figure 7.
Displacement of the components under total loading of 20 kgf: (a) a1b2c2d2-type structure; (b) a2b2c2d2-type structure.
Figure 7.
Displacement of the components under total loading of 20 kgf: (a) a1b2c2d2-type structure; (b) a2b2c2d2-type structure.

Figure 8.
Hot spot stress analysis plot: (a) a1b2c2d2-type structure; (b) a2b2c2d2-type structure.

Figure 9.
Design insight analysis plot: (a) a1b2c2d2-type structure; (b) a2b2c2d2-type structure.

Figure 10.
Environmental Impact calculated for the a1b2c2d2-type structure.

Figure 11.
Component environmental impact for the a1b2c2d2-type structure.

Figure 12.
Environmental impact calculated for the a2b2c2d2-type structure.

Figure 13.
Component environmental impact for the a2b2c2d2-type structure.

Figure 14.
Environmental impact comparison for the fastening components.


Table 1.
Matrix with three values for ordering and weighting of the identified functions.
| A | B | C | D | Score | Rating Ni | Coefficient γj | |
|---|---|---|---|---|---|---|---|
| A | 0.5 | 0 | 0.5 | 0 | 1.0 | 1 | 0.333 |
| B | 1 | 0.5 | 1 | 0 | 2.5 | 3 | 2.167 |
| C | 0.5 | 0 | 0.5 | 0 | 1.0 | 2 | 0.556 |
| D | 1 | 1 | 1 | 0.5 | 3.5 | 4 | 4.750 |
Table 2.
The characteristics by which the intended functions can be accomplished.
| A. Mounting method onto the rigid support | B. Transfer of the clamping force to the crossbar of the PV panel | C. Simple and fast assembly | D. Operational safety |
| a1. Locking clips | b1. Direct fastening with bolts | c1. Separate elements with a simple geometry | d1. The use of the same material for all interlocking components of the proposed system |
| a2. Bolts | b2. Indirect fastening with levers | c2. Preassembled elements | d2. Different materials for different components in the proposed system |
| a3. Self-locking systems | b3. Use of complementary profiles | c3. The use of complementary profiles |
Table 3.
Sorting matrix regarding all possible combination of elements.
| c1 | c2 | c3 | |||||
| d1 | d2 | d1 | d2 | d1 | d2 | ||
| a1 | b1 | x | 0 | 0 | 0 | x | x |
| b2 | x | 0 | 0 | 1 | x | x | |
| b3 | x | x | 0 | 1 | 0 | 1 | |
| a2 | b1 | 0 | 0 | 0 | 0 | x | x |
| b2 | x | 0 | 0 | 1 | x | x | |
| b3 | 0 | 1 | 0 | 1 | 0 | 1 | |
| a3 | b1 | x | x | 0 | 0 | x | x |
| b2 | x | 0 | 0 | 1 | x | x | |
| b3 | x | x | 0 | 1 | 0 | 1 | |
Table 4.
Evaluation matrix regarding the qi coefficient for the retained combinations.
| qi qi × γi | Ranking | |||||
|---|---|---|---|---|---|---|
| A | B | C | D | |||
| a1b2c2d2 | 8 2.66 | 9 19.50 | 10 5.56 | 10 47.50 | 75.22 | 3 |
| a1b3c2d2 | 8 2.66 | 9 19.50 | 10 5.56 | 10 47.50 | 75.22 | 3 |
| a1b3c3d2 | 8 2.66 | 9 19.50 | 9 5.00 | 10 47.50 | 74.66 | 5 |
| a2b2c2d2 | 10 3.33 | 9 19.50 | 10 5.56 | 10 47.50 | 75.89 | 1 |
| a2b3c1d2 | 10 3.33 | 9 19.50 | 7 3.89 | 10 47.50 | 74.22 | 7 |
| a2b3c2d2 | 10 3.33 | 9 19.50 | 10 5.56 | 10 47.50 | 75.89 | 1 |
| a2b3c3d2 | 10 3.33 | 9 19.50 | 9 5.00 | 10 47.50 | 75.33 | 2 |
| a3b2c2d2 | 7 2.33 | 9 19.50 | 10 5.56 | 10 47.50 | 74.89 | 4 |
| a3b3c2d2 | 7 2.33 | 9 19.50 | 10 5.56 | 10 47.50 | 74.89 | 4 |
| a3b3c3d2 | 7 2.33 | 9 19.50 | 9 5.00 | 10 47.50 | 74.33 | 6 |
Table 5.
Criteria satisfaction matrix.
| σα kα × σα | σβ kβ × σβ | σλ kλ × σλ | σψ kψ × σψ | Sop | Ranking | |||
|---|---|---|---|---|---|---|---|---|
| a1b2c2d2 | 4 3 × 4 = 12 | 5 2 × 5 = 10 | 6 1 × 6 = 6 | 4 4 × 4 = 16 | 75.22 | 44 | 3309.68 | 2 |
| a1b3c2d2 | 3 3 × 3 = 9 | 4 2 × 4 = 8 | 4 1 × 4 = 4 | 3 4 × 3 = 12 | 75.22 | 33 | 2482.26 | 5 |
| a1b3c3d2 | 2 3 × 2 = 6 | 3 2 × 3 = 6 | 3 1 × 3 = 3 | 2 4 × 2 = 8 | 74.66 | 23 | 1717.18 | 9 |
| a2b2c2d2 | 5 3 × 5 = 15 | 4 2 × 4 = 8 | 5 1 × 5 = 5 | 5 4 × 5 = 20 | 75.89 | 48 | 3642.72 | 1 |
| a2b3c1d2 | 5 3 × 5 = 15 | 1 2 × 1 = 2 | 4 1 × 4 = 4 | 2 4 × 2 = 8 | 74.22 | 29 | 2152.38 | 6 |
| a2b3c2d2 | 4 3 × 4 = 12 | 3 2 × 3 = 6 | 3 1 × 3 = 3 | 4 4 × 4 = 16 | 75.89 | 37 | 2807.93 | 3 |
| a2b3c3d2 | 3 3 × 3 = 9 | 2 2 × 2 = 4 | 2 1 × 2 = 2 | 3 4 × 3 = 12 | 75.33 | 27 | 2033.91 | 7 |
| a3b2c2d2 | 3 3 × 3 = 9 | 6 2 × 6 = 12 | 4 1 × 4 = 4 | 3 4 × 3 = 12 | 74.89 | 37 | 2770.93 | 4 |
| a3b3c2d2 | 2 3 × 2 = 6 | 5 2 × 5 = 10 | 2 1 × 2 = 2 | 2 4 × 2 = 8 | 74.89 | 26 | 1947.14 | 8 |
| a3b3c3d2 | 1 3 × 1 = 3 | 4 2 × 4 = 8 | 1 1 × 1 = 1 | 1 4 × 1 = 4 | 74.33 | 16 | 1189.28 | 10 |
Table 6.
Print settings recommended for high speed and high strength components.
| Speed Settings | Strong Settings | |
|---|---|---|
| Nozzle diameter | 0.4 mm | |
| Nozzle temperature | 210–230 °C | |
| Print speed | 120–150 mm/s | 40–70 mm/s |
| Bed temperature | 60 °C | |
| Bed modification | Below 60 °C glue | Below 60 °C tape |
| Infill density | 15–20% | ≥25% higher = stronger |
| Fan speed | 100% | 0–50% |
| Shell thickness | 0.8 mm | 1.2–1.6 mm |
| Layer height | 0.2 mm | ≥0.06 mm |
Table 7.
Input data regarding the environmental impact assessment.
| Assembly Process | ||
|---|---|---|
| Region: | Europe | |
| Built to last: | 8.0 years | |
| Use | ||
| Region: | Europe | |
| Duration of use: | 8.0 years | |
| Transportation | ||
| Truck distance: | 850 km | |
| Train distance: | 1250 km | |
| End of life | ||
| Recycled: | 97.5% | |
| Incinerated: | 2.5% | |
| Landfill: | 0.00% |
Disclaimer/Publisher’s Note: The statements, opinions and data contained in all publications are solely those of the individual author(s) and contributor(s) and not of MDPI and/or the editor(s). MDPI and/or the editor(s) disclaim responsibility for any injury to people or property resulting from any ideas, methods, instructions or products referred to in the content. |
© 2024 by the authors. Licensee MDPI, Basel, Switzerland. This article is an open access article distributed under the terms and conditions of the Creative Commons Attribution (CC BY) license (https://creativecommons.org/licenses/by/4.0/).
Share and Cite
MDPI and ACS Style
Ciubotariu, V.A.; Grigoras, C.C.; Zichil, V.; Chirita, B.A. Using the AIDA Method in the Design of New Elements for the Photovoltaic Mounting Structures. Machines 2024, 12, 211. https://doi.org/10.3390/machines12030211
AMA Style
Ciubotariu VA, Grigoras CC, Zichil V, Chirita BA. Using the AIDA Method in the Design of New Elements for the Photovoltaic Mounting Structures. Machines. 2024; 12(3):211. https://doi.org/10.3390/machines12030211
Chicago/Turabian StyleCiubotariu, Vlad Andrei, Cosmin Constantin Grigoras, Valentin Zichil, and Bogdan Alexandru Chirita. 2024. "Using the AIDA Method in the Design of New Elements for the Photovoltaic Mounting Structures" Machines 12, no. 3: 211. https://doi.org/10.3390/machines12030211
Note that from the first issue of 2016, this journal uses article numbers instead of page numbers. See further details here.