Article

On the Integrity of Large-Scale Direct-Drive Wind Turbine Electrical Generator Structures: An Integrated Design Methodology for Optimisation, Considering Thermal Loads and Novel Techniques

1
School of Computing, Engineering and the Built Environment, Edinburgh Napier University, 10 Colinton Road, Edinburgh EH10 5DT, UK
2
Naval Architecture, Ocean and Marine Engineering Department, University of Strathclyde, 100 Montrose Street, Glasgow G4 0LZ, UK
*
Author to whom correspondence should be addressed.
Machines 2024, 12(4), 277; https://doi.org/10.3390/machines12040277
Submission received: 7 March 2024 / Revised: 16 April 2024 / Accepted: 17 April 2024 / Published: 21 April 2024
(This article belongs to the Special Issue Design and Dynamic Control of Wind Turbines)

Abstract

:
With the rapid expansion of offshore wind capacity worldwide, minimising operation and maintenance requirements is pivotal. Regarded as a low-maintenance alternative to conventional drivetrain systems, direct-drive generators are increasingly commonplace for wind turbines in hard-to-service areas. To facilitate higher torque requirements consequent to low-speed operation, these machines are bulky, greatly increasing nacelle size and mass over their counterparts. This paper therefore details the structural optimisation of the International Energy Agency 15 MW Reference Wind Turbine rotor through iterative Parameter and Topology Optimisation and the inclusion of additional structural members, with consideration to its mechanical, modal, and thermal performances. With temperature found to have a significant impact on the structural integrity of multi-megawatt direct-drive machines, a Computational Fluid Dynamics analysis was carried out to map the temperature of the structure during operation and inform a consequent Finite Element Method analysis. This process, novel to this paper, found that topologically optimised structures outperform parametrically optimised structures thermally and that integrated heatsinks can be employed to further reduce deformation. Lastly, generative design techniques were used to further optimise the structure, reducing its mass, deformation, and maximum stress and expanding its operating envelope. This study reaches several key conclusions, demonstrating that significant mass reductions are achievable through the removal of cylinder wall geometry areas as well as through the implementation of structural supports and iterative parametric and topology optimisation techniques. Through the flexibility it grants, generative design was found to be a powerful tool, delivering further improvements to an already efficient, yet complex design. Heatsinks were found to lower generator structural temperatures, which may yield lower active cooling requirements whilst providing structural support. Lastly, the link between the increased mass and the increased financial and environmental impact of the rotor was confirmed.

1. Introduction

To capitalise on steadier, stronger, and less turbulent wind conditions and sidestep restricted and limited land availability, the wind industry continues to expand offshore capacity. For the UK’s wind energy pipeline, 18 projects awaiting or under construction are offshore, representing less than 7% of the total 262 projects; yet, these 18 farms provide 74.5% of the total new potential wind energy capacity [1].
Evidence shows that economies of scale for offshore wind energy exist relative to the size of the individual turbine and not in the overall farm size [2]; therefore, in seeking to maximise profit offshore, the industry pushes the envelope of ever larger individual wind turbines. This trend is reflected in the UK wind energy pipeline, where the average offshore wind turbine size currently in operation is 4.9 MW, moving to 9.6 MW for projects currently under construction and 10.7 MW for projects awaiting construction, as of April 2023 [1]. In contrast, average turbine sizes onshore are seeing an increase from 1.9 MW for turbines currently operating to 2.9 MW for turbines under construction and a decrease to 2.3 MW for turbines awaiting construction.
The move to offshore wind brings inherent challenges; turbines are naturally less accessible and therefore serviceable, with access subject to service vessel availability and weather conditions. Indeed, operation and maintenance costs are thought to account for 23% [3] to as much as 35% [4] of the total LCOE for offshore wind, compared to 5% for onshore wind [3]. Reducing maintenance and downtime is therefore a key priority for offshore wind operators, with one prominent approach being to move from a conventional, geared drivetrain to direct-drive generation. Due to their complexity and increased number of moving parts, there exists a direct correlation between the number of gearbox stages and the increased costs of maintenance, with geared transmission systems found to fail around 40% more often than their direct-drive counterparts [5].
By virtue of their low operating speeds and as made clear by Equation (1), where P is power (W), T is torque (Nm), and ω is the rotational velocity (rads/s), higher torques must be generated within the direct-drive machine to produce the desired power output. Increasing the generator’s airgap radius is the most immediate means to do so, as demonstrated by Equation (2), where R is the generator’s airgap radius (m), σ is the electromagnetic shear stress (Pa), and L is the stack or magnet length (m).
P = T ω
T = 2 π R 2 σ L
The resulting generators are vastly larger and heavier in comparison to conventional drivetrains and therefore have increased supporting requirements, consequently increasing capital costs and structural complexity. Accordingly, there has been a sustained focus on the light-weighting and optimisation of these large-scale direct-drive generator supporting structures in recent years.
In Ref. [6], the use of additive manufacturing is explored as a means to enable complex designs not possible through conventional techniques for light-weighting the stator structure of a 5 MW Permanent Magnet, Direct-Drive (PMDD) wind turbine generator. This study found that complex lattice structures enabled by additive manufacturing have the potential to lower the mass of generator-supporting structures by as much as 39%. Hybrid additive manufacturing techniques were investigated in [7], in the production of Triply Periodic Minimal Surface (TPMS)-based supporting structures for a 5 MW PMDD wind turbine generator. The use of TPMS in lieu of a simple disk support was found to permit a mass reduction of 34%. Along with the use of stiffeners and the addition of holes in the supporting structure of the International Energy Agency’s (IEA) 15 MW Reference Wind Turbine (RWT) [8] rotor, parametric optimisation was used to reduce the mass of the supporting structure necessary to achieve stiffness and stress limits under expected operating conditions. The removal of mass through holes in the rotor disk was found to enable a mass reduction of 20% and 34% under uniform and non-uniform loading scenarios, respectively. Generative design techniques were employed [9] alongside conventional structural optimisation techniques to drive an automated iterative design process in an effort to optimise the structure of a 3 MW PMDD generator for stiffness and weight, achieving a 4% reduction in structural mass, whilst potentially expanding the structures’ operating frequency range.
Understanding the loads within direct-drive generators of this scale allows for more precise and, therefore, efficient optimisation of their supporting structures. For example, [10] examines the stresses arising from dynamic wind and wave loading on the semi-submersible platform of the Denmark Technical University (DTU) 10 MW RWT, with the aim to better inform a comprehensive design procedure, whilst [11] proposes a medium-speed drivetrain for the DTU 10 MW RWT and analyses its dynamic response, likewise through an aero-servo-hydro-elastic simulation. The fatigue life performance of the drivetrain is also obtained through an analysis of the drivetrain’s stress duration distributions and long-term environmental condition distributions.
One important parameter of any wind turbine generator is the thermal stress it is subject to through operation, and although it is certainly not a new concern, it has typically been discussed within the context of power converter efficiencies and the reliability of the power electronics and not in reference to the integrity and efficiency of the generator supporting structure. Reference [12] is one such paper which represents the former, discussing the relationships between wind speed and roughness and power converter electronic temperatures within a 10 MW direct-drive generator, finding that variable wind speeds significantly lessen the lifespan of generator-side power converter components, in part due to cyclic thermal effects.
In [13], however, through a study of the influence of expected operating parameters on the integrity of the IEA-15 MW-RWT rotor structure, Bichan et al. established that the operating temperature of the generator has a considerable influence on the integrity of the supporting structure. As the structure is scaled to meet stress and deformation constraints through parameter optimisation, thermal expansion was the only load on the generator structure found to increase deformation when the thicknesses of both the cylinder and the disk are increased in a bid to meet the deformation caused by other loads. By introducing an operating temperature of 55.7 °C to a rotor structure that had been parametrically optimised to a deformation constraint of 1 mm, it was found that deformation increased by ~117% to 2.15 mm. A report in which Northern Power detailed their partnership with the National Renewable Energy Laboratory in seeking to progress wind turbine drivetrain design found that a 1.5 MW direct-drive generator experienced a peak generator temperature of 58.9 °C during rated power conditions, whilst stator winding temperatures were found to reach 120.2 °C [14].
Given the significance of the finding in [13], it was decided that the investigation and modelling of the heat generation and transfer within the generator would enhance our understanding and better inform the design process. As such, this paper presents a one-way, sequentially coupled Computational Fluid Dynamics (CFD) and Finite Element Analysis (FEA) simulation developed for the IEA-15 MW-RWT rotor, which models generator losses as radiant heat in CFD and then applies the resulting temperature contour map to the rotor structure within FEA, alongside the established loading conditions. Additionally, to produce a structurally compliant design with a minimal increase in mass, the IEA-15 MW-RWT rotor was optimised iteratively using parametric and topology optimisation techniques and the use of additional structural members. Its structural performances under no thermal load, 56 °C, and CFD simulation conditions and its financial and environmental performances were then compared to a purely parameter-optimised design. Heatsinks were also investigated and found to decrease rotor body temperatures whilst providing structural support, consequently decreasing deformation. A modal analysis of the resulting rotor structures was carried out, which was also used to inform the design process. Lastly, generative design was then employed in a bid to further optimise the device.

2. Materials and Methods

The main aim of this paper is to propose a methodology for producing an optimised rotor for the IEA-15 MW-RWT, which comprehensively accounts for the loading conditions by which it operates by first furthering the understanding of the effects that operating loads and conditions have on the structural integrity of large-scale, direct-drive generators and then investigating the ways in which the most significant and detrimental operating conditions can be mitigated. In doing so, several objectives are outlined, as follows:
  • Quantify the production of heat within the generator and determine the consequences this has on the structural integrity of the rotor.
  • Incorporate and evaluate the effectiveness of heat mitigation devices.
  • Produce a rotor structure optimised according to the current understanding of generator loads using innovative techniques.
  • Quantify the financial and environmental impacts of producing the optimised rotor.
As such, there are several loads that have been established as crucial and must therefore be accounted for in the design of large-scale PMDD generators. These loads, outlined in Section 2.2, cause stress on the structure that in turn causes the structure to deflect, and deformation can manifest in several mode shapes, as outlined in Section 2.3. As established in [13], the operating temperature plays an important role in the integrity of PMDD structures, and accordingly, novel to this paper, Computational Fluid Dynamics (CFD) has been used to predict the rotor structure operating temperature. These processes are presented in Section 2.4.
To reflect the movement to large-scale, multi-megawatt turbines within the offshore wind industry, the rotor used to facilitate the research carried out in this paper belongs to the IEA-15 MW Reference Wind Turbine [8], shown in Figure 1. The 15 MW RWT features an IEC Class 1B, radial flux, outer rotor, and permanent-magnet synchronous machine. The single-sided, disk-supported generator structure has an airgap radius of 5.08 m, an airgap length of 1/1000th of its diameter (10.16 mm), and a stack length of 2.17 m. CAD models of the full generator assembly are available on the turbines’ GitHub repository [15].
In this paper, the IEA-15 MW-RWT rotor has been optimised iteratively using parametric and topology optimisation techniques, and this process is detailed in Section 2.3. Also novel to this paper, and in conjunction with the optimisation process, heatsinks were developed in Section 5 and subsequently tested within the CFD and FEA environments. The environmental and financial performance of the resulting geometries are then evaluated according to the process outlined in [13]. Finally, generative design was employed in a bid to further improve the model, and the resulting geometry’s structural and modal performances were analysed. The diagram in Figure 2 details the work undertaken in this paper, where the red numbers indicate the stage each process belongs to, and the order taken within the project.

2.1. Direct-Drive Generator Operation

To effectively and efficiently design PMDD generator structures and ensure their integrity during operation, there are several inherent loads on the structure that must be accounted for.
Maxwell stress arises as a consequence of the attraction between the magnetism produced by the stator and the permanent magnets mounted on the rotor and is the largest of the operating loads. The local magnetic stress experienced by the rotor under different deflection modes, through its circumference, can be estimated using Equation (3) [16], below.
σ PM ( θ , δ ¯ , δ Δ ) = F ^ 2 PM cos 2 ( p θ ) μ 0 2 ( g + h m μ r δ ¯ ) 2 [ 1 + 2 δ Δ sin ( n θ ) g + h m μ r δ ¯ + δ Δ 2 sin 2 ( n θ ) ( g + h m μ r δ ¯ ) 2 ]   F ^ 2 PM 4 ( g + h m μ r δ ¯ ) 2 [ 1 + 2 δ Δ sin ( n θ ) g + h m μ r δ ¯ + δ Δ 2 sin 2 ( n θ ) ( g + h m μ r δ ¯ ) 2 ]
where σ PM is the normal magnetic component of the Maxwell stress (Pa). θ is the pitch angle, δ ¯ represents the mean radial deflection (m), and δ Δ is the variable deflection (m); these three parameters produce the total deflection. F ^ is the magnetomotive force produced by armature windings’ current and the rotor field (N); p is the total number of generator pole pairs; μ 0 corresponds to the permeability of free space (H/m); n represents the mode of deflection; g is the nominal airgap clearance (m); h m is the magnet height measured from the surface of the rotor (m); and μ r is the relative permeability of air. Equation (3) can be used to estimate the localised magnetic stress for each mode and hence used to determine the total deflection experienced under each mode. The second largest force experienced by the rotor is the shear stress that is generated as mechanical energy is converted to electrical energy, and under steady-state conditions this force counterbalances an equal and opposite force experienced by the stator. Gravitational loads, whilst constantly present, are of critical importance to consider during transportation and installation. Due to the low-speed nature of direct-drive operation, centrifugal forces are present but small. Electrical and mechanical losses within the generator naturally raise the operating temperature, which causes thermal expansion of the structure. Reference [13] examines the effect of operating temperature on generator structural integrity and finds it to considerably increase as the rotor structure is scaled up to meet the stiffness requirements imposed by the electromagnetic and gravitational forces.
Likewise, there exists a number of different rotor-supporting topologies, such as the simple single-sided disk-supported rotor outlined in the IEA-15 MW-RWT’s supporting documentation [8] or the variations of spoked, conical, and other supports detailed in [17] and displayed in Figure 3.
Rotor structure deformation can occur in a number of ways, and therefore, closure of the airgap and structural failure can occur, as demonstrated in Figure 4, where the deformation of the outer rotor under different mode shapes are shown, with the undeformed shape in black and the deformed shape in grey-arising from the electromagnetic forces represented by arrows
where, as stated in [16],
(a) is Mode 0: radial expansion of the outer rotor into the airgap, δ ( θ ) = δ ¯
(b) is Mode 1: relative displacement of the rotor, δ ( θ ) = δ ¯ + δ Δ   s i n ( θ φ )
(c) is Mode 2: elliptical distortion of the rotor surface, δ ( θ ) = δ ¯ + δ Δ   s i n ( 2 ( θ φ ) )
(d) is Mode 3: rippled distortion of the rotor surface, δ ( θ ) = δ ¯ + δ Δ s i n ( 3 ( θ φ ) )
and
δ ( θ ) is the local variation of airgap clearance (m) at angle θ , δ ¯ represents the mean radial deflection (m), δ Δ is the variable deflection (m), and φ is the phase angle of the component.

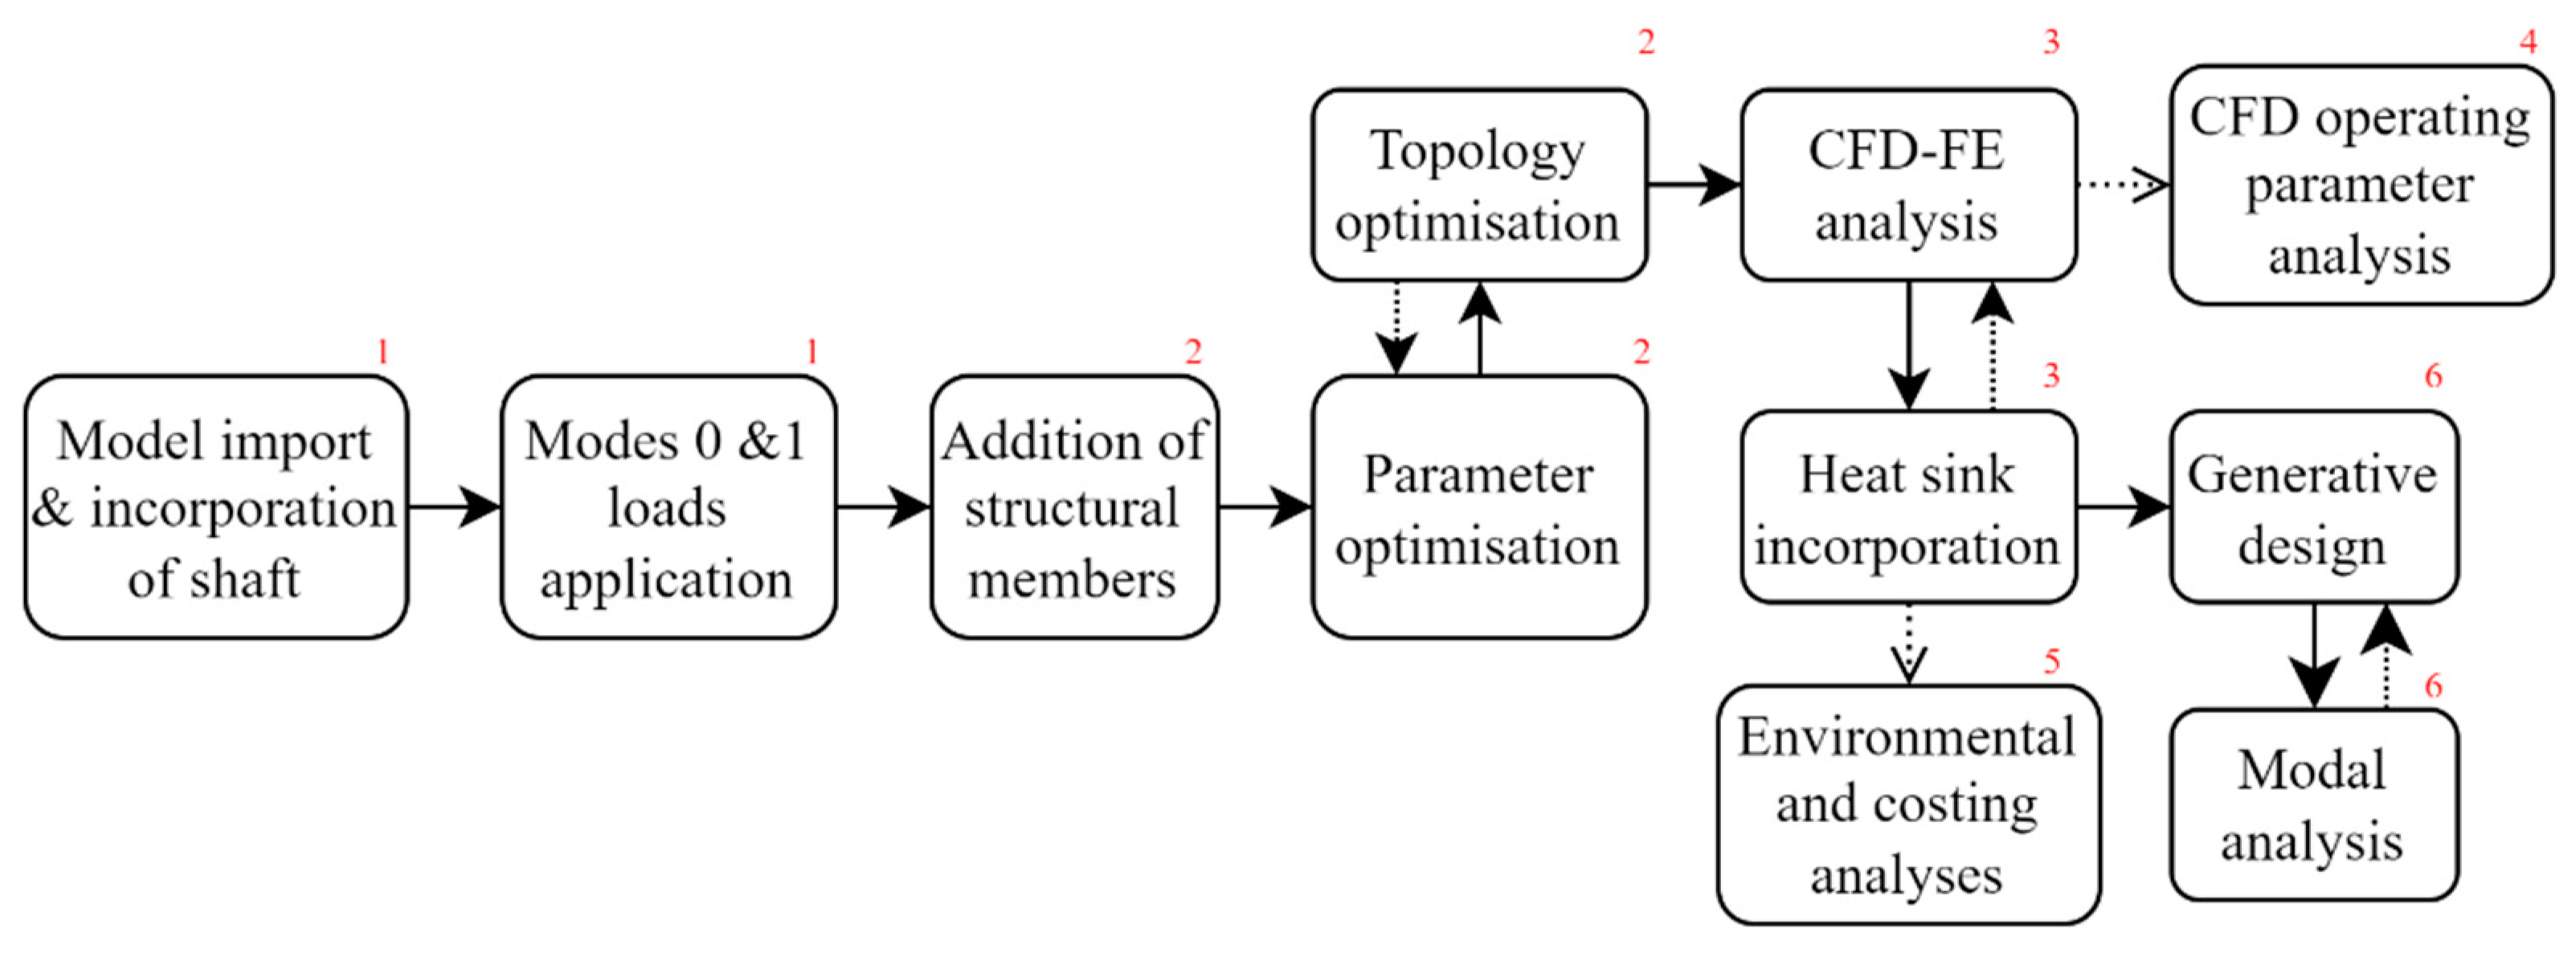
2.2. Facilitation of Simulation, Optimisation, and Performance Analysis

The original rotor part was obtained from the IEA GitHub repository [15], and using the ANSYS CAD Configuration Manager, was imported from SolidWorks [18], with a direct link to the ANSYS Workbench [19]. This link between the software is such that the changes to the geometry made through Ansys’ optimisation process were made simultaneously in SolidWorks, allowing for the instant visualisation of these changes. This immediate visual feedback was found to aid in identifying areas requiring greater structural support, for example, and ultimately accelerated the optimisation process. Likewise, the use of both software and the link between them provided greater opportunities to analyse the performance of the structure under a wider range of operating scenarios and criteria.
As this paper builds on the work detailed in [13], the structural material it used (Carbon Steel SA216 (Type WCC), Cast, Annealed) was likewise applied to the rotor structure, and an initial structural analysis was carried out using ANSYS’s static structural and steady-state thermal modules, as per the process outlined in [13]. The same mesh parameters as those in [13] were used; however, by modifying the process described in the paper, the rotor’s mounting cylinder was additionally incorporated at this stage. Parameter optimisation was carried out using the response surface optimisation module, and topology optimisation was achieved using ANSYS’s structural optimisation module.
SolidWorks’ integrated Sustainability software [20] provided the means to evaluate the resulting rotors’ environmental impact, whilst the SolidWorks costing tool [21] provided an estimate for the cost of manufacturing the rotor geometry. A CFD analysis was set up in SolidWorks Flow Simulation, with the resulting rotor temperature contour map used as an input in a further FEA analysis of the final optimised rotor structure in SolidWorks Simulation. Using the same linked CFD-FEA simulation process, a parameter-optimised rotor was likewise analysed, as were several derivative structures produced in this paper, which incorporate various integrated heatsinks, in order to evaluate their effectiveness in reducing temperatures experienced by the rotor during operation and hence reduce their structural deformation.
Two sets of operating loads were modelled, as detailed in Section 2.2.1 and Section 2.2.2.

2.2.1. Mode 0

First, a fixed support was added to the inside face of the rotor disk. A static radial compression load of 447 kPa was applied normally and uniformly to the inner cylinder surface to represent Maxwell’s electromagnetic stress ( σ PM ), and a torque ( τ f ) of 21 MNm was applied uniformly and tangentially to the inner cylinder surface. To account for centrifugal forces, a rotational velocity (ω) of 0.79 rads−1 was applied. Standard earth gravity (g), accounting for the rotor’s 6° upward tilt, resulting in an in-plane component of 9.76 ms−2, was also applied. Lastly, in contrast to previous literature [13], a fixed weight of 24,289 kg was applied uniformly to the inner cylinder surface to represent the mass of the magnets, as calculated from the figures provided in the IEA’s definition document. Previously, the mass of the back iron was also accounted for in this figure; however, in this work, it was determined that the carbon steel applied to the rotor would be adequate for the purposes of a back iron and that there is thus no requirement to account for an additional back iron material. If, for example, alternative lightweight composite materials are considered for use in the rotor structure in the future, then, an additional back iron material will need to be accounted for. For this reason, however, simultaneous to the advanced rotor optimisation, a new parameter-optimised rotor was produced following the process outlined in Reference [13] to investigate the incorporation of heatsinks and provide a comparison with the advanced rotor.
These Mode 0 loads can be seen applied to the rotor structure below, in Figure 5.

2.2.2. Mode 1

Torque ( τ f ), rotational velocity (ω), and the in-plane component of gravity (g) were all unchanged from Mode 0, however, under Mode 1 loading, Maxwell’s stress ( σ PM ) was applied sinusoidally between a minimum of 433.4 kPa and a maximum of 461.7 kPa, as calculated following Equation (4) [16]:
σ θ PM = B ^ 2 2 μ 0 [ 1 + 2 δ Δ g + h m μ r δ ¯ ]
where B ^ is the peak airgap flux density and g is the nominal airgap clearance.

2.3. Structural Optimisation Process

To enable greater flexibility of design, the mounting cylinder of the rotor was incorporated, as can be seen in Figure 6, to provide a means to affix inner disk supports. These inner supports were added in advance of the initial parameter optimisation and in doing so, the thicknesses of these supports and the mounting cylinder were also optimised alongside the disk and cylinder in the process outlined in Section 2.3.1. The optimisation of the final rotor was carried out under Modes 0 and 1 loading scenarios, and both parametric and topology optimisation processes were iterated to amplify the benefits of both. The initial analysis of the unaltered IEA rotor saw deformation and stress increase from Mode 0 to Mode 1 by 50 and 44%, respectively, necessitating the incorporation of Mode 1 into the optimisation process.
As detailed in Section 2.6, generative design was also used to further explore a more ambitious optimisation of the rotor by capitalising on the flexibility that generative design affords the designer.

2.3.1. Parameter Optimisation

The optimisation of the cylinder wall thickness was carried out by modifying the outside cylinder radius so as to not change the airgap diameter; likewise, disk thickness was optimised by its outer surface so as to not change the generators stack length, and the wall thickness of the mounting shaft was characterised by its outside radius. These values were parameterised using the Response Surface Optimisation tool, and the resulting geometry was optimised to minimise total mass within the imposed deformation limit.
Initially, each dimension had a lower limit set to a 50% reduction and an upper limit of 300% of its original value, corresponding to ranges of 41 mm to 246 mm for disk thickness and 127.3 mm to 763.8 mm for cylinder wall thickness. The mounting shaft and the structural supports all had an imposed thickness range of 50 mm to 300 mm, and an early example of the rotor through this stage can be seen in Figure 6. To provide flexibility of design in the topology optimisation stage, a maximum deformation limit of 1 mm ± 10% was imposed during parameter optimisation.
The response surface tool provides insight into each parameter’s sensitivity to, and hence, contribution to mass. As shown in Figure 7, cylinder wall thickness has the largest sensitivity by a considerable margin at 72%, compared to local sensitivities of 9 and 12%, respectively, for the mounting shaft and disk thicknesses and the support thickness of 7%, thus meaning more mass is added to the rotor per mm increase to the cylinders’ thickness than a comparable change in the thickness of the other components due to the geometry of the device. Given that augmentation of the cylinder thickness results in the addition of mass at a large distance from the rotor’s centre of mass and load path, the finding in [13] that increases in cylinder thickness resultantly increases total deformation further confirms the importance of reducing its mass.

2.3.2. Topology Optimisation and Addition of Structural Members

Topology optimisation was then used on the parametrically optimised rotor to allow for the removal of redundant areas not contributing to structural integrity through a density-based topological optimisation method. Mass retention goals were imposed on the supporting structure with a minimum of 5% and a maximum of 20% mass removal so that a minimum mass reduction can be achieved without the excessive removal of material, thus allowing for a visible repeating pattern of removed mass to be produced under both Mode 0 and Mode 1 loading, as seen in Figure 8.
The repeated patterns shown in Figure 8 consist of curved sections around the centre of the rotor, with curvature leading in the direction of rotation, counterclockwise from the perspective of the viewer. From this, a manual interpretation and reconstruction was carried out in CAD such that a manufacturable design could be produced and that structural members could be employed between the mounting cylinder and the disk.
As the deformation pattern of the rotor showed that primary deflections occur in the disk, a series of additional disk supports were added to both faces of the disk, with partial-span inner supports, as seen in Figure 9, as well as full-radius outer supports.
Topology optimisation also suggested that a series of 6 oblong regions could be removed from the cylinder wall for further mass reduction. Initially, full-depth cut-outs were explored; however, after it was determined that the chosen rotor material is a suitable back iron material and that an additional material was not required for this purpose, partial-depth cut-outs accounting for the appropriate depth to be left as back iron material were explored to facilitate further mass reduction.
Further development of the cylinder cut-out modifications was carried out through a series of manual iterations, with the final rotor taking the form of two offset rings formed of 32 holes each, equally spaced around the cylinder’s circumference, with hole diameters of 765 mm. Lastly, considerations were made to incorporate external cylinder spars, which served to further reduce deformation and act as heatsinks; this is explained further in Section 2.5.

2.4. CFD-FEA Simulation Development

Although small-scale electrical machines are known to have fins incorporated to facilitate cooling, heatsinks have not yet been documented in large-scale machines. Given that [13] proved the significance of rotor operating temperatures on structural integrity and, therefore, the need to design with operating temperature in mind, it was assumed that exploring the application of heatsinks in large-scale devices was justified; however, an accurate evaluation of their effectiveness necessitates CFD analysis. As such, a direct, one-way, sequentially coupled, steady-state computational model was produced. This allowed for the simulation of heat produced through ohmic copper losses at the stator and transmitted radiantly to the rotor structure, with the resulting temperature contour map applied to the structure in FEA, alongside the established electromechanical loads.
In SolidWorks Flow Simulation, an external time-independent simulation was created, with heat conduction in solids and radiation through the Discrete Transfer method enabled at an ambient environmental temperature of 20 °C. Gravity was enabled, with a value of 9.76 ms−2 to reflect its major in-plane component, and the rotor was set to rotate at 0.79 rads−1 with an initial temperature of 20 °C. The inside surface of the cylinder or mounting cylinder was set to fixed, air was selected as the default fluid, and the flow type was set to laminar and turbulent, with the default settings for turbulence intensity and length of 0.1% and 0.02627 m selected, respectively.
A 20 × 20 × 20 m, cubic computational domain centred at the rotor’s origin was created, and a local mesh region was implemented for better control over flow capture and heat transfer at the rotor’s surface, encapsulating the rotor within a cylinder of 5.6 m radius and a length of 200 mm upstream and downstream of the rotor’s outer edges, producing a mesh of 601,686 total cells, split between 335,208 fluid cells and 246,478 solid cells for the advanced rotor.
In Table 2 presented in Reference [22], the electromagnetic and mechanical losses of a liquid-cooled 8 MW PMDD synchronous generator are presented. These losses were summed to 591.2 kW, or ~7.4% of its rated power, assuming the same loss rate applied to the 15 MW generator produces a total generator loss of 1108.5 W. This is in line with [14], in which 109.25 kW of heat is rejected from a 1.5 MW PMDD device, equating to a loss of 7.3%. As the majority (93%) of the generator losses in [22] is incurred through ohmic copper losses, and owing to the simplicity of the rotor-only CAD model used in this paper, we decided to allocate the full 1108.5 kW as radiant heat originating from a copper dummy stator. The dummy incorporated into the CFD simulation, shown in Figure 10, is a solid cylindrical body, with a thickness of 400 mm to represent the bulk thickness of the stator coils at a distance of 10 mm from the rotor body, in keeping with the airgap length.
It should be noted that the IEA-15 MW-RWT definition document lists the full-load electrical efficiency at 96.55%, resulting in a loss of 517.5 kW. This was likewise allocated to the rotor for consideration in the operating parameter analysis. Note that the document does not describe the use of any cooling method for the machine and that, therefore, this work assumes that the machine regulates temperature solely through air cooling.
Given that the IEA-15 MW-RWT possesses an outer rotor, the opportunity exists to incorporate a heatsink that is exposed to the turbines’ ambient operating environment, providing a passive means to cool the generator structure. Cooling methods are widely used for regulating the operating temperatures of the active material in wind turbine generators. However, since the definition document does not specify any method in particular, this work assumes the incorporation of a fan intended to cool both the active material and the structure itself, rather than modelling wind on the exposed outer surfaces, and active cooling on the inside surfaces. Accordingly, an airflow with an ambient temperature of 20 °C was set to run globally along the axis of rotation, driven by a cooling fan upstream of the rotor and linked to the driveshaft at a 1:1 gear ratio. Based on an operating rotational velocity of 0.79 rads−1, the linear velocity of the airflow was calculated to be 4.1 ms−1. ‘Steel, cast, smooth, and oxidised’ was assigned as the rotors’ default wall radiative surface, with a 0-micrometre surface roughness. The surface of the dummy stator was assigned the Radiative Surface material of ‘Copper, Polished’, and a surface heat generation rate of 1108.5 kW was applied to the dummy surface.
For the external aluminium heatsink devices described in Section 2.5, an additional thermal resistance was incorporated to account for an epoxy material in order to bond the surfaces of the heatsink and rotor structure. Fujipoly GR80 was selected, with a thickness of 0.1 mm.
The stopping criteria for the CFD simulation were set such that net radiant heat flux at the surface of the stator dummy, where negative flux indicates heat emitted and positive indicates heat absorbed, and, in this case, was measured at the stator dummy (see Figure 11), along with average and maximum heat generation rates at the stator dummy, and rotor volume and surface temperatures were all achieved, with no limit on iteration count. It is important to note that no additional or outside heat sources were considered.
Three scenarios were created for structural analysis in SolidWorks Simulation; the first two replicated the models defined previously in ANSYS, implementing identical mechanical electromagnetic loads and operating temperatures. This facilitated a direct comparison between the parameter-optimised rotor and the heatsink designs adapted from that rotor and the advanced design produced in this paper whilst validating the SolidWorks Simulation set-up through results corroboration. For the final simulation, the results of the respective thermal CFD analyses were carried into FEA and applied to each respective geometry in lieu of the ~55.7 °C universal operating temperature used in [13].
It is important to note that the dummy stator implemented to facilitate the CFD analysis was excluded from the FEA analysis and that only the Mode 0 loading scenario described in Section 2.2.1 was applied through Finite Element Analysis.
A high-density blended curvature-based mesh was implemented with parabolic tetrahedral mesh elements that correspond to ANSYS’s SOLID227 3D 10-Node Coupled-Field [23] mesh element type, which allows for the simulation of coupled physics between structural, thermal, and electrical disciplines. Maximum and minimum element sizes of 100 mm and 7.5 mm were set, respectively, with an element growth ratio of 1.4, producing a high-quality mesh with 471,151 nodes and 260,646 elements in total, for the advanced rotor.
To further the understanding of the impact of operating conditions on the structure of direct-drive generators, an extended set of operating conditions was also incorporated and applied to both the parameter-optimised and advanced rotor designs. It was assumed that a permanent gearing ratio could be introduced from the rotor to the fan, and as such, fan flow velocity was varied between 1:2 and 3:1 gearing ratios with the rotor, producing a range of 4 flow speeds: 2.05 ms−1, 4.1 ms−1, 8.2 ms−1, and 12.4 ms−1. Ambient temperatures were set between 0 °C and 50 °C through increments of 10 °C, and lastly, 3 further simulations were run, which assumed that overall generator losses could be reduced by 10 and 20% and that the efficiency defined in the IEA’s documentation could be achieved.
Lastly, one further CFD scenario was added, which incorporated magnets into the baseline rotor design and moved the dummy stator to respect the 10-mm airgap length, thus allowing the quantification of the effect of the magnets on rotor temperature to determine whether their inclusion is necessary.

2.5. Incorporation of Heatsinks

The parameter-optimised rotor was produced following the process defined in [13], with the assumption that the back iron could be accounted for in the chosen material used as the canvas for the development and evaluation of various heatsink prototypes.
Initially, two retrofit, extrinsic heatsink designs were considered as it was thought that the development of such devices would provide the opportunity to improve the thermal performance of existing rotors retroactively. With a goal of minimising increased mass, aluminium was chosen as the starting material for its reduced density over copper, despite copper’s improved thermal properties. Price also favours aluminium, with the ANSYS Granta materials database [24] finding aluminium to be around one-third the price of copper by weight.
Both mounted on a base of 10 mm and as one solid part, the first heatsink comprised 90 fins at a height of 90 mm and width of 40 mm, extruded along the full length of the cylinder and the second consisted of two offset rows of 6 pins of 130 mm diameter and a height of 95 mm, repeated along the circumference with 45 equally spaced instances for each row, amounting to a total of 90 rows and 540 pins. To provide a performance comparison of the two different geometries, they were designed with the same mass of aluminium and are shown below in Figure 12.
Whilst through retrofit, these heatsinks may provide an opportunity to improve the thermal performance of existing rotors, it was determined that from a sustainability and manufacturing perspective, they would underperform integrated, homogenous heatsinks as they require additional manufacturing steps as well as an epoxy material that incurs additional cost and complicates the recycling process.
As such, four fin-based integrated heatsink rotor variations were also created, which can be seen in Figure 13. These designs were assumed to be castable with the rotor as one part and as such, are made of the same carbon steel as the rotor.
The first two comprise 90 fins, with the material roughly equal in volume and mass to the external heatsink designs, with fin widths and heights of 51 mm and 125 mm for the large-90 fin design and 30 mm and 73.5 mm for the small-90 fin design, respectively. The third and fourth comprise 180 fins, again equal in volume and mass to the external heatsinks by halving the widths of their 90-fin counterparts. These designs are henceforth referred to as the large-90, small-90, large-180, and small-180 heatsink models. As these heatsink designs are integrated into the rotor as one body, the need for a base is removed, meaning all additional material can be allocated to the heatsink fins. These designs were deemed readily sand-castable, requiring no extra manufacturing steps beyond the baseline. It is also apparent that the advent of additive and hybrid manufacturing may bring opportunities for more sophisticated heatsink designs in the future.
The last heatsink design, shown in Figure 14, was incorporated into the final iteration of the advanced rotor. A total of 176 helical supports of 125 mm in height and 12.76 mm in width were added to the outside cylinder wall of the advanced rotor. Straight heatsinks, parallel to the axis of rotation were also tested through the original optimisation process but were found to underperform the helical fins under the imposed static loading conditions. For simplicity, this final rotor geometry will henceforth be referred to as the advanced rotor. It is important to note that the heatsinks developed for the advanced rotor are discontinuous over the regions with cylinder cut-outs, used to achieve further mass reduction from the cylinder wall, described in Section 2.3.2.
The details of all heatsink devices explored in this paper are presented in Table 1.

2.6. Generative Design

Conventional structural optimisation techniques are often difficult and time-consuming for a complex topology; although traditional topology optimisation is effective in producing a guidance topology and identifying the areas where mass can be removed, it has certain limitations that prevent generating a functional resulting model. In this optimisation process, the existent mesh elements are suppressed, where the resulting shape is closely linked to the mesh analysis previously developed. An example of a conventional topology optimisation output can be seen Figure 15.
The mathematical representation of the structural optimisation algorithm can be convoluted in complex topologies with a wide set of design variables, manufacturing constraints, and a multi-objective focus. The development of new algorithms on structural optimisation techniques using generative design methods allows us to overcome certain limitations and provide great flexibility to generate unconventional topologies. The structural optimisation algorithm is able to learn from and adapt with each iteration to achieve the imposed combined-objective convergence criterion. Nevertheless, an initial volume of optimisation needs to be determined manually or automatically, depending on the piece of software used. In ANSYS, an initial optimisation volume must be determined. In Figure 16, one can see the graphical representation of the different optimisation volume domains of a structural optimisation process.
The primary criterion in our structural optimisation strategy is determined by the maximum displacement experienced in the airgap of the generator, and therefore, minimising this displacement has the biggest weight on the multi-objective process. A simple representation of this function can be denoted as the following Equation (5), where Γmag is the surface where the magnetic loads are applied and u is the displacement.
min Γ m a g u 2 d Γ m a g
Utilizing this equation directly requires a time-consuming computational process; instead, the strain-based function is usually used in structural optimisation processes. Equation (6) denotes the mathematical representation of this type of structural optimisation, where mat represents the volume of the material, ε represents strain, u is the displacement, and σ is the density.
min m a t ε ( u ) T σ ( u ) d m a t
As part of the multi-objective criteria of the structural optimisation strategy, the natural frequencies of the structure can be included in the process. Depending on the requirements of the structure, a single frequency mode or a range of frequency modes can be selected as an objective to be maximised and, therefore, improve the natural frequency of the generated models to avoid possible resonances. The natural frequencies of simple structures with one degree of freedom can be determined following the equation below (7), where f is the natural frequency, k is the stiffness, and m is the mass.
f = 1 2 π k m
However, an advanced modal analysis is required to evaluate complex three-dimensional models to evaluate the natural frequencies of a structure and assess them against the excitation frequencies under working conditions. The modal analysis used by the ANSYS package utilises an Effective Mass Participation Factor (EMPF) method as part of the structural optimisation strategy to efficiently detect the troublesome natural frequencies of the different topologies. The mass participation factor method identifies the structural mass involved in each frequency mode, and therefore, it can be used to avoid any dangerous resonance with the excitation frequencies during the optimisation process. As part of this method, the number of frequency modes to be analyzed can be determined until a minimum of 80% of the total mass of the structure is observed or when the frequency modes surpass the operational range of the generator. Any frequency mode within this range that involves over 1% of the structural mass needs to be assessed against the excitation frequencies of the generator. These generator structure frequencies can be plotted on a Campbell diagram for their visualization. For complex modal analyses, an example of a mathematical function used by structural optimisation algorithms is as follows. See Equation (8), where μr is the generalized mass of mode r, mat represents the volume of the material, φr is the load participation factor of mode r, fmag is the spatial distribution of the displacement and magnetic force, ωr is the frequency of mode r, and ωext is the harmonic excitation frequency.
η r = m a t φ r Δ f m a g d m a t ω r 2 ω e x t 2
On a multi-objective structural optimisation, complex algorithms of mathematical formulae are used to define different optimisation objectives where the individual objectives are established with different weights. A structural optimisation function is explained as the identification of the optimal material distribution within a volume range while minimising the function following a certain set of given objectives. The computing cost of this method is directly proportional to the complexity of the objectives used for the process of optimisation. On a complex optimisation strategy with multiple objectives, to overcome a high computing cost, one of the objective functions can be selected as the primary criterion to be minimised and the rest can be defined as a constraint with a limit value [25]. Figure 17 represents an example of the iteration process followed by the multi-objective structural optimisation strategy, in which the upper graph shows the combined objective optimisation through the set of iterations and the lower graph shows the optimisation of the primary criterion of displacement through the same set of iterations; it can also be observed that the combined objective criterion is achieved after a certain number of iterations, in this case, after iteration number 24. Structural optimisation was performed following the multi-objective optimisation strategy used in [9], including the mesh analysis approach followed in this study.
In comparison with traditional topology optimisation processes, recent structural optimisation methods include generative design approaches, allowing the process to be more adaptative. The results obtained using this method can be observed to not only reduce the mass, as with traditional topology optimisation, but also to be able to adapt to the objectives by generating new elements out of the established parameters set by the mesh analysis. Thus, as pictured in Figure 18, the mesh can act as a neural network through the iteration process to converge into a valid fit-for-purpose result following an evolutionary algorithm [9].
Based on the final iteration of the advanced rotor produced through Section 2.5 with the last heat sink design, three approaches were considered as the initial optimisation volume range (Figure 19). The same boundary conditions as those previously established (Figure 5) were applied to the structure to carry out this optimisation, including working loads and a temperature of 55.6 °C. Additionally, a further simplification of the heat sink structure was required to reduce the complexity of mesh analysis for the optimisation strategy, which can be observed in Figure 18. A distributed mass was applied to the outer surface of the rotor cylinder equivalent to the original heat sink, reducing the number of facets of the mesh, the number of elements and nodes, and consequently improving computational time.
Based on the knowledge acquired from the previous study in [9], where the repercussions of the design constraint of cyclic symmetry in the generative design outcomes were observed, a similar approach was intended for this study. However, the use of the support fins in the advanced optimised rotor limited the cyclic symmetry to the number of fins, in this case, 16 sectors. In order to allow the generative design process to have more flexibility in using the design constraint of cyclic symmetry, the support fin structures were replaced by an optimisation volume in that region of the structure; this can be seen in the initial volume ((a) and (b)) in Figure 19.
A preliminary modal analysis of the different initial topologies was needed to determine the natural frequencies of the initial structures with the intention to use that information in the multi-objective structural optimisation strategy. By keeping the airgap deformation a primary criterion, while minimising mass and attempting to avoid resonance within the operational range of the generator, some manufacturing constraints can be modified to produce different models. The manufacturing constraints used in the process were focused on casting and additive manufacturing processes, controlling parameters such as the pull-out direction of the die and the overhang angle constraint. The set of parameters and variables used in the process can be seen in Table 2.

3. Results

This section first presents the results of the mesh independence studies produced in ANSYS’s static structural module, SolidWorks Flow Simulation, and SolidWorks Simulation for the parametric and advanced optimised rotors. The results of the rotor optimisation processes are presented in Section 3.2., where the advanced rotor optimisation results are presented and compared against the unaltered IEA-15 MW-RWT rotor and the parameter-optimised rotor. Further comparison of the rotor structures is then made through the lens of the CFD-FEA study and through the costing and environmental analyses. A sensitivity analysis of the CFD parameters is presented in Section 3.5, and the results of further optimisation of the advanced rotor through the use of generative design, as well as a modal analysis of the produced rotors are presented in Section 3.7.

3.1. Mesh Independence Study

Following the mesh independence study methodology described in [13] within ANSYS, a high-density, tetrahedral mesh of 65,289 nodes and 32,397 elements was produced for the unaltered IEA rotor geometry using a mesh size of 140 mm, resulting in a mesh of 235,607 nodes and 116,607 elements for the advanced rotor structure.
Separate meshes were created in SolidWorks for the CFD and FEA simulations. The mesh for the CFD analysis, depicted in Figure 20, was produced using a global mesh setting of two and a ratio factor of one. A cylindrical local mesh region was set up to encapsulate the rotor, and a local refinement level of four was set for fluid-solid boundary cells. Five channel refinement cells, a small solid feature refinement level of six, and a curvature level of two were also implemented.
For the FEA simulation, a blended curvature-based mesh with parabolic tetrahedral 3D mesh elements was produced with maximum and minimum element sizes of 100 mm and 7.5 mm, respectively.
SolidWorks interpolates the temperature contour map obtained in Flow Simulation and subsequently applies the resulting temperature map to the corresponding nodes as a boundary condition in Finite Element Analysis.

3.2. Rotor Optimisation Results

The parameter-optimised rotor produced to investigate the introduction of heatsinks was carried out in accordance with the methodology set out in [13]; however, in this work, the distributed mass applied to the inner cylinder wall was reduced considerably to reflect the fact that the chosen structural steel would be sufficient for the purpose of the back iron material, and therefore, only the mass of magnets would need to be applied. It was also decided that for improved comparison, the permissible deformation would more closely match the final advanced rotor under Mode 0 loading, therefore relaxing the previous limit of 1 mm imposed in [13] to 1.5 mm.
These amendments resulted in a final mass of 235t and maximum deformations of 1.47 mm and 1.78 mm under Modes 0 and 1, respectively, and can be seen in Table 3 compared to the structural performances of the unaltered IEA rotor, the rotor produced in [13], and the advanced Rotor. It should be noted that the results presented in Table 3 were obtained under the operating conditions described with the revised distributed mass in Section 2.4 of this paper and as such, the results differ from those previously presented in [13].
In producing the advanced rotor, the response surface optimisation tool was first used to produce ten candidate points, as presented in Table 4, with candidate 6 selected for progression to further optimisation, being the candidate with the lowest mass.
The structural optimisation tool suggested a possible mass reduction of 39.2 tonnes (~19%) from the disk; however, due to the erroneous nature of material removal and the need to adapt and simplify these suggested outputs to produce a manufacturable part, the structure saw a total realised mass reduction of 18.3 tonnes (~8.8%), which caused total deformation to increase from 1.094 mm to 1.561 mm.
When initially implementing full-depth cylinder cut-outs, the wall modification further reduced the total mass of the geometry by 47.28 tonnes, or ~23% of the rotor’s original mass, and achieved a deformation of 2.37 mm. This process found that for the full-depth cylinder cut-outs initially explored, fewer, larger holes resulted in a greater reduction in deformation, for the same volume of material removed.
However, when partial-depth cut-outs were then implemented, the opposite was found to be true, as fewer, larger-circumference holes increased the deformation of the remaining back iron material as the cylinder bulged into the airgap in this area. Smaller diameter cut-outs were found to reduce this bulging, as can be seen in Figure 21.
The final cylinder cut-out modification, with partial-depth cut-outs accounting for the back iron, produced a mass reduction of 33.57 t, or 17.64%, and consisted of two offset rows of 32 cut-outs, with a diameter of 765 mm, and a remaining material cylinder thickness of 39.1 mm.
The use of structural supports on both sides of the disk was found to increase the mass by a total of 34.62 tonnes, or 18.6%, of the rotors’ mass after parameter optimisation; however, as can be seen in Table 4, these spars contributed significantly to the structural stiffness of the rotor, reducing deformation by over 9 mm. Lastly, the outer cylinder heatsink was found to further reduce deformation to a final deformation under Mode 0 loading of 1.53 mm, with an added mass of 3.44%, or 5.79 t.
The impact of each subsequent modification on the mass and deformation of the design under standard operating conditions is presented chronologically in Table 4. Through this process, the maximum deformation of the part was decreased to 1.53 mm under Mode 0 static loading conditions whilst achieving an overall mass reduction of 16.47%. Under Mode 1 loading conditions, the maximum total deformation experienced by the rotor was 1.72 mm, which is comfortably within the maximum deformation limit of 2.03 mm, with significant advantages of material cost reduction.
As per the parametric analysis, the cylinder wall mass dominates in its contribution to the over-rotor mass and as such, the removal cylinder wall material accounts for 64.7% of the mass reduction achieved when discounting the additional mass arising from the other stages.
As can be seen in Table 5, employing this method to achieve structural deformation limits yielded a final rotor structure mass of 174.25 tonnes, 33.4% heavier than the unaltered IEA-15 MW-RWT rotor at 130.6 tonnes when the same material is applied and the mounting shaft accounted for; however this rotor is 33.4% lighter than the parameter-optimised rotor through parametric optimisation alone, at 243 tonnes, when accounting for the mounting cylinder mass (8050 kg).

3.3. CFD-FE Analysis

To serve as the comparison standard, the parameter-optimised rotor was used in the CFD and FEA simulations without modification and is referred to as the baseline rotor. In this section, heat generation rates, obtained from SolidWorks, are the average or maximum temperatures experienced on the surface or within the volume of the heat source, which, in this case, is the dummy stator.
The results from the CFD simulation process, presented in Table 6, show that against the baseline rotor, the retrofit pin-based design was found to reduce the average and maximum stator dummy temperatures by 0.71% and 2.24%, respectively, and the average rotor body temperature was found to increase by 8.1%, whilst the maximum rotor temperature was found to decrease by 8.7%. The retrofit fin-based design reduced average and maximum stator temperatures by 0.64% and 1.9%, respectively, outperforming the pin-based design with respect to rotor body temperatures, with average and maximum temperatures reduced by 5% and 6.9% respectively.
In comparison, the integrated large-90 design reduced the average and maximum heat generation rates by 0.62% and 1.81%, respectively, and average and maximum rotor body temperatures were reduced by 5.2% and 7.6%, respectively, whilst the small-90 heatsink reduced average and maximum heat generation rates by 0.38% and 1.7%, respectively, and average and maximum rotor body temperatures against the baseline by 4.8% and 6.6%, respectively. The small-180 device was found to reduce the average heat generation rate by 1.1% and the maximum rotor temperature by 8.5%, whilst the large-180 device achieved reductions in the average and maximum stator surface temperatures of 1.5% and 3.2%, respectively, providing the greatest decrease in rotor body temperatures from the baseline, at 170 °C, to 148 °C (13.1%).
All designs derived from the baseline rotor were significantly outperformed by the topology-optimised design produced in this paper. The advanced rotor exhibited an average body temperature of 118 °C, representing a 30.7% reduction from the baseline. Additionally, as shown in Figure 22, the maximum rotor body temperature was reduced to 180 °C, from the maximum rotor body temperature experienced by the baseline at 246 °C.
The inclusion of magnets and the corresponding moved stator dummy was found to reduce average and maximum heat generation rates by around 4.1% against the unaltered rotor, producing a 1.7% increase in average rotor temperature and a 7.3% decrease in the maximum temperature.
To first provide an initial validation of the SolidWorks Finite Element simulation, a comparison was made between the results of the ANSYS and SolidWorks simulations carried out on the baseline, parameter-optimised rotor over the two sets of operating conditions set out by [15], the first with the standard established electromagnetic and mechanical loads and the second with an additional operating temperature of 55.7 °C. The SolidWorks and ANSYS simulations were found to be in close agreement with each other, with deformation and stress within 0.68% and 0.28%, respectively, under Mode 0 loading conditions and a difference of 3.3% and 3.5%, respectively, with the incorporation of the operating temperature. These results are presented in Appendix A Table A1.
The parameter-optimised rotor and the subsequent integrated heatsink models, as well as the final advanced rotor, were all examined under the two aforementioned loading scenarios and the third scenario, in which the results of the CFD analysis are applied to the rotor structure alongside the mechanical and electromagnetic forces. These results are presented below in Table 7.
Due to the additional components on the exterior of the advanced rotor structure, it was found that the overall maximum deformation arising from the CFD simulation erred from the maximum deformation obtained at the airgap by as much as 6.3%. Considering the deformation at the airgap is of primary concern, the data presented in Table 7 concern the maximum deformation on the inside cylinder face in all cases.
The results from the first scenario, which neglects to account for operating temperature, show that the added mass of the heatsink devices acts to increase deformation, with the inclusion of the heaviest designs, the large-90 and 180-fin heatsinks, increasing deformation by 15.2% and 16.1% over the baseline, respectively. In comparison, the lighter 90- and 180-fin devices were found to increase deformation by only 4.4% and 4.6%, respectively. Maximum Von Mises stress was also found to increase drastically by the integration of the heatsink devices, with increases of 19.3%, 23%, 16.2%, and 15.9% for the small-90 and -180-fin devices and the large-90 and -180-fin devices, respectively. These results suggest the number of fins plays a greater role in the maximum Von Mises stress than the resulting deformation change as the mass of the heatsink devices is consistent between the 90 and 180 variants.
Under this operating scenario, the advanced rotor experienced slightly higher deformation than the baseline rotor but lower deformation than both large heatsink devices. The advanced rotor was subject to considerably higher Von Mises stresses than the baseline-derived models, although this is likewise comfortably within the limits.
In the second loading scenario, which is considered a universal operating temperature of 55.7 °C, all the devices breached the ultimate deformation limit of 2.03 mm. Furthermore, the heatsink devices showed that the relationship between added mass and increased deformation holds true, with the heavier heatsinks increasing deformation by 6.3% and 6.8% over the baseline for 90 and 180 fins, respectively, and 12.6% and 13.1% over the ultimate structural limit. The small-90 and small-180 models were found to increase deformation by only 0.3 and 0.4%, respectively, further confirming that mass is a dominant contributor to deformation and highlighting the need for further investigation into the thermal effects on the rotor.
Compared to the initial scenario in which no thermal load is applied, at a rotor temperature of 55.7℃, the advanced rotor experienced a marginally larger increase in deformation (49%) than the baseline (48%) and more deformation at the cylinder overall. The Von Mises stress experienced by the advanced rotor was again higher than all its counterparts, and importantly, breached the maximum stress limit of 200 MPa.
Crucially, it is the third scenario, using the results of the CFD simulation, that showed that there is a case to be made for the development of integrated heatsinks for PMDD generators. Under the thermal and structural loading conditions defined in Section 2.2, the baseline rotor experienced a maximum deformation of 11.1 mm, expanding enough to theoretically double the airgap size, with maximum Von Mises stress also over double the permissible threshold. Both 90-fin heatsink models deformed to a lesser extent, reducing deformation to 10.2 mm and 10.6 mm for the small and large models, respectively, As shown in Figure 23a, the large-180 model saw a further reduction, amounting to 1.26 mm or 11.4% against the baseline. The small-180 saw a further reduction, amounting to 15% against the baseline, despite both small-fin models resulting in higher temperatures across the board, suggesting that the heatsink devices work not only as a means to improve thermal regulation but also, notably, to aid as structural support.
The CFD-FEA scenario is where the advanced model vastly outperforms all its counterparts in terms of deformation, as shown in Figure 23b. Whilst still undergoing significant levels of deformation over the ultimate limit, this structure was the closest by a considerable margin and experienced 36% less deformation than the baseline. It did, however, experience considerably higher levels of maximum Von Mises stress than the other models, again concentrated in the mounting cylinder, as can be seen in Figure 24.
To verify the findings of the thermal component of the CFD-FE analysis, the average deformation at the inner edge where the disk and cylinder meet, arising from solely the thermal load, was compared with an expected deformation value calculated using Equation (9).
Δ L = L 0   α ( T 1 T 2 )
where ΔL represents the change in geometry length or deformation, L0 is the original geometry length (inner cylinder radius), α is the coefficient of thermal expansion of cast Carbon Steel SA216 (1.15164 × 10⁵ K−1), T1 is the temperature obtained from the CFD simulation, and T0 is the geometry’s initial temperature.
The average temperature over the inner disk surface and the resulting deformation at the disk-cylinder edge were obtained using the probe tool for both the advanced and baseline rotors. With a calculated deformation of 8.61 mm and an obtained average deformation of 8.53 mm, the thermal deformation experienced by the parameter-optimised baseline rotor was found to be within 1% of the calculated value. The advanced rotor experienced an average of 6.77 mm of deformation at the inner edge, a difference of 10.4% against its calculated deformation of 6.07 mm.

3.4. Operating Parameter Analysis

The heatsink designs proposed in this paper are novel to literature, and therefore, further examination and quantification of the influence of the operating conditions on their performance is necessary to justify their use. Furthermore, by studying a range of ambient operating conditions, it may be possible to determine if there is feasibility and justification for a range of rotor designs with and without heatsinks or other mitigating devices developed specifically for operation in certain climates. Hence, this section investigates the effects of varying operating parameters on the structures’ operating temperature and integrity on the parametrically optimised baseline and the advanced rotor produced in this paper.
Assuming that a permanent gearing ratio can be introduced from the rotor to the cooling fan, the rotational velocity and, hence, airflow velocity was changed based on 1:2, 2:1, and 3:1 gearing ratios with the rotor, producing four flow speeds of 2.05 ms−1, 4.1 ms−1, 8.2 ms−1, and 12.4 ms−1, respectively. The ambient air temperature was varied from 0 °C to 50 °C, through 10 °C increments, and lastly, three further simulations were run, which assumed that overall generator losses could be reduced by 10% and 20% and further reduced to the rated efficiency at full load, according to the definition document [8].
The full results of the operating parameter analysis are available in Appendix A Table A1, with the results of the advanced rotor presented in Appendix A Table A3 and Table A4 and the results of the baseline rotor presented in Appendix A Table A4 and Table A5.
Whilst the fan cannot produce any direct structural benefit, such as the heatsink spars providing some resistance to cylinder thermal expansion, it is conceivably the cheapest method immediately available for heat mitigation, as well as the most direct one, provided it can be moved efficiently, which can, in turn, reduce the extent of thermal expansion.
The flow velocity study found that doubling and halving the flow speed to 2.05 ms−1 and 8.2 ms−1 has a marginal effect on the heat generation rates of the baseline rotor, in both cases decreasing the maximum generation rates by 0.9% and 0.2%, respectively, contrary to what might be expected. Average rotor temperatures reflected this too, with a temperature decrease of 5% when reducing the fan speed to 2.05 ms−1 and a decrease of 1% when the fan speed is doubled. Increasing the fan speed further to 12.3 ms−1 had a much clearer effect on heat generation and rotor temperatures, reducing maximum stator dummy temperatures by 3% and the average rotor temperature by 14%.
The advanced rotor saw an exaggerated version of the same effect, with a 1.9% decrease in heat generation rate and an 8% lower average rotor temperature arising from a halving of the fan speed. However, doubling and tripling the fan speed were found to reduce heat generation rates by 13% and 26%, respectively, whilst average rotor temperatures decreased by 30% and 53%, leading to a decrease in airgap deformation by 32% and 59%, respectively, compared to an increase of 5% at double fan speed and a decrease of 4.4% at triple the fan speed in the case of the baseline.
This major difference between designs can most likely be attributed to the increased levels of airflow circulation around the advanced rotor, owing to its cut-outs, allowing for improved heat dissipation before absorption by the rotor. It should be noted that the inclusion of the electromagnetically active components in the simulation would change the behaviour of the airflow significantly.
Von Mises stress is also impacted considerably by changes to airflow rates, with a reduction in stress seen again from both the decrease and increase in flow velocity, with 13% and 16% reductions for the advanced and baseline rotors, respectively, when the fan speed is halved. Doubling fan speed was found to produce Von Mises stress reductions of 36% and 6% for the advanced and baseline rotors, which were increased to 62% and 23%, respectively, when fan speed was tripled. Whilst the results at the lowest flow velocity are contrary to expectations, the benefits at higher airflow velocities are clear, achieving a maximum airgap deformation reduction of 58% for the advanced rotor, to 2.95 mm.
The environmental temperature was shown to have a significant impact on the rotors’ operating temperatures. For the baseline rotor, the average and maximum heat generation increased from 410 °C and 429 °C, respectively, at an ambient temperature of 0 °C to 422 °C and 434 °C at an ambient temperature of 50 °C, producing average and maximum rotor body temperatures of 161 °C and 172 °C, respectively, at an ambient temperature of 0 °C to 178 °C and 192 °C at 50 °C. From these elevated temperatures, maximum airgap deflection was found to be 14% higher at 50 °C than at 0 °C, with maximum Von Mises stress likewise increasing by 20% over the same ambient temperature swing.
The advanced rotor body was found to undergo much greater temperature fluctuations with changes in ambient temperatures. At an ambient temperature of 0 °C, the average heat generation rate on the stator was 399.7 °C, producing an average rotor temperature of 104.7 °C and a maximum of 168 °C. At an ambient temperature of 50 °C, however, the average heat generation rate reached 413 °C, producing average and maximum rotor temperatures of 135 °C and 199 °C. Where the topology-optimised design saw a decrease in deformation of 7.6% when the ambient temperature is reduced from 20 °C to a temperature of 0 °C, at 40 °C deformation increased by 8.9% and by 50 °C and maximum deformation increased by 11.9% from the base scenario of 20 °C. Maximum Von Mises stress was subject to very similar fluctuations as operating temperature changes, with an 8.7% reduction when the ambient temperature was reduced to 0 °C, and increased by 11.6% at an ambient temperature of 50 °C.
Two simulations were run, which assumed that future progress on electrical machines can contribute to an overall reduction in the extrapolated electrical losses by 10 and 20%. The losses applied as heat generation on the stator dummy surface were therefore lowered to 997.65 kW and 886.8 kW. Lastly, a final simulation was conducted using the electrical efficiency stated in the turbine definition document [8], at 517.5 kW, or a reduction of 53% against the extrapolated value.
For the baseline rotor, a 10% reduction in losses was found to lower the average and maximum stator dummy temperature by 5.1%, with average and maximum rotor temperatures falling by 6.4% and 5.6% consequentially. A 20% reduction in generator losses further reduced the average and maximum stator dummy temperatures by 10.8% against the baseline at full losses, resulting in average and maximum rotor temperatures 13% and 11% lower than the baseline. Consequently, a 10% reduction in generator losses reduced airgap deformation by 7% for the baseline rotor, and a 20% reduction in generator losses resulted in an airgap deformation reduction of 15% compared to the full-loss case. Similarly, Maximum Von Mises stress decreased by 8% and 26%, with a 10% and 20% reduction in losses, respectively.
For the advanced rotor, the effects of reducing generator losses were again amplified over that of the baseline. With a 10% reduction in generator losses, average and maximum heat generation rates for the advanced rotor were reduced by 5.2% and 5.3%, respectively, and a 10.8% reduction in heat generation rates was achieved through a 20% reduction in losses. The average rotor temperatures were reduced by 7.4% and 15.3%, with 10% and 20% reductions in generator losses, respectively, with maximum rotor temperatures likewise falling by 9% and 19%. Consequently, the advanced rotor saw airgap deformation decreases of 7.6% and 19.4% arising from 10% and 20% reductions in generator losses, respectively, with the latter resulting in a maximum airgap deformation of 5.73 mm. Although still elevated far beyond the limit of 200 MPa, stress was similarly reduced by 10% and 16% as generator losses were reduced by 10% and 20%, respectively.
Lastly, at the generator efficiency defined in the IEA’s documentation for the reference turbine, the average stator dummy temperature was found to have fallen by 35.5% and 34.1% for the advanced and baseline rotors, respectively, relative to the baseline case. For the baseline rotor, average and maximum rotor temperatures decreased by 41% and 35%, respectively, reducing the airgap deformation by 43%, to 6.61 mm, and the maximum Von Mises stress by 50%, to 252 MPa. For the advanced rotor, average and maximum rotor temperatures were reduced by 44% and 46%, respectively, resulting in an airgap deformation reduction of 52%, to 3.44 m, and maximum Von Mises stress to 317 MPa, a reduction of 56% from the base scenario.
In Figure 25, the sensitivity of the baseline and advanced rotors’ airgap deformation to their operating parameters is presented. The second and third points represent the reduction in generator losses by 10% and 20%, respectively. Points 4 to 9 show changes to the ambient operating temperature, from 0 °C to 50 °C, and points 10 to 14 represent airflow speeds of 2.05 ms−1, 4.1 ms−1, 8.2 ms−1, and 12.3 ms−1, respectively. Finally, point 15 represents the reduction in generator losses to the efficiency defined in the IEA-15 MW RWT document.
From this graph, it becomes clear that changes to operating parameters have a greater effect on the advanced rotor than on the standard design rotor. This may be due to the increased surface area relative to volume for the topology-optimised design, exposing more of its total mass to those conditions. If this is true, one could expect this effect to be more distinct in a dynamic analysis.
Of note are points 13 and 14, where flow speeds of 8.2 ms−1 and 12.3 ms−1 see a large divergence between designs, and the benefit of increased flow speeds on rotor temperature is not fully realized on the baseline design, whilst the advanced rotor benefits considerably. This discrepancy may be explained by the presence of disk holes on the advanced rotor allowing flow through the structure, reducing the pressure built by the flow encountering the rotor disk, which forces the incoming flow away from the cylinder, reducing its overall contact and cooling effect. This can be visualized in Figure 26, demonstrating the increased flow separation increase at higher speeds and the difference between rotors.
The sensitivity analysis further highlights the need for a greater understanding of the influence of operating and environmental temperatures on direct-drive wind turbine generators.

3.5. Environmental Performance Analysis

Using SolidWorks’ sustainability and costing add-ins, the changes made to the rotor geometry when optimising the structure in ANSYS can be accounted for environmentally and financially. Both the advanced rotor and the parametrically optimised rotor have been compared against the original, unaltered rotor for their environmental impact through manufacture, transport, and end-of-life processes.
As Table 8 shows, using only the parametric optimisation of the IEA RWT rotor to achieve a compliant design results in vast increases in the energy consumed, CO2 and CO2 equivalents emitted, and water consumed during production, corresponding to 75.5%, 74.9%, and 74.7% increases, respectively, over the unaltered rotor.
Whilst the parameter-optimised design can be manufactured in one singular sand-casting process, the advanced rotor requires secondary machining in order to remove mass from the cylinder wall. While holes in the rotor disk can be sand-cast as they can lie on the mate plane between the cope and drag, cylinder cut-outs cannot be fabricated this way. Although this process does add to the total required energy in production, the increase from milling is minimal, at just 1.7% of total energy consumed and carbon dioxide emissions; there would be considerable energy and emission savings if it were possible to avoid the casting of this removed material in the first place.
If investment casting were able to produce a part of this scale, it could conceivably produce these negative spaces and hence save energy in casting, as could the development of high-capacity additive manufacturing methods of this scale. By implementing either process, the total mass of the material to be cast would decrease by 32.8%, and consequently, the total environmental impact of the final structure would be merely 14.3% higher than the original IEA RWT rotor and only 46.33% of the total environmental impact of the parametrically optimised rotor. At this time, however, neither of the processes was deemed feasible for a structure of this size.
Owing to its lighter design and the strong correlation between structural mass and the resulting energy and water consumed and CO2e emitted during casting, the advanced rotor produced in this paper consumes 52% of the energy and water, emits 51% of the CO2e of the parametrically optimised design produced in [13], requires 10.6% less energy, and produces 13.2% less CO2e and water eutrophication during production, compared to the parameter-optimised rotor produced in this paper. Given the extensive water usage in the production of the rotor, as determined in [13], efforts to reduce this through progressive structural optimisation techniques are imperative to improving the environmental sustainability of the structure.
The above figures solely represent the environmental impact associated with the manufacture of each rotor geometry. SolidWorks Sustainability indicates environmental impacts associated with other aspects such as transport, end-of-life processes, and material sourcing as a relative percentage of the manufacturing impact. While it cannot directly ascertain values for the choice material as this particular carbon steel is not present in the Sustainability library, a similar material was used to help indicate the potential environmental impact for each parameter. Figure 27 shows the environmental impact associated with end-of-life processes for the three rotor structures.
The carbon dioxide emissions produced and energy and water consumed in product transport and end-of-life processes were consistent across each design as a percentage of manufacturing impacts. On average, across the rotors, CO2 emitted during transport was found to be 12% of the manufacturing emissions for each part, and emissions during end-of-life processes were found to be an average of 16%. Energy consumed for transport was found to be 11% of the manufacturing energy consumption, on average, and 13% for end-of-life processes. Water eutrophication due to transport and end-of-life processes was found to be as much as 81% and 80.5% of the eutrophication due to manufacturing, respectively. Since these percentages are consistent across all three designs, it can be assumed that the difference in magnitude between each value is a function of mass and reaffirms earlier data that show reduced part mass results in a more sustainable rotor.

3.6. Costing Analysis

To ensure a fair comparison, through both the costing analysis and the environmental performance analysis presented in Section 3.5, the unaltered IEA RWT rotor and the parameter-optimised rotor produced in [13] both account for the inclusion of the mounting shaft used to facilitate the optimisation of the rotor produced in this paper. Also, note that the data tables presented in these sections compare the cost and environmental impact of the two optimised rotors against the unaltered IEA RWT rotor.
Following the process from [13], the financial cost of the advanced rotor produced in this paper was estimated so that an appropriate comparison can be made versus the parameter-optimised rotor produced in the aforementioned study. As with [13], these costs are estimated using an assumed labour cost of USD 50/hr and machining rate of USD 12/hr and assume a required 10% sand replenishment rate per casting in the case of the unaltered and parameter-optimised designs and a mould cost of $500,000 amortized across 100 rotors in the case of the advanced rotor. From the ANSYS Granta material database, ‘Carbon Steel SA216 (Type WCC), Cast, Annealed’ has a mean per kilogram cost of USD 0.84, and the exchange rate at the time of writing was 1.00 USD:0.791 GBP.
The financial impact, determined by the SolidWorks Sustainability tool, accounts for manufacturing energy costs and supply costs, in addition to the raw material costs, transportation costs, and costs accrued during end-of-life processes. This parameter serves as an indication and estimation of the cost and is included to consider additional financial impacts not accounted for by the costing tool and template.
As shown in Table 9, the advanced rotor produced in this paper compares closely to the parametrically optimised baseline design, being 12% more expensive in material cost, 15% higher in financial impact, and 13.3% more expensive overall.
Employing investment casting for advanced rotor structures considerably reduces the raw material cost as well as the elimination of machining costs and can reduce the overall cost of manufacturing by 21.1%. The financial impact would also be reduced by GBP 27,600, a 24.7% reduction, and total costs would be reduced by 22.5% to a total of GBP 251,600, a cost reduction of GBP 34,800. At this time, accurate estimates for high-capacity manufacturing are not possible.
If these changes to the manufacturing process were implemented to achieve production with a single additive process, the total cost of producing the optimised rotor structure would have increased by 24.5%, compared to the original IEA-15 MW-RWT rotor.

3.7. Generative Design and Modal Analysis Results

The generative design process allows the exploration of non-conventional topologies by setting a multi-objective optimisation strategy and a wide range of design and manufacturing constraints to control the iterative process of model generation. The knowledge acquired in [9] over the process of generative design with ANSYS allowed us to determine the use of the multiple variables available. The results obtained with this process were significantly optimised with regards to the displacement and stress limits of the structure.
The first two initial approaches of the generative design established in Section 2.6 with conical optimisation volumes did not generate a converged model within the limit of iterations imposed. The two non-converging models can be shown in Figure 28. The process explored in [9] showed us that a bigger optimisation volume with an over-constraint multi-objective structural optimisation strategy generates a time-consuming computational process with a low percentage of convergence. In that study, the effectiveness of introducing an initial preoptimised volume range was proven to generate more efficient models.
In this case, the initial volume approach with reinforced disk structure showed a more effective performance on the generative design process, as expected. In [9], the impact of the cyclic symmetry design variable was demonstrated to improve the control of the process; in this case, a set of parameters was used to modify the cyclic symmetry variable for the first two initial models of the process. Nevertheless, for the reinforced disk structure, as the disk reinforcement was optimised for 16 sectors, a fixed cyclic symmetry of 16 was established for this process. The contrast in output structure arising from different control methods for the process can be observed in Figure 29. In model (a), a manufacturing constraint of overhang angle was applied, and the structure was optimised for an additive manufacturing process; in model (b), a pull-out direction of the die was applied for a casting manufacturing process; and model (c) is the result of a combination of the two previous models.
In Table 10, the optimisation results obtained from the generative design process can be observed. Model (a) has the greatest reduction in structural mass (24%) while not achieving convergence for the limits of stress and deformation alongside the airgap. Model (b), on the other hand, achieves a small reduction in structural mass but significantly reduces deformation, and model (c), while improving the mass reduction in relation to model (b), surpasses the stress limit of 200 MPa by far.
The next step of the multi-objective strategy followed in this investigation was to address the dynamic performance of the proposed structure. The generative design optimisation results were assessed against the advanced rotor with heatsink, using a modal analysis with an effective mass participation factor to identify the different frequencies of the structures and their dynamic performance. The modal analysis of the advanced rotor with a heatsink can be seen in Table 11, where the frequency modes selected by the effective mass participation factor are represented.
In the results for the modal analysis presented in the Campbell diagram of Figure 30, one can observe small variations around the same modes of frequencies, with a slightly better optimisation in model (b), which is the only model to minimise its maximum mode of frequency and, therefore, widening the operational range of the generator and interfering with the electrical frequency at 8 rpm. It can be also observed that as the structural optimisation reduces the mass on the support fins, the stress and harmonic behaviour are aggravated.

4. Discussion

The advanced rotor produced through the process outlined in this paper achieves compliance with an increase in mass of only ~42% over the unaltered IEA rotor. This is significant when compared to the parametrically optimised rotor produced simultaneously, which achieved compliance with a mass increase nearly double that of the unaltered geometry, and when considering the environmental and financial cost accrued by excess mass. A significant benefit of the design processes utilised in this paper is the added flexibility afforded to the engineer. By incorporating the cylinder into the design from the outset and allowing wider margins within which to optimise the device during the initial stages, the ultimate deformation constraints can be met with additional structural members and topology optimisation not possible otherwise. The typical disk-supporting structure presents a limitation in design compared to the flexibility afforded by other substructure types, which can be mitigated following this methodology. Further research following this design philosophy may yield greater improvements.
Reference [13] demonstrated the importance of operating temperature on the structural integrity of PMDD generator structures, which this paper attempts to further explore through the development of a novel CFD-FEA simulation. Reference [14] found a maximum stator winding temperature of 120 °C during a dynamometer test of a 1.5 MW PMDD generator. Under the conditions outlined in Section 2.4, markedly elevated operating temperatures were found throughout both rotor structures, with average temperatures ranging from 118 °C to 184 °C, and the stator dummy, with temperatures ranging from 404 °C to 432 °C.
Given that demagnetisation of the permanent magnets occurs at a temperature of 155 °C, these temperatures are extreme; however, this makes sense when considering that the CFD scenario presented in this paper does not account for the active cooling of the generator components. With the inclusion of the rotor with magnets producing only a 4% drop in heat generation rates, we can rule out the elevated temperatures being a result of exaggerated stator dummy proximity to the rotor. The added magnet height, increasing the distance between the dummy and the rotor body by 58.4 mm, increases potential airflow around the rotor; however, this only gave rise to a reduction in the maximum rotor body temperature of ~7%.
It is, however, apparent that the cooling flow prescribed in this paper is insufficient for regulating generator temperatures, even at its highest rating in the sensitivity analysis, according to the conditions detailed in this paper. Moreover, while passive thermal regulation devices such as the heatsinks explored in this paper were proven to meaningfully reduce operating temperatures, they are inadequate in maintaining desired generator temperatures alone.
Whilst it is clear that the CFD study presented in this paper greatly overestimates the thermal burden on the generator structure, for the purposes of examining the influence of operating conditions on the operating temperatures and consequent increases of deformation, the CFD analysis yields important findings, confirming the previous finding from [13] that elevated operating temperatures have significant detrimental effects on large-scale PMDD rotor structure integrity. It also establishes, however, that mass and surface area are contributing factors in determining not just the maximum deformation experienced by the structure but also the sensitivity of the structure to its thermal operating parameters.
Although the thermal deformation of the advanced rotor differs somewhat from the calculated value obtained using Equation (9), this is most likely owing to its complex geometry. However, with an error of less than 1%, given the closeness by which the baseline rotor matches its calculated thermal deformation, the introduction of this thermal load in the CFD-FE analysis developed in this paper can be considered valid. Moreover, the electromagnetic and mechanical loads applied to the rotor are established in the literature and are the same as those presented in [13]. Although the presence and the general impact of thermal loading within large-scale PMDD generators are known [26,27], this paper presents a novel means by which to accurately quantify its magnitude and contribution to deformation and stress on PMDD supporting structures.
The topology-optimised advanced design has several perceived reasons contributing to its lower operating temperatures, such as a significantly lower overall mass mixed with the incorporation of cut-outs, both reducing the overall volume of the device and increasing airflow throughout the device, along with the rotors’ added supports and heatsinks, greatly increasing its surface area. The result is a surface area-to-volume ratio of 22.5 m2m−3 compared to the baselines’ 10.3 m2m−3. Whilst reducing the available mass for bulk thermal energy, this increased surface area improves the ability of the structure to shed thermal energy over the baseline. Further analysis of the structural parameters of the heatsinks would be beneficial in determining the relationship between the heatsinks’ contribution to thermal bulk mass, structural rigidity, and heat dissipation and in finding a theoretical design optimum. While experiencing lower levels of deformation under all the conditions outlined in the CFD-FEA sensitivity analysis than the baseline, the advanced rotor was found to be subject to greater fluctuations in stress and deformation. This increase in thermal load amplitude has the potential to decrease the lifespan of the structure through higher cyclic, thermal-induced stresses, which merits further study.
The exploration and examination of the use of heatsink devices in this paper indicate that retrofit heatsink devices could be employed to reduce rotor body temperatures; however from design, manufacturing, and safety standpoints as their mass needs to be accounted for when considering supporting requirements, retrofitting may not be feasible. As such, this study clearly indicates that integrating heatsink devices from the outset may be a practicable means to reduce stress and deformation on future large-scale PMDD generators. Stator temperatures were also found to be reduced through the use of heatsinks, indicating that lower rotor temperatures allow for heat to dissipate from the stator faster. Heatsinks may therefore provide the added benefit of improved generator electrical efficiency and the ability to delay implementing shutdowns or power output restrictions due to overheating in periods of high output, boosting power output yields.
The heatsink study also found that whilst a heatsink with equal mass of material, spread out into 180 fins instead of 90, produced lower rotor body temperatures, higher deformation levels were present in both cases examined. This indicates that the devices’ primary benefit may be in their contribution to cylinder wall stiffness. Further investigation into the relationship between cylinder thickness and the effectiveness of the cylinder spars as a structural member, and heatsink may be beneficial in maximising the positive effects of both.
In the case of the retrofit aluminium heatsink devices, the pin-based design was found to underperform the fin-based design both structurally and thermally, although efforts could be made to optimise both, which may contradict this finding; we also considered the possibility that integrated fin-based designs would have the added benefit of providing the inherent structural rigidity to the cylinder that pins cannot.
The use of generative design techniques as the structural optimisation method resulted in mass and stress reductions in relation to conventional topology optimisation techniques. As observed in the process developed in [9], the use of a pre-optimised initial optimisation volume increased the efficiency of the method, gaining more control over the output generation. The use of the deformation limit on the airgap surface as the primary criterion achieved great improvements in the final outputs, with model (b) from the generative design process having a deformation through the airgap of 1.78 mm against the limit of 2 mm, when compared to the 2.30 mm of deformation experienced by the advanced rotor. On the contrary, the effects of the modal analysis, integrated as an objective as part of the generative design process, did not cause a great impact on the natural frequencies of the outcomes, first, due to the lower weight of the objective within the multi-objective strategy and second, due to the numerous active modes of frequency of the structure at lower levels of the operational range of the generator.

5. Conclusions

This paper first presented a comprehensive methodology to achieve an optimised rotor structure that conforms to the widely accepted mechanical and electromagnetic loads, achieved through the use of parametric and topology optimisation techniques, and the addition of structural members enabled by the inclusion of the mounting shaft in the design process. In optimising the rotor structure, mass was also removed from the cylinder wall, a first in the literature.
A Computational Fluid Dynamics study was then developed with the aim of more closely representing the operating conditions that a large-scale PMDD generator rotor is subject to, in the case that no cooling system is used to maintain the temperature of the active material. This model can also be used to estimate the effect of the controlled temperature in the supporting structure. By applying estimated generator losses to a copper dummy stator, radiant heat was transmitted to the rotor structure. The resulting temperature contour map was then applied to the rotor structure in a one-way, sequentially coupled Finite Element Analysis to evaluate its impact on structural integrity. A thermal operating parameter analysis was carried out to assess the effects of changing ambient operating temperatures, fan speed, and estimated generator losses. The use of heatsinks, both retroactively installed and integrated as part of the structure, was also explored.
The environmental and financial impacts of the topology-optimised design was analysed using the SolidWorks’ Sustainability tool, and we found that the design vastly outperformed the parameter-optimised rotor, with reduced energy requirements, CO2 output, and water usage in manufacturing, transport, and end-of-life processes, largely due to the reduction in mass.
The key findings of this paper are listed as follows:
  • The removal of the cylinder wall material achieves a significant reduction in mass and despite increasing maximum deformation when paired with the addition of disk supports and the heatsink device, justifies its use and ongoing study.
  • Retrofit heatsinks were found to reduce the rotor structure’s operating temperatures; however, integrated designs were found to outperform the retrofit models whilst providing structural support.
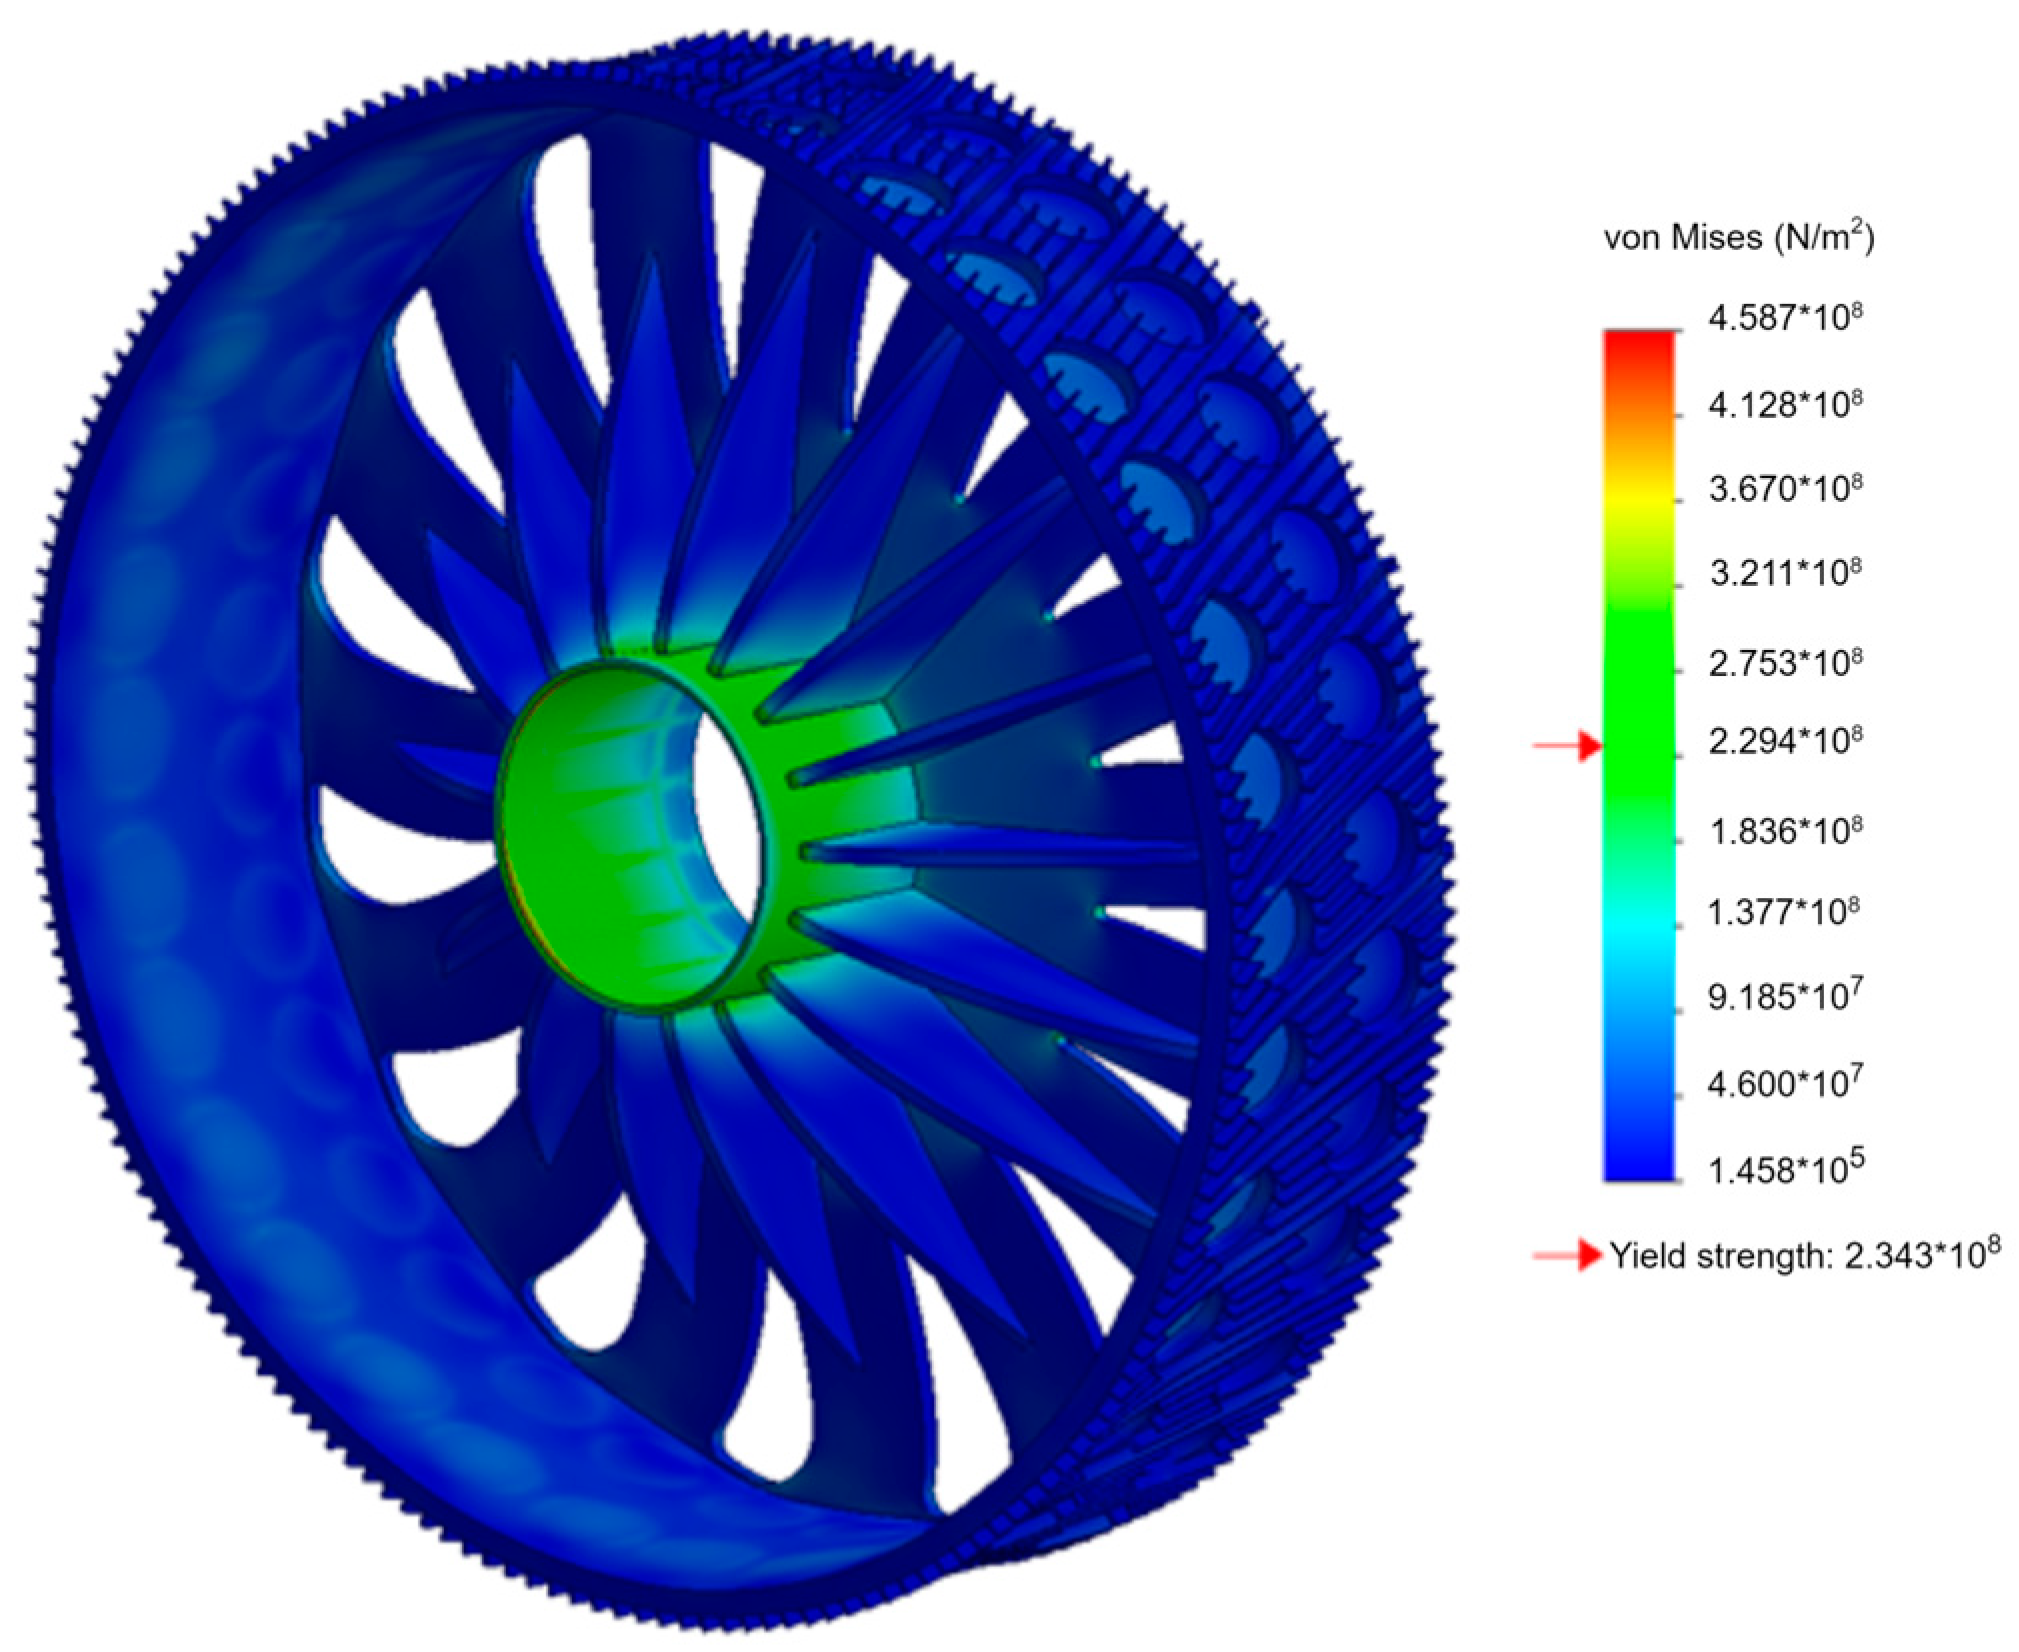
  • A primary benefit of the CFD-FE simulation produced in this paper is the ability to accurately identify thermal hotspots on the rotor structure that may increase the severity of cyclic thermal stresses on the generator structure and to quantify their effects.
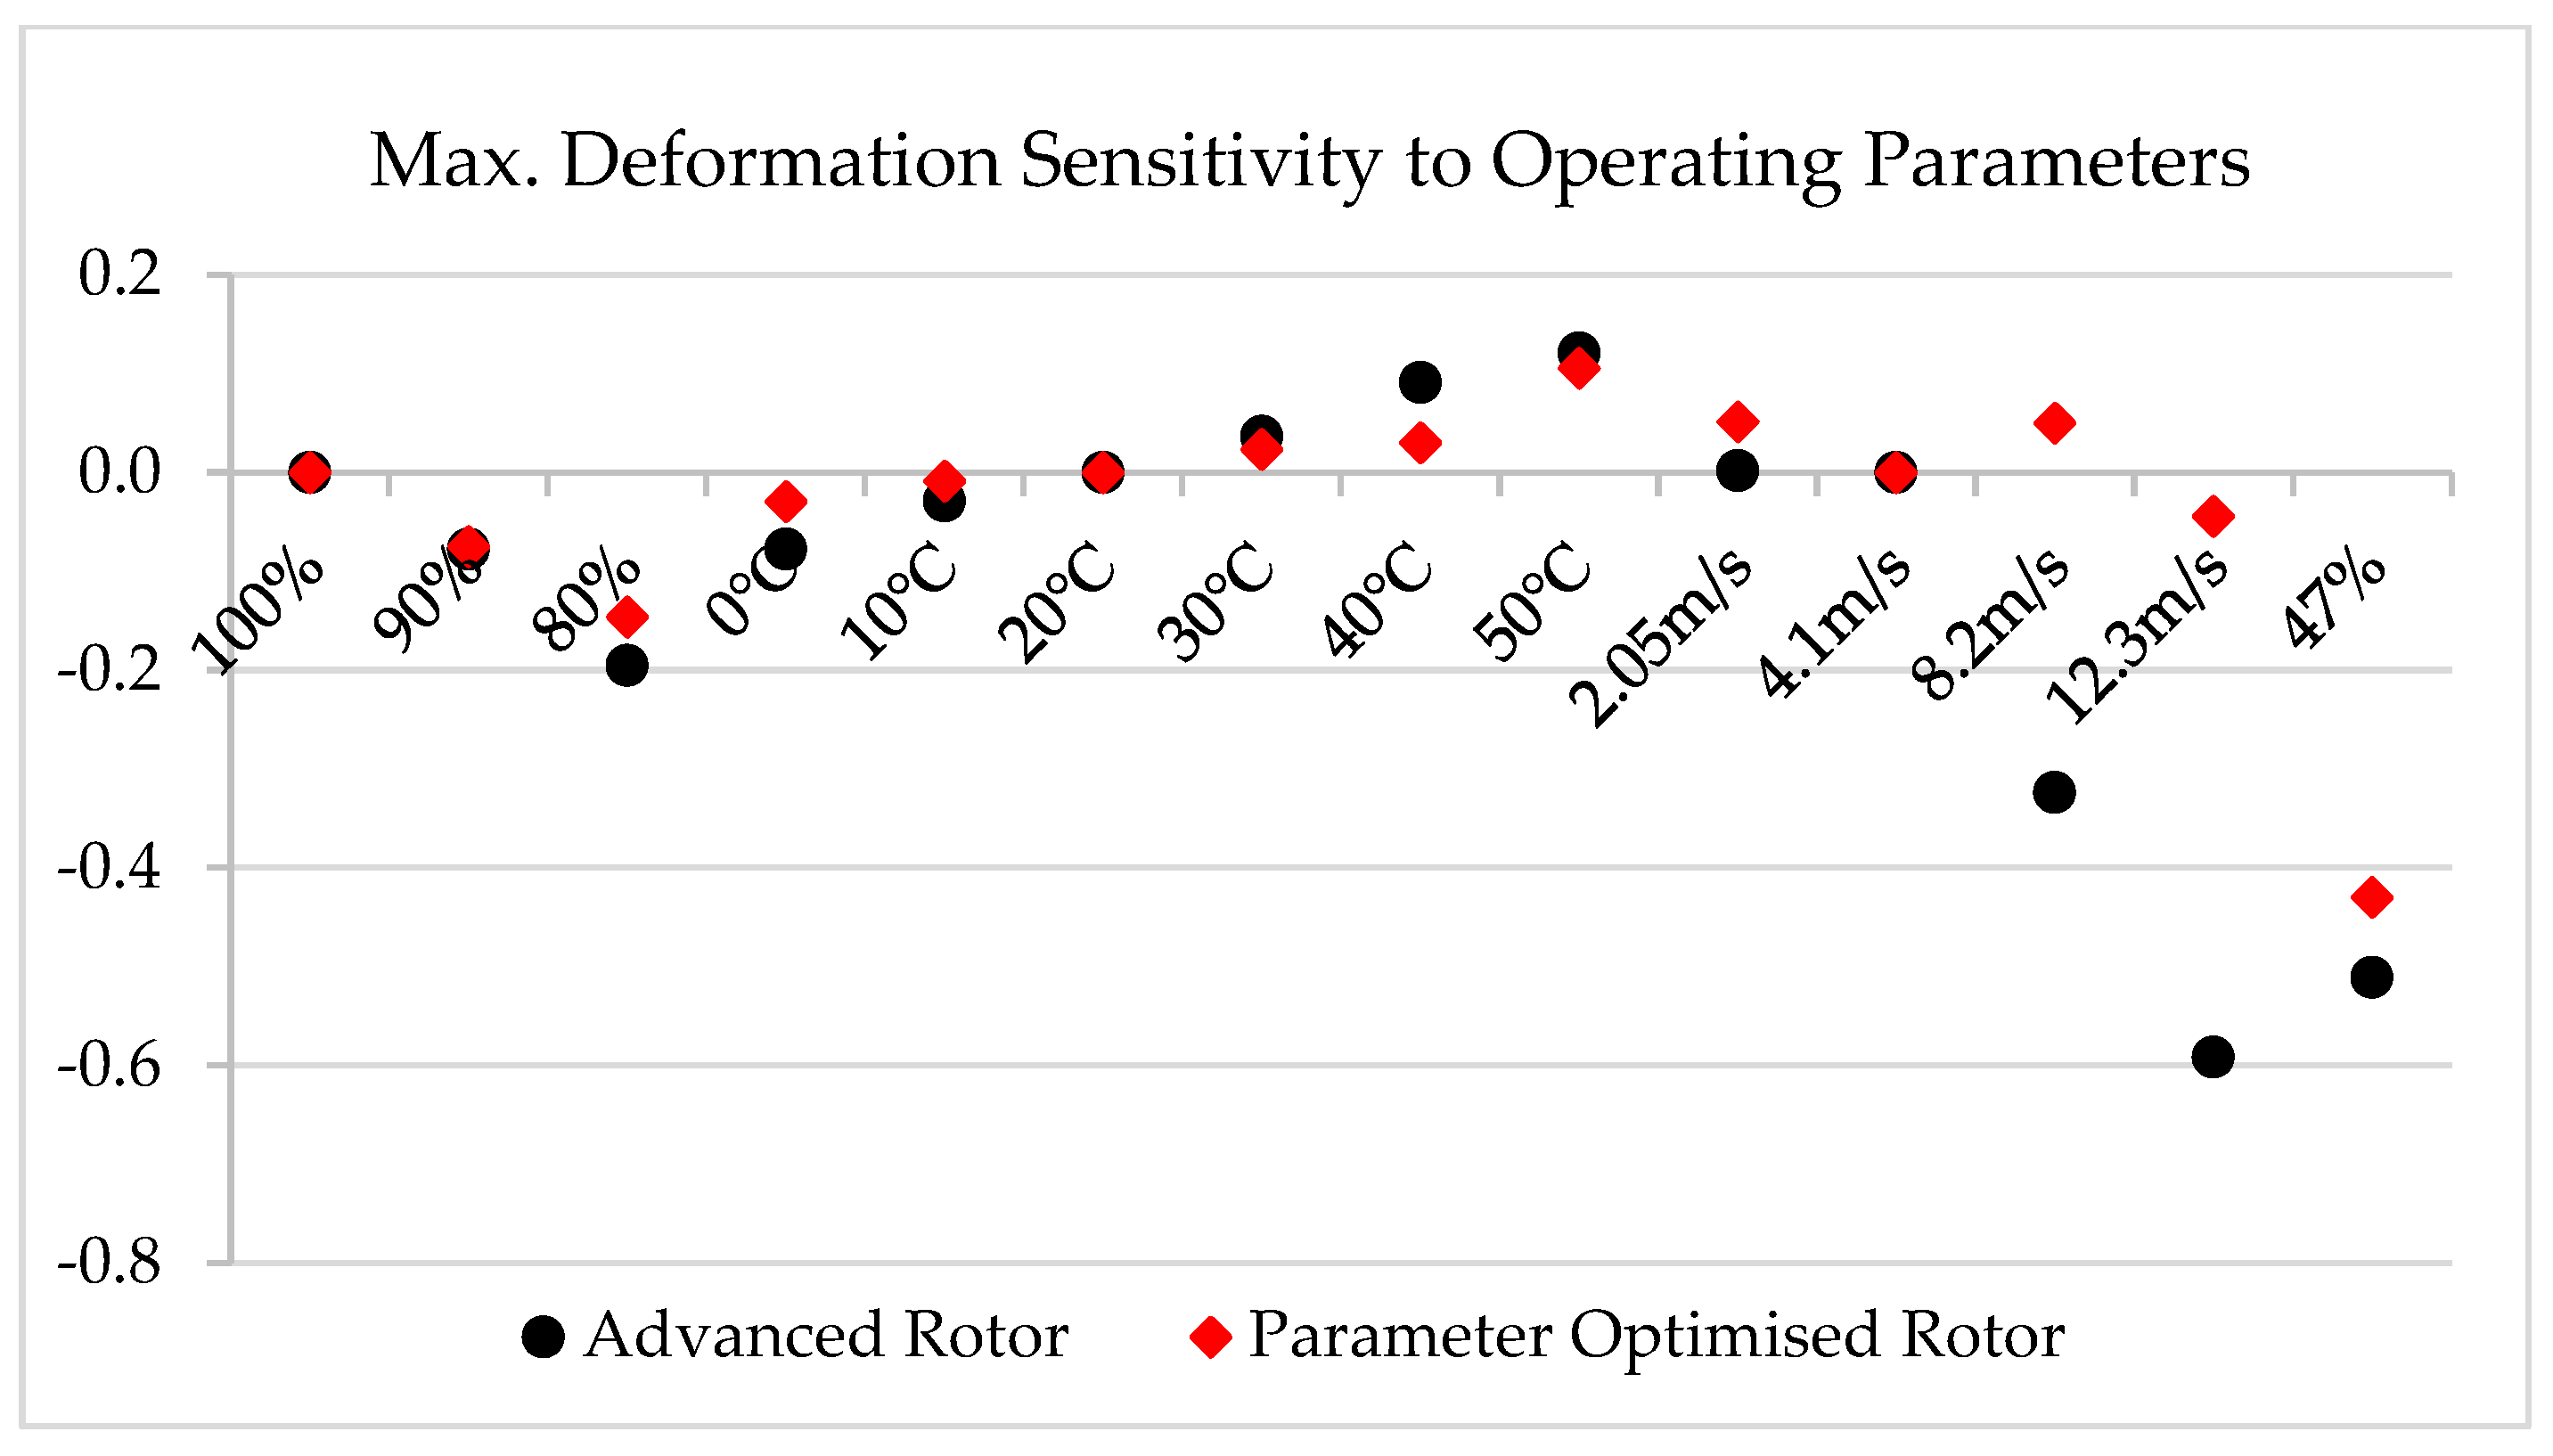
  • Although the advanced rotor structure outperformed the parametrically optimised rotor in terms of deformation in the CFD-FEA simulation, it was subject to greater variations in deformation as conditions were varied, implying that the advanced rotor structure may be subject to greater levels of dynamic thermal loading fatigue.
  • Further savings in environmental and financial factors are thought possible through the advent of high-capacity additive manufacturing or investment casting as eliminating additional milling steps required of the complex design would reduce the mass of initial material to be cast.
  • Generative design was shown to yield considerable improvements to an already complex structure, finding mass reductions of 2.3% and 7.6% while considerably reducing deformation and maximum stress in the first instance and further reducing deformation at the cost of increased maximum stress in the second instance. Its potential for substantial design improvements over topology optimisation techniques necessitates its use and future investigation.
  • By reducing the rotor structure’s temperature through the incorporation of heatsinks, stator temperatures were consequently reduced, which may in turn increase generator lifespans and efficiencies. It is apparent that the inverse is also true, i.e., active cooling of the generators’ components likewise benefits its structural components, reducing stress and deformation across the structure.
As this is the first paper to attempt to simulate heat losses as a means for temperature transfer to the supporting structure of a PMDD generator, and due to a lack of readily available data on the matter, the CFD-FEA analysis outlined in Section 2.4, makes a number of assumptions and simplifications. Further work aiming to refine this simulation towards producing a truer-to-life scenario, such as a more detailed allocation of heat production in the direct-drive generator, as well as separate inside and outside airflows representing passive wind and active fan cooling, would provide further beneficial insights.

Author Contributions

Conceptualization, M.B. and P.J.-S.; methodology, P.J.-S.; formal analysis, M.B. and D.G.-D.; investigation, M.B. and D.G.-D.; resources, P.J.-S.; data curation, M.B. and D.G.-D.; writing—original draft preparation, M.B. and D.G.-D.; writing—review and editing, P.J.-S. and E.O.; supervision, P.J.-S. and E.O.; project administration, P.J.-S.; funding acquisition, P.J.-S. All authors have read and agreed to the published version of the manuscript.

Funding

This research was funded by EPSRC through the Future Electrical Machines Manufacturing, “FEMM”, Hub, grant number 155683.

Data Availability Statement

Data are contained within the article.

Conflicts of Interest

The authors declare no conflicts of interest.

Appendix A

Table A1. Comparison between ANSYS and SolidWorks’ Finite Element Analysis results.
Baseline RotorAdvanced Rotor
ANSYSSolidWorksDifference (%)ANSYSSolidWorksDifference (%)
Mode 0, 20 °C
Maximum Deformation (mm)1.471.460.68%1.52461.540429−1.04%
Maximum Von Mises Stress (Pa)38.7738.660.28%68.0167.7791520.34%
Mode 0, 55.7 °C
Maximum Deformation (mm)2.12.17−3.33%2.39072.393144−0.10%
Maximum Von Mises Stress (Pa)185.7192.1−3.45%206.85241.88168−16.94%
Table A2. CFD-FEA results of the advanced rotor, with grey background denoting the baseline operating scenario.
VariableAverage Heat Generation Rate (°C)Maximum Heat Generation Rate (°C)Average Rotor Volume Temperature (°C)Average Rotor Surface Temperature (°C)Maximum Rotor Surface Temperature (°C)
100% extrapolated losses (1108.5 kW)404.5705415.428444118.068925116.298406180.80674
90% extrapolated losses (997.7 kW)383.6046393.560494109.330937107.862391164.647565
80% extrapolated losses (886.8 kW)359.4766367.45962499.726730998.559667146.681904
Environmental temperature: 0 °C399.6924410.603192104.659817102.815426168.443351
Environmental temperature: 10 °C402.7004413.503268111.720373109.970155174.152592
Environmental temperature: 20 °C404.5705415.428444118.068925116.298406180.80674
Environmental temperature: 30 °C407.9513417.775446124.952048123.237336187.321608
Environmental temperature: 40 °C410.5165420.916036131.308137129.665143193.551724
Environmental temperature: 50 °C413.242422.750595136.938565135.287998199.352458
Airflow velocity: 2.05 m/s397.0629411.294731108.661729106.72026167.798051
Airflow velocity: 4.1 m/s404.5705415.428444118.068925116.298406180.80674
Airflow velocity: 8.2 m/s352.2316360.29547483.25974481.8573649132.407794
Airflow velocity: 12.3 m/s298.9707306.48252556.012388555.12130586.5987422
Defined generator losses (517.5 kW)261.12269.1965.8275.6697.4
Table A3. CFD-FEA results of the Advanced rotor (continued).
VariableMaximum Total Deformation (mm)Maximum Von Mises Stress (Pa)Maximum Airgap Deformation (mm)Minimum Airgap Deformation (mm)
100% extrapolated losses (1108.5 kW)7.3982717,986,6887.1046755.173855
90% extrapolated losses (997.7 kW)6.824816646,424,5766.5644634.841605
80% extrapolated losses (886.8 kW)5.9527600,393,1525.7283014.313871
Environmental temperature: 0 °C6.822642655,258,4966.5645014.366
Environmental temperature: 10 °C7.1834686,678,6566.922934.9578
Environmental temperature: 20 °C7.3982717,986,6887.1046755.173855
Environmental temperature: 30 °C7.6684729,111,7447.375275.571075
Environmental temperature: 40 °C8.07005756,542,9127.7361525.847183
Environmental temperature: 50 °C8.292427801,503,1687.9468576.152822
Airflow velocity: 2.05 m/s7.410163628,218,9446.9681684.4833
Airflow velocity: 4.1 m/s7.3982717,986,6887.1046755.173855
Airflow velocity: 8.2 m/s5.0029458,688,1604.8759763.064497
Airflow velocity: 12.3 m/s3.0203275,507,2962.9513881.669598
Defined generator losses (517.5 kW)3.618967316,771,7763.4363462.35124
Table A4. CFD-FEA results of the Baseline rotor, with grey background denoting the baseline operating scenario.
VariableAverage Heat Generation Rate (°C)Maximum Heat Generation Rate (°C)Average Rotor Volume Temperature (°C)Average Rotor Surface Temperature (°C)Maximum Rotor Surface Temperature (°C)
100% extrapolated losses (1108.5 kW)414.9431.53168.53179.52247.36
90% extrapolated losses (997.7 kW)394.506783410.806871159.368551170.858066235.120326
80% extrapolated losses (886.8 kW)370.669538386.0827146.835913158.289781220.483813
Environmental temperature: 0 °C409.963443429.367567161.034199171.519854244.346557
Environmental temperature: 10 °C412.760377429.736599165.153835179.31847245.326211
Environmental temperature: 20 °C414.9431.53168.53179.52247.36
Environmental temperature: 30 °C417.981289433.843892174.130672186.754466250.585765
Environmental temperature: 40 °C422.026752436.026212179.595431192.060718254.889108
Environmental temperature: 50 °C421.568573433.6744177.980684192.012944249.236399
Airflow velocity: 2.05 m/s418.249814428.835087161.777553179.768922248.82763
Airflow velocity: 4.1 m/s414.9431.53168.53179.52247.36
Airflow velocity: 8.2 m/s415.626512432.006217168.704913182.382952247.547985
Airflow velocity: 12.3 m/s404.969776419.809132146.623846164.195795231.913276
Defined generator losses (517.5 kW)273.796534286.034418100.234433111.230527163.0137
Table A5. CFD-FEA results of the baseline rotor (continued).
VariableMaximum Total
Deformation (mm)
Maximum Von Mises Stress (Pa)Maximum Airgap Deformation (mm)Minimum Airgap Deformation (mm)
100% extrapolated losses (1108.5 kW)11.776982506,168,67211.6051733.089048
90% extrapolated losses (997.7 kW)10.895239466,471,90410.7448612.557209
80% extrapolated losses (886.8 kW)10.056499372,834,4969.9192872.774552
Environmental temperature: 0 °C11.43097465,074,24011.2666941.976938
Environmental temperature: 10 °C11.6743488,489,53611.5053876.233285
Environmental temperature: 20 °C11.791964507,118,14411.6239283.761743
Environmental temperature: 30 °C12.049924525,310,84811.8882864.058718
Environmental temperature: 40 °C12.133654556,985,08811.9552244.653414
Environmental temperature: 50 °C13.018543558,268,99212.8441368.293615
Airflow velocity: 2.05 m/s12.380209425,423,42412.2025216.332108
Airflow velocity: 4.1 m/s11.776982506,168,67211.6051733.089048
Airflow velocity: 8.2 m/s12.365489476,877,66412.2123736.329225
Airflow velocity: 12.3 m/s11.255186388,515,93611.1060856.606413
Defined generator losses (517.5 kW)6.715411251,927,7446.6141561.644034

References

  1. BEIS. Renewable Energy Planning Database (REPD): April 2023; Department for Business, Energy and Industrial Strategy: London, UK, 2023. [Google Scholar]
  2. Kaiser, M.J.; Snyder, B.F. Offshore Wind Energy Cost Modeling; Springer: London, UK, 2012; ISBN 9781608054220. [Google Scholar]
  3. Ren, Z.; Shankar Verma, A.; Li, Y.; Teuwen, J.J.E.; Jiang, Z. Offshore Wind Turbine Operations and Maintenance: A State-of-the-Art Review. Renew. Sustain. Energy Rev. 2021, 144, 110886. [Google Scholar] [CrossRef]
  4. Nejad, A.R.; Keller, J.; Guo, Y.; Sheng, S.; Polinder, H.; Watson, S.; Dong, J.; Qin, Z.; Ebrahimi, A.; Schelenz, R.; et al. Wind Turbine Drivetrains: State-of-the-Art Technologies and Future Development Trends. Wind Energy Sci. 2022, 7, 387–411. [Google Scholar] [CrossRef]
  5. Carroll, J.; McDonald, A.; Dinwoodie, I.; McMillan, D.; Revie, M.; Lazakis, I. Availability, Operation and Maintenance Costs of Offshore Wind Turbines with Different Drive Train Configurations. Wind Energy 2017, 20, 361–378. [Google Scholar] [CrossRef]
  6. Hayes, A.; Sethuraman, L.; Dykes, K.; Fingersh, L.J. Structural Optimization of a Direct-Drive Wind Turbine Generator Inspired by Additive Manufacturing. Procedia Manuf. 2018, 26, 740–752. [Google Scholar] [CrossRef]
  7. Hayes, A.C.; Whiting, G.L. Reducing the Structural Mass of Large Direct Drive Wind Turbine Generators through Triply Periodic Minimal Surfaces Enabled by Hybrid Additive Manufacturing. Clean Technol. 2021, 3, 227–242. [Google Scholar] [CrossRef]
  8. Gaertner, E.; Rinker, J.; Sethuraman, L.; Zahle, F.; Anderson, B.; Barter, G.; Abbas, N.; Meng, F.; Bortolotti, P.; Skrzypinski, W.; et al. Definition of the IEA 15 MW Offshore Reference Wind Turbine; National Renewable Energy Laboratory: Golden, CO, USA, 2020. [Google Scholar]
  9. Gonzalez-Delgado, D.; Jaen-Sola, P.; Oterkus, E. Design and Optimization of Multi-MW Offshore Direct-Drive Wind Turbine Electrical Generator Structures Using Generative Design Techniques. Ocean Eng. 2023, 280, 114417. [Google Scholar] [CrossRef]
  10. Wang, S.; Xing, Y.; Balakrishna, R.; Shi, W.; Xu, X. Design, Local Structural Stress, and Global Dynamic Response Analysis of a Steel Semi-Submersible Hull for a 10-MW Floating Wind Turbine. Eng. Struct. 2023, 291, 1116474. [Google Scholar] [CrossRef]
  11. Wang, S.; Nejad, A.R.; Moan, T. On Design, Modelling, and Analysis of a 10-MW Medium-Speed Drivetrain for Offshore Wind Turbines. Wind Energy 2020, 23, 1099–1117. [Google Scholar] [CrossRef]
  12. Isidori, A.; Mario Rossi, F.; Blaabjerg, F.; Ma, K. Thermal Loading and Reliability of 10-MW Multilevel Wind Power Converter at Different Wind Roughness Classes. IEEE Trans. Ind. Appl. 2014, 50, 484–494. [Google Scholar] [CrossRef]
  13. Bichan, M.; Jaen-Sola, P.; Jack, A. Establishing the Importance of Operating Temperature in the Structural Integrity of Large-Scale Direct-Drive Wind Turbine Generators. Machines 2023, 11, 780. [Google Scholar] [CrossRef]
  14. Bywaters, G.; Mattila, P.; Costin, D.; Stowell, J.; John, V.; Hoskins, S.; Lynch, J.; Cole, T.; Cate, A.; Badger, C.; et al. Northern Power NW 1500 Direct-Drive Gnerator: April 12, 2001–September 30, 2006; National Renewable Energy Lab.(NREL): Golden, CO, USA, 2007. [Google Scholar]
  15. Gaertner, E.; Rinker, J.; Sethuraman, L.; Zahle, F.; Anderson, B.; Barter, G.; Abbas, N.; Meng, F.; Bortolotti, P.; Skrzypinski, W.; et al. IEAWindTask37/IEA-15-240-RWT: 15MW Reference Wind Turbine Repository. Available online: https://github.com/IEAWindTask37/IEA-15-240-RWT (accessed on 10 April 2023).
  16. McDonald, A.; Jaen-Sola, P. A Stiffness Approach for Coupling Structural and Magnetic Models for the Sustainable Design, Optimisation and Real-Time Structural Integrity Assessment of Radial Flux Permanent Magnet Generators for Direct-Drive Wind Turbines. Sustainability 2024, 16, 2393. [Google Scholar] [CrossRef]
  17. Stander, J.N.; Venter, G.; Kamper, M.J. Review of Direct-Drive Radial Flux Wind Turbine Generator Mechanical Design. Wind Energy 2012, 15, 459–472. [Google Scholar] [CrossRef]
  18. BOVIA. Dassault Systèmes BOVIA Solidworks 2022, Version 29.3.0.0059; Dassault Systèmes: San Diego, CA, USA, 2022.
  19. ANSYS. ANSYS ® Academic Research Mechanical 2022, Release 2022R2; ANSYS: Canonsburg, PA, USA, 2022.
  20. BOVIA. Dassault Systèmes BOVIA SOLIDWORKS Sustainability Overview. Available online: https://help.solidworks.com/2020/english/SolidWorks/sldworks/c_Sustainability_Overview.htm (accessed on 24 April 2023).
  21. BOVIA. Dassault Systèmes BOVIA SOLIDWORKS Costing Overview. Available online: https://help.solidworks.com/2018/english/SolidWorks/sldworks/c_costing_top.htm (accessed on 24 April 2023).
  22. Alexandrova, Y.; Semken, R.S.; Pyrhönen, J. Permanent Magnet Synchronous Generator Design Solution for Large Direct-Drive Wind Turbines: Thermal Behavior of the LC DD-PMSG. Appl. Therm. Eng. 2014, 65, 554–563. [Google Scholar] [CrossRef]
  23. ANSYS. SOLID227. 3-D 10-Node Coupled-Field Solid. Available online: https://www.mm.bme.hu/~gyebro/files/ans_help_v182/ans_elem/Hlp_E_SOLID227.html#elem227structmat (accessed on 16 April 2024).
  24. ANSYS. ANSYS ® Granta Selector 2022, Release 2022R1; ANSYS: Canonsburg, PA, USA, 2022.
  25. Kirschneck, M. Mastering Electro-Mechanical Dynamics of Large Off-Shore Direct-Drive Wind Turbine Generators Proefschrift. Ph.D. Thesis, Delft University of Technology, Delft, The Netherlands, 2016. [Google Scholar]
  26. Donald, A.M.C.; Mueller, M.; Zavvos, A. Electrical Drives for Direct Drive Renewable Energy Systems. Chapter 3: Electrical, Thermal and Structural Generator Design and Systems Integration for Direct Drive Renewable Energy Systems; Mueller, M., Polinder, H., Eds.; Woodhead Publishing Limited: Cambridge, UK, 2013. [Google Scholar]
  27. McDonald, A.S.; Mueller, M.A.; Polinder, H. Structural Mass in Direct-Drive Permanent Magnet Electrical Generators. Proc. IET Renew. Power Gener. 2008, 2, 3–15. [Google Scholar] [CrossRef]
Figure 1. (a) The IEA-15MW-RWT; (b) hub, generator, and bedplate assembly; and (c) PMDD generator [8].
Machines 12 00277 g001
Figure 2. Workflow diagram.
Machines 12 00277 g002
Figure 3. Rotor substructure topologies [17].
Machines 12 00277 g003
Figure 4. Deformation modes of an outer rotor [14].
Machines 12 00277 g004
Figure 5. Loads applied to the IEA-15 MW-RWT rotor structure in Ansys.
Machines 12 00277 g005
Figure 6. The IEA-15 MW-RWT rotor, with a mounting cylinder and additional supports.
Machines 12 00277 g006
Figure 7. Parameter local sensitivity to mass.
Machines 12 00277 g007
Figure 8. Topology optimisation output under (a) Mode 0 loading and (b) Mode 1 loading.
Machines 12 00277 g008
Figure 9. Interpreted topology-optimised rotor showing additional inner supports.
Machines 12 00277 g009
Figure 10. The topology-optimised rotor with the stator dummy pictured in bronze.
Machines 12 00277 g010
Figure 11. Net radiant heat flux at the stator dummy surface.
Machines 12 00277 g011
Figure 12. ‘Retrofit’ heatsink designs: (a) fin-based and (b) pin-based.
Machines 12 00277 g012
Figure 13. Integrated Heatsink designs with the dummy stator: (a) large, with 90 fins (large-90); (b) small, with 90 fins (small-90); (c) large, with 180 fins (large-180); and (d) small, with 180 fins (small-180)—front and side.
Machines 12 00277 g013
Figure 14. Integrated heatsink on the topology-optimised rotor, with the dummy stator (front and side views).
Machines 12 00277 g014
Figure 15. The example of conventional topology optimisation results [25].
Machines 12 00277 g015
Figure 16. Representation of the domain of a structural optimisation, where mat represents the volume of the material, and 0 represent the different optimisation volume domains, and Γmag represents the surface where the magnetic loads are applied [25].
Machines 12 00277 g016
Figure 17. Multi-objective combined convergence criterion.
Machines 12 00277 g017
Figure 18. Structural optimisation process using generative design techniques [10].
Machines 12 00277 g018
Figure 19. Topology optimisation model: (a) initial volume approach with conical structure; (b) initial volume approach with conical fillet structure; and (c) initial volume approach with reinforced disk structure.
Machines 12 00277 g019
Figure 20. SolidWorks CFD mesh for the advanced rotor, with mesh density levels depicted by colour.
Machines 12 00277 g020
Figure 21. Impact of hole diameter on deformation for partial-depth cut-outs in the cylinder: (a) large diameter holes and (b) small diameter holes. (deformation scale factor of 200:1).
Machines 12 00277 g021
Figure 22. Temperatures of the (a) baseline rotor (pictured with the dummy stator) and (b) topology-optimised rotor.
Machines 12 00277 g022
Figure 23. Maximum deformation experienced under the CFD import scenario: (a) large-180 variant and (b) topology-optimised rotor. (deformation scale factor of 100:1).
Machines 12 00277 g023
Figure 24. Stress experienced by the advanced rotor under the CFD-FEA operating scenario.
Machines 12 00277 g024
Figure 25. Operating parameter sensitivity analysis.
Machines 12 00277 g025
Figure 26. Flow visualisation of the advanced (top) and baseline (bottom) rotors at (a) 4.1 ms−1; (b) 8.2 ms−1; and (c) 12.3 ms−1 flow speeds.
Machines 12 00277 g026
Figure 27. Environmental impact of rotor structure as a percentage of manufacturing impact.
Machines 12 00277 g027
Figure 28. Non-converging results for the generative design process.
Machines 12 00277 g028
Figure 29. Generative design results from: (a) Overhang angle constraint; (b) Pull-out direction constraint; (c) Combination constraint.
Machines 12 00277 g029
Figure 30. Campbell diagram of the generative design optimisation.
Machines 12 00277 g030
Table 1. Heatsink device specifications.
Design NameHeatsink
Composition
NatureNumber of FinsTotal (Heatsink) Mass [t]Total (Heatsink) Volume [m3]Total (Heatsink) Surface Area [m2]
Parameter
Optimised Rotor
NoneNoneNone234.930.03310.55
Small-90Carbon Steel SA216Fins—integrated90238.430.47340.34
Large-90Carbon Steel SA216Fins—integrated90245.531.37364.22
Small-180Carbon Steel SA216Fins—integrated180238.430.47369.77
Large-180Carbon Steel SA216Fins—integrated180245.531.37416.78
Retrofit FinsAluminiumFins—external90239.2 (4.19)31.58 (1.55)511.96 (201.41)
Retrofit PinsAluminiumPins—external90 rows 540 pins239.0 (4.04)31.53 (1.50)495.48 (184.93)
Advanced RotorCarbon Steel SA216Fins—integrated, helix176174.222.27500
Table 2. Generative design optimisation strategy variables.
Mesh Analysis
Elements300,000–1,500,000
Mesh control methodHexahedron
Element size0.2 m
Local mesh control (optimisation volume)0.1 m
Multi-Objective CriteriaObjective Weight
Primary criterion: Airgap displacement limit (2.0 mm)(5)
Mass reduction(3)
Minimise total displacement(1)
Maximise frequency modes(1)
Optimisation Process
Convergence rate0.2%
Number of iterations50–500
Response constraintMass reduction %; Primary criterion
Manufacturing constraintsCyclic symmetry; pull-out direction; and AM overhang angle
Table 3. Rotor optimisation results under Modes 0 and 1 loading scenarios.
DescriptionUnaltered IEA RotorPrevious Parameter Optimised Rotor [13]Parameter Optimised BaselineAdvanced RotorLimits
Disk thickness (mm)82.21416.18326.21116-
Cylinder thickness (mm)129.06224.3265.37183.8-
Mass (kg)1.2255 × 1053.9802 × 1052.3498 × 1051.7425 × 105-
Mode 0 Max. Eq. Von-Mises Stress (MPa)69.3212.9938.7768.01200
Mode 0 Max. Total Deformation (mm) 20.450.931.471.522.03
Mode 1 Max. Eq. Von-Mises Stress (MPa) 100.1013.4040.0359.98200
Mode 1 Max. Total Deformation (mm)30.681.081.781.722.03
Table 4. Response surface optimisation candidates.
CandidateOutside Cylinder Radius (mm)Outside Shaft Radius (mm)Disk Thickness (mm)Support Thickness (mm)Mass (tonne)Deformation (mm)
15322.11451.611599.635206.391.099
25328.91452.1114.4499.709210.091.098
35334.51458.7114.4898.502213.811.098
45322.71459.1114.61101.71207.821.095
55322.71459.1114.61101.71207.821.095
65320.11452116.0998.69205.751.096
75328.11475114.499.051211.971.100
85322.91473114.8899.294209.071.100
95330.31452.2115.1799.113211.251.093
105320.41453115.7299.935206.121.095
Table 5. Advanced rotor optimisation results.
Modification Rotor + Inner Disk SupportsDisk CutsCylinder CutsOuter Disk SupportsHeatsinkOverall Change
Total Mass (t) 208.62190.32156.75168.46174.25−34.37
Mass (%)-−8.77−17.64+7.47+3.44−16.47
Deformation (mm)11.091.561.751.591.53+0.43
Table 6. Steady-state temperatures predicted by the CFD simulation.
RotorAverage Heat Generation RateMaximum Heat Generation RateAverage Rotor TemperatureMaximum Rotor Temperature
Unaltered Rotor431.7 °C448.5 °C169.5 °C245.6 °C
Unaltered Rotor w/Magnets414.1 °C430.7 °C172.4 °C263.6 °C
Parameter Optimised Rotor 415.5 °C432.6 °C170.2 °C249.0 °C
Small-90413.9 °C425.2 °C162.1 °C232.6 °C
Large-90 412.9 °C424.8 °C161.4 °C230.0 °C
Small-180 410.9 °C422.4 °C159.1 °C227.8 °C
Large-180409.2 °C419.0 °C147.9 °C215.5 °C
External Fins412.8 °C424.4 °C161.8 °C231.9 °C
External Pins412.5 °C423.0 °C184.0 °C227.3 °C
Advanced Rotor 404.3 °C413.7 °C117.9 °C179.9 °C
Table 7. Results of the Finite Element Analyses.
No Temperature
Considerations
55.7 °C Operating
Temperature
CFD Import
Max. Cylinder Deformation (mm)Stress
(Pa)
Max. Cylinder Deformation (mm)Stress
(Pa)
Max. Cylinder Deformation (mm)Stress
(Pa)
Parameter Optimised Rotor1.463.867 × 1072.171.921 × 10811.104.858 × 108
Small-901.534.613 × 1072.181.847 × 10810.244.519 × 108
Large-90 1.694.494 × 1072.301.846 × 10810.634.492 × 108
Small-180 1.534.757 × 1072.181.848 × 1089.444.461 × 108
Large-1801.704.480 × 1072.311.846 × 1089.844.107 × 108
External Fins1.503.747 × 1072.651.847 × 10811.194.531 × 108
External Pins1.463.844 × 1072.481.923 × 10811.624.499 × 108
Advanced Rotor1.546.778 × 1072.302.419 × 1087.107.180 × 108
Table 8. Environmental impact of rotor design.
Unaltered IEA RotorParameter Optimised RotorAdvanced Rotor
Energy (TJ)Casting1.632.862.48
MachiningN/AN/A0.04
(% change)-+75.5+54.6
Carbon Dioxide (t)Casting98.22171.82149.16
MachiningN/AN/A2.52
(% change)-+74.9+54.4
Water (Litres)Casting3.76 × 1066.57 × 1065.70 × 106
(% change)-+74.7+51.6
Table 9. Rotor manufacturing costs.
Unaltered RotorParameter Optimised Baseline RotorAdvanced Rotor
Manufacturing cost GBP
(USD)
97,600
(123,400)
172,400
(218,000)
193,100
(244,100)
Change from original %-+76.6+97.8
Financial impact GBP
(USD)
58,200
(73,600)
114,000
(144,200)
131,500
(166,200)
Change from original %-+95.9+125.9
Total GBP
(USD)
155,800
(197,000)
286,400
(362,200)
324,600
(410,300)
Change from original %-+83.8+108.3
Table 10. Generative design optimisation results.
T: 55.7 °CAdvanced Rotor with Heatsink(a)(b)(c)
Total Mass (t) 174.25139.49169.56161.95
Mass (%)N/A−24.92%−2.77%−7.59%
Deformation (mm)2.302.0571.7821.808
Max. Eq. Von-Mises Stress (MPa)241.90295.77214.32340.16
Table 11. Modal analysis results with effective mass participation factors.
Effective Mass Participation Factor
ModelFrequency ModeFrequency (Hz)X-DirectionY-DirectionAxial Z-Direction
Advanced rotor with Heatsink
315.775.582.100.00
415.772.105.580.00
719.070.000.0069.38
1346.5746.349.060.00
1446.579.0646.340.00
(a)414.594.456.270.00
514.606.284.460.00
817.730.000.0074.63
1338.0855.386.170.00
1438.096.1755.380.00
(b)316.226.170.380.00
416.220.386.170.00
719.360.000.0069.44
1553.1052.236.090.00
1653.106.0952.220.00
(c)315.162.474.230.00
415.164.232.470.00
718.130.000.0072.97
1552.6249.959.720.00
1652.629.7249.950.00
Disclaimer/Publisher’s Note: The statements, opinions and data contained in all publications are solely those of the individual author(s) and contributor(s) and not of MDPI and/or the editor(s). MDPI and/or the editor(s) disclaim responsibility for any injury to people or property resulting from any ideas, methods, instructions or products referred to in the content.

