Article

Prediction of Thrust Force and Cutting Torque in Drilling Based on the Response Surface Methodology

by
Panagiotis Kyratsis
1,*,
Angelos P. Markopoulos
2,
Nikolaos Efkolidis
1,
Vasileios Maliagkas
1 and
Konstantinos Kakoulis
1
1
Department of Mechanical Engineering & Industrial Design, Western Macedonia University of Applied Sciences, Kila Kozani GR 50100, Greece
2
School of Mechanical Engineering, Section of Manufacturing Technology, National Technical University of Athens, Heroon Polytechniou 9, Athens 15780, Greece
*
Author to whom correspondence should be addressed.
Machines 2018, 6(2), 24; https://doi.org/10.3390/machines6020024
Submission received: 25 April 2018 / Revised: 30 May 2018 / Accepted: 31 May 2018 / Published: 4 June 2018
(This article belongs to the Special Issue Precision Machining)

Abstract

:
In this research, experimental studies were based on drilling with solid carbide tools and the material used was Al7075. The study primarily focused on investigating the effects of machining parameters (cutting speed, feed rate, diameter of the tool) on the thrust force (Fz) and the cutting torque (Mz) when drilling an Al7075 workpiece. The experimental data were analyzed using the response surface methodology (RSM) with an aim to identify the significant factors on the development of both the Fz and Mz. The application of the mathematical models provided favorable results with an accuracy of 3.4% and 4.7%, for the Fz and the Mz, respectively. Analysis of variance (ANOVA) was applied in order to examine the effectiveness of the model, and both mathematical models were established and validated. The equations derived proved to be very precise when a set of validation tests were executed. The importance of the factors’ influence over the responses was also presented. Both the diameter of the cutting and the feed rate were found to be the factors of high significance, while cutting speed did not affect considerably the Fz and Mz in the experiments performed.

1. Introduction

A majority of products are directly or indirectly related to the metal cutting processes during their production processes. From the most commonly used processes, such as milling, turning, tapping and so forth, drilling constitutes the most commonly used. A significant number of holes are necessary for the assembly of different parts in order to be connected each other and develop the product itself.
Many researchers have developed empirical methodologies based on statistics, which can be used to learn the interactions between manufacturing factors. Response surface methodology (RSM) is one of the most widely used. RSM is a collection of an empirical modeling approach for defining the relationship between a set of manufacturing parameters and the responses. Different criteria are used and the significance of these manufacturing parameters on the coupled responses are examined. This methodology uses a number of techniques based on statistics, graphics, and mathematics, for both improving and optimizing a manufacturing process. Kumar and Singh [1] used ANOVA to investigate the material removal rate (MRR) and surface roughness of optical glass BK-7, which was drilled by a rotary ultrasonic machine. A number of manufacturing parameter combinations were used in order to effectively investigate the drilling process itself. The experimental process showed that the most influential factor was the feed rate, while the developed prediction models kept the error within 5% at a 95% confidence level. RSM was used by Balaji et al. [2] on the drilling process of Ti-6Al-4V alloy. Drilling parameters (i.e., spindle speed, helix angle, feed rate) were tested and the surface roughness, flank wear, and acceleration of drill vibration velocity (ADVV) were measured. A multi-response optimization was performed with a view to optimize the drilling parameters for minimizing the output in each case (surface roughness, flank wear, ADVV). Similarly, Balaji et al. [3] investigated the effects of helix angle, spindle speed, and feed rate on surface roughness, flank wear, and ADVV during the drilling process of AISI 304 steel with twist drill tools. The significant parameters were retrieved based on the RSM, while the optimum drilling parameters were identified based on a multi-response surface optimization method.
Furthermore, Nanda et al. [4] used RSM to measure the responses, such as material removal rate (MRR), surface roughness, and flaring diameter, with the three input parameters—pressure, nozzle tip distance, and abrasive grain size—on a borosilicate-glass workpiece with zircon abrasives. Boyacı et al. [5] developed a fuzzy mathematical model using a multi-response surface methodology based on the drilling process of PVC samples in an upright drill. Cutting parameters, such as cutting speed, feed rate, and material thickness, were tested for the minimization of surface roughness and cutting forces. RSM was also used by Ramesh and Gopinath [6] during drilling of sisal-glass fiber reinforced polymer composites to predict the influence of cutting parameters on thrust force. The adequacy of the models was checked using the analysis of variance (ANOVA). The results showed that the feed rate was the most influencing parameter on the thrust force, followed by the spindle and the drill diameter. Jenarthanan et al. [7] developed a mathematical model in order to predict how the input parameters (tool diameter, spindle speed, and feed rate) influence the output response (delamination) in machining of the ARALL composite using different cutting conditions. RSM was used for the analysis of the influences of entire individual input machining parameters on the delamination.
Rajamurugan et al. [8] developed empirical relationships to model thrust force in the drilling of GFRP composites by a multifaceted drill bit. The empirical relationships were developed by the response surface methodology, incorporating cutting parameters such as spindle speed (N), feed rate (f), drill diameter (d), and fiber orientation angle (q). The result was that the developed model can be effectively used to predict the thrust force in drilling of GFRP composites within the factors and their limits of the study. Rajkumar et al. [9] used RSM to predict the input factors influencing the delamination and thrust force on drilled surfaces of carbon-fiber reinforced polymer composite at different cutting conditions with the chosen range of 95% confidence intervals. Ankalagi et al. [10] used response surface methodology to analyze the machinability and hole quality characteristics in the drilling of SA182 steel with an HSS drill. They investigated the effects of machining parameters, such as cutting speed, feed rate, and point angle, on (a) thrust force, (b) specific cutting coefficient, (c) surface roughness, and (d) circularity error. The experimental methodology showed that thrust force, specific cutting coefficient, and surface roughness decrease with the increase in cutting speed, whereas the circularity error increases with increased cutting speed and feed, on micro-EDM drilling process parameters. Natarajan et al. [11] analyzed the effect of the manufacturing parameters (i.e., feed rate, capacitance, voltage) on machining a stainless-steel shim with a tungsten electrode. In all cases, the surface roughness, the MRR, and tool wear were measured. RSM helped the development of statistical models for multi-response optimization, based on the desirability function with an aim to determine the optimum manufacturing parameters. Finally, Kyratsis et al. [12] investigated the relationship of three manufacturing parameters (diameter of the tools, cutting speed, feed rate) on the cutting forces developed when drilling an Al7075 workpiece. The response surface methodology was the main tool for establishing the appropriate mathematical prediction models.
This paper presents a study of the Al7075 drilling process when using solid carbide tools with different diameters. A series of appropriately selected cutting speeds and feed rates were applied and different mathematical models for the prediction of the thrust force (Fz) and the cutting torque (Mz) were calculated. Analysis of variance (ANOVA) was used in order to validate the adequacy of the mathematical models and depict the significance of the manufacturing parameters. The novelty of this work is the development of mathematical models that can be used with high levels of confidence in order to predict the thrust force and torque expected during the drilling of Al7075, within a wide range of cutting parameters (cutting speed 50~150 m/min, feed rate 0.15~0.25 mm/rev). The optimum usage of cutting tools is something crucial for CNC users as it can affect the whole machining process.

2. Materials and Methods

2.1. Selection of Materials

Nowadays, the metal cutting process is a very important issue for the manufacturing sector. Al7075 is an aluminum alloy having zinc as the main alloying element. Due to its excellent properties (strength, density, thermal behavior), it is widely used in the manufacturing industry for vehicles. In addition, it provides the sector of aviation with a lighter, stronger aluminum component, as well as enabling safer, lighter, and more fuel-efficient vehicles. Furthermore, its ability to be highly polished makes it suitable for the mold tool manufacturing industry. The aforementioned reasons have led a number of researchers to focus their studies on these factors [13,14,15]. In this study, an Al7075 plate (150 mm × 150 mm × 15 mm) was selected for performing the experimental work. The material’s mechanical properties and chemical composition is depicted in Table 1.

2.2. Response Surface Methodology

RSM is a popular method for deriving mathematical models of manufacturing systems, based on the principles of statistics. The same method can be the basis for applying optimization as well. The input parameters are identified together with their value ranges in the application under study. Then, the experimental process is set. Finally, mathematical models are calculated for the responses measured in each case. The effects of all input parameters and their interactions on the response are analyzed and their importance is derived. Different statistical methodologies (i.e., analysis of means and variances) are developed in order to establish the accuracy and adequacy of the derived mathematical model.

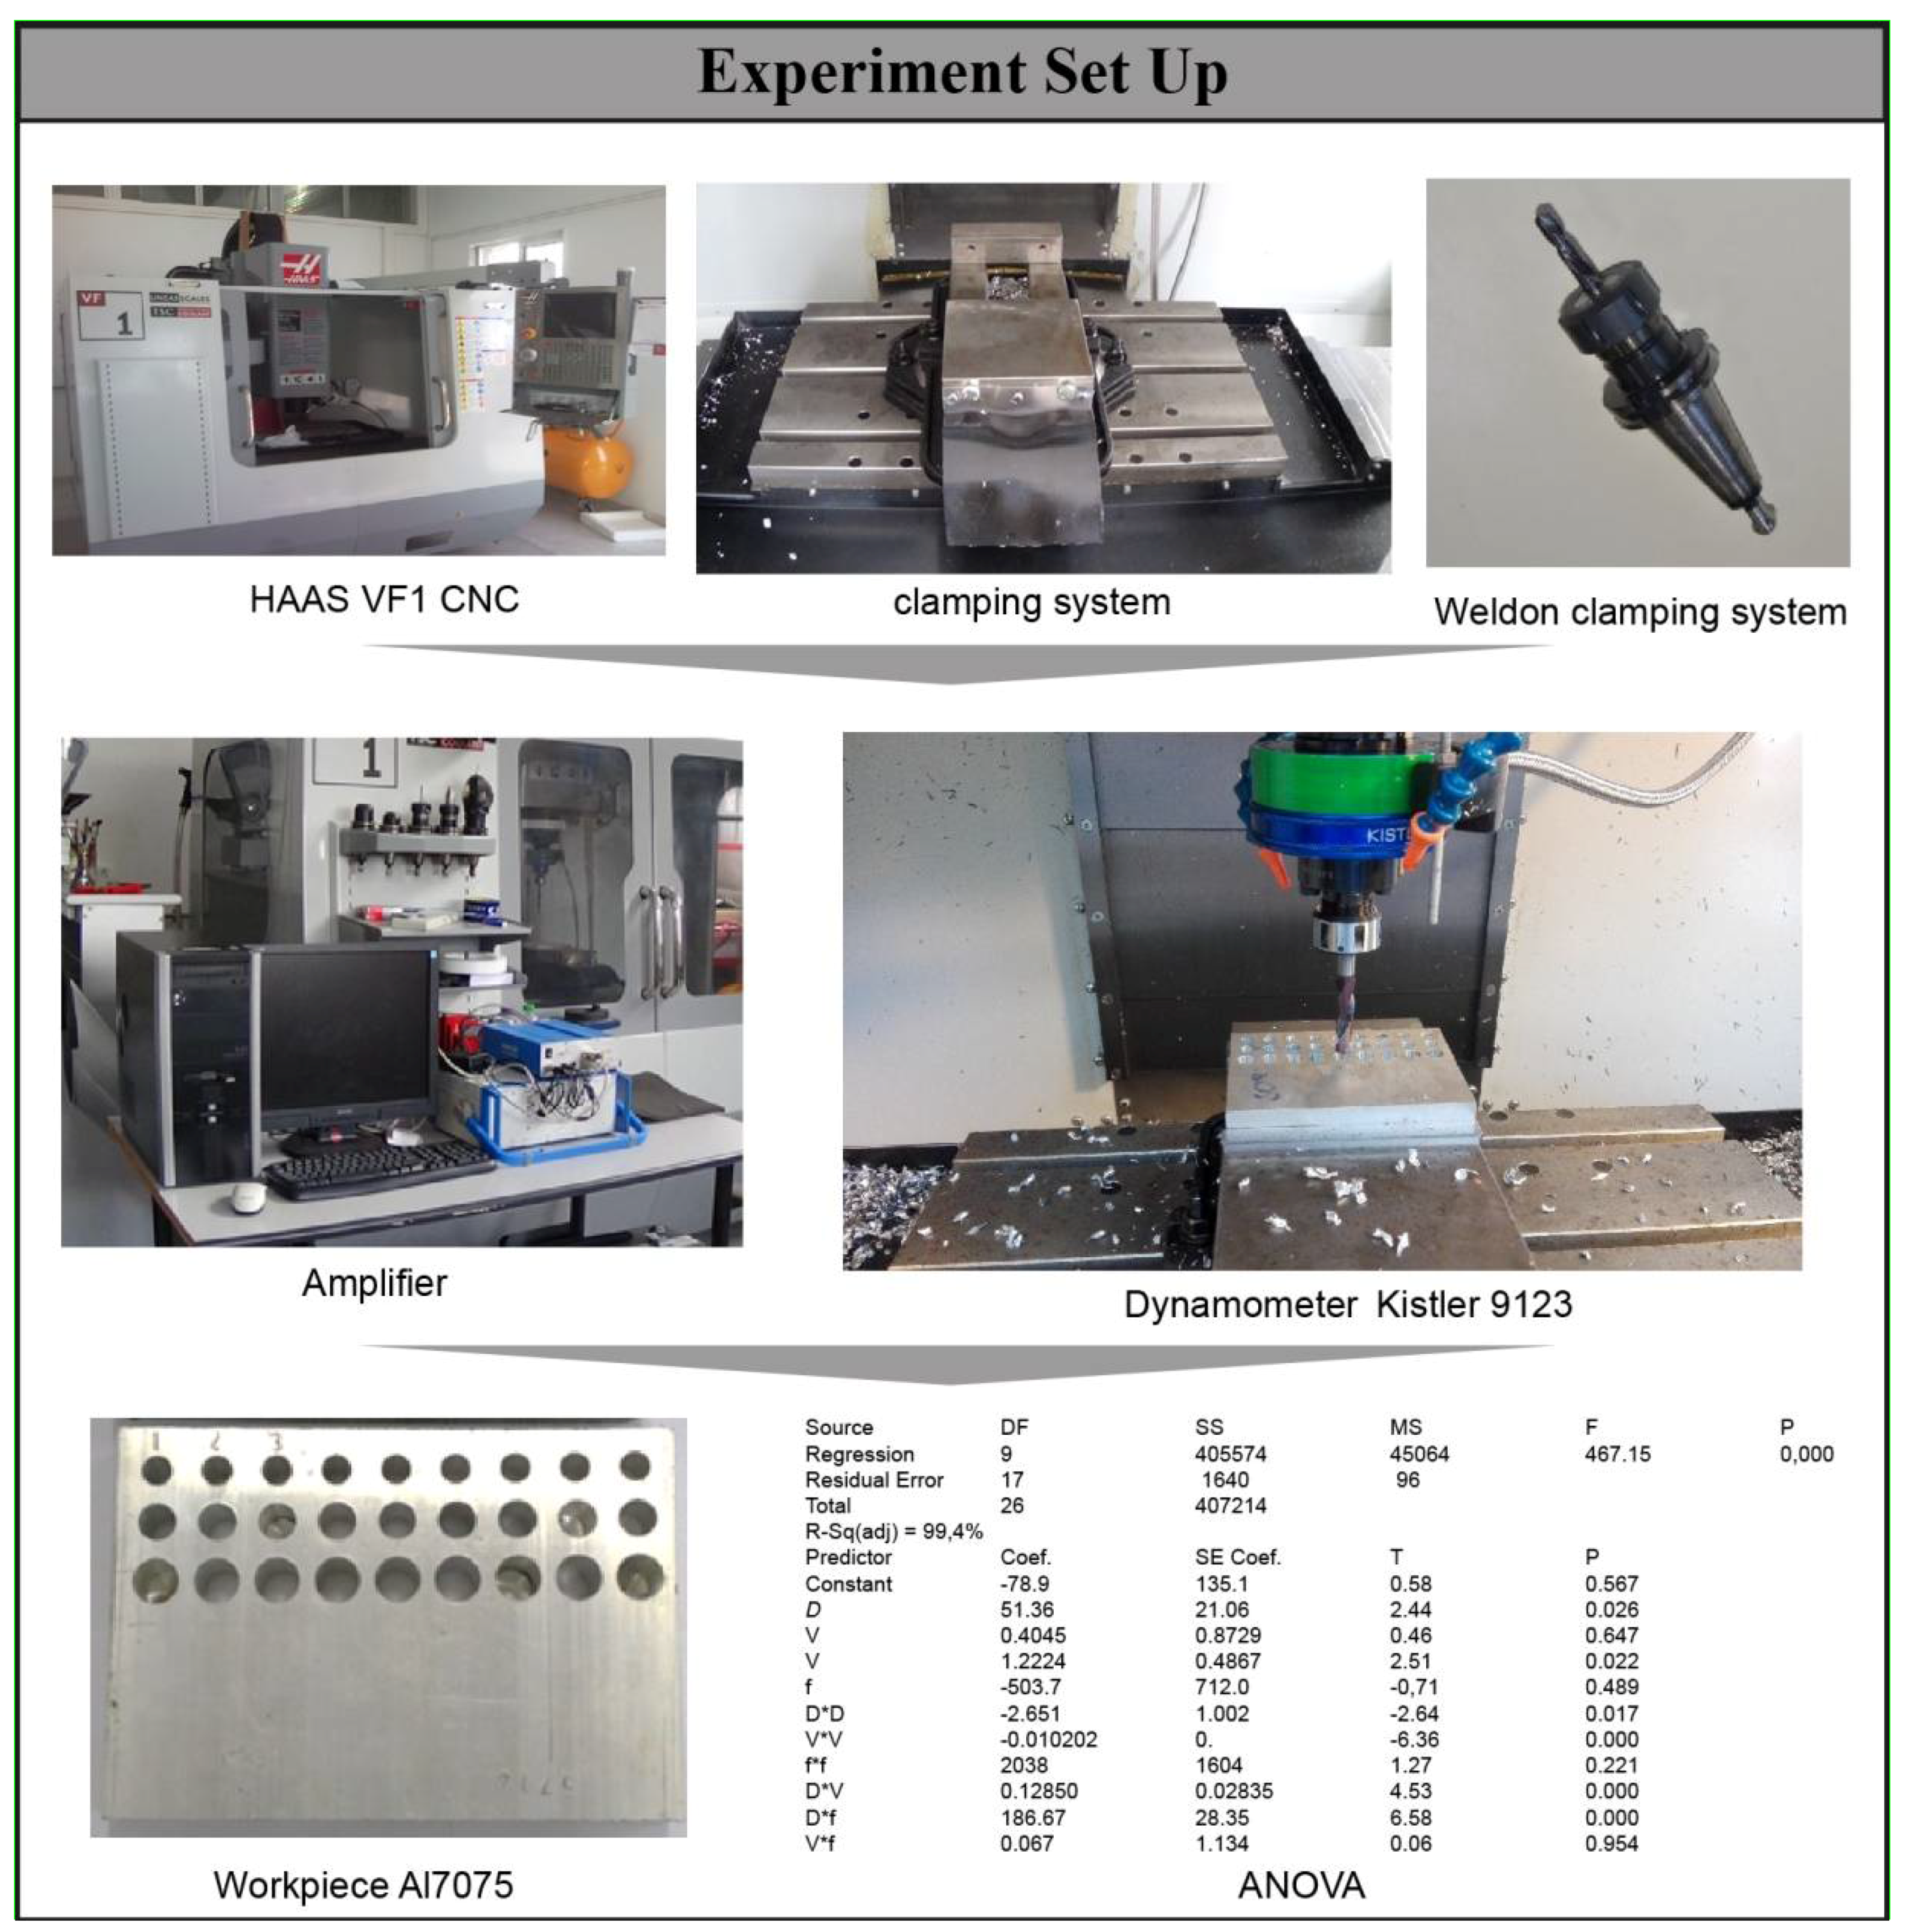
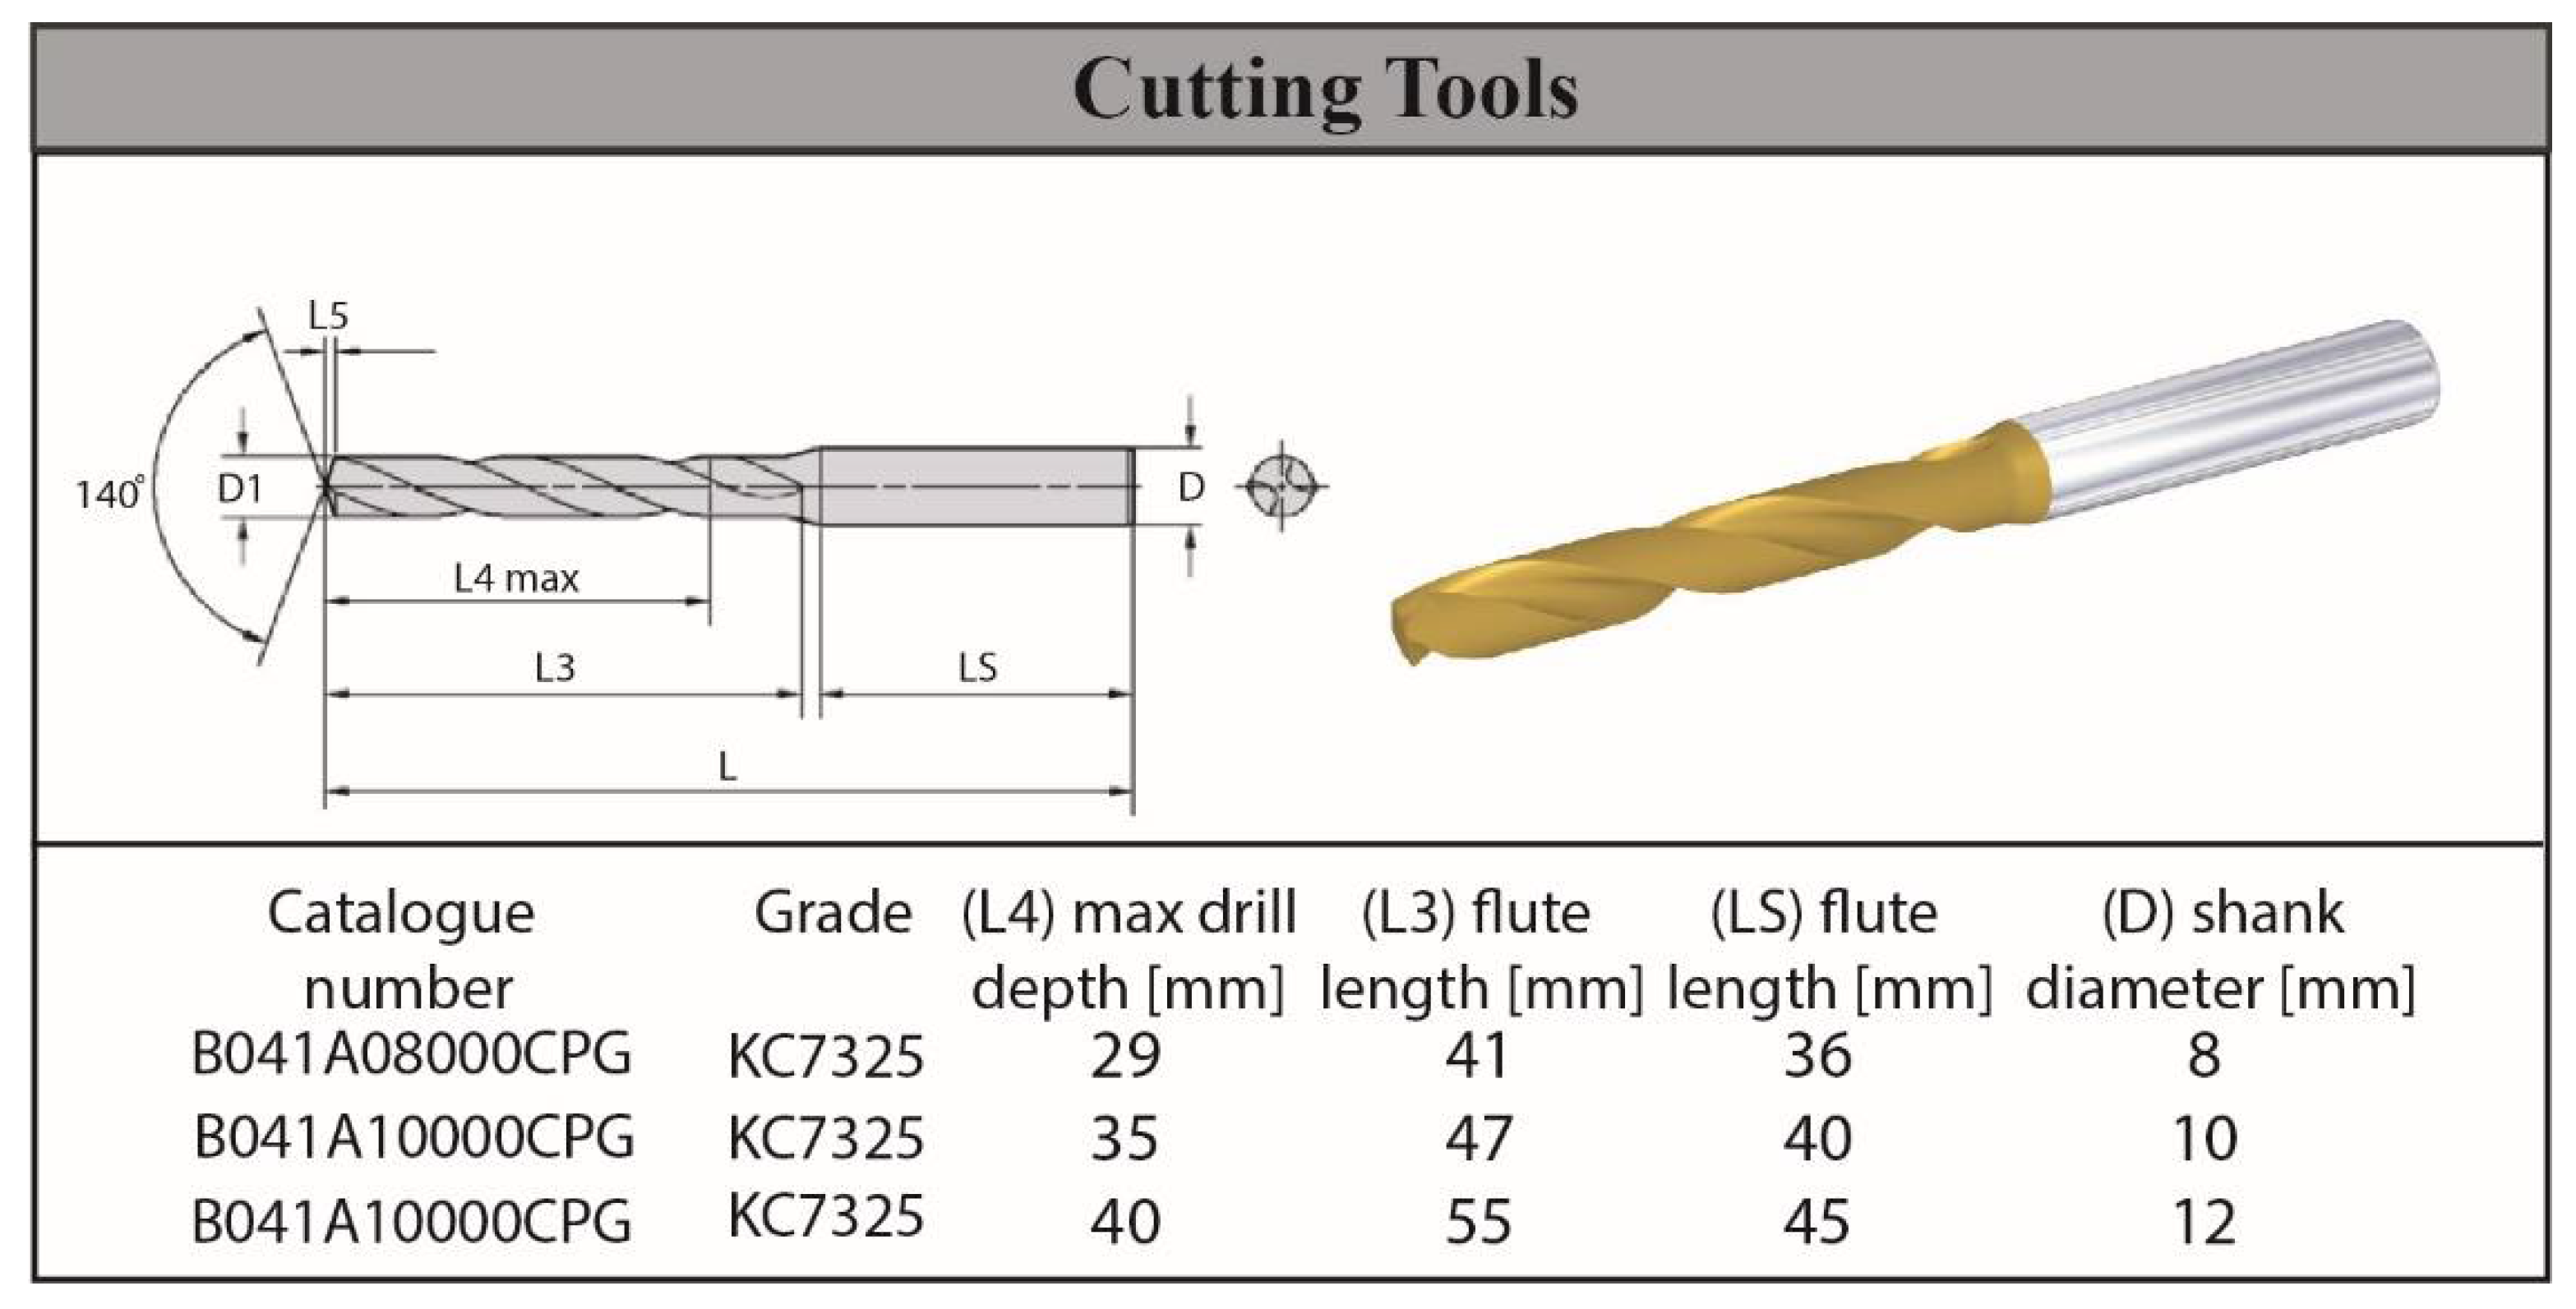
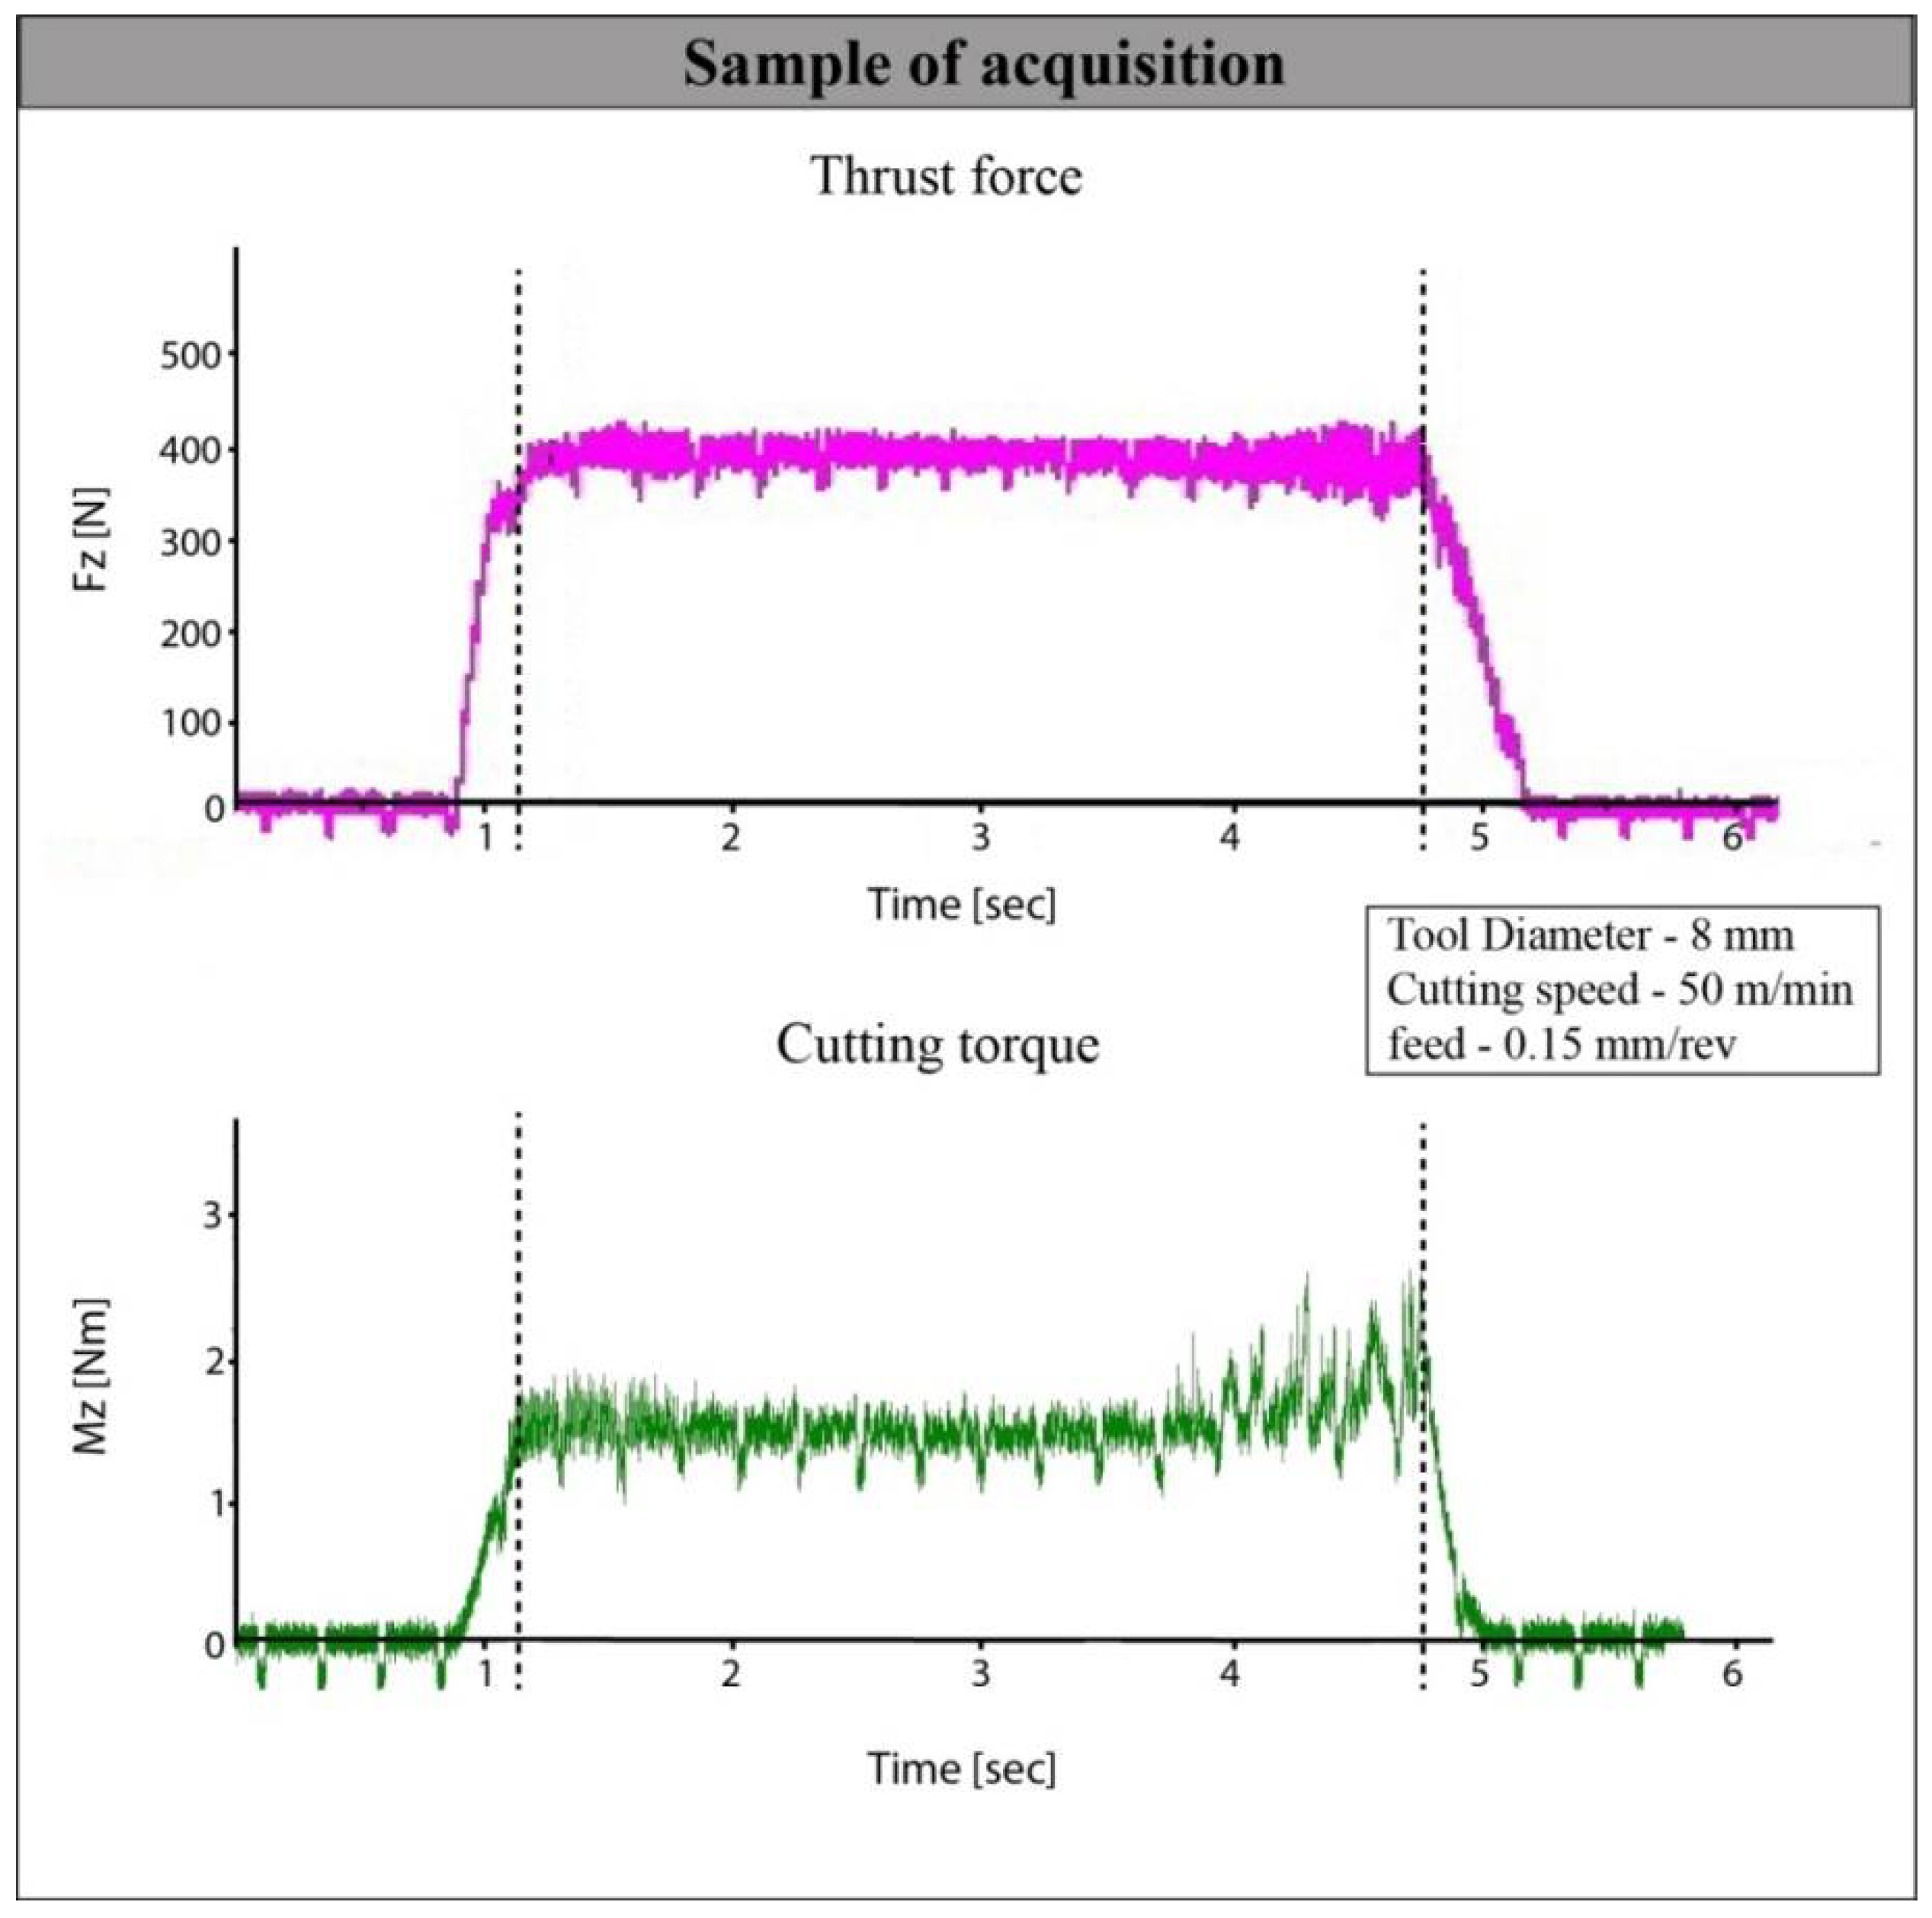
2.3. Experimental Details
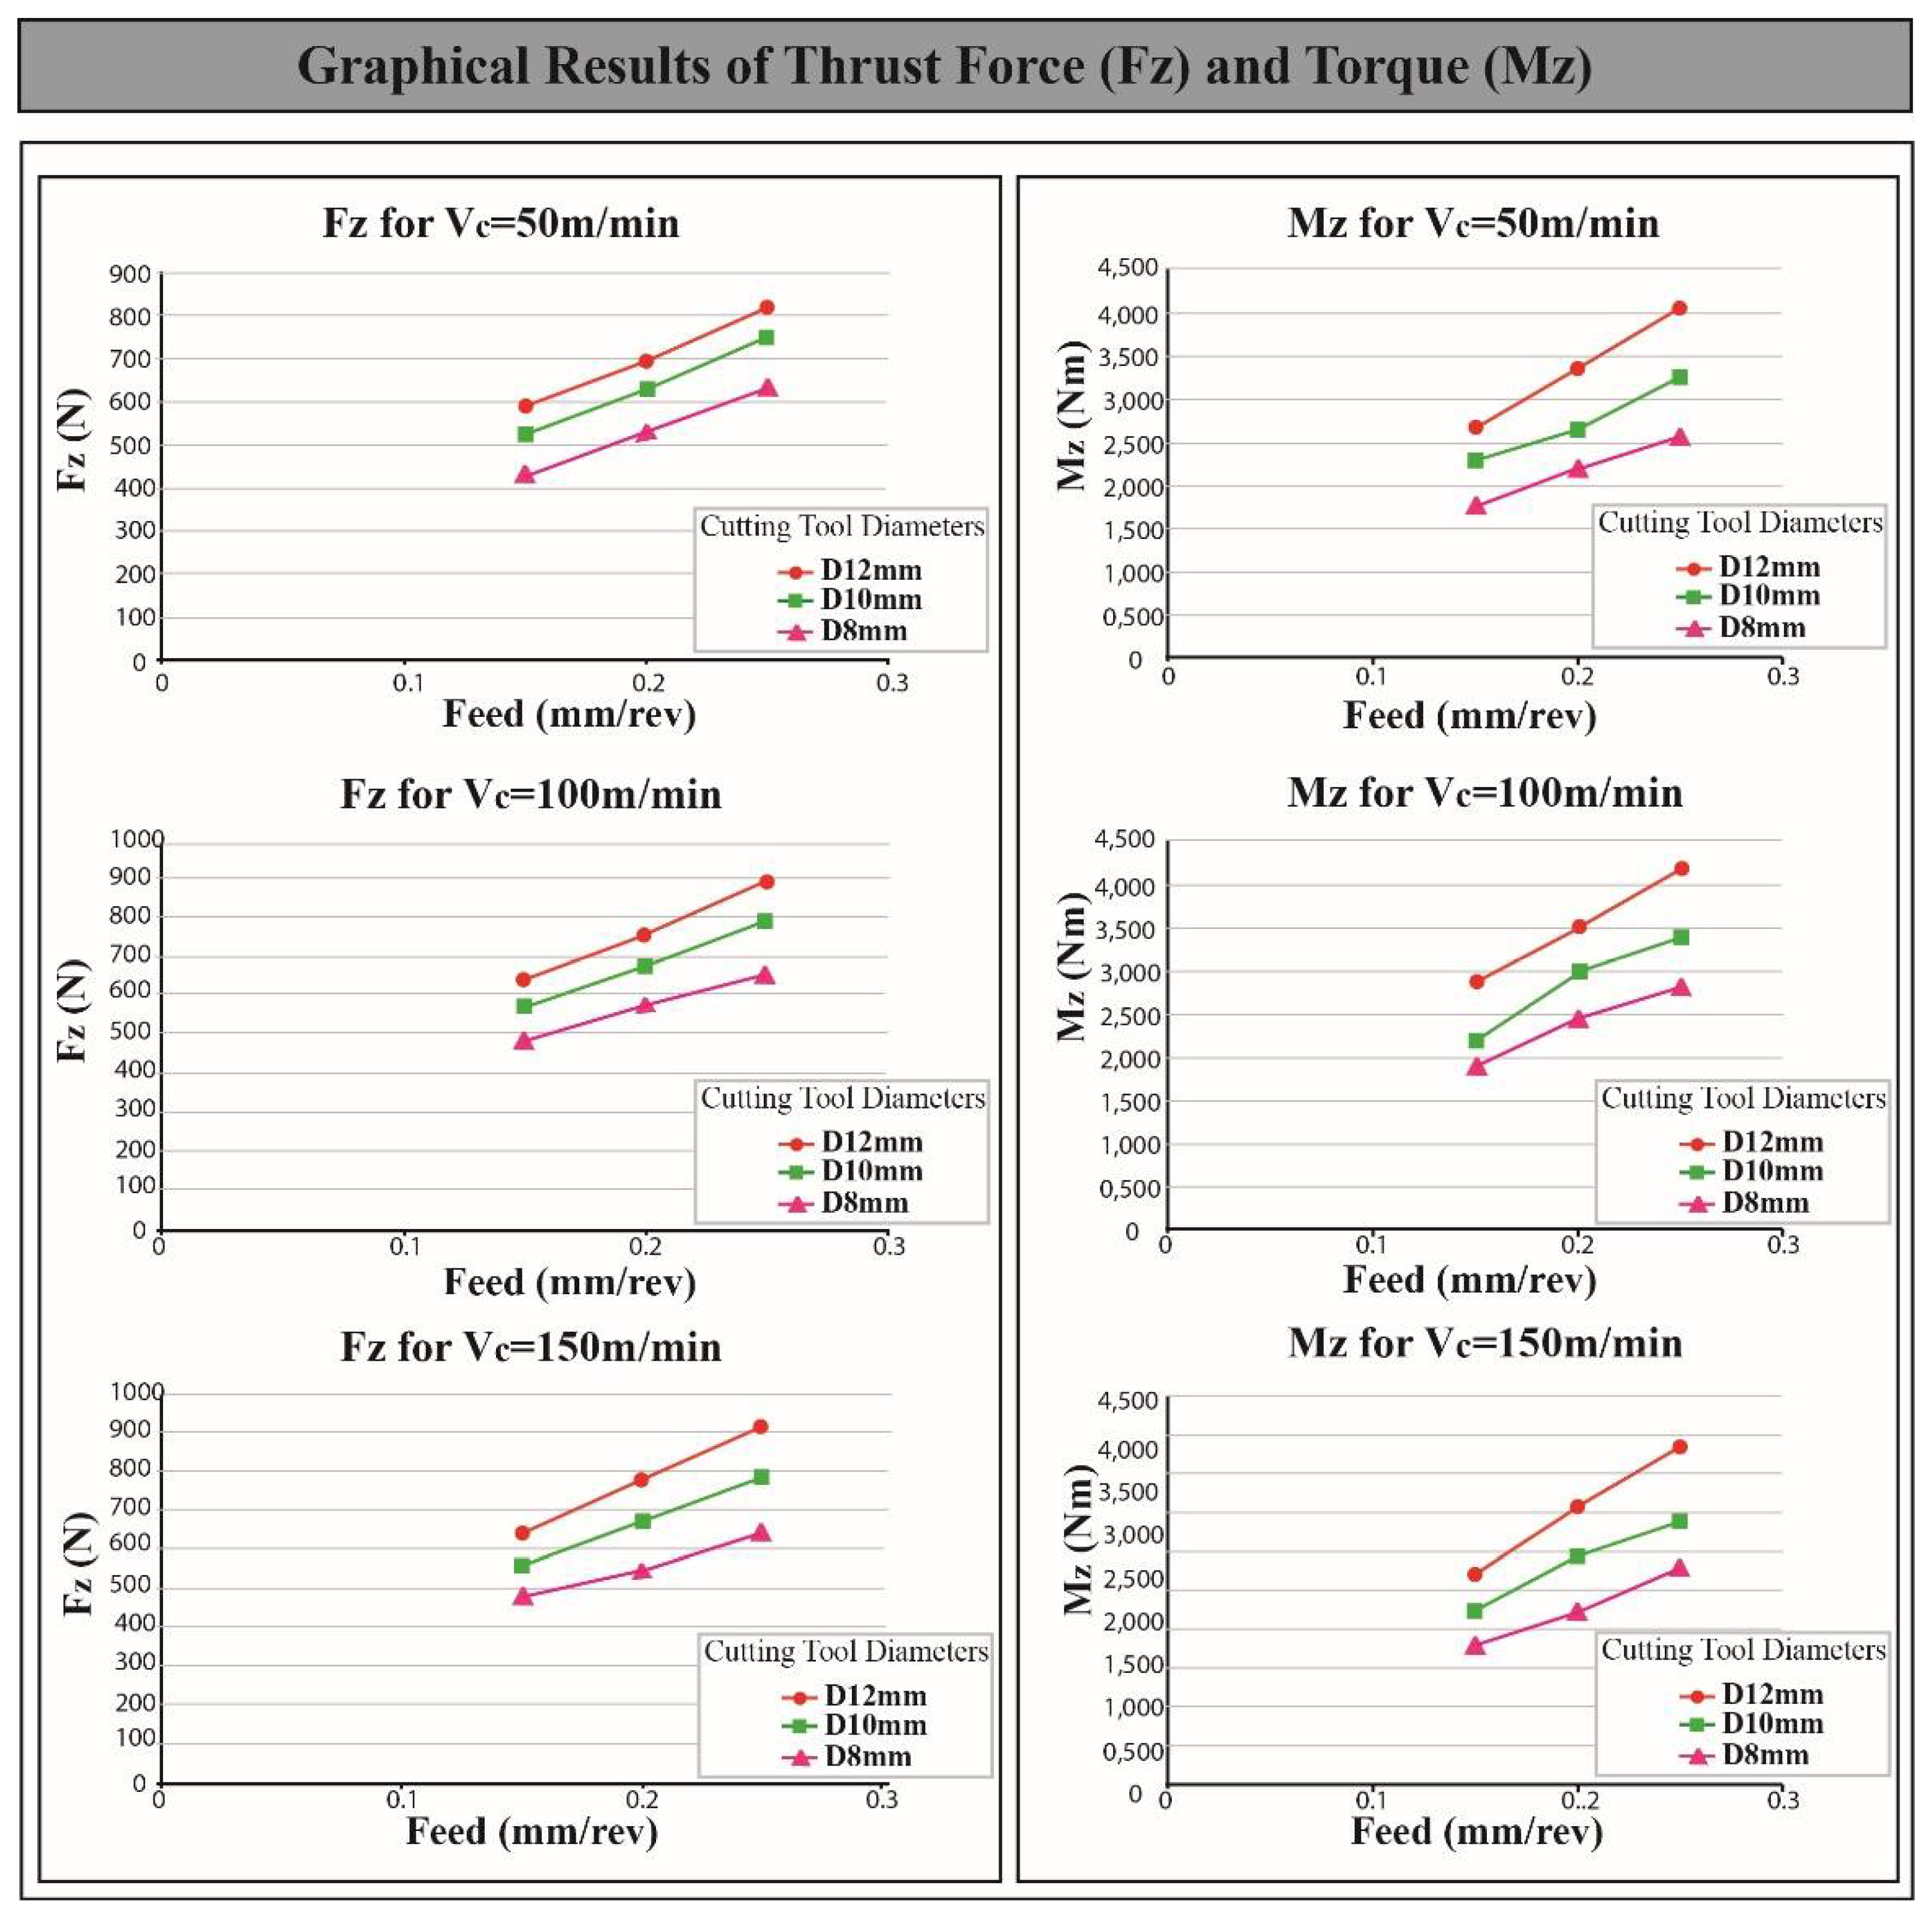
In this research, an Al7075 block was used as a stock material. A HAAS VF1 CNC machining center was used to perform all the drilling tests. The machining center is able to perform with continuous speed and feed control within its operational limits. During the tests, three cutting speeds (V) and three feed rates (f) were applied in combination with three cutting tools’ diameters (D). Table 2 depicts the factors used in this research together with their levels.
A mechanical vise was used for clamping the workpiece and a Weldon clamping device with high rigidity was used to clamp the drill. The type of cutting fluid was KOOLRite 2270 which was provided by the delivery system near to the cutting tool. A Kistler dynamometer type 9123 (capable of measuring four components at the same time) measured the thrust force (Fz) and torque (Mz) values in each case of a set of twenty-seven experiments, which were executed by using 27 different (one tool for each hole) non-through coolant solid carbide drill tools (Kennametal B041A, flute helix angle of 30 degrees). All the possible combinations of the manufacturing parameters were used (cutting speed, feed rate, tool diameter). Figure 1 depicts the steps of the research conducted. The main shape of the cutting tools and all the dimension details are illustrated in Figure 2.
Figure 3 demonstrates a sample graph of the measurements of thrust force and cutting torque. As mentioned, Kistler 9123 dynamometer has been used to measure the thrust force and cutting torque during the drilling process. Dynoware software (type 2825D-02) was used in order to monitor and record the values through a three-channel charge amplifier with a data acquisition system. During the tests, the thrust force and cutting torque were displayed graphically on the computer monitor and analyzed, enabling early error detection, and ensuring a steady state condition. As the sampling rate was high (approximately 10 kHz), the mean value was used as the final data in order to secure the value accuracy. The thrust force and cutting torque monitoring was developed as a means of enhancing the process monitoring capabilities.
Figure 4 illustrates all the experimental values derived from the dynamometer. It is obvious from the figure that when the diameter of the tool increases, both the Fz and Mz values increase. The same happens in the case of the feed rate. As the feed rate values increase, the Fz and the Mz increase, respectively. On the other hand, the different values of cutting speed do not noticeably affect their value in both cases.

3. Results

RSM was employed with a view to developing mathematical models for the Fz and the Mz in terms of cutting speed, feed rate, and cutting tool diameters. Least square fitting was used with the mathematical models in order to offer reliability. A full factorial strategy was applied and twenty-seven drilling experiments were performed, and both the Fz and Mz were modelled separately using polynomial mathematical models.

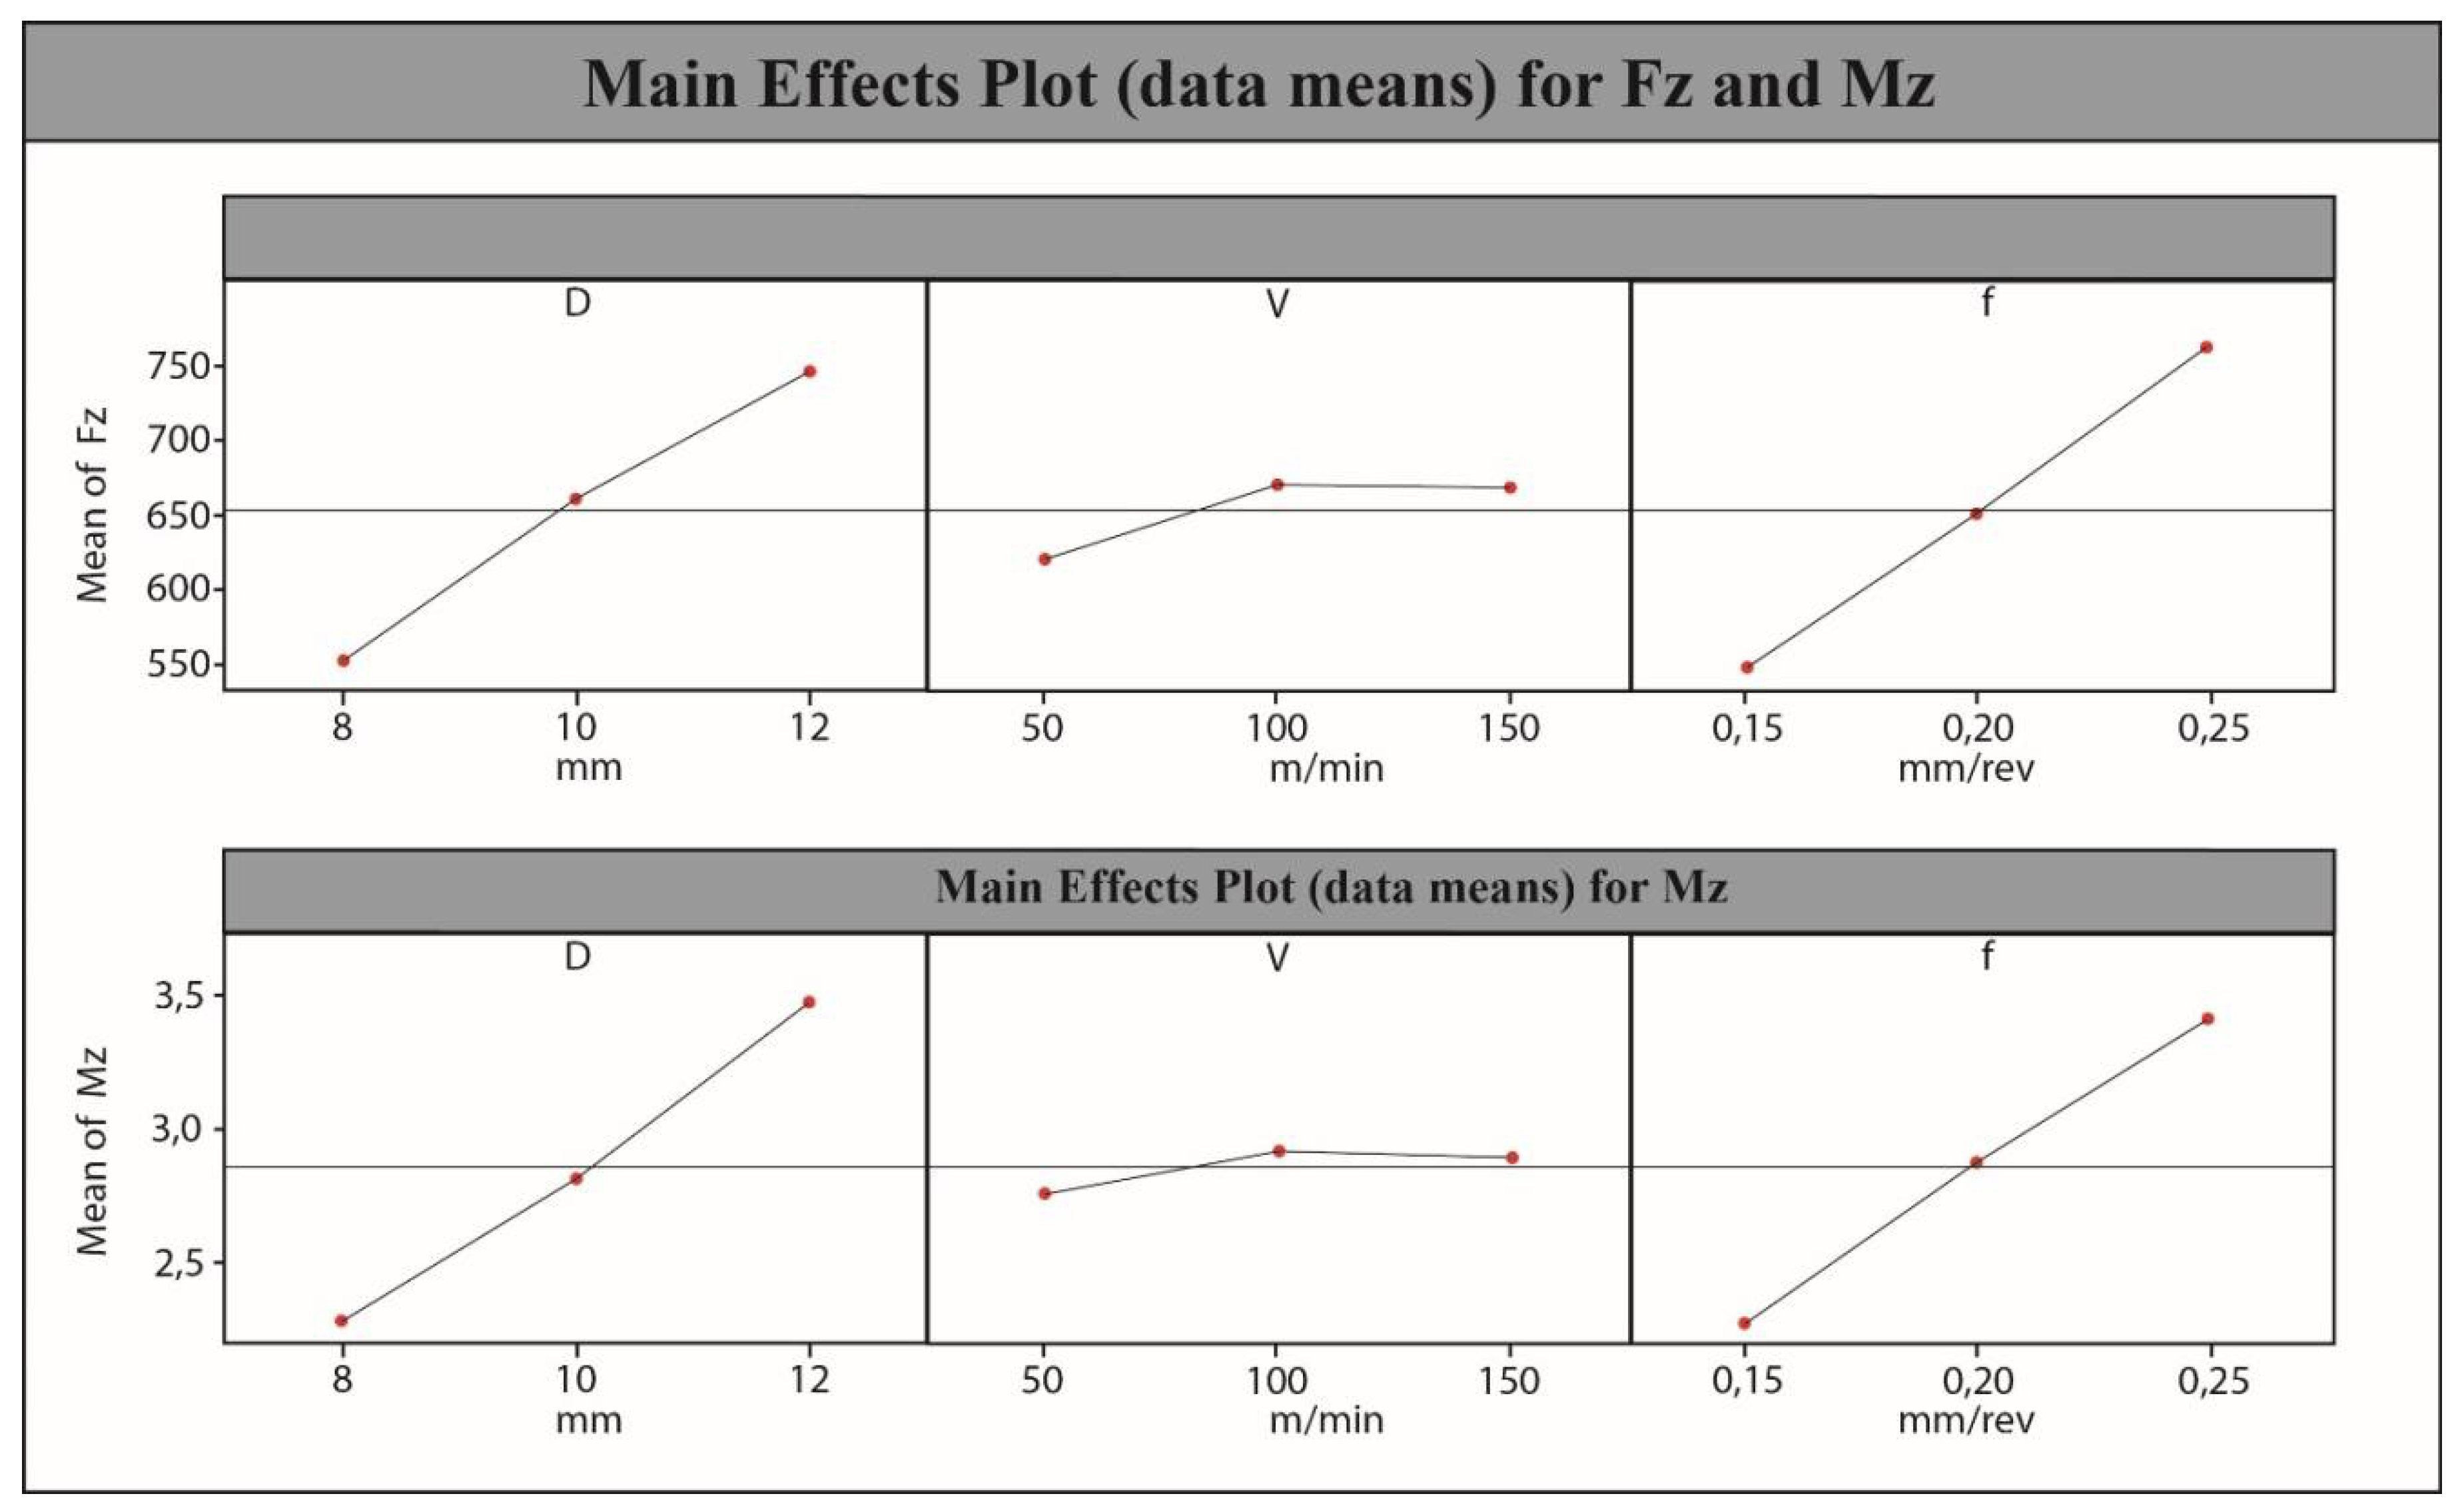
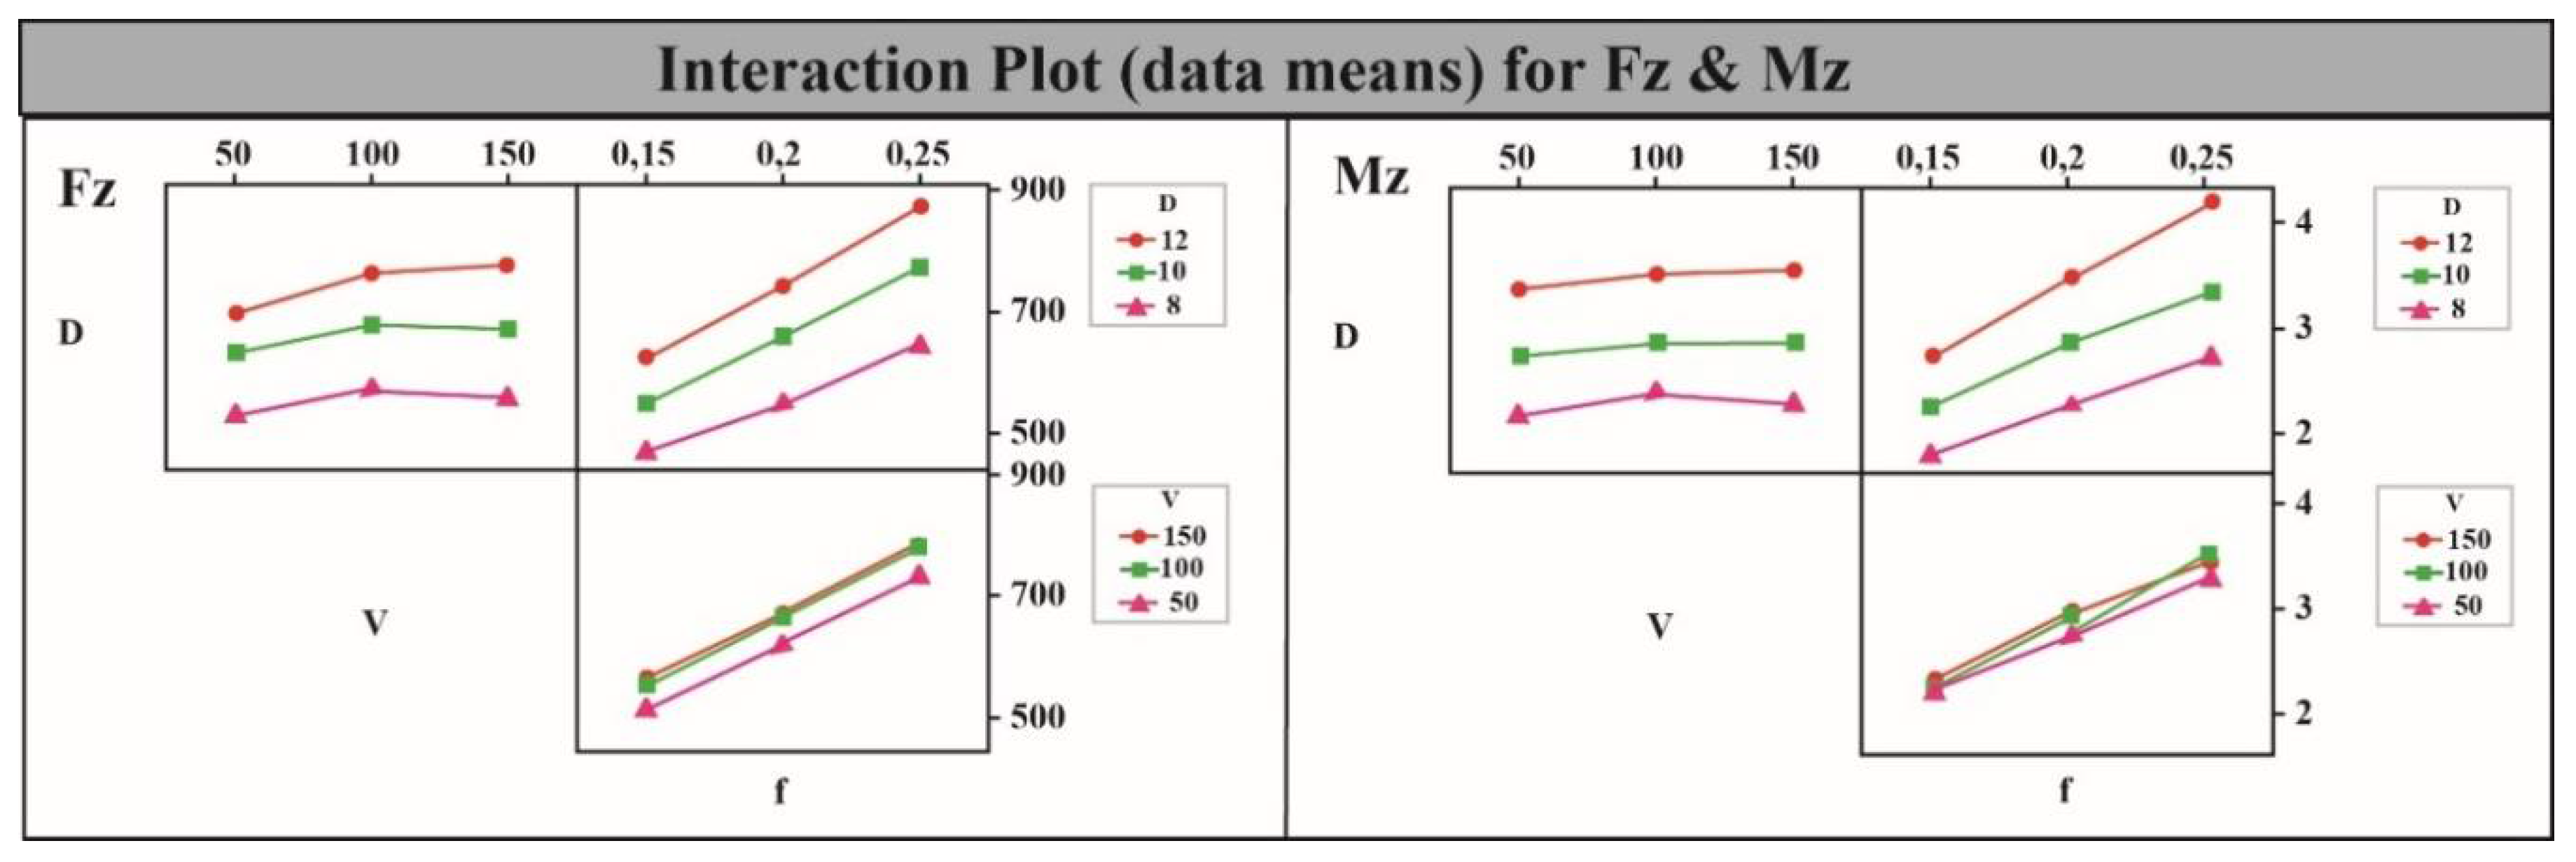
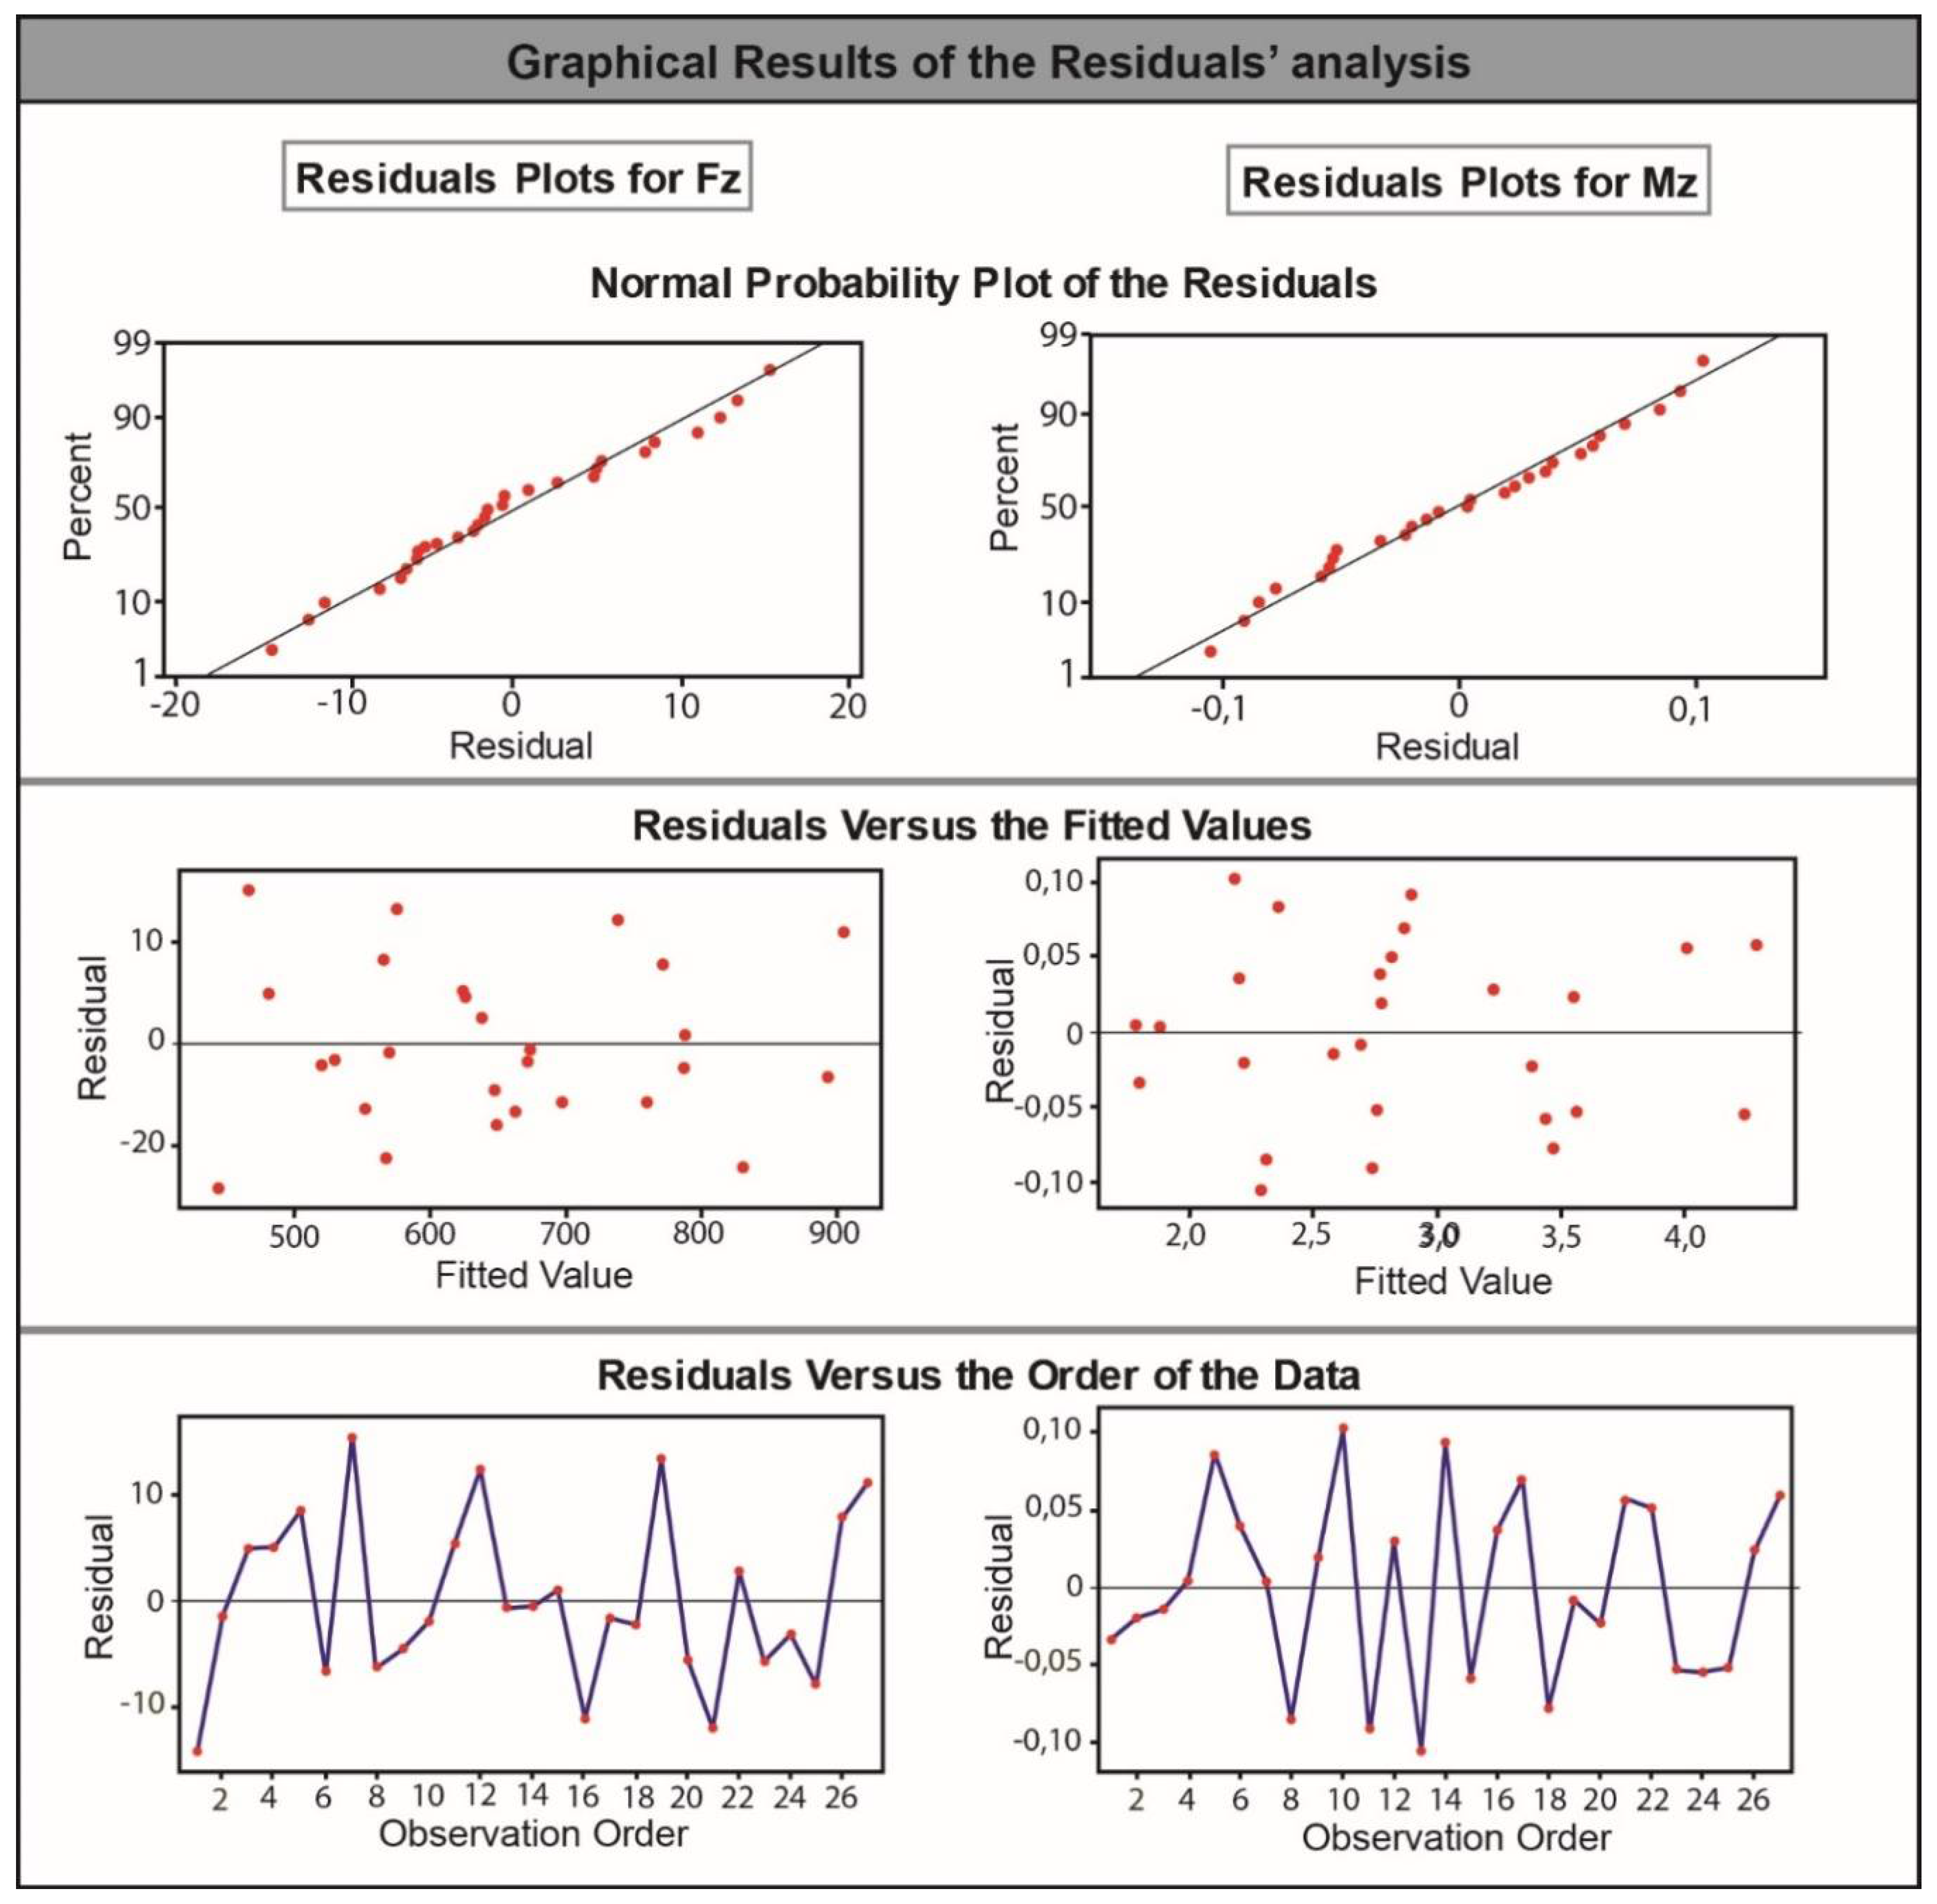
RSM-Based Predictive Models

The RSM is a precise tool used in order to examine the influence of a series of input variables on the response, when studying a complex phenomenon. The analysis of variance (ANOVA) was performed to check the adequacy and accuracy of the fitted models. MINITAB was used for the statistical analysis. The models produced used least square fitting and provided reliable mathematical modeling. The 2nd order nonlinear model with linear, quadratic, and interactive terms is indicated by the following equation:
Y = b 0 + b 1 X 1 + b 2 X 2 + b 3 X 3 + b 4 X 1 2 + b 5 X 2 2 + b 6 X 3 2 + b 7 X 1 X 2 + b 8 X 1 X 3   + b 9 X 2 X 3
where:
  • Y is the response,
  • Xi stands for the coded values, and
  • bi stands for the model regression coefficients.
According to the experimental values derived from Kistler 9123 (Figure 2) and the aforementioned mathematical model, the following equations were derived for the thrust force (in N) and the cutting torque (in Nm) respectively:
F z = 79 + 51.4 D + 1.22 V 504 f 2.65 D 2 0.0102 V 2 + 2038 f 2 + 0.128 D V + 187 D f + 0.07 V f ( N )
and
M z = 1.51 0.309 D + 0.00236 V + 1.06 f + 0.016 D 2 0.000037 V 2 12.5 f 2 + 0.000208 D V + 1.33 D f + 0.0213 V f ( Nm )
where:
  • D is the diameter of the tool in mm,
  • f is the feed rate in mm/rev, and
  • V is the cutting speed in m/min.
The adequacy of the models is secured at a 0.05 level of significance. The validity of the developed models is proved by the use of ANOVA. The R-sq(adj) is very high in both cases (99.4% for the Fz and 98.9% for the Mz). In addition, when a 0.05 level of significance is used, the main contributors of the models are those with a p-value less than 0.05. In the case of the Fz, these contributors are: D (p = 0.026), V (p = 0.022), D2 (p = 0.017), V2 (p = 0.000), DxV (p = 0.000) and Dxf (p = 0.000), while in the case of the Mz the main contributors are: D2 (p = 0.048), V2 (p = 0.007), Dxf (p = 0.000), Vxf (p = 0.023).
The validity of the models is also proved from the values of F and p. They indicate the significance of the mathematical model. The quality of the entire mathematical model can be proved by the F value which considers all the manufacturing parameters at a time. The p value depicts the probability of the manufacturing parameters having insignificant effect on the response. A large F value signifies better fit of the mathematical model with the acquired data from the experiments. The derived values of F-ratio for the models of Fz and Mz (Table 3 and Table 4) are calculated equal to 467.15 and 261.36, respectively. They are both higher than the standard tabulated values. A mathematical model is considered reliable when the F value is high and the p-value is low (below 0.05 at a 0.05 level of significance).
Figure 5 and Figure 6 both depict the main effect and interaction plots for the Fz and Mz. In the interaction plot the interaction between diameter of the tool versus the cutting speed, and diameter of the tool versus the feed rate in all cases has been highlighted. As can be seen in Table 3, V2 (p = 0.000), which implies that the square of the cutting speed affects the value of Fz and Mz. This is more obvious when observing the main effect plots for Fz and Mz where the three means of the V depict a second order shape, compared to the rest of the mean effects plots that form almost straight lines. The same happens in the case of the cutting torque.
Residual analysis was performed in order to test the models’ accuracy in both cases. The result was that the residuals appear to be normally distributed. They follow the indicated straight lines (almost linear pattern) while at the same time they are distributed almost symmetrically around the zero residual value proving that the errors are normally distributed. For both cases, there is not considerable variation of the observed values around the fitted line. The discrepancy of a particular value from its predicted value is called the residual value. When the residuals around the regression line are small, it means that the mathematical model is of high accuracy. All the scatter diagrams of the Fz and Mz residual values versus the fitted values provide enough evidence that the residual values are randomly distributed on both sides of the provided graph. The same is true for the residual values versus the order that the experiments were conducted (Figure 7). There is no evidence of any particular pattern in the residual values and, thus, the models proved their efficiency.
That is the characteristic of well suited mathematical modeling and reliable data derived from the equations provided. The derived mathematical models can be considered as very accurate and can be used directly for predicting both the Fz and the Mz within the limits of the manufacturing parameters used (diameter of tool, feed rate, cutting speed). The accuracy achieved is very high when comparing the measured values and those calculated from the mathematical models (3.4% and 4.7%, respectively).
A set of experiments was conducted with a view to validate the given mathematical models for the prediction of the Fz and Mz. Values of feed rate and cutting speed, within the range of experiments, were randomly selected (V: 70 m/min, f: 0.2 mm/rev) and tested with the three different cutting tools (D: 8-10-12 mm). The produced results can be considered satisfactory with less than 5.4% variation (Table 5). Especially, for the thrust force derived with the values (D: 10 mm, V: 70 m/min, f: 0.2 mm/rev), the variation was 0%.

4. Conclusions

The aim of this study was the generation of mathematical models for the prediction of the thrust force (Fz) and cutting torque (Mz) related to the diameter of the drilling tool and other crucial manufacturing parameters (feed rate, cutting speed) during the drilling process. Research shows clearly that the prediction models sufficiently explain the relationship between the thrust force and cutting torque with the independent variables. A full factorial experimental process was executed under different conditions of the aforementioned parameters using an Al7075 workpiece and a full set of solid carbide tools. Response surface methodology was used as the base for the prediction of both the Fz and the Mz in a series of drilling operations with Al7075 as the material under investigation. The developed models were considered as very accurate for the prediction of the Fz and Mz within the range of the manufacturing parameters used. The outcomes proved that when using these models, the accuracy achieved was 3.4% and 4.7%, respectively. People working with CNC machines very often are faced with dilemmas about which cutting parameters are the most appropriate for the available cutting tools in order to treat materials, such as aluminum alloy 7075, which is suitable for a variety of specific applications in aerospace and chemical industries. Prediction of the thrust force and the cutting torque can lead to higher productivity when selecting manufacturing parameters due to the reduced wear effect on the drilling tool and the related energy consumption.

Author Contributions

Data curation, A.P.M.; formal analysis, N.E. and V.M.; investigation, P.K. and K.K.; methodology, P.K., A.P.M. and K.K.; validation, N.E. and V.M.

Conflicts of Interest

The authors declare no conflicts of interests

References

  1. Kumar, V.; Singh, H. Machining optimization in rotary ultrasonic drilling of BK-7 through response surface methodology using desirability approach. J. Braz. Soc. Mech. Sci. Eng. 2018, 40, 83. [Google Scholar] [CrossRef]
  2. Balaji, M.; Venkata, K.; Mohan Rao, N.; Murthyd, B.S.N. Optimization of drilling parameters for drilling of TI-6Al-4V based on surface roughness, flank wear and drill vibration. Measurement 2018, 114, 332–339. [Google Scholar] [CrossRef]
  3. Balaji, M.; Murthy, B.S.N.; Rao, N.M. Multi response optimization of cutting parameters in drilling of AISI 304 stainless steels using response surface methodology. Proc. Inst. Mech. Eng. Part B J Eng. Manuf. 2018, 232, 151–161. [Google Scholar] [CrossRef]
  4. Nanda, B.K.; Mishra, A.; Dhupal, D.; Swain, S. Experimentation and optimization of process parameters of abrasive jet drilling by surface response method with desirability based PSO. Mater. Today Proc. 2017, 4, 7426–7437. [Google Scholar] [CrossRef]
  5. Boyacı, A.I.; Hatipoglu, T.; Balci, E. Drilling process optimization by using fuzzy-based multi-response surface methodology. Adv. Ind. Eng. Manag. 2017, 12, 163–172. [Google Scholar] [CrossRef] [Green Version]
  6. Ramesh, M.; Gopinath, A. Measurement and analysis of thrust force in drilling sisal-glass fiber reinforced polymer composites. In IOP Conference Series: Materials Science and Engineering; IOP Publishing: Bristol, UK, 2017; Volume 197. [Google Scholar]
  7. Jenarthanan, M.P.; Karthikeyan, M.; Naresh, N. Mathematical modeling of delamination factor on drilling of ARALL composites through RSM. Multidscip. Model. Mater. Struct. 2017, 13, 578–589. [Google Scholar] [CrossRef]
  8. Rajamurugan, T.V.; Shanmugam, K.; Palanikumar, K. Mathematical Model for Predicting Thrust Force in Drilling of GFRP Composites by Multifaceted Drill. Indian J. Sci. Technol. 2013, 6, 5316–5324. [Google Scholar] [CrossRef]
  9. Rajkumar, D.; Ranjithkumar, P.; Jenarthanan, M.P.; Sathiya Narayanan, C. Experimental investigation and analysis of factors influencing delamination and thrust force during drilling of carbon-fibre reinforced polymer composites. Pigment Resin Technol. 2017, 46, 507–524. [Google Scholar] [CrossRef]
  10. Ankalagi, S.; Gaitonde, V.N.; Petkar, P. Experimental Studies on Hole Quality in Drilling of SA182 Steel. Mater. Today Proc. 2017, 4, 11201–11209. [Google Scholar] [CrossRef]
  11. Natarajan, U.; Suganthi, X.H.; Periyanan, P.R. Modeling and Multiresponse Optimization of Quality Characteristics for the Micro-EDM Drilling Process. Trans. Indian Inst. Met. 2016, 69, 1675. [Google Scholar] [CrossRef]
  12. Kyratsis, P.; Garcia-Hernandez, C.; Vakondios, D.; Antoniadis, A. Thrust force and torque mathematical models in drilling of Al7075 using the responce surface methodology. In Book Design of Experiments in Production Engineering; Davim, J.P., Ed.; Springer International Publishing: Berlin, Germany, 2016; pp. 151–164. ISBN 978-3-319-23837-1. [Google Scholar]
  13. Pereira, R.B.D.; Leite, R.R.; Alvim, A.C.; Alvim, A.C.; Paiva, A.P.; Balestrassi, P.P.; Ferreira, J.R.; Davim, J.P. Multivariate robust modeling and optimization of cutting forces of the helical milling process of the aluminum alloy Al 7075. Int. J. Adv. Manuf. Technol. 2018, 95, 2691. [Google Scholar] [CrossRef]
  14. Zou, X.L.; Yan, H.; Chen, X.H. Evolution of second phases and mechanical properties of 7075 Al alloy processed by solution heat treatment. Trans. Nonferrous Met. Soc. Chin. 2017, 27, 2146–2155. [Google Scholar] [CrossRef]
  15. John, P.; Davis, R. Performance Study of Electrical Discharge Machining Process in Burn Removal of Drilled Holes in Al 7075. Cogent Eng. 2016, 3, 1–7. [Google Scholar] [CrossRef]
Figure 1. The workflow used for the research.
Machines 06 00024 g001
Figure 2. Cutting tool geometry details.
Machines 06 00024 g002
Figure 3. Experimental value (mean value) of thrust force and torque for a step drill with tool diameter of 8 mm, cutting speed of 50 m/min, and feed rate of 0.15 mm/rev.
Machines 06 00024 g003
Figure 4. Experimental values derived from Kistler 9123.
Machines 06 00024 g004
Figure 5. Main effects plot for Fz and Mz.
Machines 06 00024 g005
Figure 6. Interaction plot for Fz and Mz.
Machines 06 00024 g006
Figure 7. Residuals analyses for the Fz and Mz.
Machines 06 00024 g007
Table 1. Mechanical properties and chemical composition of Al7075.
Mechanical Properties
Young’s ModulusDensityHardness, HVYield StrengthTensile StrengthThermal Conductivity
72 GPa2800 kg/m3173503 MPa572 MPa130 W/m-K
Chemical Composition
ElementsZnMgCuCrFeSiMnTiAl
Percentage6320.30.60.50.40.3Balance
Table 2. Machining factors and their levels.
FactorsNotationLevels
IIIIII
Cutting speed (m/min)V50100150
Feed rate (mm/rev)f0.150.20.25
Tool diameters (mm)D81012
Table 3. ANOVA table for Fz (thrust force).
SourceDegree of FreedomSum of SquaresMean Squaref-Valuep-Value
Regression9405,57445,064467.150.000
Residual Error17164096
Total26407,214
R-Sq(adj) = 99.4%
PredictorParameter Estimate CoefficientStandard Error Coefficientt-Valuep-Value
Constant−78.9135.10.580.567
D51.3621.062.440.026
V1.22240.48672.510.022
f−503.7712.0−0.710.489
D*D−2.6511.002−2.640.017
V*V−0.0102020.−6.360.000
f*f203816041.270.221
D*V0.128500.028354.530.000
D*f186.6728.356.580.000
V*f0.0671.1340.060.954
Table 4. ANOVA table for Mz (torque).
SourceDegree of FreedomSum of SquaresMean Squaref-Valuep-Value
Regression912.78701.4208261.360.000
Residual Error170.09240.0054
Total2612.8794
R-Sq(adj) = 98.9%
PredictorParameter Estimate CoefficientStandard Error Coefficientt-Valuep-Value
Constant1.5051.0141.480.156
D−0.30860.1581−1.950.068
V0.0023570.0036540.650.527
f1.0575.3450.200.846
D*D0.0160140.0075252.130.048
V*V−0.000036910.000012043.070.007
f*f−12.5112.04−1.040.313
D*V0.00020750.00021280.970.343
D*f1.33170.21286.260.000
V*f0.0213000.0085142.500.023
Table 5. Experimental confirmation.
Factors Fz (N)Mz (Nm)
D: 8 mm, V: 70 m/min
f: 0.2 mm/rev
Predicted7071.899
Exp. Result6921.855
Variation % 2.1%2.4%
D: 10 mm, V: 70 m/min
f: 0.2 mm/rev
Predicted8752795
Exp. Result8752955
Variation % 0%−5.4%
D: 12 mm, V: 70 m/min
f: 0.2 mm/rev
Predicted10604.129
Exp. Result10574.041
Variation % 0.3%2.2%

