1. Introduction
In materials science, fatigue is defined as “a localized damage process of a component produced by cyclic loading” [
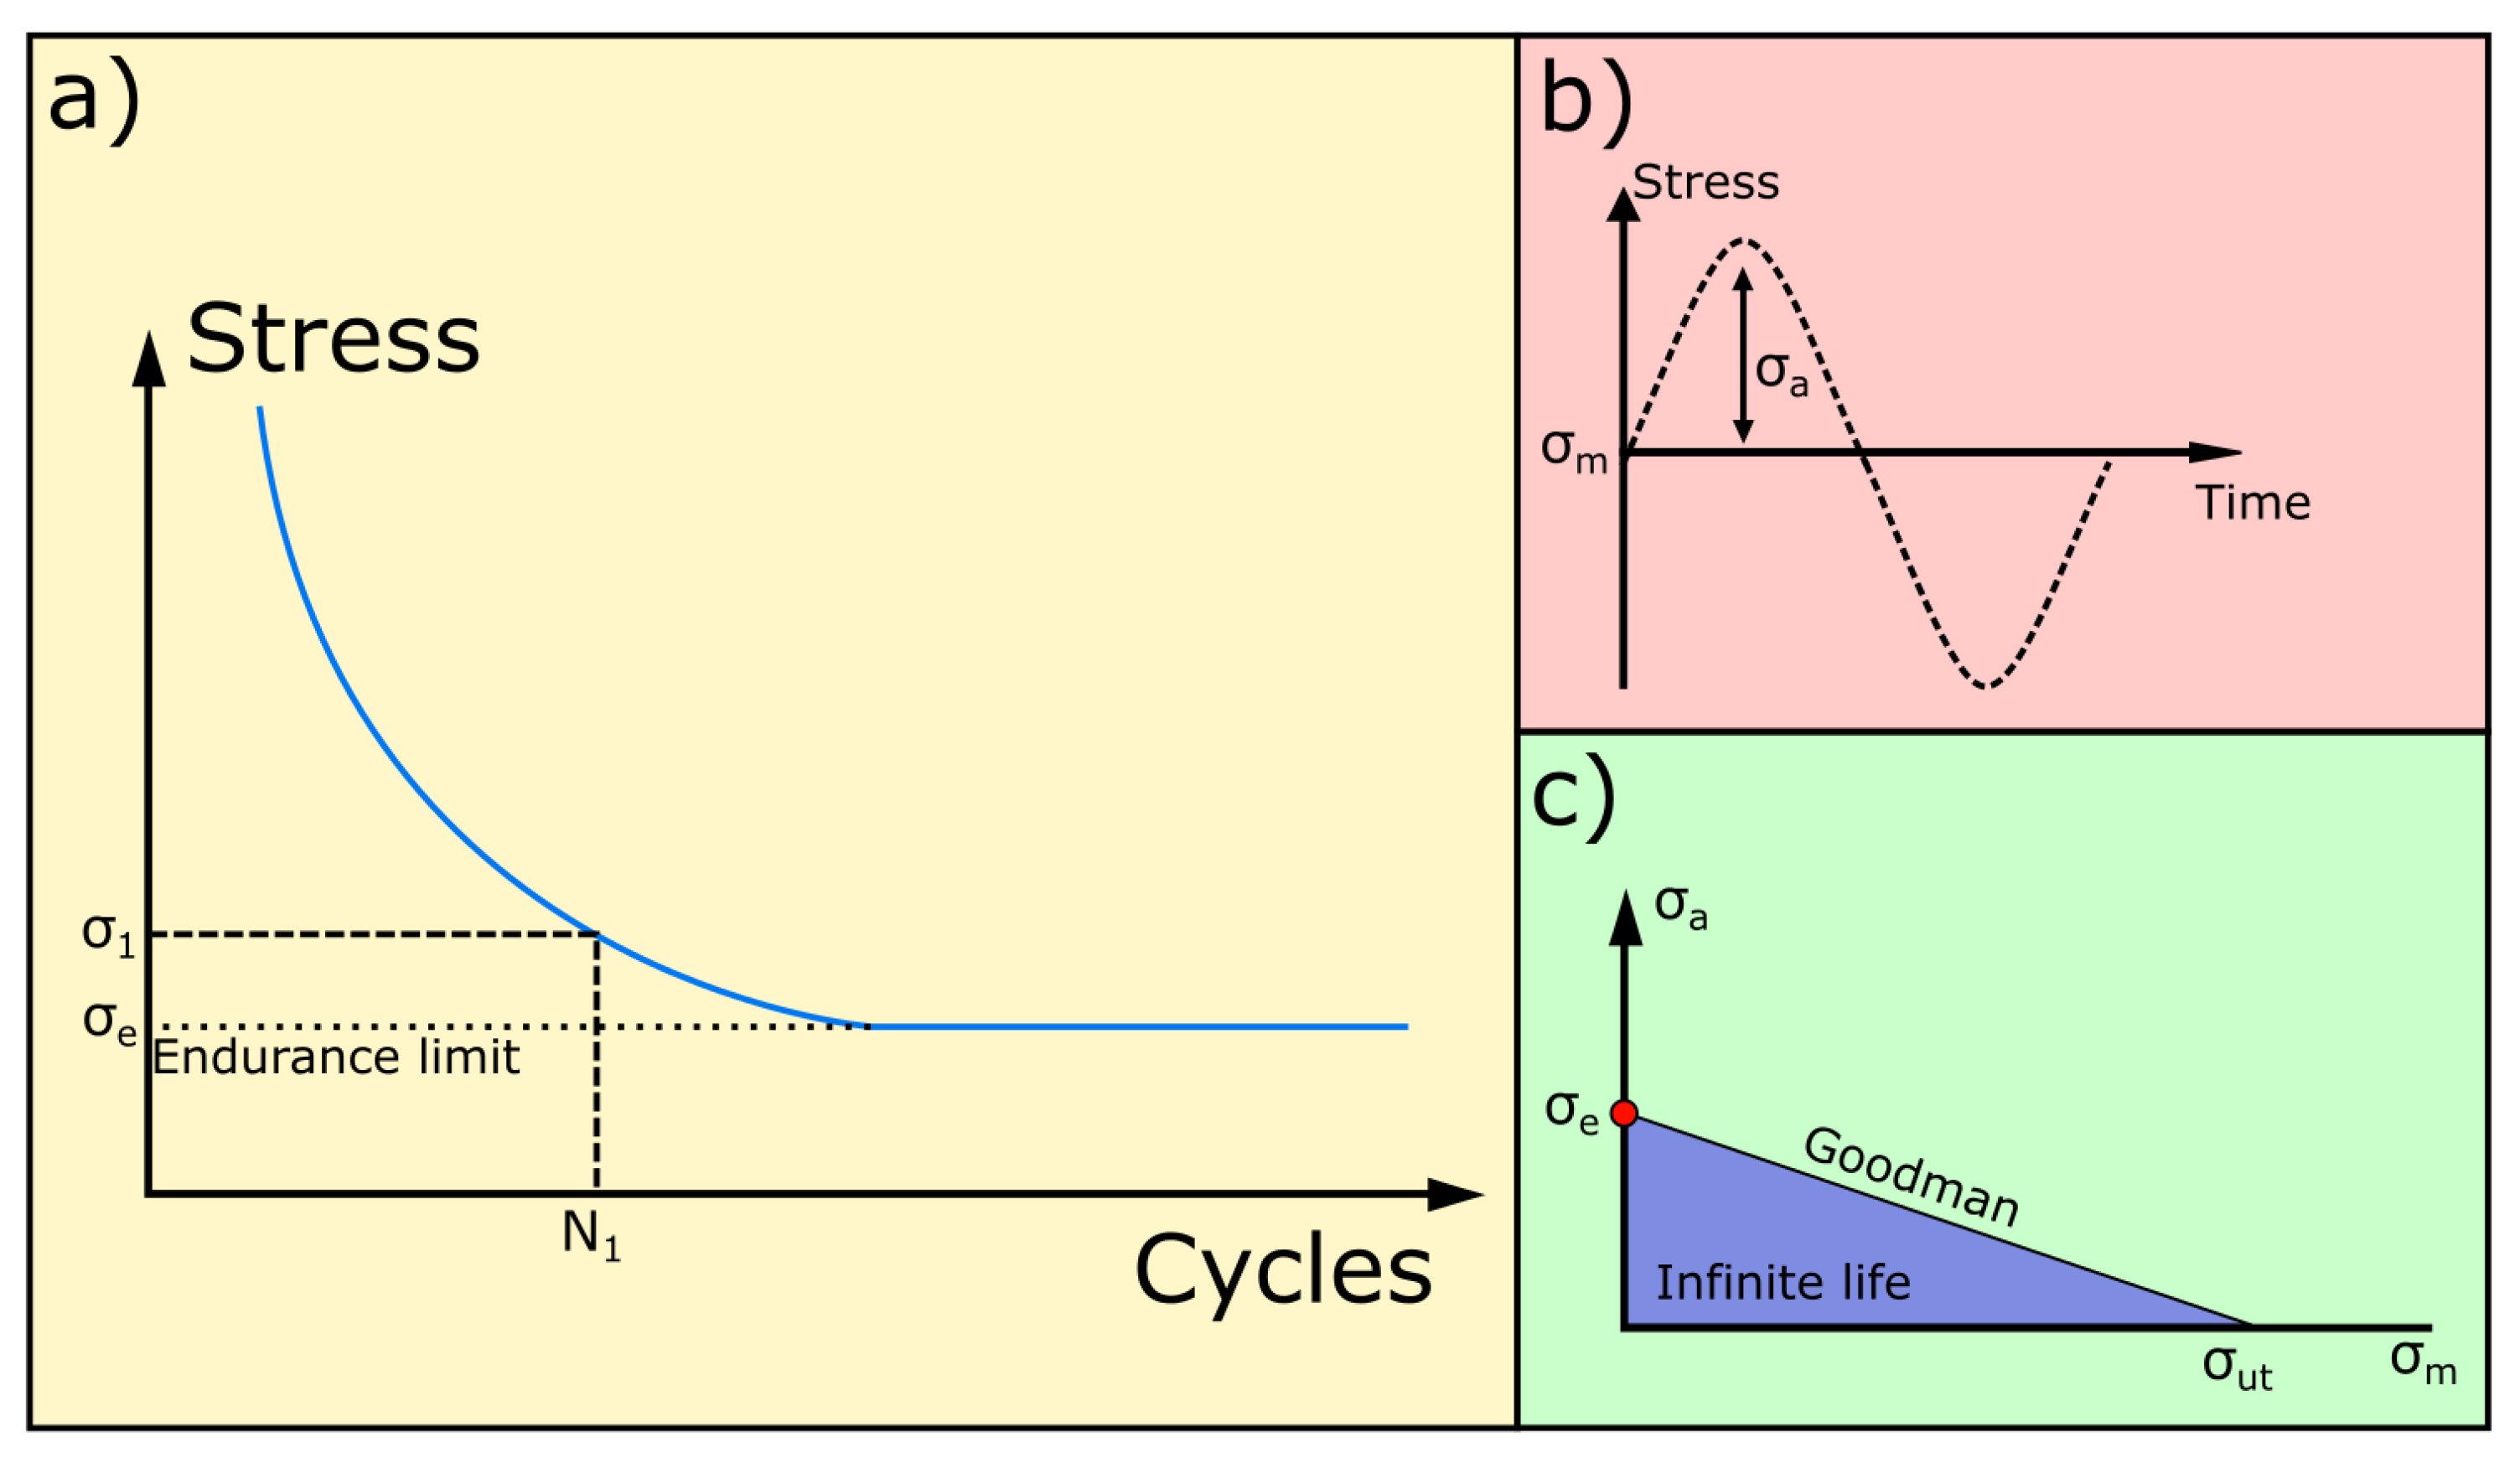
1]. It can be represented as a relationship between certain stress levels repeated for a certain number cycles, with additional factors also contributing to a varying fatigue limit. These include mainly the type of material, dimensions, manufacturing defects and environmental factors. Commonly, fatigue of a component is represented by an S-N curve, an example of which is shown in
Figure 1a. Particular stress values cause fatigue failure at a related number of cycles according to the curve. A typical fatigue test is run by repeatedly applying a sinusoidal stress, illustrated in
Figure 1b. According to the Goodman relation, a specimen will achieve infinite life if the stress amplitude
remains below the endurance limit
for a mean stress
= 0 (
Figure 1c).
Fatigue testing of materials, sensors, and structures is a key element in the design and verification process in engineering [
2,
3,
4,
5]. With fatigue tests aiming for
–
cycles and beyond, the testing processes are time consuming. This is of course dependent on the chosen cycling frequency, which will vary depending on experimental parameters. For example, in concrete structures: “cyclic frequencies are limited by the high ranges of deflection and the necessity to avoid local heating due to friction at cracks in the concrete” [
6]. Therefore, in concrete testing, a lower testing frequency is necessary, which, in turn, is more time consuming.
Access to third party fatigue testing machines is limited and can be costly. Purchasing a commercially available machine comes with initial great expense that may not amortize for a short to medium-term project, but may decrease long-term costs overall. Many commercial machines are available on the market, with varying prices that are influenced mainly by the maximum force, speed and accuracy requirements; large force, fast speeds and high accuracy that characterize the machine are accompanied by a large cost. A third option is to design and build a machine from individual components capable of producing required load cycles. Not only will this allow full control over the capabilities of the machine, but it may decrease the total project cost significantly.
In this manuscript, the design process of a low-cost, small-scale fatigue testing machine design for multi-purpose testing of materials, sensors, and structures is exemplified. Research institutions with similar project requirements may use this type of design to reduce the overall costs of long-term fatigue cycling. The paper is structured as follows:
Section 2 describes the requirements of the machine in this work,
Section 3 presents a review of reported machine designs for fatigue testing purposes, whilst
Section 4 describes the methodology for approaching the task.
Section 5 presents comparison of potential actuators followed by
Section 6 which outlines the initial computer-aided design (CAD) and finite element method (FEM) model of the support frame.
Section 7 discusses the installation and commissioning procedure before the previous FEM models are compared to experimental tests in
Section 8.
Section 9 provides information on the commercial benefit of custom machine building to outsourcing, and the paper is concluded in
Section 10.
2. Design Requirements
2.1. Intended Experiments and Required Force
The design of a fatigue testing machine is highly dependent on the intended testing specimen. This includes geometry, material properties and experimental procedure, which will also define the necessary force. In this work, the machine will primarily be used to test concrete beams with the following maximum geometry: 1 × 0.1 × 0.1 m (length × width × height). Values are chosen to provide adequate areas for multiple sensors to be applied to beam faces. In addition, the focus of the research for this machine is to test sensors applied to pre-cracked concrete specimens; therefore, a key requirement is the ability to both open and close these cracks. To do this, the actuator must be capable of bi-directional force application to the specimen. The stress ratio,
R, defines the type of loading:
where tension–tension,
, compression–compression
, and bi-directional,
. For equal magnitude, bi-directional force,
. A machine capable of all ratios will allow a more thorough fatigue testing capability and a more flexible machine overall.
The standard practice for fatigue testing is the application of a sinusoidal waveform; however, loading during real-world applications is rarely absolute [
7]. The British standards [
8] suggest “When assessing fatigue performance, a realistic estimate of the fatigue loading is crucial to the calculation of life, and all types of cyclic loading should be taken into account”. Therefore, a customizable force application to produce either sinusoidal or other shaped waveform with variable amplitude and frequency is required.
Machine geometry requires adjustment depending on the yield point of the material in order to reach the necessary strains and stresses in the sample. The initial objective was to produce an adequate strain level for testing sensors on a concrete beam face. We can calculate the maximum strain level
on the concrete beam face due to maximum force
as:
where maximum moment
is given by:
for
kN,
Nm, where
m is the height and width of the beam and
m is the beam length. Substituting Young’s modulus of concrete
GPa and area moment of inertia for the 0.1 m square cross section
m
provides strain
m
. This strain should suffice for the intended sensor testing; therefore, aimed force is
kN.
2.2. Actuator
From
Section 2.1, the required force is known to be ±25 kN, which concentrates possible actuator choices. The following itemized list presents the optimization factors for the actuator:
High accuracy,
Low noise,
High reliability,
Long lifetime,
Low maintenance requirements,
Considerable customization (capable of sinusoidal load cycle),
User friendly interface.
In addition, the variability of the stress ratio requires an adjustable control that ideally is user-friendly and software based, without any requirement to mechanically adjust the system components.
For the support frame, a few factors require consideration during design:
The frame must be capable of housing the actuator and beam in order to produce accurate fatigue forces (sinusoidal). However, the frame itself must be adequately designed to survive the maximum stress levels over a long period. In other words, the endurance limit, , of the frame must be greater than the expected maximum stresses during fatigue operation.
3. Review of Literature
A low-cost fatigue testing machine capable of
kN bi-directional force on a beam with dimensions: 1 × 0.1 × 0.1 m (length × width × height) is desired as discussed previously. Reported machine designs in literature may aid in design of a custom machine and provide insight into the novelty of the work. Lee et al. [
9] demonstrated the design of a structural fatigue testing machine capable of both bending and torsional loading. A hydraulic system was incorporated to both apply loading and fix the test specimen. Stress analysis of the frame is provided, with particular attention on the interface between actuator and specimen. The specified loading capability for bending is
kN and the maximum specimen size is 7500 × 1500 × 950 mm. Such a machine is designed for large-scale testing, made evident by the large force. The bi-directional capability is not demonstrated during test results, so it is unclear whether this is possible. No commercial evaluation is performed and so relative cost is unknown. It is likely to be extremely costly and benefit a long-term test period. A high initial cost may not be suitable for short-medium term testing periods. Machines are regularly designed for extremely small scale fatigue testing. For example, Vincent et al. [
10] and Bhatkar et al. [
11] presented machines producing maximum loading in the range of 88–300 N on small specimens of length <150 mm. The main reason for custom designs is to reduce initial costs, which is less complicated for small-scale machines. Pach et al. [
12] presented a unique method for applying axial loads to specimens by using a “seesaw” motion. Although they declare a design requirement of
(tension-compression), this was not demonstrated due to lack of correct grip attachment. Forces were also limited to 10 kN. Costs are declared to be around
in comparison to a servohydraulic machine of
. A detailed breakdown of each section is not provided.
In terms of commercially available machines, a device capable of bi-directional loading is rare for 4-point bending applications. Cooper Technology (Ripley, UK) provides a servo-hydraulic actuator capable of bi-directional loading, but only maximum loads of
kN [
13]. Instron (High Wycombe, UK) provide a few available bi-directional fatigue testing machines [
14]. The electrical devices are lacking the required force; however, the hydraulic systems are more suitable, such as the 8872 servohydraulic fatigue testing system. The main issue is that the machines are not suited to beam bending and a custom frame would still be required to both load and support the beam. In some cases, the location of sourcing appropriate machines is an issue and can cause large shipping costs. Communication is also key to determining the customization possibilities of the loading cycles, which are not usually quoted.
Following the literature review, authors believe that the novelty of the work presented in this paper is as follows:
An economic evaluation of producing a custom machine in comparison to purchasing commercially or outsourcing: which provides justification for the work.
Capability of adjustable shape, frequency and amplitude loading cycles applied to beam specimens since real-world fatigue is rarely caused by pure sinusoidal loading.
FEM modeling to validate the long-term testing capability of the machine—verified by experimental testing.
4. Methodology
The process in designing and commissioning the fatigue testing machine is as follows:
Determine the required maximum force to produce sufficient stress in predetermined test specimen. This can be exaggerated to increase specifications. For the present project, this was calculated at kN.
Review and choose preferred actuator, optimizing factors outlined in
Section 2.2.
Design suitable support frame and model in CAD software.
Use FEM software to ensure that support frame meets physical requirements. Model a test experiment with beam specimen.
Manufacture and install the machine, including electrical connections.
Commission the machine by programming and performing test experiments to compare to the model, validating the support frame structure.
Following these steps, the machine will be ready for further experimentation.
5. Actuator
Based on a literature review, possible actuators include pneumatics, hydraulics, and linear and servo actuators. Linear actuators are not suitable because they do not allow a variable speed application to adjust the testing frequency. With regards to pneumatic drives, machine parts are generally cheaper, require less maintenance, and are cleaner (no oil) than hydraulics [
15]. However, system efficiencies are significantly worse (lower possible forces) and the system experiences a time delay. The overall anticipated issue with hydraulics and pneumatics are the necessary system complexity (associated with many valves and control switches for
test option), reliability and maintenance concerns as well as the emitted noise of the compressor. Ultimately, it was ascertained that a servo actuator agrees with all requirements and was thus selected as the preferred fatigue drive option.
Servo actuators are selected based on the expected total lifetime travel distance at a given applied load, thus assumptions were made with regards to the lifetime travel distance and the mean applied force. A generic example testing procedure is defined in matrix
x consisting of different test cycles (1:
n) with the amount of cycles
C at force
F, and the respective predicted distance travelled
D. The travel distance may be derived from a FEM model:
With a pre-defined testing procedure, the total lifetime travel distance can be calculated by:
and the mean applied load is calculated by the cubic mean load formula (fatigue exponent of 3 [
16]):
Depending on the cubic mean force and total travel distance assessment for the lifetime expected, the appropriate servo actuator parameters are selected. In addition, depending on the intended test cycle and force (step changes with breaks vs. continuous movements), a fan might be necessary to prevent the motor from overheating.
Due to the requirement to enable different operational modes, the servo actuator further enables user-friendly and adjustable control. The latter can be controlled by readings from a load cell that is aimed to be installed between the 4-point bending frame and the actuator and implemented through a feedback loop via the actuator controller.
6. Support Frame
Various methods can be adopted for loading a beam specimen, such as direct tension/compression, 3-point bending or cantilever. Since an objective of this work is to test sensors, it is crucial that the maximum stress position has adequate space for sensors. For this reason, 4-point bending was chosen, as the center of the beam remains clear. This means the support frame will require fixed constraints at each end of the beam, but incorporate the capability of using a linear-single point motion from the actuator to perform 4-point bending. It is also a requirement that the beam is loaded in both directions. In other words, a single face of the beam (top or bottom) undergoes tension and compression in a single cycle. This will allow more thorough analysis and testing of the specimen and any attached sensors. With these additional requirements following the actuator choice, the frame can be designed.
6.1. CAD Model
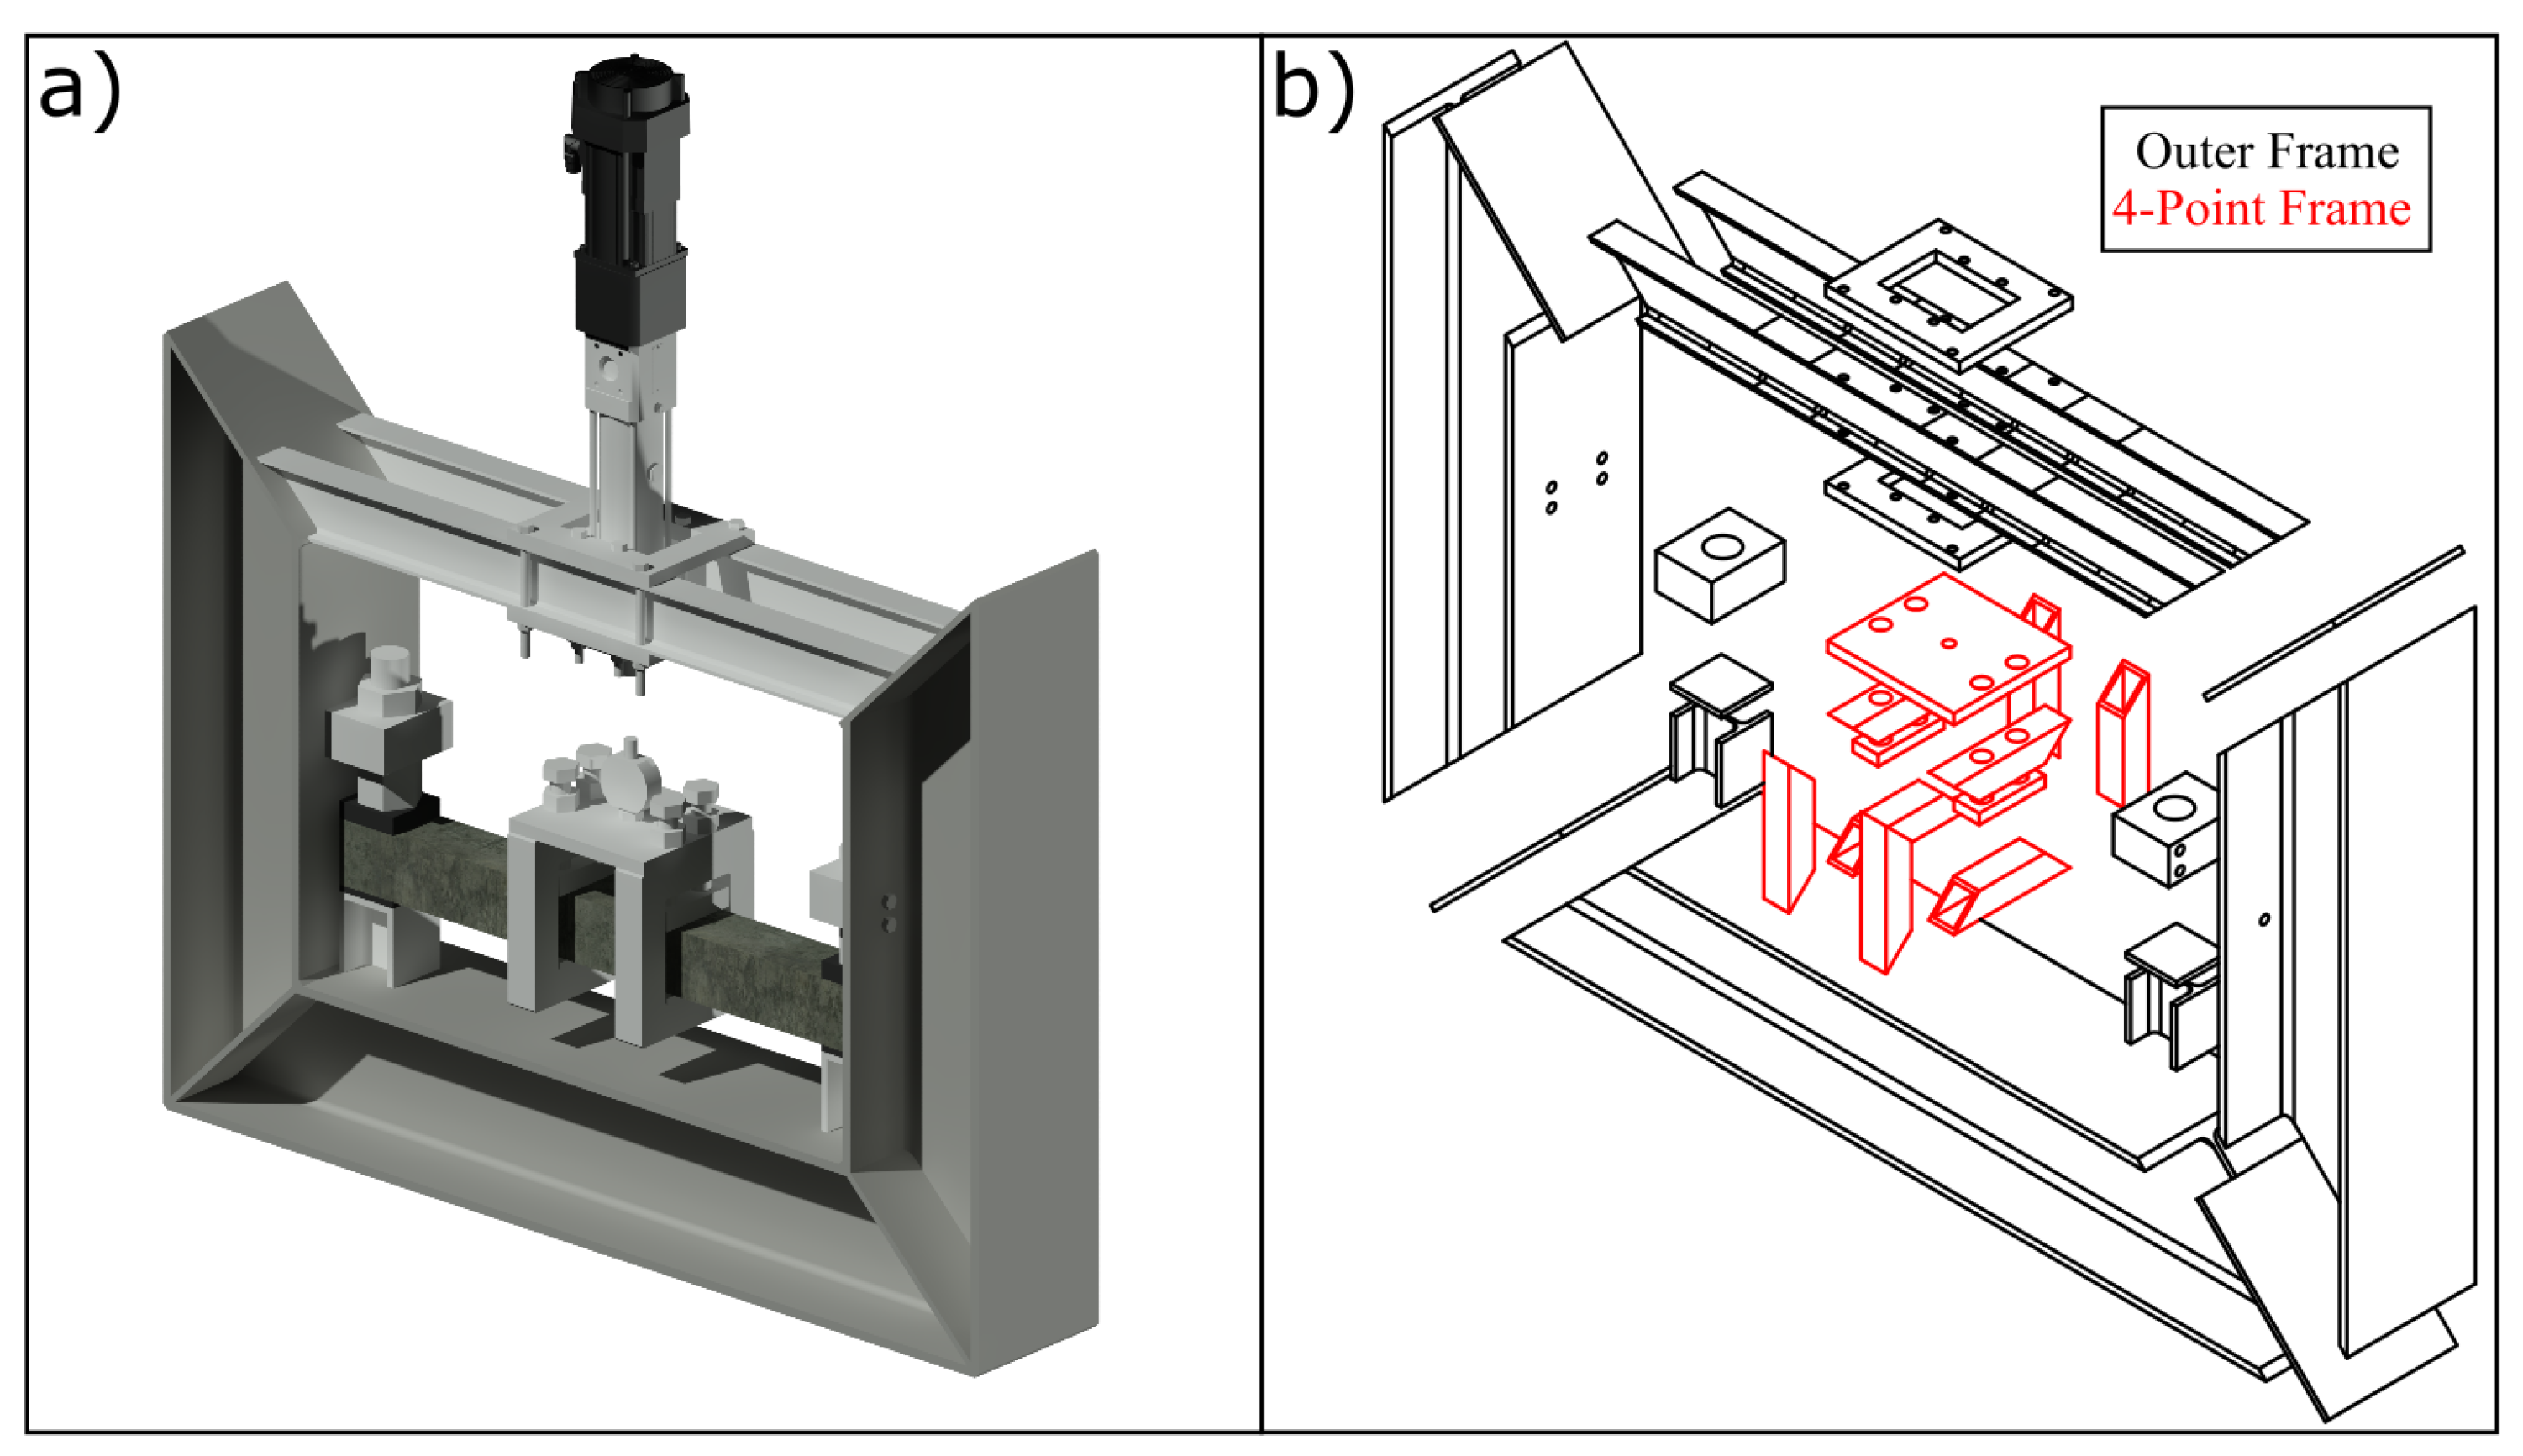
Figure 2a shows a rendered completed frame with inserted beam and actuator, whereas
Figure 2b shows an exploded isometric CAD model of the outer frame in black and the inner 4-point bending frame in red. Some key dimensions are as follows: width of frame 1.5 m, height is 1.16 m, depth is 0.254 m. The outer frame is designed to provide the necessary reactionary compression and tension forces of the linear actuator that is vertically inserted between the top two I-beams. For the outer shell, conventional sized structural steel I-beams are selected as this element enables significant tensional and compressive resistance while allowing easy sourcing without additional machining of complex parts. At each corner the I-beams are cut at an angle of 45
and in-plane full penetration butt-welded together with a steel plate in between. Welding is carried out according to British standards [
17]. The top section is manufactured out of two parallel smaller I-beams in order to fit the servo actuator, while the top and bottom plates are necessary to distribute tension and compression forces onto both I-beams.
The 4-point bending frame is designed out of hollow squares, while the top two elements are made of solid pieces with threaded holes to variably attach the testing sample to enable testing. The 4-point bending frame could potentially be exchanged with a simple foot to enable 3-point bending tests.
The frame is mounted onto the floor with two steel foot elements welded and an angle of 90. The beams intended for testing are kept in place based on two bolts on the right and left that are screwed into the middle sections. These sections are attached to the side I-beams through threaded bolt attachment. Therefore, the sample can be adjusted by tightening the main bolts. Potentially greater elements may be tested; however, this would require an adjusted 4-point bending frame.
6.2. FEM Model
Following the previously discussed requirements in
Section 2, it is essential to ensure that stress levels in the support frame do not exceed mechanical limits during maximum loading. Fatigue life of the frame will also require consideration. The frame can mechanically be separated into two parts, the outer and 4-point bending frame, as exemplified in
Figure 2. The 4-point frame can be modeled as a singularly welded component. The outer frame consists of three separate interactions: at the actuator attachment and at the bottom and top beam supports. To simplify simulations, we will assume that this structure is also singularly welded. To reduce computational requirements, all holes and bolts will be removed—meaning real-world stress levels will differ from simulations. These simulations act as an approximate guide of the expected stress levels the frame will be subjected to.
6.2.1. Outer Frame
The geometry of the outer frame is inserted into a FEM modeling software.
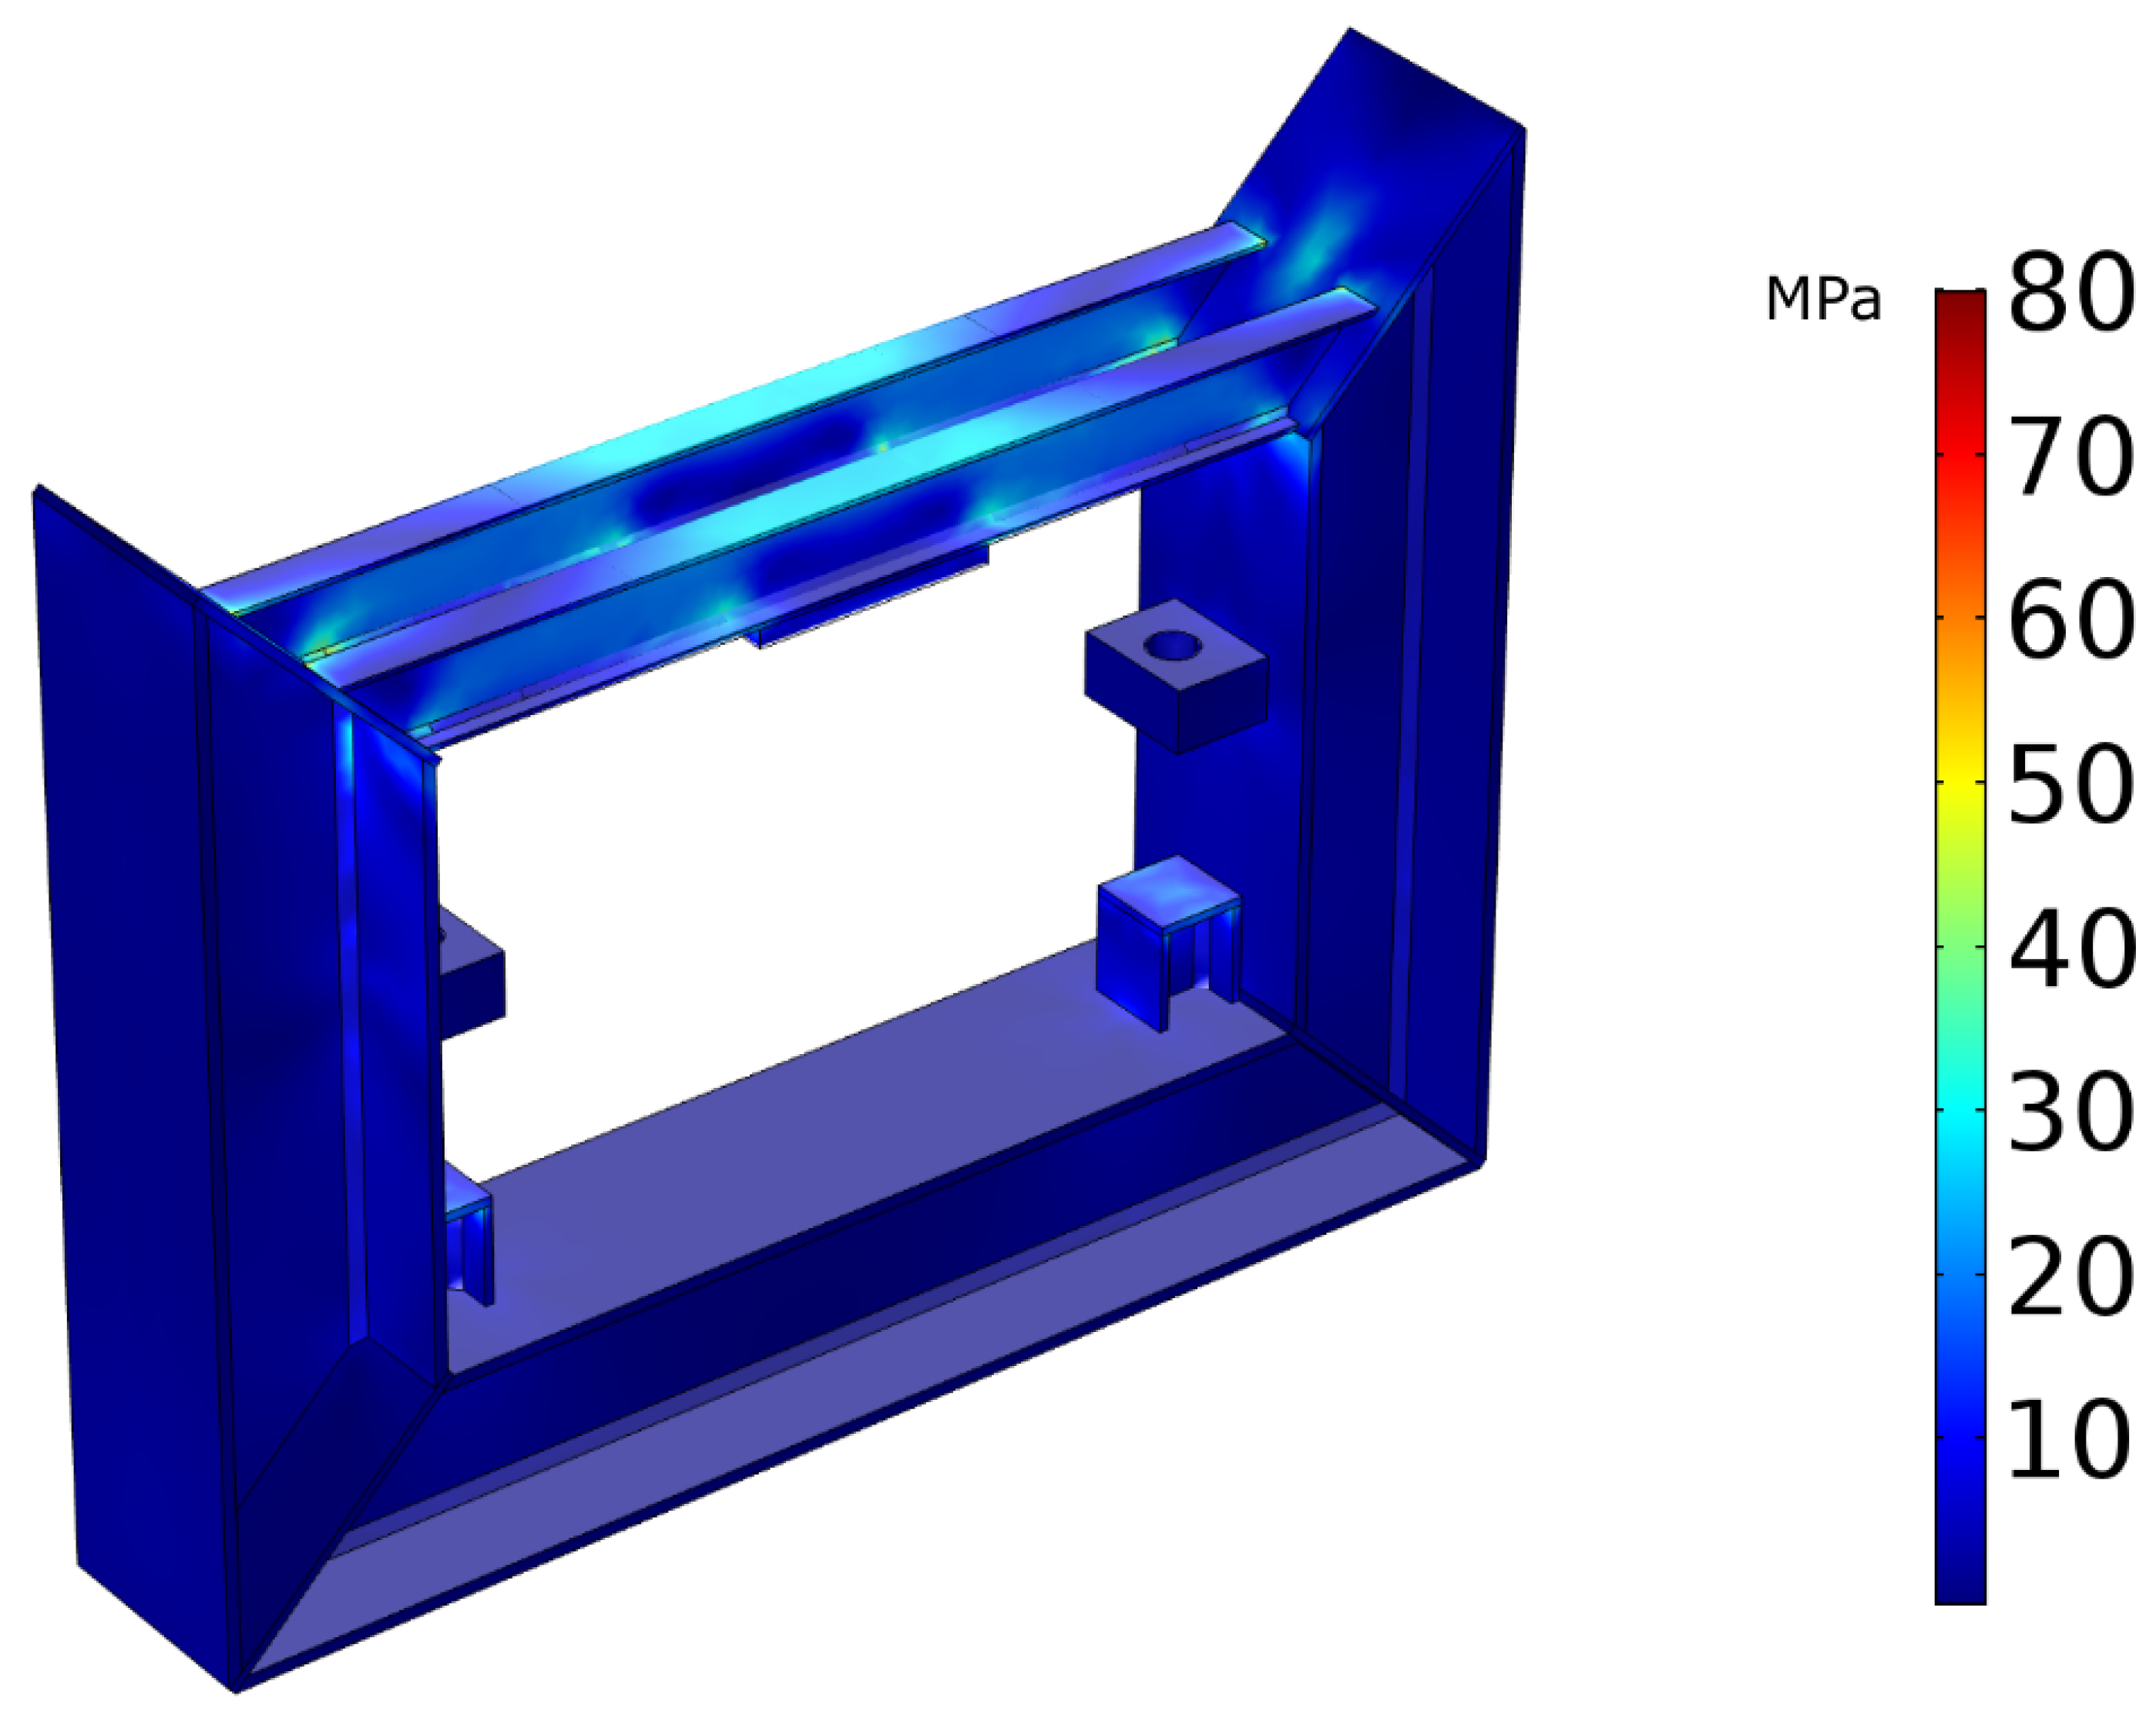
Figure 3 shows the stress distribution during a 25 kN load applied in five positions: upwards against the top I-beams and the two top supports as well as downwards against the two bottom supports. Any deformation is exaggerated for illustrative purposes.
The scale shows the maximum stress level is 80 MPa; however, it is clear that the majority of stress in the components is below 50 MPa. This is well below both the yield stress
= 250 MPa of structural steel and will also be within the endurance limit
. According to Kucharczyk et al. [
18], experiments on structural steel with yield limit of 430 MPa showed no endurance limit less than 260 MPa. A general approximation of
for
can be used as a guideline. This means a stress of less than 125 MPa is desired to ensure long operational lifetime. We can also see that most of the stress is applied to the top I-beams. It is important to also consider the welded sections, as the endurance limit will differ to that of steel. In the case of the outer frame—the stress is focused on the attachment point of the actuator, thus welds of I-beams are not a concern. This may require more in-depth study for the 4-point frame. To acquire a more accurate value for maximum stress, we can separately model the actuator attachment point with bolt interactions.
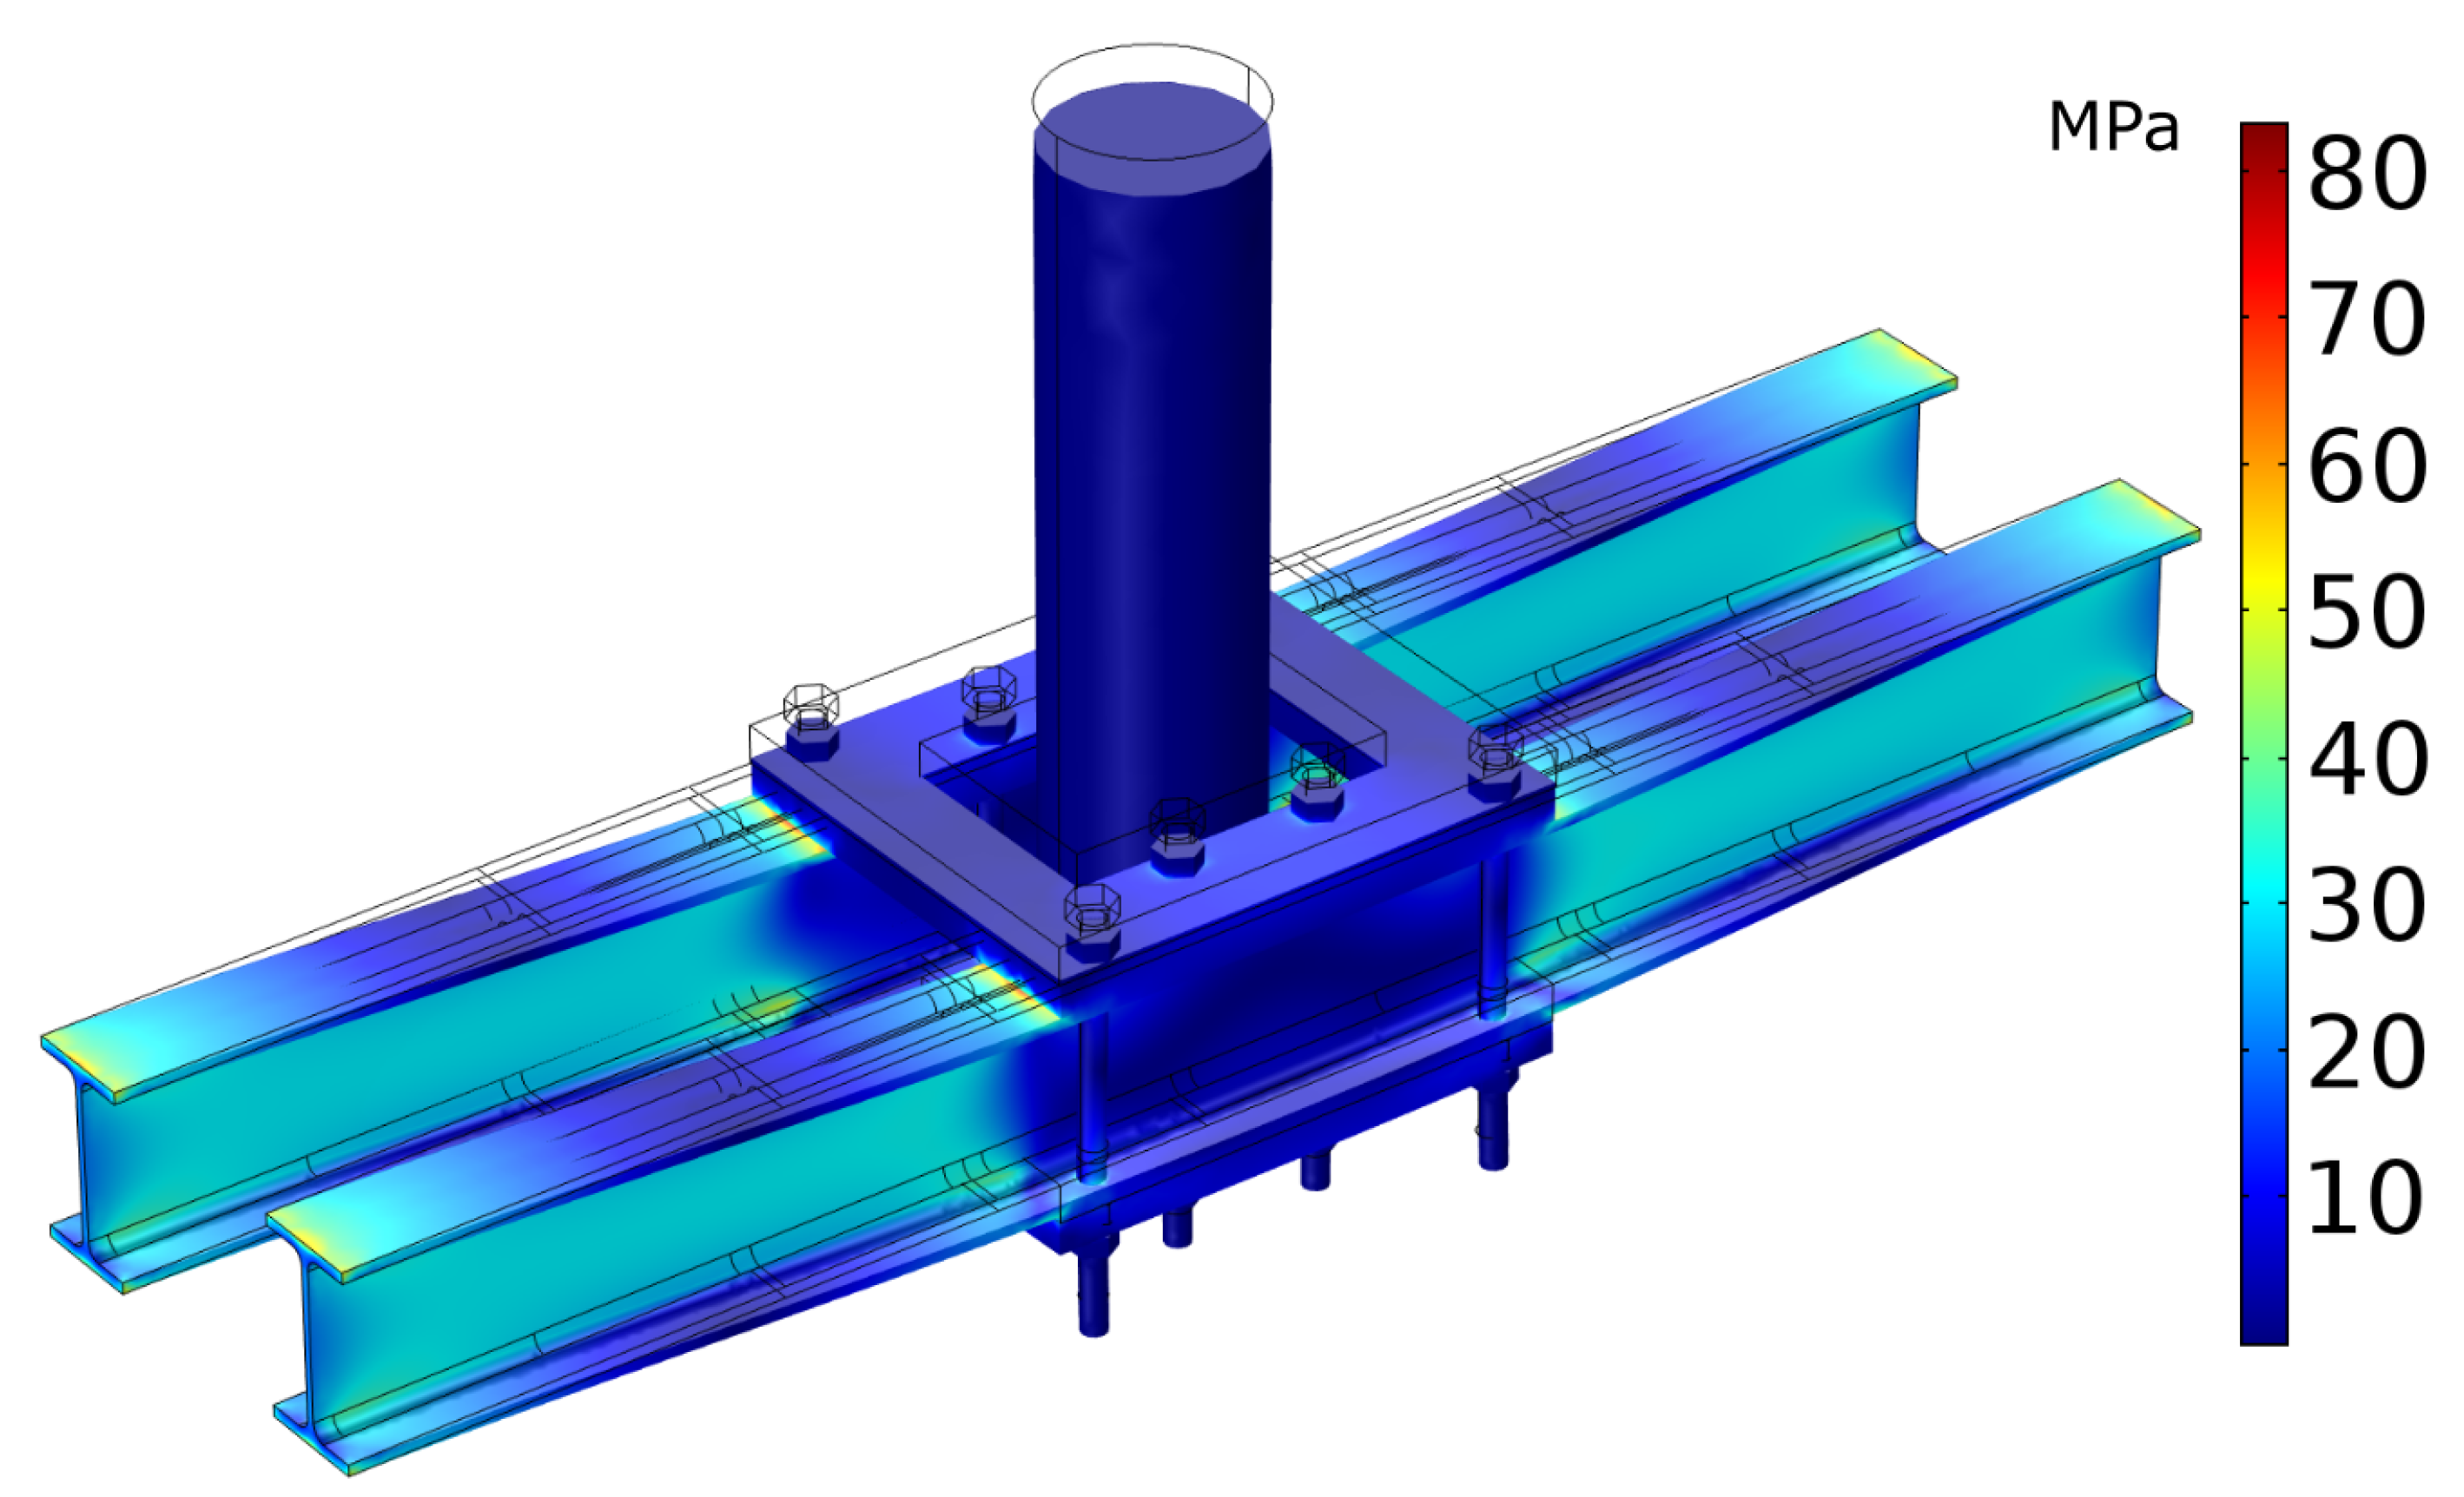
Figure 4 shows the stress distribution for the actuator attachment during a 25 kN load in the downward direction.
According to
Figure 4, the absolute maximum stress magnitude occurs at the contact point of the actuator attachment plates to I-beams. This matches the stress limit from
Figure 3. The model calculates a value of ≈70 MPa at this point. This is well below the estimated endurance limit of the steel,
= 125 MPa. It is also possible to minimize the stress at this contact point with the introduction of a soft material, such as rubber. With stress levels in the majority of the I-beams below 40 MPa, the outer frame should survive indefinitely under continuous maximum loading conditions.
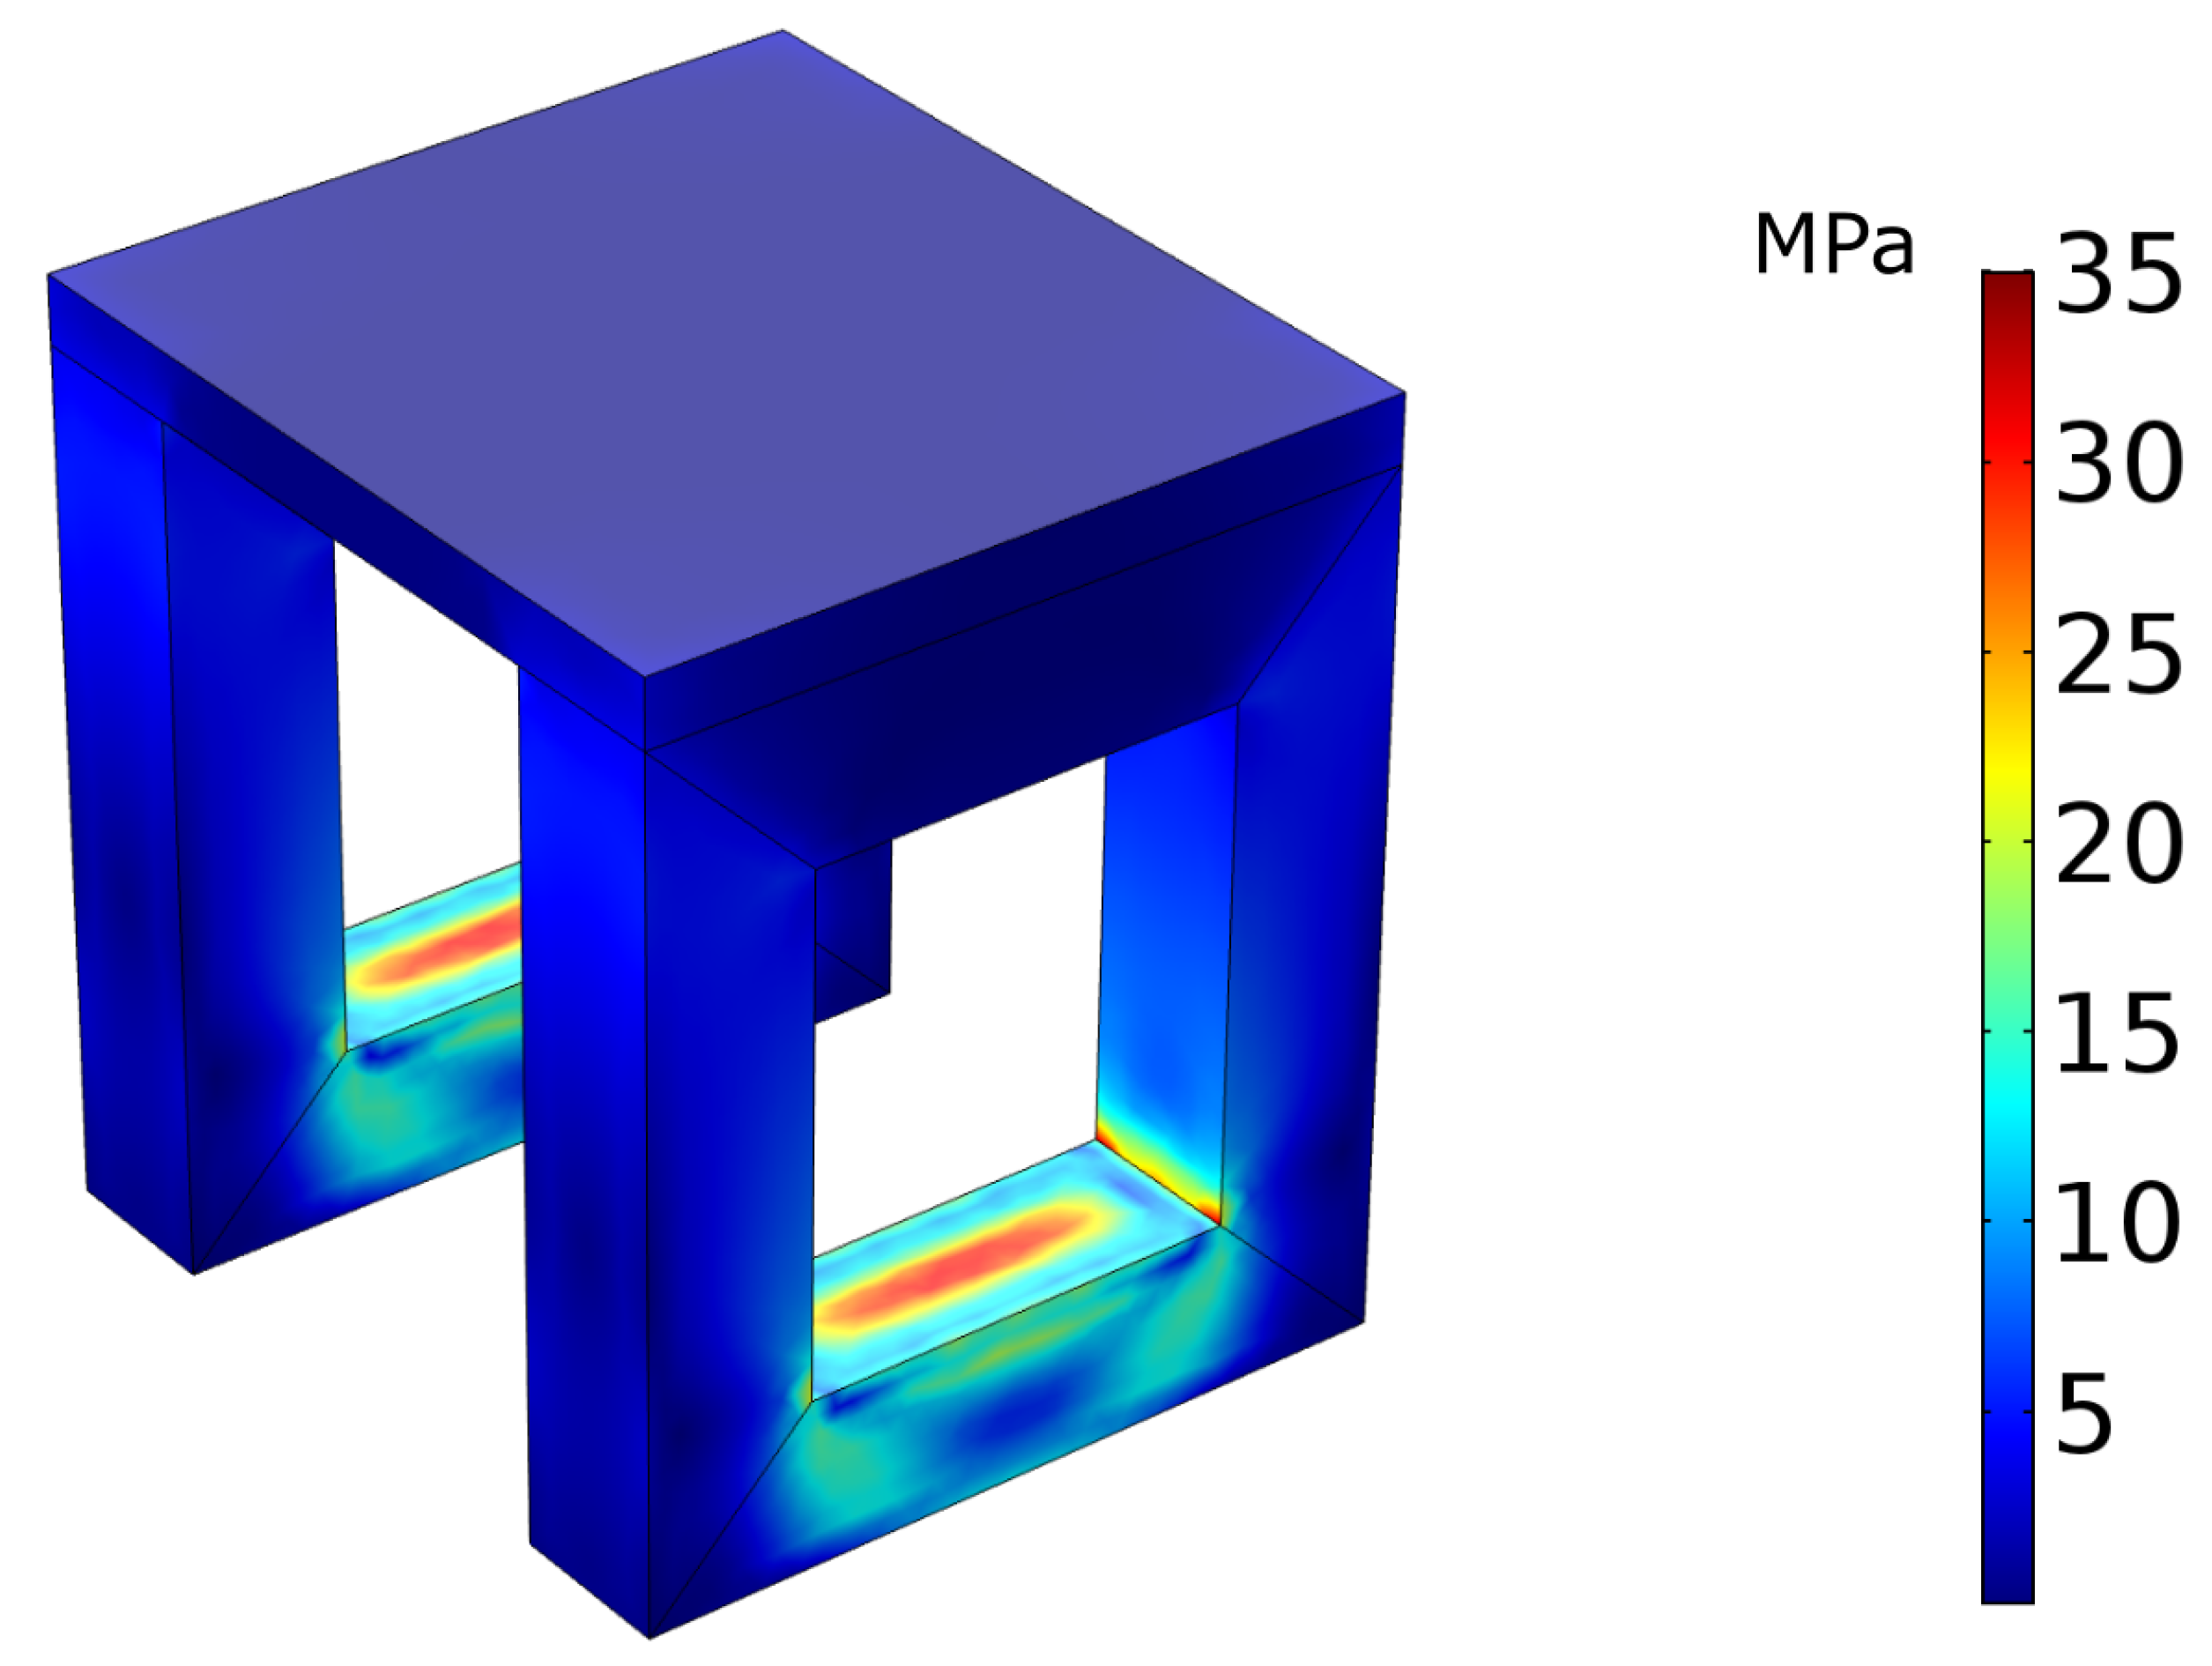
6.2.2. 4-point Frame
Following the same process, the FEM model of the 4-point frame is established by applying the maximum possible load to the bottom, shown in
Figure 5.
Again, we see stress levels well below the approximate endurance limit,
= 125 MPa. The weld interface between the hollow beams is the weakest point of this section. According to EN 1993-1-9 [
19], the endurance limit for welds,
with detail category,
can be calculated as:
providing a smaller endurance limit of 40.5 MPa when compared to that of steel. From
Figure 5, the stress is up to 35 MPa in this region. With this information, the 4-point frame should also survive indefinitely under continuous maximum loading conditions. In the worst case scenario, according to curves shown in [
19], the 4-point frame may fail after several million cycles. Since this is a significant amount of time and replacement cost would be low, this is of little concern.
6.2.3. Beam Model
As discussed in
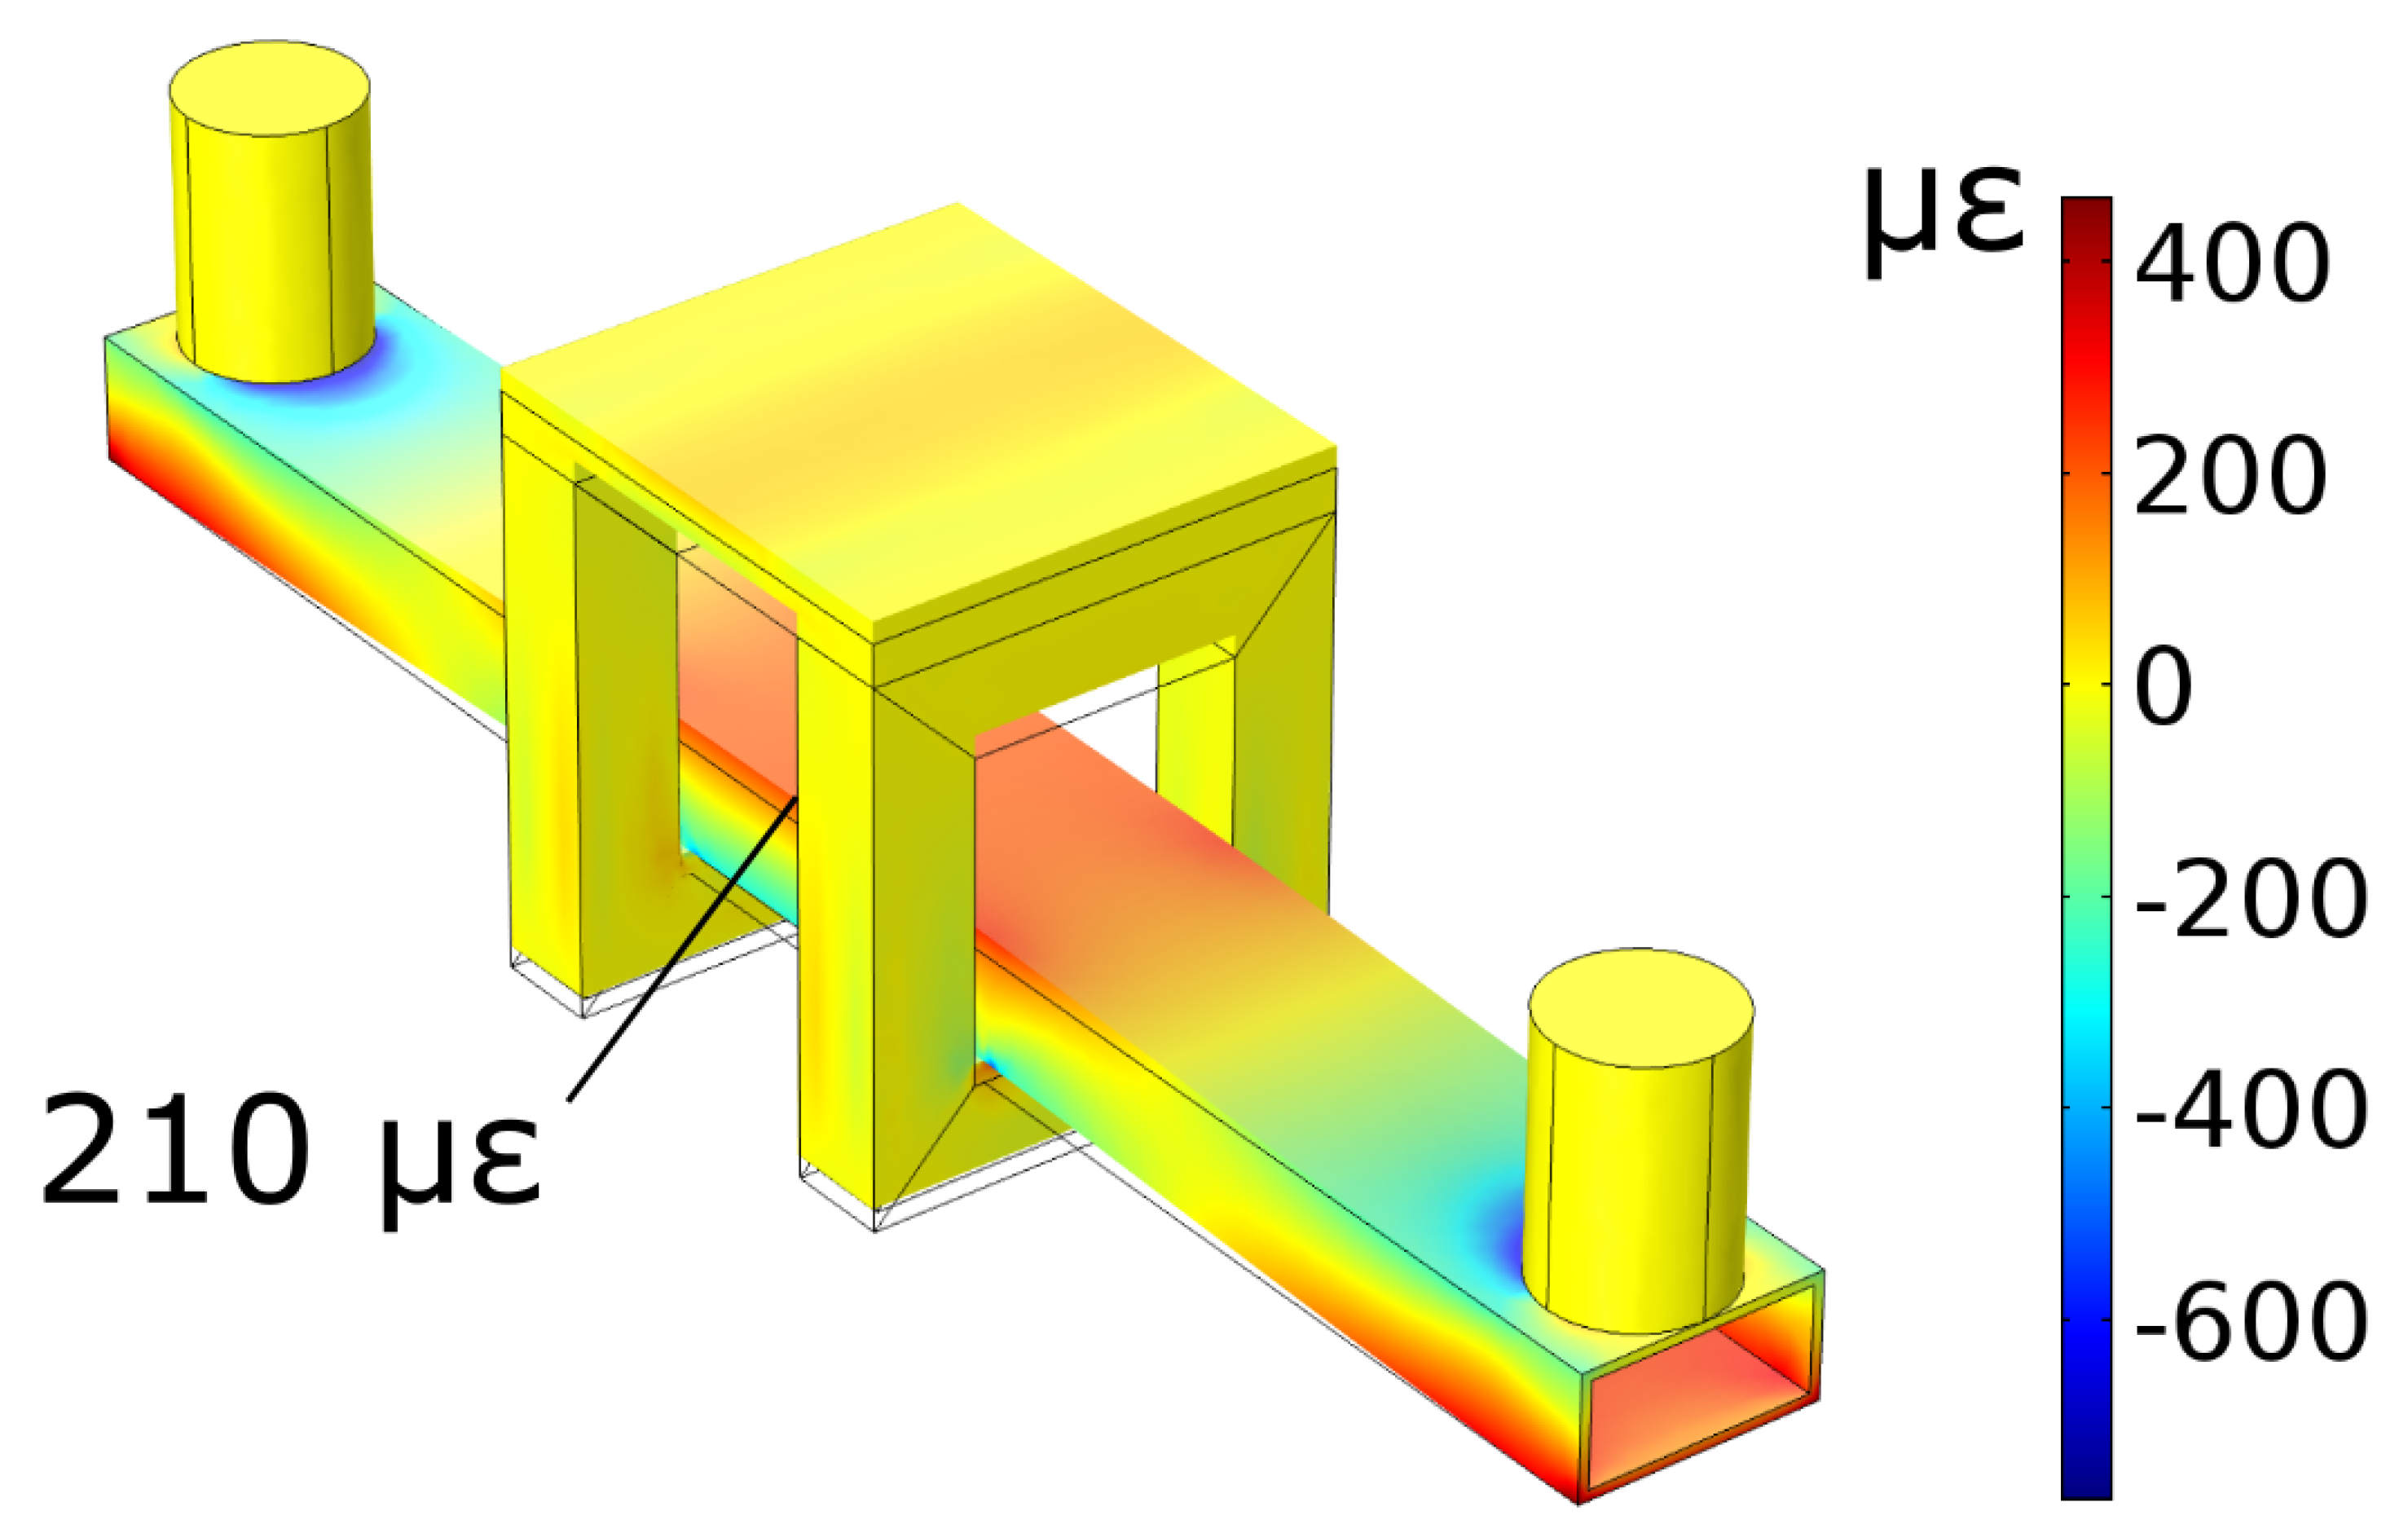
Section 2, the frame is designed to test beams of 10 cm width and height and 1 m length of any material. To validate both the force capability of the actuator and the simulations of stress levels in frame sections, it is possible to simulate and perform a single beam experiment for comparison. If strain levels witnessed in the beam during both cases are similar—this provides confidence that the frame FEM models are also accurate without the need to install more sensors. In addition, it would be highly beneficial to carry out simulations prior to any experimentation in order to determine the maximum possible strain that can be subjected to the specimen. Any new specimen can then simply be inserted into the pre-existing model and expected strains will be known prior to experimentation.
A hollow steel beam of 1 m length, 120 mm width, 60 mm height and 5 mm thick walls was chosen as a test specimen. These dimensions were firstly inserted into the FEM software, and results were shown in
Figure 6.
This will be used during testing (
Section 8) for comparison. A tension strain of 210
was witnessed in the simulation at the mid-point of the steel specimen, as annotated.
7. Installation and Commissioning Procedure
Prior to testing, the machine requires installation and initial commissioning. This includes:
Physical fitting of the frame, actuator, controller and PC,
Wiring of controller, actuator, power supplies and load cell,
Programming of actuator control software.
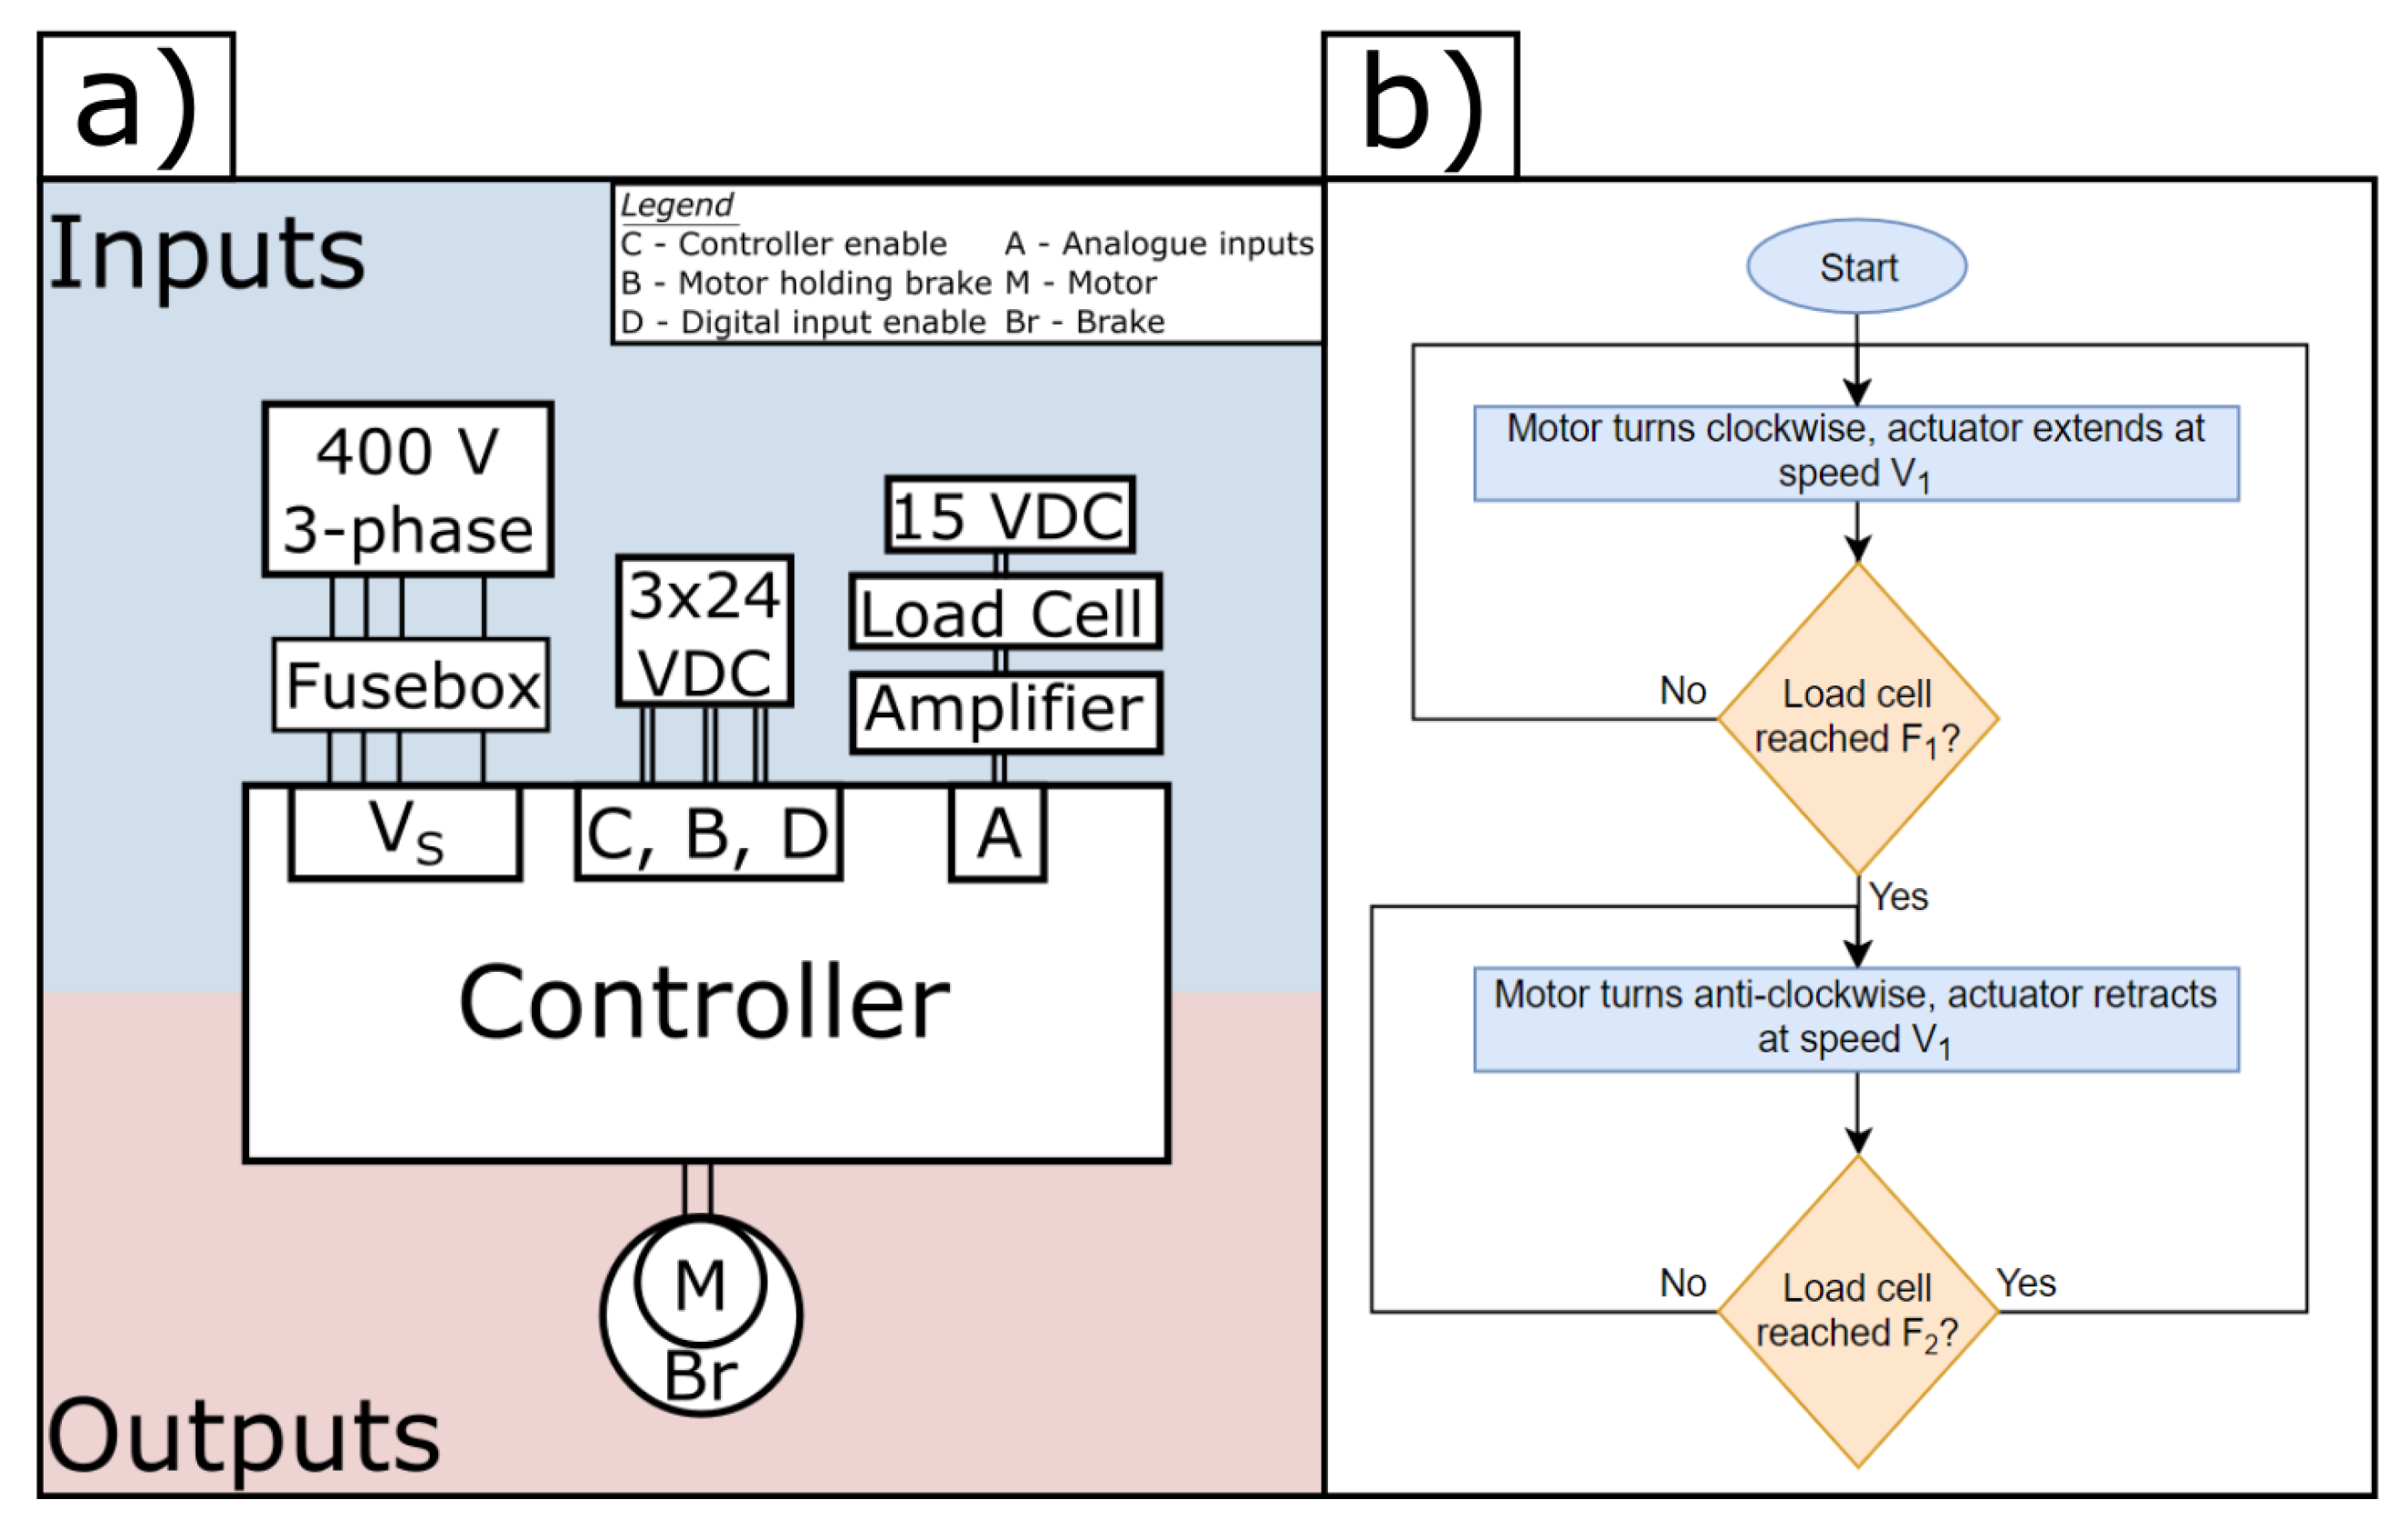
Following physical fitting, the electrical cabling is arranged according to
Figure 7a. At this stage, the setup is simple, with extensive expandability in the form of analogue and digital inputs and outputs. In addition, 24 V DC supplies are required to power the controllers various features, such as the digital inputs/outputs, the brake and to enable the controller itself. A 400 V 3-phase supply is used for powering the motor. A feedback loop containing the amplified load cell voltage is used to determine the direction of the motor. A program is created for simple sinusoidal movement dependent on set force limits, as illustrated in
Figure 7b. Three variables are set, compression force,
, tension force,
, and maximum speed,
. During either retraction or extension, the direction of motor rotation is reversed once the set force is reached. The actuator acceleration is also customizable but was set at the default value in this work. This simple program will allow initial testing of a specimen to ensure that the machine meets design requirements.
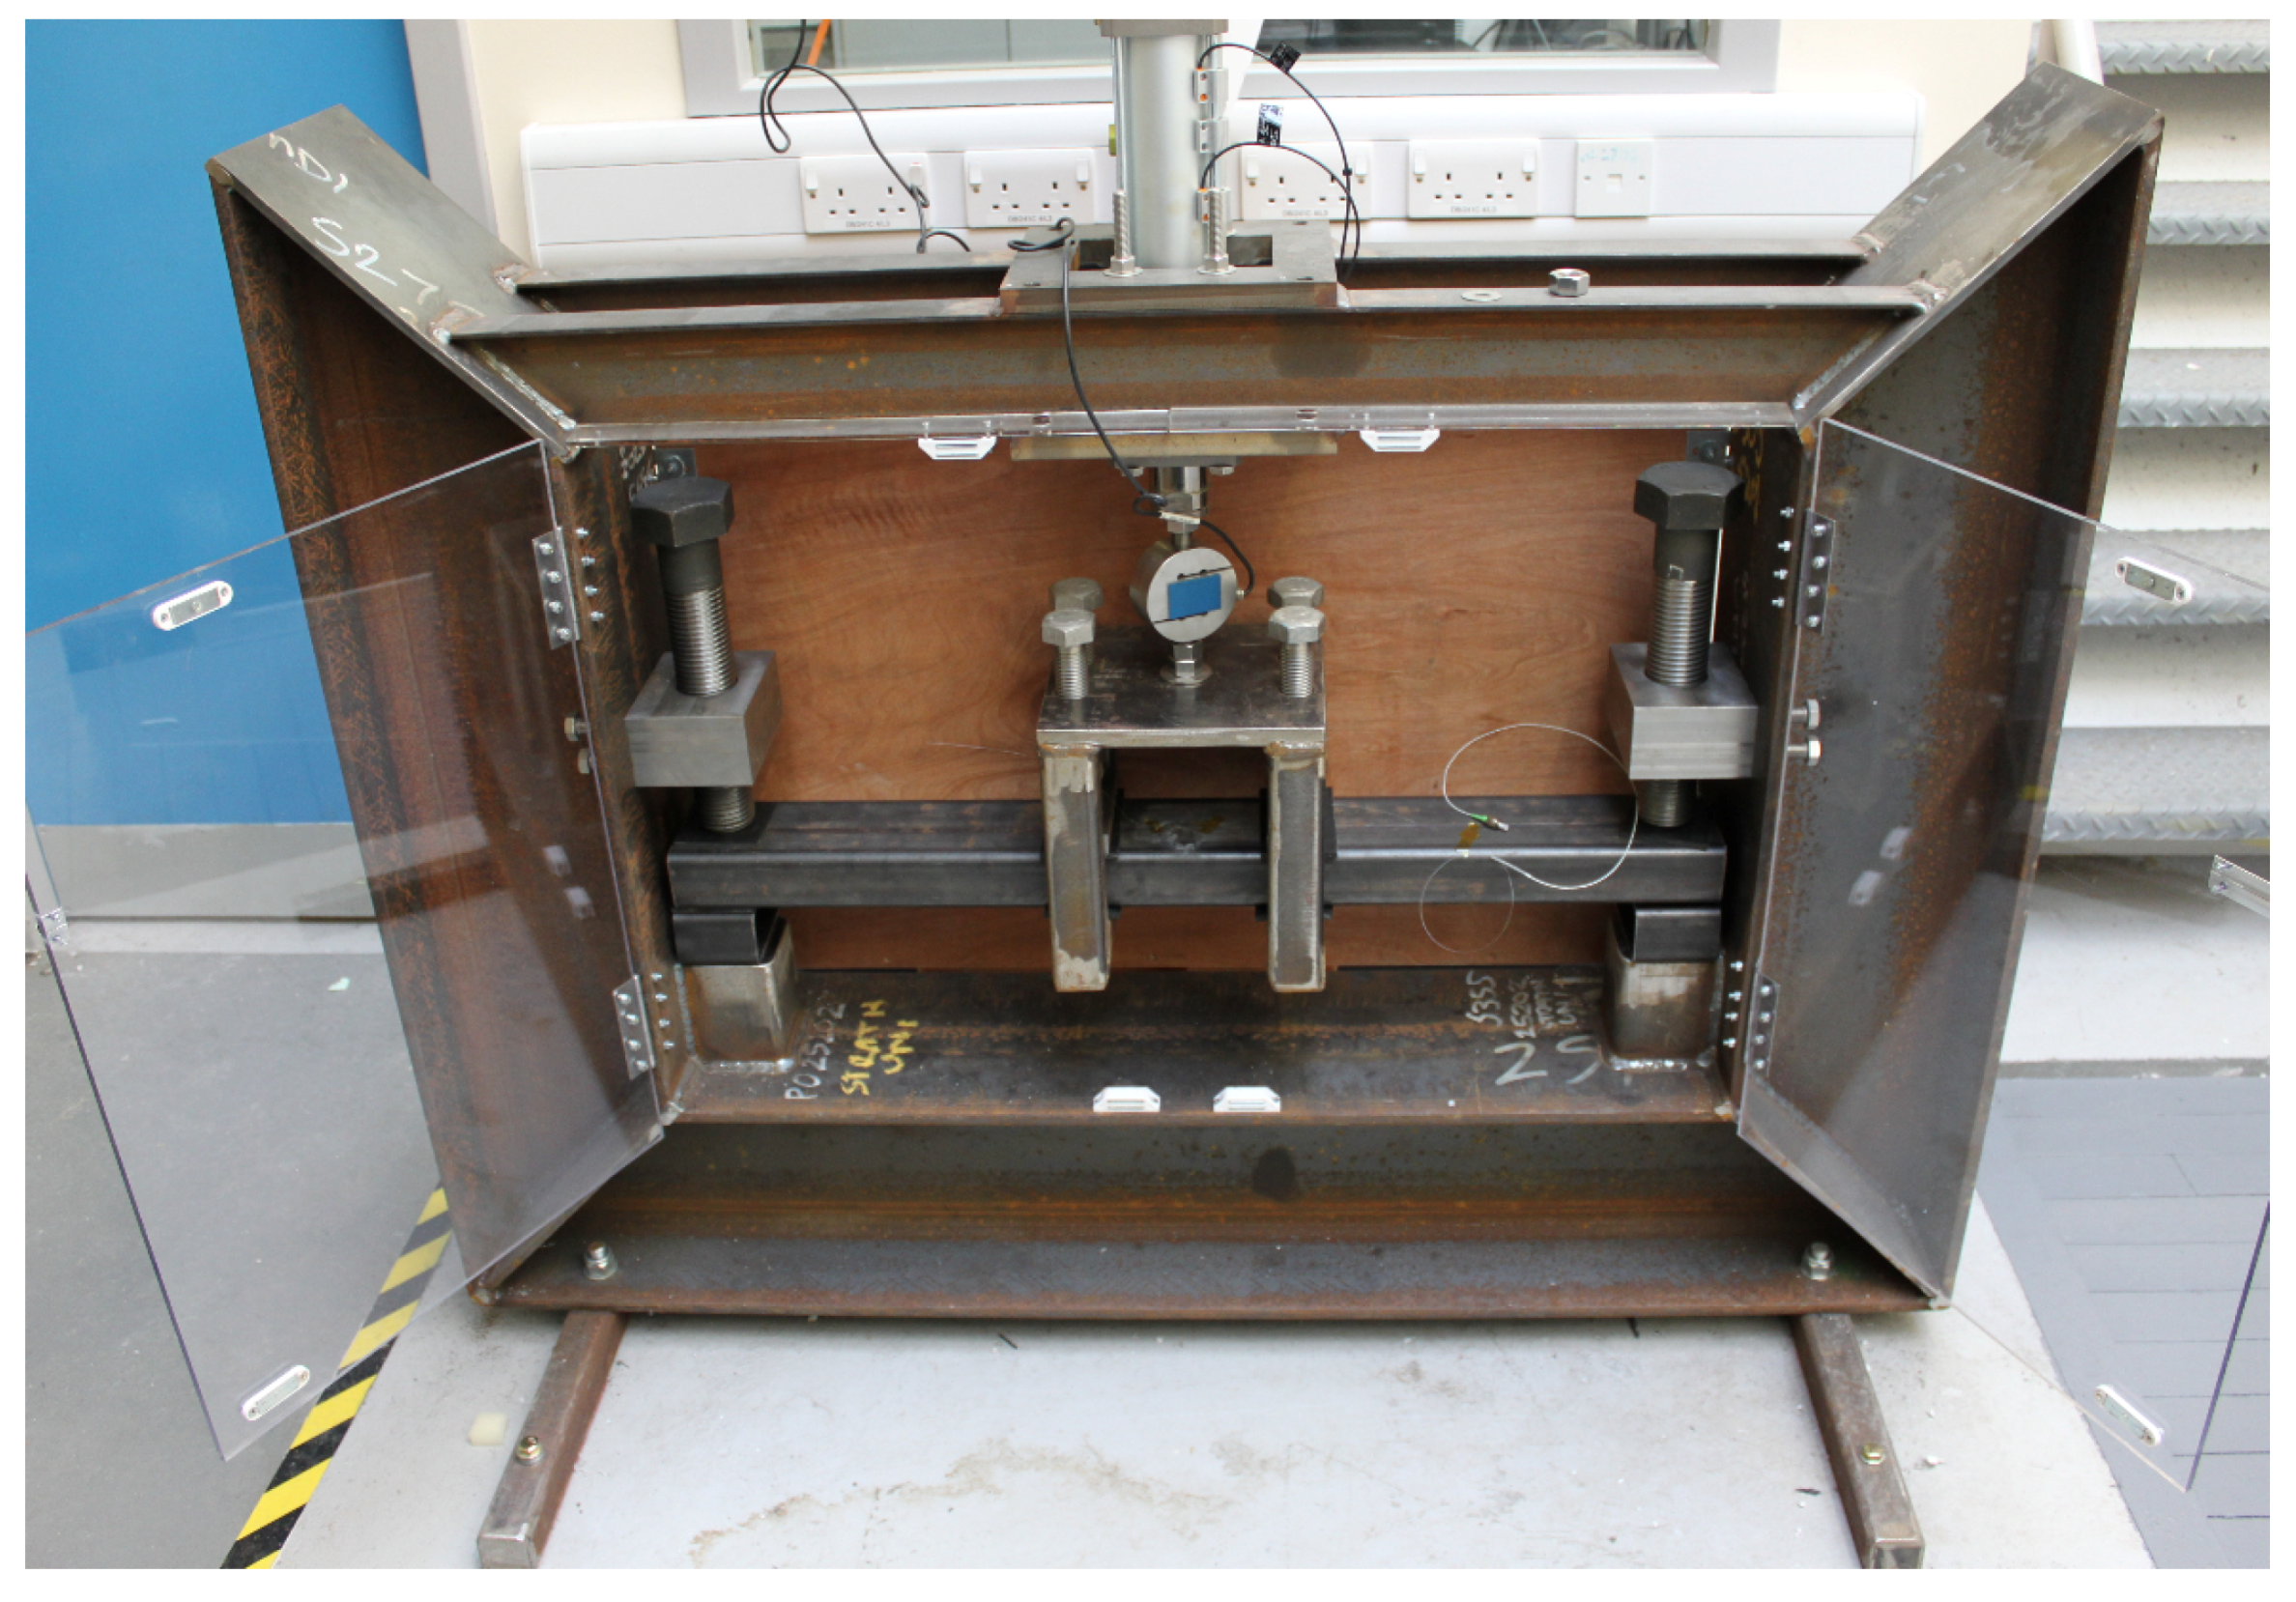
8. Testing Results
Figure 8 shows the experimental set-up of the steel beam and frame, similar to the simulation in
Figure 6. The program shown in
Figure 7b was run with the force limits,
and
, set at ±25 kN and an arbitrary speed. The sensor applied to the steel specimen were epoxied fibre Bragg gratings (FBGs), characterized as reported in [
20]. Using the sensitivity of 0.89 nm/m
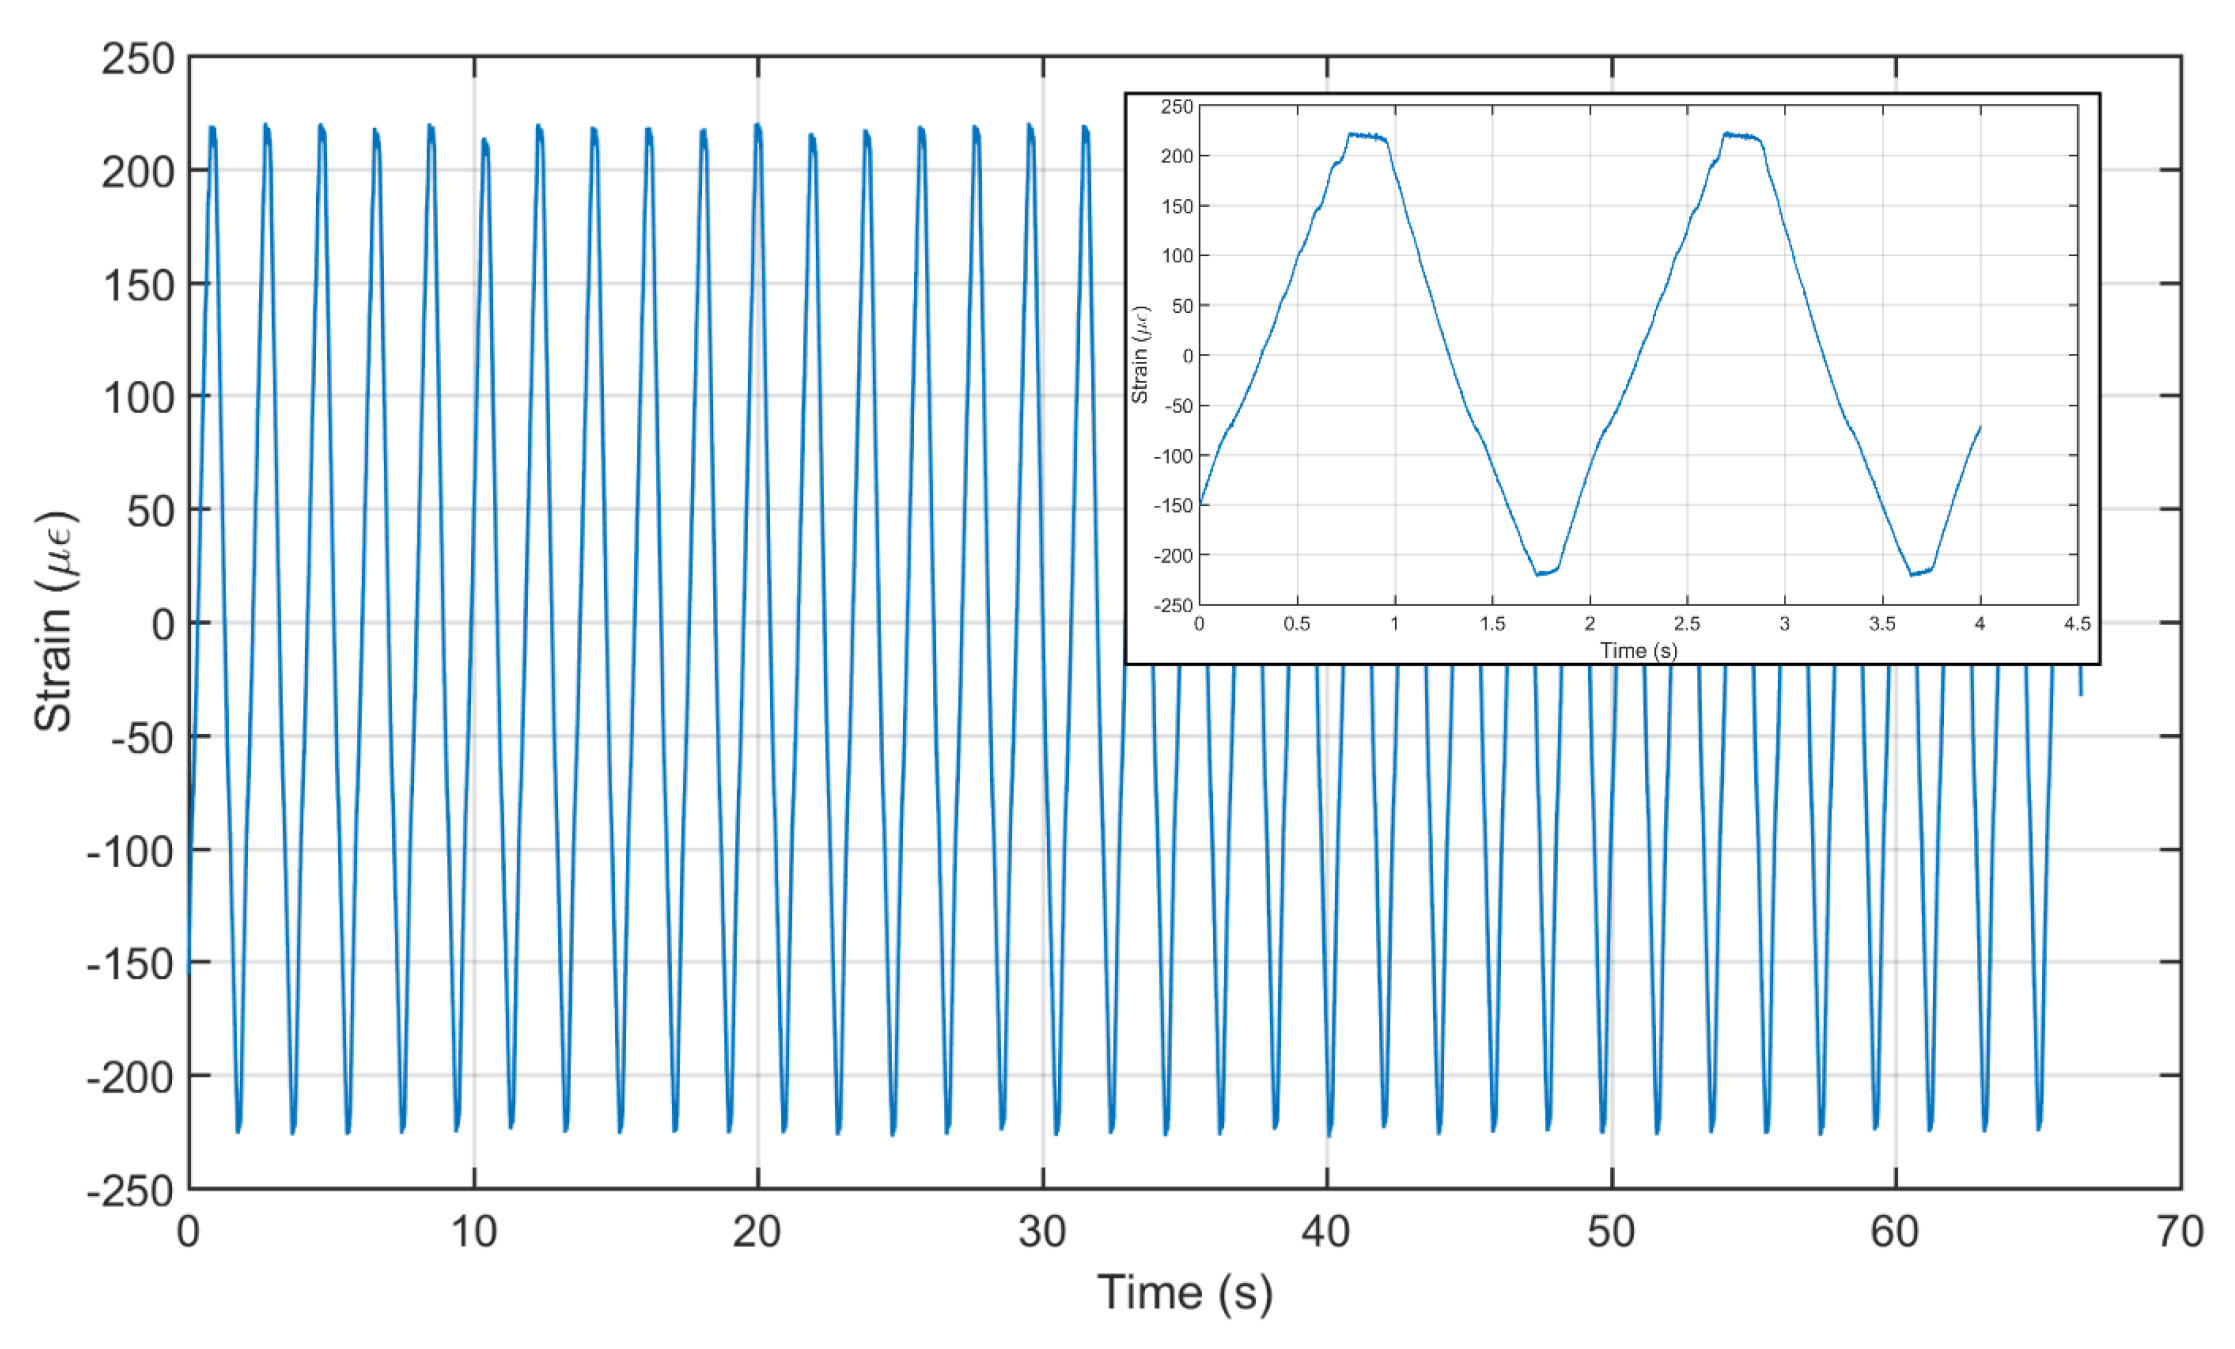
, the strain at the centre point of the steel specimen is shown in
Figure 9, with a more detailed view of the cycle inserted. The frequency of cycles is controlled by the set speed of actuator extension. Maximum linear speed of actuator is quoted as 500 mm/s. In this test, speed was set at 50 mm/s, which produced a cycle frequency of 0.5 Hz. Therefore, the maximum frequency of this load cycle is 5 Hz, although emphasis is made on the previous statement of requiring lower frequency when testing concrete. One must also consider the temperature of the controller and actuator, which may limit the cycle frequency further. An external fan is used to reduce motor temperature and was not required during the test in this work. Future work will investigate temperatures over an extended testing period. Load cell limits can be easily adjusted, allowing variable magnitude load cycles. Load and speed variables were varied during testing to ensure successful operation over the entire range. Overall, the load cycle remains stable throughout, with a tension peak of ≈220
, which, when compared to the simulation (210
), is in close agreement (
). The slight increase is most likely due to geometric differences of the specimen compared to the model—the corners are filleted for example. This was omitted in simulations to reduce computational requirements. It is clear that the cycles are not sinusoidal or triangular from the insert: this will be improved on by modifying the program to include a smoother transition. The accuracy of the machine can be ascertained by analysing the spread at the peaks of the load cycle. In other words, the deviation over time of the peak loading. Extracting the peak values of each individual cycle in this test provided an accuracy of
where
and
are the standard deviation and mean of strain peaks, respectively. To compare this to similar machines is difficult as commercial machines would require significant customization to provide similar load tests. One commercial machine was used in previous work [
21] for tensile loading of a steel specimen. Results from this produced an accuracy value of
that is comparable to the machine in this work. Overall, this simulation provides confidence in the previous FEM simulations, the survivability of the frame and the overall design.
9. Commercial Evaluation
Table 1 illustrates the breakdown of key components constituting the machine and their cost. Overall, the fatigue drive was the most expensive component with 59% of the overall costs. With regards to the decision-making of the insourcing of the machine (buying components and commissioning the machine) versus outsourcing of the testing, the business case depends on the intended usage.
Given a mean outsourcing machine expenditure of £325/day (value gained from locally available source), the cost–benefit threshold over outsourcing is reached at 373 h of testing. Assuming a sample is tested at 3 Hz, this corresponds to 4 million cycles. At 10 Hz, this corresponds to cycles. Consequently, the lower the testing frequency, the more likely becomes the option of insourcing. As a consequence, depending on the intended total usage, the sourcing strategy may be defined.
10. Conclusions
An alternative machine design is presented for continuous long-term fatigue testing. FEM models examining stress levels in the support frame conclude that, for maximum loading, the frame should remain below the endurance limit, and thus should survive indefinitely. A steel beam specimen was also modeled and compared to real world tests, validating the previous analysis and providing an initial specimen examination for any future tests. In comparison to outsourcing, this design is cost-efficient if more than 373 h of testing is planned. The machine also provides a more customizable and less time restricted test-bench.
Author Contributions
J.M. prepared the CAD and FEM model, sourced the components, installed, commissioned and programmed the machine, and supported the overall design of the machine. T.R. generated the idea, designed and commissioned the machine, sourced the components and gave guidance with regards to the CAD and FEM. J.M. and T.R. wrote the manuscript. G.F., P.N. and G.Z. supported the work throughout.
Funding
This work was supported by ScottishPower Renewables, SSE and the Engineering and Physical Sciences Research Council, Grant No. EP/L016680/1.
Conflicts of Interest
The authors declare no conflict of interest.
Abbreviations
The following abbreviations are used in this manuscript:
| CAD | computer-aided design |
| FEM | finite element method |
| FBG | fibre Bragg grating |
References
- Lee, Y.L.; Pan, J.; Hathaway, R.; Barkey, M. Fatigue Damage Theories. In Fatigue Testing and Analysis; Elsevier: Amsterdam, The Netherlands, 2005. [Google Scholar]
- Stephens, R.I.; Fatemi, A.; Stephens, R.R.; Fuchs, H.O. Metal Fatigue in Engineering; John Wiley and Sons: Hoboken, NY, USA, 2000; Volume 2. [Google Scholar]
- Suresh, S. Fatigue of Materials; Cambridge University Press: Cambridge, UK, 1994. [Google Scholar]
- Richard, H.A.; Sander, M. Fatigue Crack Growth: Detect—Assess—Avoid; Springer: Berlin, Germany, 2016. [Google Scholar]
- Kondo, Y. Fatigue under variable amplitude loading. In Comprehensive Structural Integrity; Ritchie, B.L., Murakami, Y., Eds.; Elsevier: Amsterdam, The Netherlands, 2003. [Google Scholar]
- Tilly, G.P. Fatigue of Steel Reinforcement Bars in Concrete: A Review. Fatigue Fract. Eng. Mater. Struct. 1979, 2, 251–268. [Google Scholar] [CrossRef]
- Schijve, J. Fatigue of Structures and Materials; Springer: Berlin/Heidelberg, Germany, 2009. [Google Scholar]
- British Standards Institution. Guide to Fatigue Design and Assessment of Steel Products. BS 7608:2014; British Standards Institution: London, UK, 2014. [Google Scholar]
- Lee, S.B. Stress analysis and design for a structural fatigue testing machine. KSME J. 1991, 5, 115–124. [Google Scholar] [CrossRef]
- Vincent, M.K.; Varghese, V.; Sukumaran, S. Fabrication and Analysis of Fatigue Testing Machine. Int. J. Eng. Sci. 2016, 5, 2319–1813. [Google Scholar]
- Bhatkar, O.P.; Mhatre, S.Y.; Pilankar, A.S.; Desai, V.S.; Katlikar, M.J. Design and fabrication of combined fatigue testing machine. Int. Adv. Res. J. Sci. Eng. Technol. 2017, 4. [Google Scholar] [CrossRef]
- Pach, E.; Korin, I.; Ip Na, J.P.; Pach, C.E. Simple fatigue testing machine for fiber-reinforced polymer composite. Exp. Tech. 2012, 36, 76–82. [Google Scholar] [CrossRef]
- Cooper Technology. Large Hydraulic Four Point Bending Machine. Available online: https://cooper.co.uk/shop/asphalt-testing/large-hydraulic-four-point-bending-machine/ (accessed on 27 June 2018).
- Instron. Dynamic and Fatigue Testing Systems. Available online: http://www.instron.us/en-us/products/testing-systems/dynamic-and-fatigue-systems (accessed on 27 June 2018).
- Considine, D.M.; Considine, G.D. Standard Handbook of Industrial Automation; Springer: Berlin, Germany, 1986. [Google Scholar]
- Lynwander, P. Gear Drive Systems: Design and Application; CRC Press: Boca Raton, FL, USA, 1983. [Google Scholar]
- International Organization for Standardization. Welding—Fusion-Welded Joints in Steel, Nickel, Titanium and Their Alloys (Beam Welding Excluded)—Quality Levels for Imperfections. BS EN ISO 5817:2014; ISO: Geneva, Switzerland, 2014. [Google Scholar]
- Kucharczyk, P.; Rizos, A.; Münstermann, S.; Bleck, W. Estimation of the endurance fatigue limit for structural steel in load increasing tests at low temperature. Fatigue Fract. Eng. Mater. Struct. 2012, 35, 628–637. [Google Scholar] [CrossRef]
- European Committee for Standardization. EN 1993-1-9: Eurocode 3: Design of Steel Structures—Part 1–9: Fatigue; European Committee for Standardization: Brussels, Belgium, 2005. [Google Scholar]
- Rubert, T.; Perry, M.; Fusiek, G.; McAlorum, J.; Niewczas, P.; Brotherston, A.; McCallum, D. Field demonstration of real-timewind turbine foundation strain monitoring. Sensors 2017, 18, 97. [Google Scholar]
- Fusiek, G.; Rubert, T.; Niewczas, P.; McAlorum, J.; Perry, M. Preliminary characterization of metal-packaged fiber Bragg gratings under fatigue loading. In Proceedings of the IEEE International Instrumentation and Measurement Technology Conference (I2MTC), Turin, Italy, 22–25 May 2017. [Google Scholar]
© 2018 by the authors. Licensee MDPI, Basel, Switzerland. This article is an open access article distributed under the terms and conditions of the Creative Commons Attribution (CC BY) license (http://creativecommons.org/licenses/by/4.0/).


