Article

Experimental Study of the Shaft Penetration Factor on the Torsional Dynamic Response of a Drive Train

1
Department of Mechanical Engineering, Vrije Universiteit Brussel, Pleinlaan 2, 1050 Brussels, Belgium
2
Department of Mechanical Engineering, Technology Campus De Nayer, KU Leuven, Jan De Nayerlaan 5, 2860 Sint-Katelijne-Waver, Belgium
*
Author to whom correspondence should be addressed.
Machines 2018, 6(3), 31; https://doi.org/10.3390/machines6030031
Submission received: 2 June 2018 / Revised: 12 July 2018 / Accepted: 16 July 2018 / Published: 17 July 2018

Abstract

:
Typical rotating machinery drive trains are prone to torsional vibrations. Especially those drive trains that comprise one or more couplings which connect the multiple shafts. Since these vibrations rarely produce noise or vibration of the stationary frame, their presence is hardly noticeable. Moreover, unless an expensive torsional-related problem has become obvious, such drive trains are not instrumented with torsional vibration measurement equipment. Excessive levels can easily cause damage or even complete failure of the machine. So, when designing or retrofitting a machine, a comprehensive and detailed numerical torsional vibration analysis is crucial to avoid such problems. However, to accurately calculate the torsional modes, one has to account for the penetration effect of the shaft in the coupling hub, indicated by the shaft penetration factor, on the torsional stiffness calculation. Many guidelines and assumptions have been published for the stiffness calculation, however, its effect on the damping and the dynamic amplification factor are less known. In this paper, the effect of the shaft penetration factor, and hence coupling hub-to-shaft connection, on the dynamic torsional response of the system is determined by an experimental study. More specifically, the damping is of major interest. Accordingly, a novel academic test setup is developed in which several configurations, with each a different shaft penetration factor, are considered. Besides, different amplitude levels, along with both a sweep up and down excitation, are used to identify their effect on the torsional response. The measurement results show a significant influence of the shaft penetration factor on the system’s first torsional mode. By increasing the shaft penetration factor, and thus decreasing the hub-to-shaft interference, a clear eigenfrequency drop along with an equally noticeable damping increase, is witnessed. On the contrary, the influence of the sweep up versus down excitation is less pronounced.

1. Introduction

The presence of torsional vibrations in rotating machinery is inevitable. Excessive vibration levels can cause extensive damage and even complete failure of the machine. In order to develop a safe and reliable drive train, a good physical understanding of the torsional dynamic response of the machine is required.
In general, a single turbomachine rotor is torsionally stiff enough to raise its natural frequencies above the excitation range. However, for an extended industrial drive train consisting of different rotors connected to each other via a coupling, this is not always the case. For instance a centrifugal blower driven by an electric motor through a coupling with a low stiffness value can bring down the torsional natural frequencies into the range of excitation frequencies. Figure 1 presents the typical configuration of such a centrifugal blower.
During start-up, the electric motor can produce large amplitude and variable frequency torque pulsations which will excite torsional vibrations superposed onto the acceleration scheme [1]. In the field, turbomachinery drive trains are commonly not instrumented with torsional vibration measurement equipment. One particular reason is the effort, and the related cost, to make such a torsional measurement. Quite often, the first indication of a torsion-related problem is a coupling or even rotor failure [2]. Therefore, during the design phase of the machine, the performed numerical torsional vibration analysis, for instance according to American Petroleum Institute (API) standards (API 617 [3] and API 684 [4]), needs to reflect the system’s torsional behavior well. A large amount of literature on the physical modeling of the torsional behavior can be found in [2,5,6,7,8,9]. Several effects, and thus uncertainties, have to be taken into account to accurately generate the torsional natural frequencies, mode shapes, stress levels, etc. One of the up to now less understood aspects in this analysis refers to the effect of the coupling hub-to-shaft connection on the torsional stiffness and damping.
In order to integrate this hub-to-shaft connection in a numerical torsional model, Wilson [6] introduced the (shaft) penetration factor, which is further addressed in Section 2. This factor enabled a more accurate approximation of the actual torsional response of the system and is even used in today’s API standard [4]. Besides, Calistrat et al. [10] showed that the transmitted torque, ratio between the shaft and coupling hub outside diameters, and interference fit have a strong influence on the torsional stiffness of the hub-to-shaft connection. Similarly, Vance et al. [11] concluded that an interference fit will have a significant effect on a system’s lateral rotor dynamic behavior. In [12], the uncertainty of system mass-elastic properties on the outcome of numerical torsional analyses was discussed. Among some other uncertainties, it was pointed out that the shaft penetration factor has a significant influence on the first torsional eigenfrequency. More recently, Wang et al. [13] drew the same conclusion after performing numerous calculations and, moreover, comparing those with experimental results. Repeatedly, however, no focus was laid upon the torsional damping. Hence, this paper focuses on the experimental study of the effect of the coupling hub-to-shaft connection on the dynamic torsional response of the system, with particular interest in the damping, using a novel designed academic setup.
The paper starts by presenting a brief description of the shaft penetration factor (SPF) which reflects the hub-to-shaft connection in a numerical torsional vibration analysis. In the following section, an overview of the developed test rig and the proposed test configurations is given. Subsequently, measurements of the effect of the SPF on the first torsional natural frequency are obtained and discussed. To end, a simple calculation of the first torsional eigenfrequencies is performed to justify the measurement results.

2. Shaft Penetration Factor

In order to accurately approximate the actual flexibility of the physical system, a SPF is used to determine a precise torsional stiffness value of the shaft sections. The SPF, illustrated in Figure 2, is the percentage of the shaft length within the confines of the coupling hub that is assumed to be free from restraint at the hub-to-shaft interface. As a result, the length of the shaft is effectively increased by the amount indicated by the SPF. Conversely, the length of the coupling hub bore is reduced by the same amount. Based on the hub-to-shaft connection, part of the shaft can twist unrestrained in the coupling hub bore forming a friction interface. For a given application, the SPF can have a significant influence on the outcome of the analytical calculation. According to API standards, the traditional assumption is initially set to a SPF of 1 / 3 of the length of the shaft section underneath the coupling hub [4].

3. Experimental Procedure

In this section a brief overview of the developed academic test rig is presented, together with the introduction of the used steel laminae coupling, also known as membrane or disc coupling. Furthermore, the proposed test configurations and testing procedure are discussed.

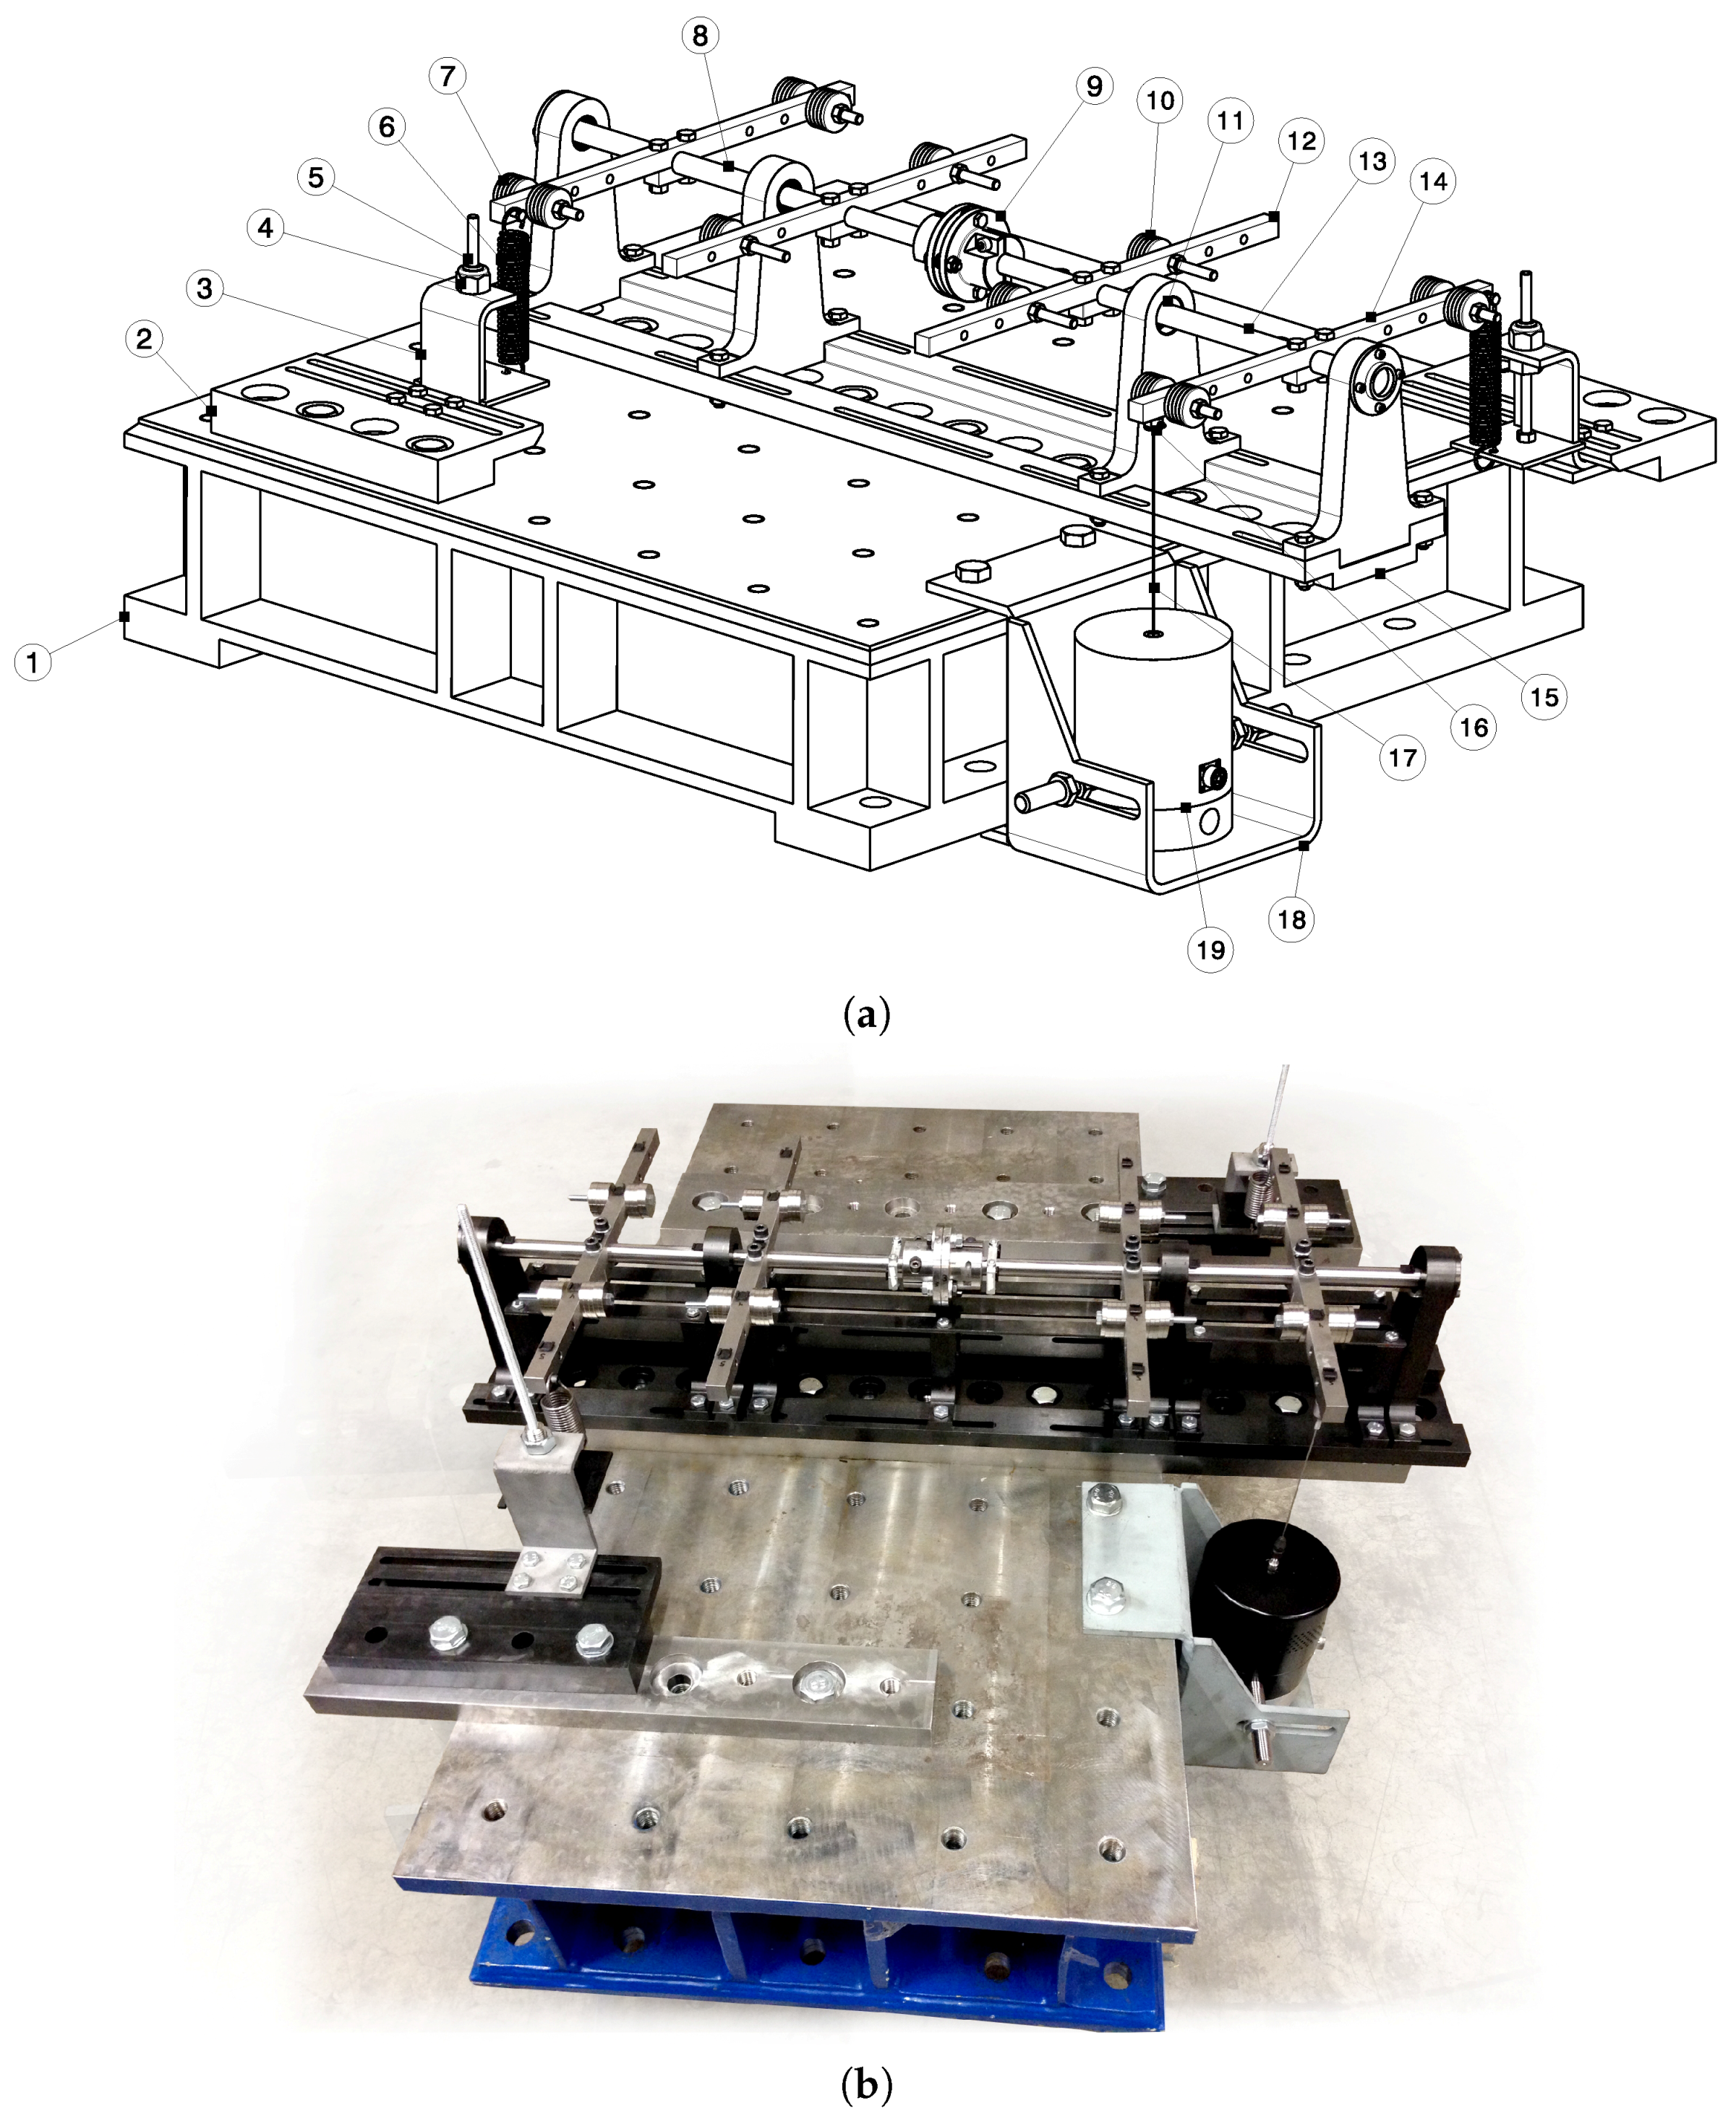
3.1. Test Rig Design

The setup, presented in Figure 3, consists of two separate shaft sections (8) and (13) connected together by an interchangeable coupling (9). Hence, different coupling types or sizes can be tested. Two large cross-beams (12) and (14) can be mounted onto a single shaft section. In order to set up the moment of inertia of the system, every side of a cross-beam can be fitted with a specific mass (7) and (10) on a predefined distance relative to the center axis. Besides, the torsional response can also be adjusted by axially repositioning the cross-beams onto the shaft sections using another arrangement. The shaft sections do not rotate, but a variable torque is introduced by a shaker (19) connected to one end of a cross-beam. In practice, the coupling will be preloaded by the static transmitted torque between the driving and driven part of the drive train. For the setup, however, a spring system (6) ensures the coupling is preloaded. The spring constant is set low in order to dynamically uncouple the system from its surrounding, while the spring tension can be adapted to vary the static transmitted torque over the coupling. Many elastomer-type couplings, for instance, behave nonlinearly, for which the torsional stiffness depends on the static preload. To accurately measure the dynamic input torque, a dynamic load cell (16) is positioned between the shaker via a stinger (17) and the end of the cross-beam (14). The purpose of the shaker is to generate the input force. Different input signals, like a harmonic excitation, a general periodic signal, or even a completely random signal, can be generated with the aid of the shaker. Both the preload system and shaker support exhibit guiding slots to account for the repositioning of the outer cross-beams. The response of the system, both lateral and torsional, is being captured by accelerometers mounted onto the shaft sections and cross-beams at well-defined distances (see Section 3.2). In the end, the entire structure is bolted onto a large workbench (1).
An overview of the dimensions of the test setup is presented in Table 1.

3.2. Test Configurations

In this paper, the focus is directed towards a steel laminae coupling type, which is often used in an industrial drive train configuration. The coupling consists of two hubs with a laminae packing in between. Torsionally, the laminae packing is extremely rigid. However, its design allows for angular compliance and misalignment with low restoring forces. Because of the all steel design, this coupling type has inherently little damping. Therefore, the coupling hub-to-shaft interface will determine most of the damping for the first torsional mode in the system.
As is shown in Figure 4, a symmetric positioning of the cross-beams with respect to the coupling is used during the test series. The additional weights are bolted on the cross-beams closely to the center axis. The location of both preload systems is indicated, together with the shaker position. Also the accelerometer positions and nomenclature are pointed out in Figure 4 (marked in blue). In Appendix A a summary of the used measurement equipment, as well as the most important technical specifications, is given.
In order to study the effect of the SPF on the torsional vibration response and modal parameters, three different configurations of hub-to-shaft connection are proposed. Each coupling hub contains a clamping device with two bolts, indicated as hub M8 bolts in Figure 2, by which the hub-to-shaft connection, and thus SPF, can be easily adjusted.
Configuration A contains the rigid connection by tensioning two M8 bolts to 21.25 kN each.
Configuration B sets the tensioning force to 4.25 kN each.
Configuration C unties the bolts, so the coupling hub is merely connected to the shaft via a key.
A swept sine excitation is generated by the shaker as input signal. The frequency range of 25 Hz to 65 Hz is chosen such that it comprises only the first torsional natural frequency. In fact, the first torsional mode is very sensitive to the SPF as the determining stiffness is changed. Four different amplitude levels, as well as sweep up and sweep down excitation, are used to identify potential nonlinear behavior. Besides, the higher amplitude levels enable to simulate the transient start-up torque of a rotating machine’s drive train. The response is measured with accelerometers on both the shaft sections and cross-beams. An overview of the measurement parameters, such as the sweep and data-acquisition parameters, is given in Table 2. It has to be noted that the data-acquisition hardware has a 100 kHz sampling rate for the throughput data combined with a build-in analog anti-aliasing filter. During the swept sine, the sampling rate is synchronously adapted with the sent out frequency for the construction of the frequency response function (FRF). Subsequently, the measurement data of the vertical direction is processed and the polyreference least-squares complex frequency-domain method, better known as PolyMAX, is used to estimate the modal parameters [14].

4. Results and Discussion

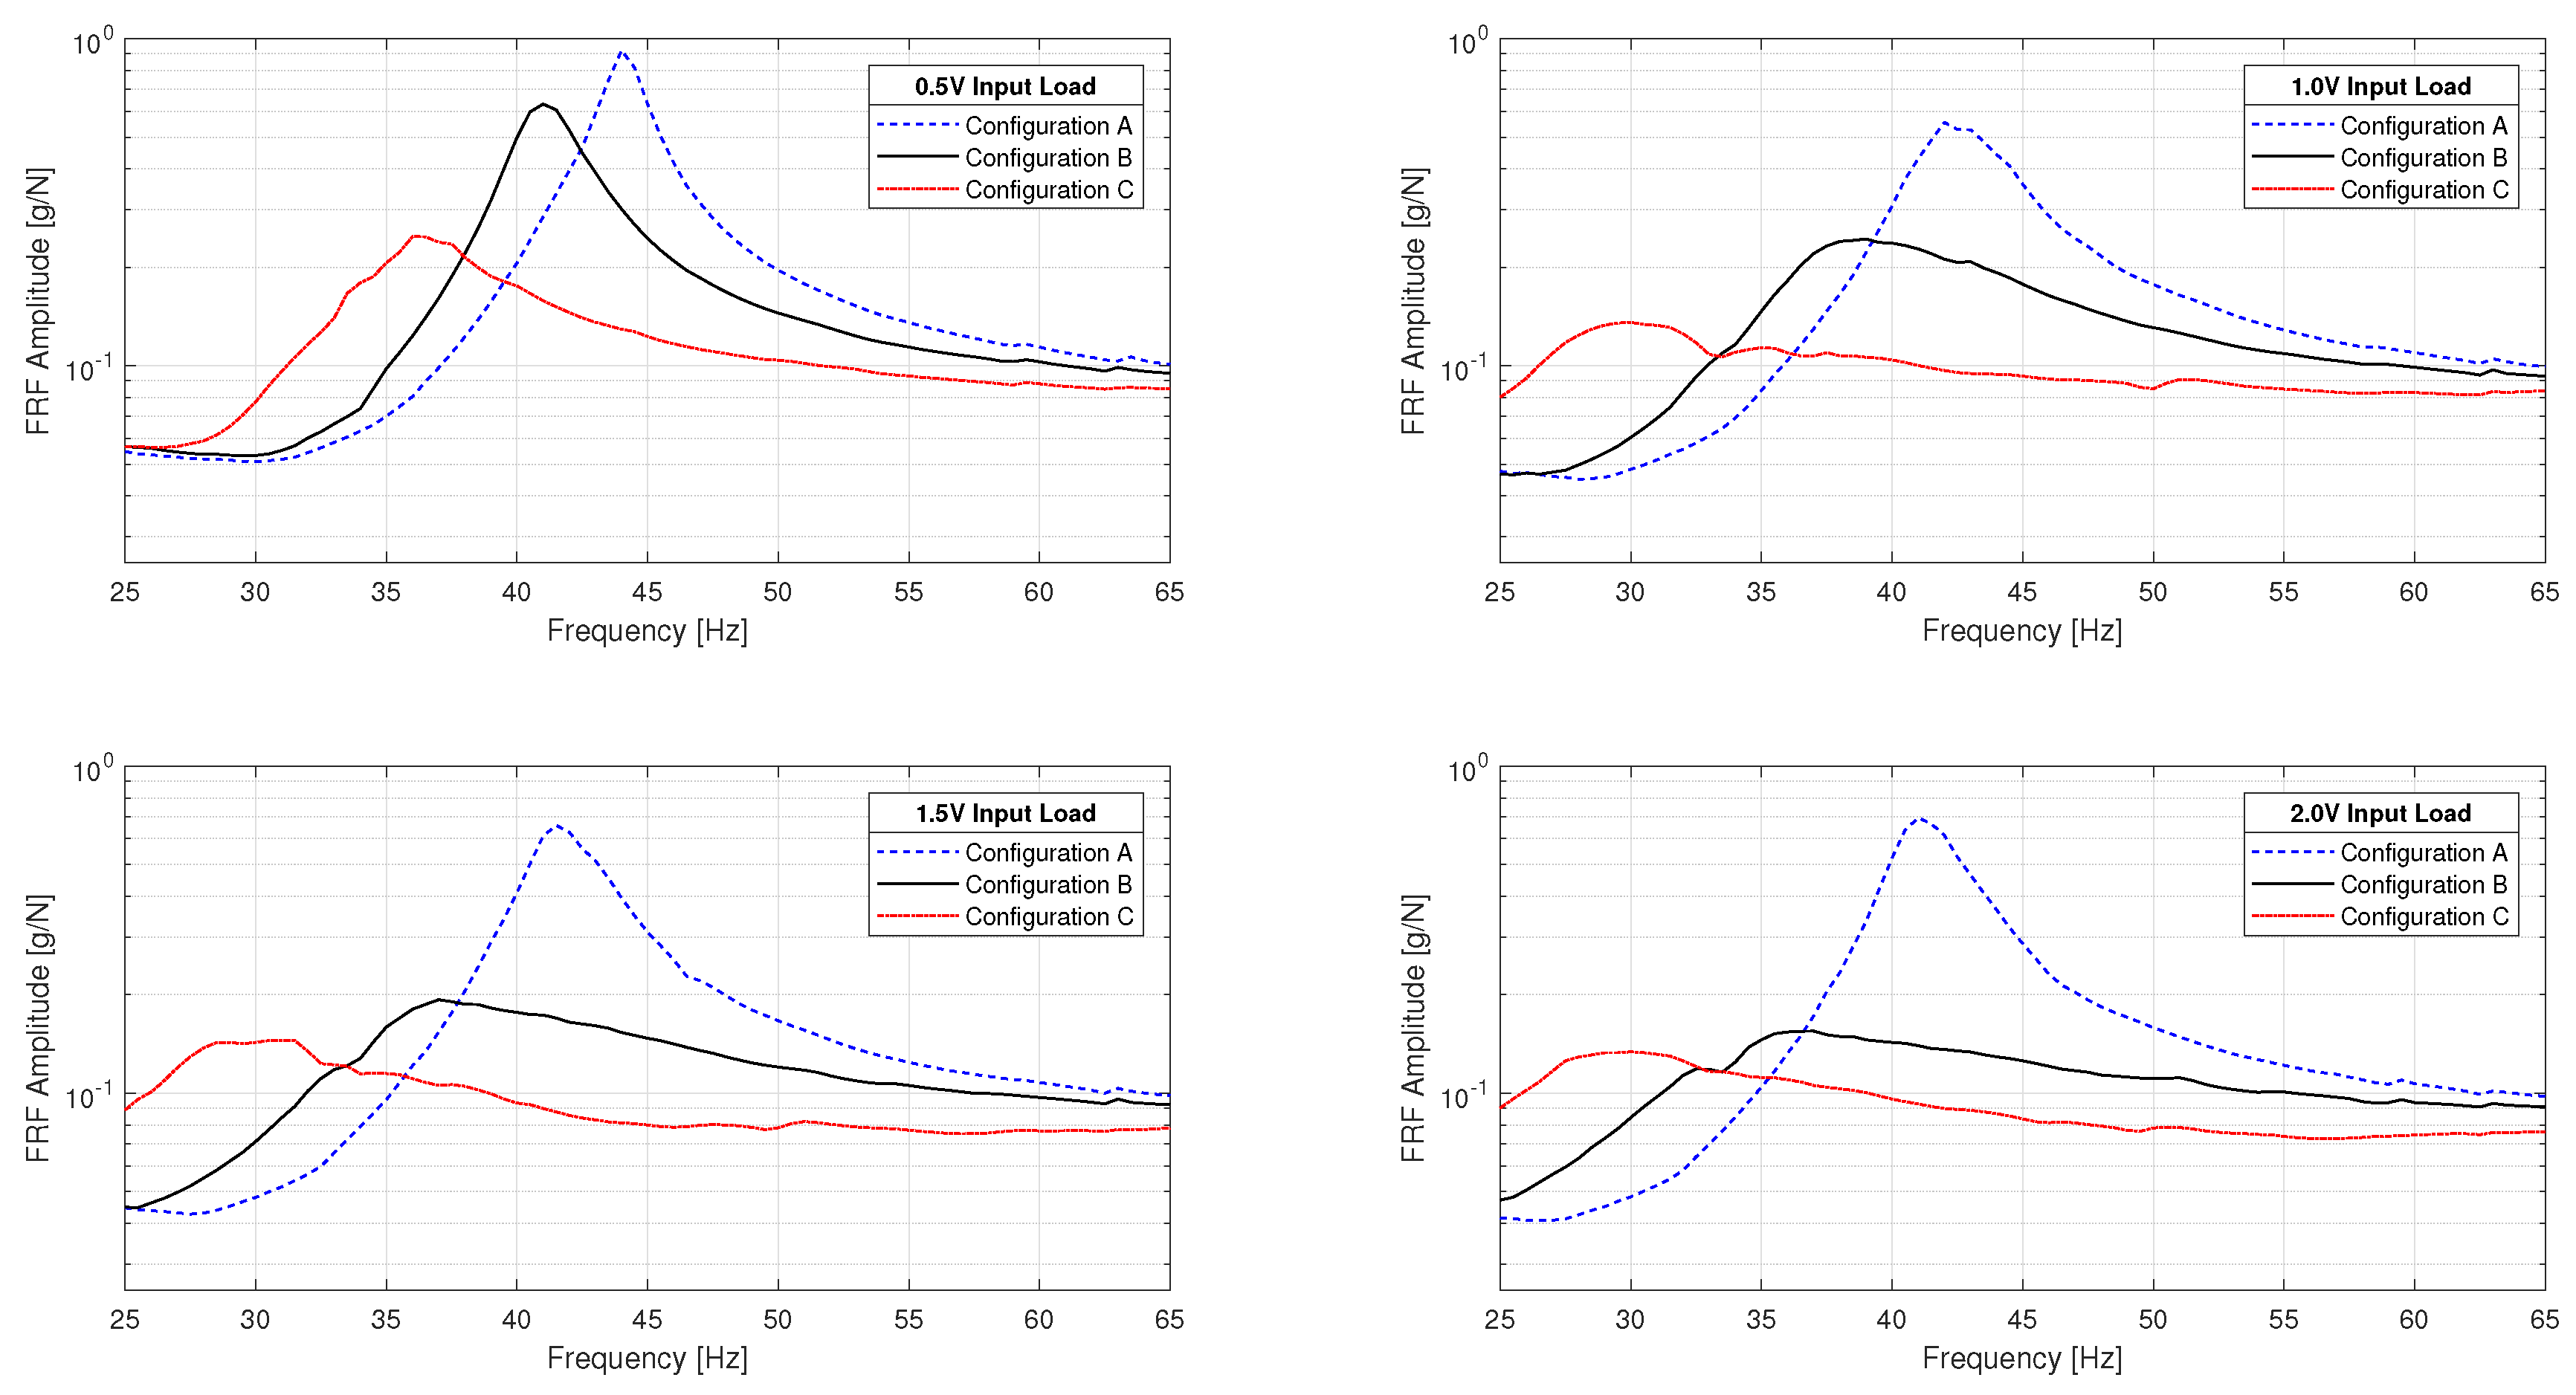
4.1. Experimental Results

Figure 5 depicts the FRF, summed up (The real part of this ‘sum’ is the average of the absolute values of the real parts of the individual FRFs, while the imaginary part is the average of the absolute values of the imaginary parts of the FRFs. Therefore, the positive and negative signs of the peaks for different points do not cancel out in the ‘sum’ [15].) over all the accelerometers, for configuration A (blue), B (black) and C (red) and this for all the different excitation levels. Note that the FRFs are given in g / N , whereby the force is related to the torque by a lever of 200 mm. As expected, the first torsional natural frequency decreases with decreasing clamping force or increasing excitation level [10]. Assuming that the total inertia of the system remains the same, the first torsional natural frequency decrease is caused by a reduced torsional stiffness of the shaft. Interestingly, the modal damping increases significantly because of an emerging relative sliding motion at the contact area.
An overview of the modal parameters of the first torsional natural mode is given in Table 3 for all tested configurations and this for all amplitude levels of both the sweep up and down excitation.
It was found that for each configuration a significant decrease in eigenfrequency can be seen for an increasing input excitation level. As expected, configurations B and C have a more pronounced influence because of the reduced, and even negligible, hub-to-shaft connection. For configuration C, the eigenfrequency remains even constant for the higher excitation levels due to the maximum reached SPF and hence the dominant role of the key connection stiffness. Besides, it is important to note that the damping values of around 3 % for configuration A are rather normal for an all steel coupling type configuration with a rigid hub-to-shaft connection. However, the damping values of configurations B and C, especially in the higher excitation range, are substantially larger than the damping values of configuration A. This means that configurations B and C exhibit a large relative sliding motion between the coupling hub and shaft. So, a disc coupling with a relatively loose hub-to-shaft connection can introduce a serious amount of torsional damping in the system which will have a significant impact on the eventual torsional dynamic response.
Moreover, when comparing the plots of the sweep up and down excitation for all configurations and excitation levels (Figure 6), no remarkable difference for configurations A and B on the response is revealed. Only configuration C shows a noticeable difference for the lower excitation range. Besides, a typical nonlinear jump phenomenon is not present. The dynamic excitation is still insufficient to overcome the static preload of the coupling.

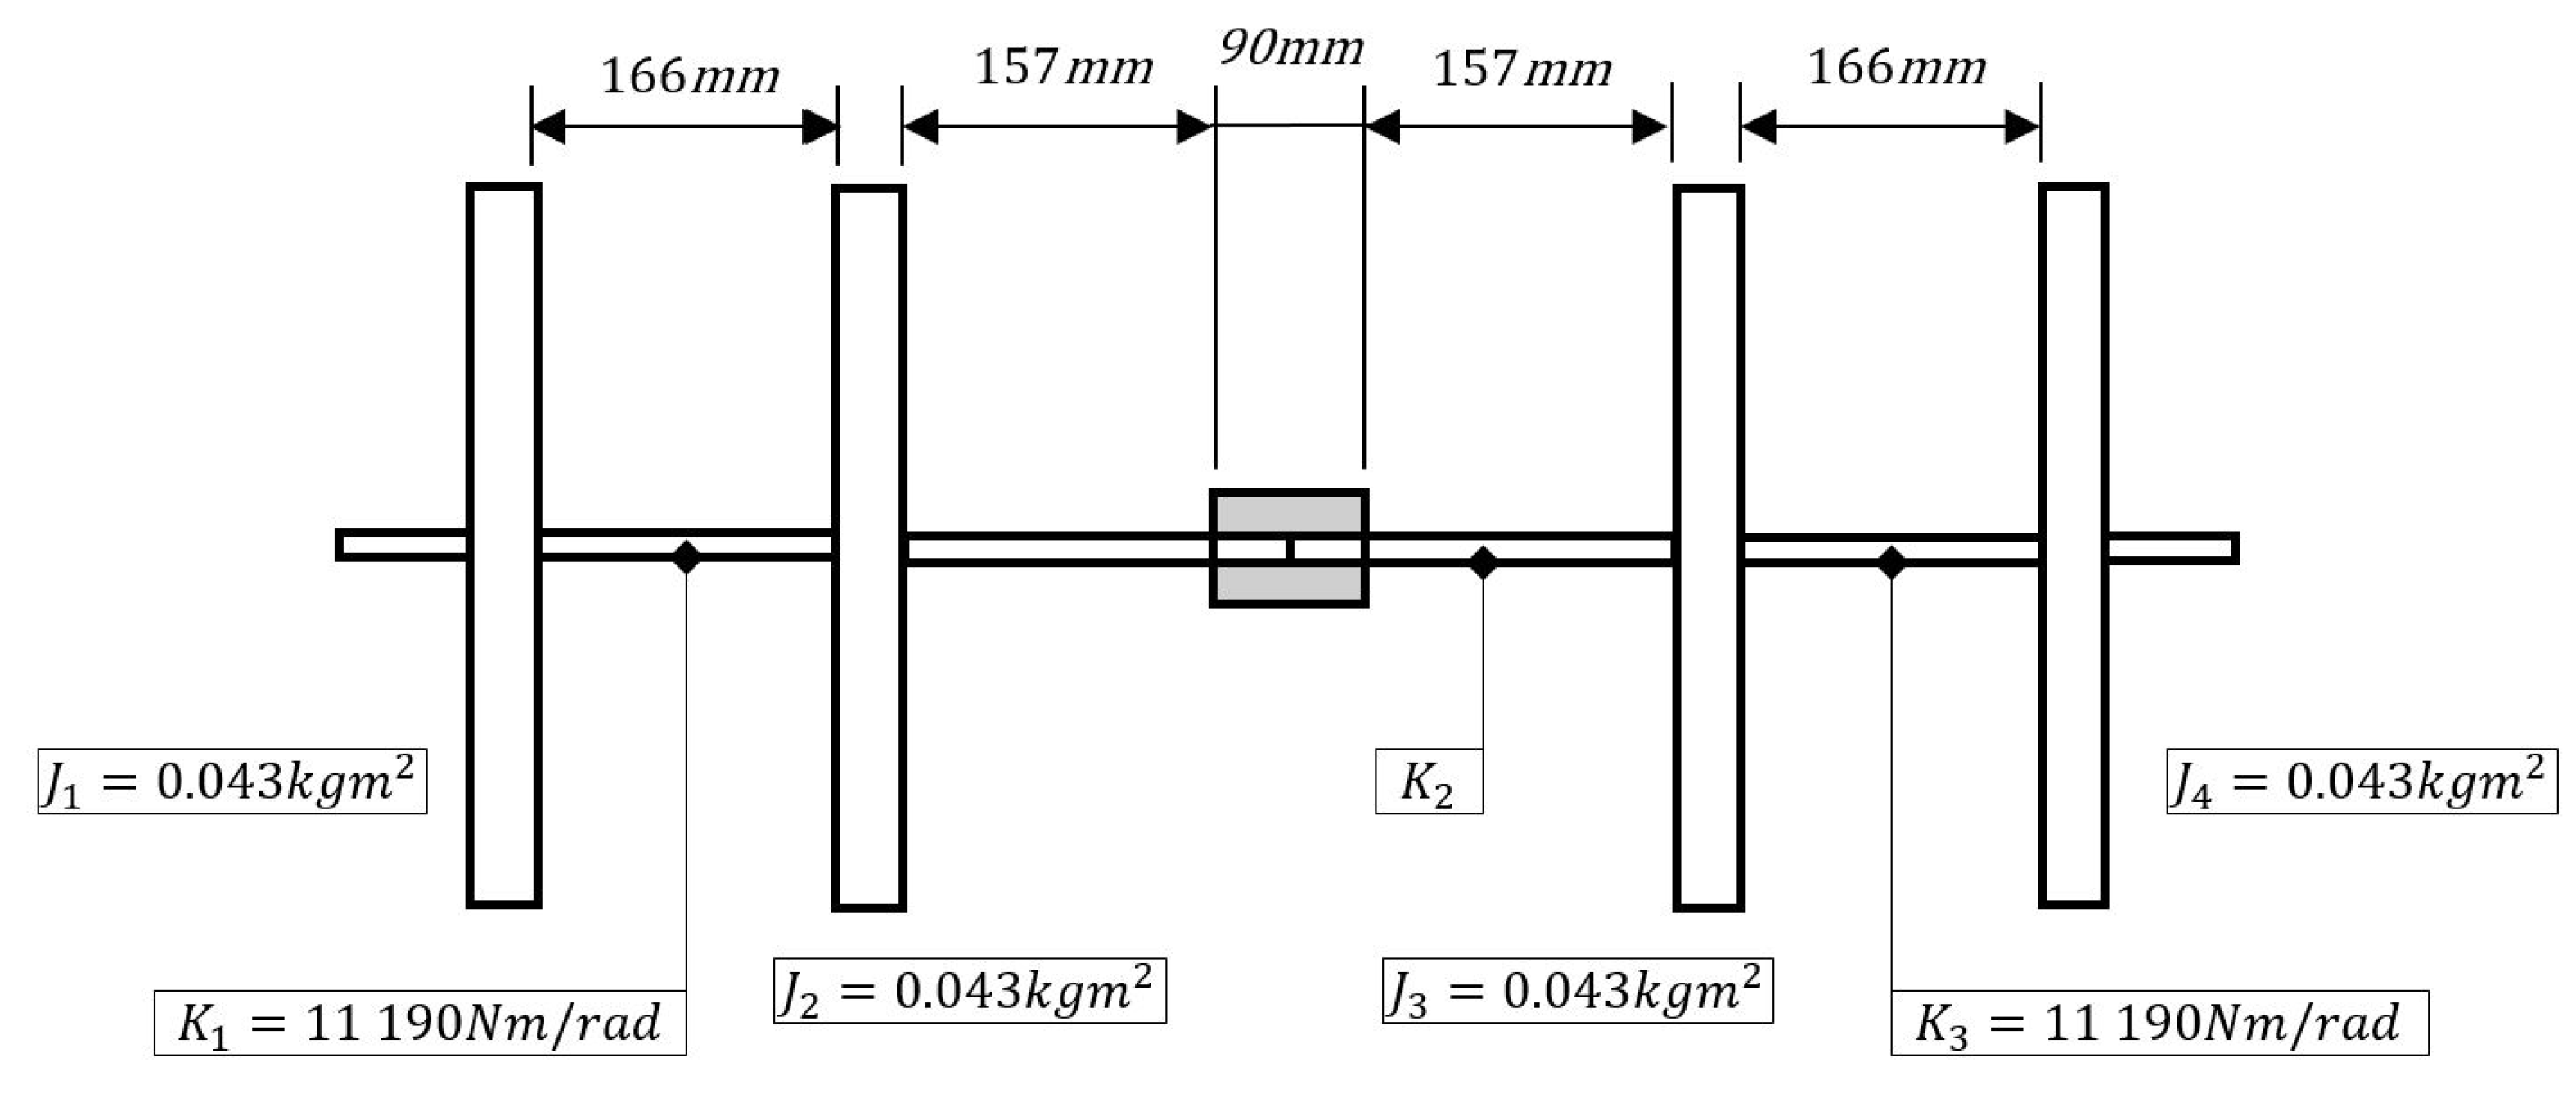
4.2. Analytical Verification of the Torsional Eigenfrequencies

Using Rivin’s algorithm [16], a reduced torsional model is developed which is able to estimate the first undamped torsional eigenfrequency of the proposed configurations of Section 3.2. Hence, the measurement results can be compared to the calculated first torsional eigenfrequency in order to verify the stiffness contribution of the SPF. A brief description of this model reduction technique can be found in Appendix B. In Figure 7, the initial model which is used to perform this analytical verification, is introduced.
Configuration A assumes an almost rigid hub-to-shaft connection, and thus the lower SPF limit. In order to facilitate the calculation, two assumptions are made. First, the coupling inertia is omitted as it is negligible compared to the cross-beam inertia terms. Second, the coupling stiffness is sufficiently larger than the adjacent shaft sections and can thus also be eliminated from the initial model. As a result, the obtained stiffness K 2 of the middle shaft section becomes 5916 Nm/rad. After performing the model reduction, the final model to estimate the first torsional eigenfrequency is exhibited in Figure 8.
The derived equivalent stiffness K 2 * yields 2876 Nm/rad. Hence, the outcome of the performed calculation according to Equation (1) features 41.2 Hz, which agrees well with the measurement results of Table 3 presented in Section 4.1.
f n = ω n 2 π = 1 2 π K 2 * 1 J 1 * + 1 J 4 *
Subsequently, the calculation is repeated for configuration C, which represent the upper SPF limit. As a result, the shaft section underneath the coupling hub is practically unrestrained. The additional length of the shaft needs to be taken into account in the torsional stiffness calculation. Note that because of the presence of a keyway at the shaft’s end, a reduced diameter is used for the calculation of the stiffness contribution of this section. The keyway accounts for a local weakening of the shaft underneath the coupling hub, whereby the internal force lines are concentrated and, consequently, the effective torque transmitting diameter is reduced to 16.5 mm by the depth of the keyway. Accordingly, the reduced model appears the same as in Figure 8, however, the equivalent stiffness value K 2 * drops to 2496 Nm/rad which causes the eigenfrequency to drop to 31.9 Hz. Again, this outcome resembles a good reflection of the obtained experimental results. Besides, when performing a reverse calculation based on the measurement result set from configuration B, a SPF of 1 / 3 of the coupling hub length is determined in case of the highest excitation level.
In general, the calculation results confirm the validity of the obtained measurement results of Section 4.1. Moreover, it has to be noted that a good approximation of the first torsional eigenfrequency can be obtained by using Rivin’s algorithm. However, in order to accurately calculate the torsional damping value, future work involves the development of a detailed torsional model which has to include the effect of the hub-to-shaft friction interface.

5. Conclusions

In this paper, an experimental study is carried out to determine the effect of the hub-to-shaft connection, and hence the SPF, on the torsional dynamic response. Accordingly, a novel academic test setup was developed and three different configurations, dedicated to a steel laminae coupling and with an altering SPF, were tested. Different amplitude levels, along with both a sweep up and down excitation, were applied to the setup so that their effect on the torsional response could be identified. The measurement results show that the choice of hub-to-shaft connection has a significant influence on the first torsional mode. By decreasing the hub-to-shaft connection, and thus increasing the SPF, a remarkable eigenfrequency drop, together with an equally notable damping increase, is observed. Also an increasing excitation level causes the same outcome. Conversely, the influence of the sweep up versus down excitation is less pronounced. Since the torsional dynamic response of a rotating machine is crucial, some uncertainties, like the damping, have to be identified to get a more profound insight in the overall dynamics. This paper tries to confront the reader with the large influence of the coupling hub-to-shaft connection on the damping of the first torsional mode. Consequently, future work on the development of accompanying calculation models will allow to estimate this substantial influence.

Author Contributions

All authors certify that they have participated sufficiently in the work to take public responsibility for the content, including participation in the concept, design, analysis, writing, or revision of the manuscript. More specifically, H.M. conducted the main research work through the conceptualization of the study, design and manufacturing of the test setup, performing the measurements, analyzing the data and justifying the measurement results with the calculations. Finally, H.M. wrote the manuscript. All other authors (B.V., D.M., P.G. and D.L.) analyzed the data and provided advice on the experimental part. Furthermore, the manuscript was critically revised for important intellectual content by the co-authors.

Funding

This research was funded by Flanders Innovation & Entrepreneurship Agency (VLAIO) (No.140751).

Conflicts of Interest

The authors declare no conflict of interest.

Abbreviations

The following abbreviations are used in this manuscript:
APIAmerican Petroleum Institute
FRFFrequency Response Function
PolyMAXPolyreference Least-Squares Complex Frequency-Domain Method
SPFShaft Penetration Factor

Appendix A. Instrumentation Data

A summary of the instrumentation data is given in Table A1, Table A2 and Table A3 for the used accelerometers, dynamic load cell and electrodynamic modal shaker, respectively. It has to be noted, however, that the reader is referred to the respective data sheet of the manufacturers for a more detailed overview.
Table A1. Technical specifications of accelerometers Dytran 3023A2H.
Dytran 3023A2H
TypeAccelerometer
GeneralWeight (g)4.0
Case MaterialTitanium
SealHermetic
PerformanceSensitivity (mV/g)10 (+15%/−10%)
Range (g) ± 500
Frequency Response (Hz)2 to 10,000 (+/−10%)
Element Natural Frequency (Hz)30,000
EnvironmentalMax. Shock (g pk)5000
Max. Vibration (g pk) ± 600
Temperature Range ( C)−51 to +160
Coeff. of Thermal Sensitivity (%/ C)0.015
Table A2. Technical specifications of the dynamic load cell Dytran 1051C.
Dytran 1051C
TypeDynamic Load Cell
GeneralWeight (g)32.0
Case MaterialStainless Steel
SealWelded/Expoxy
PerformanceSensitivity (pC/N)−80 ( ± 15 % )
Compression Range (kN)22.24
Max. Compression (kN)66.72
Tension Range (kN)2.22
Max. Tension (kN)4.45
EnvironmentalMax. Shock, unloaded (g pk)10,000
Max. Vibration, unloaded (g pk) ± 2500
Temperature Range ( C)−73 to +260
Coeff. of Thermal Sensitivity (%/ C)0.030
Table A3. Technical specifications of the electrodynamic shaker TMS 2100E11.
TMS 2100E11
TypeElectrodynamic Shaker
GeneralWeight (kg)15.0
Dimensions (L × W × H (mm 3 ))305 × 305 × 203
PerformanceOutput Force, sine pk (N)440
Output Force, random RMS (N)310
Stroke Length, pk-pk (mm)25.4
Frequency Range (Hz)2–5400
Max. Acceleration, sine pk (g)102
EnvironmentalOperating Range ( C)5 to 35
Continuous Operation (hours)8

Appendix B. Rivin’s Algorithm

In this section, Rivin’s algorithm [16] is presented in more detail. Figure A1 exemplifies the reduction technique by depicting an initial model, together with the ultimate reduced model.
Figure A1. Conceptualization of the model reduction method proposed by Rivin [16].
Machines 06 00031 g0a1
Inertia J n will be reduced to the two adjacent inertias according to the following equations:
J n 1 * = J n 1 + K i 1 K i 1 + K i J n
J n + 1 * = J n + 1 + K i K i 1 + K i J n
The equivalent stiffness term yields:
K i * = 1 K i 1 + 1 K i 1
The model reduction technique can be used for both straight, as well as branched, or even intermeshed drive systems.

References

  1. Mirošević, M. The Dynamics of Induction Motor Fed Directly from the Isolated Electrical Grid; InTech: London, UK, 2012; Chapter 3; pp. 73–98. [Google Scholar]
  2. Vance, J.; Zeidan, F.; Murphy, B. Machinery Vibration and Rotordynamics; John Wiley & Sons, Inc.: Hoboken, NJ, USA, 2010. [Google Scholar]
  3. American Petroleum Institute. Axial and Centrifugal Compressors and Expander-Compressors for Petroleum, Chemical and Gas Industry Services; API Standard 617; American Petroleum Institute: Washington, DC, USA, 2002. [Google Scholar]
  4. American Petroleum Institute. Tutorial on the API Standard Paragraphs Covering Rotor Dynamics and Balancing: An Introduction to Lateral Critical and Train Torsional Analysis and Rotor Balancing; Standard; American Petroleum Institute: Washington, DC, USA, 2005. [Google Scholar]
  5. Nestorides, E.J. A Handbook on Torsional Vibration; Cambridge University Press: Cambridge, UK, 1958. [Google Scholar]
  6. Wilson, W.K. Practical Solution of Torsional Vibration Problems; John Wiley & Sons, Inc.: Hoboken, NJ, USA, 1959. [Google Scholar]
  7. Wachel, J.C.; Szenasi, F.R. Analysis of Torsional Vibrations in Rotating Machinery. In Proceedings of the 22nd Turbomachinery Symposium, Dallas, TX, USA, 14–16 September 1993; Texas A&M University, Turbomachinery Laboratories: College Station, TX, USA, 1993. [Google Scholar]
  8. Adams, M.L. Rotating Machinery Vibration—From Analysis to Troubleshooting; Marcel Dekker, Inc.: New York, NY, USA, 2001. [Google Scholar]
  9. Walker, D.N. Torsional Vibration of Turbomachinery; McGraw-Hill: New York, NY, USA, 2003. [Google Scholar]
  10. Calistrat, M.M.; Leaseburge, G.G. Torsional Stiffness of Interference Fit Connections. In Proceedings of the Mechanisms Conference and International Symposium on Gearing and Transmissions, San Francisco, CA, USA, 11–12 October 1972. [Google Scholar]
  11. Vance, J.; French, R. Measurement of Torsional Vibration in Rotating Machinery. J. Mech. Transm. Autom. Des. 1984, 108, 565–577. [Google Scholar] [CrossRef]
  12. Murray, B.D.; Howes, B.C.; Chui, J.; Zacharias, V. Sensitivity of Torsional Analyses to Uncertainty in System Mass-Elastic Properties. In Proceedings of the First International Pipeline Conference, Calgary, AB, Canada, 9–13 June 1996; American Society of Mechanical Engineers: NewYork, NY, USA, 1996. [Google Scholar]
  13. Wang, Q.; Feese, T.D.; Pettinato, B.C. Torsional Natural Frequencies: Measurement vs. Prediction. In Proceedings of the Forty-First Turbomachinery Symposium, Houston, TX, USA, 12–15 September 2012; Texas A&M University, Turbomachinery Laboratories: College Station, TX, USA, 2012. [Google Scholar]
  14. Peeters, B.; Van der Auweraer, H.; Guillaume, P.; Leuridan, J. The PolyMAX Frequency-Domain Method: A New Standard for Modal Parameter Estimation? Shock Vib. 2004, 11, 395–409. [Google Scholar] [CrossRef]
  15. Siemens PLM Software. LMS TestLab Modal Analysis; Siemens PLM Software: Plano, TX, USA, 2015. [Google Scholar]
  16. Rivin, E.I. Method and Means for Enhancement of Beam Stiffness. U.S. Patent No. 5,533,309, 9 July 1996. [Google Scholar]
Figure 1. Configuration of a multistage centrifugal blower.
Machines 06 00031 g001
Figure 2. Coupling shaft penetration assumption for a SPF = 1 / 3 .
Machines 06 00031 g002
Figure 3. (a) Technical drawing & (b) picture of the novel test rig.
Machines 06 00031 g003
Figure 4. Overview of the test setup with all dimensions, inertia values, sensor locations and used measurement equipment. The exact positions and used nomenclature for the accelerometers are indicated in blue.
Machines 06 00031 g004
Figure 5. Comparison of configuration A, B and C for the sweep up excitation with an amplitude level of 15 N (or 0.5 V) (top left), 30 N (or 1V) (top right), 45 N (or 1.5 V) (bottom left) and 60 N (or 2 V) (bottom right).
Machines 06 00031 g005
Figure 6. Comparison of the sweep up and down excitation for each amplitude level for configuration A (top), B (middle) and C (bottom).
Machines 06 00031 g006
Figure 7. Schematic representation of the initial model to perform the analytical calculation of the first torsional eigenfrequency.
Machines 06 00031 g007
Figure 8. Schematic representation of the reduced model using Rivin’s algorithm [16] for the analytical calculation of the first torsional eigenfrequency.
Machines 06 00031 g008
Table 1. Overview of the test rig dimensions.
Dimensions
Setup EnvelopeL × W × H (mm 3 ) *1250 × 1000 × 550
Shaft SectionsDiameter (mm)20
Length (mm)545
Bearing Location 1 from Shaft End (mm)252.5
Bearing Location 2 from Shaft End (mm)536.5
Cross-BeamsL × W × H (mm 3 ) *500 × 20 × 20
Position E wrt center axis (mm) **100, 150, 200
Position F wrt center axis (mm) **100, 150, 200
Spring SystemSpring Rate (N/mm)2.13
Max. Force (N)328.4
Travel of slots (mm)280
* Length × Width × Height. ** Positions of Figure 4.
Table 2. Overview of the measurement parameters.
Measurement Parameters
Swept SineMin. Frequency (Hz)25
Max. Frequency (Hz)65
Frequency Resolution (Hz)0.5
Sweep Mode (-)Linear
Sweep Rate, Fixed (Hz/sec)0.3
Number of Sweeps (-)3
Data-AcquisitionFRF Estimator (-)H1
Max. FRF Sampling Rate (Hz)200
Table 3. Overview of the estimated modal parameters of configurations A–C for both sweep up and down excitation and this for all amplitude levels.
Configuration AConfiguration BConfiguration C
Sweep Up
Excitation
Eigenfrequency (Hz)Damping
Value (%)
Eigenfrequency (Hz)Damping
Value (%)
Eigenfrequency (Hz)Damping
Value (%)
15 N (0.5 V)43.91.7640.93.3835.38.33
30 N (1.0 V)42.03.6338.511.7828.715.59
45 N (1.5 V)41.43.1336.711.8228.614.63
60 N (2.0 V)40.73.0935.416.6328.715.57
Sweep Down
Excitation
15 N (0.5 V)44.01.9841.23.3233.312.43
30 N (1.0 V)42.03.7538.48.4628.913.18
45 N (1.5 V)41.63.1737.011.9728.913.67
60 N (2.0 V)41.02.9435.914.9528.815.40

