Article

Ultrasound Entropy Imaging Based on the Kernel Density Estimation: A New Approach to Hepatic Steatosis Characterization

1
Department of Biomedical Engineering, Faculty of Environment and Life, Beijing University of Technology, Beijing 100124, China
2
Department of Medical Imaging and Radiological Sciences, College of Medicine, Chang Gung University, Taoyuan 333323, Taiwan
3
Research Center for Radiation Medicine, Chang Gung University, Taoyuan 333323, Taiwan
4
Division of Pediatric Gastroenterology, Department of Pediatrics, Chang Gung Memorial Hospital at Linkou, Taoyuan 333423, Taiwan
5
Department of Gastroenterology and Hepatology, Chang Gung Memorial Hospital at Linkou, Chang Gung University, Taoyuan 333423, Taiwan
*
Authors to whom correspondence should be addressed.
These authors contributed equally to this work and share first authorship.
Diagnostics 2023, 13(24), 3646; https://doi.org/10.3390/diagnostics13243646
Submission received: 3 November 2023 / Revised: 28 November 2023 / Accepted: 11 December 2023 / Published: 12 December 2023
(This article belongs to the Section Medical Imaging and Theranostics)

Abstract

:
In this paper, we present the kernel density estimation (KDE)-based parallelized ultrasound entropy imaging and apply it for hepatic steatosis characterization. A KDE technique was used to estimate the probability density function (PDF) of ultrasound backscattered signals. The estimated PDF was utilized to estimate the Shannon entropy to construct parametric images. In addition, the parallel computation technique was incorporated. Clinical experiments of hepatic steatosis were conducted to validate the feasibility of the proposed method. Seventy-two participants and 204 patients with different grades of hepatic steatosis were included. The experimental results show that the KDE-based entropy parameter correlates with log10 (hepatic fat fractions) measured by magnetic resonance spectroscopy in the 72 participants (Pearson’s r = 0.52, p < 0.0001), and its areas under the receiver operating characteristic curves for diagnosing hepatic steatosis grades ≥ mild, ≥moderate, and ≥severe are 0.65, 0.73, and 0.80, respectively, for the 204 patients. The proposed method overcomes the drawbacks of conventional histogram-based ultrasound entropy imaging, including limited dynamic ranges and histogram settings dependence, although the diagnostic performance is slightly worse than conventional histogram-based entropy imaging. The proposed KDE-based parallelized ultrasound entropy imaging technique may be used as a new ultrasound entropy imaging method for hepatic steatosis characterization.

1. Introduction

Nonalcoholic fatty liver disease (NAFLD) affects 25% of the global population and has become the most common cause of chronic liver disease in the world [1]. NAFLD has the updated names of metabolic dysfunction-associated fatty liver disease (MAFLD) [2] or metabolic dysfunction-associated steatotic liver disease (MASLD) [3]. Hepatic steatosis is a key manifestation of NAFLD, MAFLD, or MASLD. Currently, liver biopsy is still the golden standard for diagnosing hepatic steatosis. However, liver biopsy is invasive and may cause sampling errors and complications.
Ultrasound is a first-line diagnostic tool for the assessment and management of hepatic steatosis. However, the commonly used ultrasound B-mode imaging technique is qualitative and only uses the amplitude information of the envelopes of ultrasound backscattered signals. Quantitative ultrasound extracts quantified frequency, phase, or statistical information from ultrasound backscattered signals [4,5,6] and can be a complement to conventional ultrasound B-mode imaging.
Ultrasound backscatter envelope statistics parametric imaging is an important form of quantitative ultrasound [7,8,9]. These techniques can be classified into model-based and non-model-based ones. Typical model-based techniques are ultrasound Nakagami imaging [10,11,12,13] and homodyned-K imaging [14,15] that are based on the generalized statistical models of backscatter envelopes. Ultrasound entropy imaging uses the information-theoretic entropy of ultrasound backscatter envelopes, without a perquisite for satisfying a specific statistical model [9], which is of growing research interest in the field of quantitative ultrasound.
Currently, the Shannon entropy is the mostly studied entropic imaging method for ultrasound tissue characterization [9,11,16,17,18,19,20,21], as it is a well-suited method for quantifying ultrasound signal uncertainty or complexity. A histogram-based method is usually used to estimate the probability of gated ultrasound backscattered signals, which is then used to estimate the Shannon entropy [9]. Conventional histogram-based ultrasound entropy imaging has been used for the ultrasound characterization of different tissues [9], including a hepatic steatosis assessment [16]. The literature survey shows that ultrasound Shannon entropy imaging is the mostly used entropic imaging approach for characterizing biological tissues, and histogram-based methods are the dominant estimators for ultrasonic Shannon entropy [9,11,16,17,18,19,20,21]. However, conventional histogram-based ultrasound entropy imaging is affected by histogram settings, such as the number of histogram bins, and has a limited dynamic range, as demonstrated in our previous work [16].
In this paper, we propose the kernel density estimation (KDE)-based ultrasound Shannon entropy imaging technique to overcome the drawbacks of conventional histogram-based ultrasound Shannon entropy imaging and apply it to a hepatic steatosis assessment. A KDE technique is used to estimate the probability density function (PDF) of gated ultrasound backscattered signals. The estimated PDF is then used to estimate the Shannon entropy to construct parametric images. In addition, we incorporated the parallel computation technique we recently introduced for ultrasound homodyned-K imaging [22] into the KDE-based ultrasound entropy imaging. The clinical data for hepatic steatosis are used to validate the feasibility of the proposed KDE-based parallelized ultrasound entropy imaging method. The major contributions of this study are as follows.
(1)
To the best of our knowledge, this study is the first to propose KDE-based ultrasound Shannon entropy imaging, which overcomes the drawbacks of conventional histogram-based ultrasound Shannon entropy imaging methods.
(2)
Parallelized computation techniques are incorporated to speed up the proposed algorithm.
(3)
Clinical validations of hepatic steatosis evaluation are performed.

2. Materials and Methods

2.1. KDE-Based Shannon Entropy Estimation of Ultrasound Backscattered Signals

For a variable, X, the information-theoretic Shannon entropy, E, is defined as:
E ( X ) = i = 1 n p ( x i ) log 2 [ p ( x i ) ] ,
where p(xi) denotes the probability that X is in the state xi, n is the number of states, and p ( x i ) log 2 [ p ( x i ) ] is defined as 0 if p(xi) = 0.
In the context of ultrasound backscattered signals, the information-theoretic entropy is a quantitative measure of signal uncertainty or complexity. The Shannon entropy of ultrasound backscattered signals is usually estimated by Equation (1), with statistical histograms used for the probability estimation [16]. However, the histogram-based entropy estimate of the ultrasound backscattered signals, denoted by Ehist, was affected by histogram settings, such as the number of histogram bins [16]. Furthermore, Ehist was found to have limited dynamic ranges in previous ultrasound entropy imaging studies [16].
To overcome the shortcomings of the histogram-based entropy estimation, we considered non-parametric KDE techniques to estimate the PDF of ultrasound backscattered signals and used the estimated PDF to estimate the entropy. For a continuous random variable, Y, with a PDF f(y), the Shannon entropy is defined as [23,24]:
E ( Y ) = f ( y ) ln f ( y ) d y M [ ln f ( y ) ] ,
where M[.] is the statistical mean operation. Then, for a discrete random variable, Z, with N samples, the Shannon entropy can be estimated by [24,25]:
E ( Z ) = M [ ln f ( z ) ] = 1 N i = 1 N ln f ( Z i ) ,
where f(z) is the PDF estimated by the KDE methods [25]:
f ( z ) = 1 N h i = 1 N K z Z i h ,
where h is the bandwidth parameter and K(.) is a kernel function. In this study, we used the Gaussian kernel function:
K ( v ) = exp ( v 2 / 2 ) / 2 π .
The reason why we selected the Gaussian kernel function is discussed in the Section 4. The KDE-based entropy estimate of the ultrasound backscattered signals, denoted by EKDE, was obtained by Equations (3)–(5):
In this study, the bandwidth parameter, h, was calculated adaptively, based on a one-dimensional signal, S, using Scott’s method [26]:
h = β 4 N ( d + 2 ) 1 d + 4 ,
where N is the length of the signal, S; d is the dimension of S, d = 1; and β is a coefficient that is adaptively calculated by the mean absolute deviation of S:
β = E [ | S E [ S ] | ]
where E[.] is the expectation operator. It can be seen that the bandwidth parameter, h, is a function of the input signal, S. In this work, h did not need to be set specifically; instead, it was automatically calculated based on S.

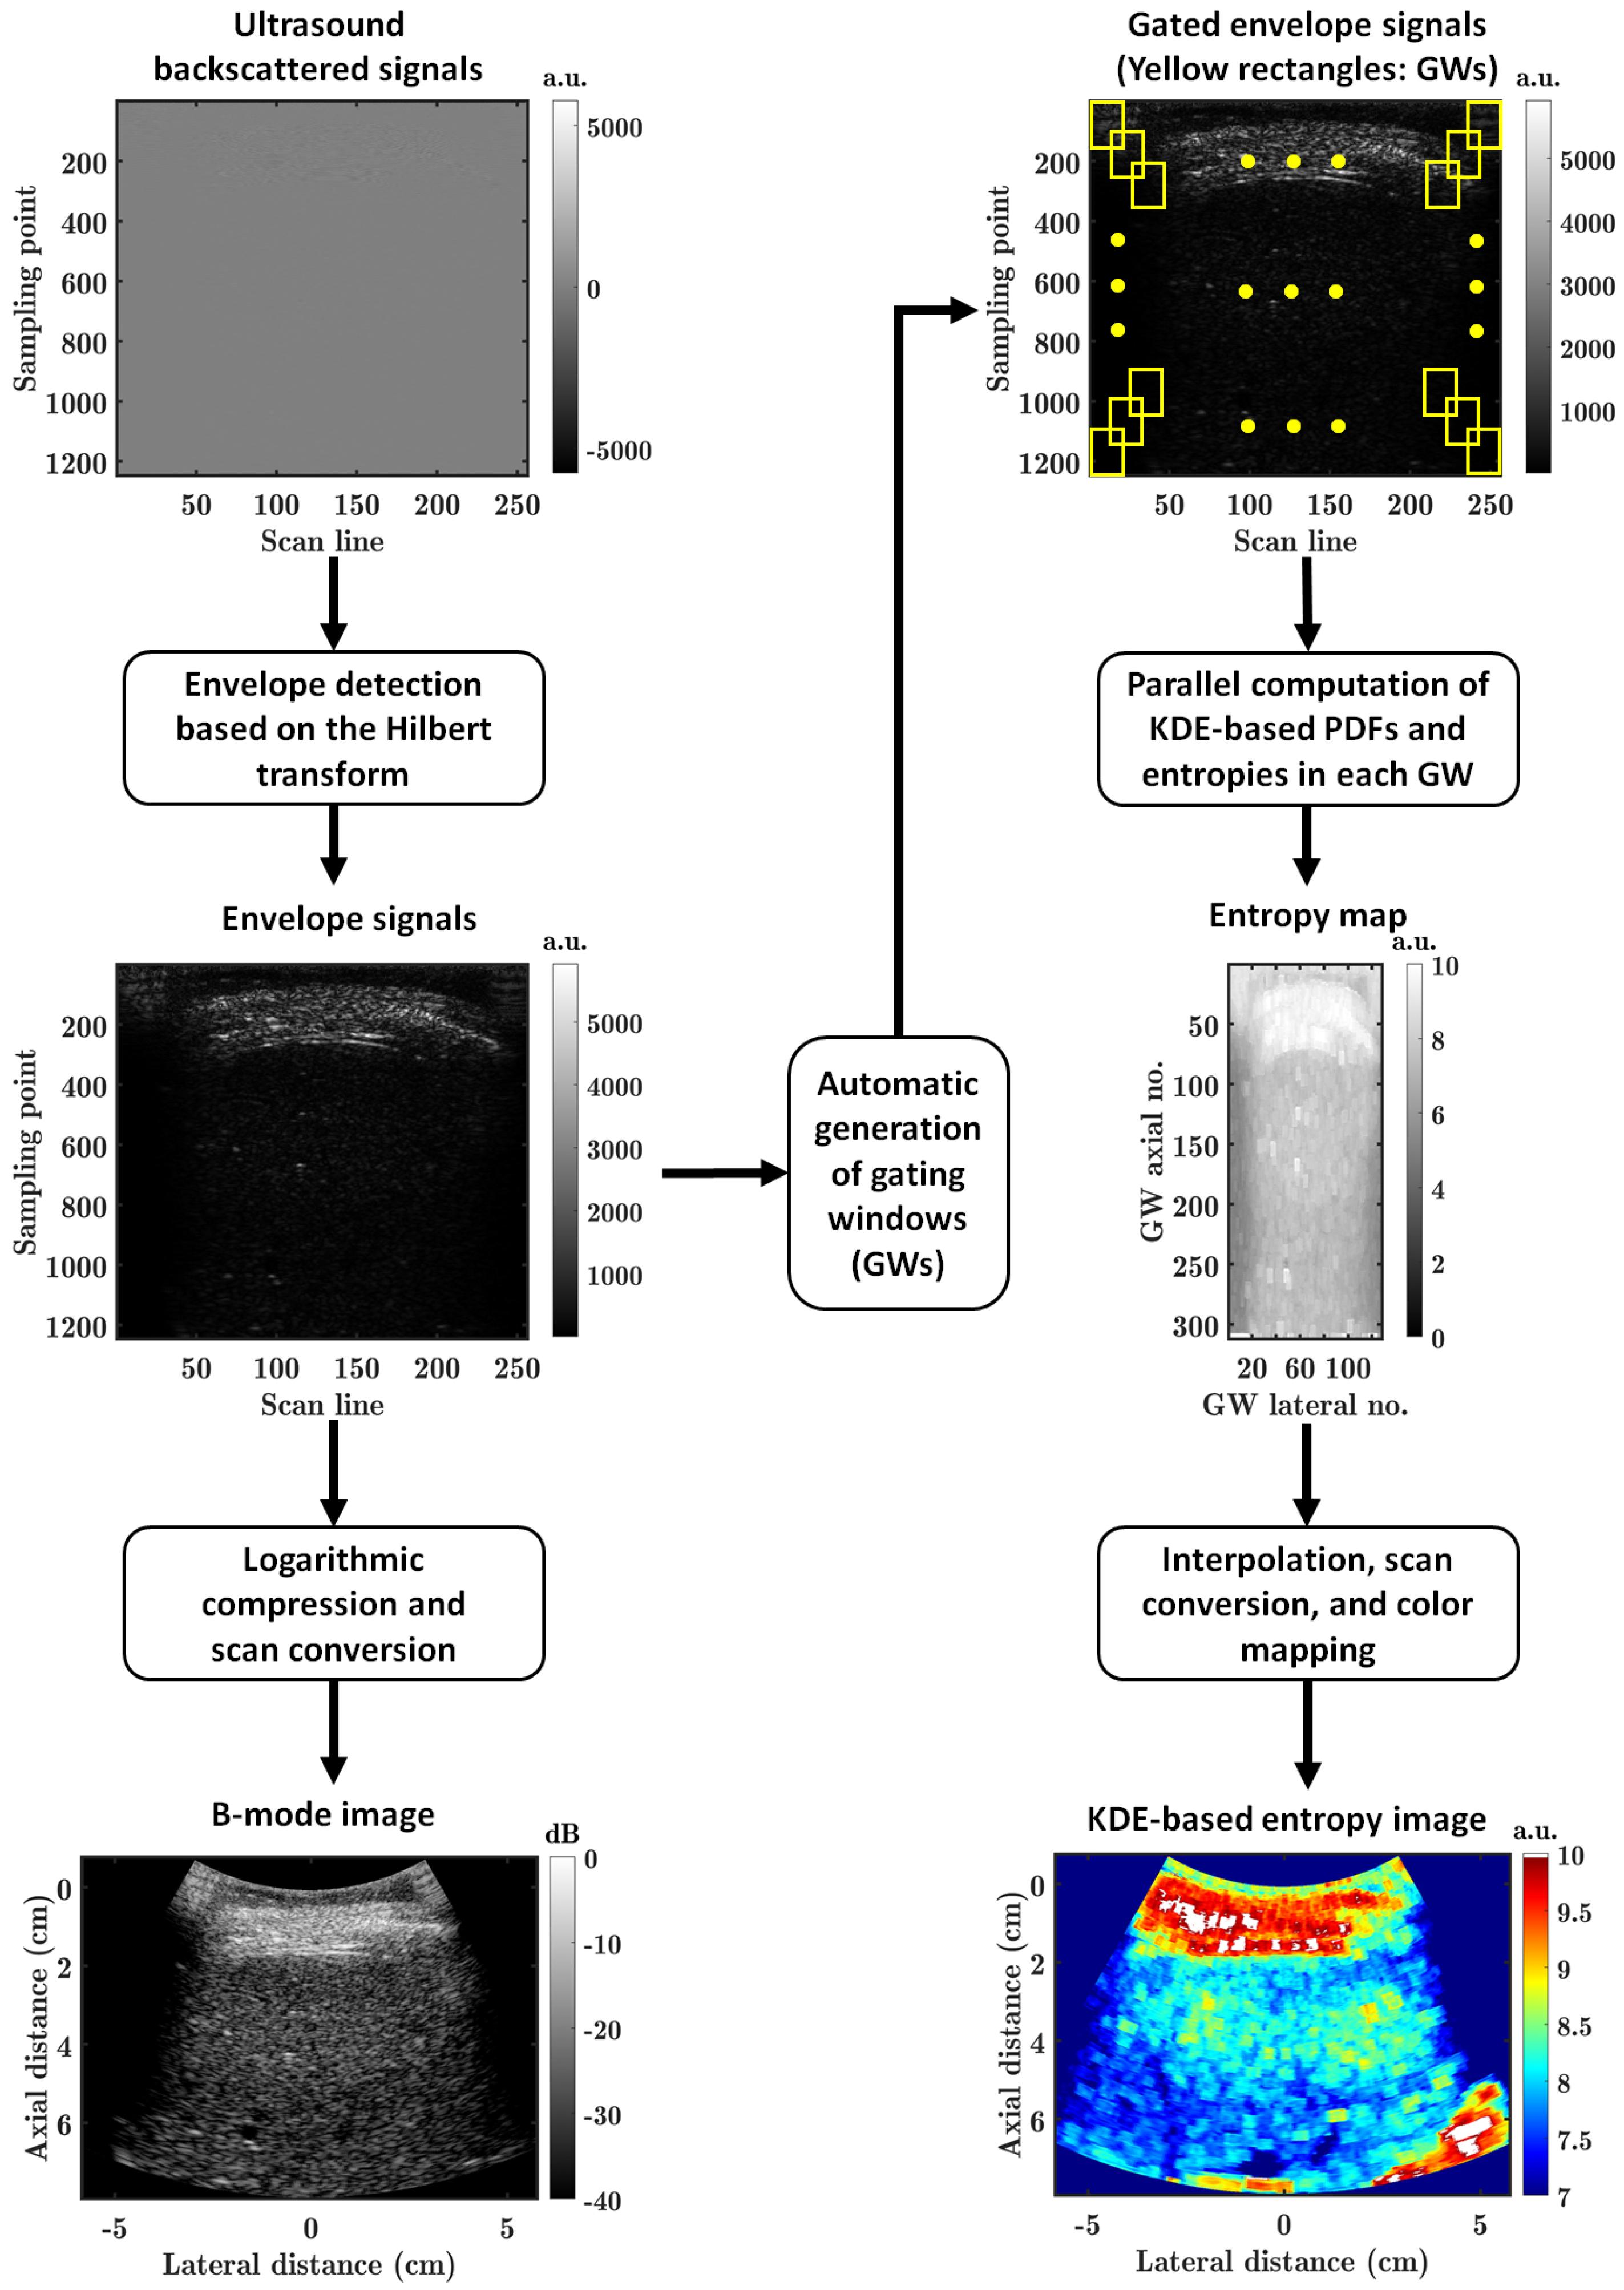
2.2. KDE-Based Parallelized Ultrasound Shannon Entropy Imaging Method

The parametric imaging of KDE-based entropy estimates of ultrasound backscattered signals, i.e., EKDE parametric imaging, was proposed in this study. In addition, we incorporated the parallel computation technique proposed in our previous work [22] for the algorithmic acceleration of ultrasound homodyned-K imaging.
Figure 1 shows the flowchart of the KDE-based parallelized ultrasound entropy imaging method proposed in this work. For an input frame of ultrasound backscattered signals, a frame of envelope signals was obtained by envelope detection based on the Hilbert transform. Then, logarithmic compression and scan conversion were performed on the frame of envelope signals to obtain an ultrasound B-mode image.
For quantitative ultrasound imaging, a sliding window technique was frequently used in the previous work [16], where a gating window was slid across the entire frame of envelope signals, with an overlap ratio (lateral × axial) between two adjacent gating windows. The quantitative ultrasound parameters were then estimated for each gating window, respectively. This generally required two nested loops in the algorithmic implementation, which was computationally inefficient, especially when the computational complexity of the quantitative ultrasound parameter estimation was high.
In this work, we introduced, for the first time, a parallel computation [22] into the ultrasound entropy imaging method to improve the time efficiency. Firstly, a series of gating windows were automatically generated in the frame of envelope signals, indicated by the yellow rectangles in Figure 1. Secondly, a parallel computation of KDE-based PDFs and entropies was performed on the gated ultrasound backscattered signals in each gating window, and an entropy map was created. Each pixel of the entropy map corresponded to a KDE-based entropy estimate, EKDE, in a gating window. Finally, two-dimensional (2D) image interpolation, scan conversion, and color mapping were conducted on the entropy map to obtain the KDE-based ultrasound entropy image. The 2D image interpolation was performed because the entropy map had a size smaller than the size of the original backscattered RF signals (Figure 1), and the entropy map was resized to the same size of the original RF signals using an interpolation algorithm.

2.3. Clinical Validations

To validate the feasibility of the proposed KDE-based parallelized ultrasound entropy imaging method, the ultrasound backscattered radiofrequency (RF) signals of hepatic steatosis used in our previous work [27] were included. This study was approved by the Institutional Review Board of Chang Gung Memorial Hospital in Taiwan to revisit the clinical data for the signal analysis. Informed consent was obtained from all the participants. The RF signals included two groups. In group I, the RF signals were acquired from 72 liver donors, with the hepatic fat fraction (HFF) measured by magnetic resonance spectroscopy (MRS) as the reference standard of the hepatic steatosis evaluation. Group II included 204 patients with chronic hepatitis B, for which liver biopsy was used as the reference standard. For these patients, the liver specimen was obtained from the right liver lobe through an intercostal approach with the guidance of ultrasound imaging. All the specimens were placed in formalin and sent to the Department of Pathology, Chang Gung Memorial Hospital, Linkou, Taiwan, for a histological examination. The samples were fixed in paraffin and stained with hematoxylin–eosin, which were read on-site by expert liver pathologists. Those samples having a minimum of six portal tracts were considered suitable for a histologic evaluation [28]. According to Brunt et al. [29], hepatic steatosis grades were classified into G0 (steatosis involving < 5% of hepatocytes), G1 (steatosis involving 5%–32.99% of hepatocytes), G2 (steatosis involving 33%–66% of hepatocytes), and G3 (steatosis involving > 66% of hepatocytes), corresponding to normal liver, mild steatosis, moderate steatosis, and severe steatosis, respectively. The RF signals were determined with an ultrasound scanner (Model 3000, Terason, Burlington, MA, USA) with a convex-array transducer (Model 5C2A, Terason). The transducer had a central frequency of 3 MHz and a pulse length (PL) of ~2.3 mm. The sampling frequency of the ultrasound imaging system was 12 MHz.

2.4. Clinical Ultrasound Backscattered Signal Processing Method

For an input frame of the ultrasound backscattered RF signals, envelope signals were detected by using the Hilbert transform. The detected envelope signals were utilized to construct ultrasound B-mode and KDE-based entropy (i.e., EKDE) images (Figure 1). The gating window was sized to 1 PL × 1 PL, i.e., 2.3 mm × 2.3 mm (lateral × axial), as the ultrasound entropy imaging method supported a small gating window [16]. The dynamic range of the ultrasound B-mode imaging was set to 40 dB. The overlap ratio was set to 90% × 90% (lateral × axial) [22], as the parallel computation technique we incorporated supported a higher parametric imaging resolution and a faster computation result at the same time. For the sake of comparison, the conventional histogram-based entropy (i.e., Ehist) imaging was analyzed with the same procedure and settings as EKDE parametric imaging, except that the entropy was estimated using a histogram-based method and that a different color mapping technique was used as the dynamic range was lower. The number of histogram bins of 40 was used for Ehist parametric imaging [16]. A quantitative evaluation was performed by manually delineating a liver region of interest (ROI) on an ultrasound B-mode image [27]. The delineated ROI was applied to the Ehist and EKDE parametric images corresponding to the B-mode image to calculate the mean parametric image pixel values for the ROI. The dynamic range, DR, of the Ehist and EKDE estimates for the liver ROI was calculated by DR = EmaxEmin, where Emax and Emin were the maximum and minimum values of the entropy estimates for the liver ROI, respectively. All the signal processing procedures were performed using MATLAB software (version 2020a, The MathWorks, Natick, MA, USA). The MATLAB subroutine Hilbert() was used for the envelope detection of ultrasound backscattered signals. The MATLAB subroutine histcounts() was utilized for the histogram-based probability estimation of ultrasound backscattered signals. The MATLAB subroutine ksdensity() was utilized for the KDE-based PDF estimation of the ultrasound backscattered signals.
The MATLAB subroutine blockproc() was used for the parallel computation of the ultrasound entropy images. A frame of uncompressed envelope signals, ENVs, was automatically divided into several blocks. The number of blocks was determined by the block size (BS) in the axial and lateral directions, BSaxial × BSlateral, and by the block overlap (BO) in the axial and lateral directions, BOaxial × BOlateral. Then, the parallelized computation of the entropy parameter matrix, ENT, in all the blocks was conducted using the subroutine blockproc(), i.e., ENT = blockproc(ENV, [m, n], @(block_struct) blockEnt(block_struct), ‘BorderSize’, [v, w], ‘UseParallel’, true, ‘TrimBorder’, false), where v = floor(BSaxial * BOaxial/2); w = floor(BSlateral * BOlateral/2); m = BSaxial − 2*v; n = BSlateral − 2*w; block_struct is a structure defined in MATLAB; and blockEnt() is a callback function for estimating the entropy parameter of one block using the KDE estimator or conventional histogram-based entropy estimator. It can be seen that parallelization and the communication between parallelized blocks were automatically conducted by the blockproc() subroutine. The blockproc() subroutine extracted each block from the envelope signals, ENVs, passed it to the callback function blockEnt(), and assembled the returned blocks to obtain the matrix of the estimated values of the entropy parameters (i.e., ENT).

2.5. Statistical Analysis
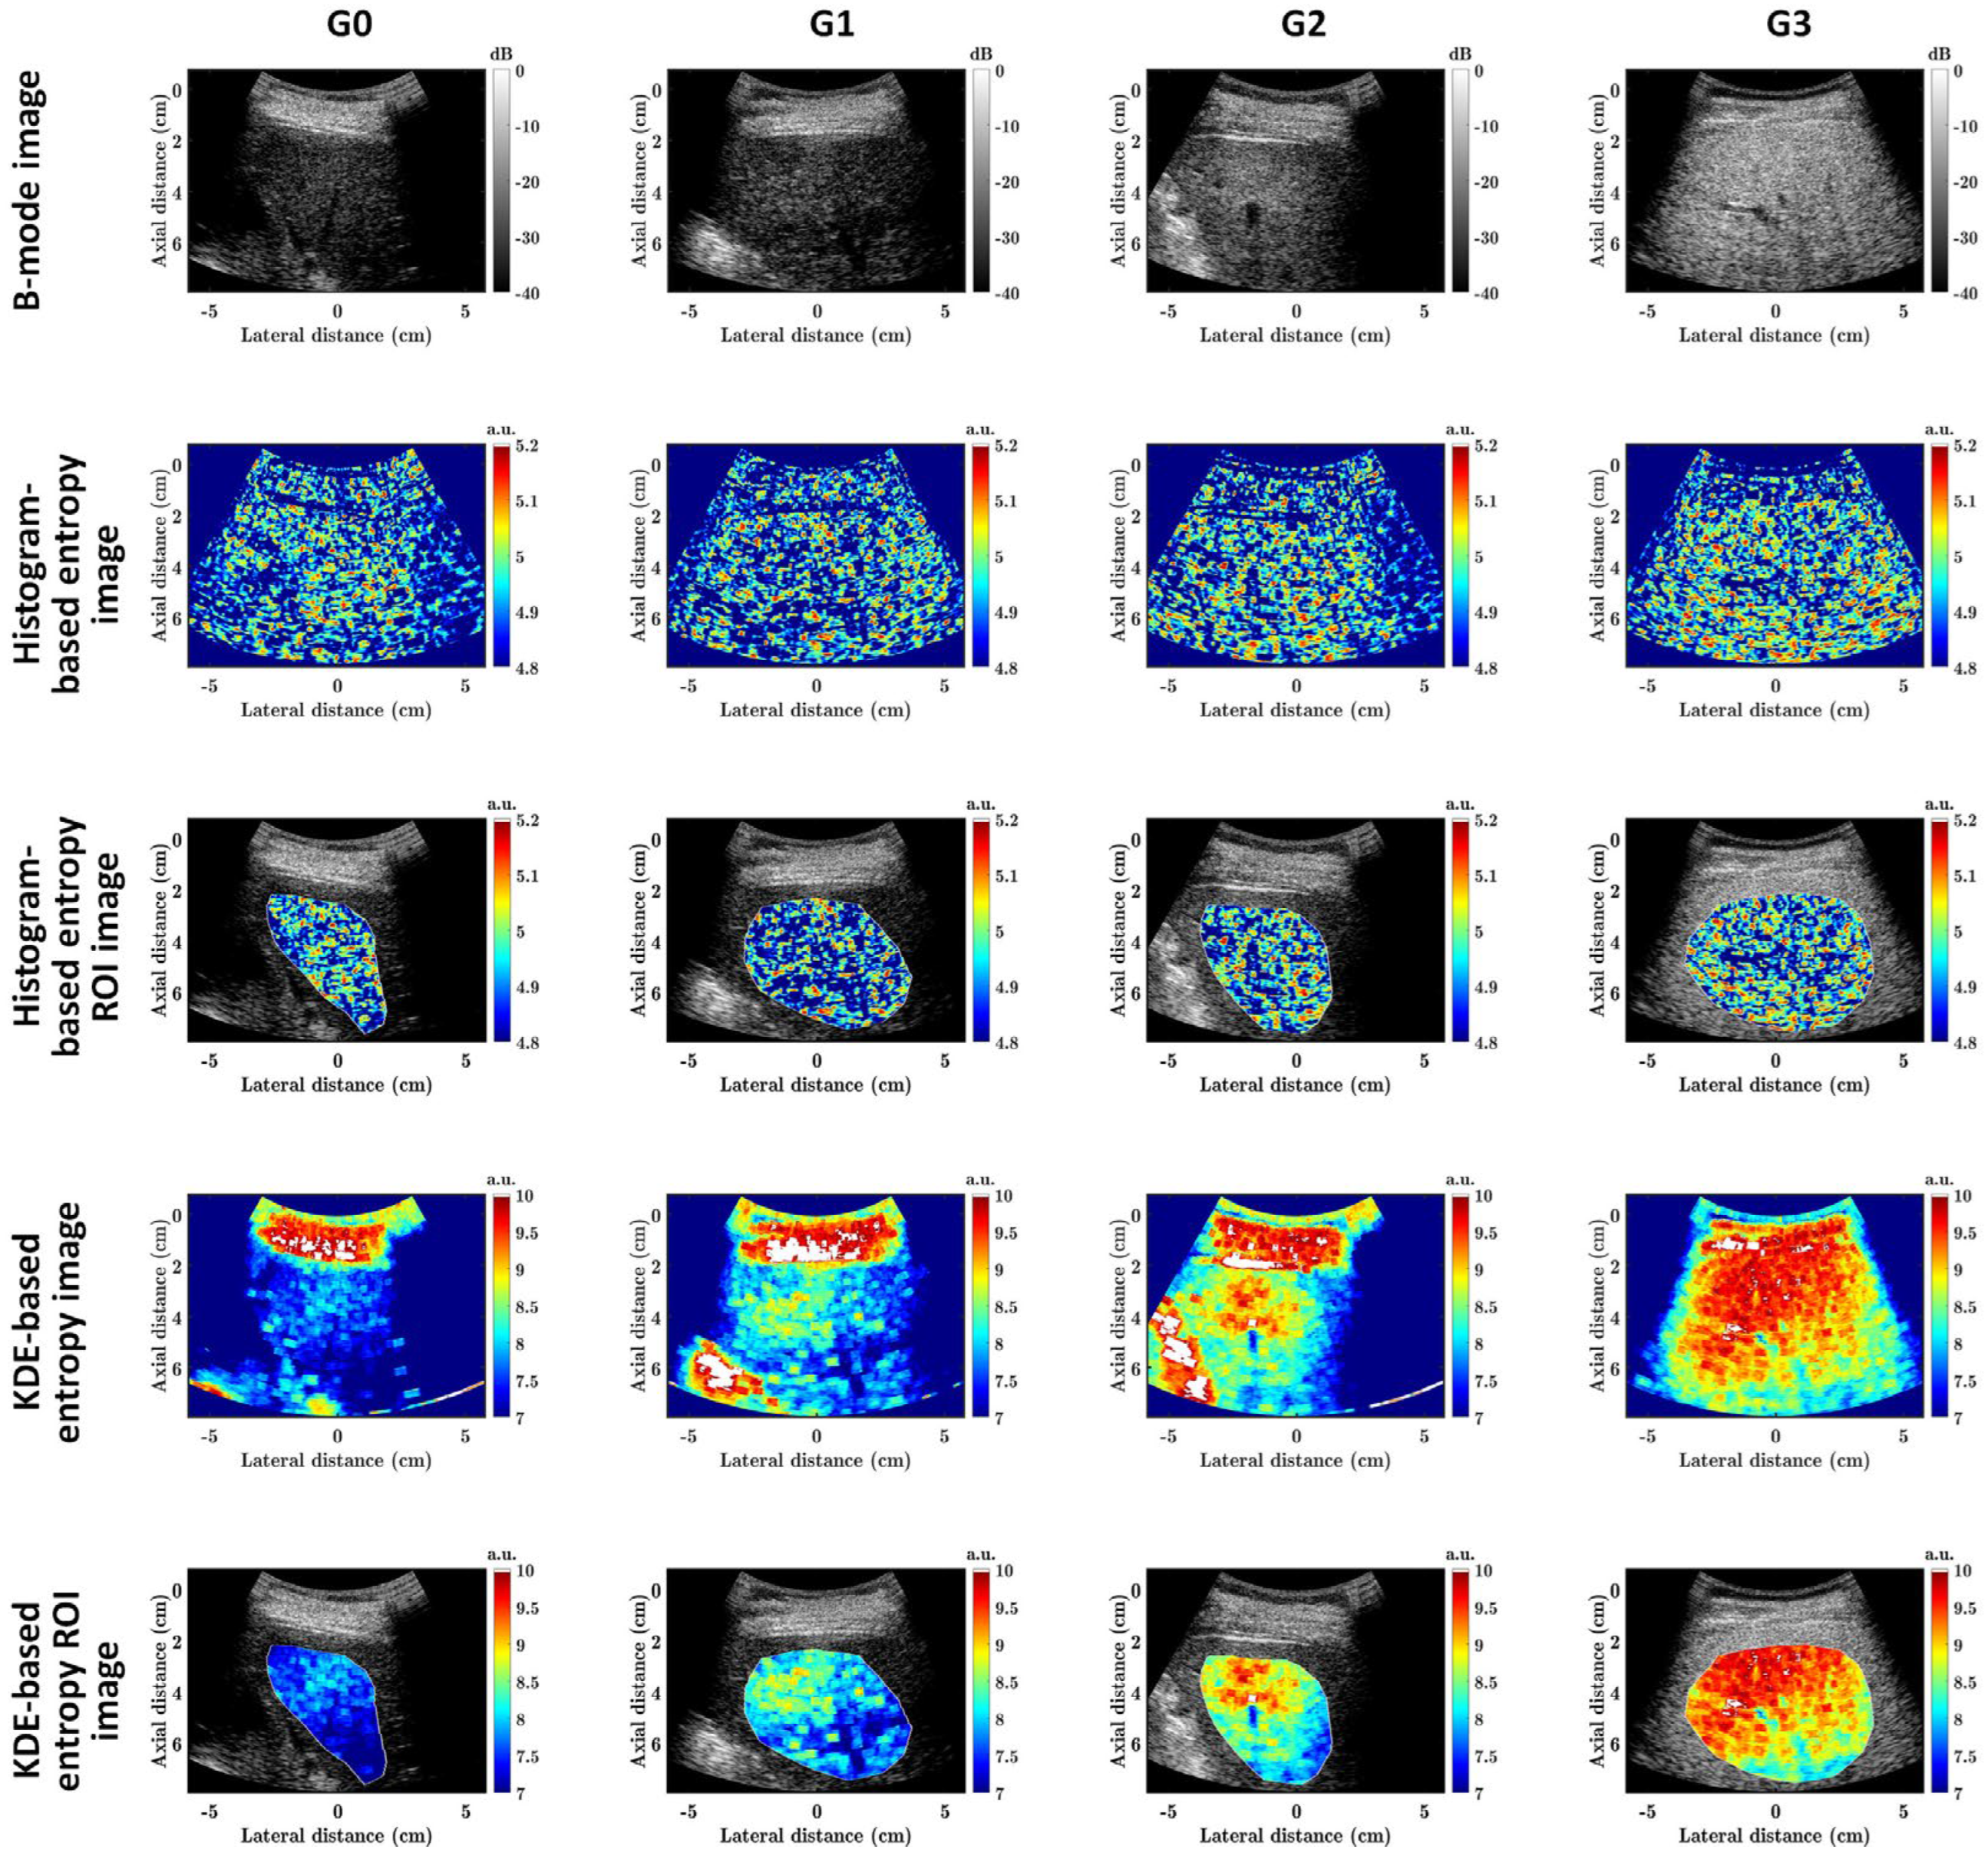
For group I, the Pearson’s correlation coefficient, r, between the mean entropy (Ehist and EKDE) values of the ROIs and log10(HFF) was computed, where log10(HFF) was used rather than the HFF because our previous studies demonstrated that quantitative ultrasound parameters had a better correlation with log10(HFF) than with HFF [16,27]. For group II, a receiver operating characteristic (ROC) analysis was conducted and the area under the ROC curve (AUC) was calculated using the 95% confidence interval (CI), in order to evaluate the diagnostic performances of Ehist and EKDE parametric imaging for classifying different grades of hepatic steatosis. We conducted three binary classifications: G0 versus G1–G3 (≥G1), G0–G1 versus G2–G3 (≥G2), and G0–G2 versus G3 (≥G3). In addition, a box plot was created. All the statistical analyses were performed using MATLAB software (version 2020a, The MathWorks, Natick, MA, USA).

3. Results

Figure 2 shows the representative ultrasound B-mode as well as Ehist and EKDE parametric images and their liver ROI images corresponding to different HFFs in group I. With the increase in the HFF, the B-mode image shows a generally increasing trend in image brightness, and the shadings of Ehist and EKDE parametric images also show an increasing trend, especially for the liver ROIs. However, the B-mode imaging was qualitative, and Ehist parametric imaging had a lower dynamic range and a lower image contrast than EKDE parametric imaging.
Figure 3 shows the scatter plots of the mean Ehist and EKDE values for the liver ROIs as a function of log10(HFF) in group I. Both Ehist and EKDE were correlated with log10(HFF). However, Ehist had a higher correlation coefficient (r = 0.65, p < 0.0001) with log10(HFF) than EKDE (r = 0.52, p < 0.0001). It is shown that the mean value of Ehist in group I ranges from ~4.75 to ~4.95, while that of EKDE ranges from ~7.5 to ~9.0, indicating that the dynamic range of EKDE parametric imaging is much higher than that of Ehist parametric imaging. The box plots of the dynamic ranges of Ehist and EKDE for the liver ROIs are shown in Figure 4. The dynamic range of EKDE is significantly higher than that of Ehist (p < 0.0001).
For group II, liver biopsy examinations revealed that the numbers for G0, G1, G2, and G3 were 80, 70, 36, and 18, respectively. Figure 5 shows representative ultrasound B-mode as well as Ehist and EKDE parametric images and their liver ROI images corresponding to different hepatic steatosis grades in group II. As the hepatic steatosis grade increases from G0 to G3, the B-mode image brightness and the entropy image shadings generally increase, similar to those in group I. Both Ehist and EKDE parametric imaging were capable to visually characterize different grades of hepatic steatosis.
Figure 6 shows the box plots of the mean Ehist and EKDE values of the liver ROIs corresponding to each hepatic steatosis grade in group II. Both Ehist and EKDE increased with the increases in hepatic steatosis grades, indicating they were capable of detecting the different hepatic steatosis grades. Furthermore, Figure 5 and Figure 6 show that EKDE parametric imaging presents a much higher dynamic range in group II than Ehist parametric imaging.
Figure 7 shows the ROC curves for diagnosing different grades of hepatic steatosis using Ehist and EKDE parametric imaging methods in group II. The AUCs for diagnosing hepatic steatosis grades ≥ G1, ≥G2, and ≥G3 using the Ehist parameter were 0.78, 0.84, and 0.86, respectively, and those using the EKDE parameter were 0.65, 0.73, and 0.80, respectively. Both Ehist and EKDE parametric imaging methods were capable of diagnosing different hepatic steatosis grades. However, Ehist parametric imaging had higher AUCs than EKDE parametric imaging. Table 1 summarizes the performance comparisons of Ehist and EKDE parametric imaging methods for diagnosing different grades of hepatic steatosis in group II.

4. Discussion

In this study, we proposed KDE-based ultrasound entropy imaging for characterizing clinical hepatic steatosis. In addition, we incorporated the parallel computation technique we recently introduced [22] into ultrasound entropy imaging. To the best of our knowledge, the proposed KDE-based parallelized ultrasound entropy imaging technique is the first to apply non-parametric entropy estimation and parallel computation techniques to ultrasound entropy imaging. Note that the parallel computation technique [22] can be easily extended to other quantitative ultrasound applications.
Conventional histogram-based ultrasound entropy imaging is based on probability estimations from ultrasound backscattered signals by using statistical histograms, while the proposed KDE-based ultrasound entropy imaging was built by using PDF estimations from ultrasound backscattered signals by using KDE. The former is known as a parametric estimation, and the latter a non-parametric estimation. Compared to conventional histogram-based ultrasound entropy imaging, the proposed KDE-based ultrasound entropy imaging has a much greater imaging dynamic range (which can be observed in Figure 2, Figure 3, Figure 4, Figure 5 and Figure 6), although its correlation coefficients with log10(HFF) and diagnostic performance (AUC) are lower. Moreover, histogram-based ultrasound entropy imaging is affected by histogram settings, such as the histogram bin number [16]. Specifically, when the number of histogram bins or histogram limits alter, the probability values change, and the entropy estimate varies correspondingly, making the histogram-based entropy method a relative quantitative ultrasound parameter. These two drawbacks of histogram-based ultrasound entropy imaging are well addressed by the proposed KDE-based ultrasound entropy imaging.
Acoustically, a biological tissue can be modeled as an ensemble of small particles that scatter ultrasound waves, namely, acoustic scatterers. In the context of the liver, the effective acoustic scatterers of normal liver tissue may be considered as liver lobules, which are regularly or quasi-regularly distributed. In human hepatic steatosis, large fatty droplets usually fill hepatocytes and displace nuclei to the periphery [30]. A simplified acoustic model of human hepatic steatosis can be created on the basis of a scattering medium with randomly distributed acoustic scatterers due to fat-infiltrated hepatocytes from large droplet steatosis in addition to a large number of effective acoustic scatterers (i.e., liver lobules). Under this condition, increasing the severity of hepatic steatosis corresponds to an increase in the uncertainty or complexity of ultrasound backscattered signals, which is well characterized by the Shannon entropy [31].
The reason why we chose the Gaussian kernel for KDE-based ultrasound entropy imaging is discussed as below. Two kernel functions were recommended by Smolíková et al. [24] for the PDF estimation of ultrasound backscattered signals, i.e., the Gaussian and Epanechnikov kernels, and they argued that the Epanechnikov kernel has a slightly higher efficiency than the Gaussian kernel. From our experiments, we found that the Gaussian kernel yielded a slightly better diagnostic performance than the Epanechnikov kernel, and the Gaussian kernel produced a higher entropy imaging contrast than the Epanechnikov kernel. Another kernel function that may be suitable for estimating the PDF from ultrasound backscattered signals is the Gamma kernel [32,33]. We implemented KDE-based ultrasound entropy imaging with the Gamma kernel; however, we found its computational speed was very low, even with the incorporation of the parallel computation technique [22]. Therefore, we selected the Gaussian kernel when estimating the PDF of ultrasound backscattered signals.
In this paper, the Shannon entropy was estimated and imaged using the PDF estimated by KDE techniques. However, it should be noted that the proposed method can be easily extended to other entropy measures, such as the Renyi and Tsallis entropy methods, which can be estimated by using the KED-based PDF. Note that there are other kinds of entropy measures in addition to the Shannon, Renyi, and Tsallis entropy methods. In our previous work [34], we introduced ultrasound sample entropy imaging for liver tissue characterizations. Unlike the Shannon entropy based on probability or PDF estimations by conventional histogram-based or proposed KDE-based methods, sample entropy was determined by the dimension parameter, m, and the tolerance parameter, r [34]. The drawback of the sample entropy method lies in the fact that the two critical parameters, m and r, should be set empirically or experimentally. This drawback is similar to the drawback of conventional histogram-based Shannon entropy estimates, where the number of histogram bins and limits should be set specifically. In contrast, the proposed KDE-based Shannon entropy estimation method is an adaptive method, with the key parameter, the bandwidth parameter, h, adaptively determined from the test signal.
We presented a new ultrasound Shannon entropy estimation and imaging method. This method overcomes conventional histogram-based Shannon entropy estimation and imaging methods in that it is based on the PDF estimation by KDE techniques, and it is an adaptive method that is not affected by parameter settings, such as histogram bins and limits, yielding much higher imaging dynamic range and contrast results than conventional histogram-based methods. Furthermore, we incorporated parallelized computation techniques into the proposed KDE-based ultrasound Shannon entropy imaging method, which achieved a higher entropic parametric imaging resolution and a higher computation speed at the same time. The proposed method may serve as a new quantitative ultrasound method for tissue characterization. Although we used a hepatic steatosis evaluation for the clinical validations, the proposed method could be easily extended to other applications of ultrasound tissue characterizations for the sake of disease diagnosis, therapy monitoring, and prognosis prediction, as the proposed method was related to alterations in tissue microstructures, i.e., acoustic scatterers. In addition, the proposed method can be conveniently integrated into an ultrasound scanner and is compatible with existing ultrasound imaging systems, serving as a complement to conventional B-mode ultrasound imaging.
This study presented limitations. The proposed KDE-based entropy imaging method was only validated for ultrasound backscattered signals collected from one ultrasound scanner platform. Because we did not eliminate the system-dependent factors, such as the diffraction effect, the entropy estimate could be varied when using a different ultrasound scanner. The diagnostic performance of the proposed KDE-based entropy imaging was worse than the conventional histogram-based entropy imaging method. In future work, the performance of KDE-based entropy imaging when diagnosing different hepatic steatosis grades can be validated by more ultrasound scanners. The performance for diagnosing steatosis grade ≥ G1 can be improved, and the radiomics features can be extracted from the KDE-based entropy images to enhance the classification performance. In addition, system-dependent effects can be alleviated using methods, such as the reference phantom method [35].

5. Conclusions

In this paper, we proposed KDE-based parallelized ultrasound entropy imaging and applied it for hepatic steatosis characterization. The proposed method overcame the limitations of conventional histogram-based ultrasound entropy imaging methods, including limited dynamic ranges and histogram settings dependence. Clinical experiments were conducted to validate the feasibility of the proposed KDE-base parallelized ultrasound entropy imaging method. The proposed KDE-based parallelized ultrasound entropy imaging method can be used as a new ultrasound entropy imaging method for hepatic steatosis characterization.

Author Contributions

Conceptualization, Z.Z. and G.B.; methodology, R.G., P.-H.T., G.B. and Z.Z.; software, R.G. and Z.Z.; validation, R.G., P.-H.T., S.W. and D.-I.T.; formal analysis, R.G., P.-H.T., S.W. and D.-I.T.; investigation, R.G. and Z.Z.; resources, D.-I.T. and P.-H.T.; data curation, Z.Z. and R.G.; writing—original draft preparation, R.G. and P.-H.T.; writing—review and editing, Z.Z. and G.B.; visualization, R.G.; supervision, Z.Z. and G.B.; funding acquisition, Z.Z., P.-H.T. and S.W. All authors have read and agreed to the published version of the manuscript.

Funding

This work was supported in part by the Beijing Natural Science Foundation (Grant No. 4222001), the National Science and Technology Council in Taiwan (NSTC 112-2221-E-182-006-MY3), the National Natural Science Foundation of China (Grant Nos. 11804013 and 61871005), and the Beijing International Science and Technology Cooperation Base for Intelligent Physiological Measurement and Clinical Transformation.

Institutional Review Board Statement

The clinical data were collected in accordance with the Declaration of Helsinki and approved by the Institutional Review Board of Chang Gung Memorial Hospital in Taiwan (group I: protocol code 04-5678C, and date of approval: 17 September 2015; group II: protocol code 201601928B0, and date of approval: 7 February 2017).

Informed Consent Statement

Informed consent was obtained from all subjects involved in the study.

Data Availability Statement

The ultrasound radiofrequency data and the ROI masks may be provided upon reasonable requests for scientific research purposes.

Acknowledgments

The authors would like to thank the anonymous reviewers for their valuable comments and suggestions.

Conflicts of Interest

The authors declare no conflict of interest.

References

  1. Younossi, Z.; Tacke, F.; Arrese, M.; Chander Sharma, B.; Mostafa, I.; Bugianesi, E.; Wai-Sun Wong, V.; Yilmaz, Y.; George, J.; Fan, J.; et al. Global perspectives on nonalcoholic fatty liver disease and nonalcoholic steatohepatitis. Hepatology 2019, 69, 2672–2682. [Google Scholar] [CrossRef]
  2. Eslam, M.; Sanyal, A.J.; George, J.; Sanyal, A.; Neuschwander-Tetri, B.; Tiribelli, C.; Kleiner, D.E.; Brunt, E.; Bugianesi, E.; Yki-Järvinen, H.; et al. MAFLD: A consensus-driven proposed nomenclature for metabolic associated fatty liver disease. Gastroenterology 2020, 158, 1999–2014. [Google Scholar] [CrossRef] [PubMed]
  3. Rinella, M.E.; Lazarus, J.V.; Ratziu, V.; Francque, S.M.; Sanyal, A.J.; Kanwal, F.; Romero, D.; Abdelmalek, M.F.; Anstee, Q.M.; Arab, J.P.; et al. A multi-society Delphi consensus statement on new fatty liver disease nomenclature. J. Hepatol. 2023, 29, 101133. [Google Scholar] [CrossRef]
  4. Oelze, M.L.; Mamou, J. Quantitative Ultrasound in Soft Tissues, 2nd ed.; Springer: Cham, Switzerland, 2023; pp. 1–301. [Google Scholar]
  5. Cloutier, G.; Destrempes, F.; Yu, F.; Tang, A. Quantitative ultrasound imaging of soft biological tissues: A primer for radiologists and medical physicists. Insights Imaging 2021, 12, 127. [Google Scholar] [CrossRef] [PubMed]
  6. Yamaguchi, T. Basic Concept and clinical applications of quantitative ultrasound (QUS) technologies. J. Med. Ultrason. 2021, 48, 391–402. [Google Scholar] [CrossRef]
  7. Destrempes, F.; Cloutier, G. Review of envelope statistics models for quantitative ultrasound imaging and tissue characterization. In Quantitative Ultrasound in Soft Tissues; Oelze, M.L., Mamou, J., Eds.; Springer: Cham, Switzerland, 2013; pp. 219–274. [Google Scholar]
  8. Oelze, M.L.; Mamou, J. Review of quantitative ultrasound: Envelope statistics and backscatter coefficient imaging and contributions to diagnostic ultrasound. IEEE Trans. Ultrason. Ferroelectr. Freq. Control 2016, 63, 336–351. [Google Scholar] [CrossRef]
  9. Tsui, P.H. Information entropy and its applications. In Quantitative Ultrasound in Soft Tissues, 2nd ed.; Oelze, M.L., Mamou, J., Eds.; Springer: Cham, Switzerland, 2023; pp. 153–167. [Google Scholar]
  10. Han, M.; Song, W.; Zhang, F.; Li, Z. Modeling for quantitative analysis of Nakagami imaging in accurate detection and monitoring of therapeutic lesions by high-intensity focused ultrasound. Ultrasound Med. Biol. 2023, 49, 1575–1585. [Google Scholar] [CrossRef]
  11. Yang, G.; Zhang, S.; Li, X.; Shen, T.; Jia, X.; Ding, Y.; Zhang, B.; Wang, H.; Li, X.; Ren, P. A systemic study on the performance of different quantitative ultrasound imaging techniques for microwave ablation monitoring of liver. IEEE Trans. Instrum. Meas. 2023, 72, 5012511. [Google Scholar] [CrossRef]
  12. Chowdhury, A.; Razzaque, R.R.; Muhtadi, S.; Shafiullah, A.; Abir, E.U.I.; Garra, B.S.; Alam, S.K. Ultrasound classification of breast masses using a comprehensive Nakagami imaging and machine learning framework. Ultrasonics 2022, 124, 106744. [Google Scholar] [CrossRef]
  13. Wang, D.; Ma, Q.; Wang, Q.; Fan, Y.; Lu, S.; Su, Q.; Zhong, H.; Wan, M. Feasibility investigation of logarithmic Nakagami parametric imaging in recovering underestimated perfusion metrics of DCEUS in the uneven acoustic field. Med. Phys. 2022, 49, 2452–2461. [Google Scholar] [CrossRef]
  14. Destrempes, F.; Trop, I.; Allard, L.; Chayer, B.; Garcia-Duitama, J.; El Khoury, M.; Lalonde, L.; Cloutier, G. Added Value of Quantitative Ultrasound and Machine Learning in BI-RADS 4-5 assessment of solid breast lesions. Ultrasound Med. Biol. 2020, 46, 436–444. [Google Scholar] [CrossRef] [PubMed]
  15. Liu, Y.; Zhang, Y.; He, B.; Li, Z.; Lang, X.; Liang, H.; Chen, J. An improved parameter estimator of the homodyned K distribution based on the maximum likelihood method for ultrasound tissue characterization. Ultrason. Imaging 2022, 44, 142–160. [Google Scholar] [CrossRef] [PubMed]
  16. Zhou, Z.; Tai, D.I.; Wan, Y.L.; Tseng, J.H.; Lin, Y.R.; Wu, S.; Yang, K.C.; Liao, Y.Y.; Yeh, C.K.; Tsui, P.H. Hepatic steatosis assessment with ultrasound small-window entropy imaging. Ultrasound Med. Biol. 2018, 44, 1327–1340. [Google Scholar] [CrossRef] [PubMed]
  17. Karbalaeisadegh, Y.; Yao, S.; Zhu, Y.; Grimal, Q.; Muller, M. Ultrasound characterization of cortical bone using Shannon entropy. Ultrasound Med. Biol. 2023, 49, 1824–1829. [Google Scholar] [CrossRef] [PubMed]
  18. Li, P.; Yang, X.; Yin, G.; Guo, J. Skeletal muscle fatigue state evaluation with ultrasound image entropy. Ultrason. Imaging 2020, 42, 235–244. [Google Scholar] [CrossRef] [PubMed]
  19. Behnia, A.; Behnam, H.; Shaswary, E.; Tavakkoli, J. Thermometry using entropy imaging of ultrasound radio frequency signal time series. Inst. Mech. Eng. Part H J. Eng. Med. 2022, 236, 1502–1512. [Google Scholar] [CrossRef] [PubMed]
  20. Fang, J.; Ting, Y.; Chen, Y. Quantitative assessment of lung ultrasound grayscale images based on Shannon entropy for the detection of pulmonary aeration: An animal study. J. Ultrasound Med. 2022, 41, 1699–1711. [Google Scholar] [CrossRef]
  21. Li, X.; Jia, X.; Shen, T.; Wang, M.; Yang, G.; Wang, H.; Sun, Q.; Wan, M.; Zhang, S. Ultrasound entropy imaging for detection and monitoring of thermal lesion during microwave ablation of liver. IEEE J. Biomed. Health Inform. 2022, 26, 4056–4066. [Google Scholar] [CrossRef]
  22. Wu, X.; Lv, K.; Wu, S.; Tai, D.I.; Tsui, P.H.; Zhou, Z. Parallelized ultrasound homodyned-K imaging based on a generalized artificial neural network estimator. Ultrasonics 2023, 132, 106987. [Google Scholar] [CrossRef]
  23. Kapur, J.N.; Kesavan, H.K. Entropy Optimization Principles with Applications; Academic Press: San Diego, CA, USA, 1992; pp. 96–97. [Google Scholar]
  24. Smolíková, R.; Wachowiak, M.P.; Zurada, J.M. An information-theoretic approach to estimating ultrasound backscatter characteristics. Comput. Biol. Med. 2004, 34, 355–370. [Google Scholar] [CrossRef]
  25. Dudewicz, E.J.; Van der Meulen, E.C. The empiric entropy, a new approach to nonparametric entropy estimation. In New Perspectives in Theoretical and Applied Statistics; Puri, M.L., Vilaplana, J., Westz, W., Eds.; Wiley: New York, NY, USA, 1987; pp. 207–227. [Google Scholar]
  26. Scott, D.W. Multivariate Density Estimation: Theory, Practice, and Visualization; John Wiley & Sons: New York, NY, USA, 1992; pp. 152–154. [Google Scholar]
  27. Zhou, Z.; Zhang, Q.; Wu, W.; Lin, Y.H.; Tai, D.I.; Tseng, J.H.; Lin, Y.R.; Wu, S.; Tsui, P.H. Hepatic steatosis assessment using ultrasound homodyned-K parametric imaging: The effects of estimators. Quant. Imaging Med. Surg. 2019, 9, 1932–1947. [Google Scholar] [CrossRef] [PubMed]
  28. Huang, Y.; Wang, Z.; Liao, B.; Liang, J.-Y.; Zhou, L.-Y.; Wang, F.; Li, W.; Liu, J.-Y.; Xie, X.-Y.; Lu, M.-D.; et al. Assessment of liver fibrosis in chronic hepatitis B using acoustic structure quantification: Quantitative morphological ultrasound. Eur. Radiol. 2016, 26, 2344–2351. [Google Scholar] [CrossRef]
  29. Brunt, E.M.; Janney, C.G.; Di Bisceglie, A.M.; Neuschwander-Tetri, B.A.; Bacon, B.R. Nonalcoholic steatohepatitis: A proposal for grading and staging the histological lesions. Am. J. Gastroenterol. 1999, 94, 2467–2474. [Google Scholar] [CrossRef] [PubMed]
  30. Tandra, S.; Yeh, M.M.; Brunt, E.M.; Vuppalanchi, R.; Cummings, O.W.; Ünalp-Arida, A.; Wilson, L.A.; Chalasani, N. Presence and significance of microvesicular steatosis in nonalcoholic fatty liver disease. J. Hepatol. 2011, 55, 654–659. [Google Scholar] [CrossRef] [PubMed]
  31. Hughes, M.S. Analysis of digitized waveforms using Shannon entropy. J. Acoust. Soc. Am. 1993, 93, 892–906. [Google Scholar] [CrossRef]
  32. Larrue, A.; Noble, J.A. Nakagami imaging with small windows. In Proceedings of the 2011 IEEE International Symposium on Biomedical Imaging: From Nano to Macro, Chicago, IL, USA, 30 March–2 April 2011; pp. 887–890. [Google Scholar]
  33. Chen, S.X. Probability density function estimation using Gamma kernels. Ann. Inst. Stat. Math. 2000, 52, 471–480. [Google Scholar] [CrossRef]
  34. Chan, H.-J.; Zhou, Z.; Fang, J.; Tai, D.-I.; Tseng, J.-H.; Lai, M.-W.; Hsieh, B.-Y.; Yamaguchi, T.; Tsui, P.H. Ultrasound sample entropy imaging: A new approach for evaluating hepatic steatosis and fibrosis. IEEE J. Trans. Eng. Health Med. 2021, 9, 1800612. [Google Scholar] [CrossRef]
  35. Yao, L.X.; Zagzebski, J.A.; Madsen, E.L. Backscatter coefficient measurements using a reference phantom to extract depth-dependent instrumentation factors. Ultrason. Imaging 1990, 12, 58–70. [Google Scholar] [CrossRef]
Figure 1. Flowchart of the proposed kernel density estimation (KDE)-based parallelized ultrasound entropy imaging method. GW: gating window; PDF: probability density function; a.u.: arbitrary unit; no.: number.
Diagnostics 13 03646 g001
Figure 2. Representative ultrasound B-mode (first row) as well as Ehist (second row) and EKDE (the fourth row) parametric images and their liver ROI images (third and fifth rows) corresponding to different HFFs in group I. The first to fifth columns correspond to HFFs = 0.25%, 8.75%, 17.83%, 28.62%, and 44.66%, respectively. HFF: hepatic fat fraction; ROI: region of interest; a.u.: arbitrary unit.
Diagnostics 13 03646 g002
Figure 3. Scatter plots of the mean Ehist (a) and EKDE (b) values for the liver ROIs as a function of log10(HFF) in group I. The dotted lines are fitting lines. HFF: hepatic fat fraction; ROI: region of interest.
Diagnostics 13 03646 g003
Figure 4. Box plots of the dynamic ranges of the conventional histogram-based entropy Ehist (Hist) and the proposed KDE-based entropy EKDE (KDE) estimates for the liver ROIs. The dynamic ranges of EKDE are significantly higher than those of Ehist (p < 0.0001 with a paired t-test).
Diagnostics 13 03646 g004
Figure 5. Representative ultrasound B-mode (first row) as well as Ehist (second row) and EKDE (fourth row) parametric images and their liver ROI images (third and fifth rows) corresponding to different hepatic steatosis grades in group II. The first to fourth columns correspond to hepatic steatosis grades = G0, G1, G2, and G3, respectively. ROI: region of interest; a.u.: arbitrary unit.
Diagnostics 13 03646 g005
Figure 6. Box plots of the mean Ehist (a) and EKDE (b) values for the liver ROIs corresponding to each hepatic steatosis grade in group II.
Diagnostics 13 03646 g006
Figure 7. ROC curves for diagnosing different grades of hepatic steatosis using Ehist (a) and EKDE (b) parametric imaging methods in group II. ROC: receiver operating characteristic; AUC: area under the ROC curve.
Diagnostics 13 03646 g007
Table 1. Ehist and EKDE parametric imaging for diagnosing different grades of hepatic steatosis in group II.
Parameter≥G1≥G2≥G3
EhistEKDEEhistEKDEEhistEKDE
Cutoff value4.888.104.898.304.908.35
Youden’s Index0.480.220.620.400.500.53
Sensitivity (%)80.0057.5073.3373.3378.0075.27
Specificity (%)67.7464.5288.8966.6772.2277.78
LR+2.481.626.602.202.813.39
LR-0.300.660.300.400.310.32
PPV (%)61.5451.1194.8385.9496.6797.22
NPV (%)84.0070.1854.5547.3724.0723.33
AUC, 95% CI0.71–0.850.57–0.730.79–0.900.66–0.800.79–0.920.72–0.89
AUC0.780.650.840.730.860.80
Note: LR+: positive likelihood ratio; LR-: negative likelihood ratio; PPV: positive predictive value; NPV: negative predictive value; AUC: area under the receiver operating characteristic curve; CI: confidence interval.
Disclaimer/Publisher’s Note: The statements, opinions and data contained in all publications are solely those of the individual author(s) and contributor(s) and not of MDPI and/or the editor(s). MDPI and/or the editor(s) disclaim responsibility for any injury to people or property resulting from any ideas, methods, instructions or products referred to in the content.

