Author Contributions
Conceptualization, T.W. and M.K.; data curation, T.W. and J.O.; formal analysis, T.W.; funding acquisition, M.K.; investigation, T.W. and R.Z.; methodology, T.W.; resources, T.W.; software, T.W.; supervision, M.K.; validation, M.K.; visualization, T.W. and A.M.; writing-original draft, T.W.; writing-review and editing, T.W., M.K. and G.T. All authors have read and agreed to the published version of the manuscript.
Figure 1.
Measurement of marginal bone loss on the radiographic images 5 years after functional loading with a single crown. The white line indicates the implant platform and the circle at the bottom of the bone loss cavity [
8].
Figure 1.
Measurement of marginal bone loss on the radiographic images 5 years after functional loading with a single crown. The white line indicates the implant platform and the circle at the bottom of the bone loss cavity [
8].
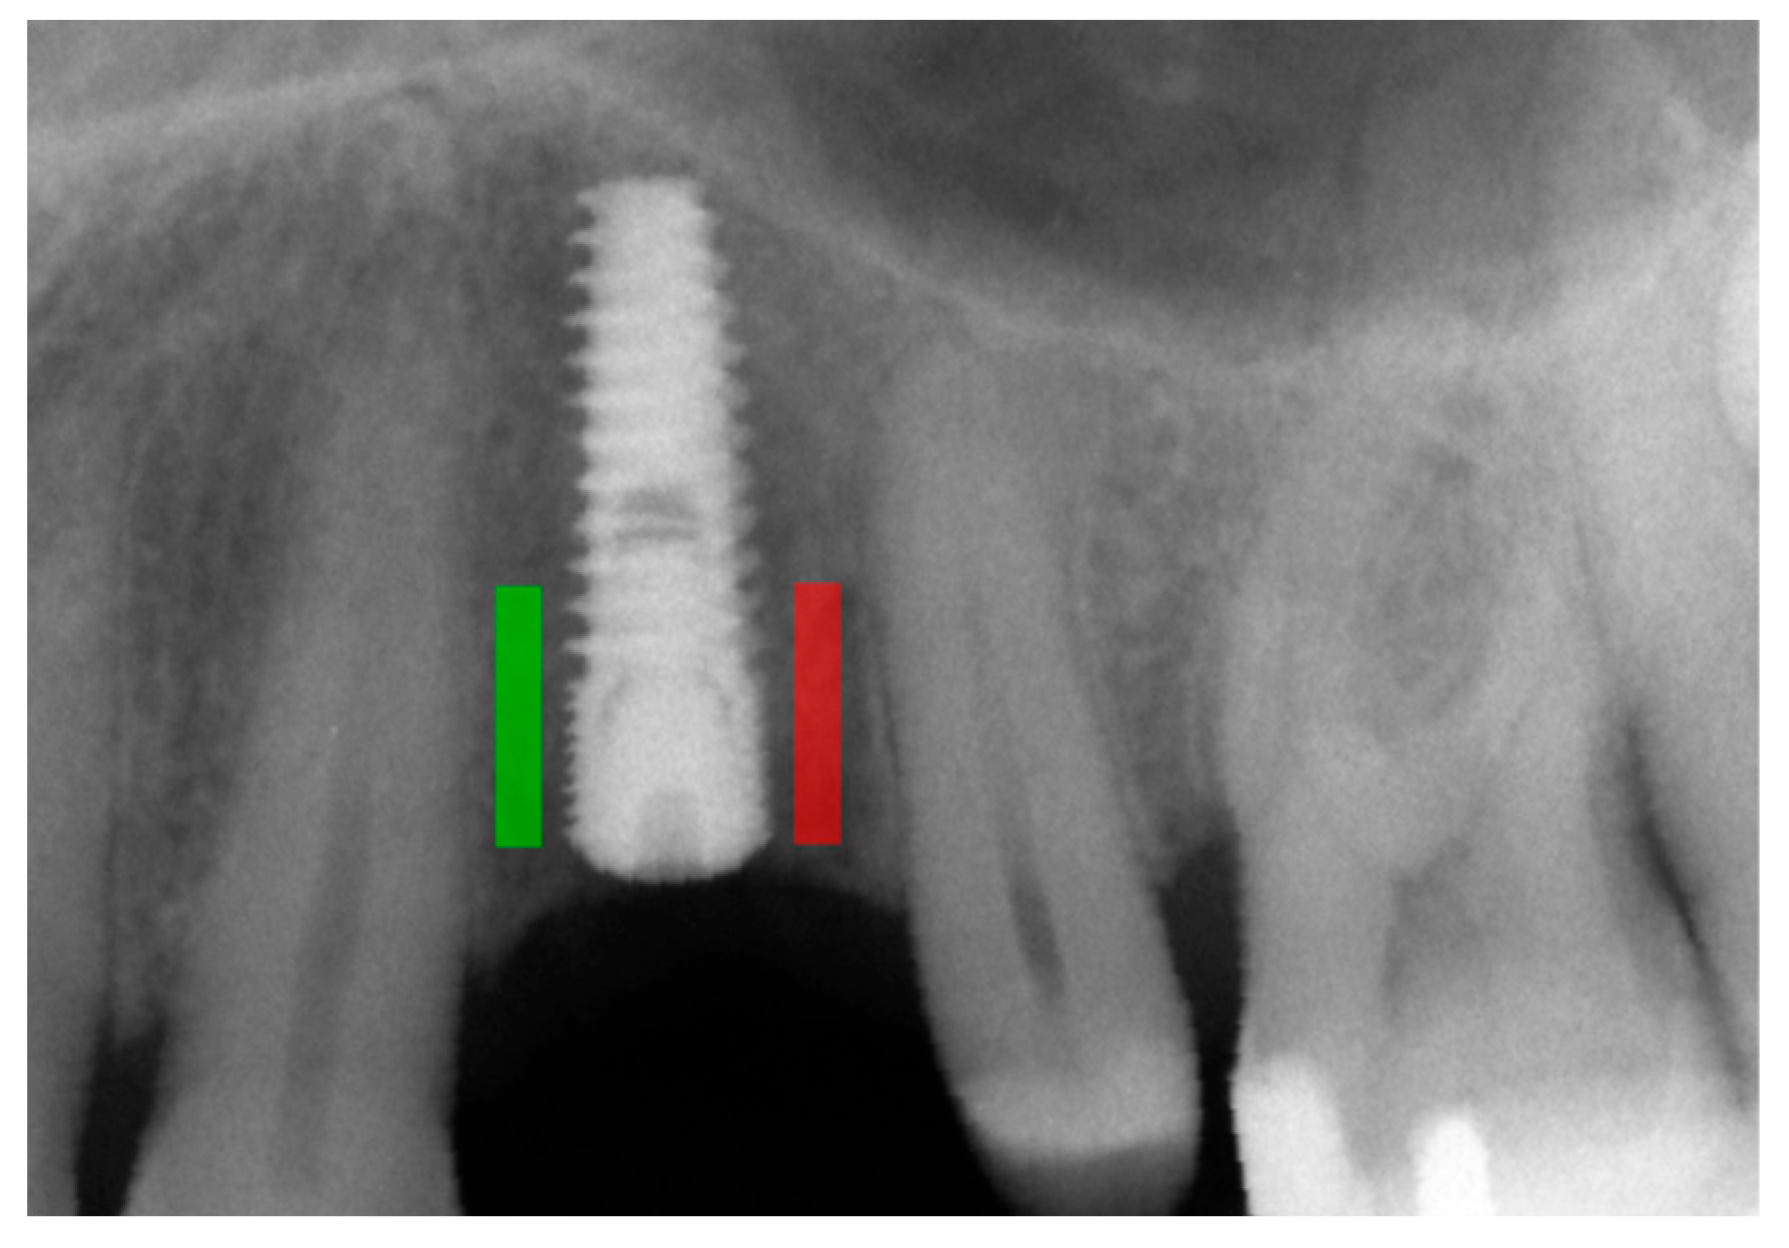
Figure 2.
Marking an ROI. ROIs were marked near the implant neck area. Green area—mesial implant neck area; red area—distal implant neck area. Abbreviations: ROI—region of interest.
Figure 2.
Marking an ROI. ROIs were marked near the implant neck area. Green area—mesial implant neck area; red area—distal implant neck area. Abbreviations: ROI—region of interest.
Figure 3.
Dependencies for all samples: (a) dependence of the number of single crowns on the corticalization index in the initial period; (b) dependence of the number of single crowns on the corticalization index after 5 years of observation; (c) dependence of the number of single crowns on marginal bone loss in the initial period; (d) dependence of the number of single crowns on marginal bone loss after 5 years of observation. The red asterisk describes statistically significant differences.
Figure 4.
Dependencies for all samples: (a) dependence of the number of splinted crowns on the corticalization index in the initial period; (b) dependence of the number of splinted crowns on the corticalization index after 5 years of observation; (c) dependence of the number of splinted crowns on marginal bone loss in the initial period; (d) dependence of the number of splinted crowns on marginal bone loss after 5 years of observation. The red asterisk describes statistically significant differences.
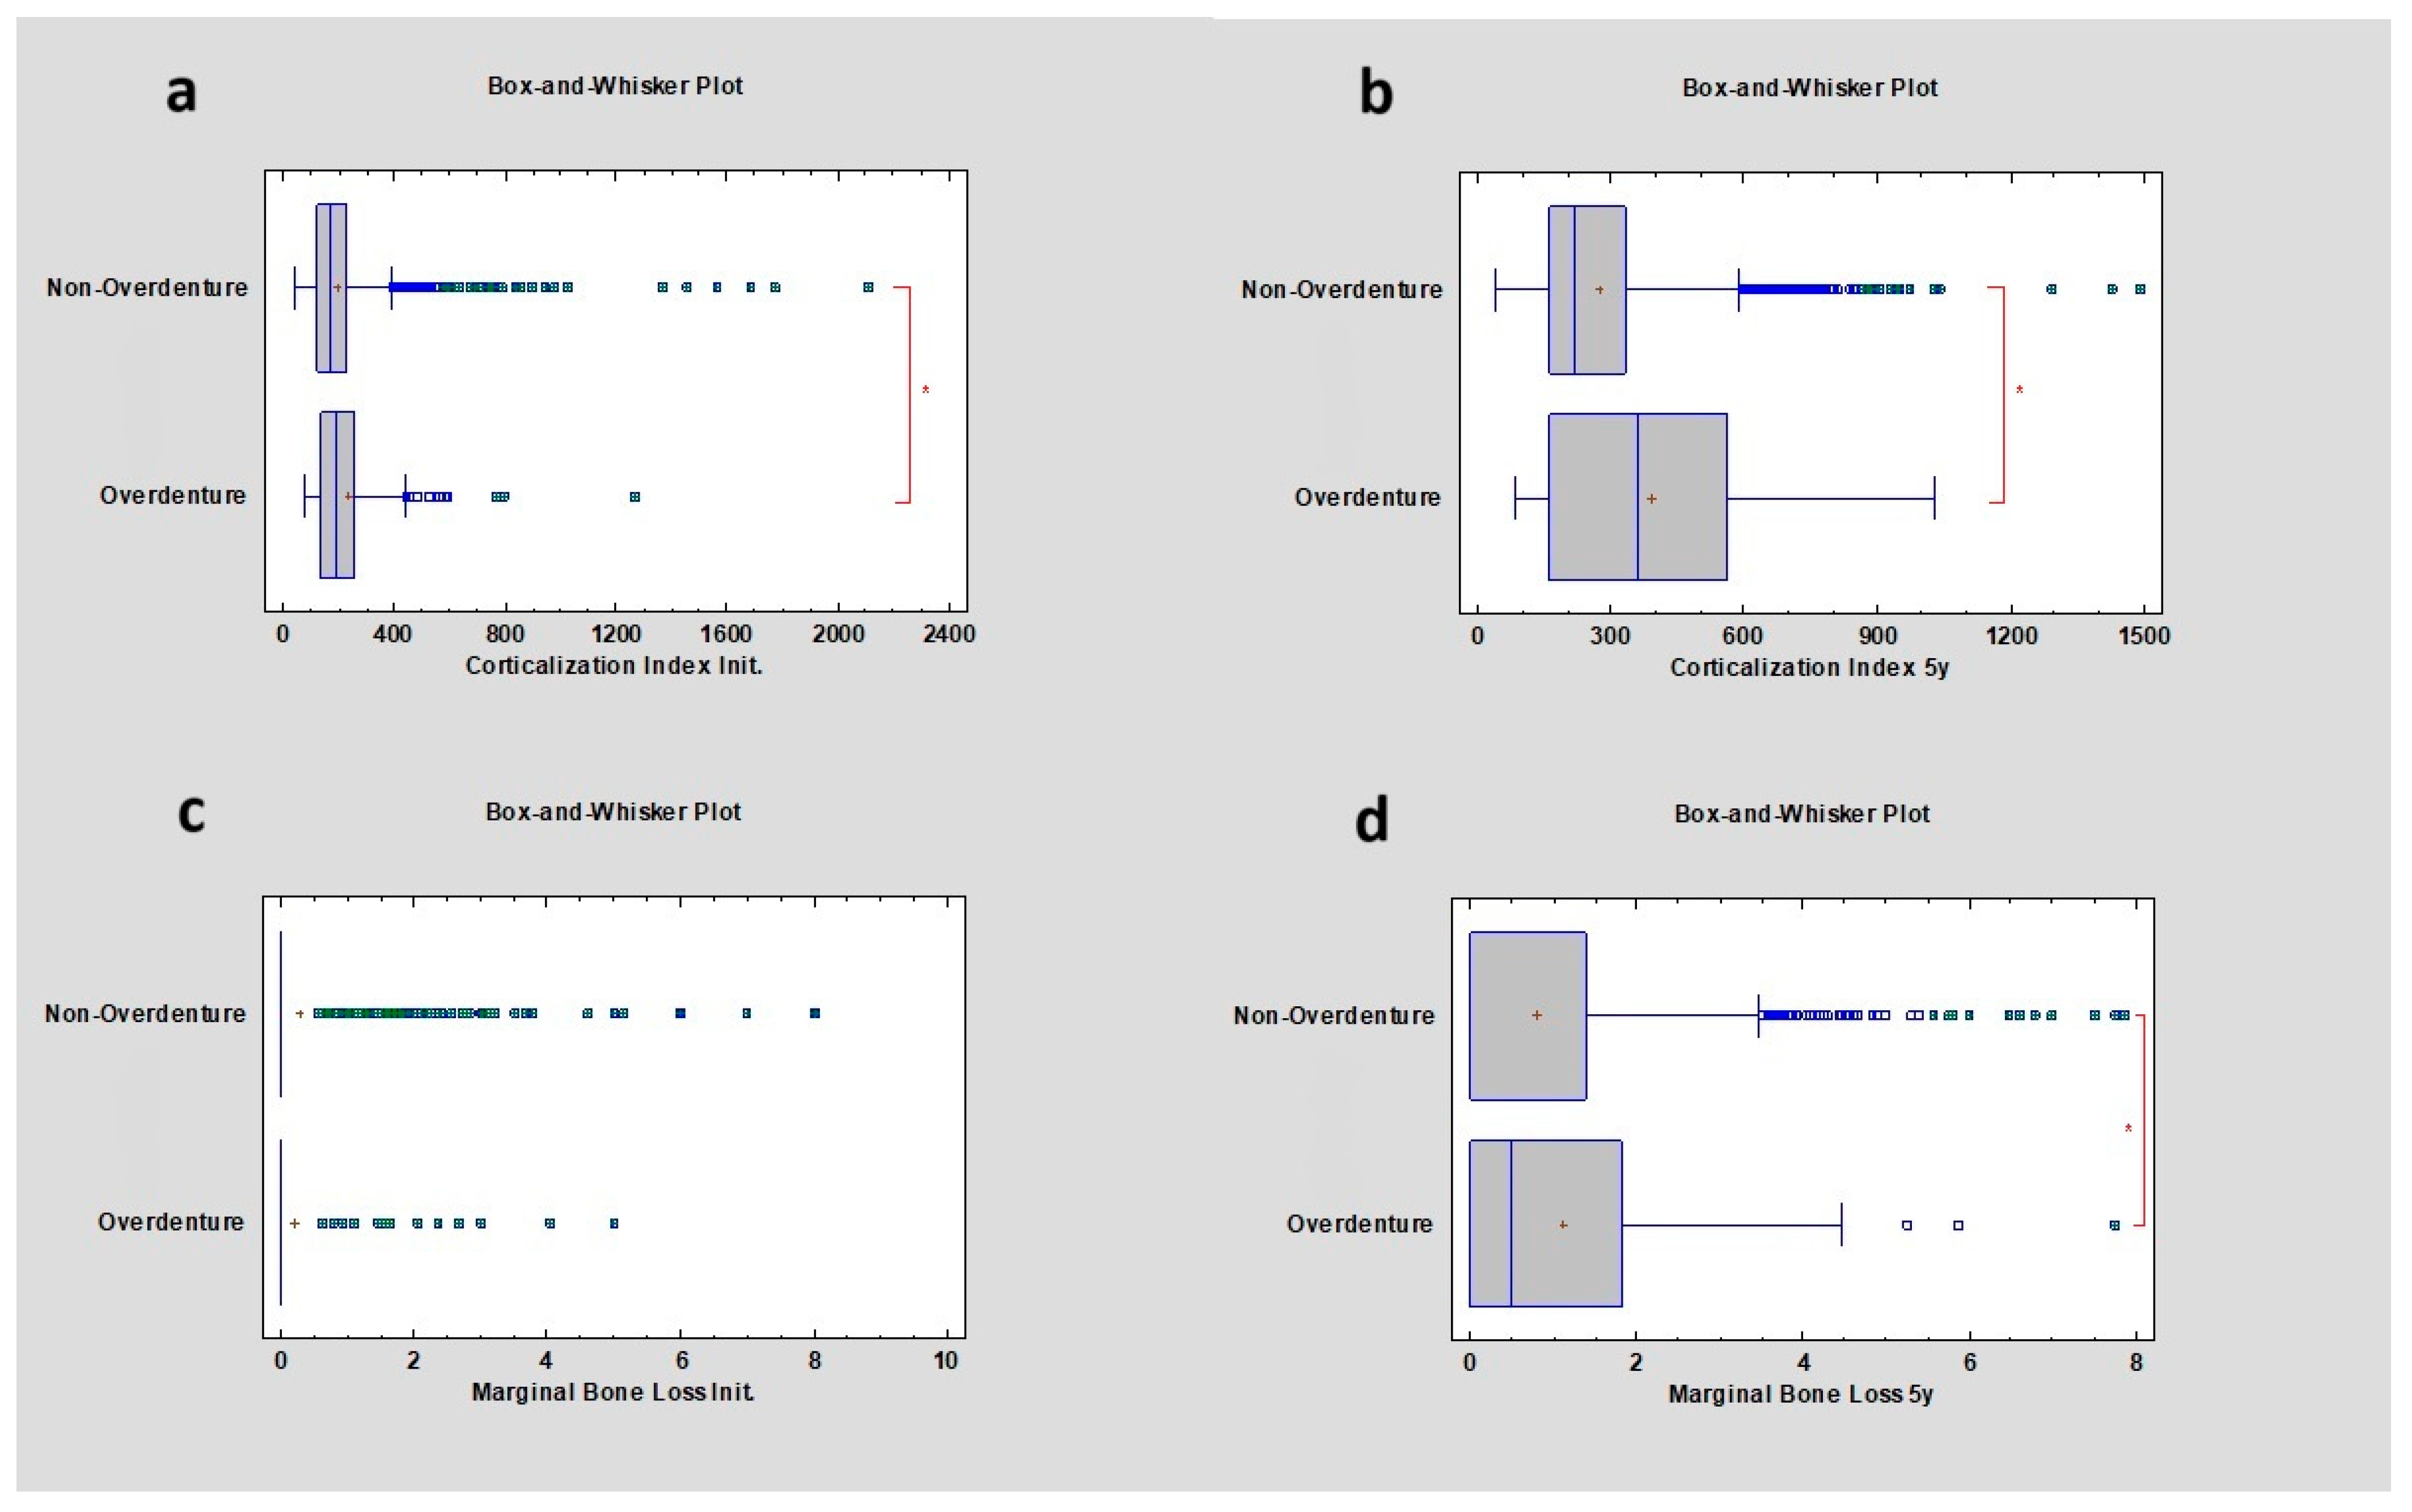
Figure 5.
Dependencies for all samples: (a) dependence of overdenture or non-overdenture prosthetic restoration on the corticalization index in the initial period; (b) dependence of overdenture or non-overdenture prosthetic restoration on the corticalization index after 5 years of observation; (c) dependence of overdenture or non-overdenture prosthetic restoration on marginal bone loss in the initial period; (d) dependence of overdenture or non-overdenture prosthetic restoration on marginal bone loss after 5 years of observation. The red asterisk describes statistically significant differences.
Figure 6.
Dependencies for all samples: (a) dependence of the presence of a prosthetic bridge or not on the corticalization index in the initial period; (b) dependence of the presence of a prosthetic bridge or not on the corticalization index after 5 years of observation; (c) dependence of the presence of a prosthetic bridge or not on marginal bone loss in the initial period; (d) dependence of the presence of a prosthetic bridge or not on marginal bone loss after 5 years of observation. The red asterisk describes statistically significant differences.
Figure 7.
Dependencies for all samples: (a) dependence of the presence of platform switching or not on the corticalization index in the initial period; (b) dependence of the presence of platform switching or not on the corticalization index after 5 years of observation; (c) dependence of the presence of platform switching or not on marginal bone loss in the initial period; (d) dependence of the presence of platform switching or not on marginal bone loss after 5 years of observation. The red asterisk describes statistically significant differences.
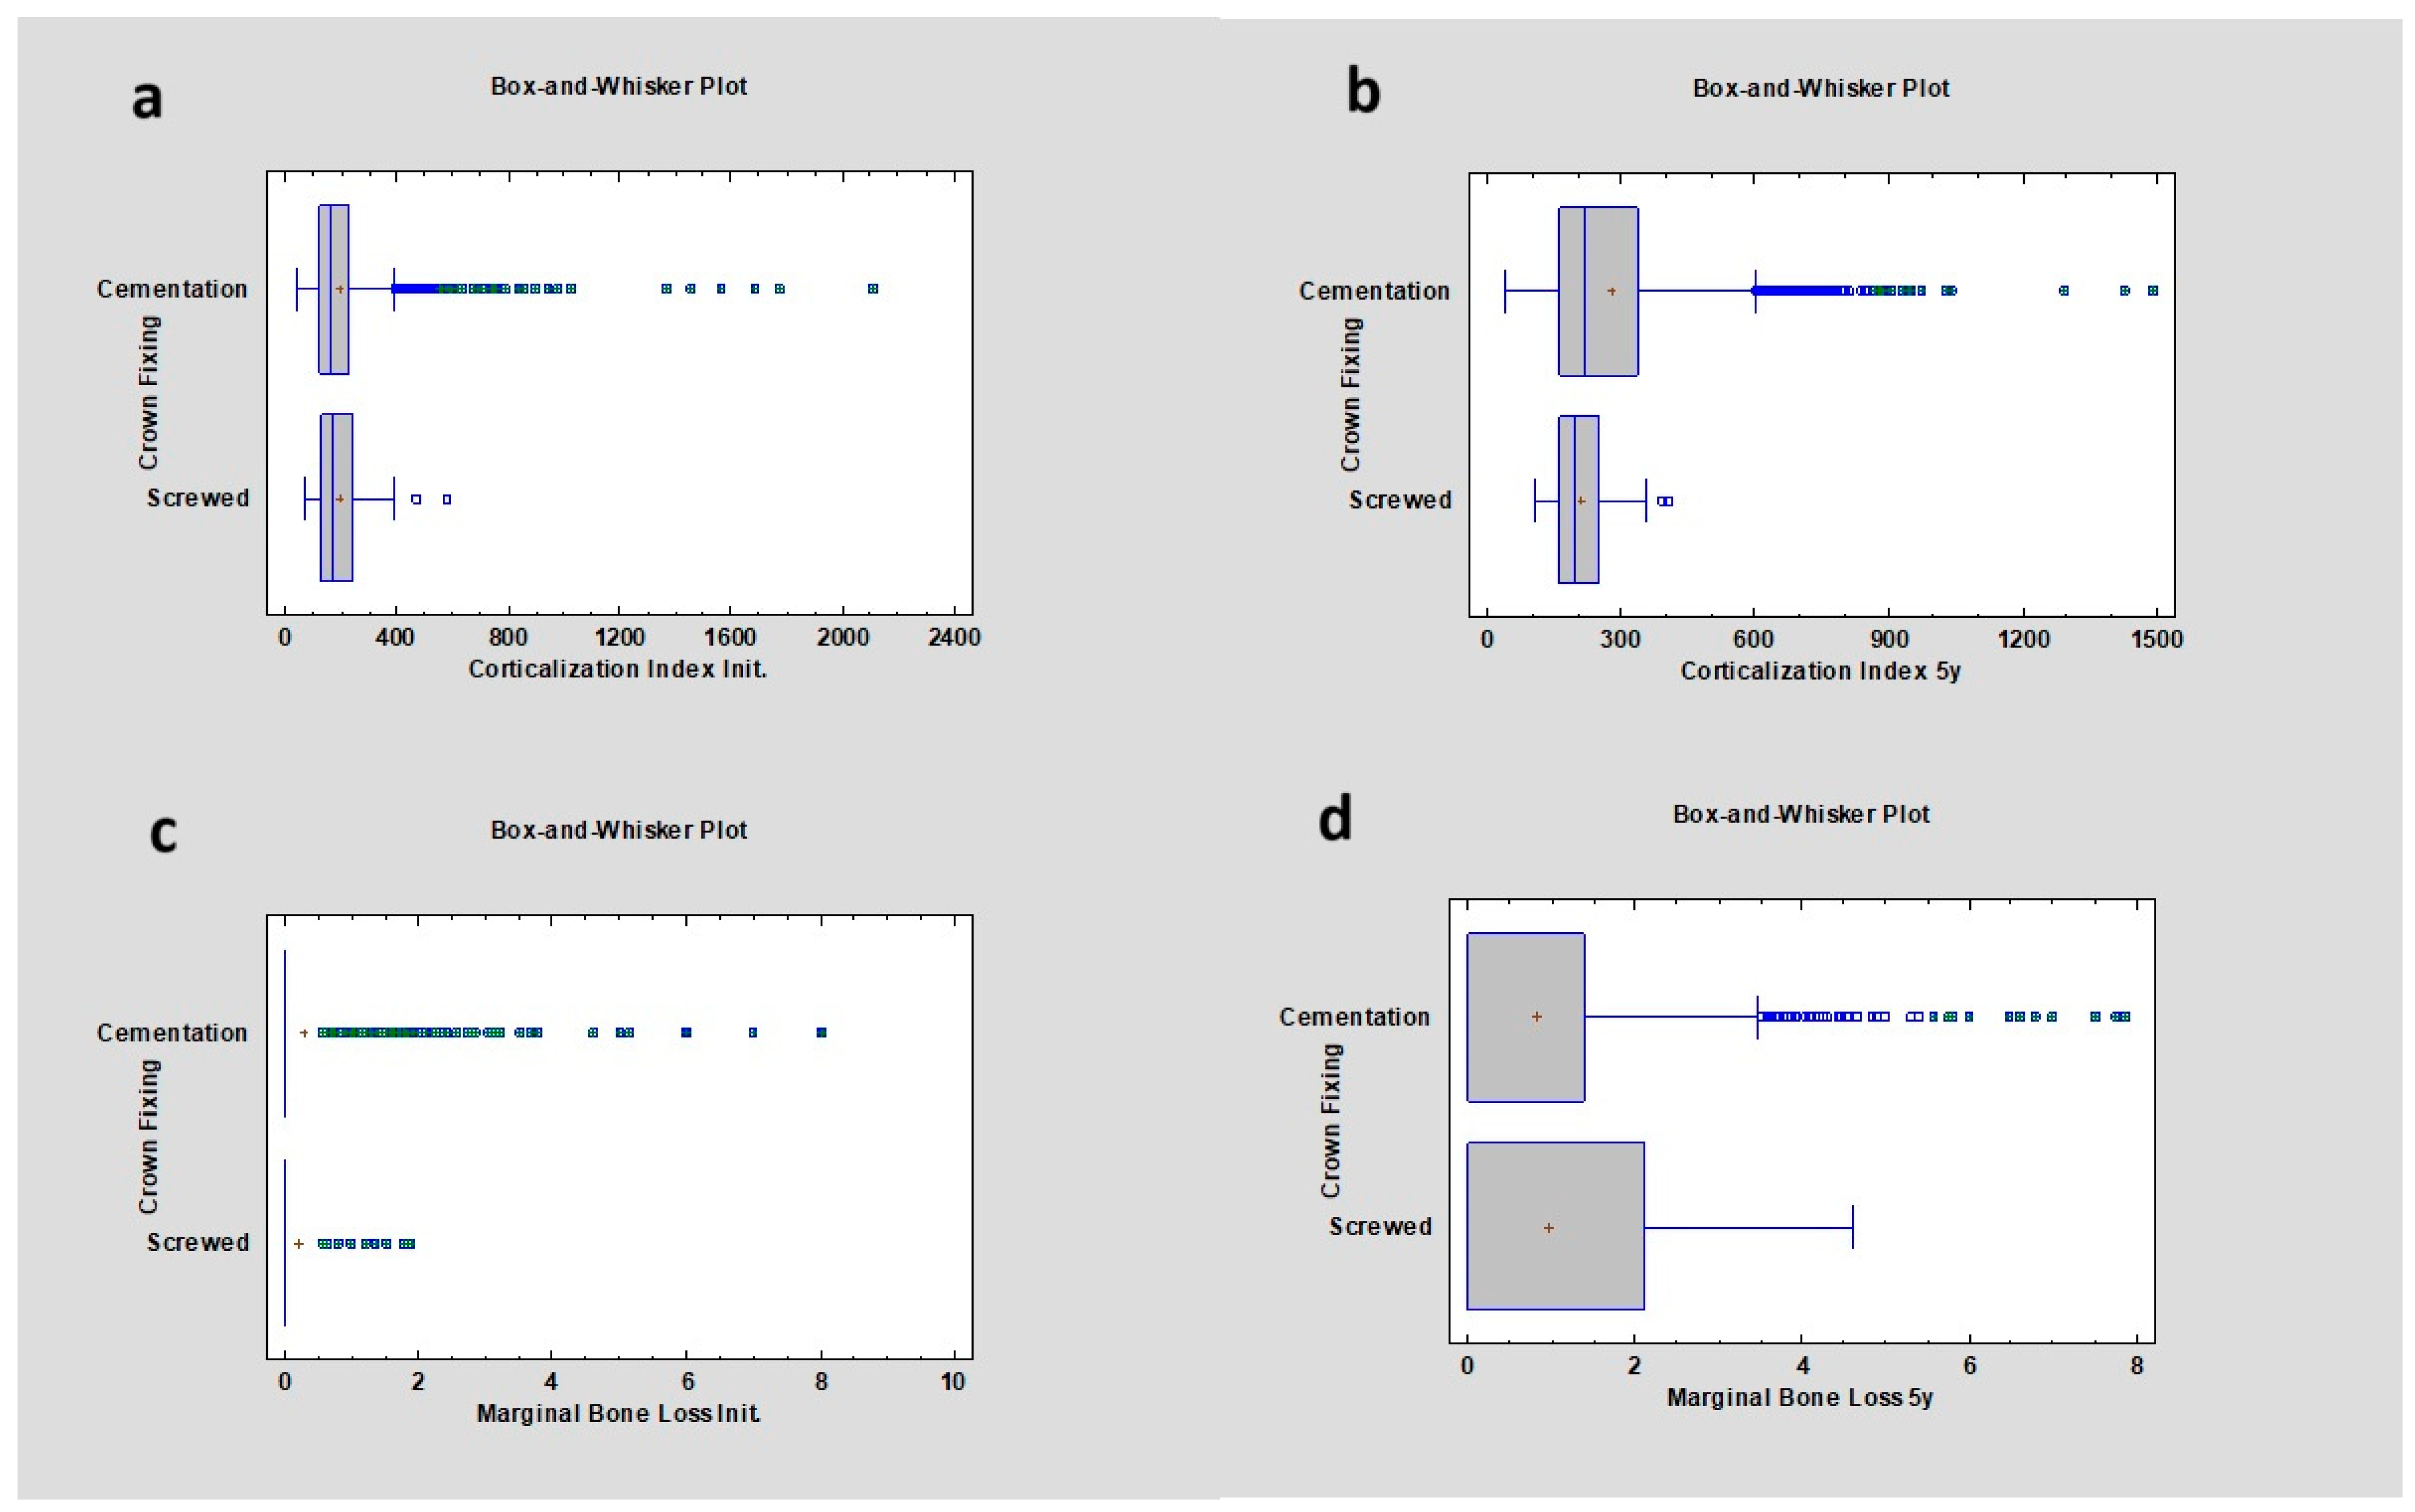
Figure 8.
Dependencies for all samples: (a) dependence of crown fixing (cemented vs screwed) on the corticalization index in the initial period; (b) dependence of crown fixing (cemented vs screwed) on the corticalization index after 5 years of observation; (c) dependence of crown fixing (cemented vs screwed) on marginal bone loss in the initial period; (d) dependence of crown fixing (cemented vs screwed) on marginal bone loss after 5 years of observation.
Figure 9.
Dependencies for all samples: (a) dependence of prosthetic retention loss on the corticalization index in the initial period; (b) dependence of prosthetic retention loss on the corticalization index after 5 years of observation; (c) dependence of prosthetic retention loss on marginal bone loss in the initial period; (d) dependence of prosthetic retention loss on marginal bone loss after 5 years of observation. The red asterisk describes statistically significant differences.
Figure 10.
Dependencies for all samples: (a) dependence of bridge length on the corticalization index in the initial period; (b) dependence of bridge length on the corticalization index after 5 years of observation; (c) dependence of bridge length on marginal bone loss in the initial period; (d) dependence of bridge length on marginal bone loss after 5 years of observation.
Figure 11.
Dependencies for all samples: (a) dependence of multiple retention losses on the corticalization index in the initial period; (b) dependence of multiple retention losses on the corticalization index after 5 years of observation; (c) dependence of multiple retention losses on marginal bone loss in the initial period; (d) dependence of multiple retention losses on marginal bone loss after 5 years of observation. The red asterisk describes statistically significant differences.
Figure 12.
Dependencies for all samples: (a) dependence of prosthetic fractures on the corticalization index in the initial period; (b) dependence of prosthetic fractures on the corticalization index after 5 years of observation; (c) dependence of prosthetic fractures on marginal bone loss in the initial period; (d) dependence of prosthetic fractures on marginal bone loss after 5 years of observation. The red asterisk describes statistically significant differences.
Table 1.
Inclusion criteria for the research.
Table 1.
Inclusion criteria for the research.
| Inclusion Criteria |
|---|
| 18 years of age |
| Bleeding on gingival probing < 20% |
| Probing depth ≤ 3 mm |
| Good oral hygiene |
| Regular follow ups |
| Two dimensional radiographs taken during the regular check |
Laboratory test:PTH, where norm is 10–60 pg/mL; TSH, where norm is 0.23–4.0 µU/mL; Calcium in serum (Ca2+), where norm is 9–11 mg/dL; HbA1c, where norm is <5%; Vitamin 25(OH)D3 (D3), where norm is 31–50 ng/mL
|
| Spine densitometry |
| Smoking 1 or more cigarettes per day |
Table 2.
Exclusion criteria for the research.
Table 2.
Exclusion criteria for the research.
| Exclusion Criteria |
|---|
| Lack of X-rays |
| Defective X-ray images in the visual assessment |
| Lack of laboratory tests |
Uncontrolled internal co-morbidity:Diabetes mellitus Thyroid dishormonoses Rheumatoid disease Other immunodeficiencies
|
| A history of oral radiation therapy |
| Past or current use of cytostatic drugs |
| Soft and bone tissue augmentation |
| Low quality or lack of follow-up radiographs |
Table 3.
Values for marginal bone loss and the corticalization index in the case of single crowns as prosthetic restoration. Values were calculated for all the implantations. 00 M—the observation period immediately after the implantation; 5 y—the observation period 5 years after the implantation.
Table 3.
Values for marginal bone loss and the corticalization index in the case of single crowns as prosthetic restoration. Values were calculated for all the implantations. 00 M—the observation period immediately after the implantation; 5 y—the observation period 5 years after the implantation.
| | Observation Period | Corticalization | p Value | Marginal Bone Loss | p Value |
|---|
| 1 single crown | 00 M | 149.55 ± 88.62 | p < 0.05 | 0 ± 1.03 mm | p < 0.05 |
| 5 y | 194.70 ± 189.08 | p < 0.05 | 0 ± 1.22 mm | p = 0.20 |
| 3 single crowns | 00 M | 261.41 ± 47.52 | p < 0.05 | 0 ± 0.58 mm | p = 0.39 |
| 5 y | 239.73 ± 70.87 | p = 0.20 | 1 ± 0.57 mm | p = 0.32 |
Table 4.
Values for marginal bone loss in the case of splinted crowns as prosthetic restoration. Values were calculated for all the implantations. 00 M—the observation period immediately after the implantation; 5 y—the observation period 5 years after the implantation.
Table 4.
Values for marginal bone loss in the case of splinted crowns as prosthetic restoration. Values were calculated for all the implantations. 00 M—the observation period immediately after the implantation; 5 y—the observation period 5 years after the implantation.
| | Observation Period | Marginal Bone Loss | p Value |
|---|
| 2 splinted crowns | 00 M | 0 ± 0.97 mm | p = 0.14 |
| 5 y | 0 ± 1.31 mm | p < 0.05 |
| 6 splinted crowns | 00 M | 0.00 ± 0.00 mm | p = 0.14 |
| 5 y | 0.00 ± 0.00 mm | p < 0.05 |
Table 5.
Values for marginal bone loss and the corticalization index in the case of overdenture and non-overdenture restorations. Values were calculated for all the implantations. 00 M—the observation period immediately after the implantation; 5 y—the observation period 5 years after the implantation.
| | Observation Period | Corticalization | p Value | Marginal Bone Loss | p Value |
|---|
| Overdenture | 00 M | 185.46 ± 162.46 | p < 0.05 | 0 ± 0.7 mm | p = 0.44 |
| 5 y | 359.91 ± 248.70 | p < 0.05 | 0.49 ± 1.47 mm | p < 0.05 |
| Non-overdenture | 00 M | 164.05 ± 144.87 | p < 0.05 | 0 ± 0.96 mm | p = 0.44 |
| 5 y | 218.57 ± 175.17 | p < 0.05 | 0 ± 1.23 mm | p < 0.05 |
Table 6.
Values for marginal bone loss and the corticalization index in the case of bridge restorations compared to non-bridge restorations. Values were calculated for all the implantations. 00 M—the observation period immediately after the implantation; 5 y—the observation period 5 years after the implantation.
| | Observation Period | Corticalization | p Value | Marginal Bone Loss | p Value |
|---|
| Non-bridge | 00 M | 163.41 ± 112.99 | p < 0.05 | 0 ± 0.95 mm | p < 0.05 |
| 5 y | 210.88 ± 187.64 | p < 0.05 | 0 ± 1.24 mm | p < 0.05 |
| Bridge | 00 M | 172.03 ± 208.84 | p < 0.05 | 0 ± 0.91 mm | p < 0.05 |
| 5 y | 250.96 ± 165.89 | p < 0.05 | 0 ± 1.30 mm | p < 0.05 |
Table 7.
Values for marginal bone loss and the corticalization index in the case of platform switching presence or absence. Values were calculated for all the implantations. 00 M—the observation period immediately after the implantation; 5 y—the observation period 5 years after the implantation; PS—platform switching; no PS—no platform switching.
| | Observation Period | Corticalization | p Value | Marginal Bone Loss | p Value |
|---|
| No PS | 00 M | 170.65 ± 157.85 | p < 0.05 | 0 ± 0.96 mm | p = 0.26 |
| 5 y | 227.23 ± 190.46 | p < 0.05 | 0 ± 1.29 mm | p = 0.15 |
| PS | 00 M | 155.50 ± 95.73 | p < 0.05 | 0 ± 0.86 mm | p = 0.26 |
| 5 y | 196.50 ± 139.84 | p < 0.05 | 0 ± 1.10 mm | p = 0.15 |
Table 8.
Values for marginal bone loss and the corticalization index in the case of the crown fixation method. Values were calculated for all the implantations. 00 M—the observation period immediately after the implantation; 5 y—the observation period 5 years after the implantation.
Table 8.
Values for marginal bone loss and the corticalization index in the case of the crown fixation method. Values were calculated for all the implantations. 00 M—the observation period immediately after the implantation; 5 y—the observation period 5 years after the implantation.
| | Observation Period | Corticalization | p Value | Marginal Bone Loss | p Value |
|---|
| Cemented | 00 M | 162.74 ± 147.50 | p = 0.26 | 0 ± 0.98 mm | p = 0.63 |
| 5 y | 218.57 ± 179.20 | p = 0.05 | 0 ± 1.26 mm | p = 0.52 |
| Screwed | 00 M | 168.99 ± 96.99 | p = 0.06 | 0 ± 0.46 mm | p = 0.63 |
| 5 y | 194.14 ± 71.81 | p = 0.05 | 0 ± 1.29 mm | p = 0.52 |
Table 9.
Values for marginal bone loss and the corticalization index in the case of the presence or absence of prosthetic restoration retention loss. Values were calculated for all the implantations. 00 M—the observation period immediately after the implantation; 5 y—the observation period 5 years after the implantation.
| | Observation Period | Corticalization | p Value | Marginal Bone Loss | p Value |
|---|
| No retention loss | 00 M | 167.51 ± 150.67 | p = 0.44 | 0 ± 0.96 mm | p = 0.63 |
| 5 y | 224.91 ± 186.13 | p < 0.05 | 0 ± 1.16 mm | p = 0.52 |
| Retention loss | 00 M | 163.75 ± 127.30 | p = 0.44 | 0 ± 0.86 mm | p = 0.63 |
| 5 y | 206.92 ± 169.88 | p < 0.05 | 0 ± 1.5 mm | p = 0.52 |
Table 10.
Values for marginal bone loss and the corticalization index in the case of the presence of multiple retention and multiple retention losses after 5 years. Values were calculated for all the implantations. 00 M—the observation period immediately after the implantation; 5 y—the observation period 5 years after the implantation.
| Retention Loss Times | Observation Period | Corticalization | p Value | Marginal Bone Loss | p Value |
|---|
| 1 | 00 M | 160.64 ± 123.28 | p = 0.56 | 0 ± 1.06 | p = 0.53 |
| 5 y | 205.265 ± 191.77 | p < 0.05 | 0 ± 1.00 | p < 0.05 |
| 2 | 00 M | 153.92 ± 124.62 | p = 0.56 | 0 ± 0.52 | p = 0.53 |
| 5 y | 247.73 ± 185.04 | p < 0.05 | 1.03 ± 1.15 | p < 0.05 |
| 3 | 00 M | 170.04 ± 74.92 | p = 0.56 | 0 ± 0.65 | p = 0.53 |
| 5 y | 174.35 ± 162.25 | p < 0.05 | 0 ± 0.32 | p < 0.05 |
| 4 | 00 M | 130.33 ± 47.44 | p = 0.56 | 0 ± 0 | p = 0.53 |
| 5 y | 152.86 ± 93.645 | p < 0.05 | 0 ± 0.33 | p < 0.05 |
| 5 | 00 M | 157.35 ± 51.78 | p = 0.56 | 0 ± 0.35 | p = 0.53 |
| 5 y | 199.91 ± 88.29 | p < 0.05 | 2.42 ± 1.72 | p < 0.05 |
Table 11.
Values for marginal bone loss and the corticalization index in the case of the presence or absence of prosthetic fracture. Values were calculated for all the implantations. 00 M—the observation period immediately after the implantation; 5 y—the observation period 5 years after the implantation; No PF—no prosthetic fracture; PF—prosthetic fracture.
| | Observation Period | Corticalization | p Value | Marginal Bone Loss | p Value |
|---|
| No PF | 00 M | 167.76 ± 147.47 | p < 0.05 | 0 ± 0.94 mm | p = 0.51 |
| 5 y | 221.68 ± 182.87 | p = 0.73 | 0 ± 1.24 mm | p = 0.38 |
| PF | 00 M | 146.73 ± 47.89 | p < 0.05 | 0 ± 1.16 mm | p = 0.51 |
| 5 y | 209.19 ± 170.13 | p = 0.73 | 0 ± 1.8 mm | p = 0.38 |

 ,
, 


