
Preoperative Lower-Limb Muscle Predictors for Gait Speed Improvement after Total Hip Arthroplasty for Patients with Osteoarthritis
 , ,
, ,
Abstract
:1. Introduction
2. Materials and Methods
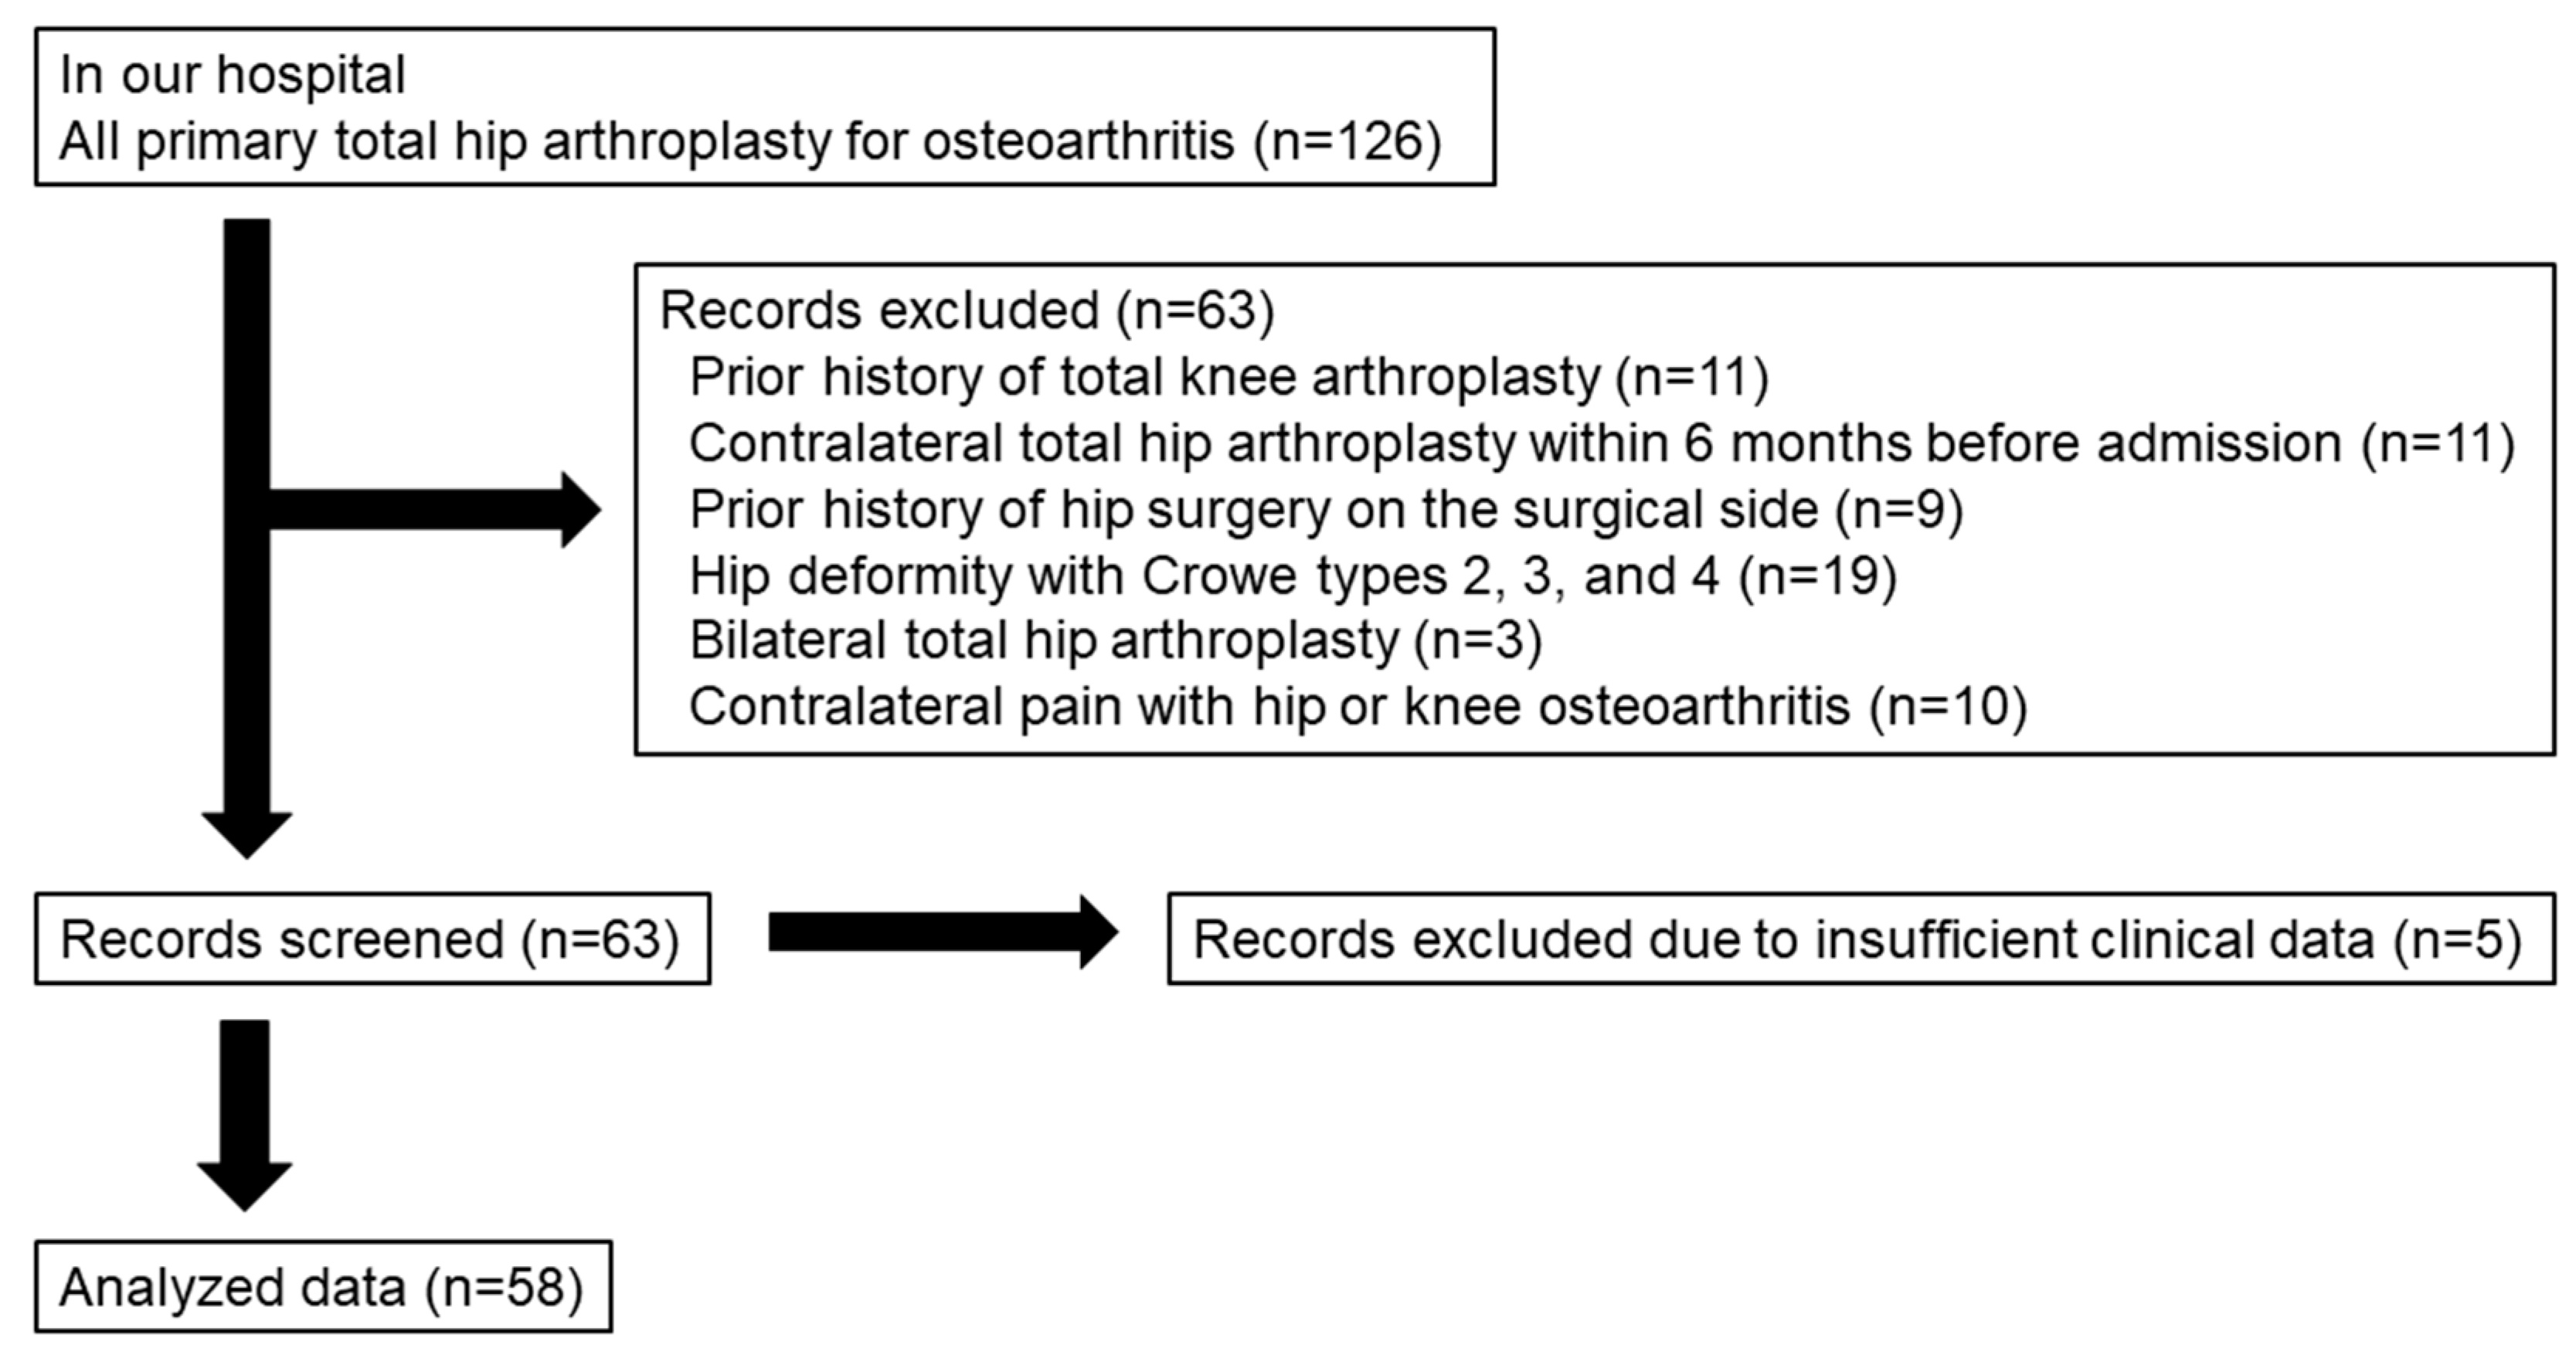
2.1. Patient Selection
2.2. Operation and Postoperative Rehabilitation
2.3. Muscle Composition
2.4. Functional Outcome Measures
2.5. Statistical Analysis
3. Results
3.1. Demographics, Gait Speed, and Muscle Strength
3.2. Preoperative Muscle Composition of the Operated Limb
3.3. Correlations of Gait Speed Improvement with Muscle Composition and Strength
3.4. Preoperative Predictors for the MCII in Gait Speed
4. Discussion
5. Conclusions
Author Contributions
Funding
Institutional Review Board Statement
Informed Consent Statement
Data Availability Statement
Acknowledgments
Conflicts of Interest
References
- Jones, C.A.; Cox, V.; Jhangri, G.S.; Suarez-Almazor, M.E. Delineating the Impact of Obesity and its Relationship on Recovery after Total Joint Arthroplasties. Osteoarthr. Cartil. 2012, 20, 511–518. [Google Scholar] [CrossRef]
- Halawi, M.J.; Jongbloed, W.; Baron, S.; Savoy, L.; Williams, V.J.; Cote, M.P. Patient Dissatisfaction after Primary Total Joint Arthroplasty: The Patient Perspective. J. Arthroplast. 2019, 34, 1093–1096. [Google Scholar] [CrossRef] [PubMed]
- Dobson, F.; Hinman, R.S.; Hall, M.; Marshall, C.J.; Sayer, T.; Anderson, C.; Newcomb, N.; Stratford, P.W.; Bennell, K.L. Reliability and Measurement Error of the Osteoarthritis Research Society International (OARSI) Recommended Performance-based Tests of Physical Function in People with Hip and Knee Osteoarthritis. Osteoarthr. Cartil. 2017, 25, 1792–1796. [Google Scholar] [CrossRef] [PubMed]
- Foucher, K.C. Identifying Clinically Meaningful Benchmarks for Gait Improvement after Total Hip Arthroplasty. J. Orthop. Res. 2016, 34, 88–96. [Google Scholar] [CrossRef]
- Flack, N.A.M.S.; Nicholson, H.D.; Woodley, S.J. A Review of the Anatomy of the Hip Abductor Muscles, Gluteus Medius, Gluteus Minimus, and Tensor Fascia Lata. Clin. Anat. 2012, 25, 697–708. [Google Scholar] [CrossRef] [PubMed]
- Cinnamon, C.C.; Longworth, J.A.; Brunner, J.H.; Chau, V.K.; Ryan, C.A.; Dapiton, K.R.; Chmell, S.J.; Foucher, K.C. Static and Dynamic Abductor Function are Both Associated with Physical Function 1 to 5 Years after Total Hip Arthroplasty. Clin. Biomech. 2019, 67, 127–133. [Google Scholar] [CrossRef]
- Grimaldi, A.; Richardson, C.; Durbridge, G.; Donnelly, W.; Darnell, R.; Hides, J. The Association between Degenerative Hip Joint Pathology and Size of the Gluteus Maximus and Tensor Fascia Lata Muscles. Man. Ther. 2009, 14, 611–617. [Google Scholar] [CrossRef]
- Addison, O.; Young, P.; Inacio, M.; Bair, W.-N.; Prettyman, M.G.; Beamer, B.A.; Ryan, A.S.; Rogers, M.W. Hip but not Thigh Intramuscular Adipose Tissue is Associated with Poor Balance and Increased Temporal Gait Variability in Older Adults. Curr. Aging Sci. 2014, 7, 137–143. [Google Scholar] [CrossRef]
- Goodpaster, B.H.; Carlson, C.L.; Visser, M.; Kelley, D.E.; Scherzinger, A.; Harris, T.B.; Stamm, E.; Newman, A.B. Attenuation of Skeletal Muscle and Strength in the Elderly: The Health ABC Study. J. Appl. Physiol. 2001, 90, 2157–2165. [Google Scholar] [CrossRef]
- Frontera, W.R.; Hughes, V.A.; Lutz, K.J.; Evans, W.J. A Cross-sectional Study of Muscle Strength and Mass in 45- to 78-yr Old Men and Women. J. Appl. Physiol. 1991, 71, 644–650. [Google Scholar] [CrossRef]
- Goodpaster, B.H.; Park, S.W.; Harris, T.B.; Kritchevsky, S.B.; Nevitt, M.; Schwartz, A.V.; Simonsick, E.M.; Tylavsky, F.A.; Visser, M.; Newman, A.B. The Loss of Skeletal Muscle Strength, Mass, and Quality in Older Adults: The Health, Aging and Body Composition Study. J. Gerontol. A Biol. Sci. Med. Sci. 2006, 61, 1059–1064. [Google Scholar] [CrossRef]
- Kim, S.; Won, C.W. Sex-different Changes of Body Composition in Aging: A Systemic Review. Arch. Gerontol. Geriatr. 2022, 102, 104711. [Google Scholar] [CrossRef]
- Lanyon, P.; Muir, K.; Doherty, S.; Doherty, M. Age and Sex Differences in Hip Joint Space among Asymptomatic Subjects without Structural Change: Implications for Epidemiologic Studies. Arthritis Rheum. 2003, 48, 1041–1046. [Google Scholar] [CrossRef] [PubMed]
- Srikanth, V.K.; Fryer, J.L.; Zhai, G.; Winzenberg, T.M.; Hosmer, D.; Jones, G. A Meta-analysis of Sex Differences Prevalence, Incidence and Severity of Osteoarthritis. Osteoarthr. Cartil. 2005, 13, 769–781. [Google Scholar] [CrossRef] [PubMed]
- Prieto-Alhambra, D.; Judge, A.; Javaid, M.K.; Cooper, C.; Diez-Perez, A.; Arden, N.K. Incidence and Risk Factors for Clinically Diagnosed Knee, Hip and Hand Osteoarthritis: Influences of Age, Gender and Osteoarthritis Affecting Other Joints. Ann. Rheum. Dis. 2014, 73, 1659–1664. [Google Scholar] [CrossRef] [PubMed]
- Crowe, J.F.; Mani, V.J.; Ranawat, C.S. Total Hip Replacement in Congenital Dislocation and Dysplasia of the Hip. J. Bone Joint Surg. Am. 1979, 61, 15–23. [Google Scholar] [CrossRef]
- Kuroda, Y.; Akiyama, H.; Nankaku, M.; So, K.; Matsuda, S. Modified Mostardi Approach with Ultra-high-molecular-weight Polyethylene Tape for Total Hip Arthroplasty Provides a Good Rate of Union of Osteotomized Fragments. J. Orthop. Sci. 2015, 20, 633–641. [Google Scholar] [CrossRef]
- Yasuda, T.; Ota, S.; Yamashita, S.; Tsukamoto, Y.; Onishi, E. Association of Preoperative Variables of Ipsilateral Hip Abductor Muscles with Gait Function after Total Hip Arthroplasty: A Retrospective Study. Arthroplasty 2022, 4, 23. [Google Scholar] [CrossRef]
- Homma, D.; Minato, I.; Imai, N.; Miyasaka, D.; Sakai, Y.; Horigome, Y.; Suzuki, H.; Dohmae, Y.; Endo, N. Appropriate Sites for the Measurement of the Cross-Sectional Area of the Gluteus Maximus and the Gluteus Medius Muscles in Patients with Hip Osteoarthritis. Surg. Radiol. Anat. 2021, 43, 45–52. [Google Scholar] [CrossRef]
- Ohmori, T.; Kabata, T.; Kato, S.; Takagi, T.; Kajino, Y.; Inoue, D.; Taga, T.; Yamamoto, T.; Kurokawa, Y.; Yoshitani, J.; et al. The Efficacy of Total Hip Arthroplasty on Locomotive Syndrome and its Related Physical Function in Patients with Hip Osteoarthritis. J. Orthop. Sci. 2021, 26, 389–395. [Google Scholar] [CrossRef]
- Kamimura, A.; Sakakima, H.; Tsutsumi, F.; Sunahara, N. Preoperative Predictors of Ambulation Ability at Different Time Points after Total Hip Arthroplasty in Patients with Osteoarthritis. Rehabilitation Res. Pract. 2014, 2014, 861268. [Google Scholar] [CrossRef]
- Rosa-Caldwell, M.E.; Greene, N.P. Muscle Metabolism and Atrophy: Let’s Talk about Sex. Biol. Sex Differ. 2019, 10, 43. [Google Scholar] [CrossRef]
- Mauvais-Jarvis, F. Sex Differences in Metabolic Homeostasis, Diabetes, and Obesity. Biol. Sex Differ. 2015, 6, 14. [Google Scholar] [CrossRef]
- Callahan, D.M.; Bedrin, N.G.; Subramanian, M.; Berking, J.; Ades, P.A.; Toth, M.J.; Miller, M.S. Age-related Structural Alterations in Human Skeletal Muscle Fibers and Mitochondria are Sex Specific: Relationship to Single-fiber Function. J. Appl. Physiol. 2014, 116, 1582–1592. [Google Scholar] [CrossRef]
- Haizlip, K.M.; Harrison, B.C.; Leinwand, L.A. Sex-based Differences in Skeletal Muscle Kinetics and Fiber-type Composition. Physiology 2015, 30, 30–39. [Google Scholar] [CrossRef] [PubMed]
- Gao, Y.; Arfat, Y.; Wang, H.; Goswami, N. Muscle Atrophy Induced by Mechanical Unloading: Mechanisms and Potential Countermeasures. Front. Physiol. 2018, 9, 235. [Google Scholar] [CrossRef] [PubMed]
- Thomason, D.B.; Herrick, R.E.; Surdyka, D.; Baldwin, K.M. Time Course of Soleus Muscle Myosin Expression during Hindlimb Suspension and Recovery. J. Appl. Physiol. 1987, 63, 130–137. [Google Scholar] [CrossRef] [PubMed]
- Zacharias, A.; Pizzari, T.; English, D.J.; Kapakoulakis, T.; Green, R.A. Hip Abductor Muscle Volume in Hip Osteoarthritis and Matched Controls. Osteoarthr. Cartil. 2016, 24, 1727–1735. [Google Scholar] [CrossRef]
- Hides, J.A.; Stokes, M.J.; Saide, M.; Jull, G.A.; Cooper, D.H. Evidence of Lumbar Multifidus Muscle Wasting Ipsilateral to Symptoms in Patients with Acute/Subacute Low Back Pain. Spine (Phila Pa 1976) 1994, 19, 165–172. [Google Scholar] [CrossRef]
- Power, M.L.; Schulkin, J. Sex Differences in Fat Storage, Fat Metabolism, and the Health Risks from Obesity: Possible Evolutionary Origins. Br. J. Nutr. 2008, 99, 931–940. [Google Scholar] [CrossRef]
- Ewen, A.M.; Stewart, S.; St Clair Gibson, A.; Kashyap, S.N.; Caplan, N. Post-operative Gait Analysis in Total Hip Replacement Patients—A Review of Current Literature and Meta-analysis. Gait Posture 2012, 36, 1–6. [Google Scholar] [CrossRef] [PubMed]
- Weber, M.; Weber, T.; Woerner, M.; Craiovan, B.; Worlicek, M.; Winkler, S.; Grifka, J.; Renkawitz, T. The Impact of Standard Combined Anteversion Definitions on Gait and Clinical Outcome within One Year after Total Hip Arthroplasty. Int. Orthop. 2015, 39, 2323–2333. [Google Scholar] [CrossRef] [PubMed]
- Oosting, E.; Hoogeboom, T.J.; Appelman-de Vries, S.A.; Swets, A.; Dronkers, J.J.; van Meeteren, N.L. Preoperative Prediction of Inpatient Recovery of Function after Total Hip Arthroplasty Using Performance-based Tests: A Prospective Cohort Study. Disabil. Rehabil. 2016, 38, 1243–1249. [Google Scholar] [CrossRef] [PubMed]
- Behery, O.A.; Foucher, K.C. Are Harris Hip Scores and Gait Mechanics Related before and after THA? Clin. Orthop. Relat. Res. 2014, 472, 3452–3461. [Google Scholar] [CrossRef] [PubMed]
- Boardman, D.L.; Dorey, F.; Thomas, B.J.; Lieberman, J.R. The Accuracy of Assessing Total Hip Arthroplasty Outcomes: A Prospective Correlation Study of Walking Ability and 2 Validated Measurement Devices. J. Arthroplast. 2000, 15, 200–204. [Google Scholar] [CrossRef]
- Unnanuntana, A.; Mait, J.E.; Shaffer, A.D.; Lane, J.M.; Mancuso, C.A. Performance-based Tests and Self-reported Questionnaires Provide Distinct Information for the Preoperative Evaluation of Total Hip Arthroplasty Patients. J. Arthroplast. 2012, 27, 770–775. [Google Scholar] [CrossRef]
- Tubach, F.; Ravaud, P.; Baron, G.; Falissard, B.; Logeart, I.; Bellamy, N.; Bombardier, C.; Felson, D.; Hochberg, M.; van der Heijde, D.; et al. Evaluation of Clinically Relevant Changes in Patient Reported Outcomes in Knee and Hip Osteoarthritis: The Minimal Clinically Important Improvement. Ann. Rheum. Dis. 2005, 64, 29–33. [Google Scholar] [CrossRef]
- Kivle, K.; Lindland, E.S.; Mjaaland, K.E.; Svenningsen, S.; Nordsletten, L. Gluteal Atrophy and Fatty Infiltration in End-stage Osteoarthritis of the Hip. Bone Jt. Open 2021, 2, 40–47. [Google Scholar] [CrossRef]
- Goutallier, D.; Postel, J.M.; Bernageau, J.; Lavau, L.; Voisin, M.C. Fatty Muscle Degeneration in Cuff Ruptures. Pre- and Postoperative Evaluation by CT Scan. Clin. Orthop. Relat. Res. 1994, 304, 78–83. [Google Scholar] [CrossRef]
- Solarino, G.; Bizzoca, D.; Moretti, A.M.; D’Apolito, R.; Moretti, B.; Zagra, L. Sex and Gender-related Differences in the Outcome of Total Hip Arthroplasty: A Current Concepts Review. Medicina 2022, 58, 1702. [Google Scholar] [CrossRef]
- Gottschalk, F.; Kourosh, S.; Leveau, B. The Functional Anatomy of Tensor Fasciae Latae and Gluteus Medius and Minimus. J. Anat. 1989, 166, 179–189. [Google Scholar] [PubMed]
- Beck, M.; Sledge, J.B.; Gautier, E.; Dora, C.F.; Ganz, R. The Anatomy and Function of the Gluteus Minimus Muscle. J. Bone Joint Surg. Br. 2000, 82, 358–363. [Google Scholar] [CrossRef] [PubMed]
- Buirs, L.D.; Van Beers, L.W.; Scholtes, V.A.; Pastoors, T.; Sprague, S.; Poolman, R.W. Predictors of Physical Functioning after Total Hip Arthroplasty: A Systematic Review. BMJ Open 2016, 6, e010725. [Google Scholar] [CrossRef] [PubMed]
- Pfirrmann, C.W.; Notzli, H.P.; Dora, C.; Hodler, J.; Zanetti, M. Abductor Tendons and Muscle Assessed at MR Imaging after Total Hip Arthroplasty in Asymptomatic and Symptomatic Patients. Radiology 2005, 235, 969–976. [Google Scholar] [CrossRef] [PubMed]
- Marcus, R.L.; Addison, O.; Dibble, L.E.; Foreman, K.B.; Morrell, G.; Lastayo, P. Intramuscular Adipose Tissue, Sarcopenia, and Mobility Function in Older Individuals. J. Aging Res. 2012, 2012, 629637. [Google Scholar] [CrossRef]


| Total (n = 58) | Females (n = 45) | Males (n = 13) | p Value | Effect Size (r) | |
|---|---|---|---|---|---|
| Age (years) | 70.9 (9.5) | 70.4 (9.0) | 72.5 (11.4) | 0.481 * | 0.09 |
| Body mass index (kg/m2) | 23.0 (3.4) | 22.4 (3.4) | 24.9 (2.7) | 0.018 * | 0.31 |
| Gait speed (m/s) | |||||
| Preoperative | 0.87 (0.32) | 0.88 (0.29) | 0.81 (0.44) | 0.598 * | 0.07 |
| Postoperative | 1.09 (0.23) | 1.07 (0.21) | 1.16 (0.30) | 0.295 * | 0.14 |
| Improvement | 0.22 (0.28) | 0.18 (0.28) | 0.35 (0.25) | 0.055 * | 0.25 |
| Ipsilateral knee extensor strength (Nm/kg) | |||||
| Preoperative | 0.84 (0.33) | 0.82 (0.32) | 0.92 (0.37) | 0.334 * | 0.13 |
| Postoperative | 1.08 (0.41) | 1.01 (0.35) | 1.32 (0.48) | 0.026 ** | 0.32 |
| Contralateral knee extensor strength (Nm/kg) | |||||
| Preoperative | 1.08 (0.44) | 0.99 (0.36) | 1.41 (0.52) | 0.006 ** | 0.35 |
| Postoperative | 1.23 (0.46) | 1.14 (0.41) | 1.53 (0.50) | 0.016 ** | 0.36 |
| Ipsilateral hip abductor strength (Nm/kg) | |||||
| Preoperative | 0.44 (0.21) | 0.43 (0.21) | 0.47 (0.21) | 0.565 * | 0.08 |
| Postoperative | 0.73 (0.27) | 0.71 (0.27) | 0.80 (0.30) | 0.307 * | 0.14 |
| Contralateral hip abductor strength (Nm/kg) | |||||
| Preoperative | 0.54 (0.24) | 0.53 (0.22) | 0.59 (0.29) | 0.452 * | 0.10 |
| Postoperative | 0.80 (0.34) | 0.76 (0.31) | 0.94 (0.40) | 0.092 * | 0.22 |
| Glutei medius and minimus | Gluteus maximus | |||||||||
|---|---|---|---|---|---|---|---|---|---|---|
| Total (n = 58) | Females (n = 45) | Males (n = 13) | p Value | Effect Size (r) | Total (n = 58) | Females (n = 45) | Males (n = 13) | p Value | Effect Size (r) | |
| TM (cm2/m2) | 13.4 (2.3) | 12.9 (2.3) | 15.2 (1.5) | 0.001 * | 0.41 | 9.6 (2.2) | 9.3 (2.2) | 10.7 (2.0) | 0.046 * | 0.26 |
| LMM (cm2/m2) | 7.6 (2.6) | 7.3 (2.6) | 8.8 (2.5) | 0.061 * | 0.25 | 4.6 (2.5) | 4.3 (2.3) | 5.8 (2.7) | 0.045 * | 0.26 |
| LMM/ TM (%) | 55.8 (13.2) | 55.4 (13.5) | 57.3 (12.7) | 0.642 * | 0.06 | 46.5 (18.8) | 44.5 (18.1) | 53.5 (20.2) | 0.128 * | 0.20 |
| LDL (cm2/m2) | 3.5 (0.8) | 3.4 (0.9) | 3.9 (1.0) | 0.085 * | 0.23 | 3.5 (1.2) | 3.5 (1.1) | 3.5 (1.5) | 0.952 * | 0.01 |
| LDL/ TM (%) | 26.6 (7.1) | 26.8 (6.9) | 26.0 (8.0) | 0.726 * | 0.05 | 36.9 (10.8) | 38.0 (10.0) | 33.3 (13.1) | 0.171 * | 0.18 |
| mFAT (cm2/m2) | 2.2 (1.5) | 2.2 (1.5) | 2.1 (1.3) | 0.933 ** | 0.01 | 1.2 (0.6) | 1.3 (0.6) | 0.9 (0.5) | 0.061 ** | 0.25 |
| mFAT/ TM (%) | 17.7 (14.2) | 18.7 (15.2) | 14.3 (9.3) | 0.450 ** | 0.10 | 13.0 (7.8) | 14.3 (8.1) | 8.7 (4.9) | 0.021 ** | 0.30 |
| IMAT (cm2/m2) | 5.7 (2.1) | 5.6 (2.1) | 6.0 (2.1) | 0.634 ** | 0.06 | 4.6 (1.6) | 4.7 (1.5) | 4.4 (1.8) | 0.517 * | 0.09 |
| IMAT/ TM (%) | 44.3 (20.1) | 45.4 (21.0) | 40.3 (16.6) | 0.337 ** | 0.13 | 49.9 (16.4) | 52.3 (15.8) | 42.0 (16.5) | 0.046 * | 0.26 |
| Muscle Composition | ||||||
|---|---|---|---|---|---|---|
| Total | Female | |||||
| Admission | 6 Months | Improvement | Admission | 6 Months | Improvement | |
| Glutei medius and minimus | ||||||
| TM | 0.010 | 0.007 | −0.005 | 0.032 | −0.118 | −0.121 |
| LMM | 0.283 * | 0.158 | −0.199 | 0.363 * | 0.101 | −0.301 * |
| LMM/TM | 0.410 ** | 0.238 | −0.280 * | 0.505 ** | 0.245 | −0.341 * |
| LDL | −0.440 ** | −0.304 * | 0.261 * | −0.532 ** | −0.431 ** | 0.232 |
| LDL/TM | −0.428 ** | −0.301 * | 0.249 | −0.529 ** | −0.333 * | 0.301 * |
| mFAT | −0.326 * | −0.224 | 0.195 | −0.388 ** | −0.263 | 0.207 |
| mFAT/TM | −0.250 | −0.210 | 0.116 | −0.302 * | −0.220 | 0.149 |
| IMAT | −0.420 ** | −0.289 * | 0.250 | −0.501 ** | −0.368 * | 0.246 |
| IMAT/TM | −0.326 * | −0.254 | 0.170 | −0.391 ** | −0.268 | 0.206 |
| Gluteus maximus | ||||||
| TM | 0.486 ** | 0.418 ** | −0.219 | 0.569 ** | 0.346 * | −0.333 * |
| LMM | 0.514 ** | 0.471 ** | −0.207 | 0.535 ** | 0.416 ** | −0.245 |
| LMM/TM | 0.392 ** | 0.390 ** | −0.132 | 0.392 ** | 0.372 * | −0.130 |
| LDL | 0.012 | 0.006 | −0.009 | 0.158 | 0.043 | −0.132 |
| LDL/TM | −0.326 * | −0.294 * | 0.136 | −0.307 * | −0.246 | 0.135 |
| mFAT | −0.147 | −0.269 * | −0.052 | −0.108 | −0.272 | −0.091 |
| mFAT/TM | −0.358 * | −0.407 ** | 0.079 | −0.401 ** | −0.409 ** | 0.112 |
| IMAT | −0.05 | −0.103 | −0.028 | 0.071 | −0.084 | −0.137 |
| IMAT/TM | −0.385 ** | −0.387 ** | 0.127 | −0.399 ** | −0.365 * | 0.143 |
| Muscle strength | ||||||
| Total | Female | |||||
| Admission | 6 months | Improvement | Admission | 6 months | Improvement | |
| Knee extensor | ||||||
| Ipsilateral | 0.387 ** | 0.383 ** | −0.133 | 0.407 ** | 0.354 * | −0.158 |
| Contralateral | 0.330 * | 0.437 ** | −0.021 | 0.318 * | 0.272 | −0.128 |
| Hip abductor | ||||||
| Ipsilateral | 0.320 * | 0.293 * | −0.130 | 0.211 | 0.150 | −0.107 |
| Contralateral | 0.303 * | 0.319 * | −0.087 | 0.210 | 0.171 | −0.091 |
| Independent Variable | B | SE (B) | β | t | p | 95% CI | Adjusted R2 | |
|---|---|---|---|---|---|---|---|---|
| Total | Glutei medius and minimus LMM/TM | −0.006 | 0.003 | −0.280 | −2.185 | 0.033 | −0.011, 0.000 | 0.062 |
| Female | Glutei medius and minimus LMM/TM | −0.007 | 0.003 | −0.341 | −2.381 | 0.022 | −0.013, −0.001 | 0.117 |
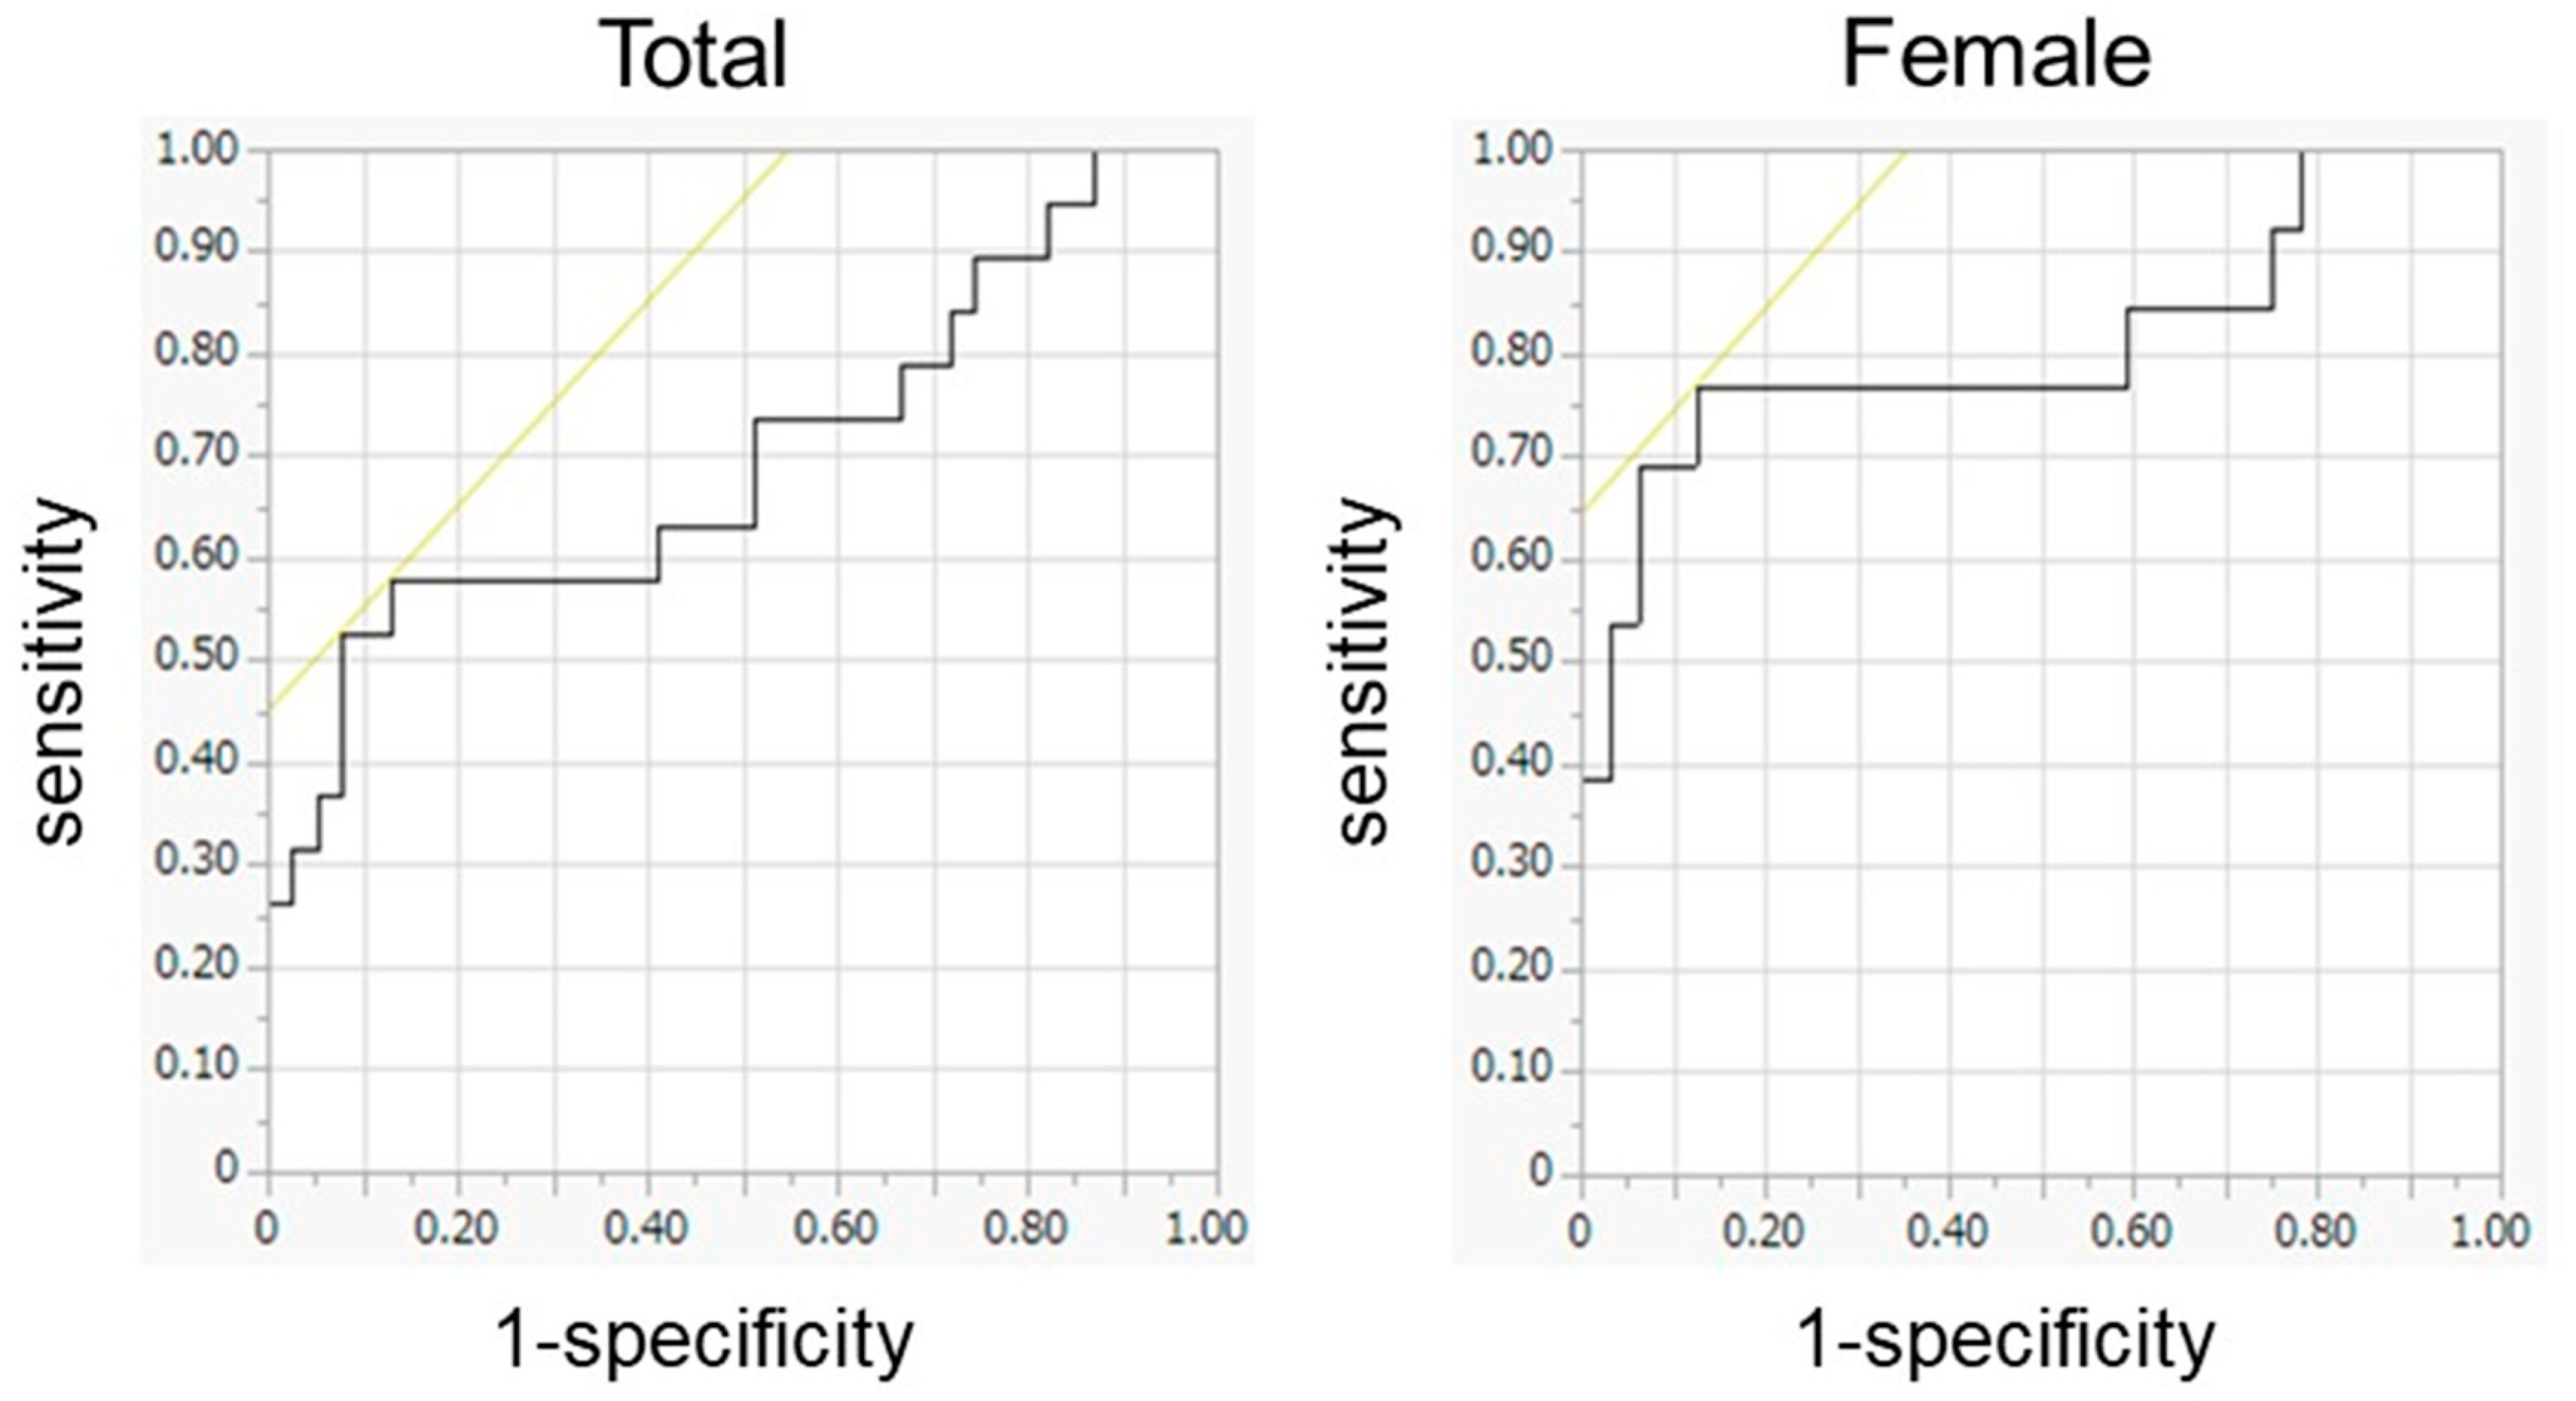
| Muscle Composition | ||||||
|---|---|---|---|---|---|---|
| Total | Female | |||||
| AUC | p Value | SE (95% CI) | AUC | p Value | SE (95% CI) | |
| Glutei medius and minimus | ||||||
| TM | 0.502 | 0.980 | 0.080 (0.344, 0.660) | 0.565 | 0.499 | 0.092 (0.385, 0.745) |
| LMM | 0.599 | 0.223 | 0.079 (0.444, 0.754) | 0.707 | 0.031 | 0.081 (0.547, 0.866) |
| LMM/TM | 0.652 | 0.062 | 0.075 (0.505, 0.799) | 0.740 | 0.012 | 0.078 (0.587, 0.894) |
| LDL | 0.648 | 0.070 | 0.074 (0.504, 0.792) | 0.675 | 0.068 | 0.084 (0.512, 0.839) |
| LDL/TM | 0.655 | 0.058 | 0.074 (0.509, 0.800) | 0.728 | 0.017 | 0.079 (0.574, 0.882) |
| mFAT | 0.629 | 0.114 | 0.079 (0.475, 0.783) | 0.700 | 0.038 | 0.083 (0.537, 0.862) |
| mFAT/TM | 0.611 | 0.172 | 0.078 (0.458, 0.765) | 0.700 | 0.038 | 0.081 (0.541, 0.858) |
| IMAT | 0.653 | 0.060 | 0.075 (0.507, 0.799) | 0.709 | 0.029 | 0.082 (0.549, 0.869) |
| IMAT/TM | 0.640 | 0.086 | 0.075 (0.492, 0.787) | 0.736 | 0.014 | 0.077 (0.584, 0.887) |
| Gluteus maximus | ||||||
| TM | 0.700 | 0.014 | 0.081 (0.542, 0.858) | 0.813 | 0.001 | 0.085 (0.647, 0.978) |
| LMM | 0.679 | 0.028 | 0.076 (0.530, 0.827) | 0.748 | 0.010 | 0.073 (0.605, 0.890) |
| LMM/TM | 0.586 | 0.293 | 0.083 (0.423, 0.748) | 0.615 | 0.229 | 0.089 (0.440, 0.790) |
| LDL | 0.584 | 0.300 | 0.093 (0.401, 0.767) | 0.623 | 0.202 | 0.103 (0.421, 0.824) |
| LDL/TM | 0.592 | 0.256 | 0.084 (0.429, 0.756) | 0.615 | 0.229 | 0.091 (0.437, 0.794) |
| mFAT | 0.528 | 0.734 | 0.089 (0.353, 0.703) | 0.541 | 0.670 | 0.106 (0.332, 0.749) |
| mFAT/TM | 0.568 | 0.403 | 0.088 (0.395, 0.741) | 0.601 | 0.293 | 0.104 (0.397, 0.805) |
| IMAT | 0.587 | 0.285 | 0.098 (0.396, 0.779) | 0.625 | 0.193 | 0.111 (0.408, 0.842) |
| IMAT/TM | 0.591 | 0.263 | 0.084 (0.427, 0.755) | 0.618 | 0.220 | 0.095 (0.431, 0.804) |
| Muscle strength | ||||||
| Total | Female | |||||
| AUC | p value | SE (95% CI) | AUC | p value | SE (95% CI) | |
| Knee extensor | ||||||
| Ipsilateral | 0.586 | 0.293 | 0.082 (0.425, 0.746) | 0.603 | 0.282 | 0.092 (0.423, 0.784) |
| Contralateral | 0.511 | 0.888 | 0.081 (0.353, 0.670) | 0.529 | 0.764 | 0.090 (0.353, 0.704) |
| Hip abductor | ||||||
| Ipsilateral | 0.530 | 0.709 | 0.085 (0.363, 0.698) | 0.555 | 0.565 | 0.098 (0.364, 0.747) |
| Contralateral | 0.552 | 0.524 | 0.084 (0.387, 0.717) | 0.555 | 0.565 | 0.099 (0.361, 0.750) |
Disclaimer/Publisher’s Note: The statements, opinions and data contained in all publications are solely those of the individual author(s) and contributor(s) and not of MDPI and/or the editor(s). MDPI and/or the editor(s) disclaim responsibility for any injury to people or property resulting from any ideas, methods, instructions or products referred to in the content. |
© 2023 by the authors. Licensee MDPI, Basel, Switzerland. This article is an open access article distributed under the terms and conditions of the Creative Commons Attribution (CC BY) license (https://creativecommons.org/licenses/by/4.0/).
Share and Cite
Yasuda, T.; Ota, S.; Mitsuzawa, S.; Yamashita, S.; Tsukamoto, Y.; Takeuchi, H.; Onishi, E. Preoperative Lower-Limb Muscle Predictors for Gait Speed Improvement after Total Hip Arthroplasty for Patients with Osteoarthritis. J. Pers. Med. 2023, 13, 1279. https://doi.org/10.3390/jpm13081279
Yasuda T, Ota S, Mitsuzawa S, Yamashita S, Tsukamoto Y, Takeuchi H, Onishi E. Preoperative Lower-Limb Muscle Predictors for Gait Speed Improvement after Total Hip Arthroplasty for Patients with Osteoarthritis. Journal of Personalized Medicine. 2023; 13(8):1279. https://doi.org/10.3390/jpm13081279
Chicago/Turabian StyleYasuda, Tadashi, Satoshi Ota, Sadaki Mitsuzawa, Shinnosuke Yamashita, Yoshihiro Tsukamoto, Hisataka Takeuchi, and Eijiro Onishi. 2023. "Preoperative Lower-Limb Muscle Predictors for Gait Speed Improvement after Total Hip Arthroplasty for Patients with Osteoarthritis" Journal of Personalized Medicine 13, no. 8: 1279. https://doi.org/10.3390/jpm13081279