Article

Protection against Oxidative Stress by Coenzyme Q10 in a Porcine Retinal Degeneration Model

1
Experimental Eye Research Institute, University Eye Hospital, Ruhr-University Bochum, In der Schornau 23-25, 44892 Bochum, Germany
2
Private Institute for Applied Ophthalmology, Eye Clinic at Wittenbergplatz, 10787 Berlin, Germany
*
Author to whom correspondence should be addressed.
J. Pers. Med. 2024, 14(4), 437; https://doi.org/10.3390/jpm14040437
Submission received: 20 March 2024 / Revised: 15 April 2024 / Accepted: 17 April 2024 / Published: 22 April 2024
(This article belongs to the Special Issue Glaucoma Management in the Era of Personalized Medicine)

Abstract

:
Oxidative stress plays an important role in neurodegenerative diseases, including glaucoma. Therefore, we analyzed if the antioxidant coenzyme Q10 (CoQ10), which is also commercially available, can prevent retinal degeneration induced by hydrogen peroxide (H2O2) in a porcine organ culture model. Retinal explants were cultivated for eight days, and H2O2 (500 µM, 3 h) induced the oxidative damage. CoQ10 therapy was applied (700 µM, 48 h). Retinal ganglion cells (RGCs) and microglia were examined immunohistologically in all groups (control, H2O2, H2O2 + CoQ10). Cellular, oxidative, and inflammatory genes were quantified via RT-qPCR. Strong RGC loss was observed with H2O2 (p ≤ 0.001). CoQ10 elicited RGC protection compared to the damaged group at a histological (p ≤ 0.001) and mRNA level. We detected more microglia cells with H2O2, but CoQ10 reduced this effect (p = 0.004). Cellular protection genes (NRF2) against oxidative stress were stimulated by CoQ10 (p ≤ 0.001). Furthermore, mitochondrial oxidative stress (SOD2) increased through H2O2 (p = 0.038), and CoQ10 reduced it to control level. Our novel results indicate neuroprotection via CoQ10 in porcine retina organ cultures. In particular, CoQ10 appears to protect RGCs by potentially inhibiting apoptosis-related pathways, activating intracellular protection and reducing mitochondrial stress.

1. Introduction

Until today, researchers have faced unanswered questions regarding degeneration in multifactorial retinal diseases like age-related macular degeneration, diabetic retinopathy, or glaucoma [1,2,3]. This has largely affected the progress of therapy and limited the current possibilities of curing these diseases.
Glaucoma represents the second most common cause for irreversible vision loss worldwide [1,4]. In Germany, about 1–2% of the population suffer from this disease. The number of patients worldwide will further rise in the next years, which will also drastically increase the cost of treatment [5,6]. Hence, there is an urgent need for new insights into glaucoma pathology. The progressive loss of retinal ganglion cells (RGCs) and degeneration of the optic nerve head result from multiple factors. Stressors considered to be involved in glaucoma development are oxidative stress, hypoxia, and inflammation [4,7,8,9,10]. One of the most common risk factors is high intraocular pressure (IOP) [4]. So far, several explanatory approaches of glaucoma pathology were made, but it is not yet fully understood [11,12].
Animal models are commonly used to elucidate disease pathologies, but the development of alternative methods, in adherence with the 3R principles (replace, reduce, and refine), is on the rise [13]. Ex vivo organ culture systems are one alternative. Here, explants can be cultivated for a restricted period of time [14]. Retinal explants can be gained from eyes as a byproduct of the food industry. For ophthalmic research, pig eyes offer several advantages. Besides their size and comparable morphology, their anatomy and cellular structure are comparable to those of humans. Pigs have a visual streak that is similar to the human macula [15]. Additionally, they possess two different opsins and are therefore able to detect color. These analogous structures are not found in nocturnal rodents [16].
Previously, we established a retinal organ culture system [17,18,19,20]. Here, hydrogen peroxide (H2O2) was used as an oxidizing agent [21]. Moreover, this organ culture model was used to examine protective agents like extremolytes, an iNOS-inhibitor, or hypothermia [18,20,22].
Now, we have investigated whether coenzyme Q10 (CoQ10), as a strong antioxidant, protects against retinal damage caused by H2O2. CoQ10 is involved in the mitochondrial energy supply and works as an electron carrier at mitochondrial multiprotein membrane complexes. It is indispensable for ATP synthesis [23,24]. In addition, CoQ10 is present in blood serum and cell membranes. Endogenous CoQ10 is synthesized via the mevalonate metabolic pathway and protects against free radicals. Normally, production decreases with advanced age, but it can also be upregulated under pathological conditions [25]. Furthermore, CoQ10 can influence gene expression, signal transduction, and metabolism, indicating a possibility of retinal protection in experimental glaucoma [26,27,28]. Interestingly, CoQ10 was identified as a successful therapeutic approach in other glaucoma animal models using ischemic conditions or intravitreal injections [29,30]. However, the exact mechanism of neuroprotection in glaucoma is still unclear and should be further analyzed. Hence, in the current study, we investigated for the first time if CoQ10 has neuroprotective potential in a retinal organ culture. To our knowledge, a project of this kind has not been carried out before and promises unique insights into the work mechanism of the antioxidant. This novel type of utilizing porcine tissue, which is quite similar to human tissue, is particularly helpful here. This will allow further steps to be taken towards the performance of clinical studies and applicable therapy, which are urgently needed in the field of glaucoma.

2. Materials and Methods

2.1. Preparation of Porcine Retinal Explants and Oxidative Stress Induction

Porcine eyes were obtained from the local slaughterhouse. Authorization from the veterinary office is available under the registration number DE05911002921. Tissue preparation was performed as described previously [17,20]. Briefly, eye cups were cut into quarters to obtain a shamrock-like structure. In three of the quarters, a round piece of retina was punched out and placed on an insert with RGCs facing up (Disposable Biopsy Punch, Ø 6 mm, KAI MEDICAL, Solingen, Germany). Each piece of tissue was used as an independent sample, placed in a different study group, and was treated according to the three different groups. All explants were cultured on filter inserts (30 mm diameter, Merck Millipore, Co Cork, Ireland) in 6-well plates (CELLSTAR®, Frickenhausen, Germany). A total of 1 mL of Neurobasal A medium supplemented with 0.8 mM L-glutamine, 2% B27, 1% N2 (all Gibco® Thermo Fischer Scientific, Waltham, MA, USA), and 2% penicillin/streptomycin (Sigma-Aldrich Chemie GmbH, Steinheim, Germany) was added to each well. The explants were cultured for eight days at 37 °C and 5% CO2 (n = 14/group).
Degeneration in all damaged groups was induced by adding 500 µM H2O2 to the medium (Sigma Aldrich, St. Louis, MO, USA) at day one for three hours. The concentration was based on unpublished pilot studies and matching literature [17]. Simultaneously, 700 µM of CoQ10 (Sigma Aldrich, St. Louis, MO, USA), diluted in Lutrol (Sigma Aldrich, St. Louis, MO, USA), was added into the therapy group for 48 h (Figure 1). The choice of the CoQ10 concentration was also based on unpublished preliminary studies of our working group in this model. Further pilot tests showed that the use of Lutrol as a solvent for CoQ10 had no effect on the retinal explants. In general, all added substances could be dissolved in the medium described above. The control group received the same amount of medium without stressor or therapy. In total, the study consisted of three groups: control, H2O2, and H2O2 + CoQ10.
The medium was changed once a day on days zero to three and on the fifth and seventh day. For (immune-) histology (n = 8/group), the tissue was fixed with 4% PFA and dehydrated with 15 and 30% sucrose/PBS solution after eight days. The fixed tissue was embedded and stored at −80 °C. Samples for the RT-qPCR (n = 6/group) analyses were directly frozen at 80 °C.

2.2. (Immuno-) Histological Staining of Retinal Cross-Sections

Retinal explants (n = 8/group) were cut into 10 µm thick cross-sections with the Microtom HM 560 (Thermo Scientific, Darmstadt, Germany).
Three sections per explant were stained with hematoxylin + eosin (HE) [31]. The thickness of the retina was measured in three different areas of two photos per section via ZEN 2012 imaging software (Carl Zeiss MicroImaging GmbH, Oberkochen, Germany). Six images per explant were analyzed, and the mean value was used for statistics.
Immunofluorescence analyses of RGCs and microglia were performed using specific primary antibodies against the RNA-binding protein with multiple splicing (RBPMS) and the ionized calcium-binding adapter molecule 1 (Iba1) (Table 1) [32,33,34]. First, retinal cross-sections (6/explant) were dried at 37 °C for 10 min and rehydrated in 1xPBS for 4 min. The blocking solution consisted of 20% normal donkey serum, 1% bovine serum albumin, and 0.2% TritonX diluted in 1xPBS (1 h). Subsequently, the primary antibody was applied overnight at room temperature, and the secondary antibody was incubated the next day in darkness for 1 h at room temperature. Both antibodies were dissolved in blocking solution. 4′,6′-Diamidin-2-phenylindol (DAPI; 1:10) was applied for 5 min to visualize cell nuclei. Finally, slides were capped with Immu-Mount. Four images were taken of each cross-section with the fluorescence microscope (Axio Imager M2, Zeiss, Oberkochen, Germany) at 400× magnification. To evaluate the number of positive cells, 24 images of each explant were cropped to a defined size (800 × 600 pixel). Only specific signals co-localized with DAPI were counted (ImageJ 1.44 M; NIH, Bethesda, MD, USA). Iba1+ cells were counted in the ganglion cell layer, inner plexiform layer, and inner nuclear layer together as well as in the ganglion cell complex (GCC; ganglion cell layer and inner plexiform layer).

2.3. RNA Isolation and cDNA Synthesis

RNA isolation was performed according to the manufacturer’s instructions of the GeneEluteTM Mammalian Total RNA Miniprep Kit (Sigma-Aldrich, St. Louis, MO, USA). Therefore, retinal tissue (n = 6/group) was lysed with a mixture of 2-mercaptoethanol. Afterwards, the RNA concentration was measured using a NanoDropTM One spectrophotometer (Thermo Fisher Scientific, Madison, WI, USA). A total of 1 µg of RNA was used for cDNA synthesis, which was performed with the First Strand cDNA Synthesis Kit (Thermo Fisher Scientific, Vilnius, Lithuania).

2.4. Quantitative Real-Time PCR (RT-qPCR)

RT-qPCR evaluations based on the SYBR Green I protocol were carried out with the PikoRealTM 96 Real-Time Thermal Cycler (Thermo Fisher Scientific, Vantaa, Finland). Duplicates for every cDNA and primer pair were included. All used nucleotide sequences were researched on NCBI, and primers were blasted with the offered tool (Table 2). The final volume in each 96-well plate well amounted to 20 µL, consisting of 5 µL of cDNA and 15 µL of primer mix. Ct values were calculated via PikoReal 2.2. The results were normalized to the housekeeping gene Histocompatibility 3 (H3). Both the difference between the control and H2O2 groups and among the H2O2 groups was examined.

2.5. Statistical Analyses

Regarding (immuno-) histological data, groups were compared by one-way ANOVA, followed by Turkey’s honest post hoc test (Statistica V13, StatSoft, Hamburg, Germany), and they are presented as mean ± SEM. The RT-qPCR results were analyzed with the 2−ΔΔCT method and are shown as mean ± SEM, with all single samples presented as dots. Afterwards, the fold expression was also compared with the Statistica software (version 14.0.1.25). A p value less than 0.05 was considered statistically significant: * p ≤ 0.05, ** p ≤ 0.01, and *** p ≤ 0.001 compared to the controls and # p ≤ 0.05, ## p ≤ 0.01, and ### p ≤ 0.001 compared to H2O2.

3. Results

3.1. HE Staining Revealed No Significant Changes in Retinal Thickness

To investigate the macrostructure of the cultured retina, layer thickness was measured after HE staining. The total retinal thickness (GCL to ONL) of the H2O2-damaged and CoQ10-treated groups was compared to the control group (Figure 2A). There were no statistical differences between the groups (control: 91.85 ± 4.50 µm; H2O2: 92.89 ± 5.25 µm, p = 0.999; H2O2 + CoQ10: 92.71 ± 4.26 µm, p = 0.999; Figure 2B).

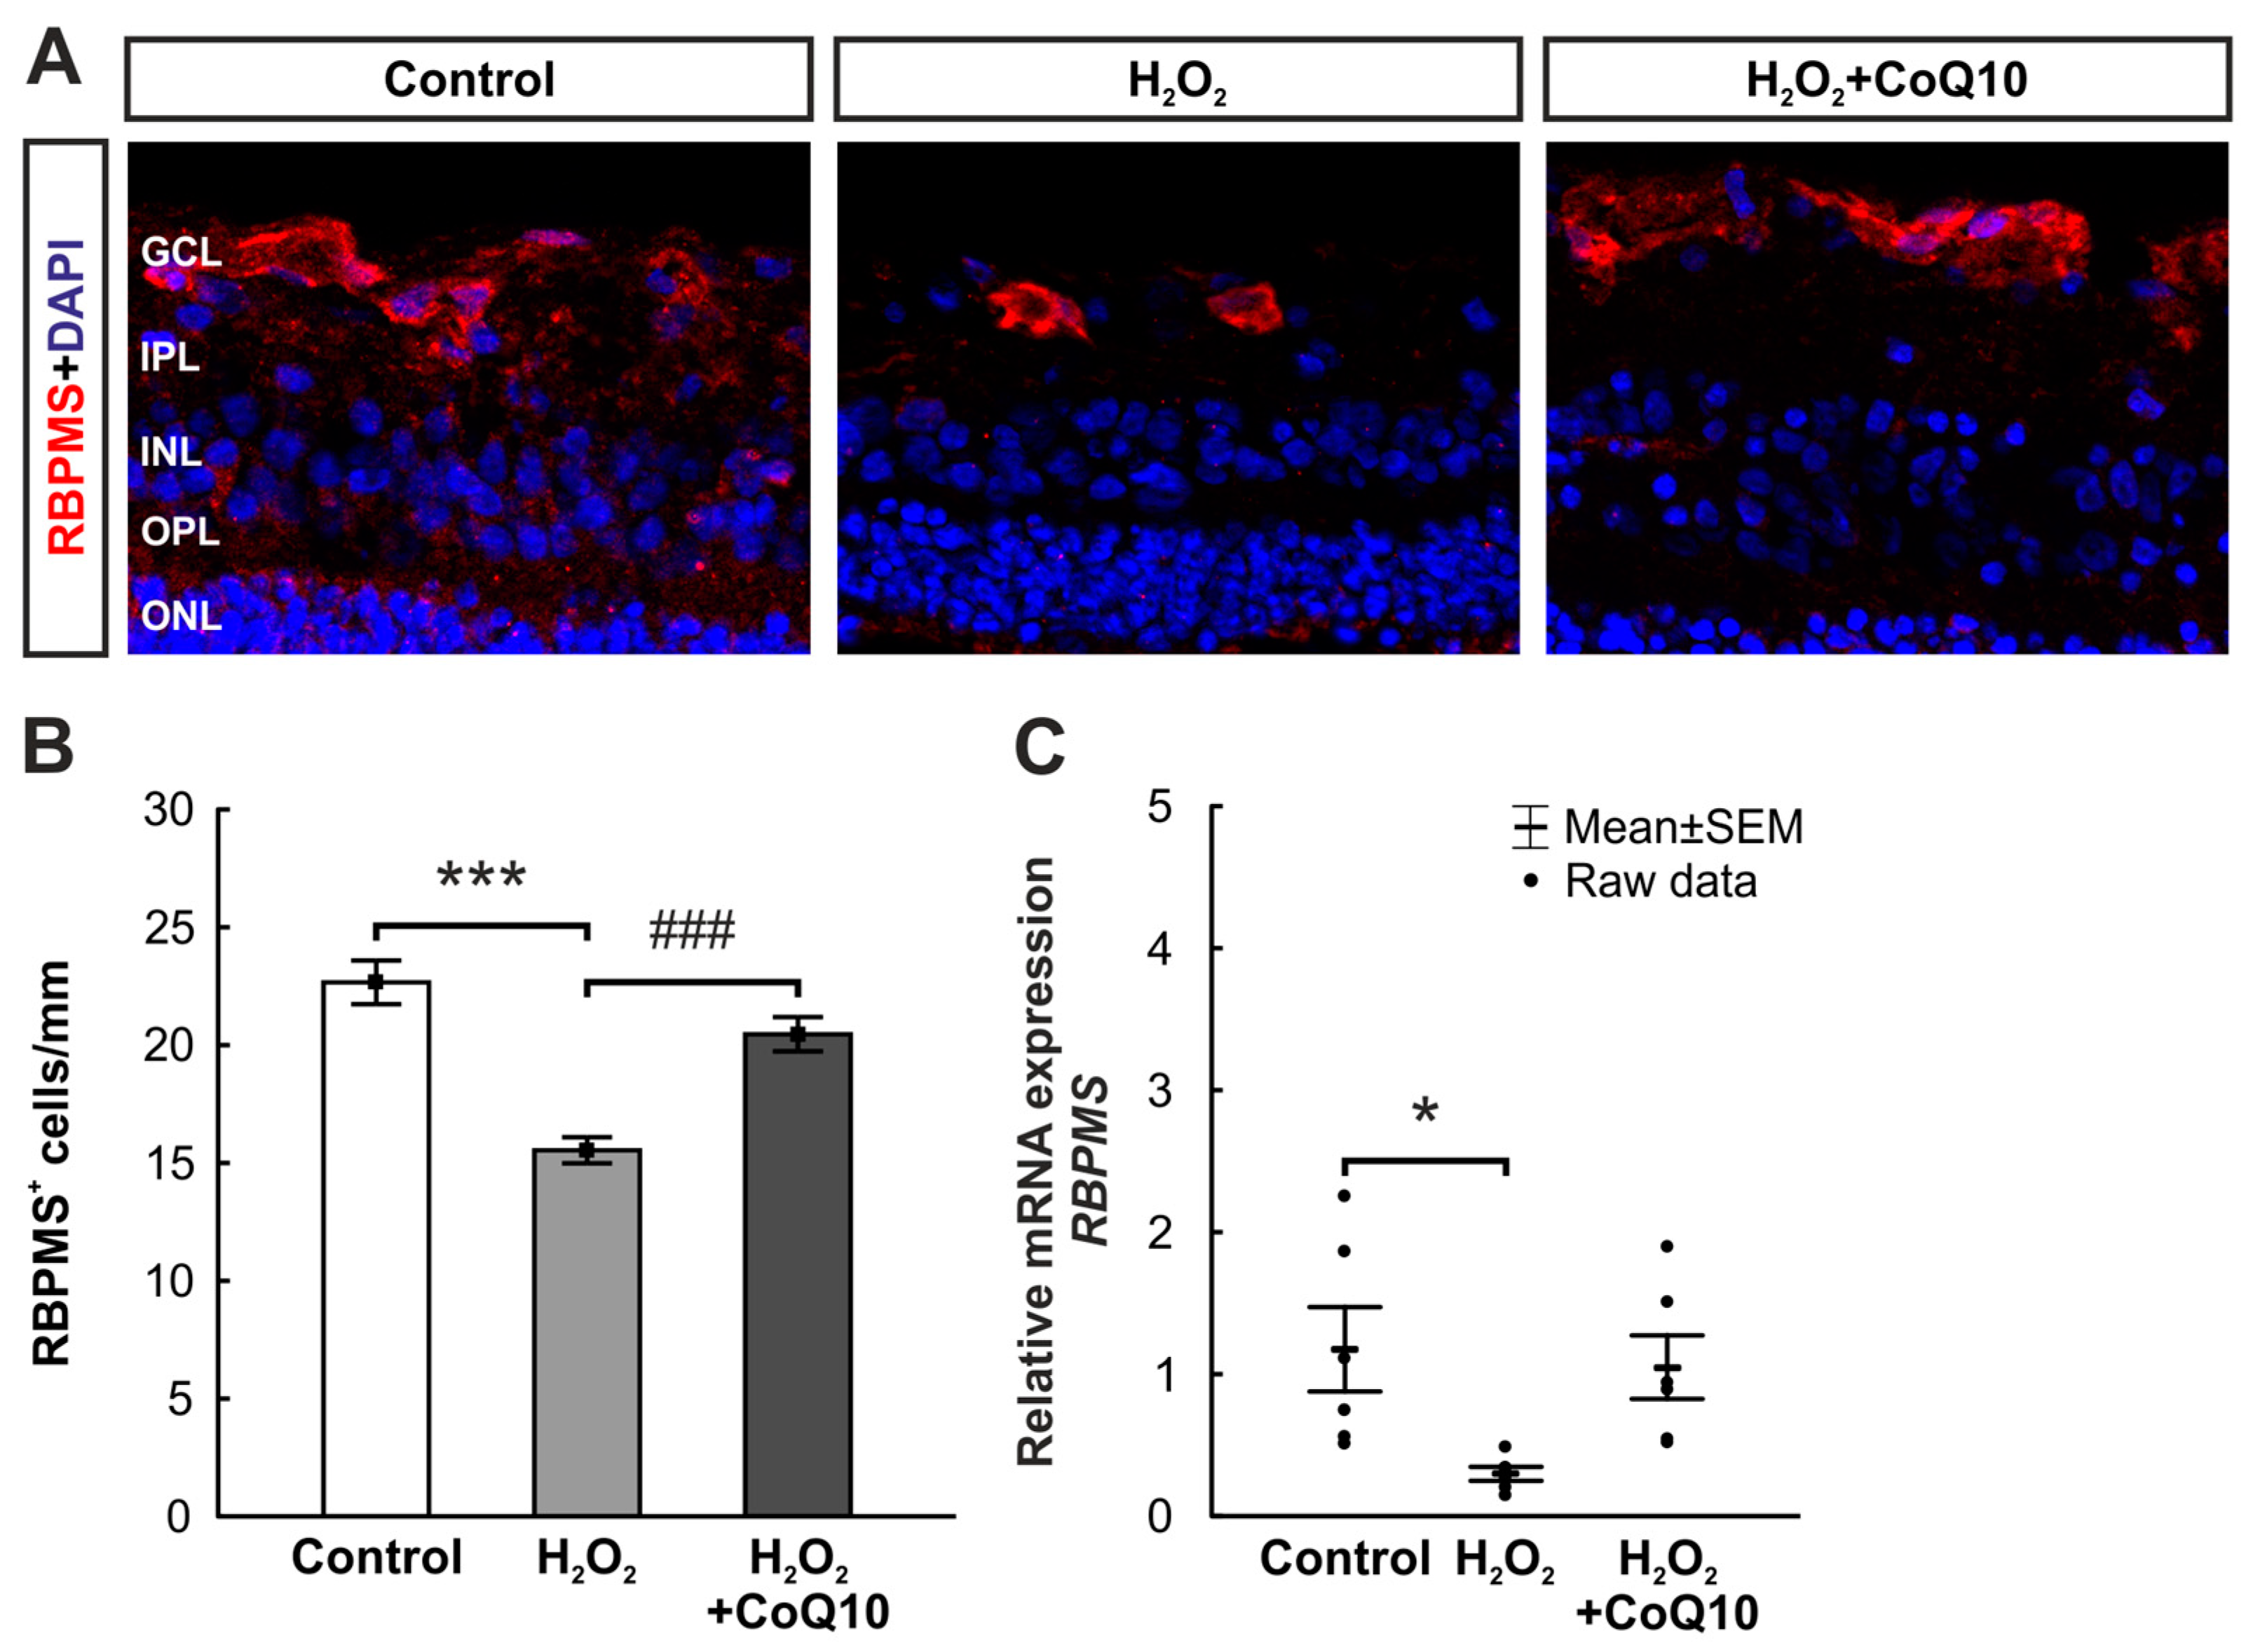
3.2. CoQ10 Minimized RGC Loss

Sections of retinae were stained against RBPMS (Figure 3A). Significant RGC loss was identified in the H2O2 group (15.54 ± 0.55 cells/mm, p ≤ 0.001) compared to controls (22.66 ± 0.93 cells/mm), which was no longer detectable with the CoQ10 treatment (20.46 ± 0.73 cells/mm, p ≤ 0.001; Figure 3B).
RT-qPCR analyses verified these results and presented a significantly decreased mRNA expression of RBPMS in the H2O2 group compared to the control group (0.3-fold expression ± 0.05, p = 0.03). RBPMS expression in the H2O2 + CoQ10 group was similar to controls (1.05-fold expression ± 0.22, p = 0.912). H2O2 + CoQ10 samples showed a non-significant increased RBPMS expression compared to H2O2 group (3.78-fold expression ± 0.8, p = 0.066; Figure 3C).

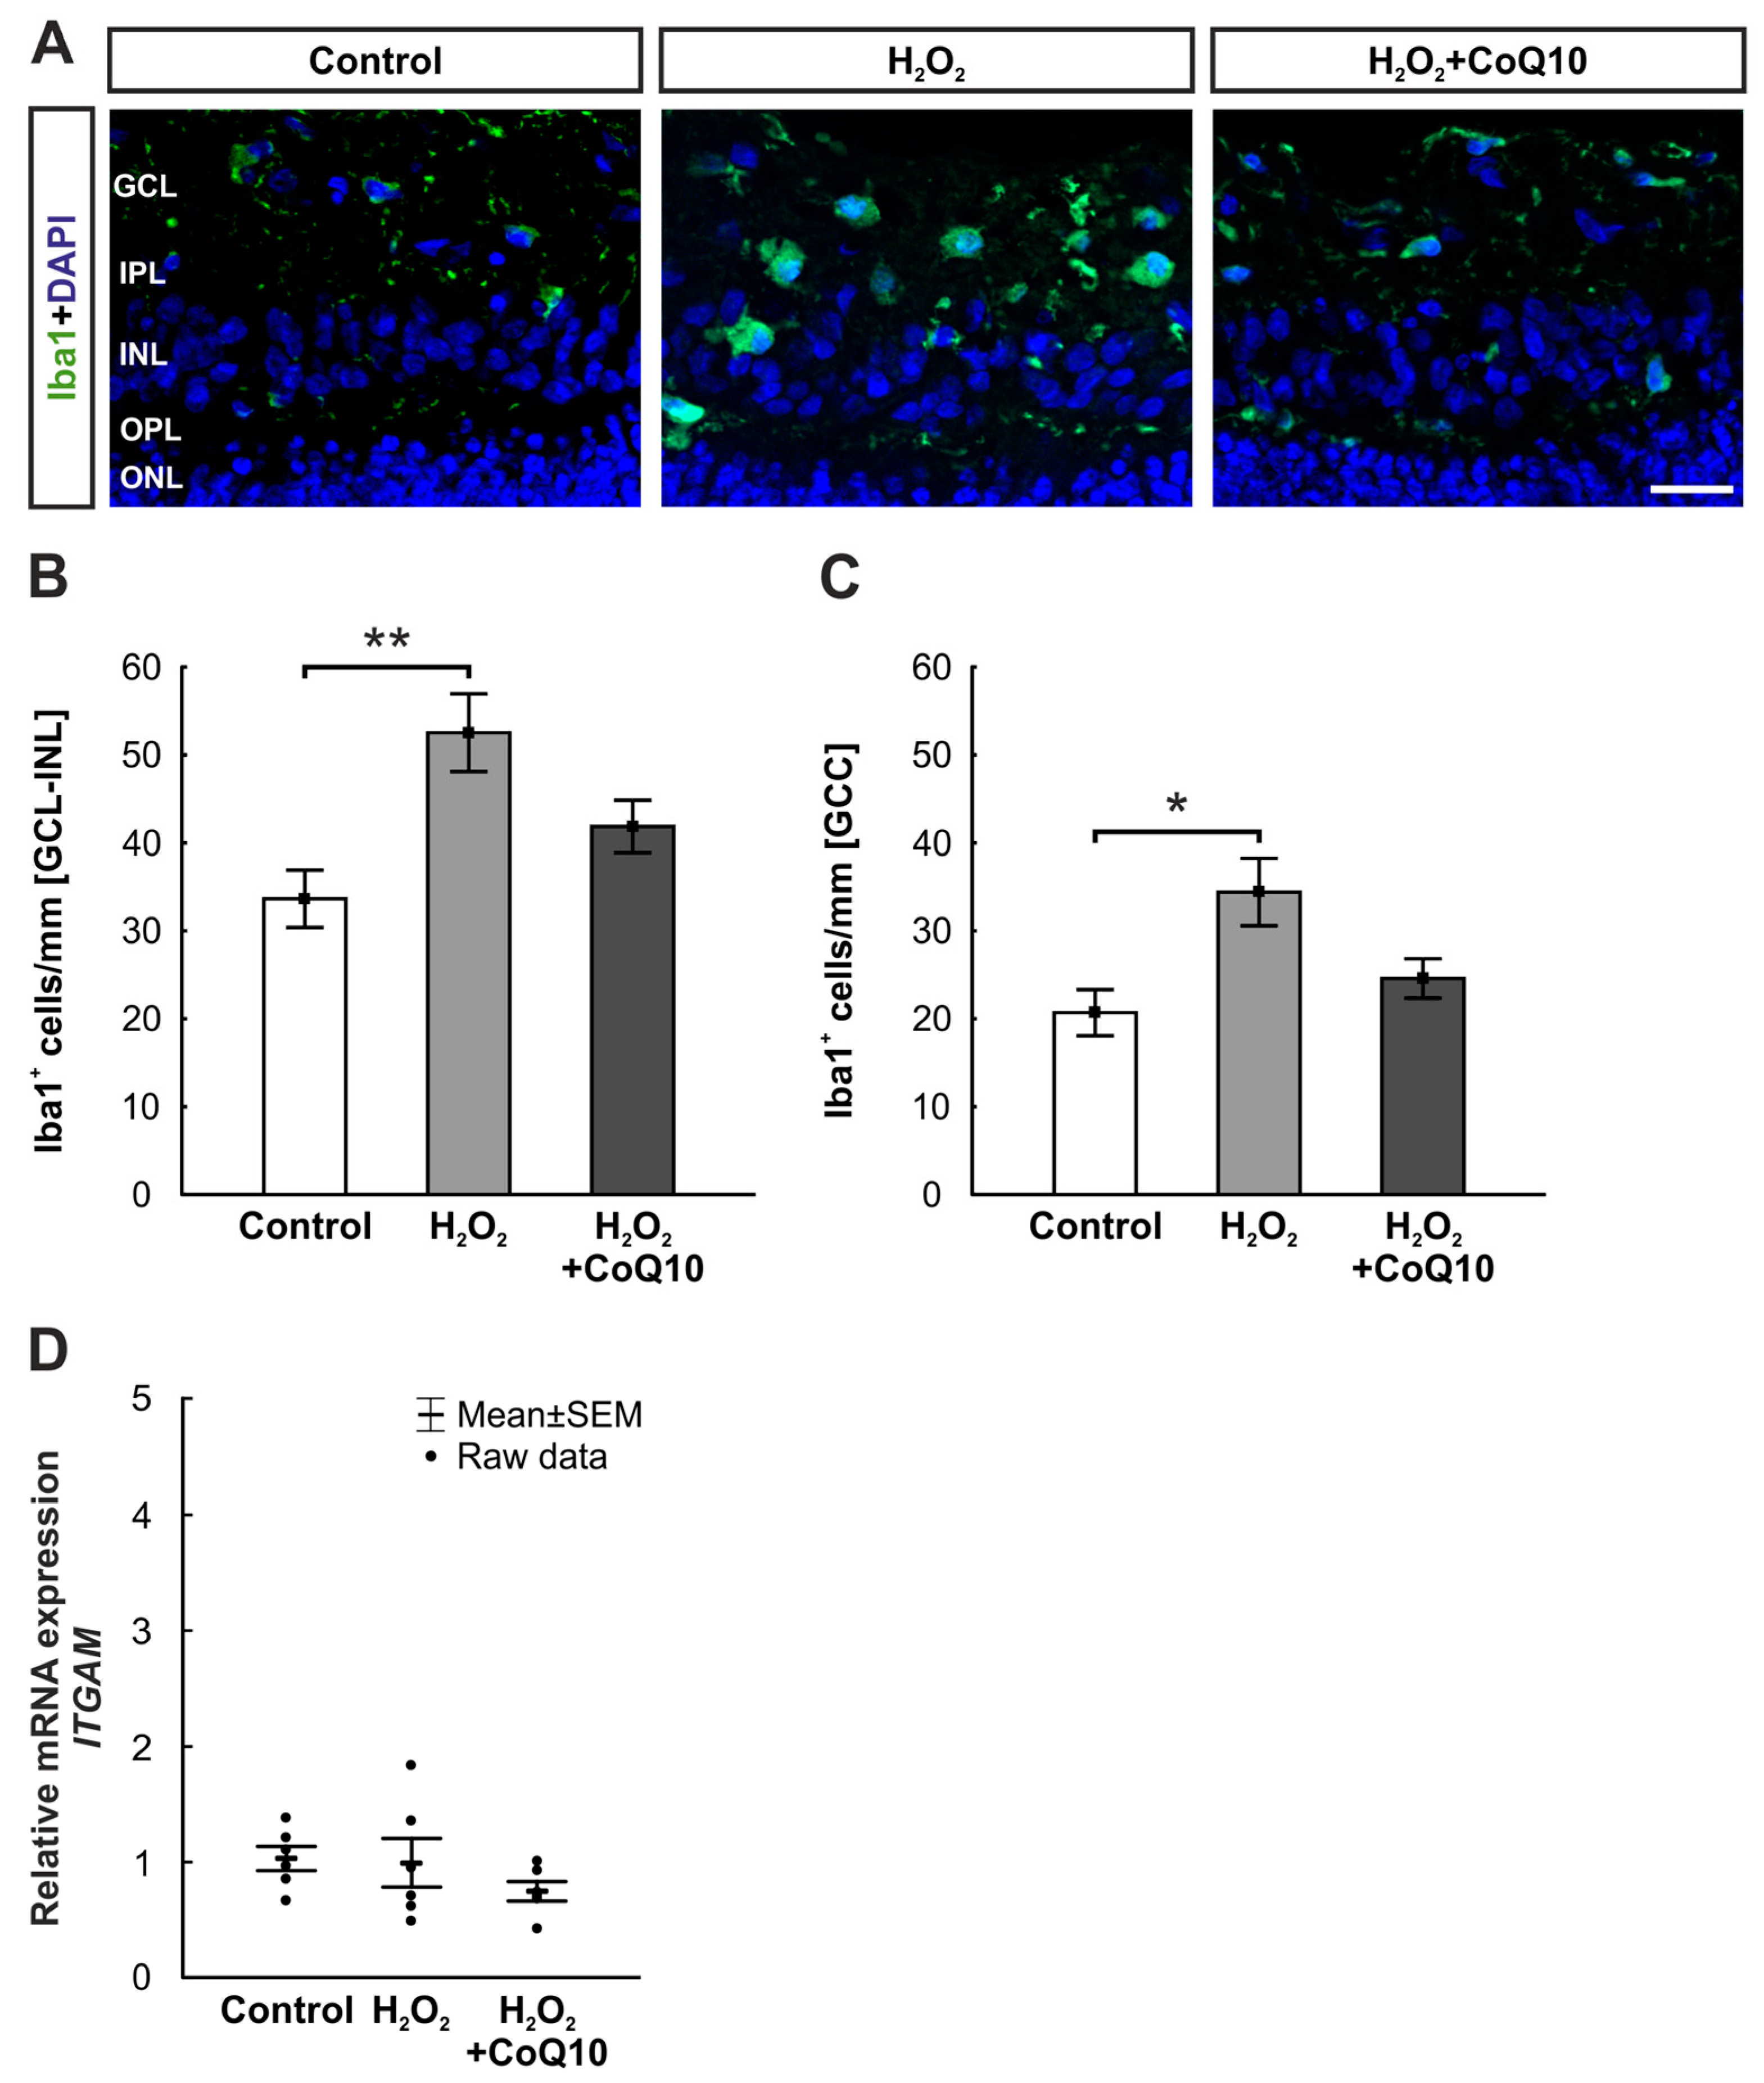
3.3. Reduced Microglia Accumulation by CoQ10 after Eight Days

Microglia were also examined in the inner retina after eight days using an Iba1 antibody (Figure 4A). Cell counting in the ganglion cell layer (GCL) to the inner nuclear layer (INL) showed significantly more Iba1+ cells after oxidative stress induction (52.53 ± 4.42 cells/mm, p = 0.004) compared to controls (33.64 ± 3.25 cells/mm). This was not detectable after CoQ10 treatment (41.86 ± 2.99 cells/mm, p = 0.264; Figure 4B). The same alterations were observable when looking exclusively at the ganglion cell complex (GCC) consisting of GCL and inner plexiform layer (IPL) (control: 20.69 ± 2.62 cells/mm; H2O2: 34.4 ± 3.83 cells/mm, p = 0.010; H2O2 + CoQ10: 24.58 ± 2.24 cells/mm, p = 0.631; Figure 4C).
In contrast to the histological evaluation, no statistically relevant changes were found within the RT-qPCR analysis. The relative mRNA expression of integrin alpha M (ITGAM), a specific microglia gene which codes for the cell adhesion molecule integrin CD11b, was comparable between the groups (H2O2: 0.99-fold expression ± 0.21, p = 0.983; H2O2 + CoQ10: 0.74-fold expression ± 0.08, p = 0.370). Comparing both H2O2 groups also showed no differences (H2O2 + CoQ10: 0.84-fold expression ± 0.09, p = 0.465; Figure 4D).

3.4. Inflammatory Activity Was Not Affected by CoQ10

To investigate the inflammatory response, the relative mRNA expression of specific cytokines was analyzed. In the case of interleukin 6 (IL6), expression levels were similar in all groups (H2O2: 1.39-fold expression ± 0.24, p = 0.262; H2O2 + CoQ10: 0.79-fold expression ± 0.13, p = 0.612). The comparison of both H2O2 groups also revealed no significant differences (H2O2 + CoQ10: 0.62-fold expression ± 0.1, p = 0.051; Figure 5A).
Elevated expression patterns were found for interleukin 8 (IL8) compared to controls. The IL8 expression level of the H2O2 group (4.51-fold expression ± 1.49, p = 0.035) was significantly elevated, while the H2O2 + CoQ10 (1.7-fold expression ± 0.29, p = 0.855) displayed no increased expression. Accordingly, the H2O2 + CoQ10 expression was similar to the control group. The comparison of both damaged groups did not reveal any differences (0.53-fold expression ± 0.09, p = 0.095; Figure 5B).
No changes could be detected regarding tumor necrosis factor (TNF) expression levels (H2O2: 0.98-fold expression ± 0.16, p = 0.806; H2O2 + CoQ10: 0.91-fold expression ± 0.09, p = 0.623). The comparison of the two H2O2 groups also did not expose any alterations (1.00-fold expression ± 0.10, p = 0.948; Figure 5C).

3.5. CoQ10 Stimulates Intracellular Protection Cascades against Oxidative Stress

Different gene expression patterns regarding oxidative stress and intracellular protection cascades were analyzed by RT-qPCR. The nuclear factor erythroid 2 (NF-E2)-related factor 2 (NRF2) mRNA level, which initiates protection against oxidative stress, increased significantly after oxidative stress and was more prominent with CoQ10 treatment compared to controls (H2O2: 2.74-fold expression ± 0.38, p = 0.011; H2O2 + CoQ10: 3.6-fold expression ± 0.34, p ≤ 0.001). But the H2O2 + CoQ10 group showed no significant NRF2 elevation compared to the H2O2 group (1.39-fold expression ± 0.13, p = 0.192; Figure 6A).
Similar results, which were not significant, could be found regarding heme oxygenase 1 (HMOX1), one of the enzymes activated by Nrf2. The H2O2 group displayed an HMOX1 expression similar to controls (1.21-fold expression ± 0.19, p = 0.861), while the H2O2 + CoQ10 group had a slightly, but not significant, increased expression (1.66-fold expression ± 0.22, p = 0.110). The comparison of the two H2O2 groups showed no difference (H2O2 + CoQ10: 1.45-fold expression ± 0.19, p = 0.257; Figure 6B).
Superoxide dismutase 1 (SOD1) is an important enzyme for cellular protection against oxidative stress and is predominantly localized in the cytoplasm [35,36,37]. SOD1 gene expression showed no significant changes in all groups (H2O2: 1.04-fold expression ± 0.19, p = 0.992; H2O2 + CoQ10: 0.84-fold expression ± 0.08, p = 0.575). The comparison of both H2O2 groups could not reveal any variations (H2O2 + CoQ10: 0.87-fold expression ± 0.08, p = 0.503; Figure 6C).
Another type of protective superoxide dismutase, which occurs in the mitochondrial matrix, is superoxide dismutase 2 (SOD2) [35,36,37]. A significantly increased mRNA expression of SOD2 was identified in the H2O2 group (1.75-fold expression ± 0.29, p = 0.038) compared to controls, which was not detectable after CoQ10 application (0.97-fold expression ± 0.12, p = 0.981). Comparing the two damaged groups, CoQ10 was able to reduce the SOD2 expression significantly (0.6-fold expression ± 0.08, p = 0.026; Figure 6D).

4. Discussion

To date, glaucoma patients have mainly been treated through IOP lowering, while neuroprotective agents still need to be identified. Reliable models are needed to improve our knowledge of multifactorial glaucoma pathogenesis [38,39]. Therefore, we used a specific ex vivo organ culture system of porcine eyes, where neurodegeneration can be stimulated via oxidative stress induced with H2O2 [17,20,40]. We investigated if it is possible to counteract this damage with the antioxidant CoQ10 [23,24,26,27,28]. Our presented results demonstrate a positive effect of CoQ10 against oxidative stress in a porcine ex vivo organ culture model for the first time. We could identify strong RGC protection, an inhibition of microglia accumulation, and a specific modulation of oxidative-stress-related genes. Due to the high similarity between humans and pigs, these new findings point to promising future projects with CoQ10 in the clinical field.
RGC analysis showed a protective effect of CoQ10. The reduced number of cells and the level of relative RBPMS mRNA expression after oxidative damage could be recovered with CoQ10. These results support our hypothesis that CoQ10 plays a neuroprotective role. The reason for the explicit RGC damage after H2O2 application may be related to its high energy turnover. Since RGCs have a particularly high energy consumption, they are sensitive to mitochondrial undersupply [41,42]. The breakdown of ATP synthesis leads to impaired function of RGCs, which may occur after mitochondria permeabilization. Moreover, pathological accumulation of ROS causes the release of mitochondrial dissolution factors, so that apoptosis and RGC death, which have been demonstrated here, are induced [43,44]. The fact that CoQ10 can eliminate oxidative stress, ROS, and maintain the mitochondrial membrane potential may account for the protective effect [25]. Thus, the specific RGC protection by CoQ10 is likely due to its close correlation to neuronal energy turnover and functionality in mitochondria. The pathological pathways during glaucoma usually lead to cell death and particularly affect RGCs [1,9]. This cell death can be triggered by apoptotic signaling cascades, which are either part of the physiological cell process or can lead to the activation of cellular self-destruction [43,44]. Neurodegenerative diseases are often characterized by an inappropriate rate of apoptosis after oxidative stress [19,44,45]. CoQ10 supplementation in mice was able to protect the quality of postovulatory aged oocytes [46]. It provided reversion of disorders of spindle assembly, chromosome misdirection, and abnormal distribution patterns in mitochondria. Consistent with our results, the addition of CoQ10 could reduce age-related oxidative stress and apoptosis [46]. Another study investigating CoQ10 protection in a murine Parkinson’s disease model with chronic exposure to rotenone also revealed reduced apoptosis and restoration of mitochondrial membrane potential [47]. This study again supports the changes found here in the glaucoma model and demonstrates the protective effects of CoQ10.
The Iba1 staining of the inner retina in our study demonstrated increased microglial presence in the H2O2 group. Microglia are part of the neuronal immune system with their phagocytotic work and have a protective function to some extent. Macrophages are highly agile, secrete cytokines, and migrate rapidly into damaged tissue [48,49]. Both the absence of microglial activity and the excessive presence of cells can lead to cell death [50,51,52]. The increased microglia number after H2O2 injury suggests an inflammatory response [17,53]. Similar studies with porcine retinae could also detect a late response of microglia after H2O2 damage, which was minimized through hypothermic conditions [20]. The anti-inflammatory effect of CoQ10 occurring in this study results from its antioxidant capabilities of the electron transfer and its redox capacity [23,24,25]. By scavenging oxygen free radicals, oxidative stress does not occur. No proinflammatory cytokines are produced, and the necessary signaling cascades for microglial activation are absent [54]. In this way, CoQ10 protects against microglial accumulation, inflammatory signaling, and cell death [55]. The lack of changes in the microglial mRNA expression could be due to the CoQ10 concentrations used, the time points, or a difference between cell presence and gene expression. Discrepancies between expression and cellular occurrence were already seen in other studies and might be related to post-transcriptional and translational regulations [31,56,57].
Various inflammatory markers were investigated since oxidative stress activates immunological processes [17,45,58,59]. Relative mRNA expression of IL6, IL8, and TNF genes were examined to analyze potential anti-inflammatory aspects of CoQ10. IL8 expression was increased in H2O2 samples, whereas CoQ10 had a protective effect and could reduce the elevated expression to the control level. Previous studies using this porcine model showed an IL8 increase after four days, indicating increased inflammatory activity after oxidative stress [45]. IL8 is secreted by microglial cells and can therefore be increased due to a stronger presence of these cells, as we have detected in our study [60,61]. A clinical study regarding CoQ10 as a treatment for acute viral myocarditis showed promising results. CoQ10 treatment appeared to have an anti-inflammatory effect, including a decrease in IL8 levels in the serum [62]. Furthermore, there are other sources of IL8 in the retina which were not considered here, like astrocytes and Müller cells [63,64,65]. It would be beneficial to use other concentrations, exposure times, or investigation time points in the future.
CoQ10 could trigger RGC protection via different pathways. Nrf2 as a transcription factor regulates the expression of oxygenase’s as Hmox1, protects against cellular stress, and induces the expression of other antioxidative genes [66,67]. Based on this functional linkage of the two, the similar expression patterns found here can be explained and a certain dependence can be justified even if the HMOX1 expression changes were not significant. The fact that H2O2 alone also stimulated NRF2 expression can probably be explained by a general reaction to oxidative stress, which was amplified to a high extent by CoQ10 [68]. A previous murine study regarding RGC loss demonstrated that pharmacological activation of Nrf2 has a positive effect on cell survival [69]. In this regard, activation of Nrf2 and Hmox1, which were positively affected by CoQ10 in this study, appears to have minimized RGC loss.
SODs are endogenous enzymes and play a pivotal role in preventing oxidative stress and ROS. They are key elements in the metabolization of oxygen [35]. Their expression can be altered by certain intracellular and extracellular triggers, like interleukin increase [37]. The elevated IL8 expression due to oxidative stress could have been such a trigger, which in turn stimulated SOD expression via signaling pathways, as mentioned before [45,60,61,70]. SOD2 works predominantly in the mitochondrial matrix, whereas SOD1 is found in the cytoplasm [35,36]. Since oxidative stress in neurodegenerative diseases particularly affects mitochondrial function and ATP supply, protective mechanisms in mitochondria are specifically targeted [71]. It has been shown that CoQ10 can influence gene expression and signaling pathways, which could explain the direct influence on expression patterns [26,27,28]. By maintaining mitochondrial membrane potential, CoQ10 was able to minimize oxidative damage and thus restore the expression of SOD2 [72].
It should be mentioned that the study presented here also has some limitations. The evaluation of the protein level was carried out using immunohistology to evaluate the cell number. To quantify these regulations, Western blot analysis should be carried out in follow-up studies to gain more information about the amount of protein in retinal explants.

5. Conclusions

The aim of this work was to test the potential neuroprotective effect of CoQ10 in a porcine retinal organ culture. CoQ10 significantly prevented RGC death by likely decreasing apoptosis-related processes, reducing microglia proliferation, activating neuroprotective enzymes, and decreasing mitochondrial stress levels (Figure 7). Due to the association of the enzyme and mitochondrial activity, we hypothesize that the effective protection by CoQ10 arises from its influence on mitochondrial stability. Furthermore, this study illustrates the strong neuroprotective effect of CoQ10, specifically on RGCs. Overall, CoQ10 is a promising therapeutic approach for the treatment of glaucoma, and our work provides new information on its mechanisms of action.

Author Contributions

Conceptualization, S.C.J., T.T., C.E. and A.M.M.-B.; methodology, L.D. and A.M.M.-B.; software, L.D.; validation, L.D. and A.M.M.-B.; formal analysis, L.D. and A.M.M.-B.; investigation, L.D. and A.M.M.-B.; resources, S.C.J., C.E. and H.B.D.; data curation, L.D.; writing—original draft preparation, L.D.; writing—review and editing, S.C.J., T.T., A.M.M.-B., C.E. and H.B.D.; visualization, L.D.; supervision, S.C.J. and A.M.M.-B.; project administration, S.C.J. and T.T.; funding acquisition, S.C.J. and H.B.D. All authors have read and agreed to the published version of the manuscript.

Funding

We acknowledge the support by the Open Access Publication Funds of the Ruhr-University Bochum.

Institutional Review Board Statement

Not applicable.

Informed Consent Statement

Not applicable.

Data Availability Statement

The datasets generated and/or analyzed during the current study are available from the corresponding author on reasonable request.

Conflicts of Interest

The authors declare no conflicts of interest. The funders had no role in the design of the study, in the collection, analyses, or interpretation of the data, in the writing of the manuscript, or in the decision to publish the results.

References

  1. Bear, M.F.; Connors, B.W.; Paradiso, M.A. Neurowissenschaften: Ein Grundlegendes Lehrbuch Für Biologie, Medizin und Psychologie; Engel, A.K., Ed.; Springer Spektrum: Berlin/Heidelberg, Germany, 2018; Volume 4, p. 316. [Google Scholar]
  2. Duh, E.J.; Sun, J.K.; Stitt, A.W. Diabetic retinopathy: Current understanding, mechanisms, and treatment strategies. JCI Insight 2017, 2, e93751. [Google Scholar] [CrossRef] [PubMed]
  3. Fleckenstein, M.; Keenan, T.D.L.; Guymer, R.H.; Chakravarthy, U.; Schmitz-Valckenberg, S.; Klaver, C.C.; Wong, W.T.; Chew, E.Y. Age-related macular degeneration. Nat. Rev. Dis. Primers 2021, 7, 31. [Google Scholar] [CrossRef] [PubMed]
  4. European Glaucoma Society Terminology and Guidelines for Glaucoma, 5th Edition. Br. J. Ophthalmol. 2021, 105, 1–169. [CrossRef] [PubMed]
  5. Rein, D.B. Vision problems are a leading source of modifiable health expenditures. Investig. Ophthalmol. Vis. Sci. 2013, 54, ORSF18–ORSF22. [Google Scholar] [CrossRef] [PubMed]
  6. Tham, Y.C.; Li, X.; Wong, T.Y.; Quigley, H.A.; Aung, T.; Cheng, C.Y. Global prevalence of glaucoma and projections of glaucoma burden through 2040: A systematic review and meta-analysis. Ophthalmology 2014, 121, 2081–2090. [Google Scholar] [CrossRef] [PubMed]
  7. IQWiG. Glaucoma: Overview; Institute for Quality and Efficiency in Health Care: Cologne, Germany, 2022. Available online: https://www.ncbi.nlm.nih.gov/books/NBK367579/ (accessed on 1 August 2019).
  8. Jassim, A.H.; Fan, Y.; Pappenhagen, N.; Nsiah, N.Y.; Inman, D.M. Oxidative Stress and Hypoxia Modify Mitochondrial Homeostasis During Glaucoma. Antioxid. Redox Signal. 2021, 35, 1341–1357. [Google Scholar] [CrossRef] [PubMed]
  9. Quigley, H.A.; Broman, A.T. The number of people with glaucoma worldwide in 2010 and 2020. Br. J. Ophthalmol. 2006, 90, 262–267. [Google Scholar] [CrossRef]
  10. Tezel, G. Oxidative stress in glaucomatous neurodegeneration: Mechanisms and consequences. Prog. Retin. Eye Res. 2006, 25, 490–513. [Google Scholar] [CrossRef]
  11. Esporcatte, B.L.; Tavares, I.M. Normal-tension glaucoma: An update. Arq. Bras. De Oftalmol. 2016, 79, 270–276. [Google Scholar] [CrossRef]
  12. Killer, H.E.; Pircher, A. Normal tension glaucoma: Review of current understanding and mechanisms of the pathogenesis. Eye 2018, 32, 924–930. [Google Scholar] [CrossRef]
  13. Williamson, A.; Singh, S.; Fernekorn, U.; Schober, A. The future of the patient-specific Body-on-a-chip. Lab A Chip 2013, 13, 3471–3480. [Google Scholar] [CrossRef] [PubMed]
  14. Schaeffer, W.I. Terminology associated with cell, tissue, and organ culture, molecular biology, and molecular genetics. Tissue Culture Association Terminology Committee. Vitr. Cell. Dev. Biol. J. Tissue Cult. Assoc. 1990, 26, 97–101. [Google Scholar] [CrossRef] [PubMed]
  15. Hendrickson, A.; Hicks, D. Distribution and density of medium- and short-wavelength selective cones in the domestic pig retina. Exp. Eye Res. 2002, 74, 435–444. [Google Scholar] [CrossRef] [PubMed]
  16. Leinonen, H.; Tanila, H. Vision in laboratory rodents-Tools to measure it and implications for behavioral research. Behav. Brain Res. 2018, 352, 172–182. [Google Scholar] [CrossRef] [PubMed]
  17. Hurst, J.; Kuehn, S.; Jashari, A.; Tsai, T.; Bartz-Schmidt, K.U.; Schnichels, S.; Joachim, S.C. A novel porcine ex vivo retina culture model for oxidative stress induced by H2O2. Altern. Lab. Anim. ATLA 2017, 45, 11–25. [Google Scholar] [CrossRef]
  18. Hurst, J.; Mueller-Buehl, A.M.; Hofmann, L.; Kuehn, S.; Herms, F.; Schnichels, S.; Joachim, S.C. iNOS-inhibitor driven neuroprotection in a porcine retina organ culture model. J. Cell. Mol. Med. 2020, 24, 4312–4323. [Google Scholar] [CrossRef] [PubMed]
  19. Kuehn, S.; Hurst, J.; Jashari, A.; Ahrens, K.; Tsai, T.; Wunderlich, I.M.; Dick, H.B.; Joachim, S.C.; Schnichels, S. The novel induction of retinal ganglion cell apoptosis in porcine organ culture by NMDA—An opportunity for the replacement of animals in experiments. Altern. Lab. Anim. ATLA 2016, 44, 557–568. [Google Scholar] [CrossRef] [PubMed]
  20. Mueller-Buehl, A.M.; Doepper, H.; Grauthoff, S.; Kiebler, T.; Peters, L.; Hurst, J.; Kuehn, S.; Bartz-Schmidt, K.U.; Dick, H.B.; Joachim, S.C.; et al. Oxidative stress-induced retinal damage is prevented by mild hypothermia in an ex vivo model of cultivated porcine retinas. Clin. Exp. Ophthalmol. 2020, 48, 666–681. [Google Scholar] [CrossRef]
  21. Ransy, C.; Vaz, C.; Lombes, A.; Bouillaud, F. Use of H2O2 to Cause Oxidative Stress, the Catalase Issue. Int. J. Mol. Sci. 2020, 21, 9149. [Google Scholar] [CrossRef]
  22. Tsai, T.; Mueller-Buehl, A.M.; Satgunarajah, Y.; Kuehn, S.; Dick, H.B.; Joachim, S.C. Protective effect of the extremolytes ectoine and hydroxyectoine in a porcine organ culture. Graefe’s Arch. Clin. Exp. Ophthalmol. = Albrecht Von Graefes Arch. Fur Klin. Und Exp. Ophthalmol. 2020, 258, 2185–2203. [Google Scholar] [CrossRef]
  23. Caruana, N.J.; Stroud, D.A. The road to the structure of the mitochondrial respiratory chain supercomplex. Biochem. Soc. Trans. 2020, 48, 621–629. [Google Scholar] [CrossRef]
  24. Passi, S.; De Pita, O.; Grandinetti, M.; Simotti, C.; Littarru, G.P. The combined use of oral and topical lipophilic antioxidants increases their levels both in sebum and stratum corneum. BioFactors 2003, 18, 289–297. [Google Scholar] [CrossRef] [PubMed]
  25. Ernster, L.; Dallner, G. Biochemical, physiological and medical aspects of ubiquinone function. Biochim. Biophys. Acta 1995, 1271, 195–204. [Google Scholar] [CrossRef]
  26. Choi, H.; Park, H.H.; Lee, K.Y.; Choi, N.Y.; Yu, H.J.; Lee, Y.J.; Park, J.; Huh, Y.M.; Lee, S.H.; Koh, S.H. Coenzyme Q10 restores amyloid beta-inhibited proliferation of neural stem cells by activating the PI3K pathway. Stem Cells Dev. 2013, 22, 2112–2120. [Google Scholar] [CrossRef] [PubMed]
  27. Li, R.; Ren, T.; Zeng, J. Mitochondrial Coenzyme Q Protects Sepsis-Induced Acute Lung Injury by Activating PI3K/Akt/GSK-3beta/mTOR Pathway in Rats. BioMed Res. Int. 2019, 2019, 5240898. [Google Scholar] [CrossRef] [PubMed]
  28. Li, X.; Zhan, J.; Hou, Y.; Hou, Y.; Chen, S.; Luo, D.; Luan, J.; Wang, L.; Lin, D. Coenzyme Q10 Regulation of Apoptosis and Oxidative Stress in H2O2 Induced BMSC Death by Modulating the Nrf-2/NQO-1 Signaling Pathway and Its Application in a Model of Spinal Cord Injury. Oxidative Med. Cell. Longev. 2019, 2019, 6493081. [Google Scholar] [CrossRef] [PubMed]
  29. Edwards, G.; Lee, Y.; Kim, M.; Bhanvadia, S.; Kim, K.Y.; Ju, W.K. Effect of Ubiquinol on Glaucomatous Neurodegeneration and Oxidative Stress: Studies for Retinal Ganglion Cell Survival and/or Visual Function. Antioxidants 2020, 9, 952. [Google Scholar] [CrossRef] [PubMed]
  30. Ju, W.K.; Shim, M.S.; Kim, K.Y.; Bu, J.H.; Park, T.L.; Ahn, S.; Weinreb, R.N. Ubiquinol promotes retinal ganglion cell survival and blocks the apoptotic pathway in ischemic retinal degeneration. Biochem. Biophys. Res. Commun. 2018, 503, 2639–2645. [Google Scholar] [CrossRef] [PubMed]
  31. Mueller-Buehl, A.M.; Buehner, T.; Pfarrer, C.; Deppe, L.; Peters, L.; Dick, B.H.; Joachim, S.C. Hypoxic Processes Induce Complement Activation via Classical Pathway in Porcine Neuroretinas. Cells 2021, 10, 3575. [Google Scholar] [CrossRef]
  32. Ito, D.; Imai, Y.; Ohsawa, K.; Nakajima, K.; Fukuuchi, Y.; Kohsaka, S. Microglia-specific localisation of a novel calcium binding protein, Iba1. Brain Res. Mol. Brain Res. 1998, 57, 1–9. [Google Scholar] [CrossRef]
  33. Pereiro, X.; Ruzafa, N.; Urcola, J.H.; Sharma, S.C.; Vecino, E. Differential Distribution of RBPMS in Pig, Rat, and Human Retina after Damage. Int. J. Mol. Sci. 2020, 21, 9330. [Google Scholar] [CrossRef] [PubMed]
  34. Rodriguez, A.R.; de Sevilla Muller, L.P.; Brecha, N.C. The RNA binding protein RBPMS is a selective marker of ganglion cells in the mammalian retina. J. Comp. Neurol. 2014, 522, 1411–1443. [Google Scholar] [CrossRef] [PubMed]
  35. Miller, A.F. Superoxide dismutases: Ancient enzymes and new insights. FEBS Lett. 2012, 586, 585–595. [Google Scholar] [CrossRef] [PubMed]
  36. Nojima, Y.; Ito, K.; Ono, H.; Nakazato, T.; Bono, H.; Yokoyama, T.; Sato, R.; Suetsugu, Y.; Nakamura, Y.; Yamamoto, K.; et al. Superoxide dismutases, SOD1 and SOD2, play a distinct role in the fat body during pupation in silkworm Bombyx mori. PLoS ONE 2015, 10, e0116007. [Google Scholar] [CrossRef] [PubMed]
  37. Zelko, I.N.; Mariani, T.J.; Folz, R.J. Superoxide dismutase multigene family: A comparison of the CuZn-SOD (SOD1), Mn-SOD (SOD2), and EC-SOD (SOD3) gene structures, evolution, and expression. Free Radic. Biol. Med. 2002, 33, 337–349. [Google Scholar] [CrossRef] [PubMed]
  38. Fernandes, K.A.; Harder, J.M.; Williams, P.A.; Rausch, R.L.; Kiernan, A.E.; Nair, K.S.; Anderson, M.G.; John, S.W.; Howell, G.R.; Libby, R.T. Using genetic mouse models to gain insight into glaucoma: Past results and future possibilities. Exp. Eye Res. 2015, 141, 42–56. [Google Scholar] [CrossRef] [PubMed]
  39. Harada, C.; Kimura, A.; Guo, X.; Namekata, K.; Harada, T. Recent advances in genetically modified animal models of glaucoma and their roles in drug repositioning. Br. J. Ophthalmol. 2019, 103, 161–166. [Google Scholar] [CrossRef] [PubMed]
  40. Maliha, A.M.; Kuehn, S.; Hurst, J.; Herms, F.; Fehr, M.; Bartz-Schmidt, K.U.; Dick, H.B.; Joachim, S.C.; Schnichels, S. Diminished apoptosis in hypoxic porcine retina explant cultures through hypothermia. Sci. Rep. 2019, 9, 4898. [Google Scholar] [CrossRef]
  41. Liu, H.; Prokosch, V. Energy Metabolism in the Inner Retina in Health and Glaucoma. Int. J. Mol. Sci. 2021, 22, 3689. [Google Scholar] [CrossRef]
  42. Yu, D.Y.; Cringle, S.J.; Balaratnasingam, C.; Morgan, W.H.; Yu, P.K.; Su, E.N. Retinal ganglion cells: Energetics, compartmentation, axonal transport, cytoskeletons and vulnerability. Prog. Retin. Eye Res. 2013, 36, 217–246. [Google Scholar] [CrossRef]
  43. Abraha, A.M.; Ketema, E.B. Apoptotic pathways as a therapeutic target for colorectal cancer treatment. World J. Gastrointest. Oncol. 2016, 8, 583–591. [Google Scholar] [CrossRef] [PubMed]
  44. Elmore, S. Apoptosis: A review of programmed cell death. Toxicol. Pathol. 2007, 35, 495–516. [Google Scholar] [CrossRef] [PubMed]
  45. Mueller-Buehl, A.M.; Tsai, T.; Hurst, J.; Theiss, C.; Peters, L.; Hofmann, L.; Herms, F.; Kuehn, S.; Schnichels, S.; Joachim, S.C. Reduced Retinal Degeneration in an Oxidative Stress Organ Culture Model through an iNOS-Inhibitor. Biology 2021, 10, 383. [Google Scholar] [CrossRef]
  46. Zhang, M.; ShiYang, X.; Zhang, Y.; Miao, Y.; Chen, Y.; Cui, Z.; Xiong, B. Coenzyme Q10 ameliorates the quality of postovulatory aged oocytes by suppressing DNA damage and apoptosis. Free Radic. Biol. Med. 2019, 143, 84–94. [Google Scholar] [CrossRef] [PubMed]
  47. Moon, Y.; Lee, K.H.; Park, J.H.; Geum, D.; Kim, K. Mitochondrial membrane depolarization and the selective death of dopaminergic neurons by rotenone: Protective effect of coenzyme Q10. J. Neurochem. 2005, 93, 1199–1208. [Google Scholar] [CrossRef] [PubMed]
  48. Fu, R.; Shen, Q.; Xu, P.; Luo, J.J.; Tang, Y. Phagocytosis of microglia in the central nervous system diseases. Mol. Neurobiol. 2014, 49, 1422–1434. [Google Scholar] [CrossRef] [PubMed]
  49. Grigsby, J.G.; Cardona, S.M.; Pouw, C.E.; Muniz, A.; Mendiola, A.S.; Tsin, A.T.; Allen, D.M.; Cardona, A.E. The role of microglia in diabetic retinopathy. J. Ophthalmol. 2014, 2014, 705783. [Google Scholar] [CrossRef] [PubMed]
  50. Aguzzi, A.; Barres, B.A.; Bennett, M.L. Microglia: Scapegoat, saboteur, or something else? Science 2013, 339, 156–161. [Google Scholar] [CrossRef] [PubMed]
  51. Li, Y.; He, X.; Kawaguchi, R.; Zhang, Y.; Wang, Q.; Monavarfeshani, A.; Yang, Z.; Chen, B.; Shi, Z.; Meng, H.; et al. Microglia-organized scar-free spinal cord repair in neonatal mice. Nature 2020, 587, 613–618. [Google Scholar] [CrossRef]
  52. Todd, L.; Palazzo, I.; Suarez, L.; Liu, X.; Volkov, L.; Hoang, T.V.; Campbell, W.A.; Blackshaw, S.; Quan, N.; Fischer, A.J. Reactive microglia and IL1beta/IL-1R1-signaling mediate neuroprotection in excitotoxin-damaged mouse retina. J. Neuroinflamm. 2019, 16, 118. [Google Scholar] [CrossRef]
  53. Ozawa, Y. Oxidative stress in the light-exposed retina and its implication in age-related macular degeneration. Redox Biol. 2020, 37, 101779. [Google Scholar] [CrossRef] [PubMed]
  54. Saada, J.; McAuley, R.J.; Marcatti, M.; Tang, T.Z.; Motamedi, M.; Szczesny, B. Oxidative stress induces Z-DNA-binding protein 1-dependent activation of microglia via mtDNA released from retinal pigment epithelial cells. J. Biol. Chem. 2022, 298, 101523. [Google Scholar] [CrossRef] [PubMed]
  55. Wei, X.; Cho, K.S.; Thee, E.F.; Jager, M.J.; Chen, D.F. Neuroinflammation and microglia in glaucoma: Time for a paradigm shift. J. Neurosci. Res. 2019, 97, 70–76. [Google Scholar] [CrossRef] [PubMed]
  56. Hopperton, K.E.; Mohammad, D.; Trepanier, M.O.; Giuliano, V.; Bazinet, R.P. Markers of microglia in post-mortem brain samples from patients with Alzheimer’s disease: A systematic review. Mol. Psychiatry 2018, 23, 177–198. [Google Scholar] [CrossRef] [PubMed]
  57. Wagner, N.; Reinehr, S.; Palmhof, M.; Schuschel, D.; Tsai, T.; Sommer, E.; Frank, V.; Stute, G.; Dick, H.B.; Joachim, S.C. Microglia Activation in Retinal Ischemia Triggers Cytokine and Toll-Like Receptor Response. J. Mol. Neurosci. MN 2021, 71, 527–544. [Google Scholar] [CrossRef] [PubMed]
  58. Tezel, G.; Yang, X.; Luo, C.; Kain, A.D.; Powell, D.W.; Kuehn, M.H.; Kaplan, H.J. Oxidative stress and the regulation of complement activation in human glaucoma. Investig. Ophthalmol. Vis. Sci. 2010, 51, 5071–5082. [Google Scholar] [CrossRef] [PubMed]
  59. Tsai, T.; Reinehr, S.; Maliha, A.M.; Joachim, S.C. Immune Mediated Degeneration and Possible Protection in Glaucoma. Front. Neurosci. 2019, 13, 931. [Google Scholar] [CrossRef] [PubMed]
  60. Karlstetter, M.; Scholz, R.; Rutar, M.; Wong, W.T.; Provis, J.M.; Langmann, T. Retinal microglia: Just bystander or target for therapy? Prog. Retin. Eye Res. 2015, 45, 30–57. [Google Scholar] [CrossRef]
  61. Kinuthia, U.M.; Wolf, A.; Langmann, T. Microglia and Inflammatory Responses in Diabetic Retinopathy. Front. Immunol. 2020, 11, 564077. [Google Scholar] [CrossRef]
  62. Yin, Y.J.; Zeng, S.L.; Li, Y.W.; Wu, Z.; Huang, D.J.; Tang, H.Z. The effect of coenzyme Q10 plus trimetazidine on acute viral myocarditis treatment. Am. J. Transl. Res. 2021, 13, 13854–13861. [Google Scholar]
  63. Ghasemi, H.; Ghazanfari, T.; Yaraee, R.; Faghihzadeh, S.; Hassan, Z.M. Roles of IL-8 in ocular inflammations: A review. Ocul. Immunol. Inflamm. 2011, 19, 401–412. [Google Scholar] [CrossRef] [PubMed]
  64. Gomes, C.; VanderWall, K.B.; Pan, Y.; Lu, X.; Lavekar, S.S.; Huang, K.C.; Fligor, C.M.; Harkin, J.; Zhang, C.; Cummins, T.R.; et al. Astrocytes modulate neurodegenerative phenotypes associated with glaucoma in OPTN(E50K) human stem cell-derived retinal ganglion cells. Stem Cell Rep. 2022, 17, 1636–1649. [Google Scholar] [CrossRef] [PubMed]
  65. Ulbrich, F.; Lerach, T.; Biermann, J.; Kaufmann, K.B.; Lagreze, W.A.; Buerkle, H.; Loop, T.; Goebel, U. Argon mediates protection by interleukin-8 suppression via a TLR2/TLR4/STAT3/NF-kappaB pathway in a model of apoptosis in neuroblastoma cells in vitro and following ischemia-reperfusion injury in rat retina in vivo. J. Neurochem. 2016, 138, 859–873. [Google Scholar] [CrossRef] [PubMed]
  66. Alcaraz, M.J.; Ferrandiz, M.L. Relevance of Nrf2 and heme oxygenase-1 in articular diseases. Free Radic. Biol. Med. 2020, 157, 83–93. [Google Scholar] [CrossRef] [PubMed]
  67. Dunn, L.L.; Midwinter, R.G.; Ni, J.; Hamid, H.A.; Parish, C.R.; Stocker, R. New insights into intracellular locations and functions of heme oxygenase-1. Antioxid. Redox Signal. 2014, 20, 1723–1742. [Google Scholar] [CrossRef] [PubMed]
  68. Bellezza, I.; Giambanco, I.; Minelli, A.; Donato, R. Nrf2-Keap1 signaling in oxidative and reductive stress. Biochim. Et Biophys. Acta. Mol. Cell Res. 2018, 1865, 721–733. [Google Scholar] [CrossRef] [PubMed]
  69. Himori, N.; Yamamoto, K.; Maruyama, K.; Ryu, M.; Taguchi, K.; Yamamoto, M.; Nakazawa, T. Critical role of Nrf2 in oxidative stress-induced retinal ganglion cell death. J. Neurochem. 2013, 127, 669–680. [Google Scholar] [CrossRef]
  70. Bruscolini, A.; Lambiase, A.; Segatto, M.; La Cava, M.; Nebbioso, M.; Sacchetti, M. Evaluation of IL8 pathway on the ocular surface: New insights in patients with ocular mucous membrane pemphigoid. Acta Ophthalmol. 2020, 98, e173–e177. [Google Scholar] [CrossRef]
  71. Singh, A.; Kukreti, R.; Saso, L.; Kukreti, S. Oxidative Stress: A Key Modulator in Neurodegenerative Diseases. Molecules 2019, 24, 1583. [Google Scholar] [CrossRef]
  72. Somayajulu, M.; McCarthy, S.; Hung, M.; Sikorska, M.; Borowy-Borowski, H.; Pandey, S. Role of mitochondria in neuronal cell death induced by oxidative stress; neuroprotection by Coenzyme Q10. Neurobiol. Dis. 2005, 18, 618–627. [Google Scholar] [CrossRef]
Figure 1. Experimental setup. Retinal explants were prepared on day zero. Degeneration was induced on day one by H2O2 (500 µM) for 3 h. The H2O2 + CoQ10 explants simultaneously received CoQ10 treatment (700 µM), which remained for 48 h. Retinae of the control group received medium without stressor or CoQ10. After eight days of cultivation, samples from all three groups were analyzed with hematoxylin and eosin staining (HE), immunohistological staining (IHC), and quantitative real-time PCR (RT-qPCR) analysis.
Jpm 14 00437 g001
Figure 2. Retinal thickness was comparable in all groups. (A) Pictures displaying the retinal layers on HE-stained sections of each experimental group after 8 days. (B) No alteration in retinal thickness was noted within the groups. CoQ10 = coenzyme Q10; GCL = ganglion cell layer; HE = hematoxylin and eosin; INL = inner nuclear layer; IPL = inner plexiform layer; ONL = outer nuclear layer; OPL = outer plexiform layer; PR = photoreceptors. n = 8/group, values are shown as mean ± SEM. Scale bar: 50 µm.
Jpm 14 00437 g002
Figure 3. RGC protection through CoQ10 after H2O2 exposition. (A) RGCs of all groups were stained with antibodies against RBPMS (red) after eight days. DAPI (blue) was used to visualize cell nuclei. (B) RGC number was significantly decreased in the H2O2 group compared to controls (p ≤ 0.001). This RGC loss was no longer detectable after CoQ10 treatment compared to the damaged group (p ≤ 0.001). (C) The relative mRNA level of RBPMS was significantly decreased after oxidative stress induction compared to controls (p = 0.03), while the expression in the H2O2 + CoQ10 group was similar to the control group. CoQ10 = coenzyme Q10; GCL = ganglion cell layer; INL = inner nuclear layer; IPL = inner plexiform layer; ONL = outer nuclear layer; OPL = outer plexiform layer. (B): n = 8/group, values are shown as mean ± SEM; (C): n = 6/group, values are shown as mean ± SEM, raw data visualized as dots. Scale bar: 20 µm. * p ≤ 0.05 and *** p ≤ 0.001 vs. control and ### p ≤ 0.001 vs. H2O2.
Jpm 14 00437 g003
Figure 4. CoQ10 prevents H2O2-induced proliferation of microglia. (A) After eight days, microglia cells were stained with antibodies against Iba1 (green) and DAPI (blue), which was used to visualize the cell nuclei. (B) The H2O2 group revealed a significant increase in Iba1+ cells in the area of the GCL to the INL compared to the controls (p = 0.003). In the H2O2 + CoQ10 group, no changes were visible. (C) When comparing the GCC of the damaged group with the one of the controls, similar results were detectable (p = 0.010). (D) In terms of mRNA level, the expression of ITGAM revealed no changes in any groups. Also, the comparison between both H2O2 groups was unremarkable. CoQ10 = coenzyme Q10; GCC = ganglion cell complex; GCL = ganglion cell layer; INL = inner nuclear layer; IPL = inner plexiform layer; ONL = outer nuclear layer; OPL = outer plexiform layer. (B,C): n = 8/group, values are shown as mean ± SEM; (D): n = 6/group, values are shown as mean ± SEM, raw data visualized as dots. Scale bar: 20 µm. * p ≤ 0.05 and ** p ≤ 0.01 vs. control.
Jpm 14 00437 g004
Figure 5. Low inflammatory response after eight days through H2O2 or CoQ10 treatment. (A) Both groups showed no significant changes in relative IL6 mRNA expression versus controls. (B) In contrast, the relative mRNA expression of IL8 was significantly increased in the H2O2 group compared to the control group (p = 0.035), but the H2O2 + CoQ10 group showed no differences. Also, there were no differences in IL8 expression in the direct comparison of the two H2O2 groups. (C) The relative mRNA expression of TNF was not altered. CoQ10 = coenzyme Q10. n = 6/group, values are shown as mean ± SEM, raw data visualized as dots. * p ≤ 0.05 vs. control.
Jpm 14 00437 g005
Figure 6. CoQ10 stimulates intracellular protection cascade against oxidative stress. (A) Relative expression of NRF2 was significantly increased after H2O2 and CoQ10 in comparison to controls (H2O2: p = 0.011; H2O2 + CoQ10: p ≤ 0.001). In a direct comparison of both H2O2 groups, the NRF2 expression was not significantly changed. (B) Comparable but not significant results were detectable considering the HMOX1 expression, where both groups exposed a higher expression level compared to the controls. However, the variance with CoQ10 was not strong enough to cause differences while comparing the two H2O2 groups. (C) No statistical differences were noted regarding the SOD1 expression when comparing the H2O2 groups to the control group. SOD1 expression in the two H2O2 groups was similar. (D) In the H2O2 group, the expression of SOD2 was significantly increased (p = 0.038). The H2O2 + CoQ10 group showed a significantly decreased SOD2 expression compared to the H2O2 group (p = 0.026). CoQ10 = coenzyme Q10. n = 6/group, values are shown as mean ± SEM, raw data visualized as dots. * p ≤ 0.05 and *** p ≤ 0.001 vs. control; # p ≤ 0.05 vs. H2O2.
Jpm 14 00437 g006
Figure 7. Graphical summary showing protective effects of CoQ10 on porcine retinae damaged by H2O2. Oxidative damage was induced by H2O2, and some samples were treated with CoQ10. A significant RGC loss through H2O2 application was noted via RBPMS in the immunohistological evaluation and RT-qPCR analysis, which was no longer detectable with CoQ10 treatment. Additionally, the damage caused higher microglia numbers identified by Iba1 staining. Within the analyses of inflammation markers, higher IL8 mRNA levels were detected in the H2O2 group counteracted by CoQ10. Furthermore, the antioxidant was able to increase the expression of specific oxidative protection cascade genes, like NRF2, to a large extent. Finally, mitochondrial stress, examined by the expression of SOD2, was elevated after oxidative stress induction. This effect was no longer detectable after CoQ10 application. Overall, CoQ10 positively affected the protection of RGCs by possibly altering apoptotic-related processes, microglial activity, and oxidative stress, as well as associated protective cascades.
Jpm 14 00437 g007
Table 1. Primary and secondary antibodies used for immunohistology.
Primary AntibodiesSecondary Antibodies
AntibodySourceCompanyDilutionAntibodyCompanyDilution
Anti-Iba1ChickenSynaptic Systems1:500Donkey anti-chicken
Alexa Fluor 488
Jackson Immuno Research1:500
Anti-RBPMSRabbitMillipore1:200Donkey anti-rabbit
Alexa Fluor 555
Invitrogen1:500
Table 2. Sequences of primers used for RT-qPCR.
GenePrimer Fwd (5′-3′)
Primer Rev (5′-3′)
GenBank Acc. No.Amplicon Size
H3ACTGGCTACAAAAGCCGCTCNM_213930.1232
ACTTGCCTCCTGCAAAGCAC
HMOX1GGCTGAGAATGCCGAGTTCANM_001004027.188
GTGGTACAAGGACGCCATCA
IL6GCAGTCACAGAACGAGTGGANM_214399.184
CTCAGGCTGAACTGCAGGAA
IL8TTCCAAACTGGCTGTTGCCTM86923.1178
ACAGTGGGGTCCACTCTCAA
ITGAMAGAAGGAGACACCCAGAGCAXM_021086380.1169
GTAGGACAATGGGCGTCACT
NRF2GCCGACTATTCCCAGGTAGCXM_003133500.6713
GTTGTGCTTTCACGGTGGTC
RBPMSCGAGAAGGAGAACACCCCGAACXM_003133393.4549
CAAAAGACAGGTGTGTTGGGC
SOD1AAAACATGGTGGGCCAAAGGNM_001190422.172
CCATCTTTGCCAGCAGTCAC
SOD2CAGCTCGAGCAGGAATCTGGNM_214127.287
CCATAGTCGTACGGCAGGTC
TNFGCCCTTCCACCAACGTTTTCNM_214022.197
CAAGGGCTCTTGATGGCAGA
Disclaimer/Publisher’s Note: The statements, opinions and data contained in all publications are solely those of the individual author(s) and contributor(s) and not of MDPI and/or the editor(s). MDPI and/or the editor(s) disclaim responsibility for any injury to people or property resulting from any ideas, methods, instructions or products referred to in the content.

