The Interaction between Genetic Polymorphisms in FTO and TCF7L2 Genes and Dietary Intake with Regard to Body Mass and Composition: An Exploratory Study


Abstract
:1. Introduction
2. Materials and Methods
2.1. Study Participants and Data Collection
2.2. Anthropometric Measurements
2.3. Dietary Data
2.4. Genotyping
2.5. Statistical Analyses
3. Results
3.1. Genotype Frequencies
3.2. Associations of Baseline Characteristics, Lifestyle, and Dietary Habits with Genotypes
3.3. Associations of BMI and Body Fat and Muscle with Genotypes
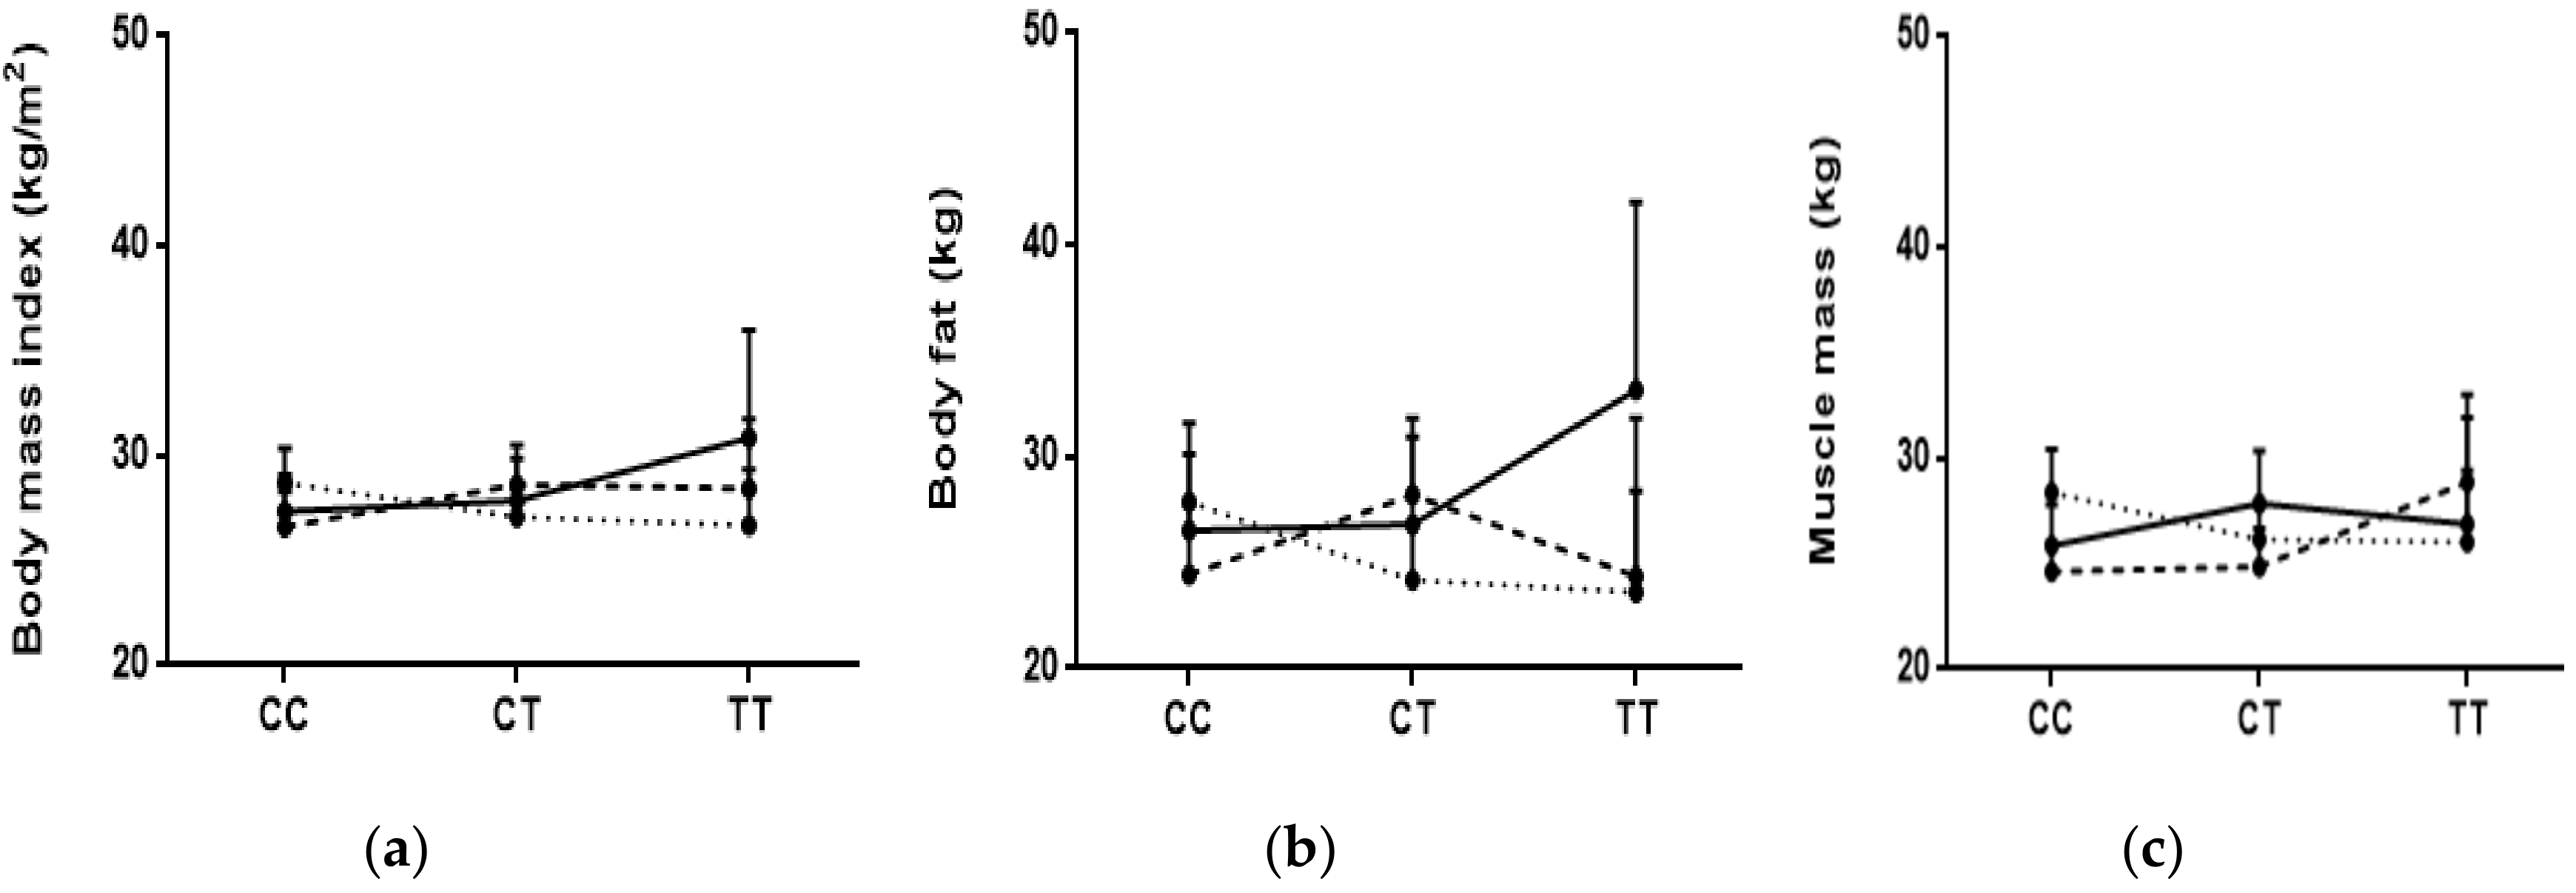
3.4. Interactions between Diet and Genotypes with BMI, Body Fat, and Muscle Mass
4. Discussion
5. Conclusions
Supplementary Materials
Author Contributions
Funding
Acknowledgments
Conflicts of Interest
References
- Hossain, P.; Kawar, B.; El Nahas, M. Obesity and diabetes in the developing world—A growing challenge. N. Engl. J. Med. 2007, 356, 213–215. [Google Scholar] [CrossRef] [PubMed]
- Ni, M.C.; Rodgers, A.; Pan, W.H.; Gu, D.F.; Woodward, M. Body mass index and cardiovascular disease in the Asia-Pacific Region: An overview of 33 cohorts involving 310000 participants. Int. J. Epidemiol. 2004, 33, 751–758. [Google Scholar]
- Whitlock, G.; Lewington, S.; Sherliker, P.; Clarke, R.; Emberson, J.; Halsey, J.; Qizilbash, N.; Collins, R.; Peto, R. Body-mass index and cause-specific mortality in 900000 adults: Collaborative analyses of 57 prospective studies. Lancet 2009, 373, 1083–1096. [Google Scholar] [PubMed]
- Wormser, D.; Kaptoge, S.; Di, A.E.; Wood, A.M.; Pennells, L.; Thompson, A.; Sarwar, N.; Kizer, J.R.; Lawlor, D.A.; Nordestgaard, B.G.; et al. Separate and combined associations of body-mass index and abdominal adiposity with cardiovascular disease: Collaborative analysis of 58 prospective studies. Lancet 2011, 377, 1085–1095. [Google Scholar]
- Renehan, A.G.; Tyson, M.; Egger, M.; Heller, R.F.; Zwahlen, M. Body-mass index and incidence of cancer: A systematic review and meta-analysis of prospective observational studies. Lancet 2008, 371, 569–578. [Google Scholar] [CrossRef]
- Lim, S.S.; Vos, T.; Flaxman, A.D.; Danaei, G.; Shibuya, K.; Adair-Rohani, H.; Amann, M.; Anderson, H.R.; Andrews, K.G.; Aryee, M.; et al. A comparative risk assessment of burden of disease and injury attributable to 67 risk factors and risk factor clusters in 21 regions, 1990-2010: A systematic analysis for the Global Burden of Disease Study 2010. Lancet 2012, 380, 2224–2260. [Google Scholar] [CrossRef]
- Nasreddine, L.; Naja, F.; Chamieh, M.C.; Adra, N.; Sibai, A.M.; Hwalla, N. Trends in overweight and obesity in Lebanon: Evidence from two national cross-sectional surveys (1997 and 2009). BMC Public Health 2012, 12, 798. [Google Scholar] [CrossRef] [PubMed]
- Nasreddine, L.; Naja, F.A.; Sibai, A.M.; Helou, K.; Adra, N.; Hwalla, N. Trends in nutritional intakes and nutrition-related cardiovascular disease risk factors in Lebanon: The need for immediate action. J. Med. Liban. 2014, 62, 83–91. [Google Scholar] [CrossRef]
- Finucane, M.M.; Stevens, G.A.; Cowan, M.J.; Danaei, G.; Lin, J.K.; Paciorek, C.J.; Singh, G.M.; Gutierrez, H.R.; Lu, Y.; Bahalim, A.N.; et al. National, regional, and global trends in body-mass index since 1980: Systematic analysis of health examination surveys and epidemiological studies with 960 country-years and 9.1 million participants. Lancet 2011, 377, 557–567. [Google Scholar] [CrossRef]
- Doo, M.; Kim, Y. Obesity: Interactions of genome and nutrients intake. Prev. Nutr. Food Sci. 2015, 20, 1–7. [Google Scholar] [CrossRef]
- Huang, T.; Hu, F.B. Gene-environment interactions and obesity: Recent developments and future directions. BMC Med. Genom. 2015, 8, S2. [Google Scholar] [CrossRef] [PubMed]
- CDC. Public Health Genomics Knowledge Base (v5.0). Phenopedia. Obesity. Available online: https://phgkb.cdc.gov/PHGKB/phenoPedia.action?firstQuery=Obesity&cuiID=C0028754&typeSubmit=GO&check=y&which=2&pubOrderType=pubD (accessed on 10 January 2018).
- Hunt, S.C.; Stone, S.; Xin, Y.; Scherer, C.A.; Magness, C.L.; Iadonato, S.P.; Hopkins, P.N.; Adams, T.D. Association of the FTO gene with BMI. Obesity 2008, 16, 902–904. [Google Scholar] [CrossRef] [PubMed]
- Xiang, L.; Wu, H.; Pan, A.; Patel, B.; Xiang, G.; Qi, L.; Kaplan, R.C.; Hu, F.; Wylie-Rosett, J.; Qi, Q. FTO genotype and weight loss in diet and lifestyle interventions: A systematic review and meta-analysis. Am. J. Clin. Nutr. 2016, 103, 1162–1170. [Google Scholar] [CrossRef] [PubMed]
- Zhang, X.; Qi, Q.; Zhang, C.; Smith, S.R.; Hu, F.B.; Sacks, F.M.; Bray, G.A.; Qi, L. FTO genotype and 2-year change in body composition and fat distribution in response to weight-loss diets: The POUNDS LOST Trial. Diabetes 2012, 61, 3005–3011. [Google Scholar] [CrossRef] [PubMed]
- Phillips, C.M.; Kesse-Guyot, E.; McManus, R.; Hercberg, S.; Lairon, D.; Planells, R.; Roche, H.M. High dietary saturated fat intake accentuates obesity risk associated with the fat mass and obesity-associated gene in adults. J. Nutr. 2012, 142, 824–831. [Google Scholar] [CrossRef] [PubMed]
- Sonestedt, E.; Roos, C.; Gullberg, B.; Ericson, U.; Wirfalt, E.; Orho-Melander, M. Fat and carbohydrate intake modify the association between genetic variation in the FTO genotype and obesity. Am. J. Clin. Nutr. 2009, 90, 1418–1425. [Google Scholar] [CrossRef] [PubMed] [Green Version]
- Andreasen, C.H.; Stender-Petersen, K.L.; Mogensen, M.S.; Torekov, S.S.; Wegner, L.; Andersen, G.; Nielsen, A.L.; Albrechtsen, A.; Borch-Johnsen, K.; Rasmussen, S.S.; et al. Low physical activity accentuates the effect of the FTO rs9939609 polymorphism on body fat accumulation. Diabetes 2008, 57, 95–101. [Google Scholar] [CrossRef]
- Grau, K.; Cauchi, S.; Holst, C.; Astrup, A.; Martinez, J.A.; Saris, W.H.; Blaak, E.E.; Oppert, J.M.; Arner, P.; Rössner, S.; et al. TCF7L2 rs7903146-macronutrient interaction in obese individuals’ responses to a 10-wk randomized hypoenergetic diet. Am. J. Clin. Nutr. 2010, 91, 472–479. [Google Scholar] [CrossRef]
- Mattei, J.; Qi, Q.; Hu, F.B.; Sacks, F.M.; Qi, L. TCF7L2 genetic variants modulate the effect of dietary fat intake on changes in body composition during a weight-loss intervention. Am. J. Clin. Nutr. 2012, 96, 1129–1136. [Google Scholar] [CrossRef] [Green Version]
- Hosseini-Esfahani, F.; Mirmiran, P.; Daneshpour, M.S.; Mehrabi, Y.; Hedayati, M.; Zarkesh, M.; Azizi, F. Western dietary pattern interaction with APOC3 polymorphism in the risk of metabolic syndrome: Tehran Lipid and Glucose Study. J. Nutrigenet. Nutrigenom. 2014, 7, 105–117. [Google Scholar] [CrossRef]
- Hosseini-Esfahani, F.; Mirmiran, P.; Daneshpour, M.S.; Mehrabi, Y.; Hedayati, M.; Soheilian-Khorzoghi, M.; Azizi, F. Dietary patterns interact with APOA1/APOC3 polymorphisms to alter the risk of the metabolic syndrome: The Tehran Lipid and Glucose Study. Br. J. Nutr. 2015, 113, 644–653. [Google Scholar] [CrossRef] [PubMed]
- Khalilitehrani, A.; Qorbani, M.; Hosseini, S.; Pishva, H. The association of MC4R rs17782313 polymorphism with dietary intake in Iranian adults. Gene 2015, 563, 125–129. [Google Scholar] [CrossRef] [PubMed]
- Zgheib, N.K.; Sleiman, F.; Nasreddine, L.; Nasrallah, M.; Nakhoul, N.; Isma’eel, H.; Tamim, H. Short Telomere Length is Associated with Aging, Central Obesity, Poor Sleep and Hypertension in Lebanese Individuals. Aging Dis. 2018, 9, 77–89. [Google Scholar] [CrossRef] [PubMed] [Green Version]
- Craig, C.L.; Marshall, A.L.; Sjostrom, M.; Bauman, A.E.; Booth, M.L.; Ainsworth, B.E.; Pratt, M.; Ekelund, U.; Yngve, A.; Sallis, J.F.; et al. International physical activity questionnaire: 12-country reliability and validity. Med. Sci. Sports Exerc. 2003, 35, 1381–1395. [Google Scholar] [CrossRef] [PubMed]
- Lee, R.D.; Nieman, D.C. Nutritional Assessment, 4th ed.; McGraw-Hill: New York, NY, USA, 2007. [Google Scholar]
- Naja, F.; Nasreddine, L.; Itani, L.; Chamieh, M.C.; Adra, N.; Sibai, A.M.; Hwalla, N. Dietary patterns and their association with obesity and sociodemographic factors in a national sample of Lebanese adults. Public Health Nutr. 2011, 14, 1570–1578. [Google Scholar] [CrossRef] [PubMed] [Green Version]
- Millen, B.E.; Morgan, J.L. The 2D Food Portion Visual; Nutrition Consulting Enterprises: Framingham, MA, USA, 1996. [Google Scholar]
- Pellet, P.; Shadarevian, S. Food Composition: Tables for Use in the Middle East; American University of Beirut: Beirut, Lebanon, 1970. [Google Scholar]
- CSHL-HAPMAP. CEU. Available online: https://www.ncbi.nlm.nih.gov/projects/SNP/snp_viewTable.cgi?pop=1409 (accessed on 10 January 2018).
- Tanaka, T.; Ngwa, J.S.; van Rooij, F.J.; Zillikens, M.C.; Wojczynski, M.K.; Frazier-Wood, A.C.; Houston, D.K.; Kanoni, S.; Lemaitre, R.N.; Luan, J.; et al. Genome-wide meta-analysis of observational studies shows common genetic variants associated with macronutrient intake. Am. J. Clin. Nutr. 2013, 97, 1395–1402. [Google Scholar] [CrossRef] [PubMed] [Green Version]
- Speliotes, E.K.; Willer, C.J.; Berndt, S.I.; Monda, K.L.; Thorleifsson, G.; Jackson, A.U.; Lango Allen, H.; Lindgren, C.M.; Luan, J.; Mägi, R.; et al. Association analyses of 249,796 individuals reveal 18 new loci associated with body mass index. Nat. Genet. 2010, 42, 937–948. [Google Scholar] [CrossRef] [Green Version]
- Hinney, A.; Nguyen, T.T.; Scherag, A.; Friedel, S.; Bronner, G.; Muller, T.D.; Grallert, H.; Illig, T.; Wichmann, H.E.; Rief, W.; et al. Genome wide association (GWA) study for early onset extreme obesity supports the role of fat mass and obesity associated gene (FTO) variants. PLoS ONE 2007, 2, e1361. [Google Scholar] [CrossRef]
- Meyre, D.; Delplanque, J.; Chevre, J.C.; Lecoeur, C.; Lobbens, S.; Gallina, S.; Durand, E.; Vatin, V.; Degraeve, F.; Proença, C.; et al. Genome-wide association study for early-onset and morbid adult obesity identifies three new risk loci in European populations. Nat. Genet. 2009, 41, 157–159. [Google Scholar] [CrossRef]
- Willer, C.J.; Speliotes, E.K.; Loos, R.J.; Li, S.; Lindgren, C.M.; Heid, I.M.; Berndt, S.I.; Elliott, A.L.; Jackson, A.U.; Lamina, C.; et al. Six new loci associated with body mass index highlight a neuronal influence on body weight regulation. Nat. Genet. 2009, 41, 25–34. [Google Scholar] [CrossRef]
- Hagg, S.; Ganna, A.; Van Der Laan, S.W.; Esko, T.; Pers, T.H.; Locke, A.E.; Berndt, S.I.; Justice, A.E.; Kahali, B.; Siemelink, M.A.; et al. Gene-based meta-analysis of genome-wide association studies implicates new loci involved in obesity. Hum. Mol. Genet. 2015, 24, 6849–6860. [Google Scholar] [PubMed] [Green Version]
- Yang, J.; Loos, R.J.; Powell, J.E.; Medland, S.E.; Speliotes, E.K.; Chasman, D.I.; Rose, L.M.; Thorleifsson, G.; Steinthorsdottir, V.; Mägi, R.; et al. FTO genotype is associated with phenotypic variability of body mass index. Nature 2012, 490, 267–272. [Google Scholar] [CrossRef] [PubMed] [Green Version]
- Fischer, J.; Koch, L.; Emmerling, C.; Vierkotten, J.; Peters, T.; Bruning, J.C.; Rüther, U. Inactivation of the Fto gene protects from obesity. Nature 2009, 458, 894–898. [Google Scholar] [CrossRef] [PubMed]
- Church, C.; Lee, S.; Bagg, E.A.; McTaggart, J.S.; Deacon, R.; Gerken, T.; Lee, A.; Moir, L.; Mecinović, J.; Quwailid, M.M.; et al. A mouse model for the metabolic effects of the human fat mass and obesity associated FTO gene. PLoS Genet. 2009, 5, e1000599. [Google Scholar] [CrossRef] [PubMed]
- Zhao, X.; Yang, Y.; Sun, B.F.; Zhao, Y.L.; Yang, Y.G. FTO and obesity: Mechanisms of association. Curr. Diabetes Rep. 2014, 14, 486. [Google Scholar] [CrossRef] [PubMed]
- Tan, L.J.; Zhu, H.; He, H.; Wu, K.H.; Li, J.; Chen, X.D.; Zhang, J.G.; Shen, H.; Tian, Q.; Krousel-Wood, M.; et al. Replication of 6 obesity genes in a meta-analysis of genome-wide association studies from diverse ancestries. PLoS ONE 2014, 9, e96149. [Google Scholar] [CrossRef] [PubMed]
- Livingstone, K.M.; Celis-Morales, C.; Papandonatos, G.D.; Erar, B.; Florez, J.C.; Jablonski, K.A.; Razquin, C.; Marti, A.; Heianza, Y.; Huang, T.; et al. FTO genotype and weight loss: Systematic review and meta-analysis of 9563 individual participant data from eight randomised controlled trials. BMJ 2017, 356, j263. [Google Scholar] [CrossRef]
- Merritt, D.C.; Jamnik, J.; El-Sohemy, A. FTO genotype, dietary protein intake, and body weight in a multiethnic population of young adults: A cross-sectional study. Genes Nutr. 2018, 13, 4. [Google Scholar] [CrossRef]
- Yi, F.; Brubaker, P.L.; Jin, T. TCF-4 mediates cell type-specific regulation of proglucagon gene expression by beta-catenin and glycogen synthase kinase-3beta. J. Biol. Chem. 2005, 280, 1457–1464. [Google Scholar] [CrossRef]
- Schafer, S.A.; Tschritter, O.; Machicao, F.; Thamer, C.; Stefan, N.; Gallwitz, B.; Holst, J.J.; Dekker, J.M.; ’t Hart, L.M.; Nijpels, G.; et al. Impaired glucagon-like peptide-1-induced insulin secretion in carriers of transcription factor 7-like 2 (TCF7L2) gene polymorphisms. Diabetologia 2007, 50, 2443–2450. [Google Scholar] [CrossRef] [Green Version]
- Cauchi, S.; El Achhab, Y.; Choquet, H.; Krempler, F.; Weitgasser, R.; Nejjari, C.; Patsch, W.; Chikri, M.; Meyre, D.; Froguel, P. TCF7L2 is reproducibly associated with type 2 diabetes in various ethnic groups: A global meta-analysis. J. Mol. Med. 2007, 85, 777–782. [Google Scholar] [CrossRef] [PubMed]
- Povel, C.M.; Boer, J.M.; Reiling, E.; Feskens, E.J. Genetic variants and the metabolic syndrome: A systematic review. Obes. Rev. 2011, 12, 952–967. [Google Scholar] [CrossRef] [PubMed]
- Fisher, E.; Meidtner, K.; Angquist, L.; Holst, C.; Hansen, R.D.; Halkjaer, J.; Masala, G.; Ostergaard, J.N.; Overvad, K.; Palli, D.; et al. Influence of dietary protein intake and glycemic index on the association between TCF7L2 HapA and weight gain. Am. J. Clin. Nutr. 2012, 95, 1468–1476. [Google Scholar] [CrossRef] [PubMed] [Green Version]
- Roswall, N.; Angquist, L.; Ahluwalia, T.S.; Romaguera, D.; Larsen, S.C.; Ostergaard, J.N.; Halkjaer, J.; Vimaleswaran, K.S.; Wareham, N.J.; Bendinelli, B.; et al. Association between Mediterranean and Nordic diet scores and changes in weight and waist circumference: Influence of FTO and TCF7L2 loci. Am. J. Clin. Nutr. 2014, 100, 1188–1197. [Google Scholar] [CrossRef]
- Georgiadi, A.; Kersten, S. Mechanisms of gene regulation by fatty acids. Adv. Nutr. 2012, 3, 127–134. [Google Scholar] [CrossRef] [PubMed]
- Rosqvist, F.; Iggman, D.; Kullberg, J.; Cedernaes, J.; Johansson, H.E.; Larsson, A.; Johansson, L.; Ahlström, H.; Arner, P.; Dahlman, I.; et al. Overfeeding polyunsaturated and saturated fat causes distinct effects on liver and visceral fat accumulation in humans. Diabetes 2014, 63, 2356–2368. [Google Scholar] [CrossRef] [PubMed]
- Norris, L.E.; Collene, A.L.; Asp, M.L.; Hsu, J.C.; Liu, L.F.; Richardson, J.R.; Li, D.; Bell, D.; Osei, K.; Jackson, R.D.; et al. Comparison of dietary conjugated linoleic acid with safflower oil on body composition in obese postmenopausal women with type 2 diabetes mellitus. Am. J. Clin. Nutr. 2009, 90, 468–476. [Google Scholar] [CrossRef] [Green Version]
- World Health Organization (WHO). Healthy Diet: Key Facts. 2018. Available online: https://www.who.int/news-room/fact-sheets/detail/healthy-diet (accessed on 28 December 2018).
- Naja, F.; Hwalla, N.; Itani, L.; Baalbaki, S.; Sibai, A.; Nasreddine, L. A novel Mediterranean diet index from Lebanon: Comparison with Europe. Eur. J. Nutr. 2015, 54, 1229–1243. [Google Scholar] [CrossRef]
- Willett, W. Nutritional Epidemiology, 2nd ed.; Oxford University Press: New York, NY, USA, 1998. [Google Scholar]
- Caan, B.J.; Lanza, E.; Schatzkin, A.; Coates, A.O.; Brewer, B.K.; Slattery, M.L.; Marshall, J.R.; Bloch, A. Does nutritionist review of a self-administered food frequency questionnaire improve data quality? Public Health Nutr. 1999, 2, 565–569. [Google Scholar] [CrossRef] [Green Version]
- Nasreddine, L.; Hwalla, N.; Sibai, A.; Hamze, M.; Parent-Massin, D. Food consumption patterns in an adult urban population in Beirut, Lebanon. Public Health Nutr. 2006, 9, 194–203. [Google Scholar] [CrossRef]
- Naja, F.; Nasreddine, L.; Itani, L.; Adra, N.; Sibai, A.M.; Hwalla, N. Association between dietary patterns and the risk of metabolic syndrome among Lebanese adults. Eur. J. Nutr. 2013, 52, 97–105. [Google Scholar] [CrossRef] [PubMed]
- Chamieh, M.C.; Moore, H.J.; Summerbell, C.; Tamim, H.; Sibai, A.M.; Hwalla, N. Diet, physical activity and socio-economic disparities of obesity in Lebanese adults: Findings from a national study. BMC Public Health 2015, 15, 279. [Google Scholar] [CrossRef] [PubMed]
- Okamoto, K.; Ohsuka, K.; Shiraishi, T.; Hukazawa, E.; Wakasugi, S.; Furuta, K. Comparability of epidemiological information between self- and interviewer-administered questionnaires. J. Clin. Epidemiol. 2002, 55, 505–511. [Google Scholar] [CrossRef]


| FTO (rs1558902) | TCF7L2 (rs7903146) | ||||||||
|---|---|---|---|---|---|---|---|---|---|
| Among All | TT | AT | AA | p | CC | CT | TT | p | |
| N = 308 | N = 85 | N = 165 | N = 58 | N = 134 | N = 130 | N = 43 | |||
| Characteristics and lifestyle factors | |||||||||
| Gender, Female | 193 (62.7) | 50 (58.8) | 103 (62.4) | 40 (69.0) | 0.47 | 86 (35.8) | 82 (63.1) | 25 (58.1) | 0.77 |
| Age (years) | 39.79 ± 14.00 | 38.46 ± 13.59 | 41.85 ± 14.23 | 35.89 ± 13.04 | 0.011 | 38.80 ± 13.66 | 40.61 ± 14.39 | 40.70 ± 14.02 | 0.53 |
| Crowding index | 1.55 ± 0.85 | 1.55 ± 0.89 | 1.56 ± 0.87 | 1.49 ± 0.74 | 0.86 | 1.54 ± 0.82 | 1.57 ± 0.83 | 1.52 ± 1.04 | 0.93 |
| Levels of physical activity | |||||||||
| Low | 137 (44.5) | 35 (41.2) | 72 (43.6) | 30 (51.7) | 0.71 | 51 (38.1) | 68 (52.3) | 18 (41.9) | 0.20 |
| Moderate | 99 (32.1) | 27 (31.8) | 55 (33.3) | 17 (29.3) | 50 (37.3) | 34 (26.2) | 14 (32.6) | ||
| High | 72 (23.4) | 23 (27.1) | 38 (23.0) | 11 (19.0) | 33 (24.6) | 28 (21.5) | 11 (25.6) | ||
| Physical activity | |||||||||
| None | 44 (14.3) | 14 (16.5) | 20 (12.1) | 10 (17.2) | 0.50 | 17 (12.7) | 18 (13.9) | 9 (20.9) | 0.40 |
| Any | 264 (85.7) | 71 (83.5) | 145 (87.9) | 48 (82.8) | 117 (87.3) | 112 (86.2) | 34 (79.1) | ||
| Cigarette smoker | |||||||||
| Never | 148 (48.1) | 43 (50.6) | 73 (44.2) | 32 (55.2) | 0.23 | 65 (48.5) | 59 (45.4) | 24 (55.8) | 0.71 |
| Current | 135 (43.8) | 32 (37.7) | 79 (47.9) | 24 (41.4) | 60 (44.8) | 58 (44.6) | 16 (37.2) | ||
| Past | 25 (8.1) | 10 (11.8) | 13 (7.9) | 2 (3.5) | 9 (6.7) | 13 (10.0) | 3 (7.0) | ||
| Narghileh smoker | |||||||||
| Never | 177 (57.5) | 43 (50.6) | 103 (62.4) | 31 (53.5) | 0.28 | 81 (60.5) | 75 (57.7) | 20 (46.5) | 0.62 |
| Current | 101 (32.8) | 32 (37.7) | 46 (27.9) | 23 (39.7) | 41 (30.6) | 42 (32.3) | 18 (41.9) | ||
| Past | 30 (9.7) | 10 (11.8) | 16 (9.7) | 4 (6.9) | 12 (9.0) | 13 (10.0) | 5 (11.6) | ||
| Alcohol drinker | |||||||||
| Never | 223 (72.4) | 60 (70.6) | 119 (72.1) | 44 (75.9) | 0.38 | 100 (74.6) | 99 (76.2) | 24 (55.8) | 0.08 |
| Current | 66 (21.4) | 20 (23.5) | 38 (23.0) | 8 (13.8) | 28 (20.9) | 22 (16.9) | 15 (34.8) | ||
| Past | 19 (6.2) | 5 (5.9) | 8 (4.9) | 6 (10.3) | 6 (4.5) | 9 (6.9) | 4 (9.3) | ||
| Body mass and composition | |||||||||
| Body mass index (BMI) (kg/m²) | 27.78 ± 5.62 | 28.49 ± 5.70 | 27.35 ± 5.44 | 27.96 ± 6.00 | 0.31 | 27.57 ± 5.65 | 27.79 ± 5.44 | 28.37 ± 6.20 | 0.72 |
| Body fat (kg) | 26.24 ± 11.42 | 27.48 ± 11.72 | 25.30 ± 11.09 | 27.12 ± 11.84 | 0.29 | 26.27 ± 11.73 | 26.15 ± 10.91 | 26.32 ± 12.30 | 0.99 |
| Muscle mass (kg) | 26.43 ± 6.37 | 27.41 ± 6.71 | 26.35 ± 6.19 | 25.21 ± 6.25 | 0.13 | 26.32 ± 6.14 | 26.17 ± 6.33 | 27.25 ± 7.09 | 0.62 |
| Energy and macronutrient intake | |||||||||
| Total energy (Kcal/day) | 3600.55 ± 2029.45 | 3737.20 ± 1973.73 | 3491.42 ± 2048.33 | 3710.71 ± 2072.60 | 0.60 | 3728.28 ± 2359.00 | 3467.58 ± 1782.08 | 3632.36 ± 1608.44 | 0.58 |
| Carbohydrates (g/day) | 441.61 ± 254.55 | 475.47 ± 271.82 | 427.01 ± 253.47 | 437.90 ± 230.63 | 0.41 | 468.61 ± 317.18 | 416.61 ± 195.45 | 435.43 ± 182.07 | 0.25 |
| Percent Kcal from carbohydrates (%) | 50.07 ± 8.54 | 51.24 ± 8.85 | 49.89 ± 7.79 | 48.85 ± 9.95 | 0.24 | 50.98 ± 8.62 | 49.27 ± 8.40 | 49.47 ± 8.63 | 0.24 |
| Proteins (g/day) | 116.26 ± 77.07 | 113.44 ± 61.23 | 113.44 ± 68.02 | 129.24 ± 113.76 | 0.36 | 115.59 ± 75.04 | 117.14 ± 84.40 | 116.65 ± 60.46 | 0.99 |
| Percent Kcal from proteins (%) | 12.95 ± 3.66 | 12.32 ± 2.72 | 13.15 ± 3.44 | 13.32 ± 5.13 | 0.16 | 12.61 ± 2.85 | 13.41 ± 4.58 | 12.70 ± 2.58 | 0.18 |
| Sugar (g/day) | 132.55 ± 117.60 | 146.90 ± 173.91 | 125.58 ± 91.12 | 131.37 ± 74.63 | 0.40 | 147.88 ± 156.56 | 120.28 ± 73.09 | 123.54 ± 75.09 | 0.14 |
| Percent Kcal from sugar (%) | 14.79 ± 6.47 | 14.82 ± 7.30 | 14.62 ± 5.88 | 15.22 ± 6.90 | 0.83 | 15.59 ± 7.08 | 14.37 ± 6.03 | 13.70 ± 5.65 | 0.15 |
| Total fat (g/day) | 150.12 ± 90.40 | 147.92 ± 76.68 | 147.09 ± 91.08 | 162.00 ± 106.31 | 0.54 | 151.61 ± 97.79 | 148.71 ± 86.89 | 151.30 ± 78.34 | 0.96 |
| Percent Kcal from total fat (%) | 39.00 ± 7.89 | 37.65 ± 7.52 | 39.30 ± 7.43 | 40.14 ± 9.43 | 0.14 | 38.39 ± 7.90 | 39.76 ± 7.61 | 38.75 ± 8.72 | 0.36 |
| Saturated fat (g/day) | 42.97 ± 29.24 | 42.62 ± 24.57 | 42.07 ± 30.95 | 46.04 ± 30.78 | 0.67 | 44.06 ± 33.05 | 42.34 ± 26.84 | 42.03 ± 23.65 | 0.87 |
| Percent Kcal from saturated fat (%) | 10.38 ± 2.76 | 10.17 ± 2.66 | 10.39 ± 2.80 | 10.65 ± 2.84 | 0.60 | 10.22 ± 2.65 | 10.65 ± 2.98 | 10.11 ± 2.40 | 0.34 |
| Monounsaturated fat (MUFA) (g/day) | 55.33 ± 34.48 | 54.70 ± 29.58 | 54.35 ± 34.55 | 59.04 ± 40.76 | 0.66 | 55.43 ± 35.99 | 54.73 ± 33.52 | 57.29 ± 33.46 | 0.92 |
| Percent kcal from MUFA (%) | 13.82 ± 4.03 | 13.37 ± 3.78 | 13.98 ± 4.06 | 14.02 ± 4.32 | 0.49 | 13.47 ± 3.85 | 14.07 ± 3.81 | 14.17 ± 5.14 | 0.40 |
| Polyunsaturated fat (PUFA) (g/day) | 39.36 ± 25.06 | 38.07 ± 20.26 | 38.55 ± 24.34 | 43.52 ± 32.42 | 0.37 | 39.42 ± 24.49 | 39.36 ± 25.64 | 39.55 ± 25.80 | 1.00 |
| Percent kcal from PUFA (%) | 10.00 ± 3.76 | 9.40 ± 3.17 | 10.13 ± 3.78 | 10.54 ± 4.41 | 0.17 | 9.84 ± 3.60 | 10.18 ± 3.64 | 10.00 ± 4.63 | 0.77 |
| Cholesterol (mg/day) | 382.03 ± 373.27 | 398.50 ± 460.86 | 358.75 ± 295.23 | 424.11 ± 427.62 | 0.46 | 388.62 ± 403.55 | 382.10 ± 365.80 | 352.42 ± 295.41 | 0.86 |
| No. of Subjects by Genotype (TT/AT/AA) | TT Mean (95% CI) (N = 85) | AT Mean (95% CI) (N = 165) | AA Mean (95% CI) (N = 58) | p-Trend 1 | p-Trend 2 | p-Trend 3 | p-Interaction 1 | p-Interaction 2 | p-Interaction 3 | |
|---|---|---|---|---|---|---|---|---|---|---|
| Among ALL | 85/165/58 | 28.49 (27.26–29.72) | 27.35 (26.52–28.19) | 27.96 (26.38–29.54) | 0.58 | 0.68 | 0.53 | - | - | - |
| Carbohydrates (% of energy) | ||||||||||
| Tertile 1 (<47.317) | 25/53/26 | 29.05 (26.88–31.22) | 27.63 (26.24–29.02) | 28.49 (25.93–31.04) | 0.71 | 0.43 | 0.44 | 0.58 | 0.76 | 0.73 |
| Tertile 2 (47.317–53.984) | 29/64/15 | 27.33 (25.30–29.35) | 27.03 (25.63–28.43) | 27.25 (24.04–30.45) | 0.96 | 0.70 | 0.76 | |||
| Tertile 3 (>53.984) | 31/48/17 | 29.12 (26.78–31.45) | 27.47 (25.81–29.13) | 27.78 (24.71–30.84) | 0.46 | 0.59 | 0.43 | |||
| Fat (% of energy) | ||||||||||
| Tertile 1 (<35.131) | 31/45/16 | 28.74 (26.31–31.17) | 26.92 (25.13–28.71) | 29.27 (25.79–32.76) | 0.79 | 0.72 | 0.94 | 0.86 | 0.98 | 0.81 |
| Tertile 2 (35.131–41.333) | 27/67/17 | 27.59 (25.60–29.57) | 28.08 (26.78–29.38) | 24.87 (23.07–26.67) | 0.08 | 0.24 | 0.21 | |||
| Tertile 3 (>41.333) | 27/53/25 | 29.09 (26.99–31.18) | 26.80 (25.39–28.21) | 29.21 (26.57–31.86) | 0.93 | 0.98 | 0.98 | |||
| Protein (% of energy) | ||||||||||
| Tertile 1 (<11.700) | 39/57/25 | 29.34 (27.93–30.75) | 27.10 (25.82–28.39) | 27.12 (24.53–29.70) | 0.09 | 0.10 | 0.06 | 0.55 | 0.44 | 0.41 |
| Tertile 2 (11.700–13.985) | 27/54/15 | 26.10 (23.98–28.29) | 26.78 (25.26–28.29) | 29.21 (26.19–32.23) | 0.08 | 0.06 | 0.06 | |||
| Tertile 3 (>13.985) | 19/54/18 | 30.13 (26.47–33.78) | 28.19 (26.59–29.80) | 28.08 (24.99–31.17) | 0.33 | 0.22 | 0.16 | |||
| Saturated fat (% of energy) | ||||||||||
| Tertile 1 (<8.595) | 26/42/17 | 28.11 (26.31–29.92) | 27.73 (25.80–29.65) | 28.65 (25.13–32.17) | 0.77 | 0.47 | 0.52 | 0.35 | 0.29 | 0.33 |
| Tertile 2 (8.595–11.034) | 28/65/11 | 28.18 (25.70–30.65) | 27.36 (25.95–28.78) | 28.46 (24.10–32.82) | 0.90 | 0.98 | 0.83 | |||
| Tertile 3 (>11.034) | 31/58/30 | 29.07 (26.84–31.31) | 27.07 (25.87–28.27) | 27.38 (25.34–29.42) | 0.21 | 0.20 | 0.19 | |||
| MUFA (% of energy) | ||||||||||
| Tertile 1 (<11.890) | 29/44/19 | 29.12 (26.60–31.65) | 26.54 (25.02–28.07) | 29.05 (26.16–31.94) | 0.97 | 0.72 | 0.89 | 0.89 | 0.95 | 0.92 |
| Tertile 2 (11.890–14.571) | 27/65/18 | 27.87 (25.82–29.92) | 28.05 (26.72–29.37) | 26.36 (23.40–29.33) | 0.36 | 0.54 | 0.63 | |||
| Tertile 3 (>14.571) | 29/56/21 | 28.42 (26.42–30.42) | 27.18 (25.62–28.75) | 28.33 (25.59–31.08) | 0.96 | 0.83 | 0.73 | |||
| PUFA (% of energy) | ||||||||||
| Tertile 1 (<8.426) | 36/51/21 | 28.81 (26.59–31.04) | 27.32 (25.46–29.19) | 27.62 (24.71–30.53) | 0.51 | 0.84 | 0.66 | 0.34 | 0.49 | 0.41 |
| Tertile 2 (8.426–10.930) | 26/66/16 | 28.45 (26.25–30.66) | 27.16 (26.01–28.01) | 27.30 (24.88–29.72) | 0.46 | 0.30 | 0.13 | |||
| Tertile 3 (>10.930) | 23/48/21 | 28.01 (26.03–29.98) | 27.64 (26.16–29.12) | 28.80 (25.73–31.86) | 0.63 | 0.64 | 0.66 | |||
| No. of Subjects by Genotype (CC/CT/TT) | CC Mean (95% CI) (N = 134) | CT Mean (95% CI) (N = 130) | TT Mean (95% CI) (N = 43) | p-Trend 1 | p-Trend 2 | p-Trend 3 | p-Interaction 1 | p-Interaction 2 | p-Interaction 3 | |
|---|---|---|---|---|---|---|---|---|---|---|
| Among ALL | 134/130/43 | 27.57 (26.61–28.54) | 27.79 (26.84–28.73) | 28.37 (26.46–30.28) | 0.42 | 0.47 | 0.48 | - | - | - |
| Carbohydrates (% of energy) | ||||||||||
| Tertile 1 (<47.317) | 43/46/15 | 28.96 (27.29–30.63) | 27.95 (26.44–29.46) | 26.69 (23.18–30.20) | 0.17 | 0.20 | 0.20 | 0.10 | 0.11 | 0.17 |
| Tertile 2 (47.317–53.984) | 44/49/15 | 26.07 (24.24–27.89) | 27.62 (26.13–29.10) | 28.74 (26.11–31.38) | 0.11 | 0.15 | 0.12 | |||
| Tertile 3 (>53.984) | 47/35/13 | 27.71 (26.16–29.27) | 27.82 (25.64–30.00) | 29.87 (25.39–34.36) | 0.25 | 0.30 | 0.33 | |||
| Fat (% of energy) | ||||||||||
| Tertile 1 (<35.131) | 47/28/16 | 27.69 (25.80–29.58) | 28.58 (25.80–31.35) | 27.53 (25.10–29.96) | 0.93 | 0.87 | 0.87 | 0.24 | 0.35 | 0.33 |
| Tertile 2 (35.131–41.333) | 46/51/14 | 26.10 (24.85–27.35) | 27.72 (26.45–29.00) | 31.03 (26.64–35.42) | 0.001 | 0.003 | 0.002 | |||
| Tertile 3 (>41.333) | 41/51/13 | 29.09 (27.26–30.93) | 27.42 (25.94–28.90) | 26.53 (23.06–30.01) | 0.15 | 0.21 | 0.19 | |||
| Protein (% of energy) | ||||||||||
| Tertile 1 (<11.700) | 53/50/18 | 28.01 (26.53–29.49) | 27.64 (26.26–29.02) | 27.81 (25.26–30.35) | 0.88 | 0.92 | 0.86 | 0.54 | 0.61 | 0.56 |
| Tertile 2 (11.700–13.985) | 45/36/14 | 26.54 (24.87–28.21) | 26.76 (25.17–28.36) | 28.70 (24.48–32.93) | 0.21 | 0.31 | 0.30 | |||
| Tertile 3 (>13.985) | 36/44/11 | 28.21 (26.14–30.28) | 28.80 (26.83–30.77) | 28.86 (24.30–33.43) | 0.77 | 0.66 | 0.63 | |||
| Saturated fat (% of energy) | ||||||||||
| Tertile 1 (<8.595) | 40/33/11 | 27.36 (25.63–29.09) | 27.87 (25.90–29.85) | 30.86 (25.74–35.99) | 0.08 | 0.08 | 0.09 | 0.020 | 0.015 | 0.016 |
| Tertile 2 (8.595–11.034) | 47/42/15 | 26.62 (24.92–28.32) | 28.64 (26.76–30.51) | 28.44 (25.16–31.73) | 0.30 | 0.17 | 0.16 | |||
| Tertile 3 (>11.034) | 47/55/17 | 28.71 (27.05–30.36) | 27.09 (25.77–28.41) | 26.69 (24.05–29.33) | 0.18 | 0.16 | 0.16 | |||
| MUFA (% of energy) | ||||||||||
| Tertile 1 (<11.890) | 43/37/12 | 27.70 (26.04–29.37) | 28.17 (25.93–30.40) | 27.58 (24.50–30.66) | 0.95 | 0.99 | 0.91 | 0.82 | 0.94 | 0.99 |
| Tertile 2 (11.890–14.571) | 54/39/16 | 27.26 (25.64–28.88) | 27.53 (26.13–28.93) | 29.72 (26.56–32.89) | 0.11 | 0.22 | 0.12 | |||
| Tertile 3 (>14.571) | 37/54/15 | 27.88 (25.98–29.77) | 27.72 (26.27–29.16) | 27.55 (23.42–31.69) | 0.85 | 0.95 | 0.99 | |||
| PUFA (% of energy) | ||||||||||
| Tertile 1 (<8.426) | 49/41/18 | 27.84 (25.94–29.74) | 28.10 (26.08–30.11) | 27.49 (23.97–31.00) | 0.85 | 0.89 | 0.82 | 0.79 | 0.68 | 0.72 |
| Tertile 2 (8.426–10.930) | 49/43/15 | 26.38 (25.12–27.64) | 28.06 (26.46–29.66) | 29.42 (26.74–32.11) | 0.033 | 0.037 | 0.034 | |||
| Tertile 3 (>10.930) | 36/46/10 | 28.83 (26.93–30.74) | 27.26 (25.83–28.69) | 28.37 (23.58–33.17) | 0.81 | 0.69 | 0.69 |
© 2019 by the authors. Licensee MDPI, Basel, Switzerland. This article is an open access article distributed under the terms and conditions of the Creative Commons Attribution (CC BY) license (http://creativecommons.org/licenses/by/4.0/).
Share and Cite
Nasreddine, L.; Akika, R.; Mailhac, A.; Tamim, H.; Zgheib, N.K. The Interaction between Genetic Polymorphisms in FTO and TCF7L2 Genes and Dietary Intake with Regard to Body Mass and Composition: An Exploratory Study. J. Pers. Med. 2019, 9, 11. https://doi.org/10.3390/jpm9010011
Nasreddine L, Akika R, Mailhac A, Tamim H, Zgheib NK. The Interaction between Genetic Polymorphisms in FTO and TCF7L2 Genes and Dietary Intake with Regard to Body Mass and Composition: An Exploratory Study. Journal of Personalized Medicine. 2019; 9(1):11. https://doi.org/10.3390/jpm9010011
Chicago/Turabian StyleNasreddine, Lara, Reem Akika, Aurelie Mailhac, Hani Tamim, and Nathalie Khoueiry Zgheib. 2019. "The Interaction between Genetic Polymorphisms in FTO and TCF7L2 Genes and Dietary Intake with Regard to Body Mass and Composition: An Exploratory Study" Journal of Personalized Medicine 9, no. 1: 11. https://doi.org/10.3390/jpm9010011