An Unsupervised Vibration Noise Reduction Approach and Its Application in Lubrication Condition Monitoring


1
Graduate School of Mechanical and Energy Engineering, Kun Shan University, Tainan 71070, Taiwan
2
Department of Mechanical Engineering, Kun Shan University, Tainan 71070, Taiwan
*
Author to whom correspondence should be addressed.
Lubricants 2023, 11(2), 90; https://doi.org/10.3390/lubricants11020090
Submission received: 18 December 2022
/
Revised: 13 February 2023
/
Accepted: 16 February 2023
/
Published: 19 February 2023
(This article belongs to the Special Issue Tribology in Manufacturing and Design)
Abstract
:Accelerometers are sensitive devices that capture vibrational fault signatures from industrial machines. However, noise often contaminates these fault signatures and must be eliminated before analysis. A data-driven (DD) denoising algorithm capable of filtering useful vibrational fault signatures from background noises was derived in this study. The algorithm was first validated by comparing its denoised result with a numerically generated ideal signal with a known exact solution. The DD denoising approach reduced the Mean Squared Error (MSE) from 0.459, when no denoising was performed, to 0.068, indicating an 85.2% decrease in noise. This novel approach outperformed the Discrete Wavelet (DW) denoising approach, which had an MSE of 0.115. The proposed DD denoising algorithm was also applied to preprocess vibration data used for the real-time lubrication condition monitoring of the plastic injection molding machine’s toggle clamping system, thereby reducing false positive relubrication alarms. The false positive rates, when analysis was performed on the raw vibration and the DW denoised vibration, were 10.7% and 7.6%, respectively, whereas the DD denoised vibration yielded the lowest false positive rate at 1%. This low false positive rate of the DD denoised vibration indicates that it is a more reliable condition monitoring system, thereby making this technique suitable for the smart manufacturing industry.
1. Introduction
Production machines are subject to wear and therefore require timely maintenance. This goes to say that a machine and its components have a specific operational life, after which its performance becomes unstable and eventually fails. In the manufacturing industry, machine maintenance plays a key role in retaining high product quality and reliability [1]. Hence, there exists a constant need for operators to perform comprehensive equipment maintenance in order to ensure high product quality and avoid machine downtimes in critical phases of production [2]. The earliest reported form of machine maintenance was termed, “breakdown maintenance” (BM) [3]. As suggested by its name, maintenance would not be performed until there is machine failure. This approach always resulted in unplanned downtime and catastrophic failures which greatly affected the efficiency and reliability of manufactured products. To overcome the challenges posed by BM, the industry later relied on a “planned maintenance” (PM) approach. This approach entails a meticulous logging procedure where maintenance and inspection are performed at periodic intervals regardless of the machine’s condition [4]. The logged data are then used to estimate the next optimal maintenance point. Although there are some merits to this approach, it is undoubtedly labor intensive, often leading to over maintenance and a waste of resources, since components tend to be replaced long before their actual failure point [5]. Using this approach, spontaneous breakdown is difficult to predict. As technology continues to rapidly evolve, the demand for products of higher complexity and reliability commensurately increases. Manufacturers are pressured to implement strict quality control measures to meet this growing demand. Planned maintenance costs are therefore driven up by this increase in quality control measures, which inevitably increases production costs.
Bloch, H.P, et al. [6] reported that 99% of mechanical failures are preceded by distinctive failure signatures. It is therefore possible to use sensors to perform the real-time condition monitoring of machines, triggering maintenance only when the distinctive failure signatures are manifested. A maintenance regime of this nature is very attractive to manufacturers as equipment use is maximized, thereby preventing machine downtime while maintaining a high production quality. Today, a plethora of low-cost, industrial-grade sensors are available for integration into robust condition monitoring systems. Some of the more commonly used condition monitoring approaches include vibration, acoustic, shock pulse, and thermal analysis [7]. This study thus focuses on the use of vibration-based condition monitoring for industrial machines.
Vibration analysis is an in situ, nondestructive sensing technique capable of highlighting faults in mechanical systems [8]. The origins of this technique date to the late 1970s and early 1980s, where it was utilized for platform damage detection in the offshore oil industry [9]. Since then, vibration analysis has matured into a powerful tool for condition monitoring across all fields of engineering, making it the most widely used technique in the field of condition-based maintenance [10,11]. Its popularity is attributed to the fundamental principle that all mechanical systems generate a unique vibrational signature when interacting with the environment. These vibrations are directly linked to mechanical disturbances caused by rotating and reciprocating components such as bearings, engines, gear boxes, shafts, turbines, and motors [12,13]. As the condition of these mechanical components deteriorate, their vibrational behavior is also altered due to changing oscillating frequencies. These vibrational changes may be manifested in the time, frequency, or modal domain in the form of periodic shocks known as transients [14]. Transients are characterized as a short duration pulse that covers a wide frequency range [15,16,17,18]. Unfortunately, due to the high sensitivity of vibration sensors, these fault-induced transient vibrations are often masked as they are superimposed with background noise [19]. This phenomenon is known as noise contamination. Background noise is generated due to the influence of electromagnetic interference and sporadic environmental noises [20]. The inability to clearly identify and extract the transients from the vibration signal makes vibration-based condition monitoring a daunting task. Separating these dominant fault-induced transients from the mixed signal has proven to be a major challenge. For this reason, signal denoising has become an important task in the field of sensor processing.
Researchers have shown that there are three classes of signal denoising, namely, time domain, frequency domain and time–frequency domain [21]. Time domain denoising is typically applied by averaging periodic sections of the acquired vibration signal [22]. This technique is therefore best suited for the denoising of periodic signals. Time domain denoising also assumes prior knowledge of the periodicity of the signal. Synchronous averaging has been shown to be one of the most effective time–domain denoising techniques [22]. McFadden et al. [23] successfully applied this technique to denoise and detect early failure in rolling element bearings. The second class of vibration denoising is performed in the frequency domain. This type of denoising requires that the raw vibrational signal first be converted to its frequency domain representation using the well-established Fast Fourier Transform (FFT). Once in the frequency domain, frequency pass filters can be applied to suppress noise related frequencies while keeping frequencies directly related to useful machine vibration. There are three commonly applied frequency pass filters for noise reduction. These include low-pass, high-pass, and band-pass filters. A low-pass filter only retains frequencies below a specified threshold and suppresses frequencies above this specified threshold. The exact opposite is true for the high-pass filter, as this retains frequencies above the specified threshold while suppressing the lower frequencies. High-pass filters have been successfully applied in the condition monitoring of bearings [24]. Unlike both the high-pass and low-pass filters, the band pass filter allows frequencies within a specified range or band to pass while suppressing all frequencies both above and below this range. All three frequency pass filters generally perform well when the frequency bands containing the mechanical failure are known. However, they perform subpar when filtering signals containing heavy transient activity, as transients characteristically span a wide frequency range. Both time and frequency domain denoising approaches generally result in the loss of information relating to transient activity as they cannot simultaneously consider time and frequency information [21]. Overcoming this limitation gave rise to time–frequency denoising. As suggested by its name, time–frequency denoising considers both its temporal and frequency components. The wavelet transform (WT) algorithm is commonly used to perform time–frequency denoising. This algorithm localizes transients in the signal to different scales containing varying magnitudes of wavelet coefficients. Coefficients of larger magnitudes typically contain important information relating to machine failure, while coefficients of smaller magnitudes may be deemed as noise. The noise-containing coefficients can then be suppressed, leaving behind only coefficients related to machine failure. In recent years, WT has become a popular topic as researchers have reported notable success when using this technique to detect fault-induced transients embedded in vibration data [25,26,27]. Although the wavelet transform algorithm performs well when decomposing a signal into coefficients of varying magnitude, the selection of the optimal threshold value that avoids the suppression of useful signal components while eliminating substantial amounts of background noise remains a challenge. To address this problem, He et al. [21] proposed a time–frequency manifold (TFM) approach. The study showed that the TFM signature reflects the intrinsic time–frequency signature of nonstationary signals, thereby making it suitable for vibration denoising. Although this approach has its merits, it is mathematically intensive and not easily computed as the algorithms are not available for open-source use.
The objective of this study is therefore to develop a robust vibration denoising algorithm and apply it in the lubrication condition monitoring of a plastic injection molding machine’s toggle clamping system. The derived algorithm is easily computed using available packages in either MATLAB or Python. To perform this task, the singular value decomposition (SVD) algorithm was used as a tool to separate transient-related and noise-related wavelet coefficients of a given time series signal. For further noise reduction, Sigmoid Soft Thresholding was performed in this study. The proposed model was first evaluated on simulated data and later compared with the results obtained using the traditional Discrete Wavelet (DW) denoising method [28]. The denoising performance was measured by calculating the denoised signal’s Mean Squared Error (MSE) compared to an ideal signal of exact solution. The proposed model was also applied to denoise the vibration data collected from the toggle clamping system of a plastic injection molding machine as its lubrication condition deteriorated over time. The condition monitoring performance of the DD denoised vibration was compared to the results when both raw vibration and DW denoised vibration were used to perform the same condition monitoring task.
2. Mathematical Models
To fully understand the intricacies of signal denoising, it is imperative to first understand the characteristics of noise as it relates to vibration. Signals from vibration sensors are prone to noise corruption as they are frequently exposed to electromagnetic disturbances from the environment [29]. Additional noise may also originate from neighboring rotating or reciprocating equipment. A signal corrupted with noise can be expressed as shown in Equation (1) [20]:
where x(t) is the corrupted signal, s(t) is the useful signal, and n(t) is the added noise. Since it is impossible to completely remove noise, the goal of denoising algorithms is to separate as much of the useful signal from the added noise. The denoising performance of the traditional Discrete Wavelet (DW) transform algorithm and the newly proposed data-driven (DD) denoising algorithm are evaluated in this paper.
2.1. Traditional DW Denoising
The DW transform performs a recursive decomposition of the lower frequency bands obtained from the previous decomposition [28]. This decomposition gives rise to a hierarchical set of approximate and detail coefficients as shown in Figure 1.
The DW decomposition can be mathematically expressed as a linear combination of mother and father () wavelet basis functions, as shown in Equation (2) [28].
where , and to are the wavelet coefficients. is a small natural number which depends on the number of sample points in the signal () and the mother and father wavelet basis functions ( respectively), and ranges from 1 to the number of coefficients in the specified component.
In this study, we implemented the traditional DW denoising algorithm presented by Yi et al. [28]. This approach decomposes the noisy signal into several levels of approximate and detailed coefficients using the Daubechies 4 mother wavelet. Each of the levels are then soft threshold using the Stein’s Unbiased Risk Estimate (SURE) [30] paired with the sigmoid function. All coefficient levels except the last detailed coefficient are reconstructed with the Inverse Discrete Wavelet Transform (IDWT), resulting in a denoised signal.
2.2. Data-Driven Denoising Model
This study proposes a model for the denoising of vibration signals, as shown by the flowchart in Figure 2. The model was built around the widely accepted observation that there are two classes of noise that often corrupt vibrational signals [31,32]. The first class of noise corruption is that of white noise. This class of noise is described as having zero mean, constant variance, and is uncorrelated in time. It is also known for having a power spectrum that spreads uniformly across all allowable frequencies. This class of noise is often observed in data acquired from factories due to the presence of numerous machines operating simultaneously. The second class of noise commonly encountered in noisy signals is called pulse noise. Pulse noise is characteristically large in amplitude and has a short duration. Our two-part denoising model first eliminates white noise by first transforming the noisy vibration signal into its time–frequency domain representation using the continuous wavelet transform (CWT). This transformation results in a high-dimensional matrix of wavelet coefficients that is further decomposed into a series of low-ranking matrix approximations using the singular value decomposition (SVD). This study shows that the information related to the signal’s transient behavior is contained in the rank-1 matrix approximation while the remaining rank-r matrix approximations are riddled with white noise. The rank-1 matrix approximation is therefore reconstructed into its time–domain representation using the inverse continuous wavelet transform (ICWT). In the second stage of the proposed denoising algorithm, the remaining pulse noise is removed using a Sigmoid Soft Thresholding approach. An in-depth discussion of the underlying mathematical framework is provided in the upcoming sections.
2.2.1. Continuous Wavelet Transform (CWT)
The CWT is a technique that decomposes a signal into its frequency distribution throughout time. This technique rose to popularity in the late 1980s as it was shown to perform better time frequency localization than the popular Short-Term Fourier Transform (STFT) [33]. Unlike the STFT, CWT did not suffer from the time bandwidth resolution limitation. Over the years, this technique has shown great success in analyzing nonstationary and transient signals [34]. The term nonstationary refers to a signal whose frequency components changes over time while transients are described as a sudden change from the signal’s steady state. Transient signals typically provide valuable information about a machine’s condition [35]. For this reason, our denoising model first utilizes the CWT to transform the noisy time series into its time–frequency representation, thereby localizing transient-related coefficients. This transformation is depicted in Figure 3.
To perform this transformation, the “cwt” tool available in MATLAB was used. The CWT’s coefficients () are mathematically computed using the inner products of the input signal and a mother wavelet function () at different scales, , and time positions, . The mathematical expression for this transformation is shown in Equation (3) [36].
where > 0 and * denotes the complex conjugate.
In this study, a Complex Morlet Wavelet function (“cmor”) was used as the mother wavelet function (). This function is defined by Equation (4) [37].
where is a bandwidth parameter and is a wavelet center frequency.
The matrix of wavelet coefficients () can be used to recover the time series signal by performing the ICWT. In MATLAB, this computation is executed using the command “icwt”. This transformation is mathematically computed using Equation (5) [38].
where is the reconstructed time series data.
2.2.2. Singular Value Decomposition (SVD)
Singular value decomposition (SVD) is one of the most important matrix factorizations of the computational era [39]. The SVD provides a strategic approach to determine low-dimensional approximations of high-dimensional data in terms of its dominant correlation patterns. It performs this task by tailoring a new coordinate system capable of highlighting axes of greatest variance. This technique is data driven, meaning that the patterns are discoverable purely from data [40]. Therefore, data-driven pattern discovery requires no prior knowledge or intuition of the data being analyzed. Unlike the eigen-decomposition, the SVD is also guaranteed to exist for any matrix, making it a useful tool for data analytics and machine learning. The SVD is computed by first obtaining a high-dimensional data set. In this study, the time–frequency matrix of wavelet coefficients (), as computed using Equation (3), served as our high-dimensional data. This matrix can be alternatively expressed, as shown in Equation (6) [36].
The rows of matrix are frequency scales to while the columns are time windows to that span the duration of the signal. The “svd” function in MATLAB is thereafter used to express matrix as the product of two singular vectors and , as well as an orthogonal column of singular values . This relationship is shown in Equation (7) [39].
where * denotes the complex conjugate transpose.
In the case of matrix , where > , the matrix has at most non-zero elements on the diagonal and can hence be written as . It is therefore possible to exactly represent using the economy SVD as shown in Equation (8) [39].
where are the first n columns of and first n-by-n block of .
The SVD algorithm provides a hierarchy of low-rank matrix approximation. A rank-r approximation is obtained by keeping the leading r singular values and vectors and discarding the rest. can therefore be represented as the sum of the rank-r matrix approximations, as shown in Equation (9) [39].
This study shows that it is possible to denoise a signal by reconstructing its rank-1 matrix approximation using the ICWT. This rank-1 matrix proved to contain mainly transient-related information, and the higher-ranking matrix approximations were noise polluted and therefore discarded.
2.2.3. Sigmoid Thresholding
The final stage of the data-driven denoising algorithm includes a soft threshold on the reconstructed time series data . This was performed to eliminate residual noise that was not eliminated by the SVD algorithm. A sigmoid function was used to perform soft thresholding by deriving a scalar multiplier of values between zero and one, as shown in Equation (10) [28]. If the values in the array were above a specified threshold, it was squeezed towards 1; however, if the values were below the threshold, it was squeezed towards 0. The threshold was established using Stein’s Unbiased Risk Estimate (SURE) [30]. This framework has been widely applied to determine the optimal amount of shrinkage performed during soft thresholding. A detailed discussion of this algorithm was provided by Donoho, D.L., et al. [41].
The final denoised signal xdenoised was computed by multiplying the scalar multiplier with the reconstructed rank-1 signal as shown in Equation (11) [28].
2.3. Model Validation
To evaluate the performance of the proposed denoising algorithm, a signal with four periodic transient impulses was generated as shown in Figure 4a. From the graph, it is evident that the transient activities are located at times 0.02 s, 0.04 s, 0.06 s, and 0.08 s, respectively. This form of transient activity is representative of the vibrational behavior of faulty rotating machinery in an ideal zero-noise environment. This signal was simulated using a free damped vibration model, as expressed in Equation (12) [21]. The input parameters used for this model are provided in Table 1.
In reality, it is not possible to obtain a zero-noise signal. A more realistic representation of the vibration signal collected from a faulty rotating machine is shown in Figure 4b. To obtain this signal, –5 db of white noise was added to the clean signal. Figure 4a,b clearly highlights the importance of denoising prior to performing statistical analysis. It can be observed in Figure 4b that most of the fault-induced vibrational transients become vaguely visible in the presence of noise. It is therefore difficult to extract robust condition monitoring features from such a noisy signal. The proposed denoising algorithm therefore seeks to recover the signal shown in Figure 4a from the obtained signal in Figure 4b, assuming no prior knowledge of the embedded transient activity.
The first step in the proposed denoising algorithm was to convert the noisy time series vibration shown in Figure 4b to its time-frequency representation. This transformation was performed using the CWT as shown in Figure 5a. From the 3D surface plot, it is evident that there are transient activities at 0.04 s and 0.06 s; moreover, the transients at 0.02 s and 0.08 s are less profound because they are buried in noise. All four transients cover a wide frequency range of 600 Hz to 2000 Hz. To eliminate substantial amounts of the background noise, a singular value decomposition was performed on the CWT matrix (Figure 5a). The SVD algorithm interprets the rows of a matrix as features and the columns as observations. In the case of the CWT matrix, the frequency bands are therefore features, and time steps are observations. From a statistical point of view, the SVD algorithm can identify and rank the variance of the frequency bands as they evolve over time. The SVD therefore provides a hierarchy of low-rank approximations. A rank-r approximation is obtained by keeping the leading r singular values and vectors while discarding the rest. Since noise is described as having constant variance and zero mean over time, the frequency bands containing purely noise-related coefficients will have smaller singular values than frequency bands containing dynamic information related to transient activities. By only keeping the rank-1 matrix approximation and discarding the remaining smaller noise riddled approximations, it is possible to obtain a denoised representation of the time–frequency plot, as shown in Figure 5b. This denoised representation clearly highlights the four transient activities in the signal. From the Singular Value plot in Figure 6a, it can be observed that most of the information present in the signal is contained in the first few singular values. Additionally, it can be observed that the rank-1 matrix approximation only captures 17.8% of the total energy in the data while still retaining all the information relating to transient activities, as shown in the cumulative energy plot in Figure 6b. This demonstrates the difficulty in developing robust condition monitoring systems when analyzing noisy vibrational data, since noise accounts for most of the information present in the signal.
The rank-1 matrix approximation can now be reconstructed to its time domain representation using the ICWT and soft threshold using the Sigmoid thresholding algorithm. Figure 7a,b shows the results of the proposed DD denoising algorithm and the traditional DW denoising, respectively. Although the results of the DW denoising (Figure 7b) produced a certain level of denoising, this approach faintly captures the transient activity of the original signal. However, it fails to retain the natural periodic characteristics that were present in the original clean signal (Figure 4a). The DW denoising failed to capture the natural periodic characteristics because it eliminated noise based on frequency magnitude. Moreover, it decomposed the noise-contaminated signal into different frequency bands but, in doing so, removed some spatiotemporal behavior relating to the periodicity of the signal. This limitation of the of the DW denoising algorithm was also reported by He et al. [21]. On the contrary, the DD denoising model proposed in this study does not only capture the natural transient behavior of the original signal but also maintains its periodicity, as shown in Figure 7a. Such denoising performance was achieved because the SVD is a tool capable of extracting both CWT coefficients of high magnitude and variance and their corresponding spatiotemporal behavior, which contains information relating to the signal’s periodicity. It is therefore evident that the denoising performed using the DD approach outperformed the DW denoising method. The clean impulsive signals retained after performing the DD denoising is useful for machine fault diagnosis and monitoring.
The performance of the proposed DD denoising algorithm is statistically evaluated by using the exact ideal signal (Figure 4a) as a reference of an exact solution. Both denoising approaches are then compared with the exact solution by computing their Mean Squared Error (MSE). MSE is a popular statistical tool in signal processing that is used to compare the similarity of two signals [42]. The closer the MSE value is to zero, the more similar the two signals are. MSE is mathematically expressed as shown in Equation (13) [42].
where N is the number of the signal data points acquired, is the time series of the exact ideal signal, and is the time series of the denoised signal. As shown in Figure 8, the noisy signal with −5 db white noise had an MSE of 0.459. After denoising with the traditional DW denoising algorithm and the proposed DD denoising algorithm, the MSE score decreased to 0.115 and 0.068, respectively. Since the DD denoising algorithm yielded the lowest MSE when compared to the exact solution, this suggests that the DD denoising algorithm was the best approach to recover useful transient activity from a noise-contaminated signal and hence is the most similar to the exact solution. The results further show that the traditional DW denoising was able to decrease the error by 74.9% while our proposed denoising algorithm decreased the error by 85.2%. It is therefore evident that the proposed DD approach outperforms the traditional DW denoising by obtaining half the error of the DW denoising algorithm.
3. Application of DD Denoising in Lubrication Condition Monitoring of a Plastic Injection Molding Machine’s Toggle Clamping System
The plastic industry is one of the world’s fastest growing industries [43]. It has grown to be one of the few multibillion-dollar industries in the world. Many of the plastic parts used in everyday life are produced via plastic injection molding. This widespread popularity is directly attributed to the fact that plastic injection molding is flexible enough to produce parts of varying shapes and geometric complexity at high production volumes and at a relatively low cost [44].
Plastic injection molding is a five-stage process [43]. These stages include melting, filling, packing, cooling, and ejection. In the melting stage, plastic resin falls onto the rotating screw from the hopper. It is then conveyed through the barrel via the flights of the screw [45,46]. Inside the barrel, the plastic resin is gradually melted as it is pushed towards the nozzle [47]. When sufficient molten plastic material accumulates at the nozzle, the injection molding machine commences its filling stage. In the filling stage, the screw stops rotating and acts similar to a plunger, pushing the molten plastic through the nozzle and out of the barrel, into a shaping mold. Once the mold is filled, the machine enters the packing stage of production, which compresses additional plastic material into the mold, resulting in a fully molded part. The molded part is finally allowed to cool and solidify and is thereafter ejected from the shaping mold.
Injection molding is a cyclic process, suggesting that all five stages are sequentially repeated when manufacturing parts [43]. The clamping system of an injection molding machine is therefore an integral component as it is responsible for clamping the shaping mold at the start of the cycle and unclamping the shaping mold for part ejection at the end of the cycle. Most injection molding machines either utilize a ram or toggle-type clamping unit [48]. Ram clamping units are generally utilized for high-precision injection molding while toggle clamping units are used for high-speed injection molding. In industry, toggle clamping units are more often preferred over ram clamping units as they are generally more energy efficient. For this reason, the present research focuses on the toggle clamping system.
In an actual industrial setting, the toggle clamping system undergoes repeated clamping and unclamping cycles. To prevent failure, lubricant must be constantly pumped into the journal of this clamping system. The presence of lubricant in the journal limits metal-to-metal contact, thereby reducing friction, wear, and catastrophic damage to the clamping system [49]. The lubricant added to the system, however, gradually deteriorates as the cycle number increases. Lubricant must therefore be constantly replenished in a timely manner. Premature replenishment of the lubricant results in lubricant waste which subsequently reduces profits and impacts the environment negatively as more lubricant must be disposed. On the contrary, late replenishment of the lubricant results in damage to the toggle clamping system. To mitigate this problem, vibration analysis was used to perform a real-time condition monitoring of the toggle clamping system [50]. It was shown that it is possible to derive a vibration-based Shock Response Health Indicator that reflects the real-time lubrication condition of the toggle clamping system. The Shock Response Algorithm was used to derive a Health Indicator directly from the vibration signal collected from the toggle clamping system. Raw vibration signals acquired from the toggle bearing are unfortunately susceptible to background noise corruption. The presence of background noises suppresses useful fault-related vibrational signatures, thereby decreasing the reliability of a condition monitoring system. To overcome this challenge, the proper denoising of raw vibrational signals is essential. This study seeks to improve the reliability of the Shock Response Health Indicator by applying the previously discussed DD denoising algorithm to the preprocessing of the raw vibration signals obtained from the toggle clamping system. The reliability of the Health Indicator obtained under the following three circumstances were compared: (a) no denoising algorithm is performed, (b) denoising is performed with the traditional DW denoising algorithm, and (c) denoising is performed using our proposed DD denoising algorithm.
3.1. Materials and Methods
3.1.1. Injection Molding Machine
The experiments described in this study were conducted on the CLF-60TX injection molding machine as shown in Figure 9. This machine was a hydraulically controlled, toggle-type injection molding machine manufactured by Chuan Lih Fa Machinery Works Co., Ltd., with headquarters located in Tainan, Taiwan. It has a maximum clamping force rating of 600 kN. The machine had a 22 kW servo system allowing for a maximum shot rate of 115 cm3/s. It has a maximum system pressure of 170 bar and a maximum injection pressure of 2951 kg/cm2. The PLC control system is manufactured by MIRLE Automation Corporation (Hsinchu, Taiwan).
3.1.2. Data Acquisition System
The data were acquired from both a strain gauge and a PCB Piezotronics accelerometer (Model:352A24) of sensitivity 100 mV/g and a measurement range of ±50 g. This sensor was manufactured in Depew NY, USA. The data acquisition system (DAQ) used to acquire the signals was the IMC CRONOSflex, which was manufactured in Berlin, Germany. This DAQ has a total of 8 analog channels capable of individually acquiring frequency of 100 kHz.
3.1.3. Experimental Setup
- Figure 10a,b shows schematics of the toggle clamping system investigated in this study.
- The external surface of the stationary pin of the toggle clamping system was properly cleaned with acetone cleaner to remove oil or any other contaminants;
- A PCB Piezotronics accelerometer was first fastened to the stationary pin of the toggle clamping system using quick-setting cyanoacrylate adhesive glue as recommended by the manufacturer’s datasheet. This set up is shown in Figure 10c;
- A strain gauge was connected across the tie bar of the injection molding machine (Figure 10d);
- Both strain gauge and accelerometer were connected to the IMC CRONOSflex DAQ and sampled at 100 Hz and 50,000 Hz, respectively;
- The data from the sensors were transferred from the DAQ system to an in situ PC via an RJ45 cable for further analysis.
3.1.4. Experimental Procedures
- The clamping force of the CLF-60TX was fixed at 240 kPa;
- Since the lubrication system of the machine was time-controlled, the toggle clamping system was thereafter lubricated for 40 s with an anti-stick, extreme pressure oil. A lubrication time of 40 s injects the maximum quantity of lubricant into the journal and therefore represents complete relubrication;
- The toggle was clamped and unclamped repeatedly, replicating industrial mass production;
- The plastic injection industry currently relies on the machine operator’s experience to determine the number of cycles before relubrication. It is therefore a common practice for the toggle to be relubricated when the experienced machine operator detects a screeching sound during operation. Similarly, in this study, the toggle was completely relubricated for 40 s when a screeching sound was detected by the experience machine operator;
- At the onset of a screeching sound, as detected by the experienced machine operator, the toggle clamping system was completely relubricated for 40 s while allowed to continue its clamping and unclamping motion;
- Relubrication was performed at cycles 150, 330, 530, 710, and 880 as determined by the machine operator;
- The reliability of the Shock Response Spectrum (SRS) Health Indicator was evaluated when using (a) raw vibration, (b) vibration denoised with a traditional CW denoising method, and (c) vibration denoised using the DD denoising algorithm. Figure 11 summarizes the described analytical procedures.
3.2. Data Acquisition and Treatment
Figure 12 shows the data acquired during a single clamping-unclamping cycle. The blue profile represents the vibration data acquired using the accelerometer while the orange profile shows the strain changes acquired using the strain gauge. From points a–b, the toggle clamping system closes. From points b–c, the toggle clamping system is clamped. Points c–d are the injection, packing, and cooling periods. However, since the objective of the research was not to monitor product quality, there was no injection of molten plastic material into the shaping mold during testing. This explains why the period from 22 s to 27 s remains constant. Empty shots were performed to not waste plastic material. Points d–e represent the unclamping of the toggle clamping system, and points e–f are the retraction of the shaping mold to its zero position. Morgan and Chu [50] had shown that the unclamping period provides more information relating to the lubricating condition of the toggle clamping system than that of the clamping period. This study was improved by subjecting the vibration signal obtained during the unclamping period to a denoising pretreatment and then analyzing it using the Shock Response Spectrum algorithm.
4. Results/Discussion
Figure 13 shows the results after computing the Shock Response Health Indicator from (a) the raw vibration signal, (b) vibration signal denoised with the traditional DW denoising algorithm, and (c) the vibration signal denoised with the proposed DD denoising algorithm, respectively. The y axis of each plot represents the lubricating condition of the toggle as quantified by the Health Indicator while the x axis represents increasing cycle numbers. The vertical blue lines highlight the points where lubricant was added to the toggle clamping system. These relubrication points were determined to occur at cycles 150, 330, 530, 710, and 880. A visual inspection of the figures shows that lubricant degradation in the toggle clamping system of the plastic injection molding machine behaves in agreement with the widely published bathtub curve [51]. At the start of testing, and when the toggle was properly lubricated, its Health Indicator score was maintained at a low failure rate, as represented by the green arrows. However, as cycle numbers increased, the lubricating condition deteriorated and transitioned to an increasing failure as represented by the red arrows. Upon the relubrication of the toggle, the Health Indicator rapidly decreased, indicating a decreasing failure rate, as represented by the yellow arrows.
Although it can be visually identified when the lubricating condition transitions between a healthy and unhealthy state, for a practical industrial application, this transition must be mathematically quantified. An ideal condition monitoring regime should therefore be able to automatically trigger relubrication when the lubricating condition of the toggle transitions from a low failure rate to an increasing failure rate. It is, however, not suitable to derive a fixed relubrication threshold, as the amplitude of the vibration generated during toggle operation is dependent on factors such as ambient temperature, type of lubricant, age of the machine, operational clamping force, etc. Although the amplitude of the vibration is specific to the machine’s operational condition, a consistent vibrational pattern was observed using the Shock Response Spectrum (SRS) Health Indicator. When the toggle was properly lubricated, the SRS Health Indicator computed for successive unclamping cycles remains fairly stable with low variance when the signal is properly denoised (Figure 13c). However, as the lubricating condition begins to deteriorate, the variance of the SRS Health Indicator increases in a random manner. Density based clustering is therefore the most suitable tool to capture the change in data pattern from a healthy to an unhealthy lubricating state. During the healthy state, the local density of the observations will be high as the variance is low. The data cluster during this stage is therefore not sparse. As the lubricant transitions to an unhealthy state, the local density becomes low as the variance increases. The data cluster during this stage is therefore sparce. A successful condition monitoring system should be able to automatically detect the changes in the sparsity of the clusters. In MATLAB, there are two commonly used unsupervised clustering tools, namely K-Means and DBScan. K-Means was, however, used to perform the clustering in this study as it is reported to perform better than DBScan with data sets that have varying densities [52]. Data that exists in the same cluster typically have similar behavioral patterns. Using the K-Means clustering tool, the data were determined to exist in four different clusters, with the green cluster of points representing healthy observations; moreover, the magenta, red, and black points were determined to be unhealthy observations. After clustering, it can be observed that, when no data denoising (Figure 13a) is performed prior to computing the Health Indicator, there is a significant amount of outliers (magenta and back points) occurring during the “Low Failure Rate” stages of the lubricant lifecycle. The presence of these outlier observations decreases the reliability of the condition monitoring system as it will trigger false positive alarms and subsequently result in premature relubrication and lubricant waste. When the denoising was performed using the traditional DW denoising algorithm (Figure 13b), the preponderance of outlier observations during the “Low Failure Rate” stages decreased marginally. However, a significant decrease in numbers of outlier points occurring during the “Low Failure Rate” stages can only be observed when the data were first denoised with the proposed DD denoising algorithm prior to computing its Health Indicator. This study therefore shows that a large amount of the fluctuation in the raw vibrational data was caused by external activities unrelated to lubricant degradation. The proposed DD denoising algorithm therefore makes it possible to devise a robust condition monitoring system that is immune to external noise. The DD denoising algorithm removes the noise-influenced outliers. The elimination of these noise-influenced outliers makes it easy to distinguish between a low failure rate state (healthy) and an increasing failure rate state (unhealthy). The system can now trigger relubrication only when the toggle’s lubricating condition changes from a low failure rate to an increasing failure rate because all the false noise-influenced outliers are eliminated, thereby increasing its reliability. Such a relubrication regime has the potential to maximize lubricant use while keeping metal-to-metal contact to a minimum, as the lubricant can now be added at the exact cycle when the lubrication condition starts to deteriorate.
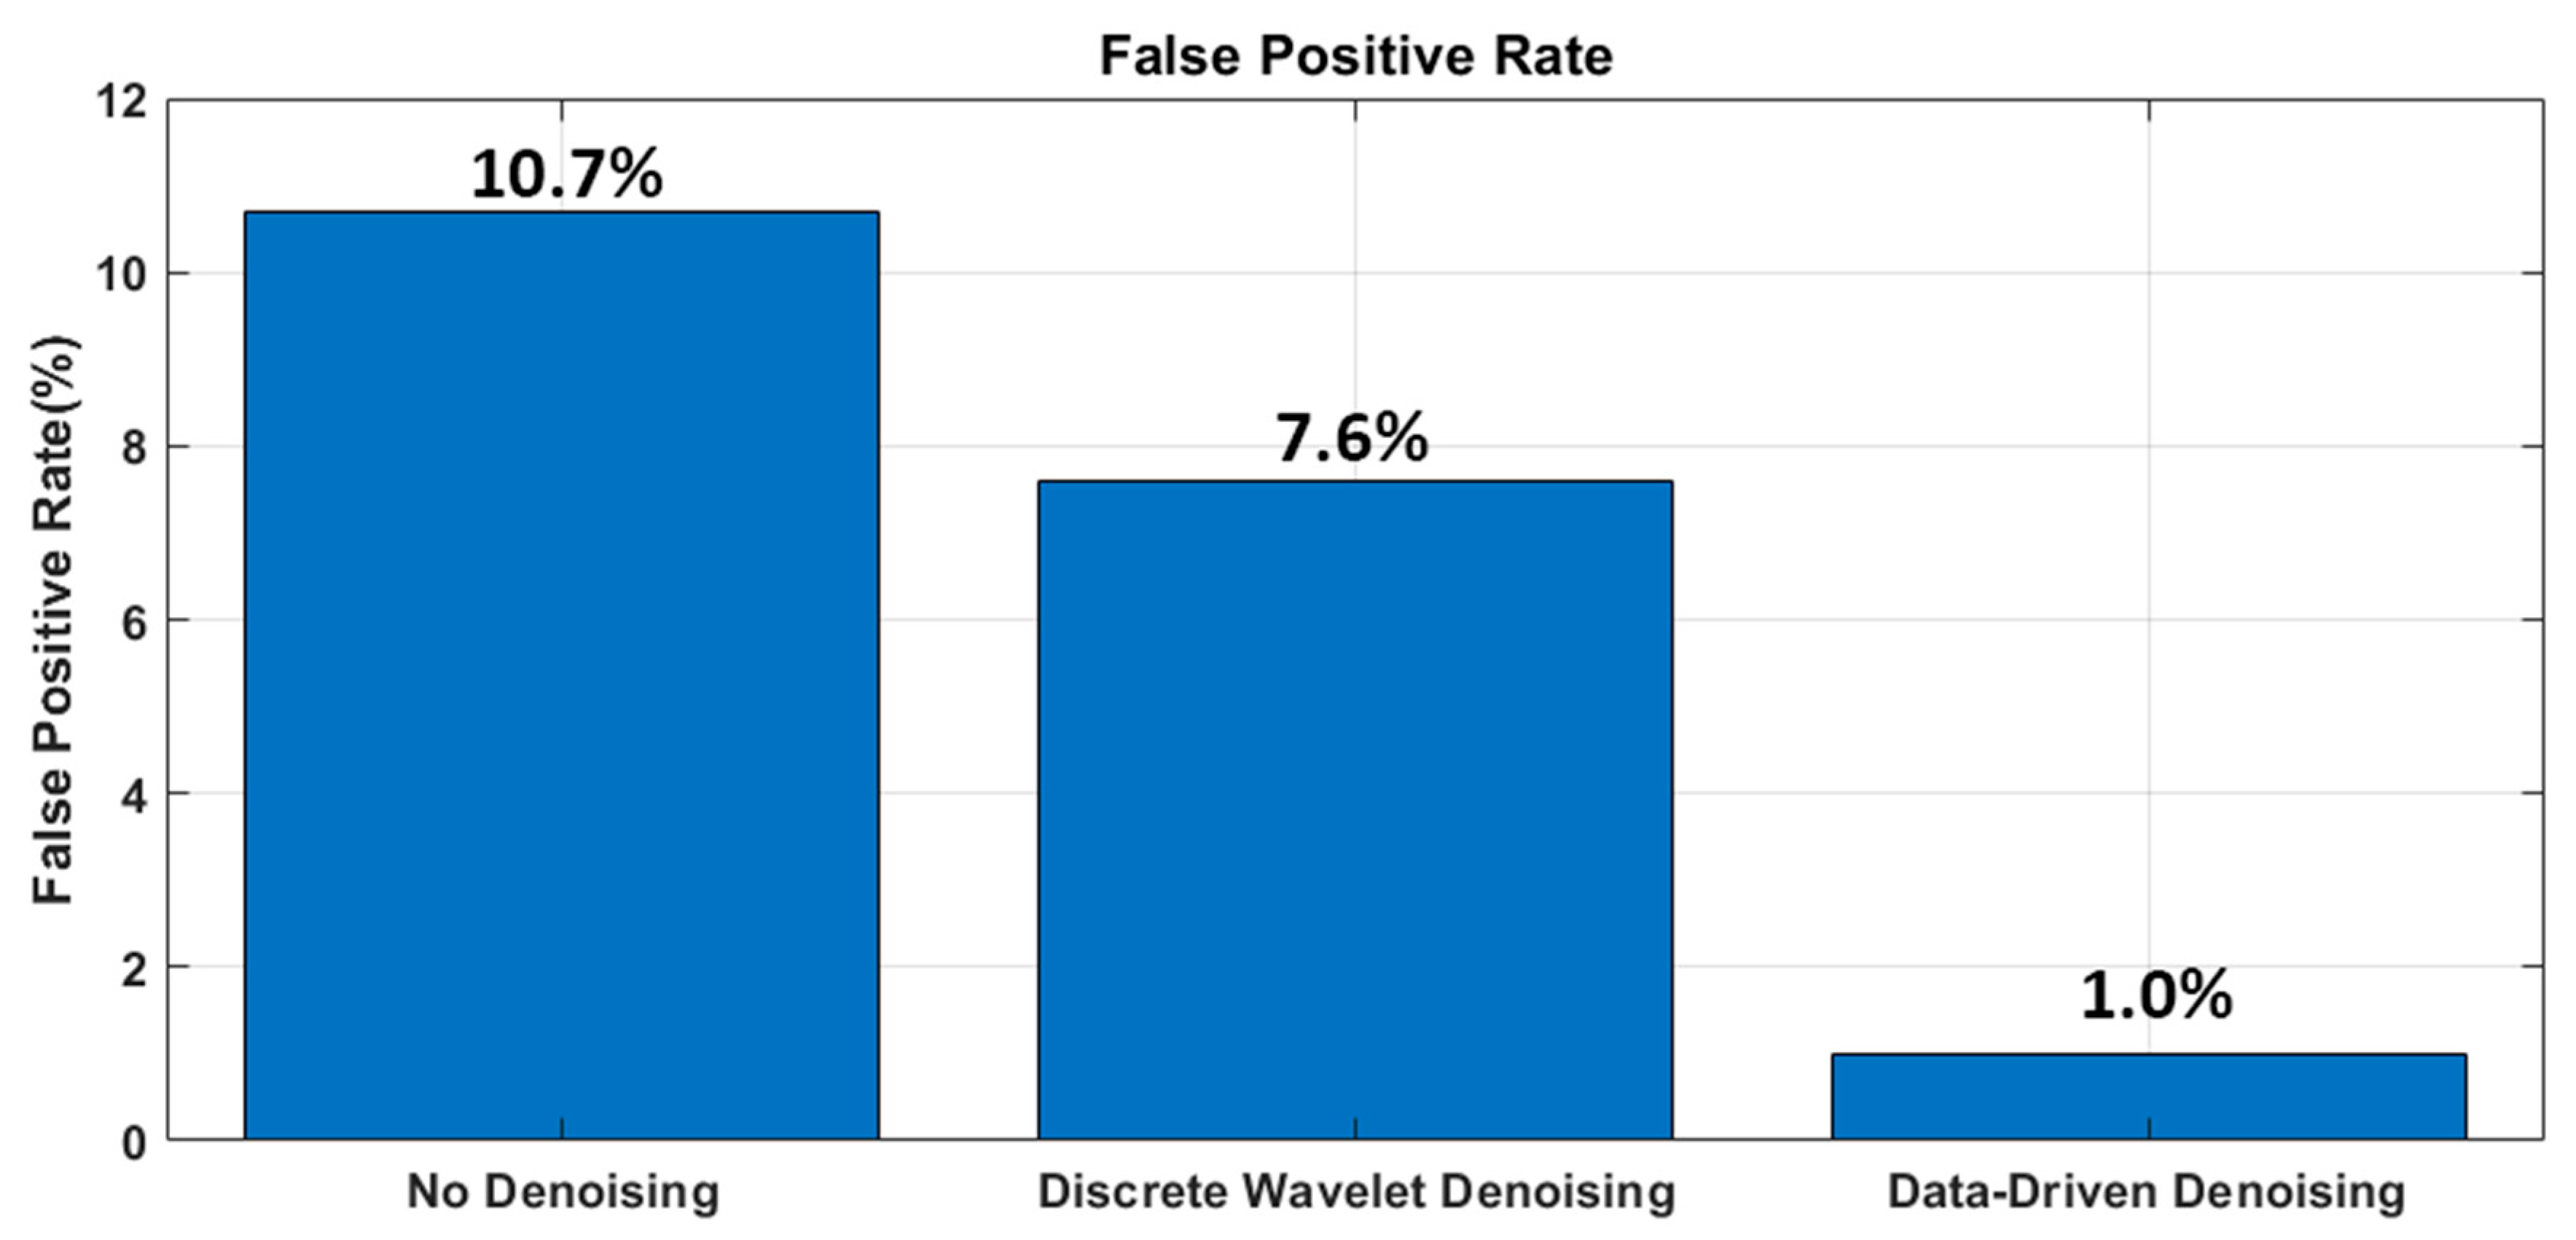
To statistically evaluate the performance improvement of the data-driven algorithm, a false positive rate was computed using Equation (14) [53].
where the False Positive observations were taken to be the number of outlier points (unhealthy non-green points) occurring during the “Low Failure Rate” stages of the lubricant’s lifecycle while the True Negative were the inlier points (healthy green points) occurring during this same period. The False Positive Rate is inversely proportional to reliability. The lower the False Positive Rate, the more reliable the system and vice versa. Figure 14 shows that the DD denoising approach yielded the lowest False Positive Rate of 1%, suggesting a highly reliable data set. This was followed by the DW denoising having a False Positive Rate of 7.6%, and the least reliable data set proved to be when no denoising was performed on the raw data, having a False Positive Rate of 10.7%.
In the final part of this study, the computational overhead necessary to implement the proposed denoising approach was assessed. Since the proposed denoising algorithm is data driven, it is inevitably more computationally expensive than that of the traditional DW denoising method. The computational overhead for both the proposed DD denoising model and the traditional DW denoising model were assessed using the MATLAB programming environment installed on a laptop PC with an Intel(R) Core(TM) i7-7500U CPU @ 2.70 GHz and 16.0 GB RAM. Both denoising approaches were performed on a vibration signal with 7000 samples and sampled at a rate of 50,000 Hz. Computation was completed for the traditional DW denoising method in 0.007 s while the DD model took 0.38 s to be computed. Although the DD denoising model took a considerably longer computational time, it remains useful in condition monitoring systems where data are sampled intermittently. In this study, intermittent sampling was used to perform the condition monitoring of the lubrication condition of the toggle clamping system since computation was only performed on the vibration generated during the unclamping of the toggle clamping system. There were approximately 5 s between successive unclamping cycles. The time delay of 5 s was much longer than the denoising time of 0.38 s. Thus, the additional computational overhead posed by the data-driven approach had no effect on the real-time condition monitoring system.
5. Conclusions
- Noise contamination reduces the reliability of vibration-based condition monitoring systems;
- This study proposed a novel and unsupervised data-driven (DD) Denoising algorithm using the Continuous Wavelet Transform method paired with the singular value decomposition method;
- The proposed model was validated with simulated data. It outperformed the traditional Discrete Wavelet denoising algorithm, resulting in an 85.2% noise reduction;
- The DD denoising algorithm was applied to the real time lubrication condition monitoring of the toggle clamping system, thereby improving the system’s robustness. It decreased the false positive rate from 10.7% when no denoising was performed to 1%.
6. Future Work
At present, the proposed model has been validated numerically and in a single practical case where the lubrication condition of a toggle clamping system of a plastic injection molding machine was monitored. To add further validity to this study, the DD denoising algorithm’s noise reduction performance must be evaluated when integrated into condition monitoring systems of different types of industrial machines. The algorithm must also be translated from the MATLAB programming language to the C/C++ programming language to improve its computational speed.
Author Contributions
Conceptualization, H.-Y.C. and W.J.M.; methodology, H.-Y.C.; software, W.J.M.; validation, H.-Y.C. and W.J.M.; formal analysis, W.J.M.; investigation, W.J.M.; resources, H.-Y.C.; data curation, W.J.M.; writing—original draft preparation, W.J.M.; writing—review and editing, H.-Y.C.; visualization, W.J.M.; supervision, H.-Y.C.; project administration, H.-Y.C.; funding acquisition, H.-Y.C. All authors have read and agreed to the published version of the manuscript.
Funding
This research was funded by Taiwan’s National Science and Technology Council (NSTC) with grant number NSTC 111-3111-E-035-001.
Data Availability Statement
Not applicable.
Acknowledgments
The authors would like to thank Chuan Lih Fa Machinery Works Co. Ltd., (Tainan, Taiwan) for providing us with the injection molding machine and their technical expertise. The authors also would like to thank Sheng-Jye Hwang in the Department of Mechanical Engineering, National Cheng Kung University, and Hsin-Shu Peng in the Department of Mechanical and Computer-Aided Engineering, Feng Chia University, for their help in the NSTC’s Integrated plan.
Conflicts of Interest
The authors declare no conflict of interest.
References
- Lanza, G.; Niggeschmidt, S.; Werner, P. Optimization of Preventive Maintenance and Spare Part Provision for Machine Tools Based on Variable Operational Conditions. CIRP Ann. 2009, 58, 429–432. [Google Scholar] [CrossRef]
- Ferreiro, S.; Konde, E.; Fernández, S.; Prado, A. Industry 4.0: Predictive Intelligent Maintenance for Production Equipment. In Proceedings of the Third European Conference of the PHM Society 2016, Bilbao, Spain, 5–8 July 2016. [Google Scholar]
- Heng, A.; Zhang, S.; Tan, A.C.C.; Mathew, J. Rotating Machinery Prognostics: State of the Art, Challenges and Opportunities. Mech. Syst. Signal Process. 2009, 23, 724–739. [Google Scholar] [CrossRef]
- Martin, K.F. A Review by Discussion of Condition Monitoring and Fault Diagnosis in Machine Tools. Int. J. Mach. Tools Manuf. 1994, 34, 527–551. [Google Scholar] [CrossRef]
- Jardine, A.K.S.; Lin, D.; Banjevic, D. A Review on Machinery Diagnostics and Prognostics Implementing Condition-Based Maintenance. Mech. Syst. Signal Process. 2006, 20, 1483–1510. [Google Scholar]
- Geitner, F.K.; Bloch, H.P. Chapter 1—The Failure Analysis and Troubleshooting System. In Machinery Failure Analysis and Troubleshooting, 4th ed.; Geitner, F.K., Bloch, H.P., Eds.; Butterworth-Heinemann: Oxford, UK, 2012; pp. 1–9. [Google Scholar]
- Bogue, R. Sensors for Condition Monitoring: A Review of Technologies and Applications. Sens. Rev. 2013, 33, 295–299. [Google Scholar] [CrossRef]
- Carden, E.P.; Fanning, P. Vibration Based Condition Monitoring: A Review. Struct. Health Monit. 2004, 3, 355–377. [Google Scholar] [CrossRef]
- Farrar, C.R.; Doebling, S.W. Damage Detection and Evaluation Ii. In Modal Analysis and Testing; Silva, J.M.M., Maia, N.M.M., Eds.; Springer: Dordrecht, The Netherlands, 1999; pp. 345–378. [Google Scholar]
- Sait, A.S.; Sharaf-Eldeen, Y.I. A Review of Gearbox Condition Monitoring Based on Vibration Analysis Techniques Diagnostics and Prognostics. In Rotating Machinery, Structural Health Monitoring, Shock and Vibration; Springer: New York, NY, USA, 2011; Volume 5. [Google Scholar]
- Sinha, J.K.; Elbhbah, K. A Future Possibility of Vibration Based Condition Monitoring of Rotating Machines. Mech. Syst. Signal Process. 2013, 34, 231–240. [Google Scholar] [CrossRef]
- Goyal, D.; Pabla, B.S. The Vibration Monitoring Methods and Signal Processing Techniques for Structural Health Monitoring: A Review. Arch. Comput. Methods Eng. 2016, 23, 585–594. [Google Scholar] [CrossRef]
- Randall, R.B. Vibration-Based Condition Monitoring: Industrial, Aerospace and Automotive Applications; John Wiley & Sons: Hoboken, NJ, USA, 2010. [Google Scholar]
- Al-Obaidi, A.R. Detection of Cavitation Phenomenon within a Centrifugal Pump Based on Vibration Analysis Technique in Both Time and Frequency Domains. Exp. Tech. 2020, 44, 329–347. [Google Scholar] [CrossRef]
- Hory, C.; Martin, N.; Chehikian, A. Spectrogram Segmentation by Means of Statistical Features for Non-Stationary Signal Interpretation. IEEE Trans. Signal Process. 2002, 50, 2915–2925. [Google Scholar] [CrossRef]
- Ravier, P.; Amblard, P.-O. Combining an Adapted Wavelet Analysis with Fourth-Order Statistics for Transient Detection. Signal Process. 1998, 70, 115–128. [Google Scholar] [CrossRef]
- Angrisani, L.; Daponte, P.; D’apuzzo, M. A Method for the Automatic Detection and Measurement of Transients. Part I The Measurement Method. Measurement 1999, 25, 19–30. [Google Scholar]
- Angrisani, L.; Daponte, P.; D’apuzzo, M. A Method for the Automatic Detection and Measurement of Transients. Part II Applications. Measurement 1999, 25, 31–40. [Google Scholar]
- Zhu, Z.K.; Yan, R.; Luo, L.; Feng, Z.H.; Kong, F.R. Detection of Signal Transients Based on Wavelet and Statistics for Machine Fault Diagnosis. Mech. Syst. Signal Process. 2009, 23, 1076–1097. [Google Scholar] [CrossRef]
- Miao, F.; Zhao, R.; Wang, X. A New Method of Denoising of Vibration Signal and Its Application. Shock. Vib. 2020, 2020, 7587840. [Google Scholar] [CrossRef]
- He, Q.; Wang, X.; Zhou, Q. Vibration Sensor Data Denoising Using a Time-Frequency Manifold for Machinery Fault Diagnosis. Sensors 2014, 14, 382–402. [Google Scholar] [CrossRef] [PubMed] [Green Version]
- Braun, S. The Synchronous (Time Domain) Average Revisited. Mech. Syst. Signal Process. 2011, 25, 1087–1102. [Google Scholar] [CrossRef]
- Mcfadden, P.D.; Toozhy, M.M. Application of Synchronous Averaging to Vibration Monitoring of Rolling Element Bearings. Mech. Syst. Signal Process. 2000, 14, 891–906. [Google Scholar] [CrossRef]
- Martin, H.R.; Honarvar, F. Application of Statistical Moments to Bearing Failure Detection. Appl. Acoust. 1995, 44, 67–77. [Google Scholar] [CrossRef]
- Lin, J.; Qu, L. Feature Extraction Based on Morlet Wavelet and Its Application for Mechanical Fault Diagnosis. J. Sound Vib. 2000, 234, 135–148. [Google Scholar] [CrossRef]
- Beheshti, S.; Dahleh, M.A. A New Information-Theoretic Approach to Signal Denoising and Best Basis Selection. IEEE Trans. Signal Process. 2005, 53, 3613–3624. [Google Scholar] [CrossRef]
- Xiaogang, D.; Yang, Y.; Xiwen, Q.; Xinmin, W.; Zhansheng, T. Signal Denoising Based on Improved Wavelet Packet Thresholding Function. In Proceedings of the 2010 International Conference on Computer, Mechatronics, Control and Electronic Engineering, Changchun, China, 24–26 August 2010. [Google Scholar]
- Yi, T.-H.; Li, H.-N.; Zhao, X.-Y. Noise Smoothing for Structural Vibration Test Signals Using an Improved Wavelet Thresholding Technique. Sensors 2012, 12, 11205–11220. [Google Scholar] [CrossRef] [PubMed] [Green Version]
- Yang, W.-X.; Tse, P.W. Development of an Advanced Noise Reduction Method for Vibration Analysis Based on Singular Value Decomposition. NDT E Int. 2003, 36, 419–432. [Google Scholar] [CrossRef] [Green Version]
- Candès, E.J.; Sing-Long, C.A.; Trzasko, J.D. Unbiased Risk Estimates for Singular Value Thresholding and Spectral Estimators. IEEE Trans. Signal Process. 2013, 61, 4643–4657. [Google Scholar] [CrossRef] [Green Version]
- Ashok, K.; Kalaiselvi, A.; Vijaykumar, V.R. Adaptive Impulse Detection Based Selective Window Median Filter for Removal of Random-Valued Impulse Noise in Digital Images. COMPEL—Int. J. Comput. Math. Electr. Electron. Eng. 2016, 35, 1604–1616. [Google Scholar] [CrossRef]
- Wang, Y.; Ren, X.; Yang, Y.; Deng, W. An Efficient Denoising Source Separation (Dss) of Rotating Machine Fault Signals Based on Empirical Mode Decomposition (Emd). Xibei Gongye Daxue Xuebao J. Northwestern Polytech. Univ. 2013, 31, 272–276. [Google Scholar]
- Chakraborty, A.; Okaya, D.A. Frequency-Time Decomposition of Seismic Data Using Wavelet-Based Methods. Geophysics 1995, 60, 1906–1916. [Google Scholar] [CrossRef] [Green Version]
- Ramesh Babu, T.; Srikanth, S.; Sekhar, A.S. Hilbert-Huang Transform for Detection and Monitoring of Crack in a Transient Rotor. Mech. Syst. Signal Process. 2008, 22, 905–914. [Google Scholar] [CrossRef]
- Boashash, B. Chapter 15—Time-Frequency Diagnosis and Monitoring. In Time Frequency Analysis; Boashash, B., Ed.; Elsevier Science: Oxford, UK, 2003; pp. 627–682. [Google Scholar]
- Rioul, O.; Duhamel, P. Fast Algorithms for Discrete and Continuous Wavelet Transforms. IEEE Trans. Inf. Theory 1992, 38, 569–586. [Google Scholar] [CrossRef] [Green Version]
- Zeng, C.; Lin, H.; Jiang, Q.; Xu, M. Qrs Complex Detection Using Combination of Mexican-Hat Wavelet and Complex Morlet Wavelet. J. Comput. 2013, 8, 2951–2958. [Google Scholar] [CrossRef]
- Duval-Destin, M.; Muschietti, M.A.; Torrésani, B. Continuous Wavelet Decompositions, Multiresolution, and Contrast Analysis. SIAM J. Math. Anal. 1993, 24, 739–755. [Google Scholar] [CrossRef]
- Luchtenburg, D.M. Data-Driven Science and Engineering: Machine Learning, Dynamical Systems, and Control (Brunton, Steven L. and Kutz, J. Nathan; 2020) [Bookshelf]. IEEE Control. Syst. Mag. 2021, 41, 95–102. [Google Scholar] [CrossRef]
- Chitsaz, N.; Azarnivand, A.; Araghinejad, S. Pre-Processing of Data-Driven River Flow Forecasting Models by Singular Value Decomposition (Svd) Technique. Hydrol. Sci. J. 2016, 61, 2164–2178. [Google Scholar] [CrossRef] [Green Version]
- Donoho, D.L.; Johnstone, I.M. Adapting to Unknown Smoothness Via Wavelet Shrinkage. J. Am. Stat. Assoc. 1995, 90, 1200–1224. [Google Scholar] [CrossRef]
- Wang, Z.; Bovik, A.C. Mean Squared Error: Love It or Leave It? A New Look at Signal Fidelity Measures. IEEE Signal Process. Mag. 2009, 26, 98–117. [Google Scholar] [CrossRef]
- Tang, S.H.; Kong, Y.M.; Sapuan, S.M.; Samin, R.; Sulaiman, S. Design and Thermal Analysis of Plastic Injection Mould. J. Mater. Process. Technol. 2006, 171, 259–267. [Google Scholar] [CrossRef]
- Min, B.H. A Study on Quality Monitoring of Injection-Molded Parts. J. Mater. Process. Technol. 2003, 136, 1–6. [Google Scholar] [CrossRef]
- Kulkarni, V.; Karande, P.; Joshi, N.; Hambir, P.; Gurav, S. Design and Material Selection of Screw Feeder of Injection Molding Machine. Int. J. Eng. Adv. Technol. 2020, 9, 1812–1816. [Google Scholar]
- Pun, K.-F.; Hui, I.-K.; Lewis, W.G.; Lau, H.C.W. A Multiple-Criteria Environmental Impact Assessment for the Plastic Injection Molding Process: A Methodology. J. Clean. Prod. 2003, 11, 41–49. [Google Scholar] [CrossRef]
- Kitayama, S.; Hashimoto, S.; Takano, M.; Yamazaki, Y.; Kubo, Y.; Aiba, S. Multi-Objective Optimization for Minimizing Weldline and Cycle Time Using Variable Injection Velocity and Variable Pressure Profile in Plastic Injection Molding. Int. J. Adv. Manuf. Technol. 2020, 107, 3351–3361. [Google Scholar] [CrossRef]
- Ambs, L.; Frerker, M.M. The Use of Variable Speed Drives to Retrofit Hydraulic Injection Molding Machines. Energy Eng. 1998, 95, 55–76. [Google Scholar] [CrossRef]
- Yazawa, S.; Minami, I.; Prakash, B. Reducing Friction and Wear of Tribological Systems through Hybrid Tribofilm Consisting of Coating and Lubricants. Lubricants 2014, 2, 90–112. [Google Scholar] [CrossRef] [Green Version]
- Morgan, W.J.; Chu, H.-Y. Development of a Reliable Vibration Based Health Indicator for Monitoring the Lubricating Condition of the Toggle Clamping System of a Plastic Injection Molding Machine. Appl. Sci. 2022, 12, 196. [Google Scholar] [CrossRef]
- Motahari-Nezhad, M.; Jafari, S.M. Bearing Remaining Useful Life Prediction under Starved Lubricating Condition Using Time Domain Acoustic Emission Signal Processing. Expert Syst. Appl. 2021, 168, 114391. [Google Scholar] [CrossRef]
- Asgharbeygi, N.; Maleki, A. Geodesic K-Means Clustering. In Proceedings of the 2008 19th International Conference on Pattern Recognition, Tampa, FL, USA, 8–11 December 2008. [Google Scholar]
- Amin, M.A.; Yan, H. High Speed Detection of Retinal Blood Vessels in Fundus Image Using Phase Congruency. Soft Comput. 2011, 15, 1217–1230. [Google Scholar] [CrossRef]
Figure 1.
Two-level DW decomposition.

Figure 2.
Proposed DD denoising algorithm.
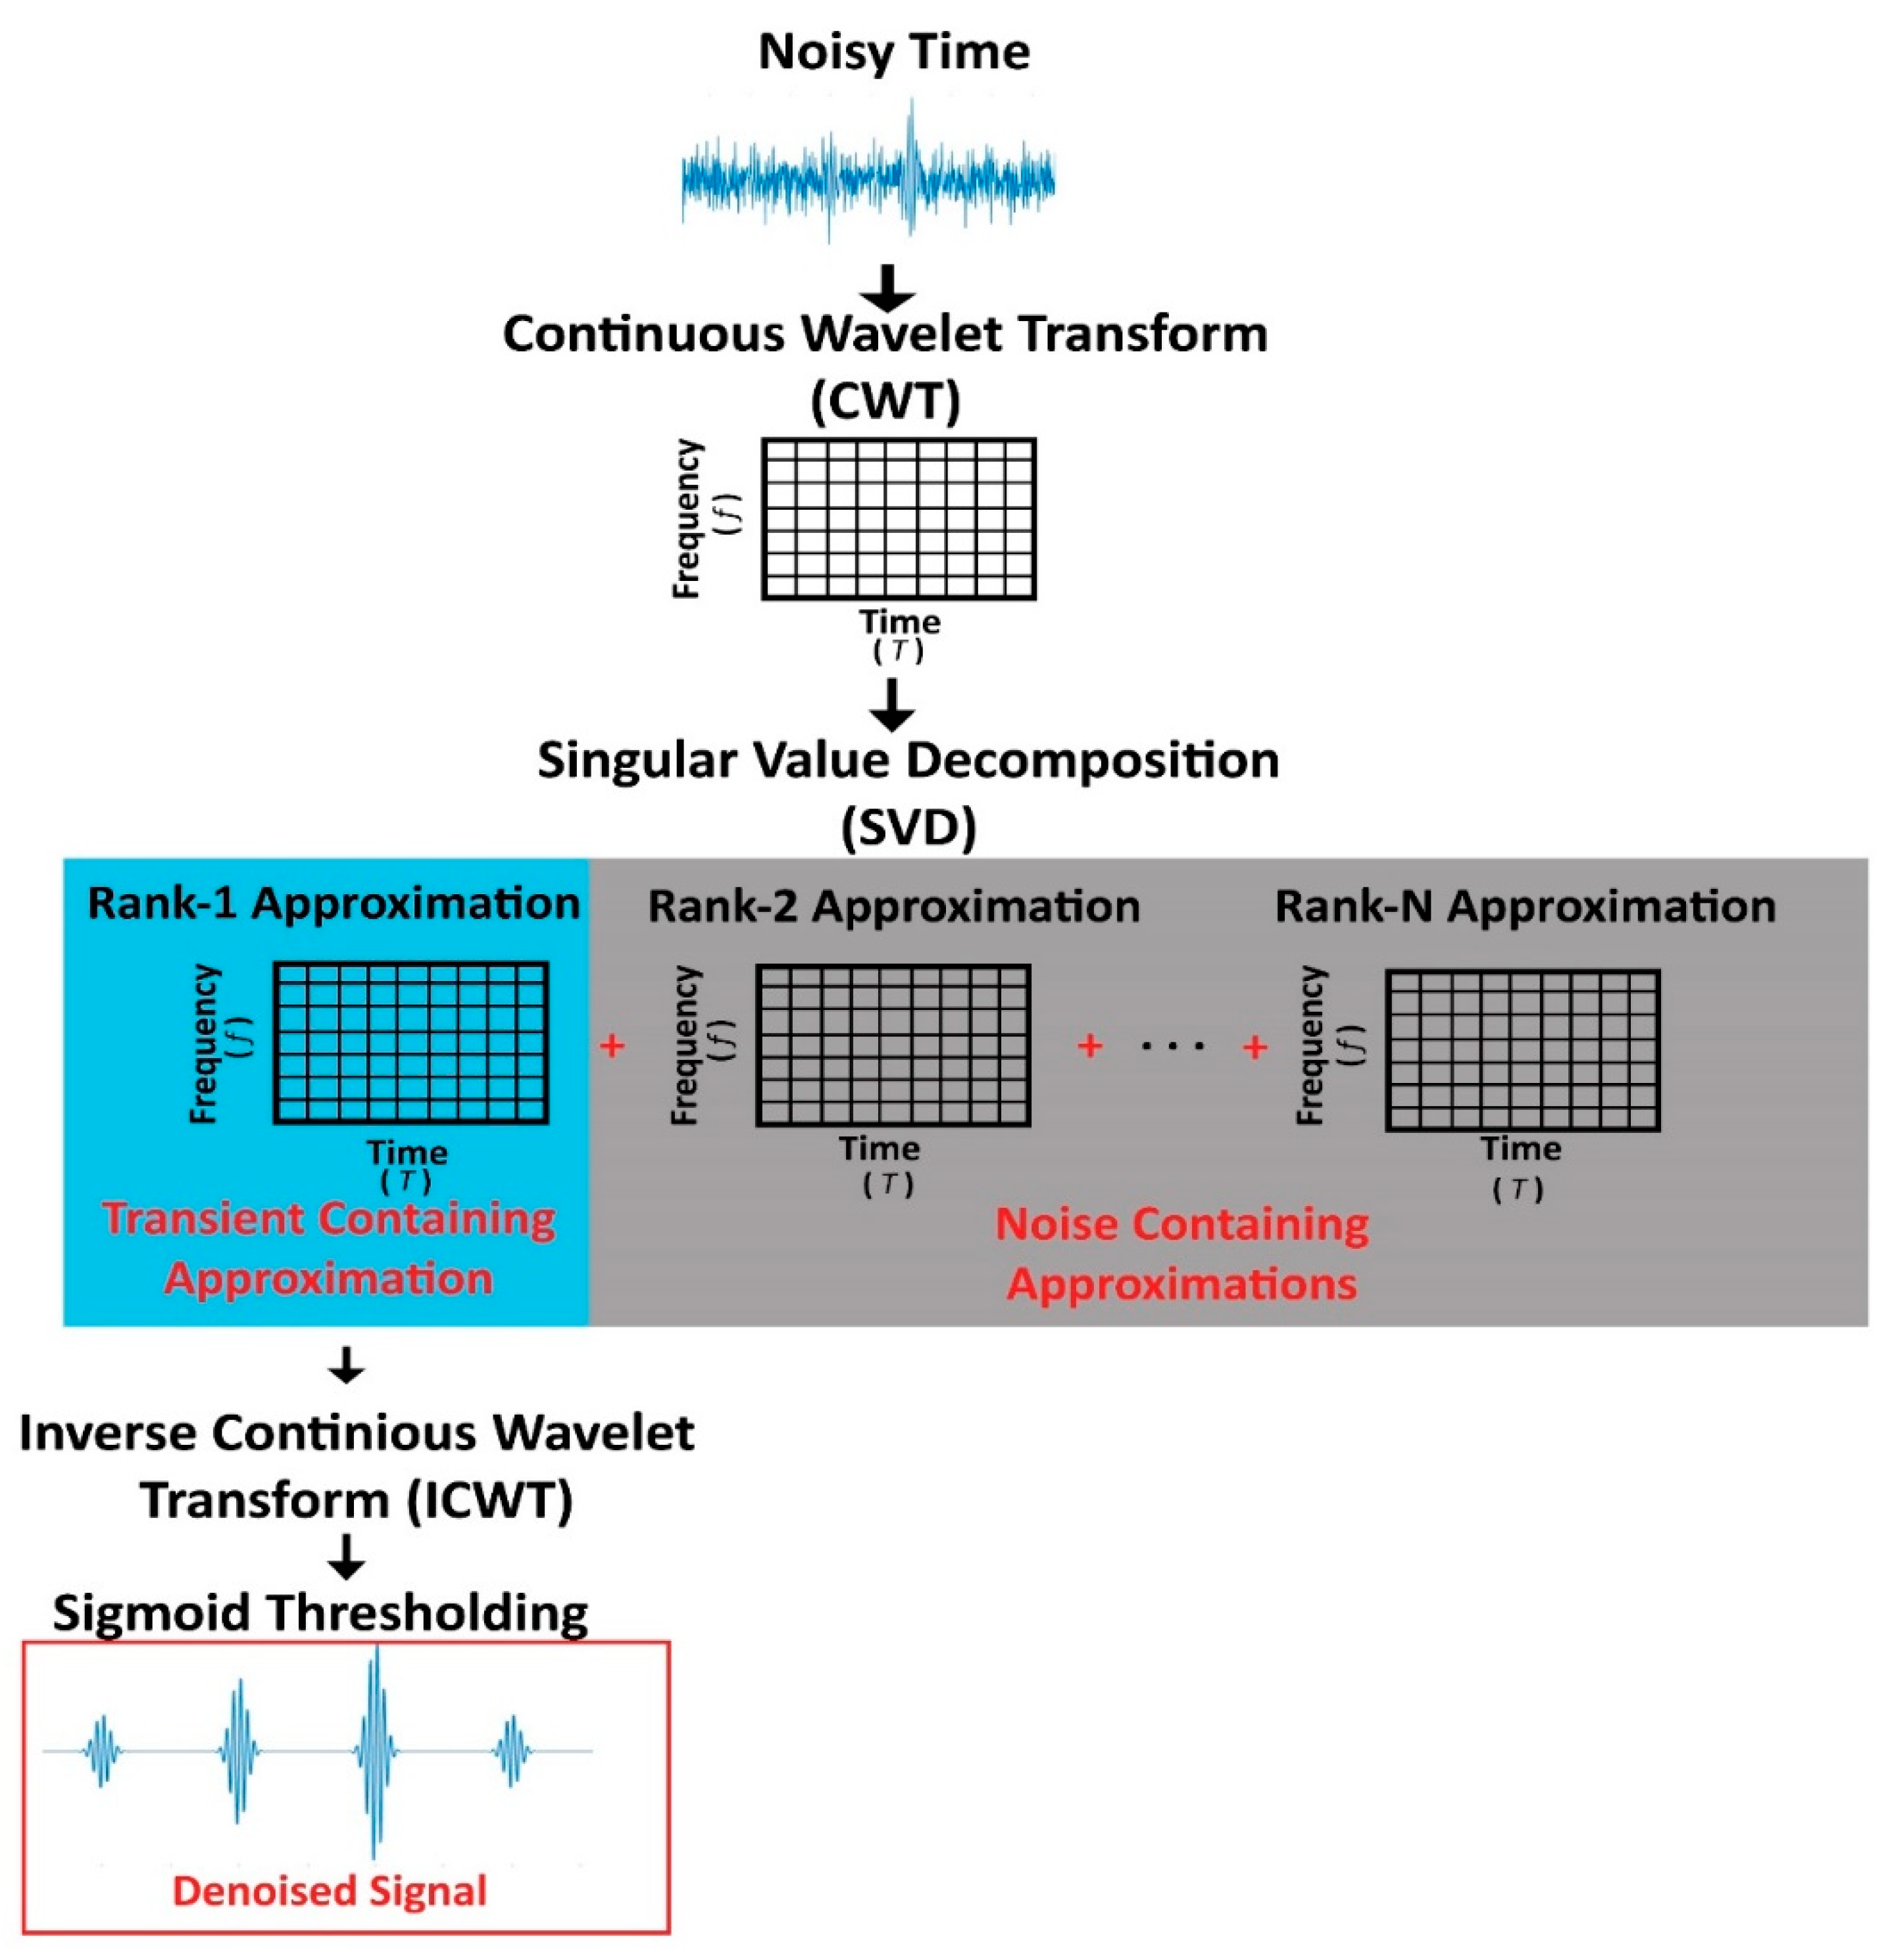
Figure 3.
Transformation of time domain signal to time–frequency domain using CWT.
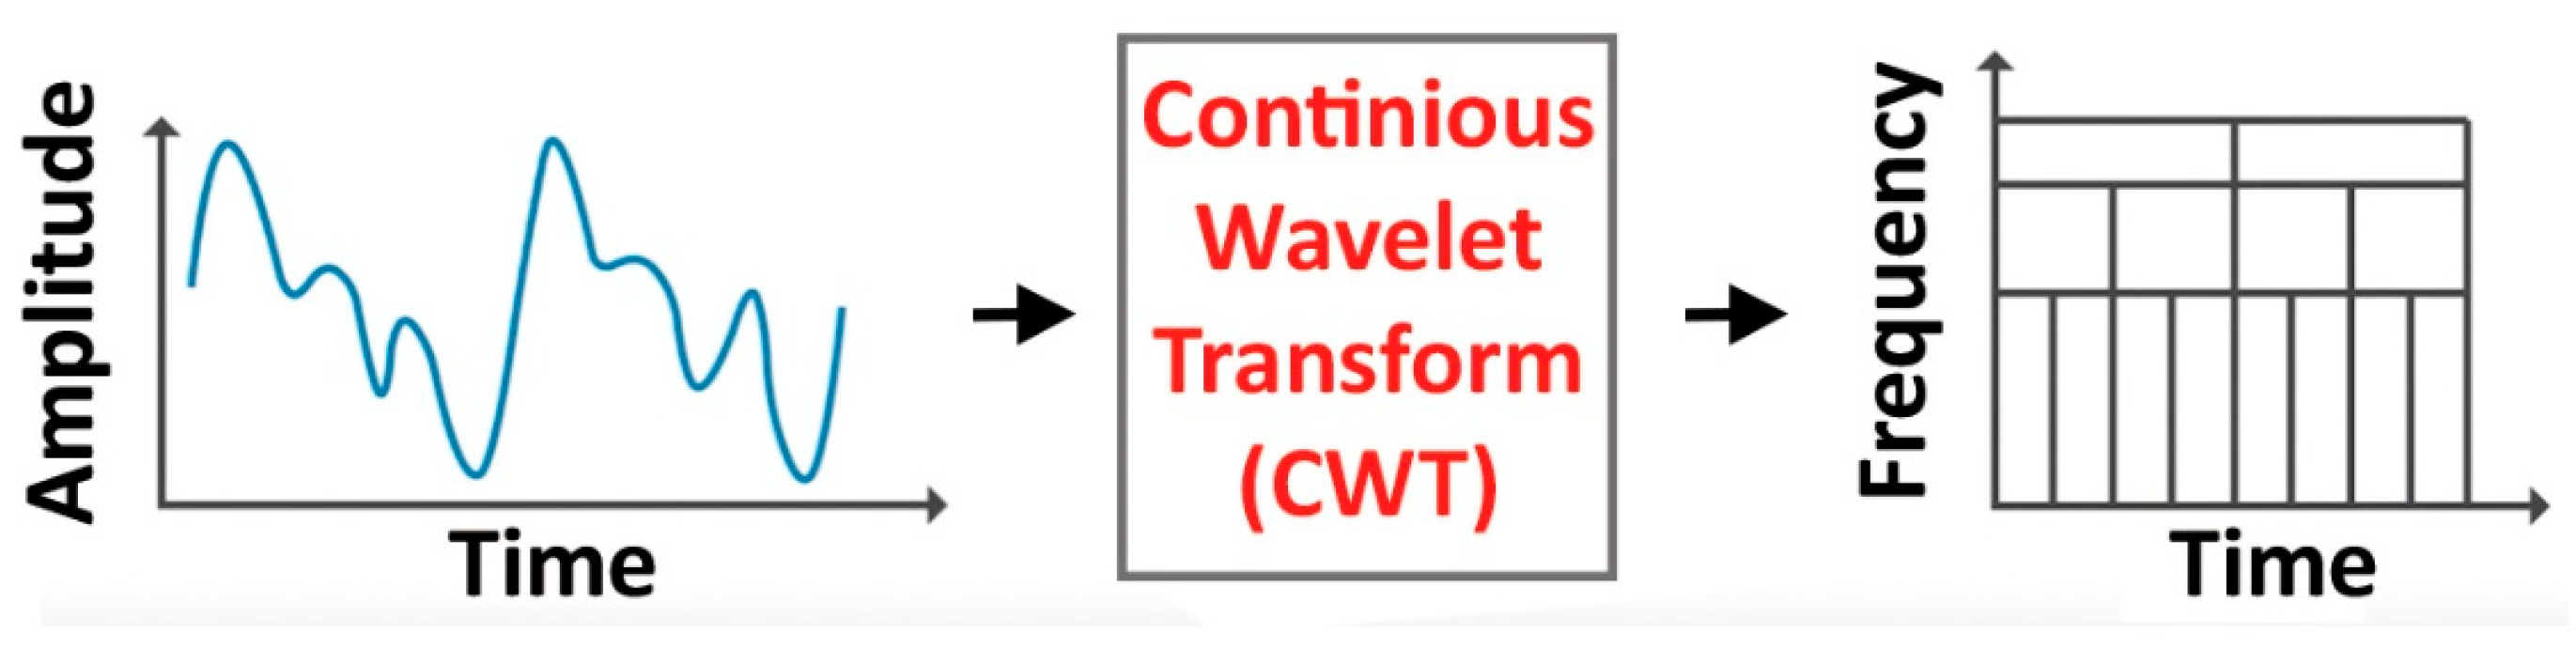
Figure 4.
A clean free damped vibration model with 4 distinct periodic transients (a) without (b) with –5 db white noise.
Figure 4.
A clean free damped vibration model with 4 distinct periodic transients (a) without (b) with –5 db white noise.
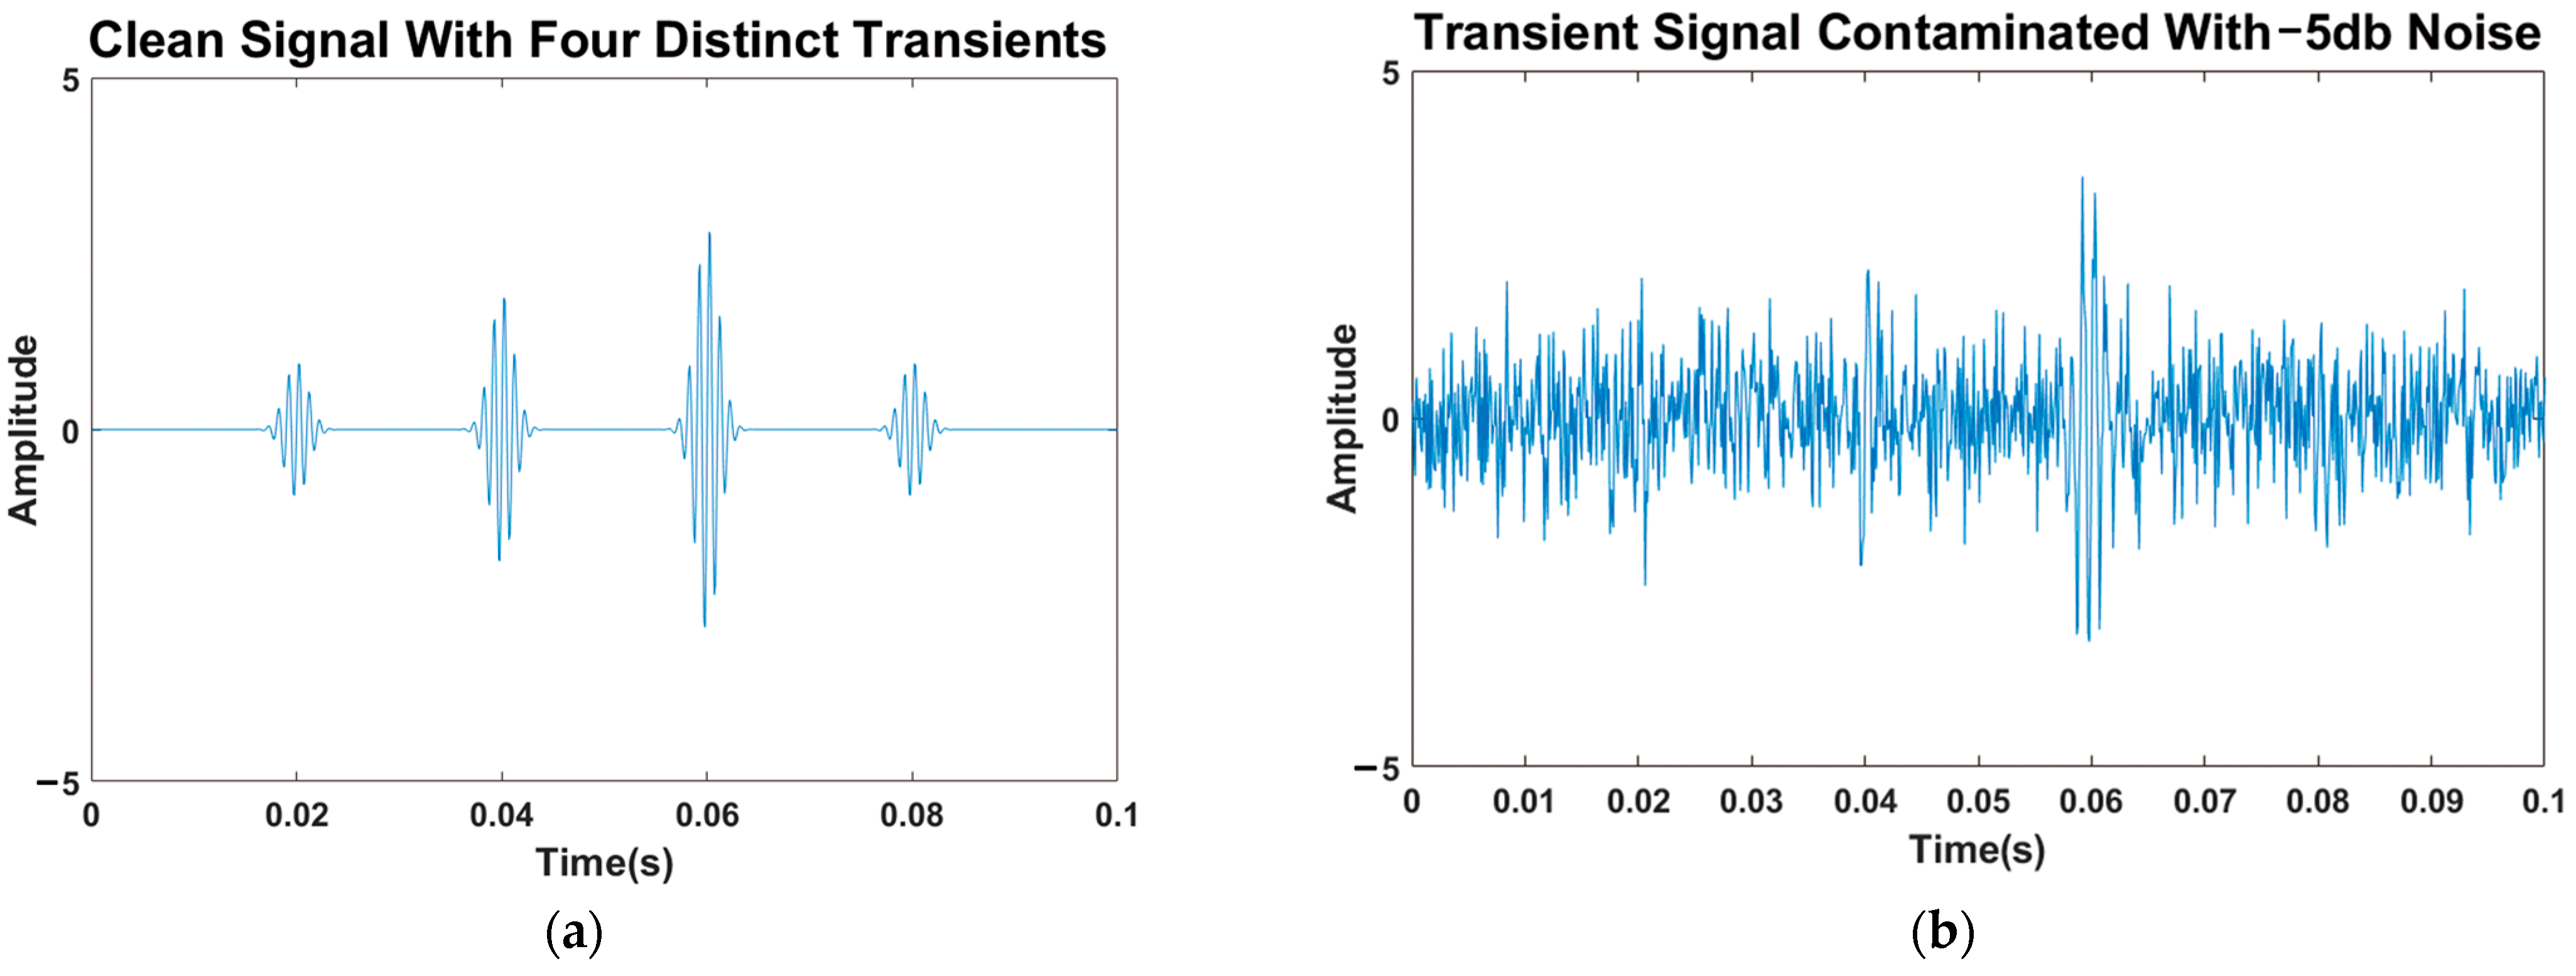
Figure 5.
(a) Continuous wavelet transform of noisy signal (b) rank-1 matrix approximation.
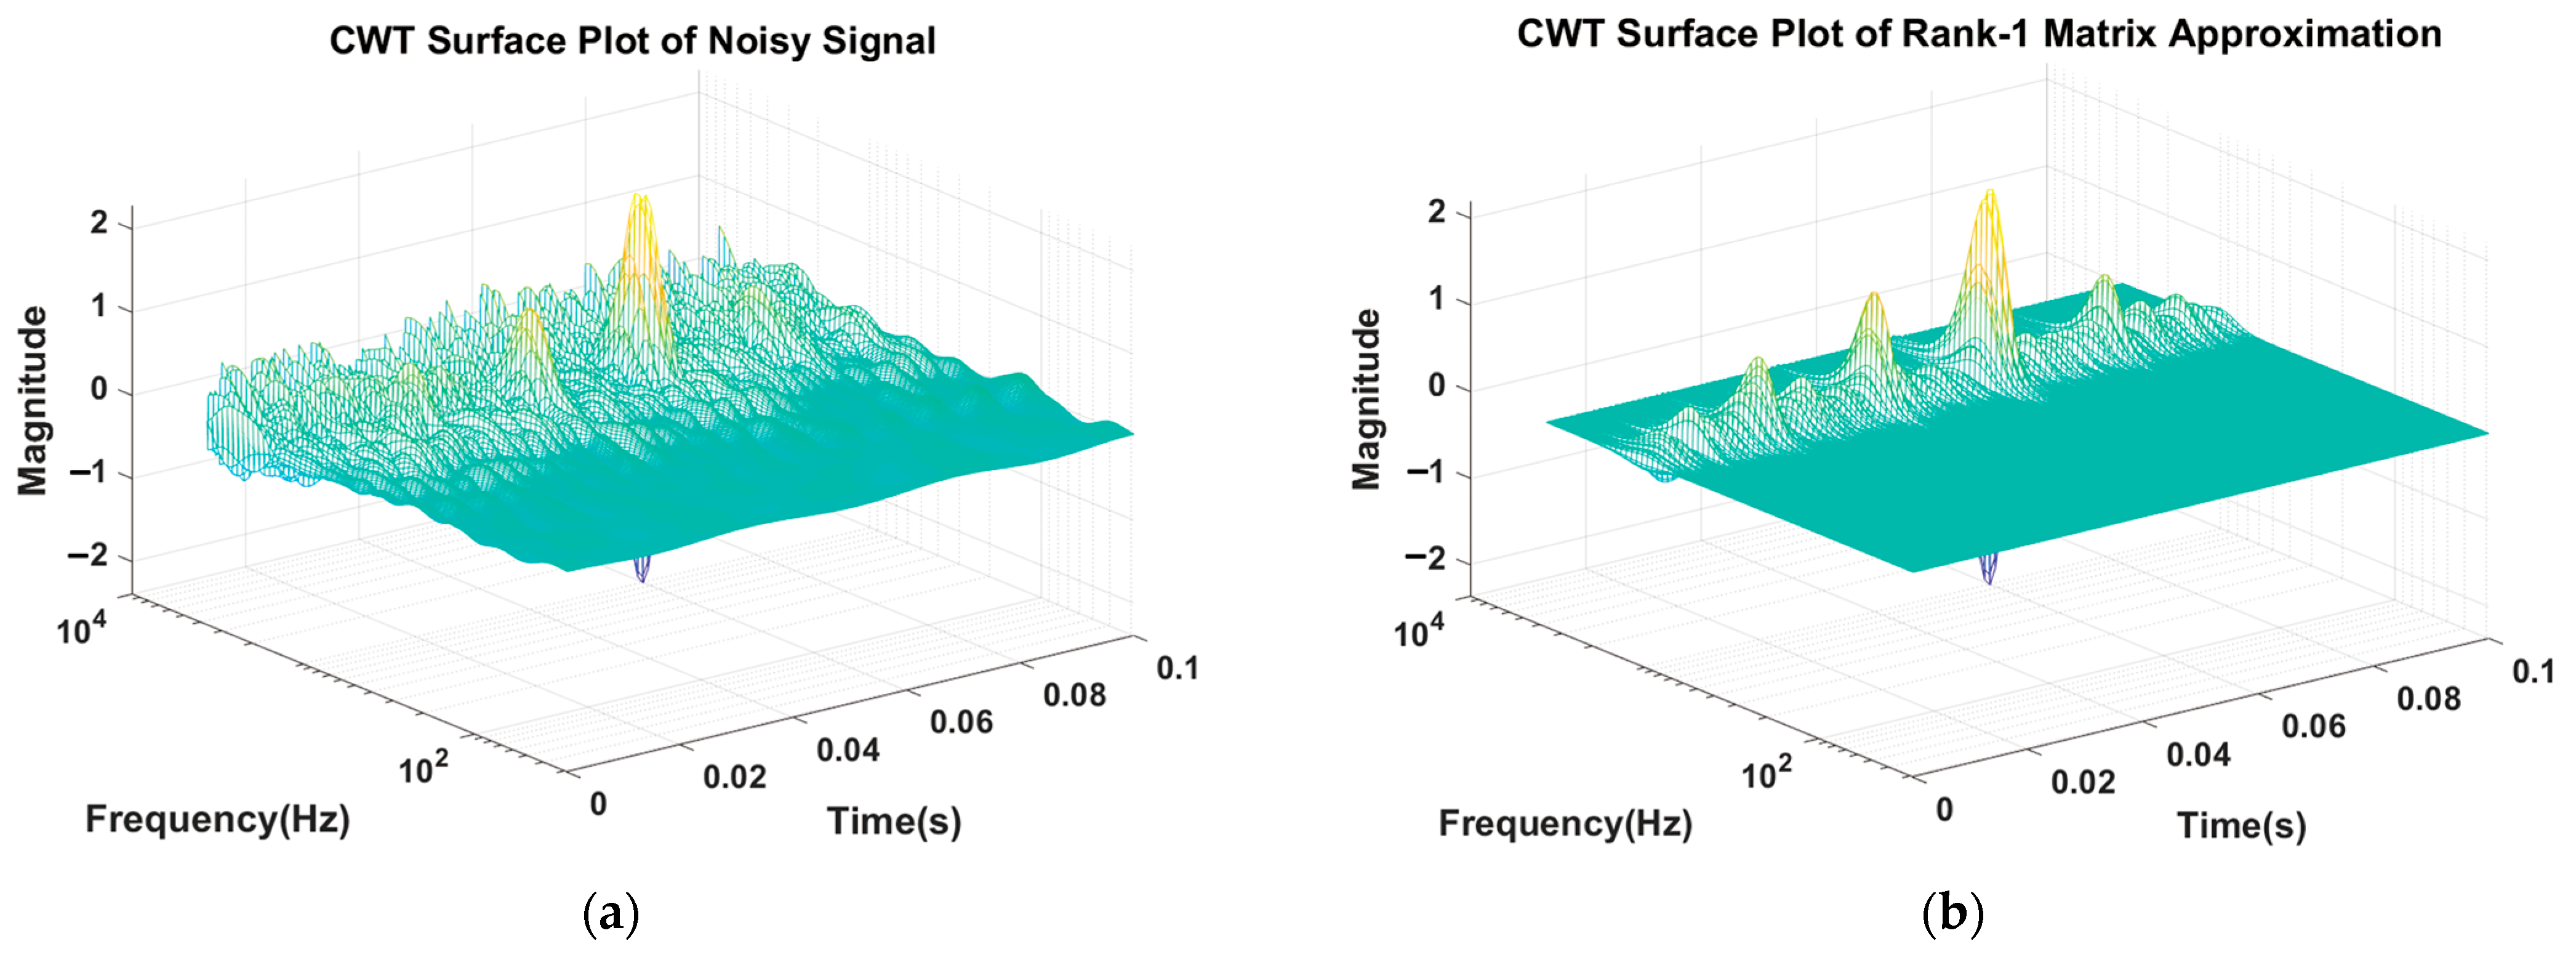
Figure 6.
(a) Singular values σr; (b) cumulative energy in first r modes.
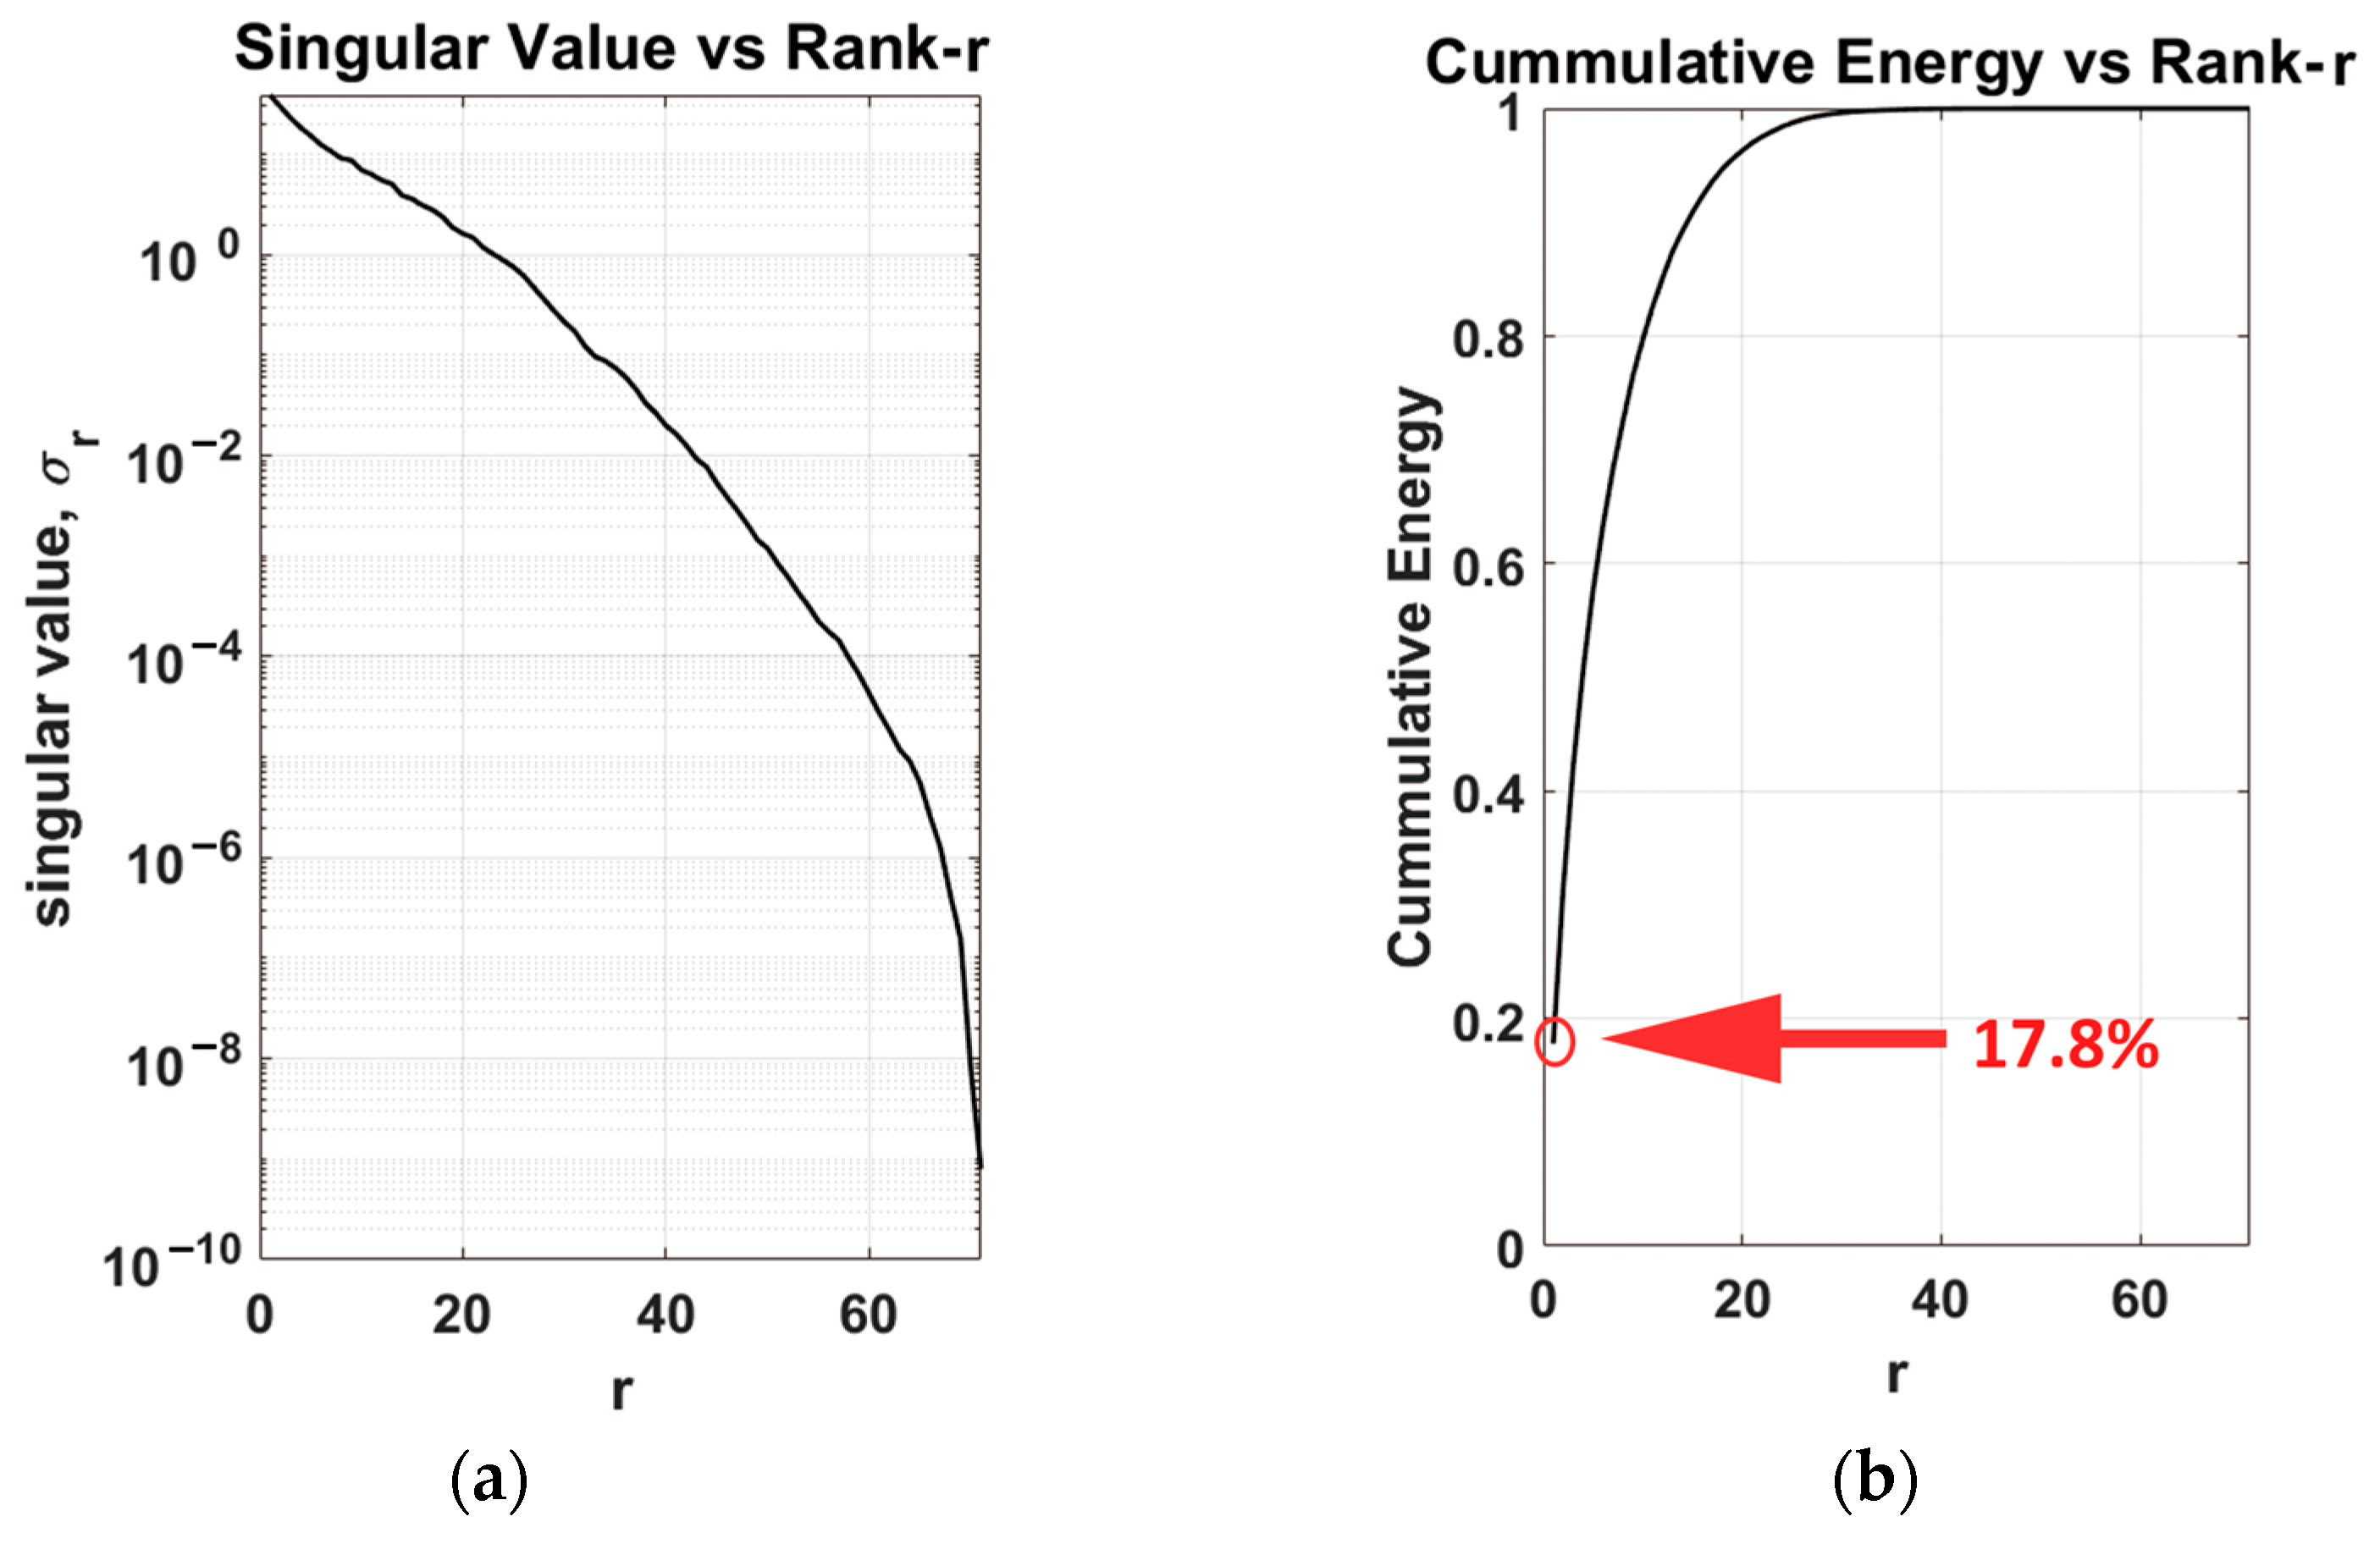
Figure 7.
Result of (a) DD denoising approach, (b) traditional DW denoising approach.
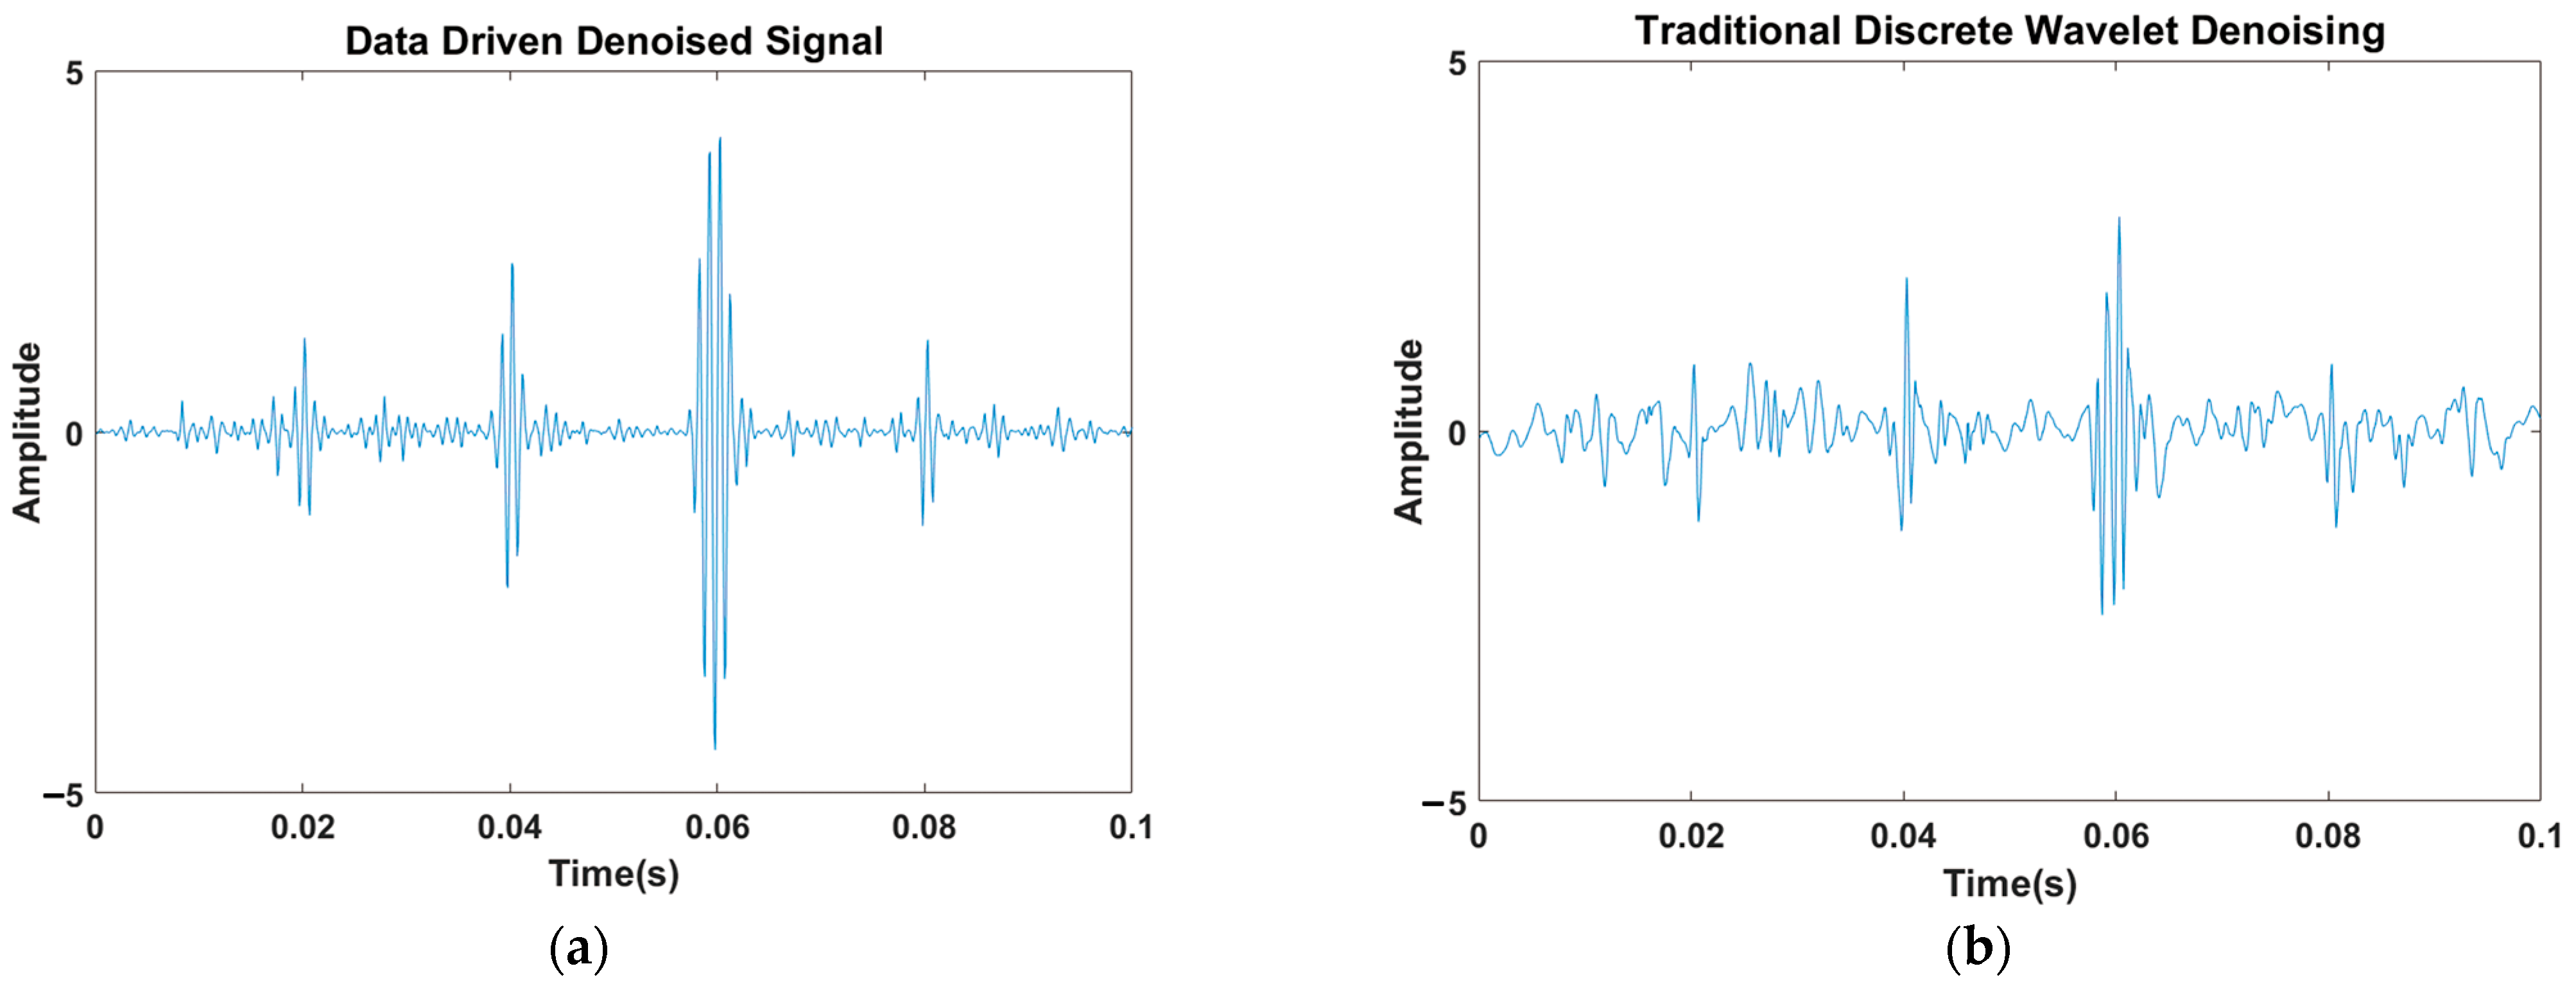
Figure 8.
MSE relative to exact solution (clean signal).
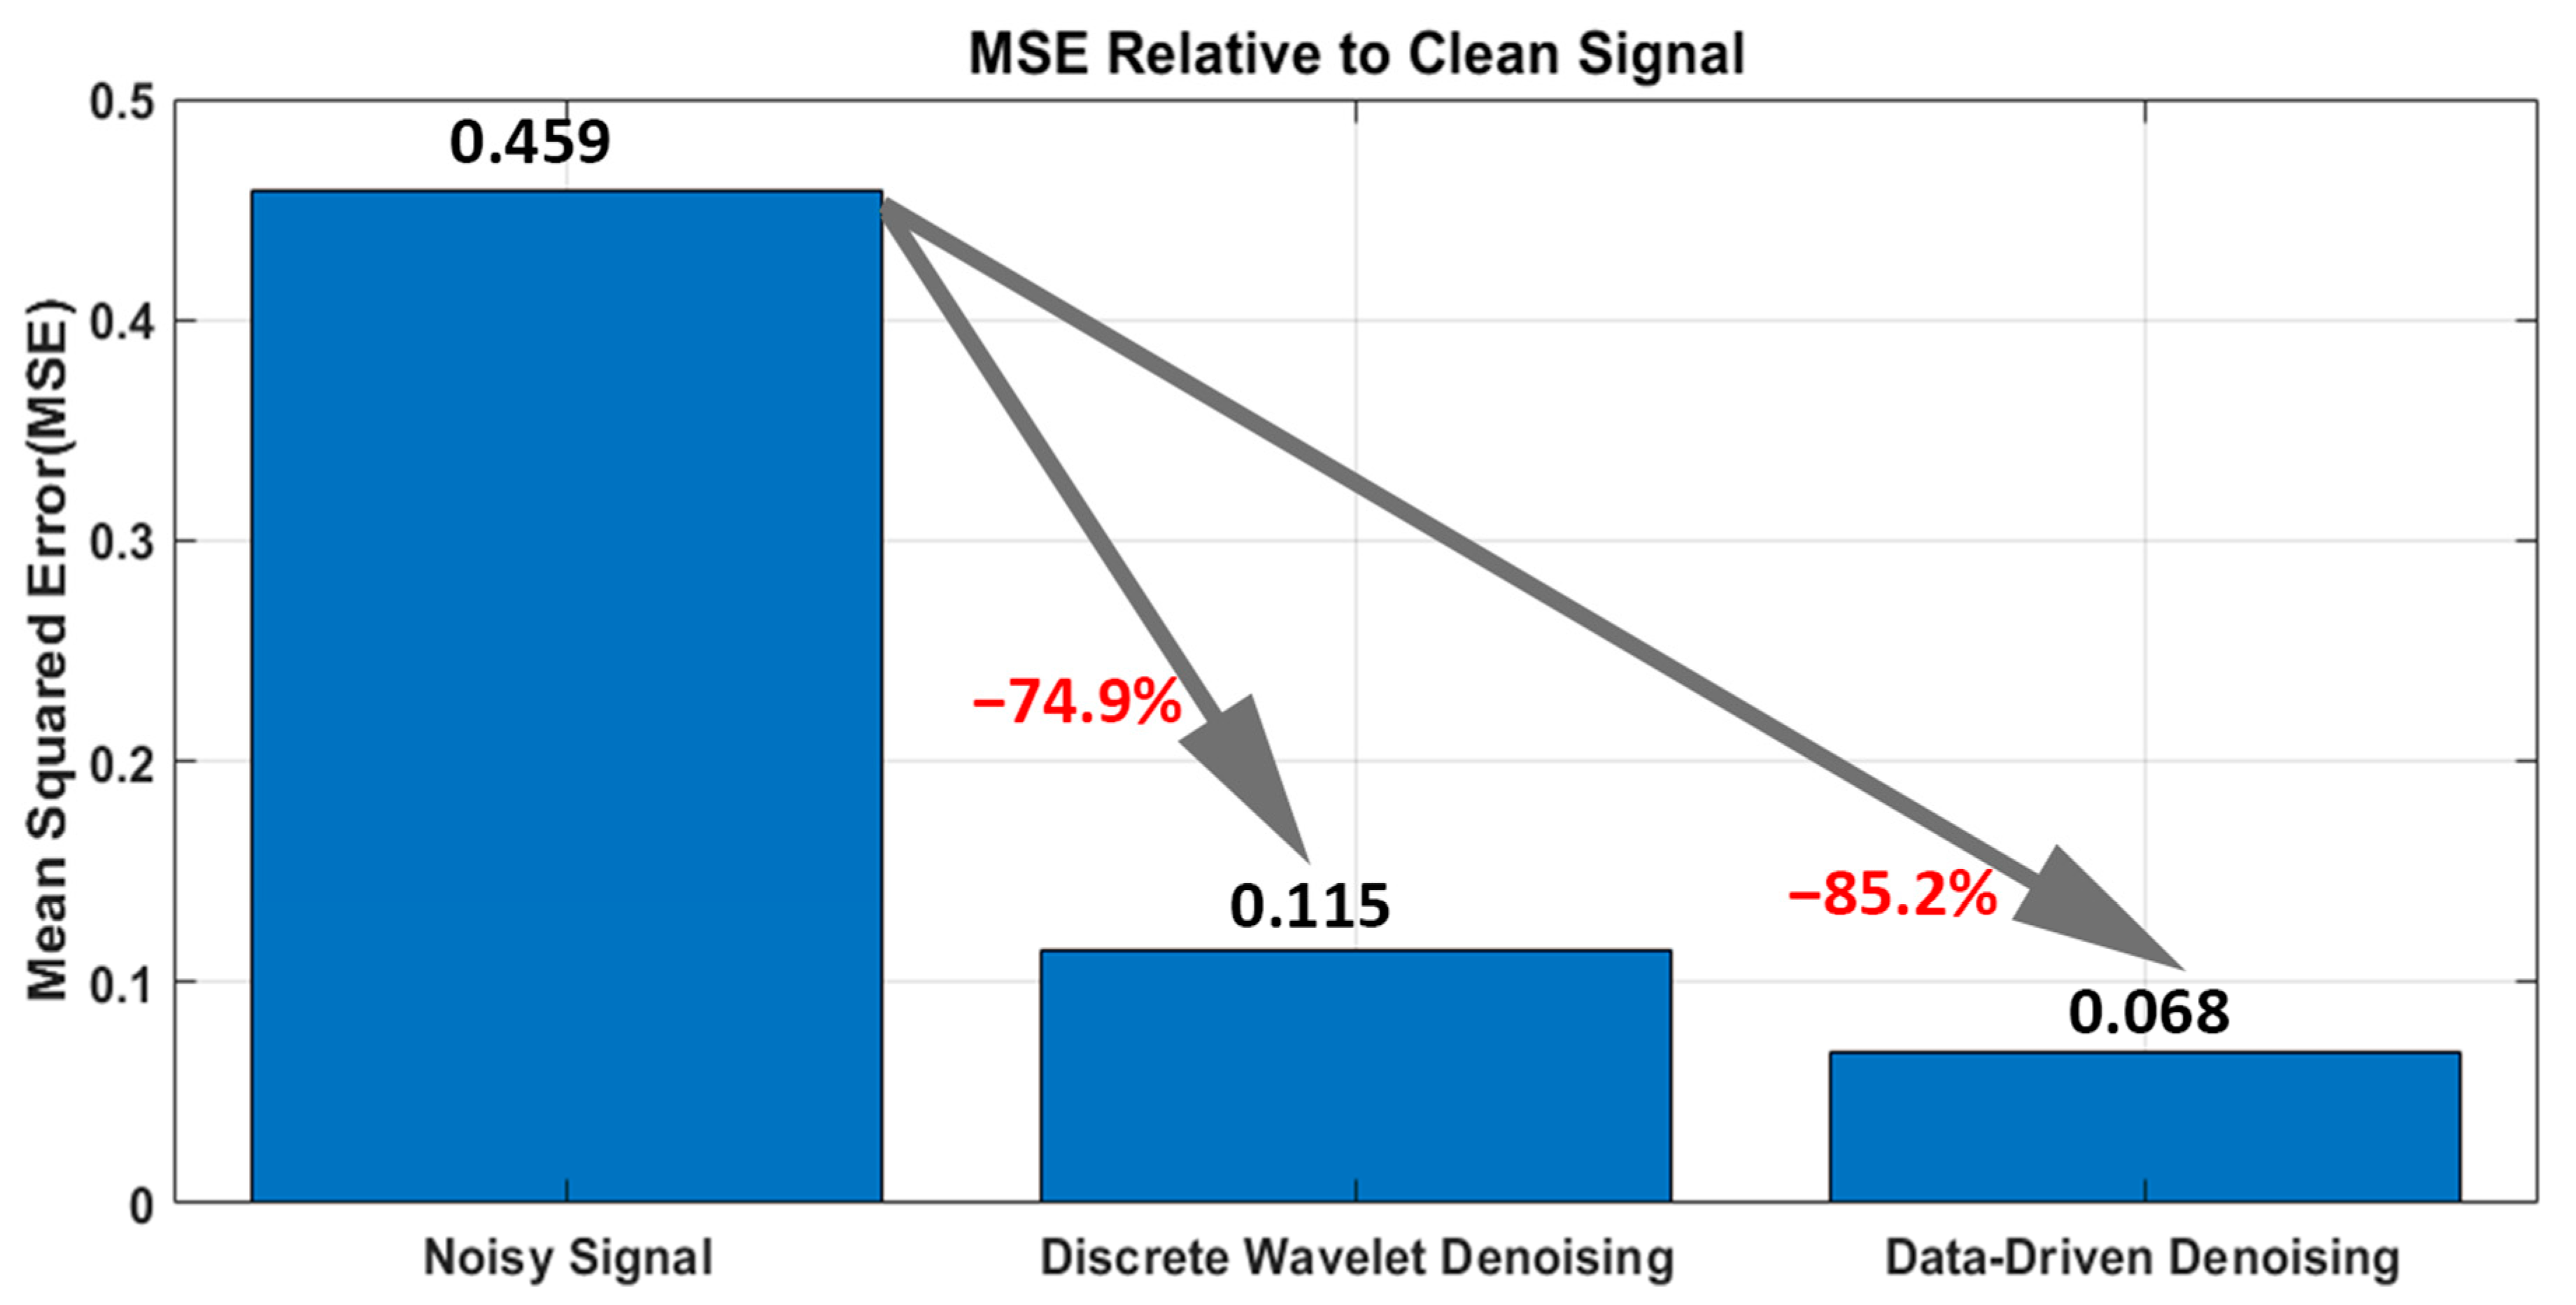
Figure 9.
CLF-60TX injection molding machine.
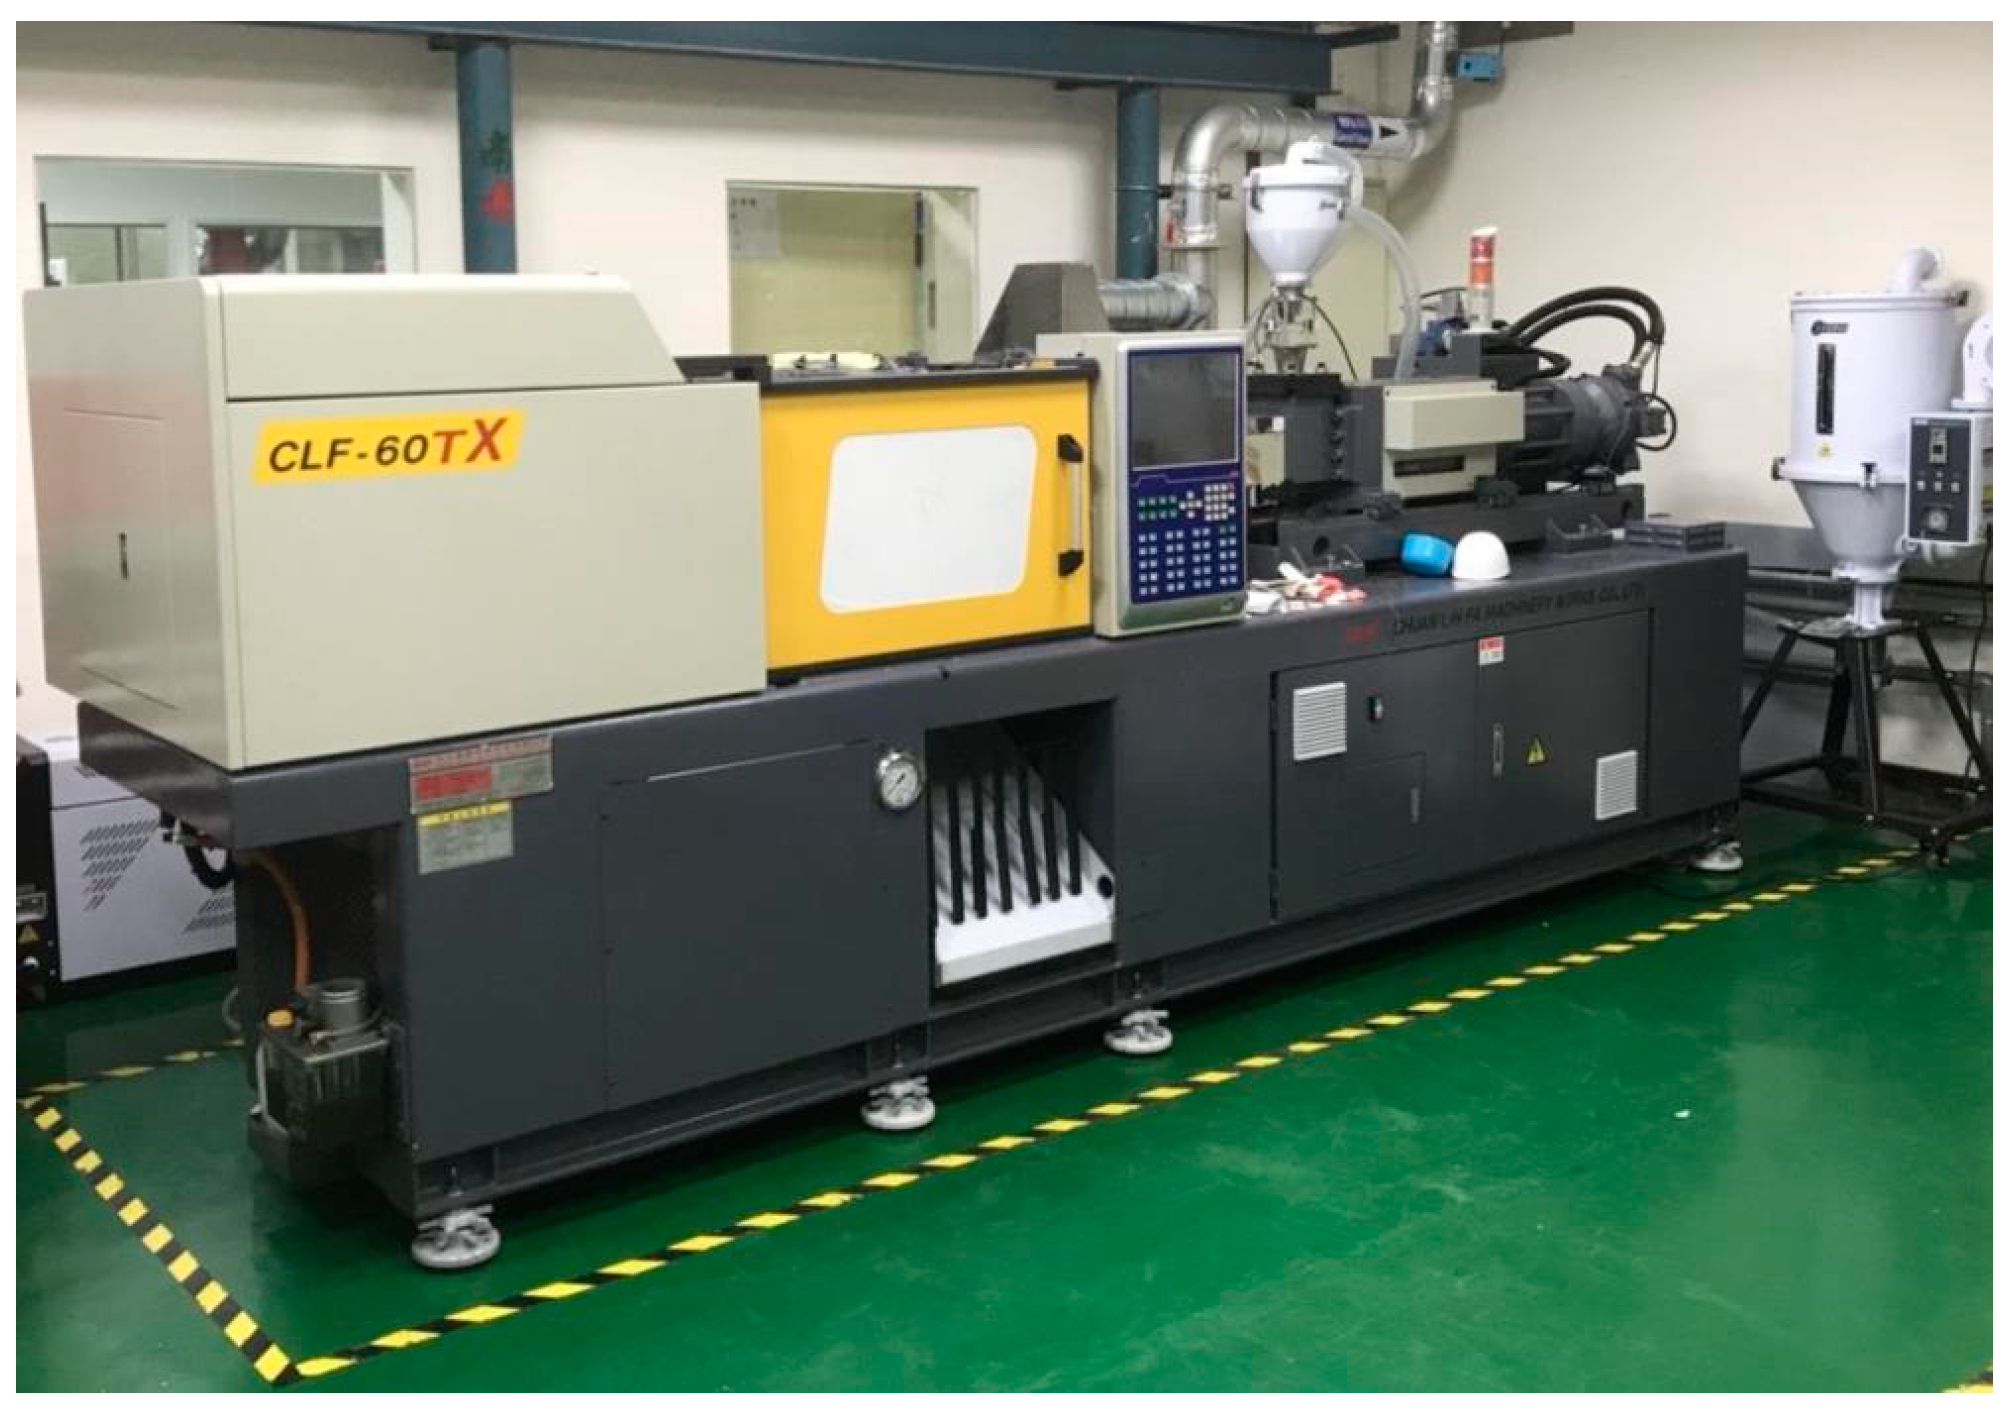
Figure 10.
Schematic of (a) clamped and (b) unclamped injection molding machine with mounted strain and accelerometer sensors; (c) accelerometer mounted on stationary pin of toggle clamping system; (d) strain gauge mounted across tie bar of injection molding machine.
Figure 10.
Schematic of (a) clamped and (b) unclamped injection molding machine with mounted strain and accelerometer sensors; (c) accelerometer mounted on stationary pin of toggle clamping system; (d) strain gauge mounted across tie bar of injection molding machine.
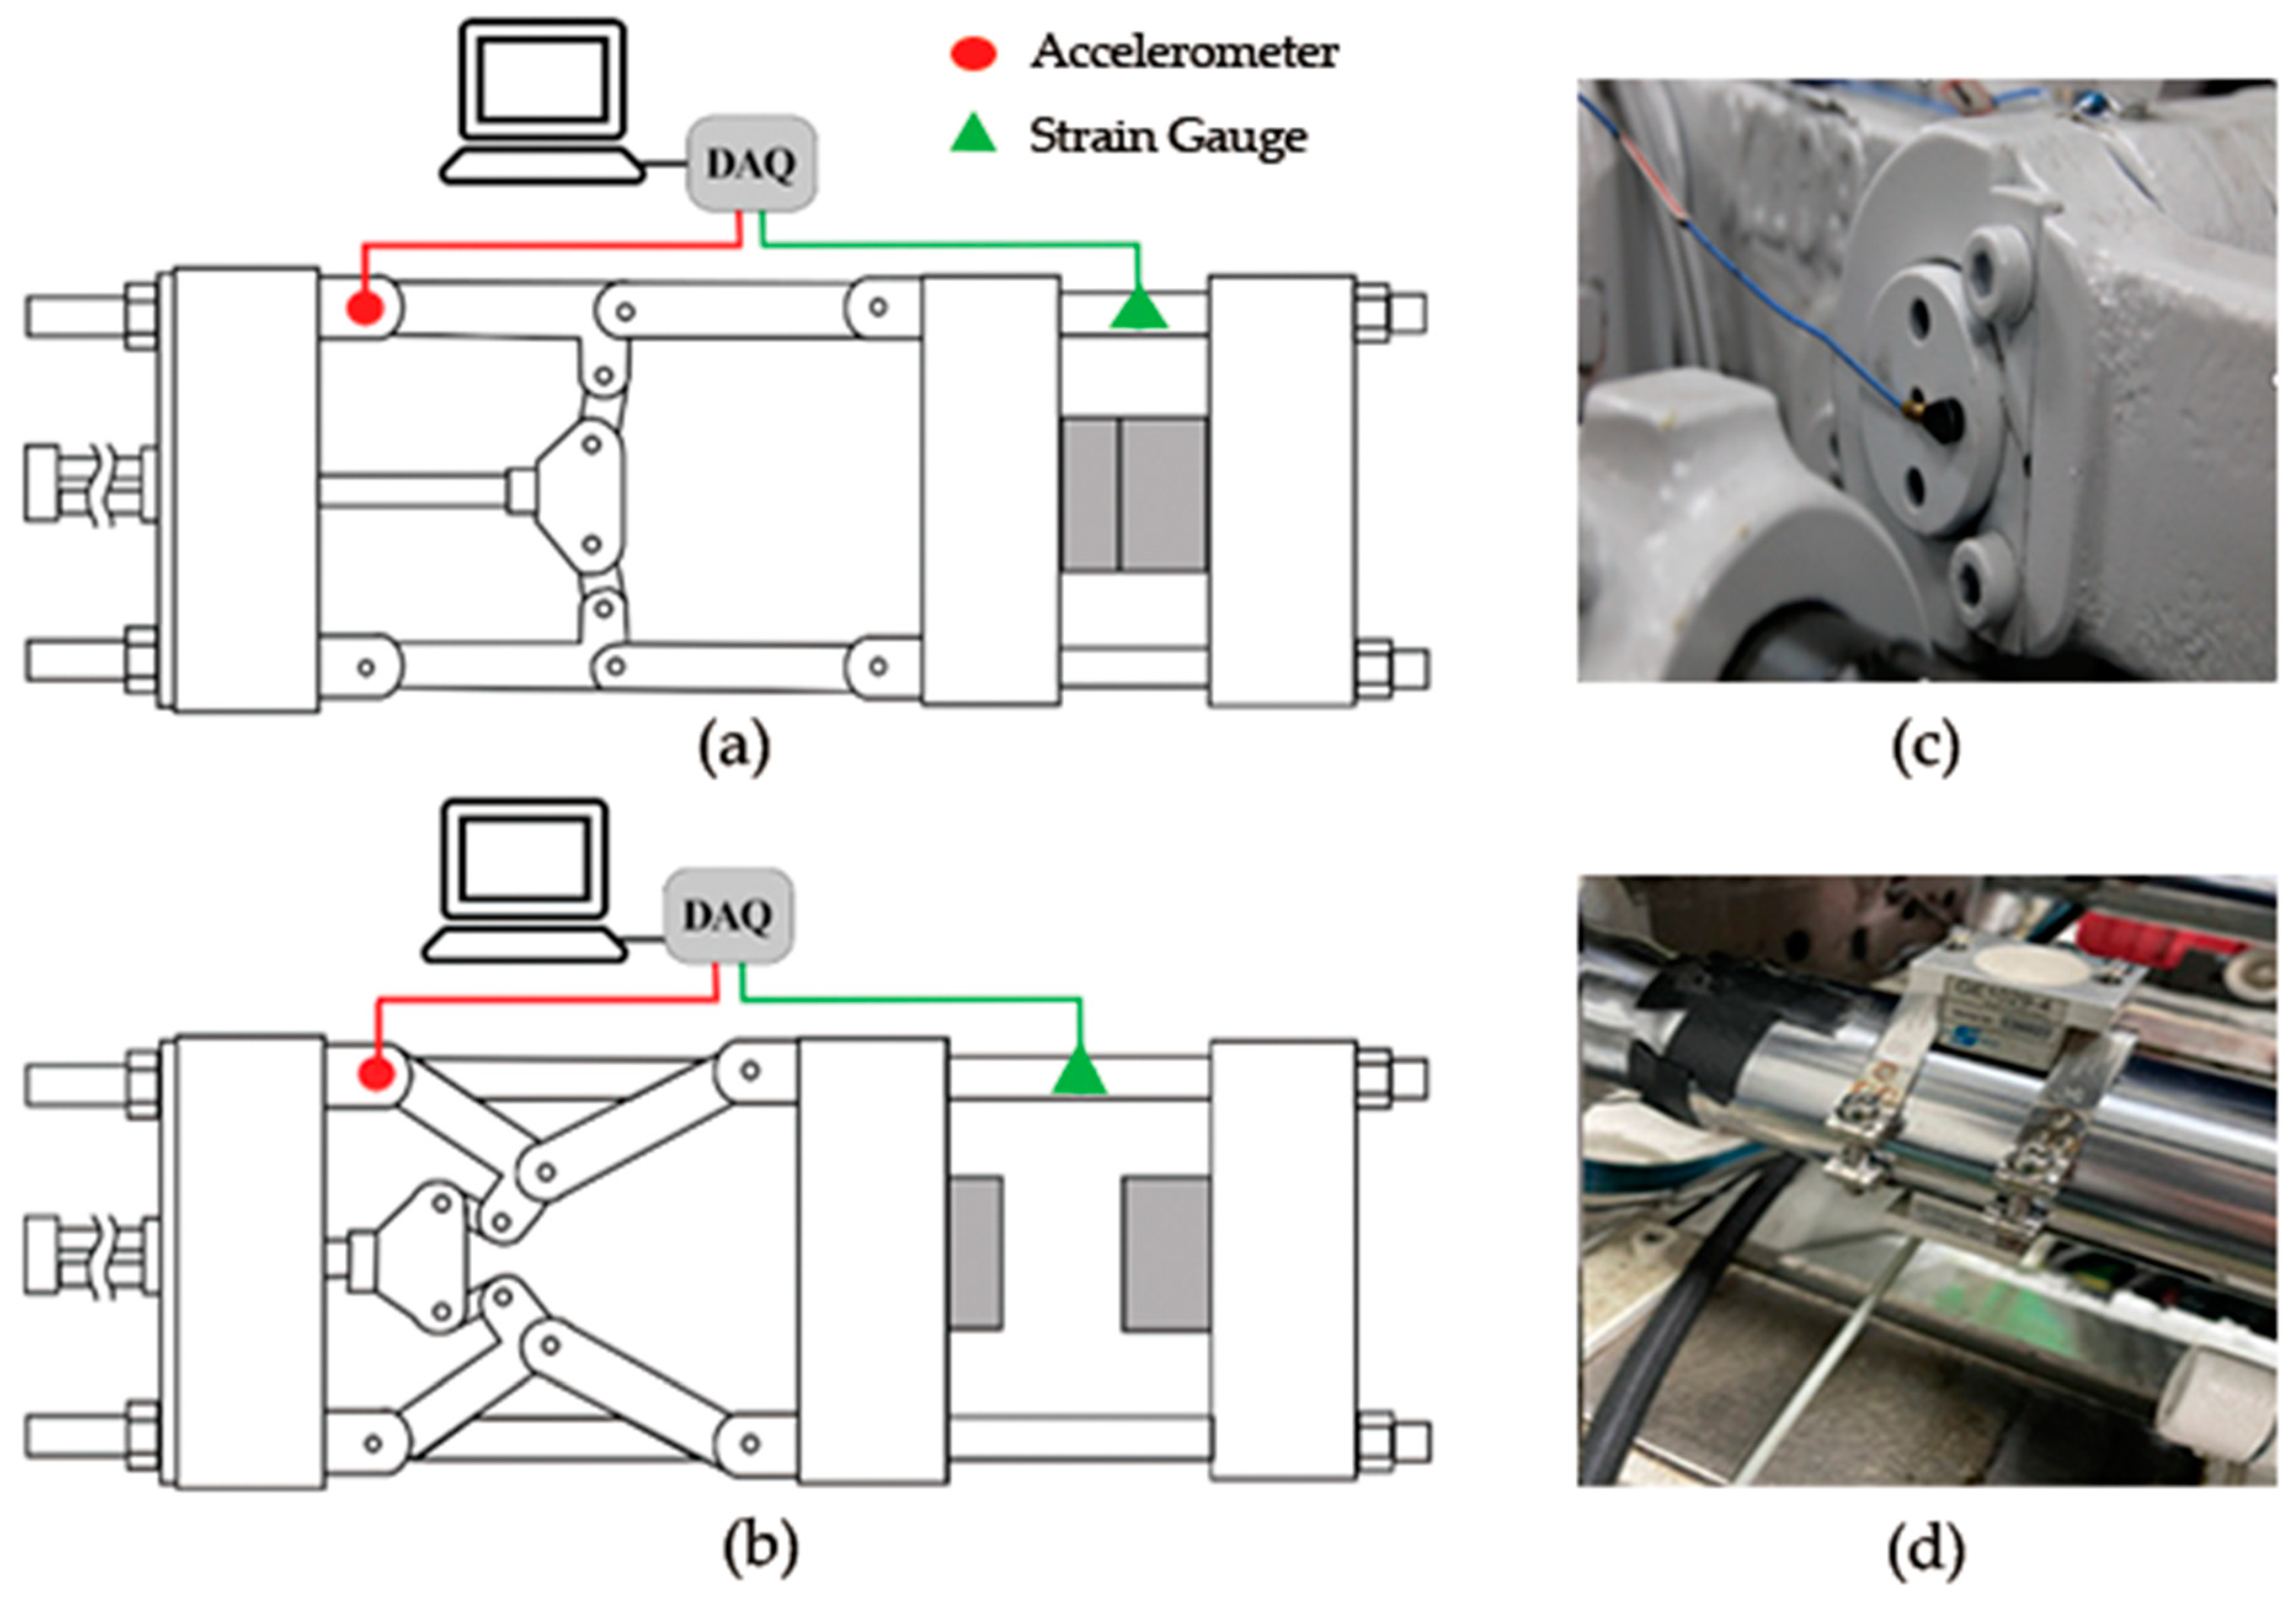
Figure 11.
Analytical procedures of the three data processing methods for the estimation of the Health Indicator (HI) of the toggle bearing.
Figure 11.
Analytical procedures of the three data processing methods for the estimation of the Health Indicator (HI) of the toggle bearing.
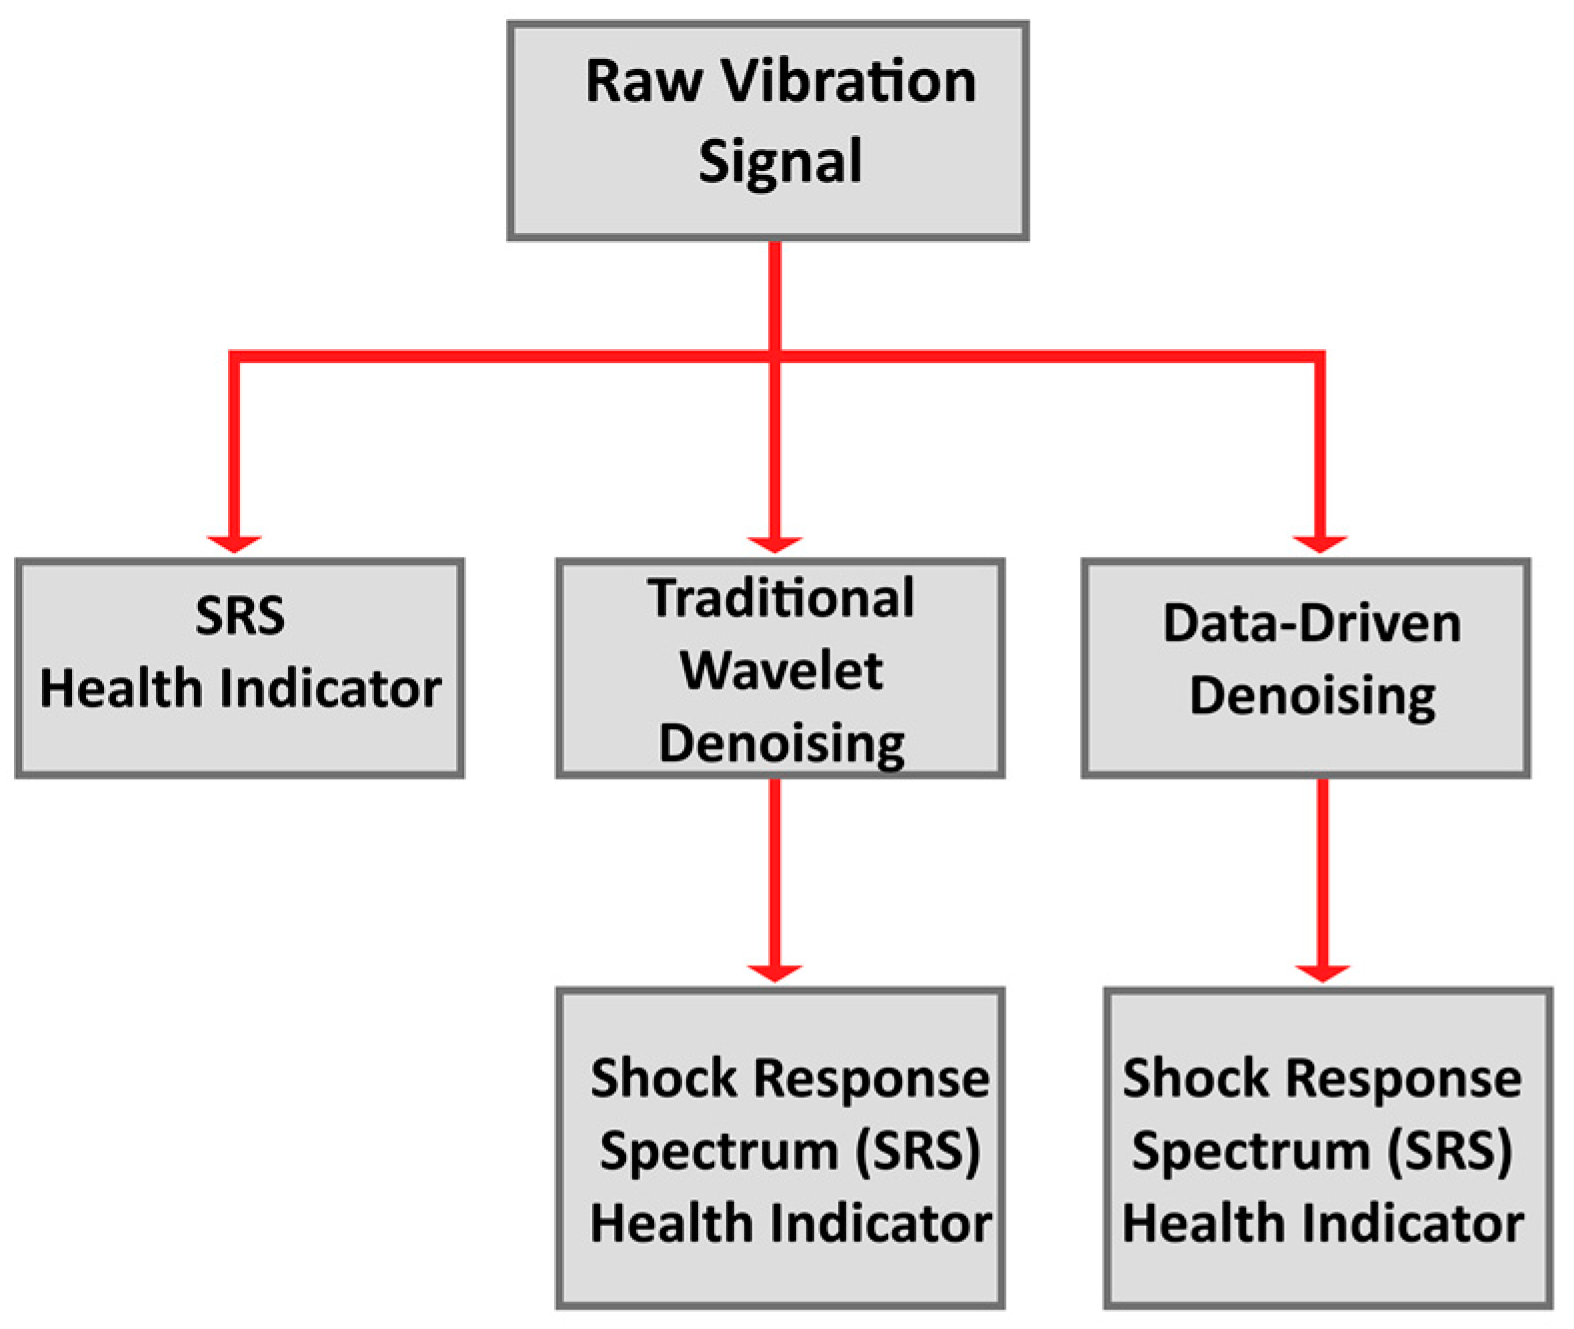
Figure 12.
Data collection profile of the acceleration and strain of a complete plastic injection molding cycle [50], where segment a-b shows the closing of the shaping mold, segment b-c shows the clamping of the shaping mold, segment c-d shows the injection, packing and cooling stages, segment d-e shows the unclamping of the shaping mold and segment e-f shows the stage the shaping mold returns to its origin position.
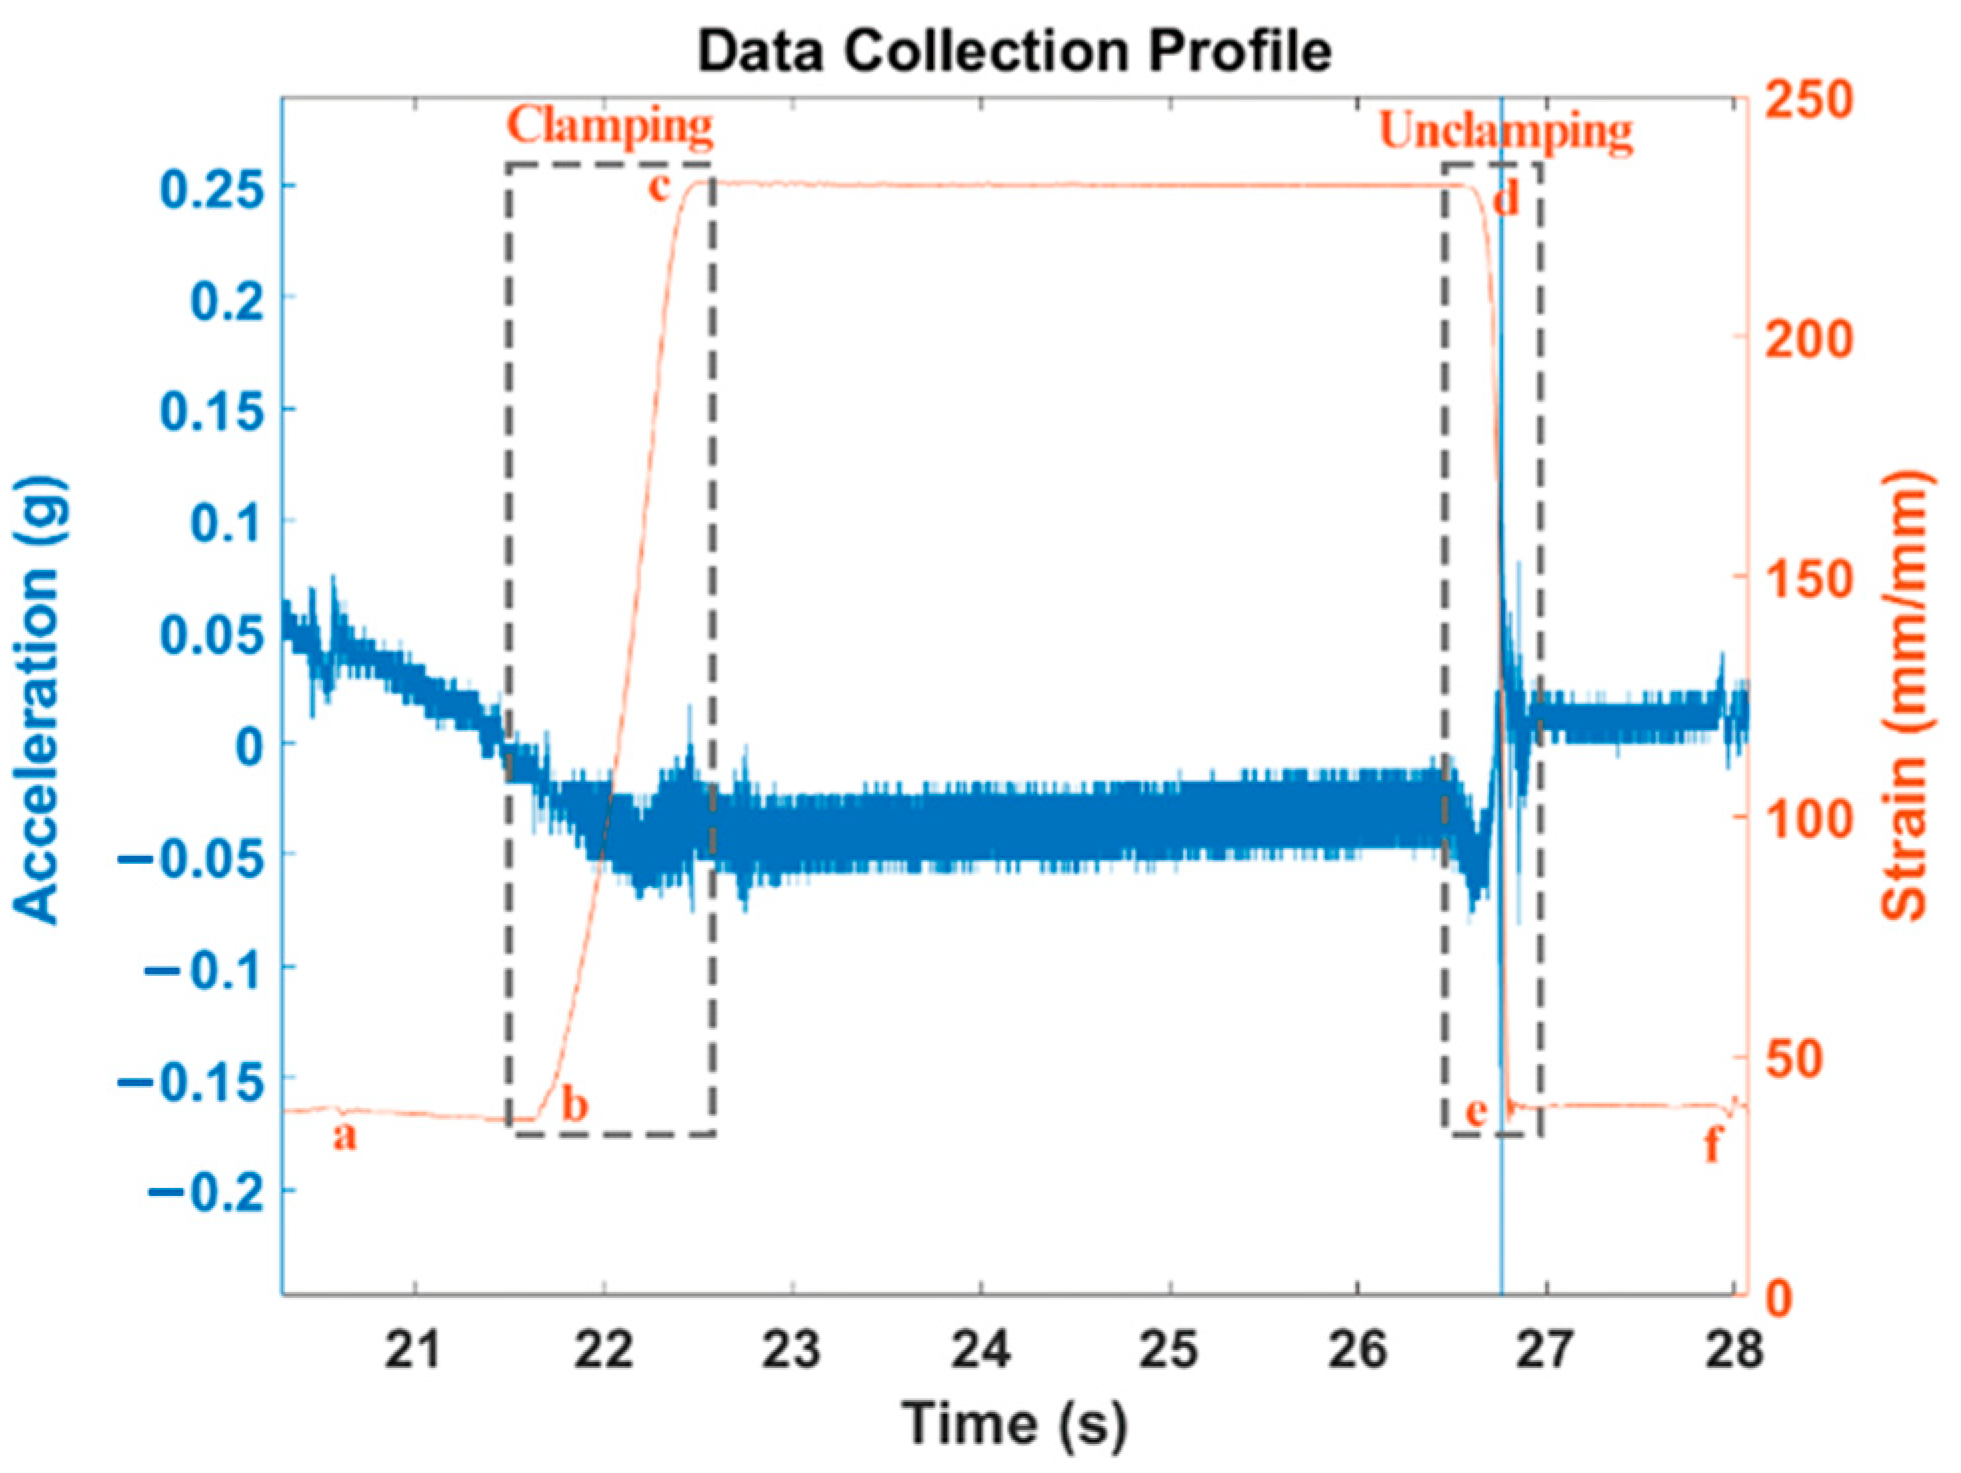
Figure 13.
SRS computed (a) without denoising, (b) after performing the traditional wavelet denoising, (c) after performing the data-driven denoising method.
Figure 13.
SRS computed (a) without denoising, (b) after performing the traditional wavelet denoising, (c) after performing the data-driven denoising method.
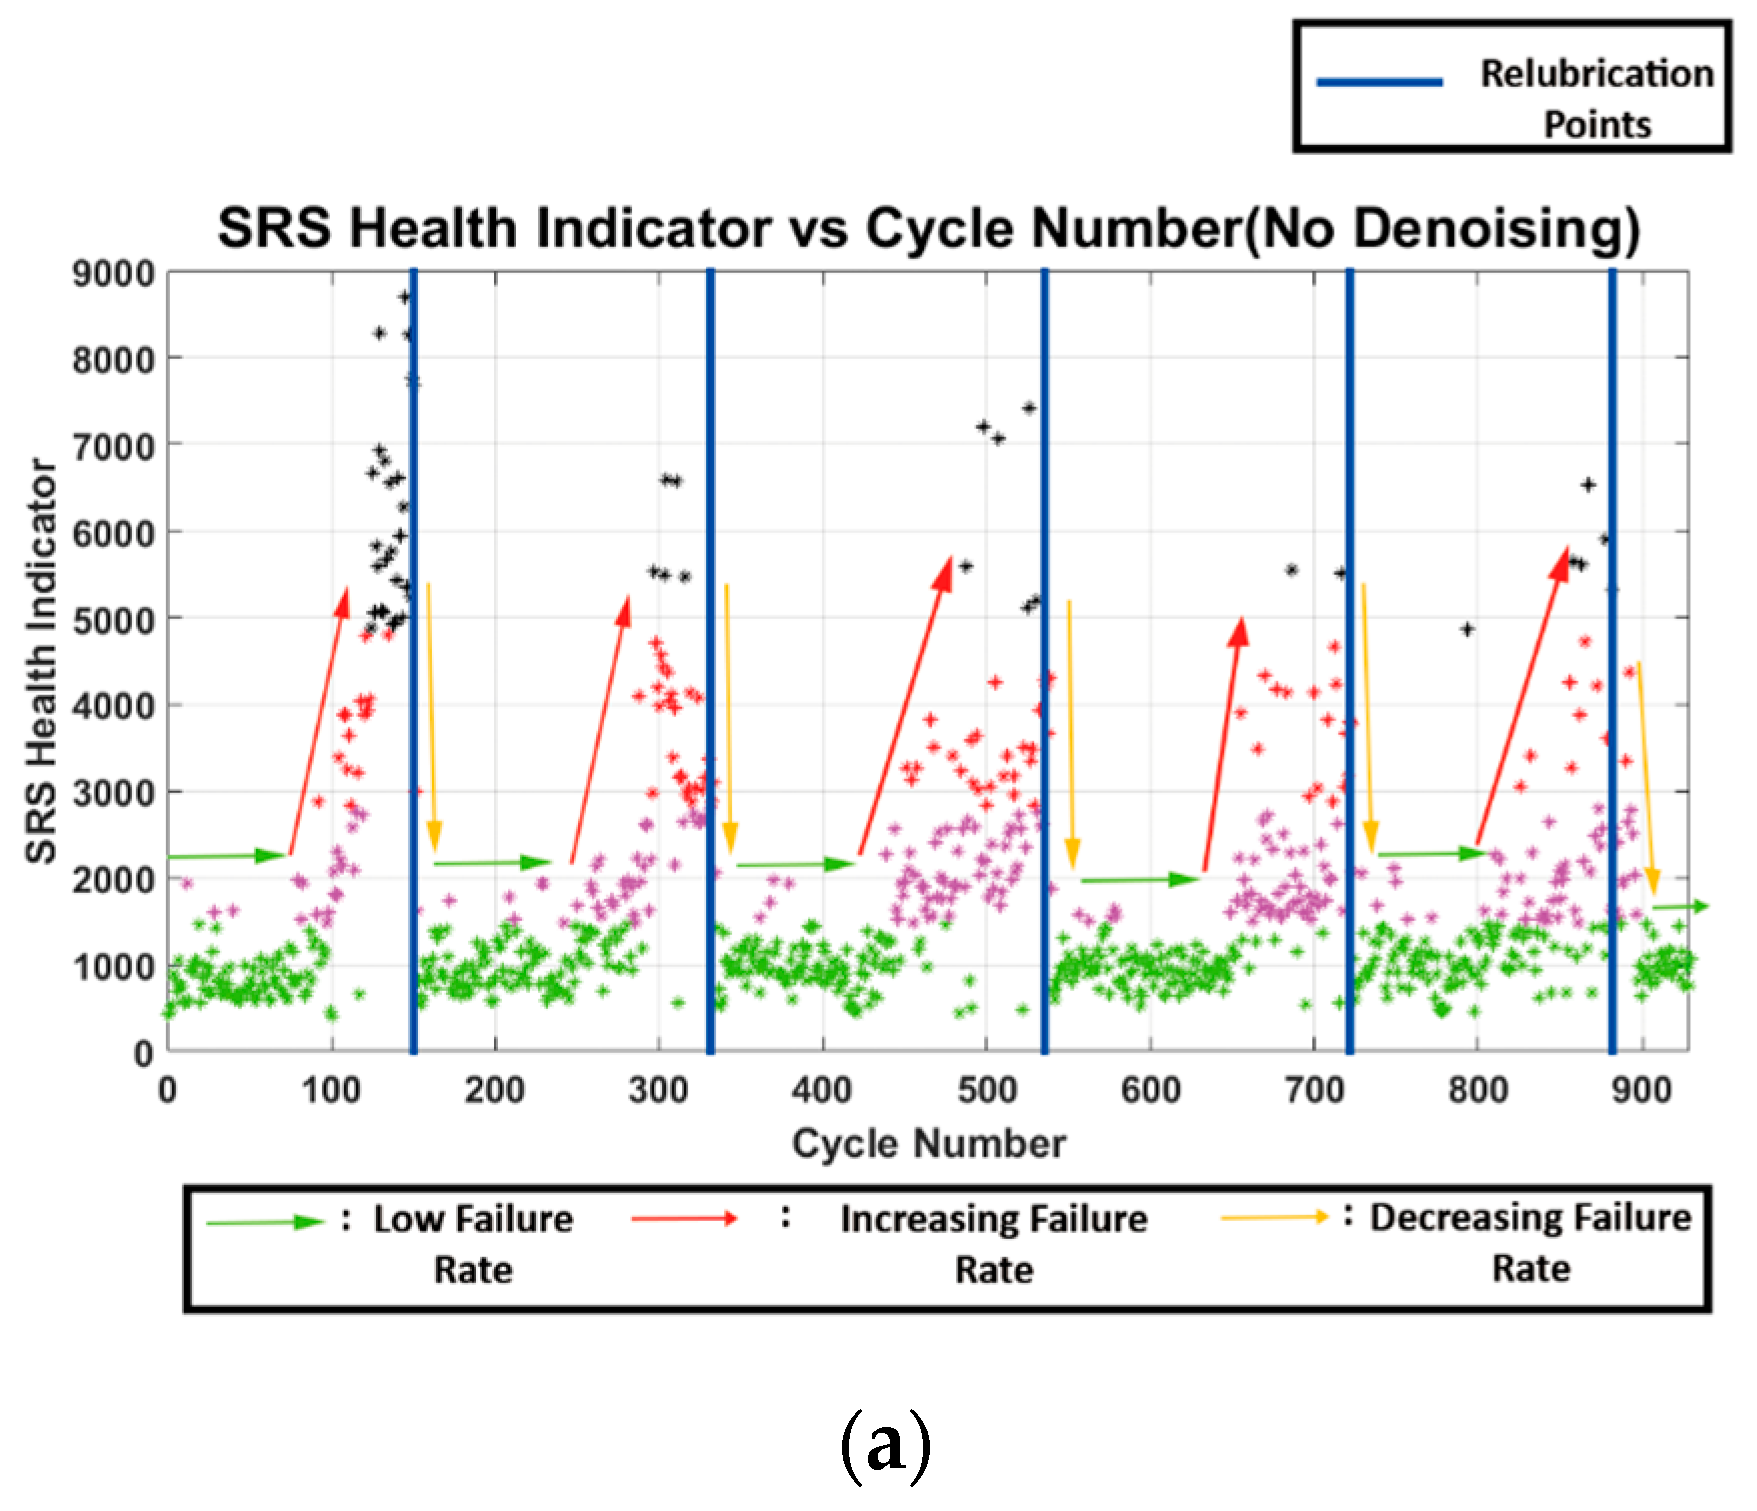
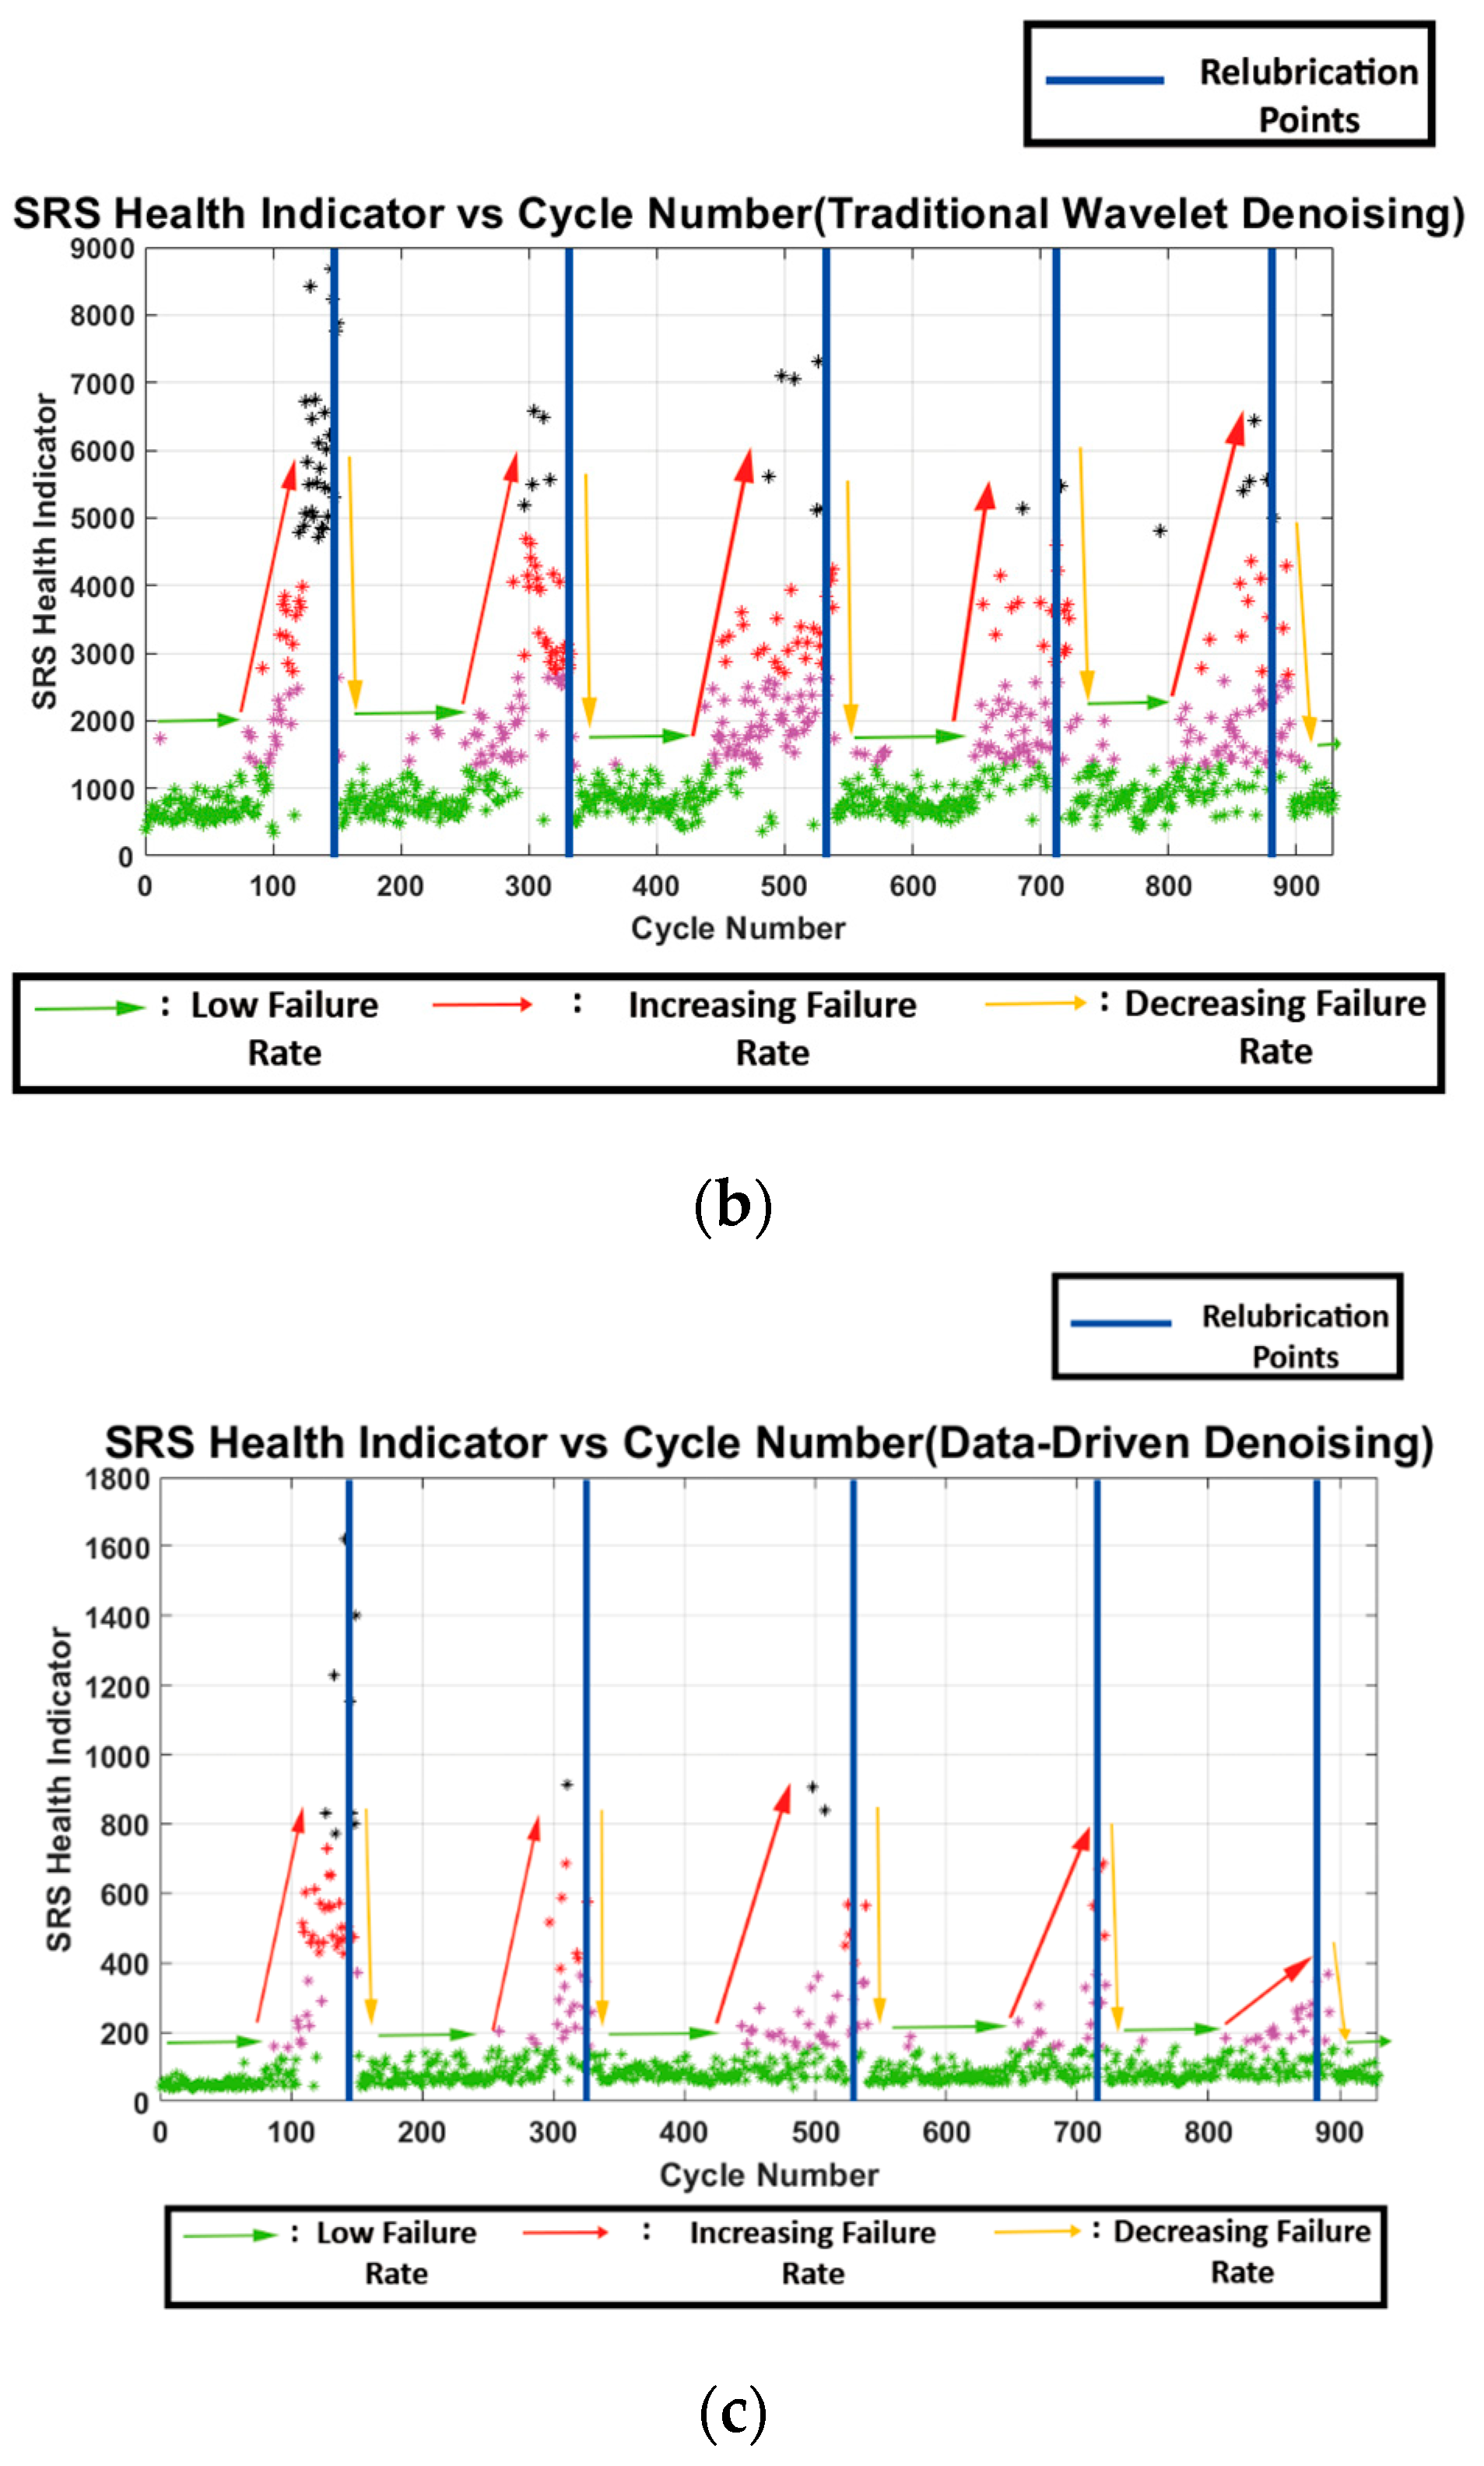
Figure 14.
False positive rate of the raw data, DW denoised data, and DD denoised data.

Table 1.
Input parameters for simulated free damped vibration model.
| Input Parameters | Values |
|---|---|
| Frequency (f0) | 1000 Hz |
| Impulse Period (p) | 0.02 s |
| Damping Ratio (ζ) | 0.01 |
| Sampling Rate (fs) | 10 kHz |
| Initial Magnitude (A) | 1~4 |
| Time Array (t) | Range: 0.0001~0.1 s, Time Steps 0.0001 s |
Disclaimer/Publisher’s Note: The statements, opinions and data contained in all publications are solely those of the individual author(s) and contributor(s) and not of MDPI and/or the editor(s). MDPI and/or the editor(s) disclaim responsibility for any injury to people or property resulting from any ideas, methods, instructions or products referred to in the content. |
© 2023 by the authors. Licensee MDPI, Basel, Switzerland. This article is an open access article distributed under the terms and conditions of the Creative Commons Attribution (CC BY) license (https://creativecommons.org/licenses/by/4.0/).
Share and Cite
MDPI and ACS Style
Morgan, W.J.; Chu, H.-Y. An Unsupervised Vibration Noise Reduction Approach and Its Application in Lubrication Condition Monitoring. Lubricants 2023, 11, 90. https://doi.org/10.3390/lubricants11020090
AMA Style
Morgan WJ, Chu H-Y. An Unsupervised Vibration Noise Reduction Approach and Its Application in Lubrication Condition Monitoring. Lubricants. 2023; 11(2):90. https://doi.org/10.3390/lubricants11020090
Chicago/Turabian StyleMorgan, Wani J., and Hsiao-Yeh Chu. 2023. "An Unsupervised Vibration Noise Reduction Approach and Its Application in Lubrication Condition Monitoring" Lubricants 11, no. 2: 90. https://doi.org/10.3390/lubricants11020090
Note that from the first issue of 2016, this journal uses article numbers instead of page numbers. See further details here.