Article

Deterioration Mechanism and Status Prediction of Hydrocarbon Lubricants under High Temperatures and Humid Environments

1
School of Mechatronic Engineering, Xi’an Technological University, Xi’an 710021, China
2
National and Local Joint Engineering Research Center for Precision and Ultra−Precision Machining and Measurement, Xi’an Technological University, Xi’an 710021, China
3
Shaanxi Province Institute of Water Resources and Electric Power Investigation and Design, Xi’an 710001, China
*
Author to whom correspondence should be addressed.
Lubricants 2024, 12(4), 116; https://doi.org/10.3390/lubricants12040116
Submission received: 28 February 2024 / Revised: 20 March 2024 / Accepted: 25 March 2024 / Published: 31 March 2024

Abstract

:
In practical engineering applications, high temperatures and water ingress seriously affect the service life of hydrocarbon lubricants. In this study, the deterioration process of hydrocarbon lubricants under high temperatures and humid environments was investigated, and a new health state prediction model was proposed. Simulation of hydrocarbon lubricant Polyalpha−olefin (PAO) molecules used the ReaxFF force field to analyse the high temperature thermal oxidation process of lubricants. The rheological properties of oil−water emulsions were determined by observing the morphology of oil−water two−phase mixtures with different water contents. A multiparameter fusion viscosity prediction model was proposed using a linear model of the viscosity of aqueous fluids, as affected by temperature and water content, and was fitted with the Andrade viscosity−temperature equation to predict lubricant viscosity changes under multiple parameters. Online validation tests were carried out on a compound planetary transmission system, and the surface topographical parameters of the transmission components were further discussed. Experimental results show that the linear correlation with the improved lubricant viscosity prediction model is 0.966, and the surface wear of transmission components is consistent with the trend of lubricant quality change. These findings provide a fundamental basis for the assessment of lubricant service life in high temperatures and humid environments.

Graphical Abstract

1. Introduction

During the operation of mechanical equipment, the lubricant’s physical and chemical properties are altered, due to the combined effects of high temperature, water, and air. The degradation of lubricant will directly affect the lubrication performance, resulting in corrosion and wear of mechanical equipment. Therefore, analyzing lubricant degradation mechanisms and predicting service life are particularly important.
There are three main failure modes of machine parts: corrosion, fracture, and wear [1,2,3], in which wear accounts for the largest proportion, about 60–80%, and consumes nearly one−third−half of the energy [4,5]. Therefore, the technology of reducing frictional resistance and wear is an effective way to save energy, prolong the service life of mechanical equipment, and improve its working reliability [6,7]. Lubricants can be added between the contact surfaces in relative motion to improve the friction state of the friction pair, thereby reducing frictional resistance and slowing down the wear [8,9]. As early as before christ, people used animal grease and other liquids as lubricants to reduce friction between contact parts, such as in the transportation of giant stones in the pyramids of Egypt and the construction of the Great Wall of China [10]. Before the 1930s, additive−free lubrication (base oils) could basically meet the daily needs of life at that time. However, with the rapid development of modern industry, higher requirements are now being imposed on equipment load, speed, and temperature. Conventional mineral lubricants have difficulty meeting these demanding lubrication requirements. To guarantee the normal operation of mechanical equipment, people pay more and more attention to synthetic lubricants with excellent performance, high reliability, long service life, and biodegradability. Synthetic lubricants can be designed for molecular composition, structure, and function according to people’s needs. They play an important role in extreme working conditions and have been widely used in the lubrication of various equipment components [11]. Synthetic lubricants mainly include synthetic hydrocarbon oil, polyether oil, lipid oil, halogenated hydrocarbon oil, silicone oil, etc. [12]. At present, hydrocarbon synthetic oils account for 42% of the global synthetic lubricant market [13]. Typically, PAO is the most widely used synthetic hydrocarbon base lubricant. It exhibits good thermal oxidation stability, excellent high− and low−temperature lubrication performance, a low pour point, low volatility, good oil seal compatibility, excellent shear stability, and a high viscosity index [14]. Therefore, with the increasingly strict requirements for lubricant specifications, the demand for high−quality synthetic lubricant is growing, and PAO has become one of the fastest growing varieties in the synthetic lubricant market.
In practical engineering applications, the performance of lubricant will be affected by diverse factors, such as mechanical stress, friction heat, high temperature, irradiation, moisture, and metal catalysis. Among them, high temperature thermal oxidation and moisture intervention have the greatest impact on the service performance of lubricants. In recent years, many scholars have studied the high temperature thermal oxidation of lubricants. In the process of comparing the lubricating properties of PAO base oils and mineral base oils, Wang et al. [15] found that PAO with the same viscosity and mineral oils had better film formation at high temperatures, and the viscosity index of PAO was higher than that of mineral oils at 150 °C. And they studied three kinds of base oils with different molecular structures, and found that base oils with a linear molecular structure have higher viscosity and less wear at high temperatures. Zhang et al. [16] compared PAO with the other three base oils through viscosity, friction, and wear tests. Fei et al. [17] used gas chromatography/mass spectrometry (GC/MS), Fourier−transform infrared spectroscopy (FTIR), and other detection methods to study the physical and chemical properties, as well as chemical structure changes of PAO, after high−temperature oxidation. It was found that less than 10% of PAO molecules were cleaved into small molecules of n−alkanes, iso−alkanes, and olefins. However, when the temperature rose to 300 °C, the relative content of cracked molecules reached nearly 30%, and the relative content of iso−paraffins and olefins increased significantly. The generation of a large number of small molecules reduced the intermolecular force of PAO, shortened the branched chain, reduced the viscosity of the oil, and increased the pour point. At high temperatures, the lubricant generated compounds that alter its viscosity also produced small amounts of water molecules.
Meanwhile, during the operation of mechanical equipment, the intervention of water inevitably leads to lubricant contamination, thus forming oil−water two−phase flow lubrication. Research on lubricant water contamination has been reported in the literature, which mainly focuses on the conversion of oil and water fluid phases when water intervenes in the lubricant, the effect on the lubricant viscosity, and the corrosion of mechanical equipment [18]. The two−phase transition of oil−water fluid refers to the transition of fluid, from the water−in−oil type to the oil−in−water type, with the increase of water content in lubricants. Harika [19] conducted experimental research on the rheological behavior of an oil−water mixture without any additives, measured the viscosity at five temperatures, from 10 °C to 80 °C, and defined the model of the viscosity in an oil−water mixture varying with temperature and concentration. Subsequently, they found, through experiments, that within a certain range of water content, the intervention of water in lubricant has a significant effect on the viscosity and temperature of the fluid. They pointed out that the lubrication effect of a water−in−oil two−phase fluid is superior to that of traditional pure oil lubrication. Luo et al. [20,21] found from the test that after water is mixed in the lubricant, with the water content increases, the viscosity of the oil−water two−phase fluid increases first and then decreases rapidly, reaching a maximum water content of about 30%. Dittes et al. [22] studied the corrosivity of water contamination of lubricating oils, and they found the corrosion rate increased proportionally as the water content in the lubricant increased from 0.3% to 5.0%. Lu et al. [23] found that the coefficient of friction increases with increasing free water content under oil lubrication conditions, causing severe wear, deformation, and oxidation. Qin and Doll [24] found that water contamination in oil accelerates the formation of micro−pitting and rolling contact fatigue cracks, which can corrode the cracked interface. The above scholars primarily focus on the changes of physical and chemical characteristics during the thermal oxidation of hydrocarbon lubricant, as well as the impact of water pollution on the viscosity of the lubricant. However, there appears to be limited mutual confirmation between simulation and testing regarding the degradation process of hydrocarbon lubricant due to thermal oxidation. In addition, the interaction of multiple factors, such as temperature and moisture, on the degradation of lubricant viscosity is not adequately addressed.
In fact, the viscosity of fluid is a reflection of its internal friction. The greater the internal friction of the fluid, the greater its viscosity, making flow more difficult, and vice versa. The two effects of intermolecular attraction and kinetic energy transfer together govern the magnitude of fluid viscosity [25]. For liquids, due to the slow motion and short distance of molecules, it is mainly the intermolecular hydrogen bonds and intermolecular forces that play a role. As the temperature decreases, the kinetic energy of liquid molecular motion decreases, the molecular spacing decreases, and the attractive forces increase, leading to an increase in viscosity [26]. To enhance the assessment of lubricant friction performance, numerous scholars, both domestically and abroad, have conducted quantitative analyses of the relationship between lubricant viscosity and temperature. At present, the Andrade equation, Walther equation, Vogel equation, Reynolds equation, and Slote equation have been commonly used internationally to describe the lubricant viscosity−temperature relationship [27,28,29,30]. Among them, the Andrade equation, Walther equation, and Vogel equation have been suitable for a wider temperature limit, which can more accurately describe the viscosity−temperature variation of lubricant. However, the specific viscosity−temperature relationships of different types and compositions of lubricants are different. Therefore, different viscosity−temperature models are used to obtain the best viscosity−temperature equations by fitting different oil viscosity−temperature data and analysing the fitting accuracies through comparison, which is significant for predicting the viscosity changes of lubricant at other temperatures and evaluating the overall performance of the oils.
To address the above issues, this paper conducted the following four studies. (1) Taking hydrocarbon lubricant as the research object, the high temperature thermal oxidation process of the PAO molecule in hydrocarbon lubricant was simulated by using a ReaxFF force field. (2) In order to further explain the reason for the viscosity change of the lubricant, emulsified oil with varying water content was observed. The micro−droplets and macro−morphology of the oil−water two−phase mixture were analysed. (3) By detecting the linear relationship between the viscosity of lubricant affected by temperature and water content and fitting the existing Andrade viscosity−temperature equation, a high−precision prediction model of lubricant viscosity was established. It was then combined with the threshold line method to determine the safety state threshold of the lubricant viscosity. (4) Using the compound planetary gearbox test rig as the carrier, online validation experiments were conducted with the planetary gear friction subassembly as the research object, to verify the accuracy of the lubricant viscosity prediction model. Three−dimensional (3D) morphology of white light interference (WLI) and scanning electron microscope (SEM) acquisition were used to characterize the surface morphology of transmission components, to study the effect of lubricant quality change on the surface wear of transmission components. This study provides guidance for the analysis of the deterioration mechanism of hydrocarbon lubricant and the prediction of the lubricant service life in high temperatures and humid environments.

2. Materials and Methods

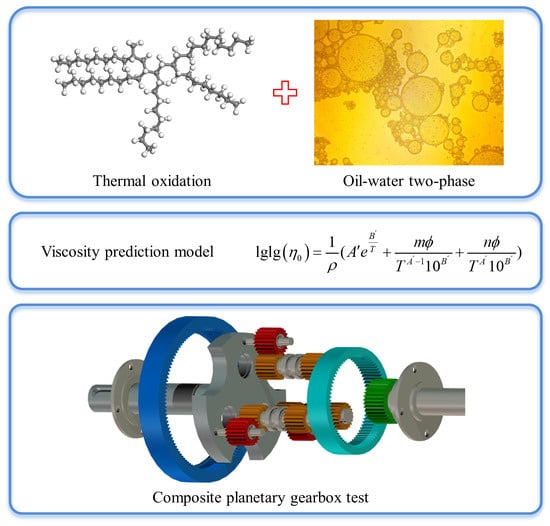
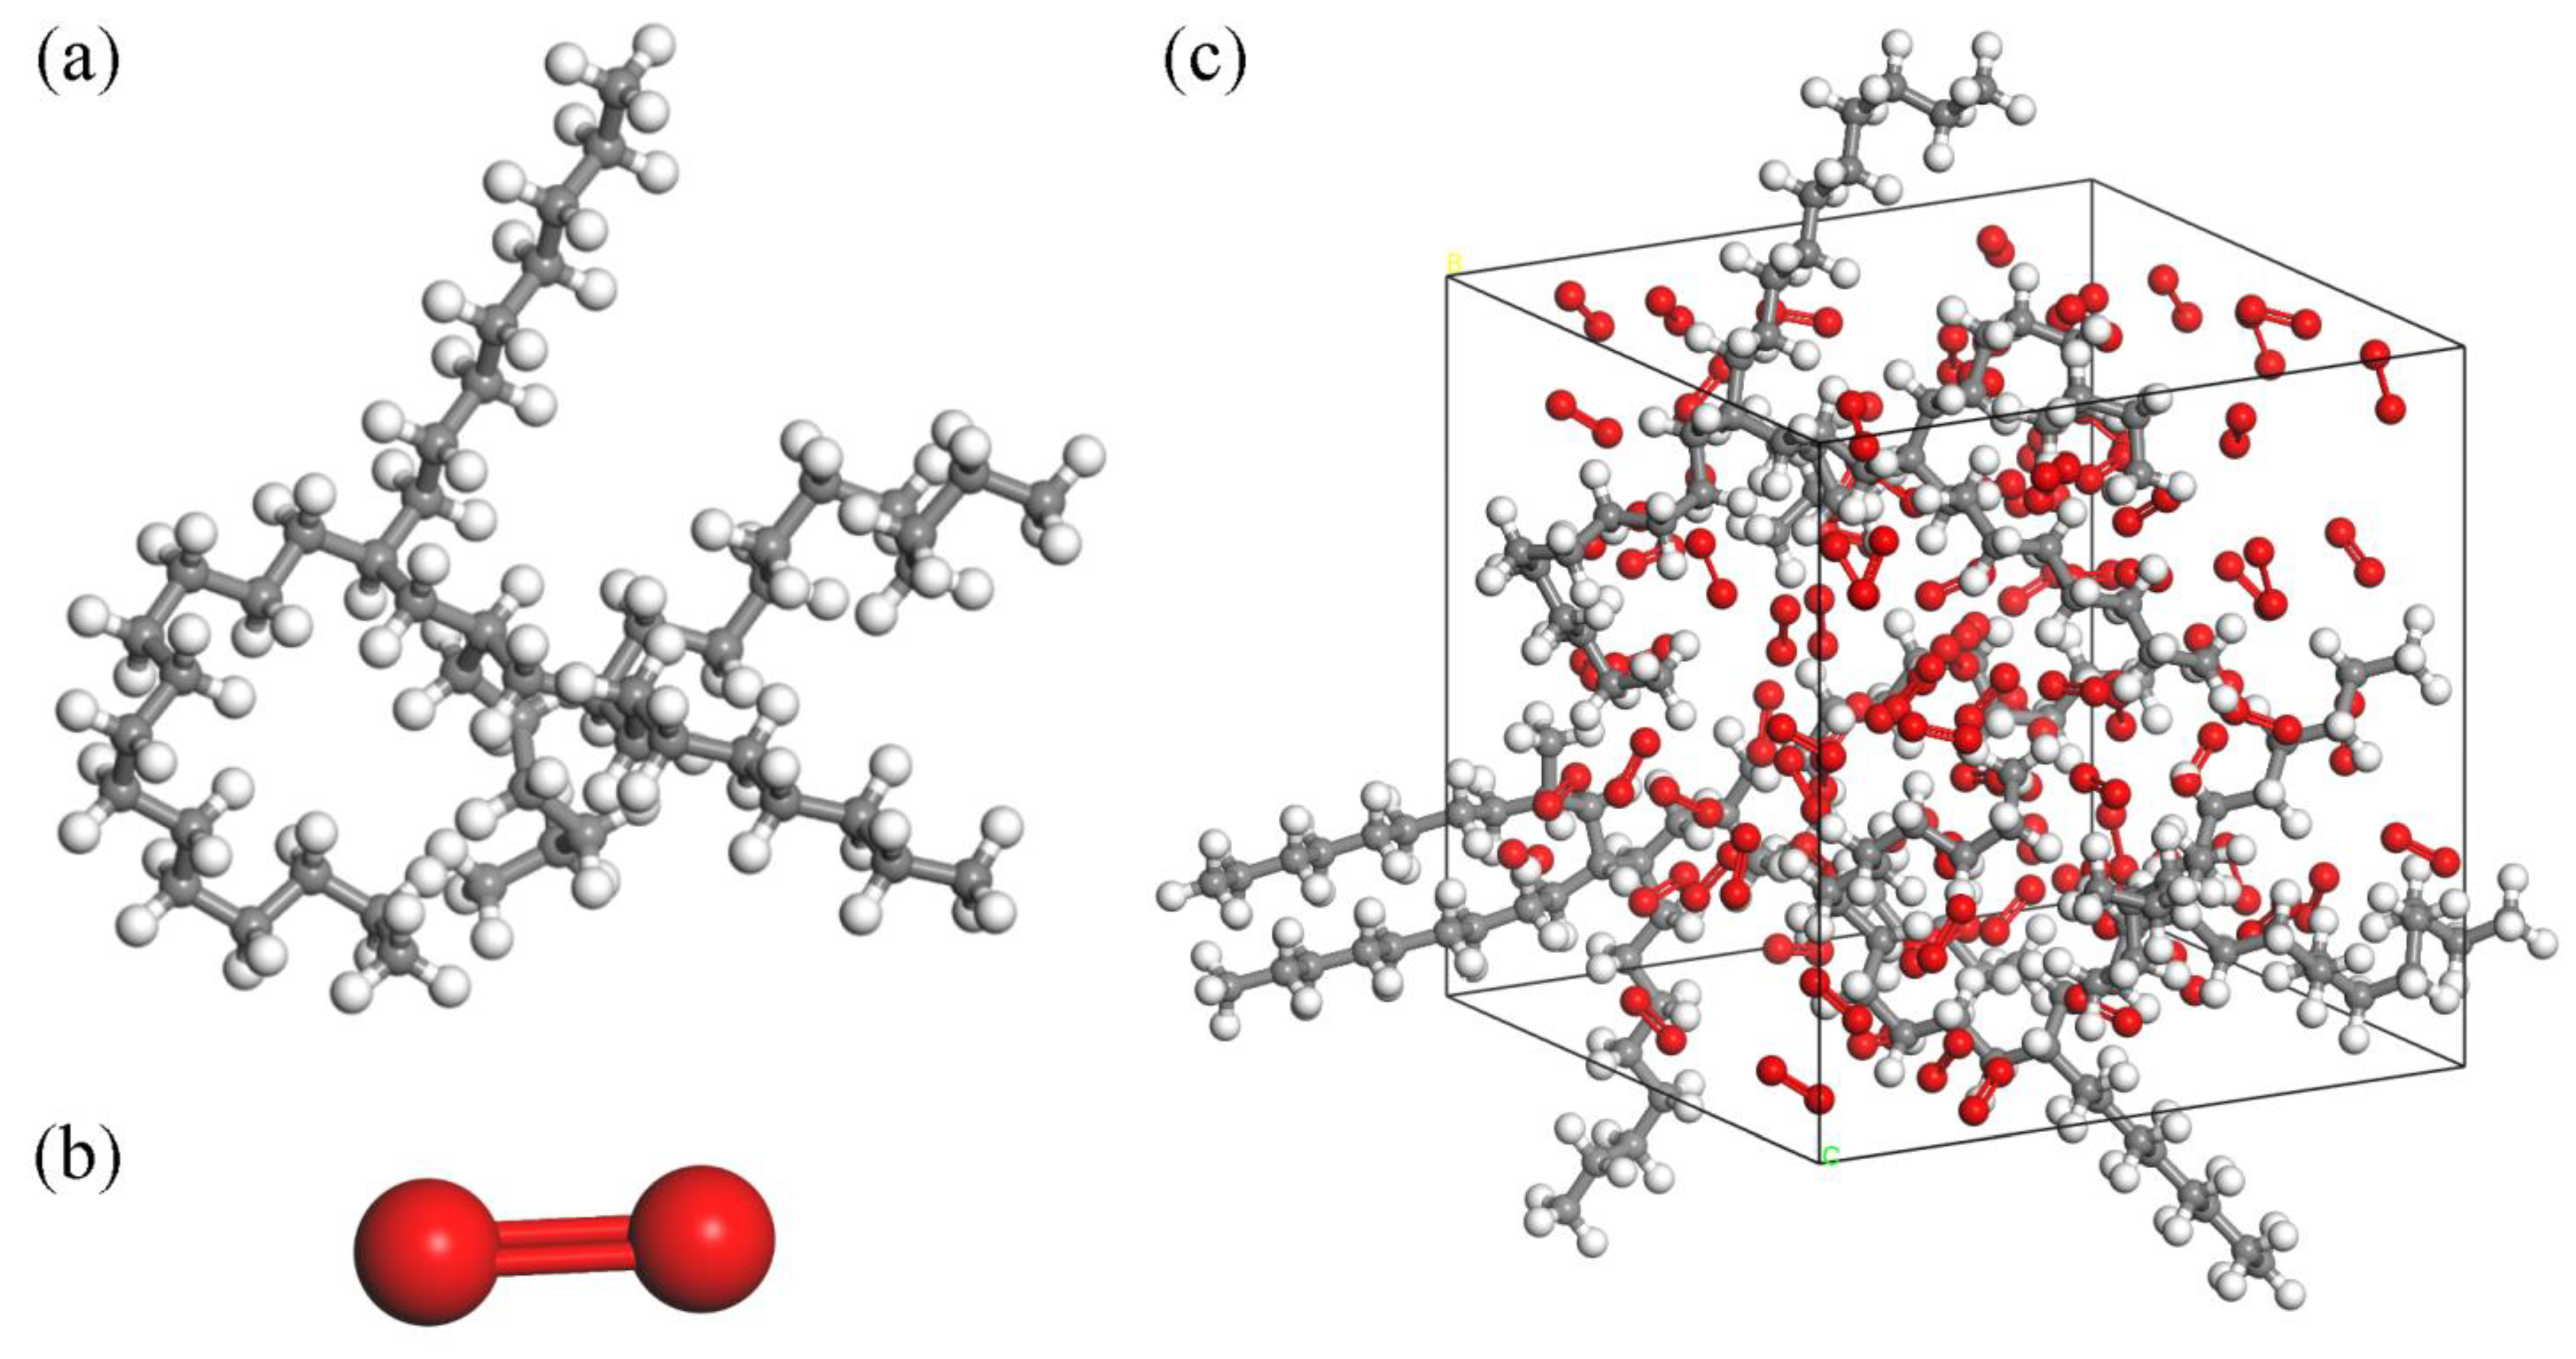
2.1. Thermal Oxidation Model of Lubricants

The procedure of thermal oxidation of hydrocarbon lubricants is very similar to that of mineral oils and also the generation of aldehydes, ketones, acids, water, and esters, thus reducing the viscosity of the lubricant. When thermal oxidation is carried out for a long time, these small molecular products will undergo polymerization reactions, forming large−molecule polymers and, as a result, the viscosity rises. The thermal oxidation process of hydrocarbon lubricants gene rally includes four reaction stages: chain initiation, chain growth, chain transfer, and chain termination [31,32,33].
During chain initiation, hydrocarbons are excited by metal ions, heat, or light to remove hydrogen atoms (H∙) from hydrocarbon molecules (R1H) and form free radicals (R1∙). The reaction process is as follows:
R 1 H R 1 + H
During chain growth, the free radicals react with oxygen molecules (O2) to form hydrocarbon proxy radicals (R1OO∙), which is an irreversible reaction. The generated alkyl peroxide radical forms hydrocarbon hydrogen peroxides (R1OOH) and a new free radical (R2∙) by taking a hydrogen atom from another hydrocarbon molecule (R2H). The stability of newly formed hydrocarbons (hydrogen peroxides) determines the rate of chain reactions generated by repeated chain growth reactions. The reaction process is as follows:
R 1 + O 2 R 1 OO
R 1 OO + R 2 H R 1 OOH + R 2
During chain transfer, various free radicals (generated by the decomposition of hydrogen peroxide) simultaneously participate in or trigger a series of complex reactions, thus generating a wide variety of products. During the decomposition process, the O−O bond breaks to produce two new free radicals. The reaction process is as follows:
R 1 OOH R 1 O + OH
The newly formed hydrocarbon hydrogen peroxide can be oxidized to form more peroxide−free radicals. Under high−temperature oxidation conditions, the generated aldehydes (R1CHO, CH2O), ketones (R1CH2OR2), and alcohols (R1CH2OH) can further react. This secondary condensation reaction generates high molecular weight polymers, producing paint films, accumulations etc., leading to an increase in the viscosity of lubricant. Ultimately, the organic acids produced by the condensation reaction and the small amount of water molecules produced during the chain transfer process can corrode the components of mechanical equipment, thereby reducing the working life of the equipment. The reaction process is as follows:
OH + R 1 H H 2 O + R 1
H | R 1 | H CO R 1 | H CO + H
H | R 1 | H CO + R 2 H R 1 CH 2 OH + R 2
H | R 1 | H CO + R 2 H R 1 CH 2 OR 2 + H
H | R 1 | H CH 2 CO CH 2 O + R 1 C H 2
As the degree of oxidation increases, oxygen or active substances are gradually depleted, chain termination reactions dominate, and oxidation tends to stop. The termination process may involve the recombination and disproportionation of hydrocarbon peroxy radicals by multiple processes, resulting in stable molecular end products, or the reaction can generate stable radicals without participating in further chain transfer reactions. The reaction process is as follows:
2 R RR
2 ROO ROOR + O 2
In order to verify the thermal oxidation process of the aforementioned hydrocarbon base oils, traditional experimental methods make it difficult to observe the generated small molecule compounds, and temperature and oxidation time are difficult to control. Therefore, Materials Studio (MS) simulation software (BIOVIA Materials Studio 2021) is used to simulate the thermal oxidation process of lubricant. Selecting typical hydrocarbon base lubricant PAO as the research object, the effect of temperature on the molecular structure of PAO lubricant is investigated.
Initially, construct the molecular structure of PAO (Figure 1a) and O2 (Figure 1b), and utilize the Forcite and Dmol3 Tools modules for structural optimization to obtain molecular models for energy and structural optimization. Then, a reaction unit containing 3 PAO molecules and 100 O2 molecules are constructed in the Amorphous Cell module. To facilitate the classification of atoms, the model sets carbon atoms are gray, hydrogen atoms are white and oxygen atoms are red, generating a 3D−reaction unit cell with a density of 0.9 g/cm3. Finally, structural optimization and energy balancing of reaction units using the Anneal function of the Forcite Tools module. During the annealing process, the atomic force field is selected as COMPASS, and the energy category is selected as the lowest energy and most stable Hamilton reaction model (Figure 1c).
For the above reaction units, the reactive force field (ReaxFF) 6.0 force field in the GULP module is selected to simulate the thermal oxidation reaction process of PAO molecules. Firstly, reaction equilibrium is carried out, and the electronegativity balance method is used to dynamically optimize atomic charges at each time step during the simulation process. The equilibrium time is set to 100 ps to better describe the polarization effect. After that, simulate the reaction, selecting the NVT (constant particle number, volume, and temperature) regular system as the reaction system. The integration step is set to 0.1 fs, the constant temperature device parameter is set to 0.1 ps, and the simulation time is set to 20,000 ps. In order to observe the oxidation reaction results in a short period of time, the ReaxFF molecular dynamics (MD) simulation reaction temperature is set to 1473 K. By observing the molecular changes in the thermal oxidation reaction of PAO molecules, screenshots of the simulated reaction results are taken to obtain some molecular structural changes, and the mechanism of the thermal oxidation reaction process of PAO molecules is summarized (Section 3.1).

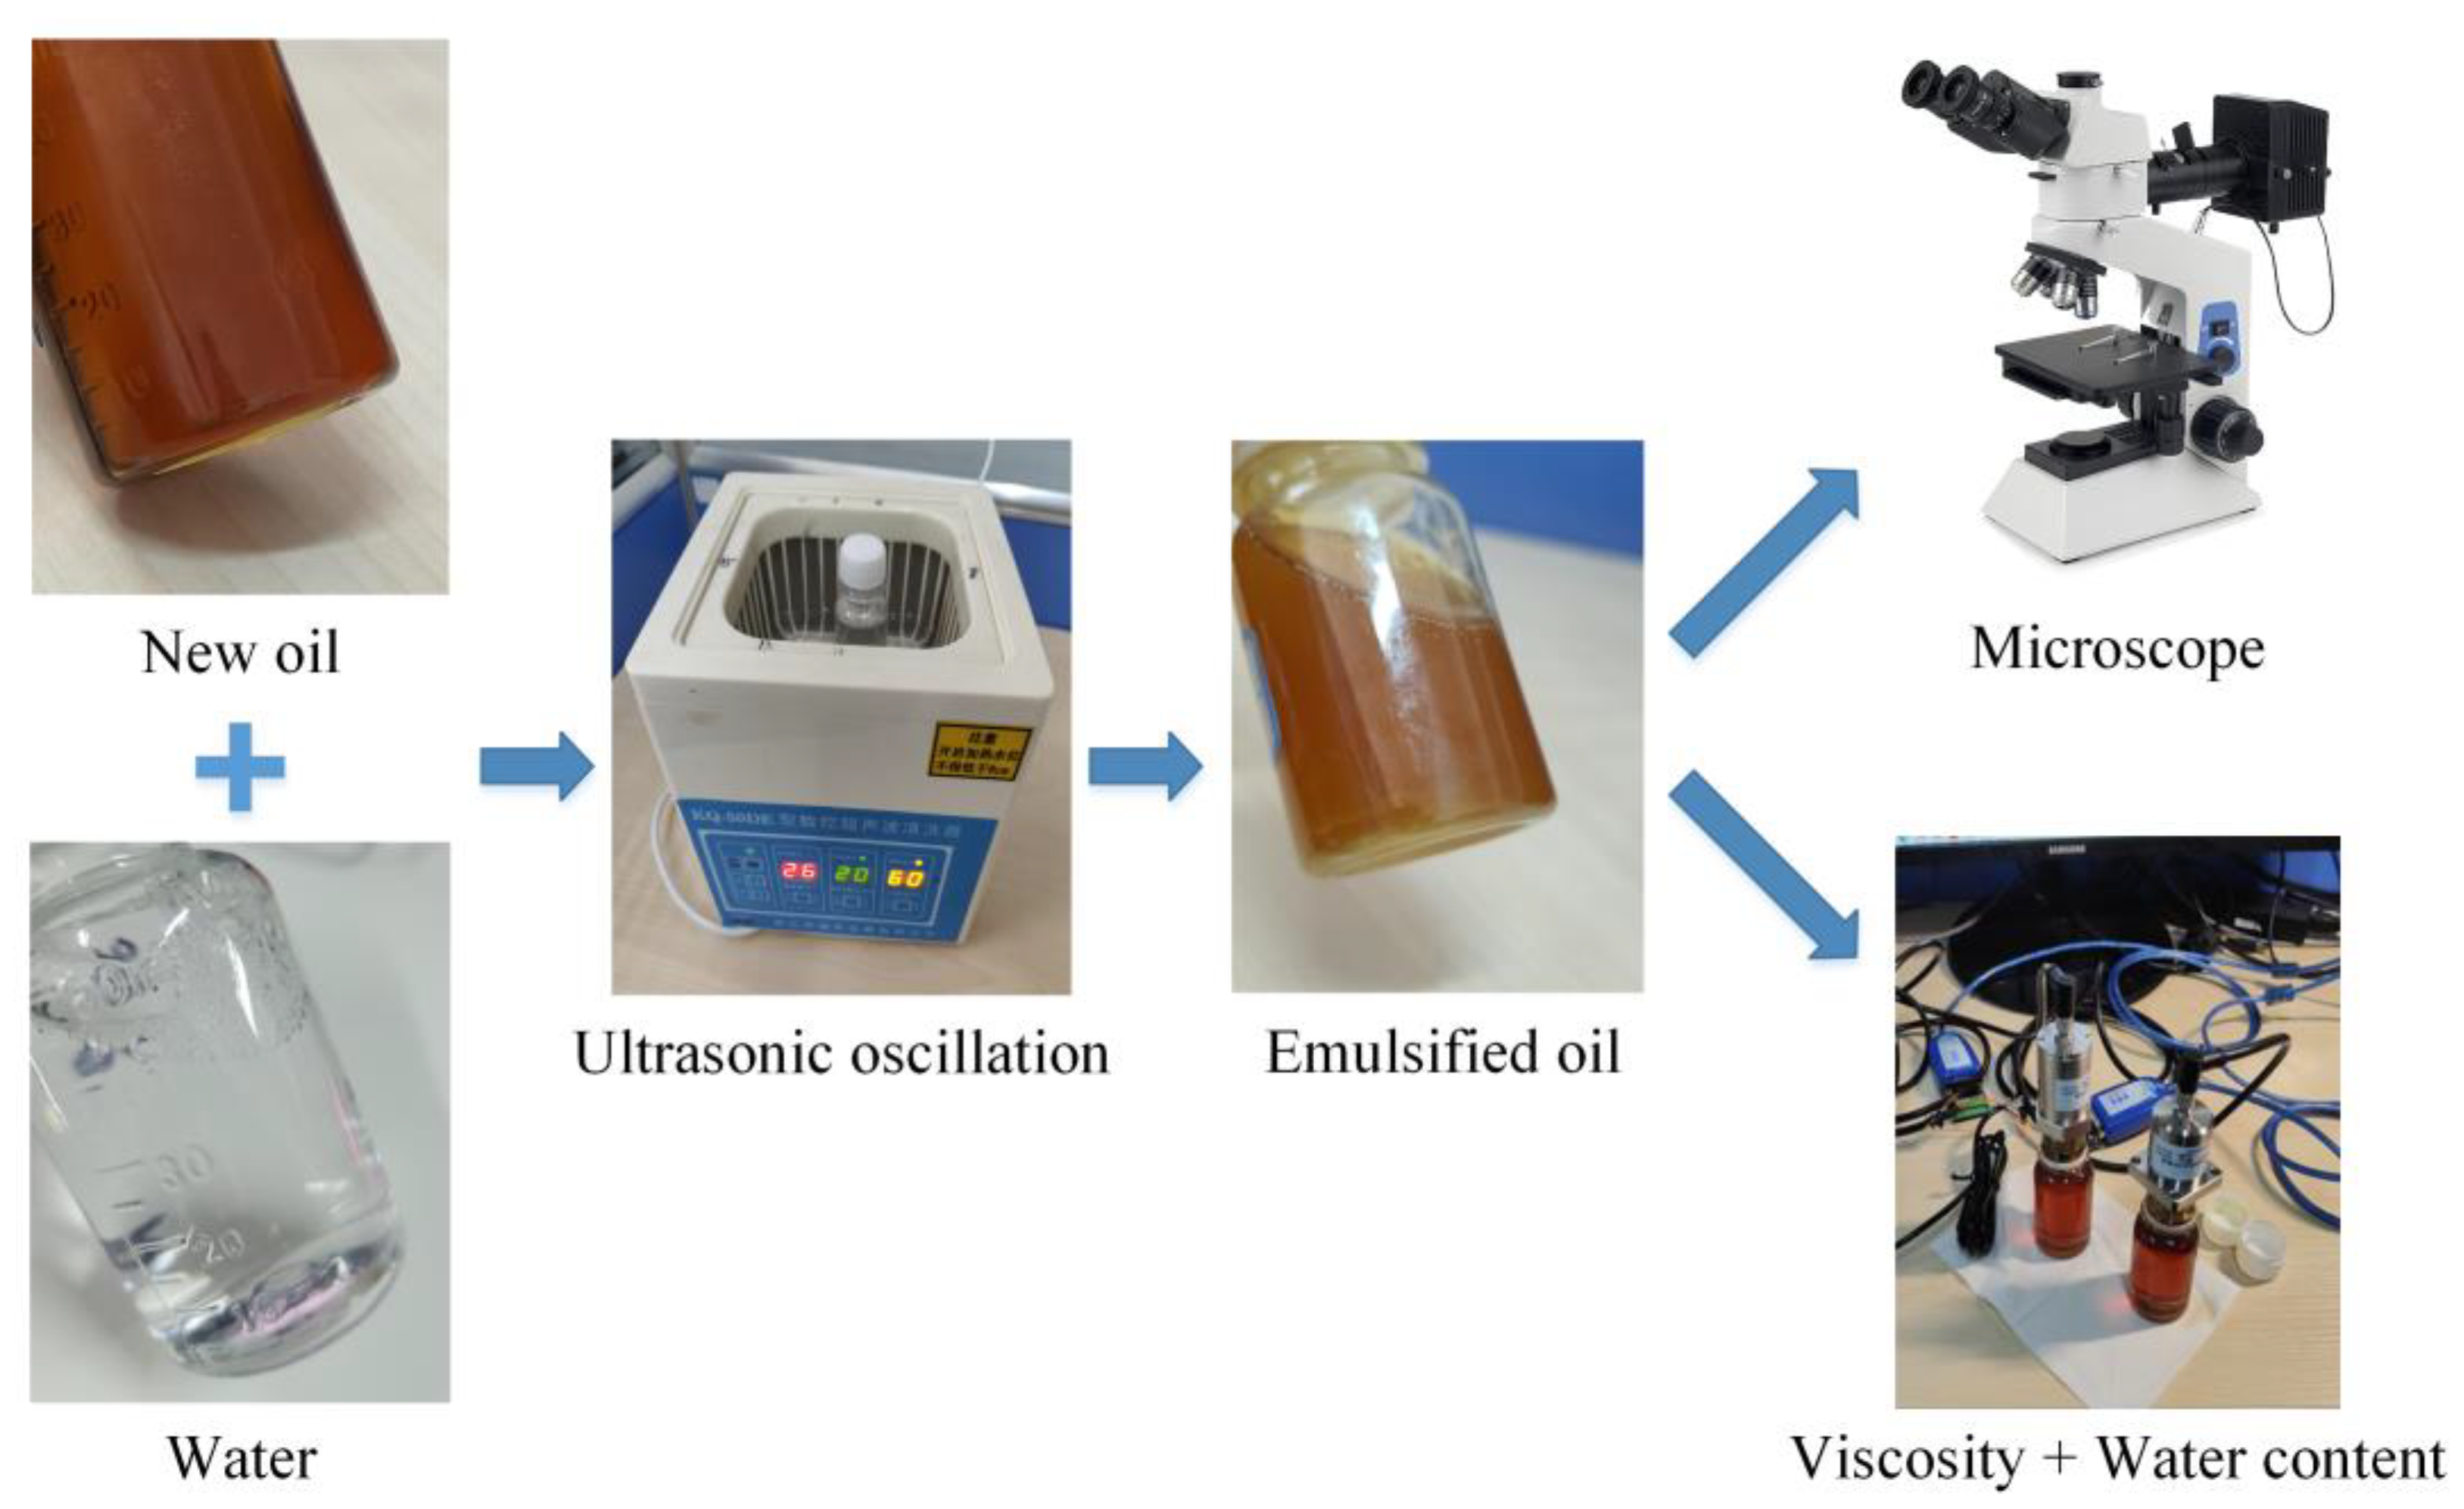
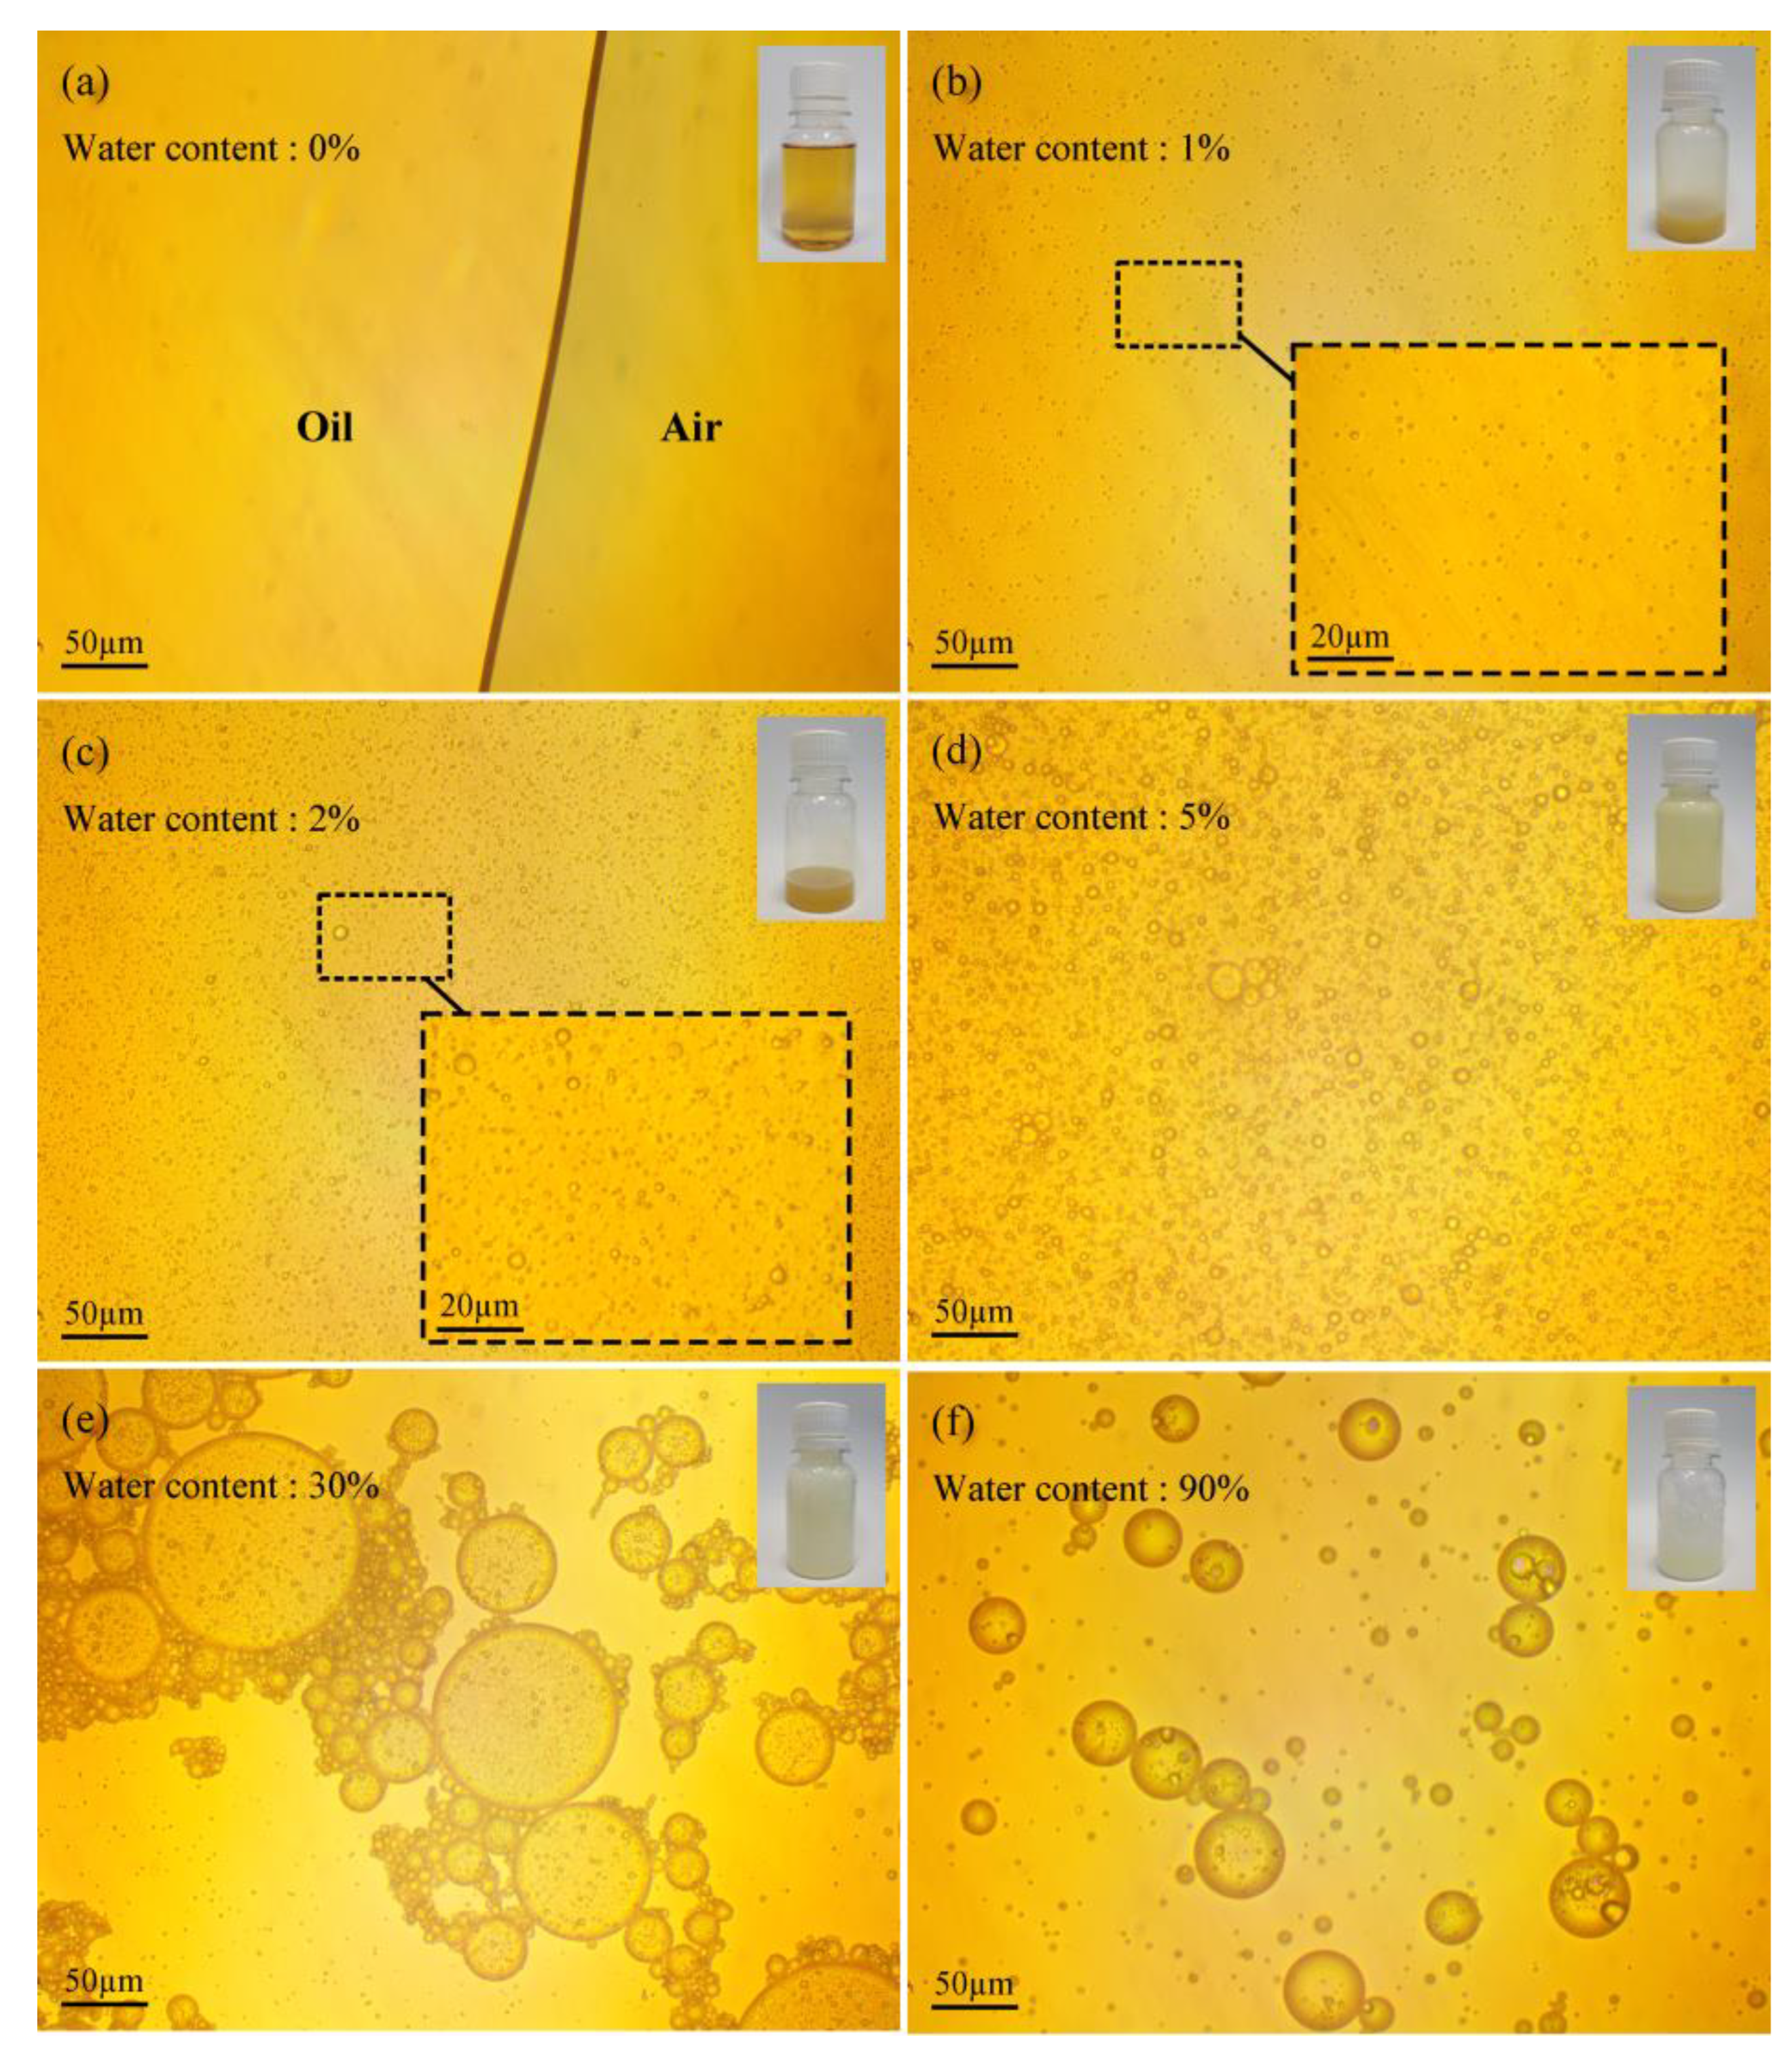
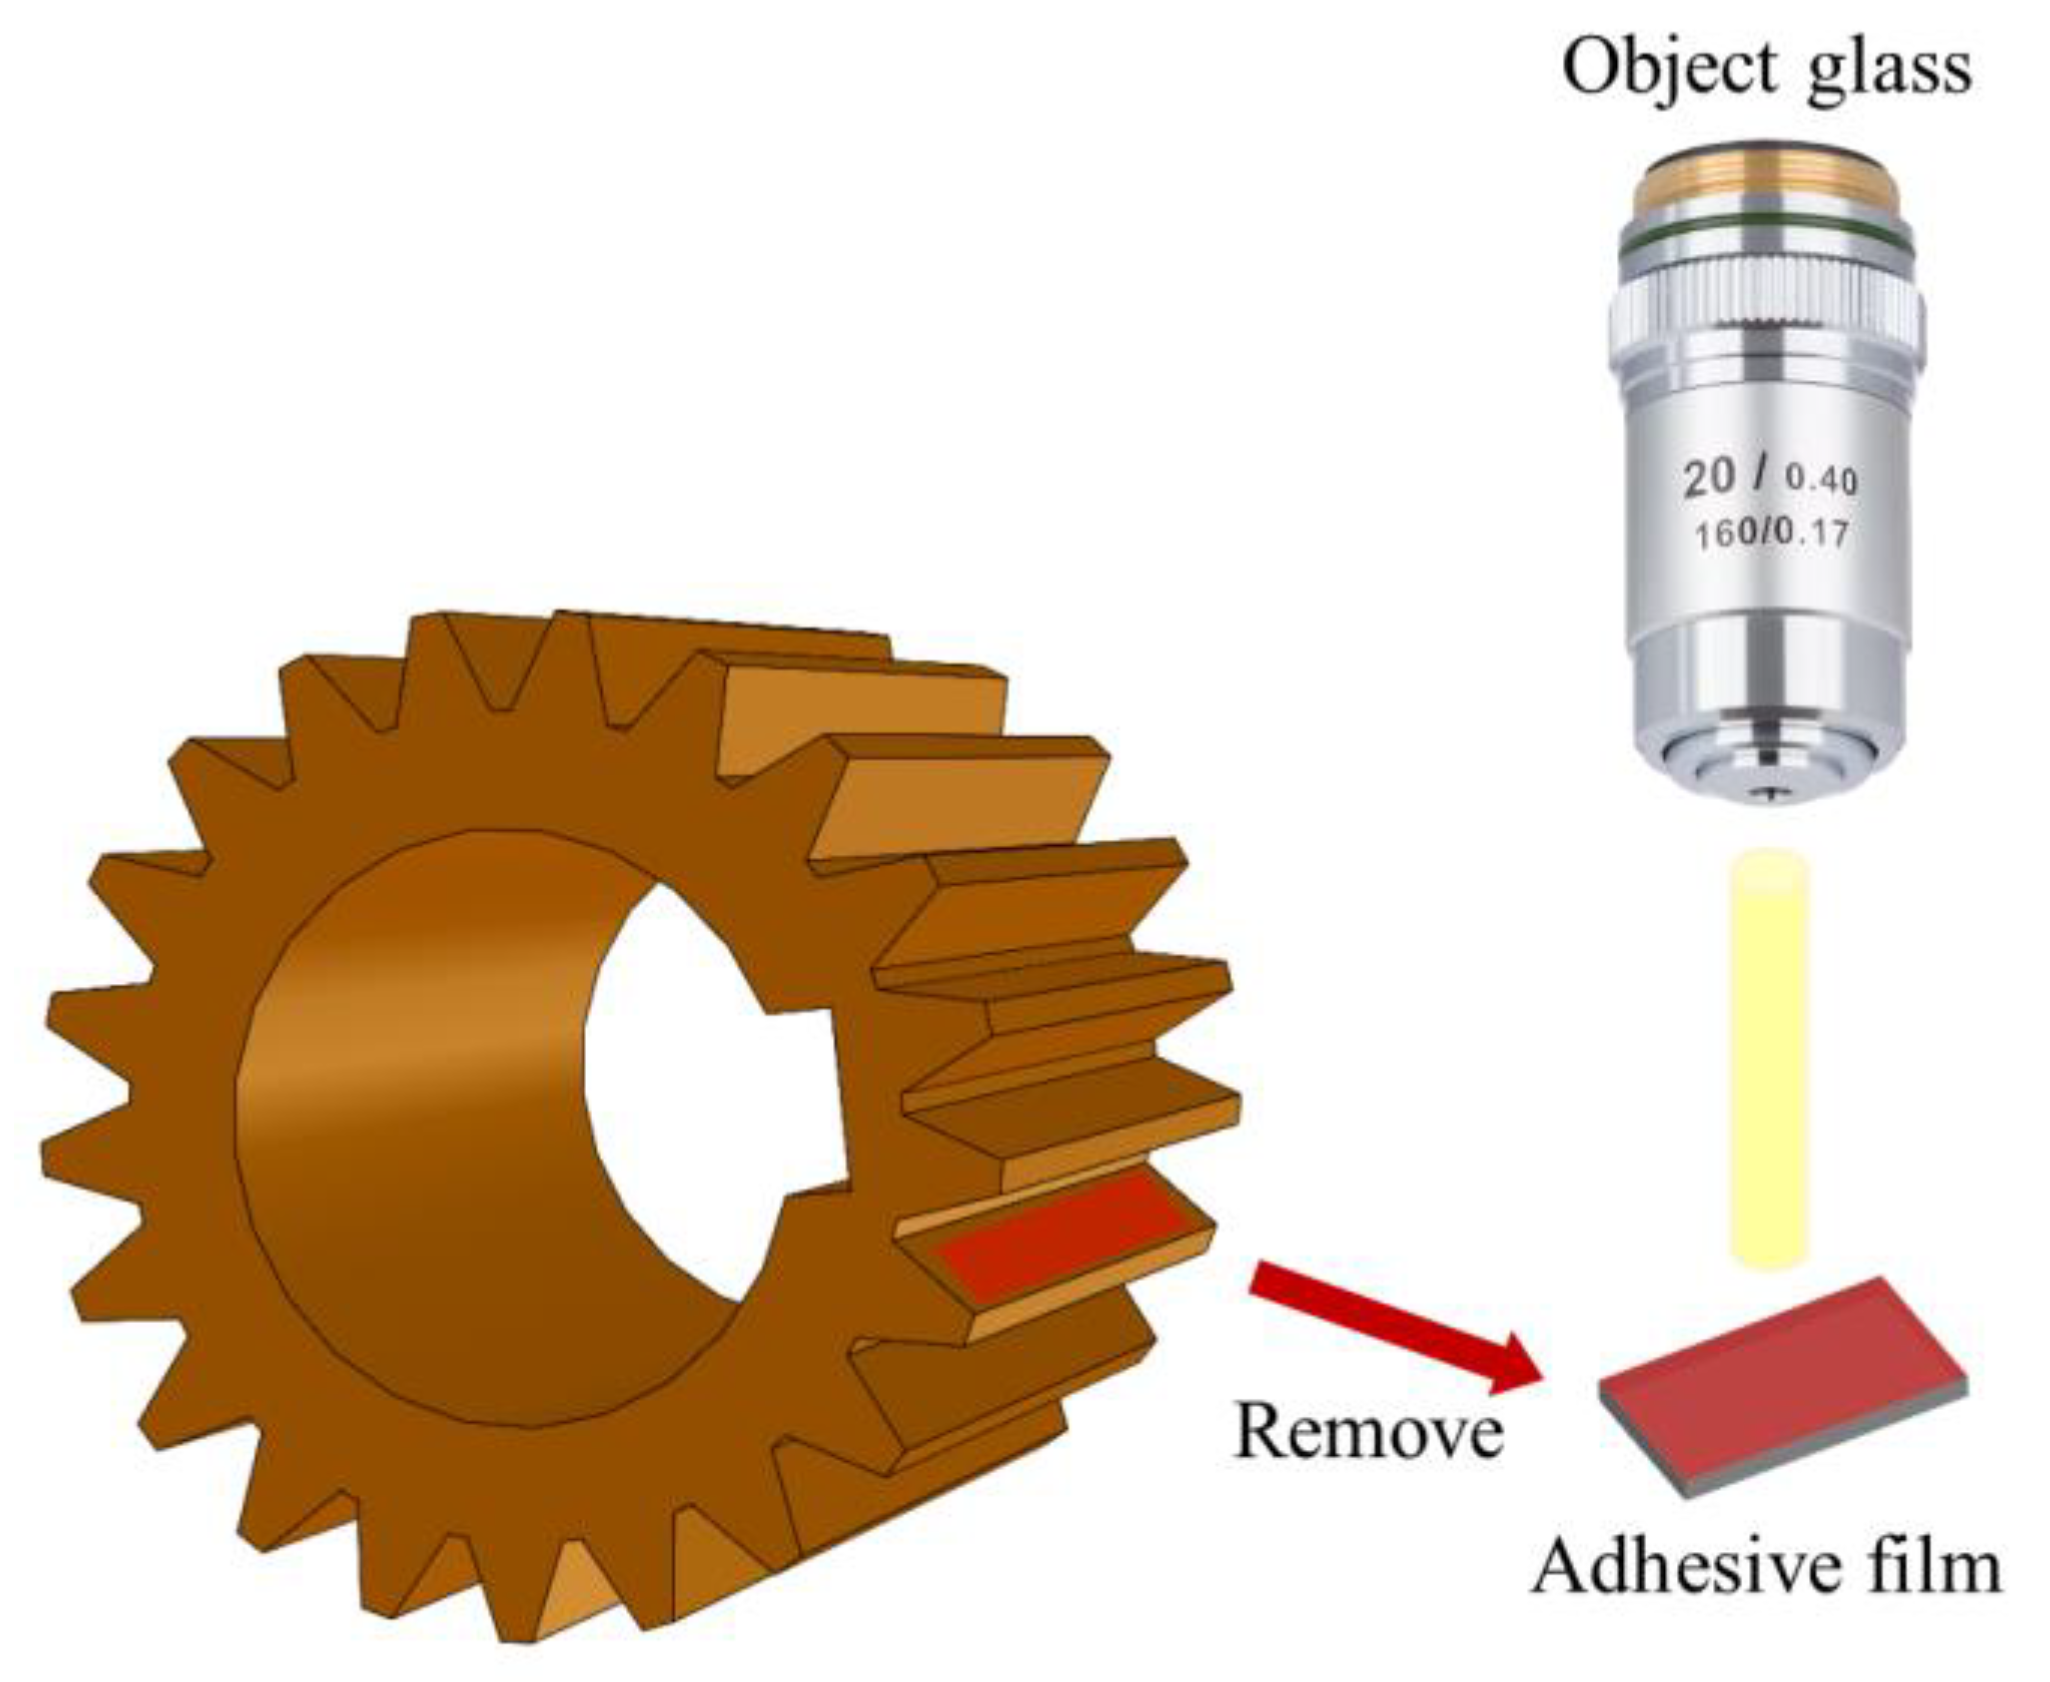
2.2. Analysis of the Micro− and Macro−Morphology of Emulsified Oil

KunLun lubricant (GL−5 85W/90, PetroChina Company Limited, Beijing, China) (parameters are shown in Table 1) and distilled water are selected as the main materials for preparing emulsion oil in the experiment. Prepare oil−water mixtures with different water contents, and then use ultrasonic oscillation for 30 min to obtain emulsified oil. The preparation process is shown in Figure 2.
Observe the micro−droplet morphology of emulsified oil with 1%, 2%, 5%, 10%, 20%, 30%, 50%, and 90% water content using optical microscopes (SOIF 20×, 50×, Shanghai Xinmao Scientific Instrument Company Limited, Shanghai, China). Under normal humid environments (except for special underwater operating equipment), the primary sources of water in the lubricants include water inflow due to seal failure of mechanical equipment or high−temperature oxidation products. According to Chinese national standards, the permissible water content in lubricants must be below 0.03% [34]. Exceeding this threshold may result in the formation of acids within the lubricant, consequently accelerating corrosion and potentially leading to severe accidents. Therefore, we have analysed the viscosity change of deteriorating lubricants under a normal state (up to 5% water content). Use a viscosity sensor (YFV−2) and a temperature sensor (YFW−2B) to measure the kinematic viscosity of emulsified oil with water content of 0%, 1.0%, 2.0%, 3.0%, 4.0%, and 5.0% at temperatures of 25 °C, 35 °C, 45 °C, 55 °C, 65 °C, and 75 °C respectively, and obtain the variation pattern of the viscosity of the water containing oil affected by temperature and water content.

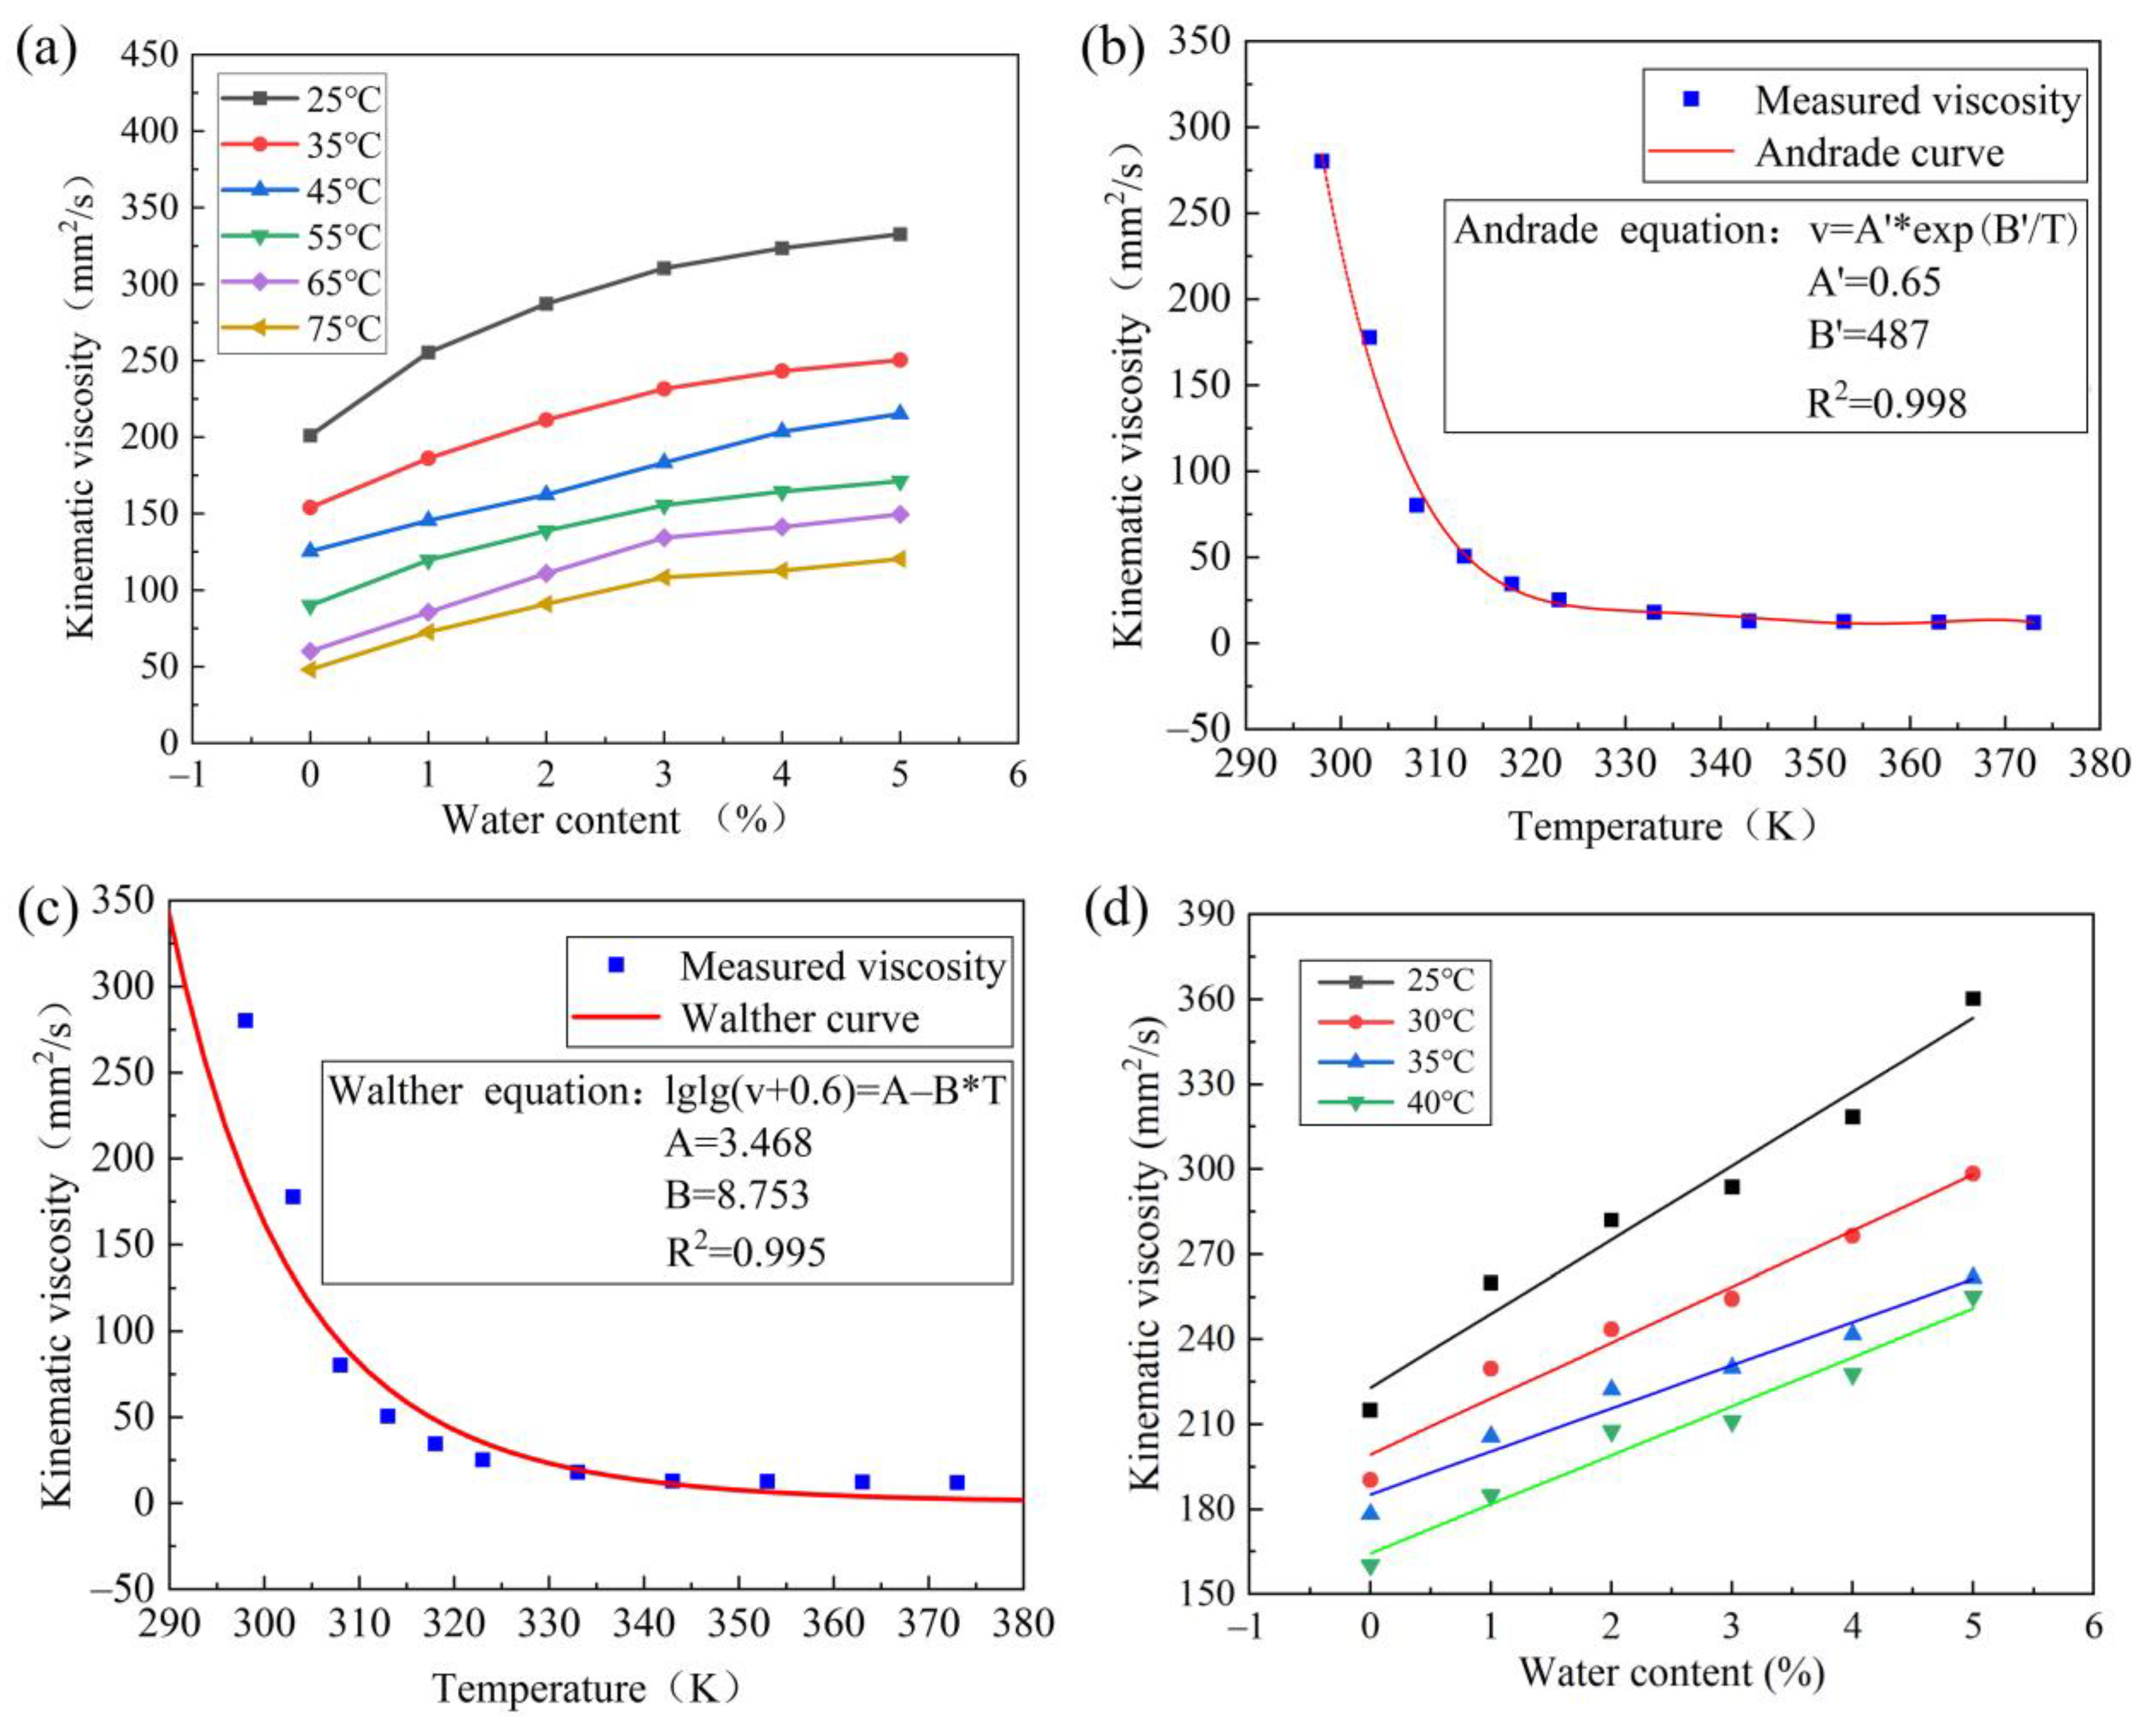
2.3. Viscosity Prediction Model

Relative viscosity is the ratio of the kinematic viscosity of the polymer solution to the kinematic viscosity of the pure solvent at the same temperature, which is vre = vru/voil. The relative viscosity and water content are linearly correlated under different temperature conditions, and are calculated from the measured kinematic viscosity data [19].
The linear relationship of relative viscosity with temperature and water content can be described as follows:
vre = 1 + ϑ(T) ϕ
where vre denotes the relative viscosity; ϑ(T) represents a function of temperature T, which is the slope of the curve of relative viscosity changing with water content; ϕ corresponds to the water content.
Since ϑ(T) and ϕ are very small compared with 1, the logarithm of both sides is taken as follows:
lglg v ru = lglg v oil + ϑ ( T ) ϕ lg v oil ln 2 ( 10 )
The measured data are fitted with the Andrade viscosity−temperature equation and the Walther viscosity−temperature equation, respectively, and the viscosity−temperature equation with the better fitting degree is chosen. Substituting the Andrade viscosity−temperature equation v oil = A e B / T is obtained, as follows:
lglg v ru = A e B T + m ϕ T A 1 10 B + n ϕ T A 10 B
lglg η 0 = 1 ρ ( A e B T + m ϕ T A 1 10 B + n ϕ T A 10 B )
where vru represents the kinematic viscosity of emulsion oil, ƞ0 signifies the initial viscosity, and ρ denotes the density of lubricants.
The threshold line method is used to determine the lubricant viscosity safety threshold. The thresholds are calculated from the mean of the data samples obtained from statistical monitoring. The calculation methods for safety threshold τ 1 is as follows:
τ 1 = ¯ = 1 χ i = 1 χ i
where ¯ represents the sample mean, i signifies the viscosity monitoring value, and χ stands for the sample size.

3. Results and Discussion

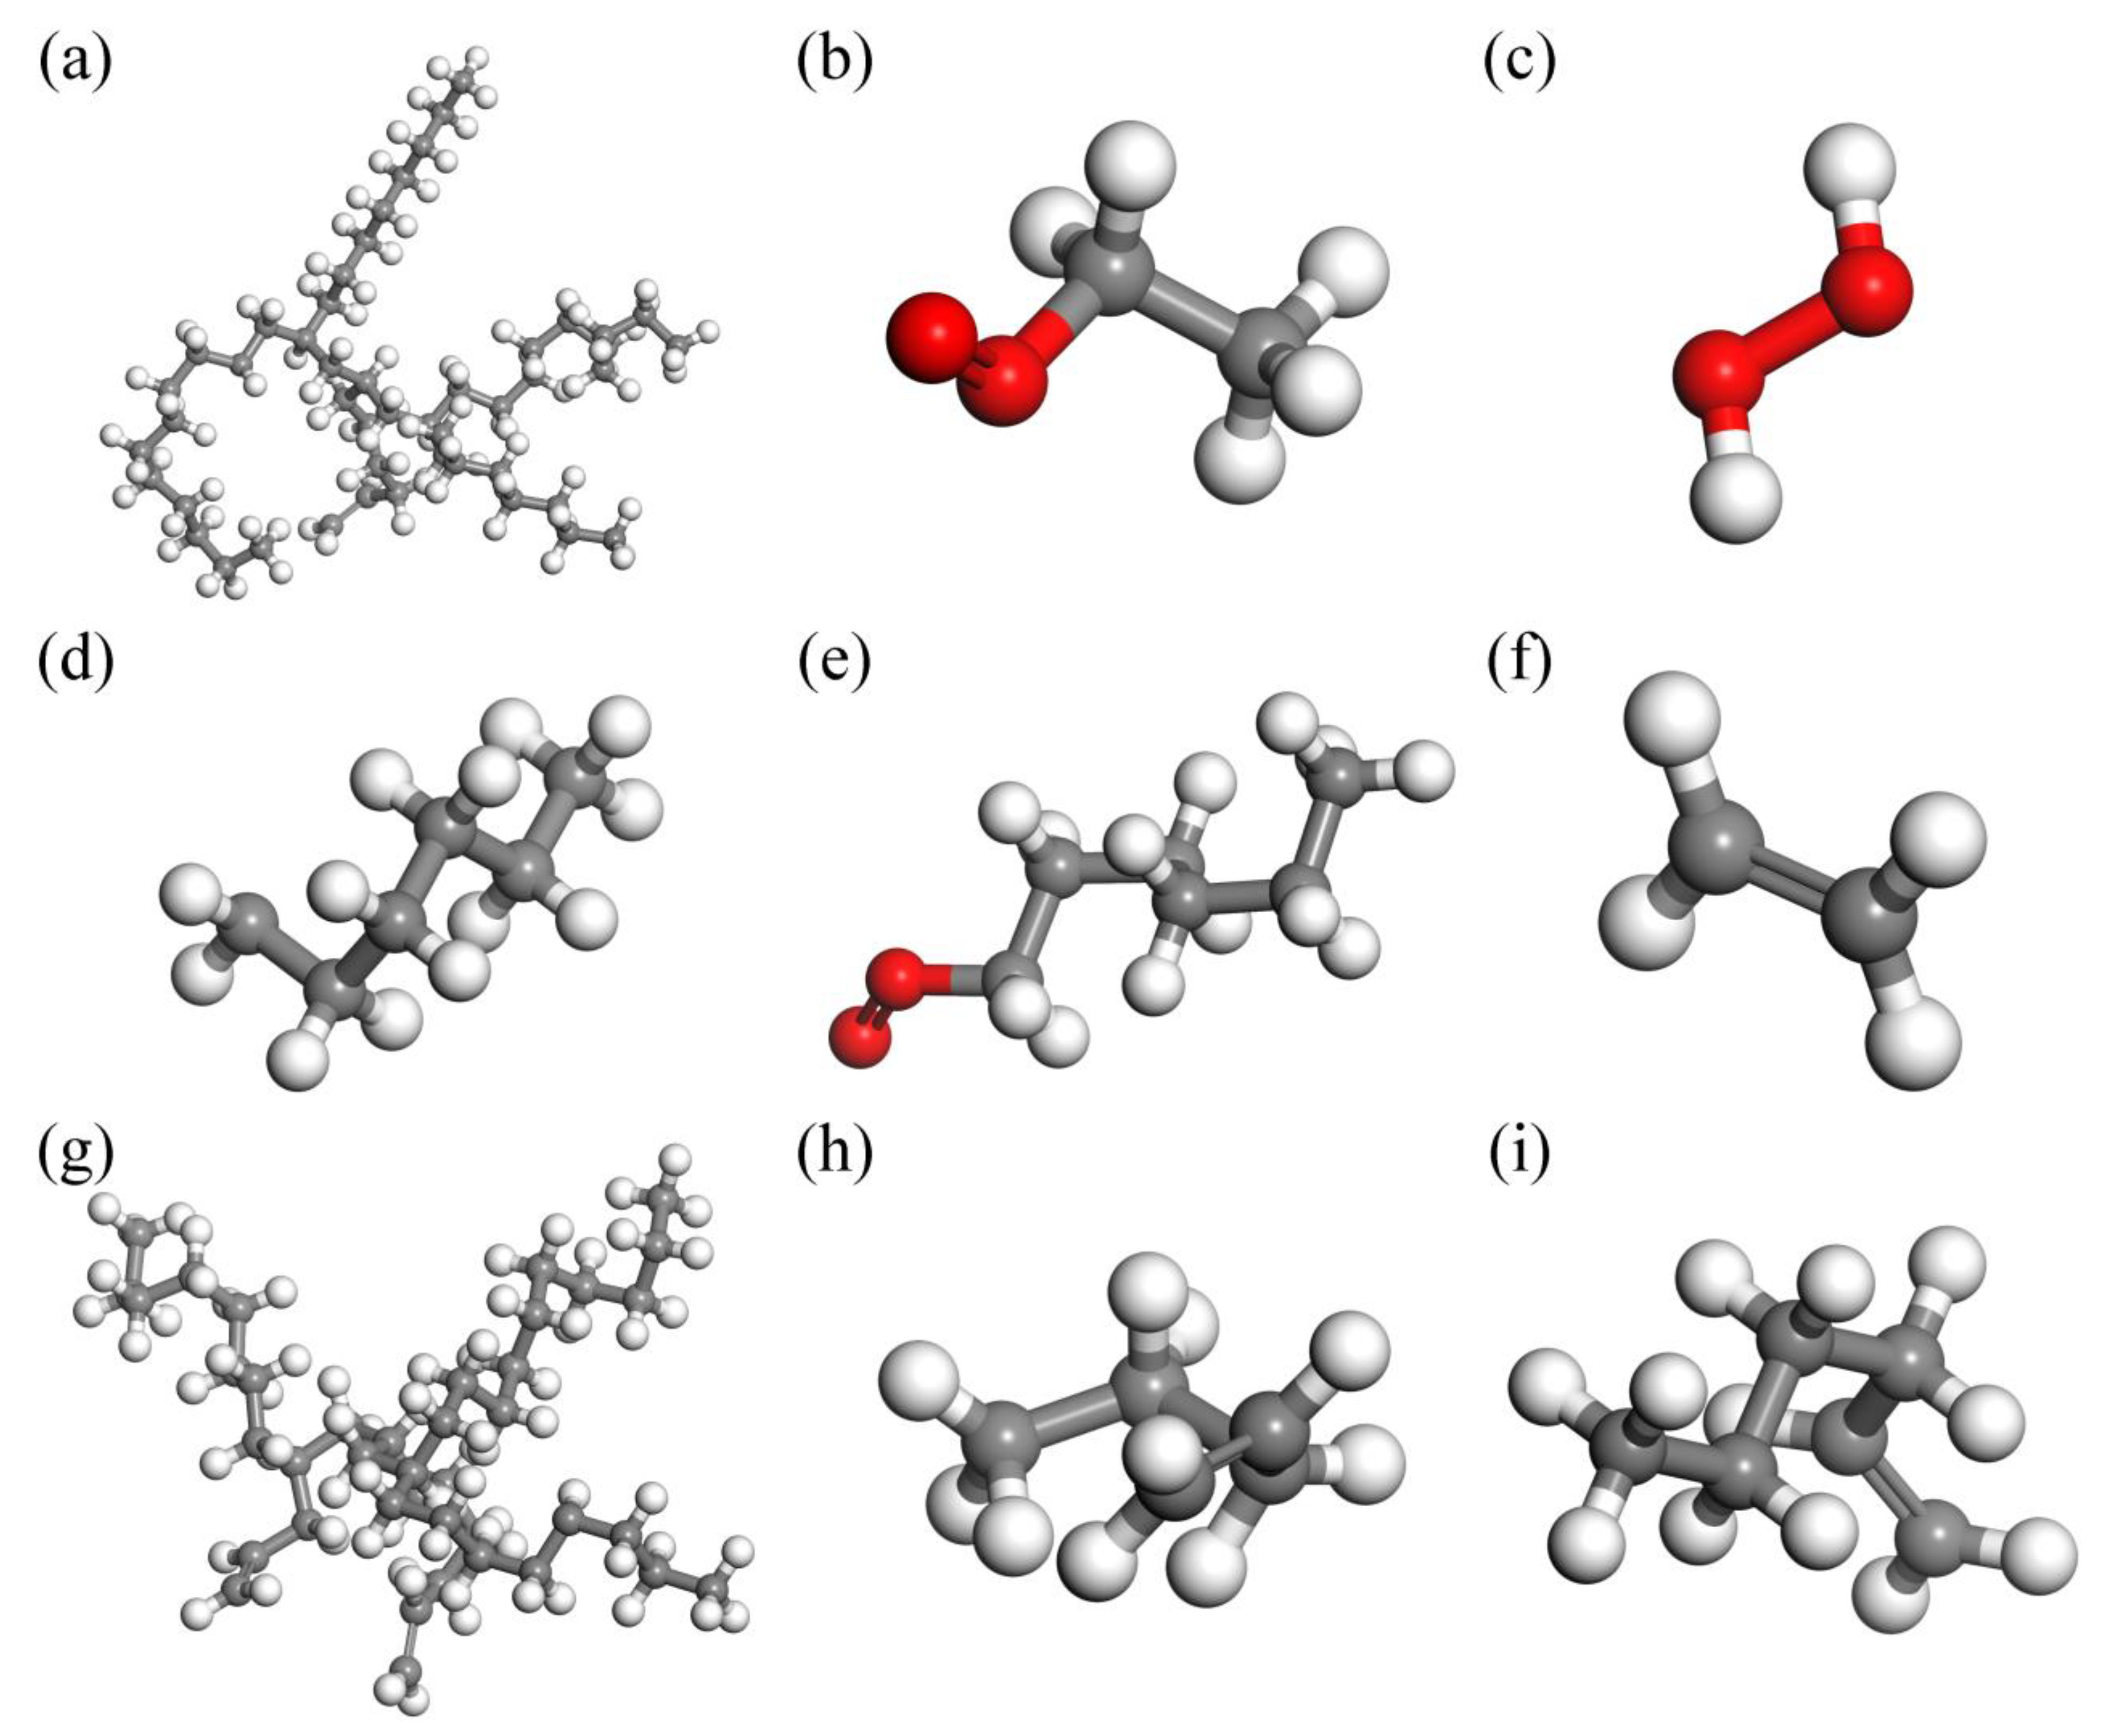
3.1. ReaxFF MD Simulation Results of Lubricant

From the simulation results (Figure 3, carbon atoms are gray, hydrogen atoms are white and oxygen atoms are red), it can be seen that the thermal oxidation process of the PAO molecule conforms to the free radical polymerization theory of hydrocarbon lubricant. At a relatively moderate simulated temperature of 1473 K, first the chain initiation stage occurs, before the C−C bond and C−H bond then break, and the PAO molecule generates free radicals. See Figure 3a,d, to obtain hydrocarbons with a small molecular weight. During the chain growth phase, new free radicals are formed, and the free C−C bonds break to combine with each other and also undergo an oxidizing reaction with O2 molecules to produce alcohols (Figure 3b). In the chain transfer stage, the number of free radicals further increases, and the oxidation reaction takes place further, producing hydrogen peroxide, carboxylic acids, olefins, and other substances (Figure 3c,e,g). In addition to the above free radicals involved in the reaction, there are also some unsaturated hydrocarbons in the system (Figure 3f,h,i). At the chain termination stage, all free radicals are annihilated, and the reaction tends to stop.
From Figure 3 it can be observed that the main small molecules produced are: small molecule−saturated hydrocarbon substances, six carbon esters, and twenty−nine carbon esters, along with unsaturated hydrocarbons, such as ethylene and hydrogen peroxide, and other products. The number of molecules in the reaction unit increases as the reaction proceeds. The number of molecules increases slowly from the initial state of 0.1 ps to 8000 ps. The number of molecules increases, the molecular weight decreases, the molecular gap increases, and the intermolecular force decreases, which is the fundamental reason for the viscosity reduction caused by the thermal oxidation reaction of the lubricant. The number of molecules in the lubricant reaction unit tends to remain constant as the thermal oxidation reactions progress from 8000 ps to 10,000 ps, indicting the equilibrium state of the thermal oxidation process of the PAO molecules.
In addition, previous studies showed that the thermal oxidation products of hydrocarbon base lubricant can, when combined with the antioxidants, exhibit effects that are effective for quenching the hydrocarbon oxidation chain reactions. Primary antioxidants act as “radical scavengers”, reacting quickly with free radicals during the propagation phase and slowing down the oxidation process by forming new, more stable, radicals. Secondary antioxidants react with peroxides and are responsible for breaking the cycle, preventing branching and further propagation [35]. These mechanisms effectively enhance the antioxidant properties of hydrocarbon base lubricant.
Figure 4 shows the change trend of the number of molecules in the reaction system under the relatively moderate simulated temperature of 1473 K within 10,000 ps. The number of molecules in the PAO unit cell of the lubricant increases initially and then tends to equilibrium with the lapse of reaction time. At this time, the heated oxidation or decomposition reaction of the lubricant reaches the intermediate equilibrium state.

3.2. Microdroplet Morphology of Emulsified Oil

The researchers found that when the stirring time was longer, the emulsion oil exhibited higher initial viscosity [36]. This is because of the difference in droplet size generated at different stirring times. When the stirring time is above 30 min, the difference in viscosity changes, and the droplet amount is small. Therefore, this experiment sets the stirring time to 30 min.
The microscopic and macroscopic photos of pure oil are shown in Figure 5a–f. The results show that the lubricant is a yellow transparent liquid, and no tiny droplets or bubbles are found; Figure 5b–d are the lubricant emulsions with water contents of 1%, 2%, and 5%, respectively. The macro−photos show that as the water content of the lubricant increases, the color of the lubricant changes from yellow to milky white, the number of emulsion droplets increases significantly, and the droplet size gradually increases. When the water content exceeds 30%, the continuous phase of the oil–water emulsion changes from oil phase to water phase, the number of emulsified oil droplets also gradually decreases, and the color of the emulsion gradually changes, from milky white to white and transparent.
Therefore, when the water content is less than 30% (Figure 5a–e), the lubricating fluid is a water−in−oil emulsion. With the gradual increase in water content, the viscosity of oil−water emulsion first increases and then decreases, the number of emulsified water droplets increases, and the internal frictional resistance of the emulsion increases, which leads to an increase in viscosity. When the water content is above 30% (Figure 5e,f), the lubricating fluid changes from a water−in−oil type to an oil−in−water type emulsion. As the water content increases, the number of emulsified oil droplets decreases, leading to a reduction in viscosity. This is consistent with the experimental rule reported in the relevant research [20,21].

3.3. Viscosity Prediction Model and Safety Threshold Division

In order to further investigate the effect of water content and temperature on the viscosity of the lubricant, a viscosity−temperature test is carried out on the lubricant, and the test results are shown in Figure 6a.
Figure 6a shows the variation curve of lubricant kinematic viscosity with water content under different temperatures. At the same temperature level, the kinematic viscosity of the lubricant increases slowly as the water content increases. Additionally, the kinematic viscosity of the lubricant decreases as the temperature rises, indicating a negative correlation between temperature and viscosity value.
Based on the linear relationship between the viscosity of lubricant, which is correlated with water content and temperature. The measured data are fitted with Andrade equation (see Figure 6b) and Walther equation (see Figure 6c), respectively. The linear correlation coefficient (R2) of Andrade equation (R2 = 0.998) is greater than that of Walther equation (R2 = 0.995). The Andrade viscosity−temperature equation with a better fitting degree is optimized, and the high−precision prediction model of lubricant viscosity is established by combining the linear relationship of relative viscosity with the Andrade viscosity−temperature equation.
The parameter value A = 3.534 , B = 9.057 , m = 0.0036 , n = 1.545 and R2 = 0.999 can be obtained by fitting offline experimental data with Equation (13), indicating a high degree of fitting.
The online test data are used to fit the improved lubricant viscosity prediction model for verification. The viscosity data of 25 °C, 30 °C, 35 °C, and 40 °C in the online test are used to fit the prediction model. Figure 6d shows that most data points are distributed on the fitting line and the trend is consistent (R2 = 0.966), which proves the accuracy of this lubricant viscosity prediction model.
The viscosity threshold is calculated by the threshold line method and marked by the real−time monitoring data graph, as shown in Figure 7. The black curve in the graph represents the change of the lubricant viscosity value, the orange curve represents the change of the temperature, and the green straight line represents the safety threshold calculated by the threshold line method.
Figure 7 shows the safety thresholds of lubricants with water content in: (a) 0%, (b) 1%, (c) 2%, (d) 3%, (e) 4%, (f) 5%. During the test, the viscosity stability time and safety threshold of lubricant with different water contents are shown in Table 2. With the temperature gradually rising, the dynamic viscosity of lubricant showed a downward trend, and the viscosity trend tended to be stable at about 160 min, maintaining a slight fluctuation, and the safety threshold of lubricant viscosity is higher than the stable value. At the threshold time, the viscosity of the lubricant is less than the safety threshold, indicating that the viscosity of the lubricant is low, the oil film is small, and the lubricating performance is reduced. According to the six groups of test viscosity trend diagrams, temperature is the main factor affecting the viscosity of lubricant, and too high temperature rapidly reduces the viscosity value, thus affecting the oil film thickness and the lubrication performance. The viscosity of a lubricant increases as the water content increases and thus increases the oil film thickness, but the degree of enhancing the lubricating performance is limited. On the contrary, water can corrode mechanical equipment and make the wear more serious. Therefore, in practical engineering applications, the temperature and water content should be strictly controlled to ensure the service life of mechanical equipment.

4. Wear Experiment

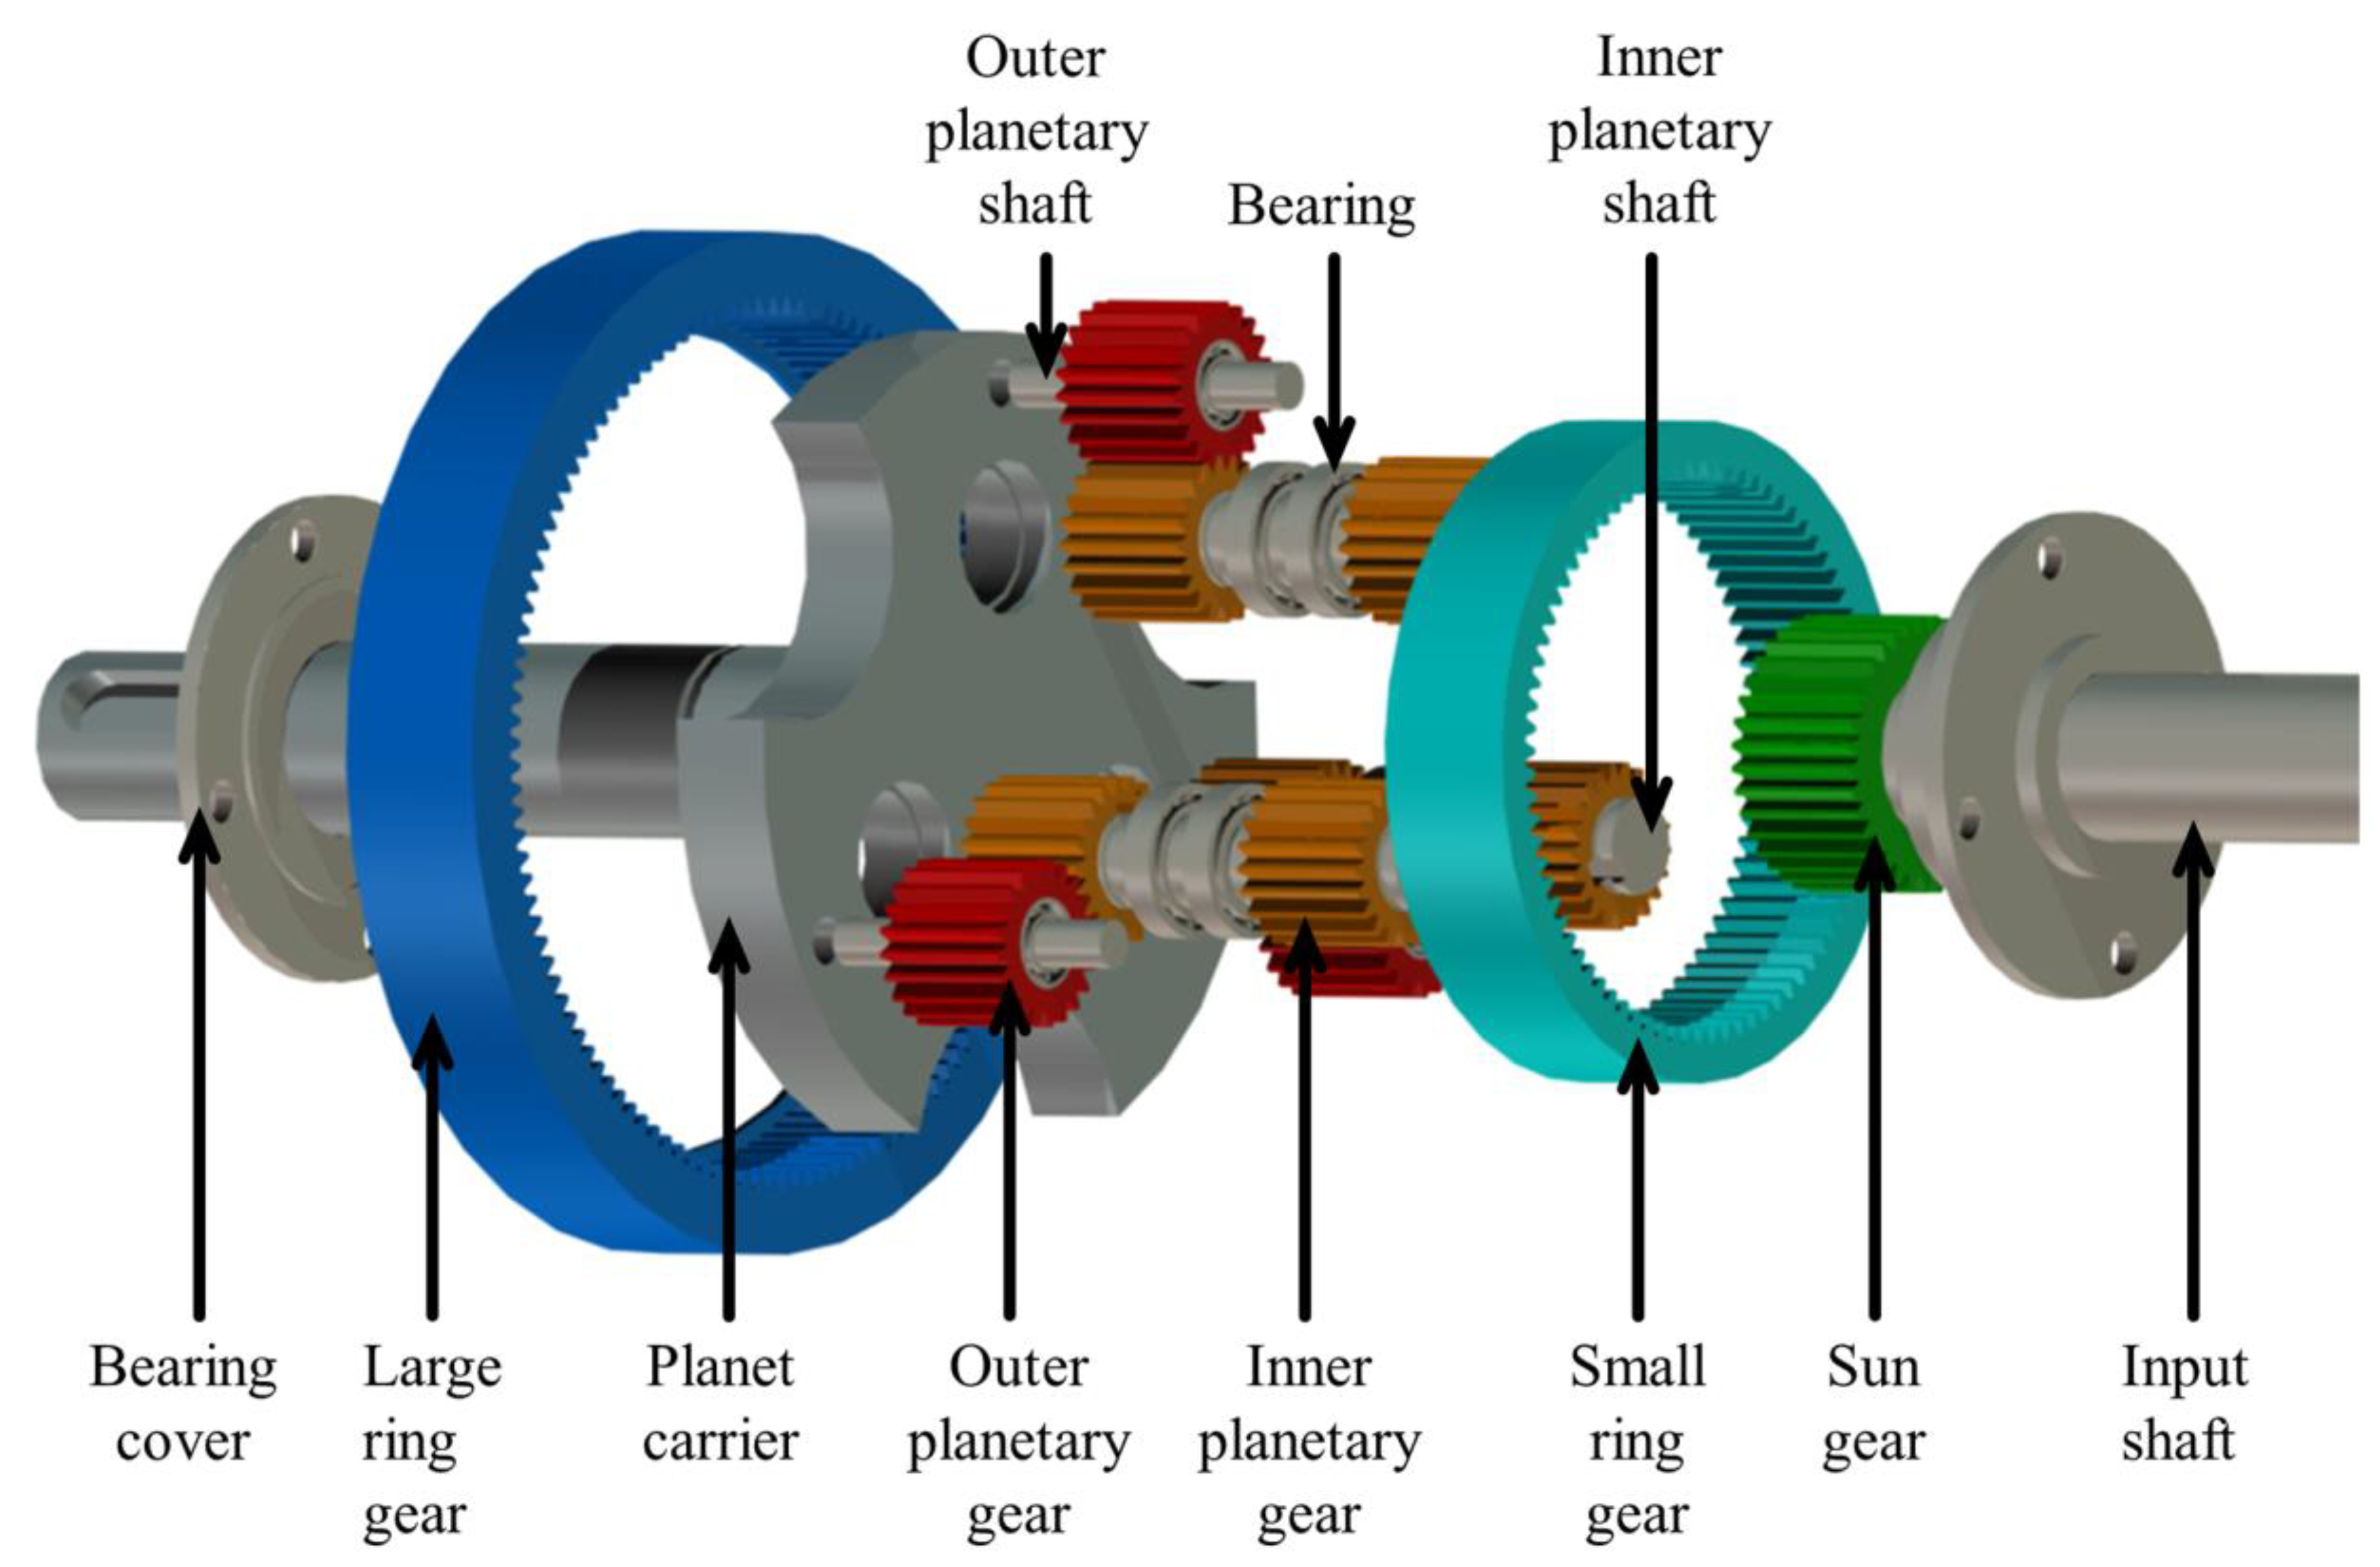
4.1. Wear Test of Compound Planetary Transmission System

Due to their compact structure and strong bearing capacity, planetary gearboxes find extensive applications in various sectors, including automobiles, wind power, and ships. However, the aviation industry demands a transmission system with a more compact structure, stronger bearing capacity, and a greater transmission ratio under large transmission ratio conditions. The compound planetary transmission system exhibits enhanced load−sharing performance compared to the traditional planetary system, while the inclusion of a double planetary row further optimizes its load−carrying capacity. However, the structure of the compound planetary transmission system determines that it has higher requirements for lubricant quality. An explosion diagram of various components of the compound planetary transmission system is shown in Figure 8.
In total, six groups of online wear tests were carried out on the compound planetary transmission system to verify the effect of viscosity, temperature, and water on lubricant oil film and gear wear. Six groups of wear tests with different water contents were set up to verify the effect of different water contents on the lubricant oil film and wear state. The research object was the friction pair composed of inner and outer planetary gears in the compound planetary transmission system. The six groups of test water content were 0%, 1.0%, 2.0%, 3.0%, 4.0%, and 5.0%; torque was 50 Nm; rotational speed was 800 rpm; and each group was run for 6 h to verify the effect of water content on lubricant oil film and gear wear.
In order to address the complex situation of surface morphology collection in the compound planetary transmission system, the moulding material was used to collect the 3D morphology of the tooth surface without damaging the gear [37]. A schematic diagram of surface replication by moulding material is shown in Figure 9. The properties of the moulding material are shown in Table 3. The surface morphology of the moulding material was observed using a WLI (ZeGage, ZYGO Compact, Middlefield, CT, USA).
The surface wear of the composite planetary transmission system was characterized by using SEM (ZEISS EVO 15, Carl Zeiss Microscopy GmbH, Jena, Germany), and the micro−morphology of the gear surface was analysed.

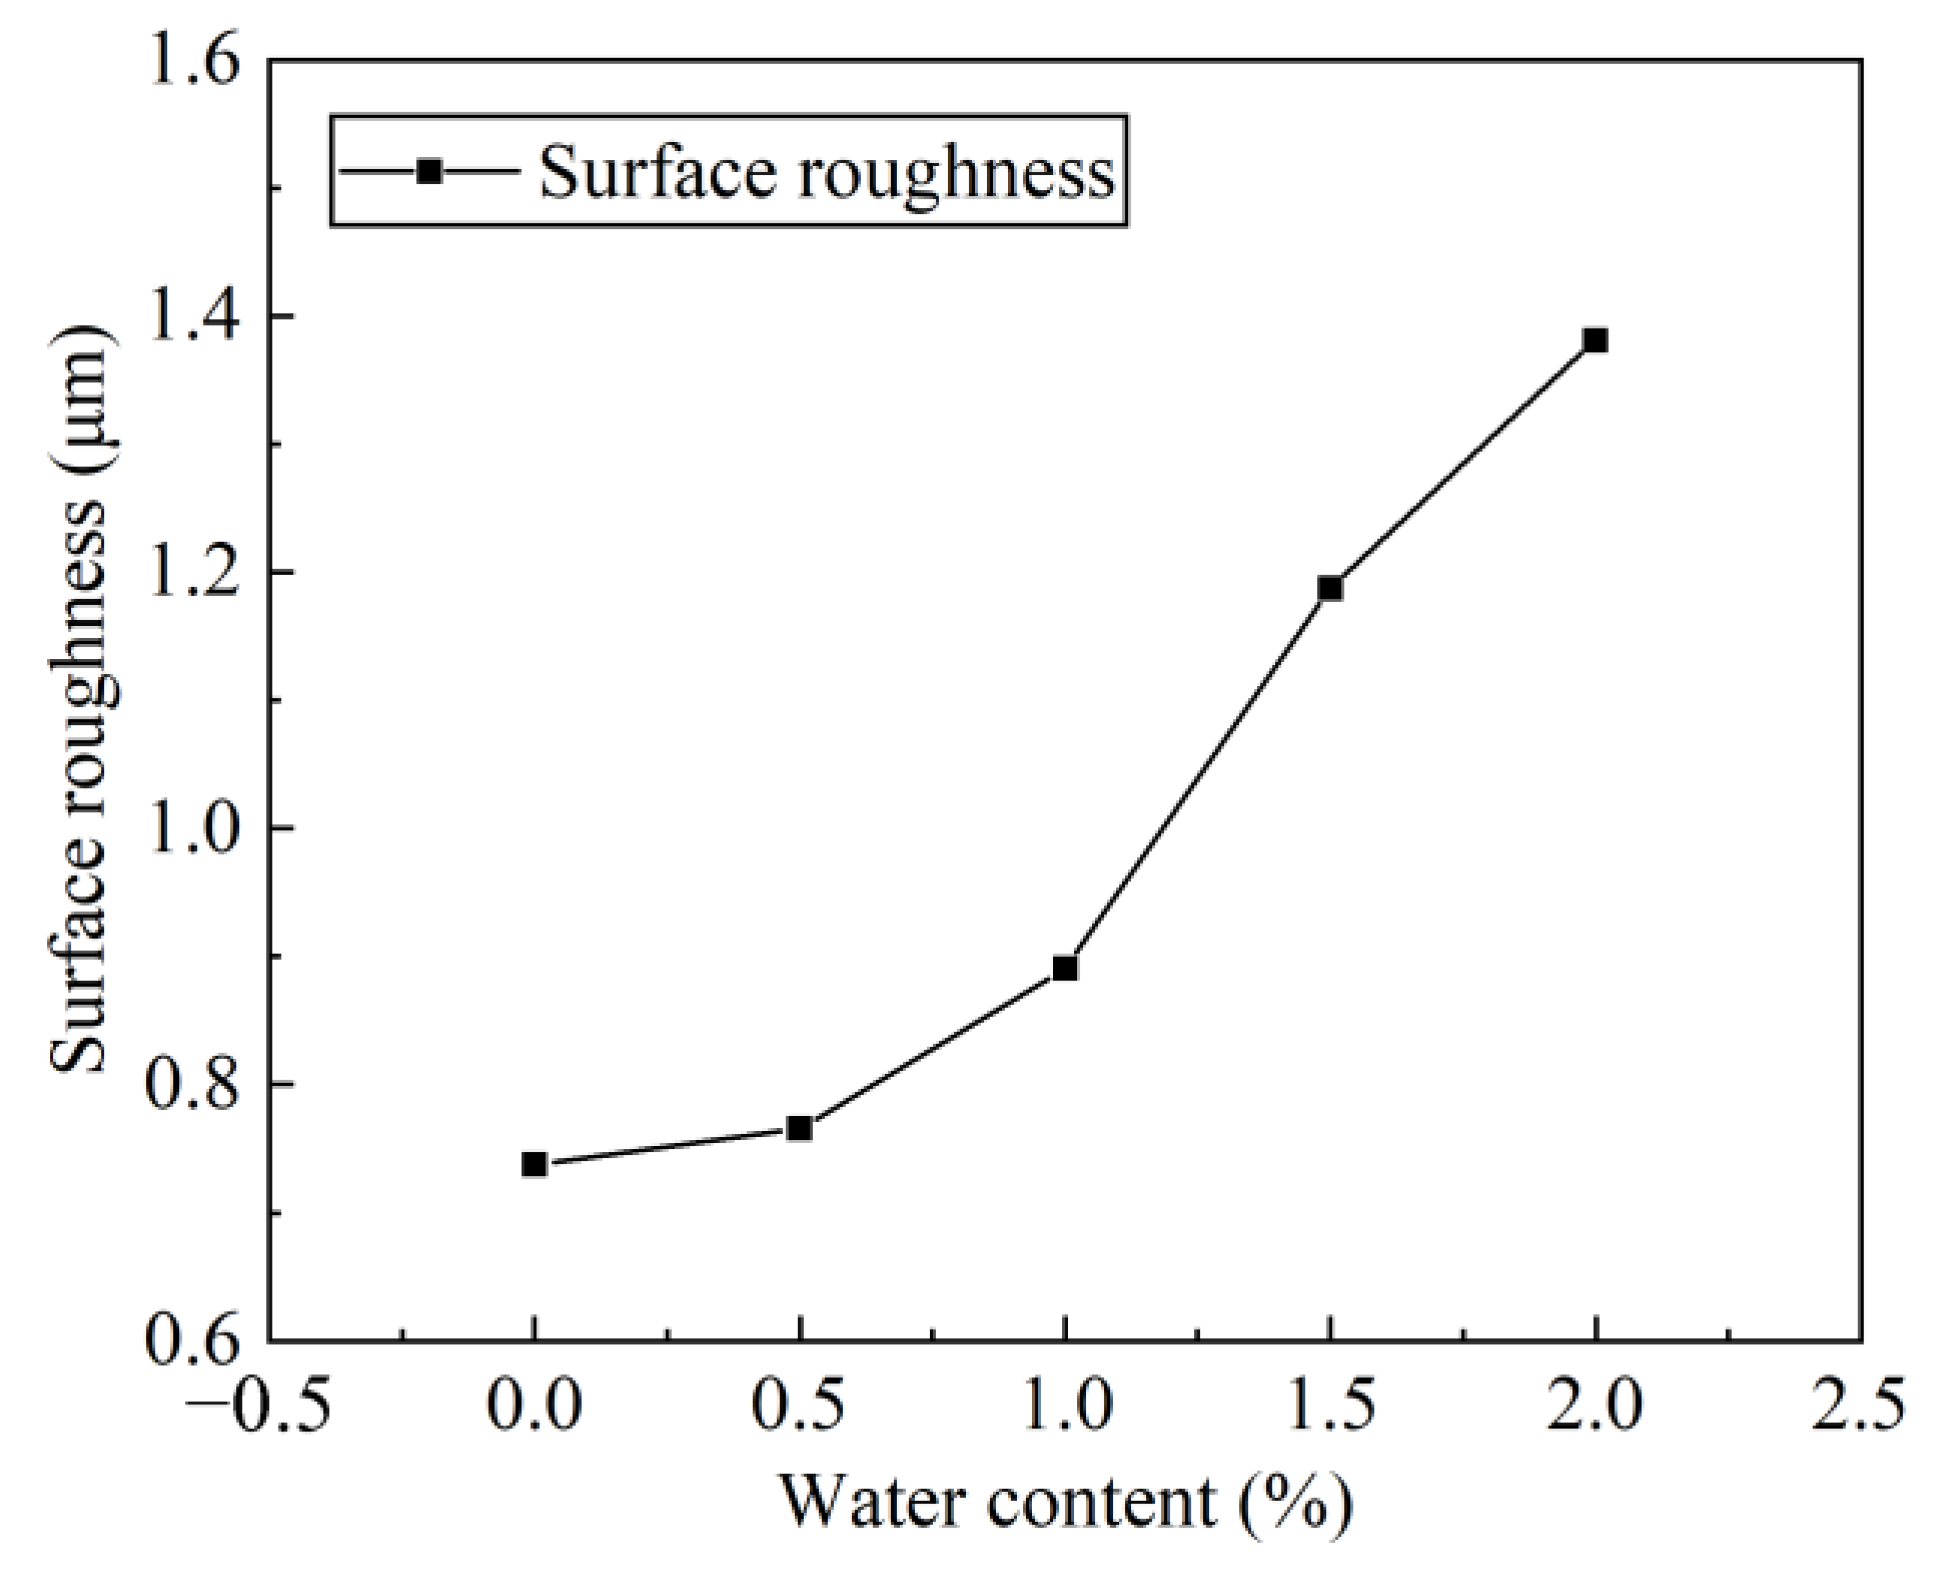
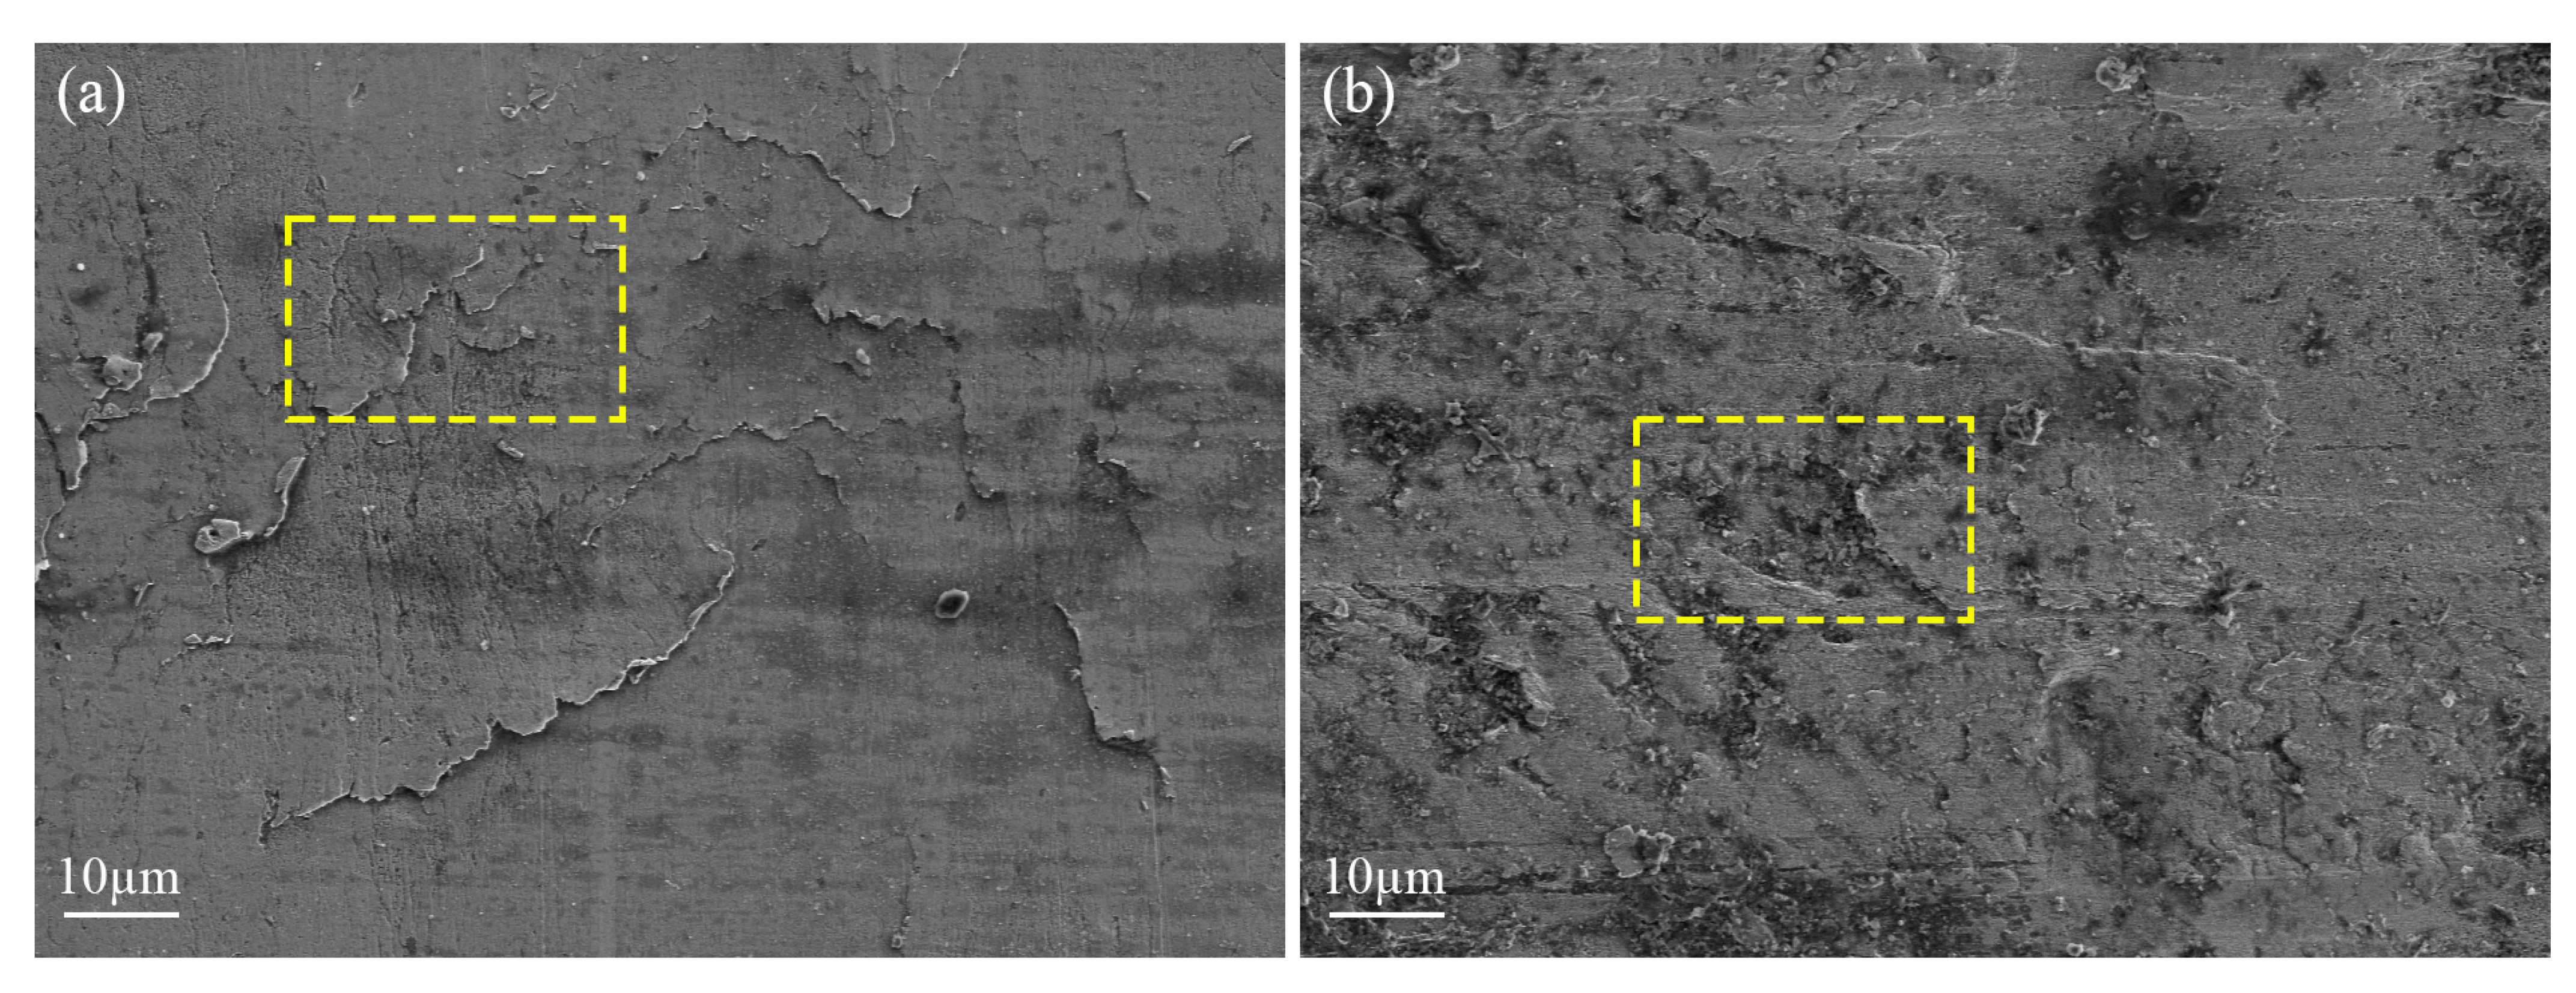
4.2. Characterization Results and Discussion

In the process of identifying the health state of mechanical equipment, the quality of the lubrication state is very important, and the surface roughness is an essential parameter. After each group of wear tests, take off the planetary gears to make duplicate rubber film, and observe and collect the gear surface roughness data under the WLI. Figure 10 lists the surface roughness of the gear after each group of test wear when the water content in the lubricant is 0%, 1.0%, 2.0%, 3.0%, 4.0% and 5.0%, respectively. It can be seen that as the water content of the lubricant increases, the 3D morphology of the gear surface also becomes rougher.
The WLI can be used to measure the 3D morphology to reflect the wear degree, but it is slightly insufficient to observe the finer wear characteristics. At this time, it is necessary to use SEM to more intuitively observe the tooth surface wear condition and fault type. When the water content in the lubricant is 0%, micro−cracks appear on the tooth surface, due to the combined action of relative sliding and stress, and there is a tendency for them to expand and connect with each other, which is the initial manifestation of pitting failure (see yellow dashed boxes in Figure 11a). When the water content in the lubricant is 2%, increased wear results in rougher tooth surfaces and pitting pits are formed (see yellow dashed boxes in Figure 11b).

5. Conclusions

This study investigated the deterioration process of hydrocarbon lubricants in high−temperature and humid environments, and proposed a novel health state prediction model.
The principle of the thermal oxidation process of hydrocarbon lubricant was analysed, and the high−temperature thermal oxidation process of the PAO molecule in hydrocarbon lubricant was simulated by using the ReaxFF force field. The results showed that an increase in the amount of small molecular compounds in the high−temperature oxidation reaction products led to a decrease in the kinematic viscosity of the lubricant.
The oil–water emulsions with different water contents were observed, and the micro−droplets and macro−morphology of the oil–water two−phase mixture were analysed. It was found that when the water content of the lubricant reached 30%, the oil–water emulsion changed from the oil−in−water phase to the water−in−oil phase, and the viscosity first increased and then decreased.
By detecting the linear relationship between the viscosity of lubricant affected by temperature and water content and fitting the existing Andrade viscosity–temperature equation, a high−precision prediction model of the lubricant viscosity was established. The safety state threshold of lubricant viscosity at different water content was determined using the threshold line method.
Taking the compound planetary gearbox test rig as the carrier and the planetary gear friction pair as the research object, the linear correlation between the online test data and the lubricant viscosity prediction model is 0.966. The effect of changes in lubricant quality on the surface wear of transmission components is consistent with the wear trend observed in the surface morphology collected by the 3D morphology of WLI and SEM.
The research content introduced in the paper is founded on the monitoring data from a compound planetary transmission system, but it can also be applied to predict the quality of the lubricant for other mechanical equipment requiring lubrication. This provides a fundamental basis for the assessment of lubricant service life in high temperatures and humid environments.

Author Contributions

Conceptualization, R.S. and W.C.; methodology, R.S. and Z.J.; software, Z.J.; validation, Y.W.; formal analysis, R.S.; investigation, Z.J.; resources, L.D.; data curation, Y.W.; writing−original draft preparation, Z.J.; writing−review and editing, R.S. and W.C.; visualization, M.M.; supervision, D.W.; project administration, D.W.; funding acquisition, W.C. All authors have read and agreed to the published version of the manuscript.

Funding

This research was supported by the National Natural Science Foundation of China (NSFC Grant No. 52175113), the International Science and Technology Cooperation and Exchange Key Program of Shaanxi Province (Grant No. 2023−GHZD−36), the Outstanding Thesis Cultivation Fund of Xi’an University of Technology in 2023 (Grant No. YS202304) and the research plan on teacher development of Shaanxi Provincial Department of Education (Grant No. SJS2022ZY015).

Data Availability Statement

Data are available upon request from the authors.

Conflicts of Interest

The authors declare that they have no known competing financial interests or personal relationships that could have appeared to influence the work reported in this paper.

References

  1. Chu, S.; Majumdar, A. Opportunities and challenges for a sustainable energy future. Nature 2012, 488, 294–303. [Google Scholar] [CrossRef] [PubMed]
  2. Cao, W.; Dong, G.; Xie, Y.B.; Peng, Z. Prediction of wear trend of engines via on−line wear debris monitoring. Tribol. Int. 2018, 120, 510–519. [Google Scholar] [CrossRef]
  3. Holmberg, K.; Anderson, P.; Erdemir, A. Global energy consumption due to friction in passenger cars. Tribol. Int. 2012, 47, 221–234. [Google Scholar] [CrossRef]
  4. Holmberg, K.; Erdemir, A. Influence of tribology on global energy consumption, costs and emissions. Friction 2017, 5, 263–284. [Google Scholar] [CrossRef]
  5. Ciulli, E. Vastness of Tribology Research Fields and Their Contribution to Sustainable Development. Lubricants 2024, 12, 33. [Google Scholar] [CrossRef]
  6. Cao, W.; Han, Z.; Yang, Z.Z.; Wang, N.; Qu, J.X.; Wang, D. Deterioration state diagnosis and wear evolution evaluation of planetary gearbox using vibration and wear debris analysis. Measurement 2022, 193, 110978. [Google Scholar] [CrossRef]
  7. Airey, J.; Spencer, M.; Greenwood, R.; Simmons, M. The effect of gas turbine lubricant base oil molecular structure on friction. Tribol. Int. 2020, 146, 106052. [Google Scholar] [CrossRef]
  8. Cao, W.; Han, Z.; Chen, Z.Q.; Jin, Z.L.; Wu, J.J.; Qu, J.X.; Wang, D. The influence of wear volume on surface quality in grinding process based on wear prediction model. Int. J. Adv. Manuf. Technol. 2022, 121, 5793–5809. [Google Scholar] [CrossRef]
  9. Kaminski, P. Experimental investigation into the effects of fuel dilution on the change in chemical properties of lubricating oil used in fuel injection pump of Pielstick PA4 V185 marine diesel engine. Lubricants 2022, 10, 162. [Google Scholar] [CrossRef]
  10. Tian, X.; Song, N.; Yang, G.; Zhou, C.H.; Zhang, S.M.; Zhang, P.Y. Organic−Sulfonate Functionalized Graphene as a High Temperature Lubricant for Efficient Antifriction and Antiwear in Water Based Drilling Fluid. Tribol. Lett. 2022, 70, 32. [Google Scholar] [CrossRef]
  11. Nagendramma, P.; Kaul, S.; Bisht, R.P.S. Study of synthesised ecofriendly and biodegradable esters: Fire resistance and lubricating properties. Lubr. Sci. 2010, 22, 103–110. [Google Scholar] [CrossRef]
  12. Wang, J.; Sun, C.; Lin, B.C.; Huang, Q.X.; Ma, Z.Y.; Chi, Y.; Yan, J.H. Micro− and mesoporous−enriched carbon materials prepared from a mixture of petroleum−derived oily sludge and biomass. Fuel Process. Technol. 2018, 171, 140–147. [Google Scholar] [CrossRef]
  13. Makaryan, I.A.; Sedov, I.V. Market Potential of Industrial Technologies for Production of Synthetic Bases of Motor Oils. Russ. J. Gen. Chem. 2021, 91, 1243–1259. [Google Scholar] [CrossRef]
  14. Liu, X.; Yamaguchi, R.; Umehara, N.; Deng, X.; Kousaka, H.; Murashima, M. Clarification of high wear resistance mechanism of ta−CNx coating under poly alpha−olefin (PAO) lubrication. Tribol. Int. 2017, 105, 193–200. [Google Scholar] [CrossRef]
  15. Wang, W.W.; Li, P.; Sheng, S.Z.; Tian, H.T.; Zhang, X. Influence of Hydrocarbon Base Oil Molecular Structure on Lubricating Properties in Nano−scale Thin Film. Tribol. Lett. 2019, 67, 111. [Google Scholar] [CrossRef]
  16. Zhang, X.A.; Zhao, Y.; Ma, K.; Wang, Q. Friction behavior and wear protection ability of selected base lubricants. Friction 2016, 4, 72–83. [Google Scholar] [CrossRef]
  17. Wu, N.; Zong, Z.M.; Fei, Y.W.; Ma, J.; Guo, F. Thermal oxidation stability of poly−α−olefin lubricating oil. Asia−Pac. J. Chem. Eng. 2017, 12, 813–817. [Google Scholar] [CrossRef]
  18. Ouyang, W.; Yan, Z.; Zhou, X.; Luo, B.; Wang, B.; Huang, J.A. Thermal Hydrodynamic Model for Emulsified Oil−Lubricated Tilting−Pad Thrust Bearings. Lubricants 2023, 11, 529. [Google Scholar] [CrossRef]
  19. Harika, E.; Bouyer, J.; Fillon, M.; Hélène, M. Effects of Water Contamination of Lubricants on Hydrodynamic Lubrication: Rheological and Thermal Modeling. J. Tribol. 2013, 135, 1115–1124. [Google Scholar] [CrossRef]
  20. Wang, Z.N.; Li, J.J.; Liu, Y.H.; Luo, J.B. Synthesis and characterizations of zwitterionic copolymer hydrogels with excellent lubrication behavior. Tribol. Int. 2019, 143, 106026. [Google Scholar] [CrossRef]
  21. Liang, H.; Guo, D.; Ma, L.R.; Luo, J.B. Increased Film Thickness of Oil−in−Water (O/W) Emulsions at High Speed. Tribol. Lett. 2017, 65, 68. [Google Scholar] [CrossRef]
  22. Dittes, N.; Sjodahl, M.; Pettersson, A.; Lang, D.F. Corrosion sensor for water contaminated grease. Tribol. Trans. 2020, 63, 891–896. [Google Scholar] [CrossRef]
  23. Lu, W.L.; Zhai, W.Z.; Zhang, P.; Zhou, M.Z.; Liu, X.J.; Zhou, L.P. Effect of different levels of free water in oil on the fretting wear of nickel−aluminum bronze based composites. Wear 2017, 390–391, 376–384. [Google Scholar] [CrossRef]
  24. Qin, H.; Doll, G.L. Effects of water contamination on micropitting and rolling contact fatigue of bearing steels. ASME J. Tribol. 2023, 145, 011501. [Google Scholar] [CrossRef]
  25. Dawczyk, J.; Morgan, N.; Russo, J.; Spikes, H. Film Thickness and Friction of ZDDP Tribofilms. Tribol. Lett. 2019, 67, 34. [Google Scholar] [CrossRef]
  26. Meng, Y.G.; Xu, J.; Ma, L.R.; Jin, Z.M.; Prakash, B.; Ma, T.B.; Wang, W.Z. A review of advances in tribology in 2020–2021. Friction 2022, 10, 1443–1595. [Google Scholar] [CrossRef]
  27. Noureddini, H.; Teoh, B.C.; Clements, L.D. Viscosities of vegetable oils and fatty acids. J. Am. Oil Chem. Soc. 1992, 69, 1189–1191. [Google Scholar] [CrossRef]
  28. Singh, A.K.; Mukherjee, P.S.; Mishra, N.M. Interrelationship among viscosity, temperature and age of lubricant. Ind. Lubr. Tribol. 2006, 58, 50–55. [Google Scholar] [CrossRef]
  29. Hong, S.H.; Kim, K.W. The validity of the Reynolds equation in spool valve analysis considering cavitation. Friction 2016, 4, 266–276. [Google Scholar] [CrossRef]
  30. Roy, S.; Pedersen, H.; Sinha, S.; Hansen, A. The Co−Moving Velocity in Immiscible Two−Phase Flow in Porous Media. Transp. Porous. Med. 2022, 143, 69–102. [Google Scholar] [CrossRef]
  31. Gan, Z.T.; Yao, T.; Zhang, M.; Hu, J.Q.; Liao, X.X.; Shen, Y.L. Effect of Temperature on the Composition of a Synthetic Hydrocarbon Aviation Lubricating Oil. Materials 2020, 13, 1606. [Google Scholar] [CrossRef] [PubMed]
  32. Frauscher, M.; Besser, C.; Allmaier, G.; Dörr, N. Oxidation Products of Ester−Based Oils with and without Antioxidants Identified by Stable Isotope Labelling and Mass Spectrometry. Appl. Sci. 2017, 7, 396. [Google Scholar] [CrossRef]
  33. Gopal, K.N.; Raj, R.T.K. Effect of pongamia oil methyl ester−diesel blend on lubricating oil degradation of di compression ignition engine. Fuel 2016, 165, 105–114. [Google Scholar] [CrossRef]
  34. Chen, M.Q.; He, M.X.; Li, M.; Qu, Q.H. Application of Interval Selection Methods in Quantitative Analysis of Water Content in Engine Oil by Terahertz Spectroscopy. Spectrosc. Spect. Anal. 2021, 41, 1393–1397. [Google Scholar] [CrossRef]
  35. Jiang, C.; Wang, Y.N.; Su, H.G.; Li, W.M.; Lou, W.J.; Wang, X.B. Synthesis and evaluation of a protic ionic liquid as a multifunctional lubricant additive. Friction 2020, 8, 568–576. [Google Scholar] [CrossRef]
  36. Li, Y.B.; He, T.S.; Hu, Z.M.; Zhang, Y.Q.; Luo, Q.; Pu, W.F.; Zhao, J.Z. Study on the mathematical model for predicting settling of water−in−oil emulsion. J. Petrol. Sci. Eng. 2021, 206, 109070. [Google Scholar] [CrossRef]
  37. Chang, H.C.; Borghesani, P.; Smith, W.A.; Peng, Z.X. Application of surface replication combined with image analysis to investigate wear evolution on gear teeth−A case study. Wear 2019, 430, 355–368. [Google Scholar] [CrossRef]
Figure 1. Molecular structure: (a) PAO molecule, (b) O2 molecule, (c) PAO molecule ReaxFF MD structure.
Lubricants 12 00116 g001
Figure 2. Emulsion oil preparation and analysis.
Lubricants 12 00116 g002
Figure 3. Molecular simulation results of 1473 K isothermal reaction and main fragments: (a) 10 ps, (b) 10 ps, (c) 10−20,000 ps, (d) 5000 ps, (e) 5000−20,000 ps, (f) 5000−20,000 ps, (g) 10,000 ps, (h) 10,000−20,000 ps, (i) 10,000−20,000 ps.
Lubricants 12 00116 g003
Figure 4. Changes in the number of molecules in the 1473 K isothermal reaction.
Lubricants 12 00116 g004
Figure 5. Micro− and macro−morphology of emulsified oil with water content in: (a) 0%, (b) 1%, (c) 2%, (d) 5%, (e) 30%, (f) 90%.
Lubricants 12 00116 g005
Figure 6. Characteristics of lubricant viscosity: (a) effect of lubricant viscosity of different temperature, (b) Andrade viscosity–temperature equation is fitted with measured data, (c) Walther viscosity–temperature equation is fitted with measured data, (d) viscosity prediction model validation.
Lubricants 12 00116 g006
Figure 7. Safety thresholds of lubricants with water content in (a) 0%, (b) 1%, (c) 2%, (d) 3%, (e) 4%, (f) 5%.
Lubricants 12 00116 g007
Figure 8. Explosion diagram of various components of the compound planetary transmission system.
Lubricants 12 00116 g008
Figure 9. Schematic diagram of surface replication by moulding material.
Lubricants 12 00116 g009
Figure 10. Surface roughness of the gear with different water content.
Lubricants 12 00116 g010
Figure 11. SEM with different water content: (a) 0% and (b) 2%.
Lubricants 12 00116 g011
Table 1. Parameters of lubricant.
Product No.Kinematic Viscosity (40 °C)Kinematic Viscosity (100 °C)Viscosity IndexFlash Point (Opening)Pour Point
KunLun
GL−5 85W/90
182.1 mm2/s16.5 mm2/s96230 °C−20 °C
Table 2. Safety threshold of viscosity of lubricant with different water content.
Water ContentStabilization TimeThreshold TimeSafety Threshold
0%160 min115 min142.89 mm2/s
1%160 min100 min197.85 mm2/s
2%160 min115 min201.52 mm2/s
3%160 min115 min201.82 mm2/s
4%160 min120 min232.79 mm2/s
5%160 min115 min234.82 mm2/s
Table 3. The properties of the moulding material.
Model No.AccuracyHardnessDimensional ChangesWorking TemperatureSetting Time
MICROSET
101 RF
0.1 μm28–30 Shore A<0.1%−10 °C–180 °C5 min
Disclaimer/Publisher’s Note: The statements, opinions and data contained in all publications are solely those of the individual author(s) and contributor(s) and not of MDPI and/or the editor(s). MDPI and/or the editor(s) disclaim responsibility for any injury to people or property resulting from any ideas, methods, instructions or products referred to in the content.

