
Regional β-Diversity of Stream Insects in Coastal Alabama Is Correlated with Stream Conditions, Not Distance among Sites

1
Biology Department, University of South Alabama, Mobile, AL 36688, USA
2
Bedwell Biological LLC., 2617 Grey Stone Rd, Henderson, NV 89074, USA
*
Author to whom correspondence should be addressed.
Insects 2023, 14(11), 847; https://doi.org/10.3390/insects14110847
Submission received: 3 October 2023
/
Revised: 22 October 2023
/
Accepted: 25 October 2023
/
Published: 31 October 2023
(This article belongs to the Section Insect Ecology, Diversity and Conservation)
Abstract
:Simple Summary
Biodiversity is measured differently depending on the spatial scale of the study. Beta (β)-diversity, for example, is a calculated measurement that addresses changes in diversity across different assemblages in a specific region. Studies of β-diversity often address changes in diversity across gradients of environmental conditions and distance among sites. However, β-diversity of stream insects can be difficult to measure due to their hyper-diversity and challenging taxonomy. Our study investigated the association of β-diversity with habitat conditions and distance among these habitats for insects found in the coastal streams of Alabama, USA. Additionally, we looked for potential influences caused by seasonality (fall and summer) and the level of taxonomic identification (genus, species). Regardless of season, stream conditions were highly correlated with β-diversity. More specifically, stream size and water chemistry showed the highest associations with β-diversity. Changes in β-diversity were largely driven by species replacement (turnover) rather than species loss (nestedness). The taxonomic resolution had minimal effects on the calculations of β-diversity across environmental conditions. Distance among stream sites was never correlated with β-diversity. As we continue to face global insect declines, our study provides valuable insight into the patterns that drive changes in diversity across environmental gradients.
Abstract
β-diversity is often measured over both spatial and temporal gradients of elevation, latitude, and environmental conditions. It is of particular interest to ecologists, as it provides opportunities to test and infer potential causal mechanisms determining local species assemblages. However, studies of invertebrate β-diversity, especially aquatic insects, have lagged far behind other biota. Using partial Mantel tests, we explored the associations between β-diversity of insects found in the coastal streams of Alabama, USA, and stream conditions and distances among sites. β-diversity was expressed using the Sørensen index, βSor, stream conditions were expressed as principal components (PCs), and distances as Euclidean distances (km) among sites. We also investigated the impact of seasonality (fall, summer) and taxonomic resolution (genus, species) on βSor. Regardless of season, βSor was significantly correlated (p < 0.01; r > 0.44) with stream conditions (stream size and water chemistry), while taxonomic resolution had minimal effect on associations between βSor and stream conditions. Distance was never correlated with changes in βSor (p > 0.05). We extended the use of the Sørensen pair-wise index to a multiple-site dissimilarity, βMult, which was partitioned into patterns of spatial turnover (βTurn) and nestedness (βNest). Changes in βMult were driven mostly by turnover rather than nestedness.
1. Introduction
A fundamental pattern of great interest to ecologists is how and why species diversity changes with location or time. Species diversity is scale dependent [1,2] and, as such, is generally examined with regards to three spatial levels: alpha (α)-, beta (β)-, and gamma (γ)-diversity [3,4,5]. Alpha diversity is the number of species in a local assemblage, whereas γ-diversity is the number of species in a regional pool. The change in species composition among local assemblages within a region is β-diversity. One can view β-diversity as the measurement that links α- and γ-diversity within a region [4,6]. β-diversity is of particular interest to ecologists as it provides an opportunity to test and infer potential causal mechanisms determining local species assemblages [7,8].
Although β-diversity is simple in concept, there are a bewildering number of indices, with no clear consensus for meaning, measurement, statistical analysis, or interpretation [8,9,10,11,12]. One reason for multiple perspectives is that β-diversity is a calculated index as opposed to an observed or estimated value, such as α-diversity and γ-diversity. However, two broad approaches have emerged. The first approach examines directional changes in species composition across local assemblages over measured or inferred gradients, such as distance or local environmental conditions [8,12]. The second approach examines changes across local assemblages without regard to a specific gradient and thus can be considered a measure of variation in species composition [12]. This second approach was expressed by Whittaker’s measurement, β = γ ÷ α, in which β-diversity is the ratio of γ-diversity and mean α-diversity [12]. We explore the former approach by examining directional changes in β-diversity over gradients of stream conditions and distance among sites.
Studies have examined patterns of β-diversity over various gradients, such as altitude [13,14], environmental conditions [15,16], and latitude [17,18,19]. However, studies of invertebrate β-diversity [20], especially stream insects, lag far behind studies of other biota [14]. Such studies are particularly important in stream systems, where the high biodiversity of organisms in the low area of the streambed results in habitats that are especially vulnerable to global changes [21]. Accordingly, these habitats are some of the most endangered ecosystems on the planet [22].
Though some studies have been conducted in similar stream systems in the southern United States [23,24] little is known about the ecology of the coastal streams of Alabama, which ultimately flow into the Gulf of Mexico [25,26]. These streams tend to be short, usually less than 40 km, with few, if any, tributaries. These sandy-bottom streams are generally meandering and slow-moving, flowing mostly through forested habitat. Like other freshwater systems, these streams are especially vulnerable to global changes [21], which makes them a sensitive “biological meter” for measuring widespread changes in biodiversity. These streams are of particular interest as many drain into what E.O. Wilson referred to as “America’s Amazon”—the Mobile Tensaw Delta (MTD). The MTD is a 1150-km2 relatively pristine area consisting largely of cypress-gum swamps and bottomland hardwood forests interlaced with large rivers, streams, canals, bayous, and marshes [27].
We calculated β-diversity as Sørensen pair-wise indices, βSor, among pairs of stream sites [28]. βSor is calculated using presence/absence data and can be expressed as:
where C is the number of species the two communities have in common, S1 is the total number of species found in community 1, and S2 is the total number of species found in community 2 [11]. Hence, this index can be viewed as the dissimilarity in species composition between any two sites.
Accordingly, our aim was to explore how patterns of βSor of lotic insects in these historically understudied coastal streams of Alabama changed over gradients of environmental conditions and distance. We also explored how seasons (fall and summer) and different taxonomic resolutions (genus only, genus/species mix, and species only) influenced patterns of βSor. We then extended the use of the Sørensen pair-wise index to a multiple-site dissimilarity index, βMult. [29]. Whereas Sørensen is an index of two sites in a region, βMult provides a measurement of dissimilarity among all sites in a region. This latter index can further divide into diversity due to species turnover (change) among sites (βTurn) and species nestedness (loss) among sites (βTurn). Hence, βMult = βTurn + βNest.
2. Materials and Methods
2.1. Study Sites and Sampling Protocols
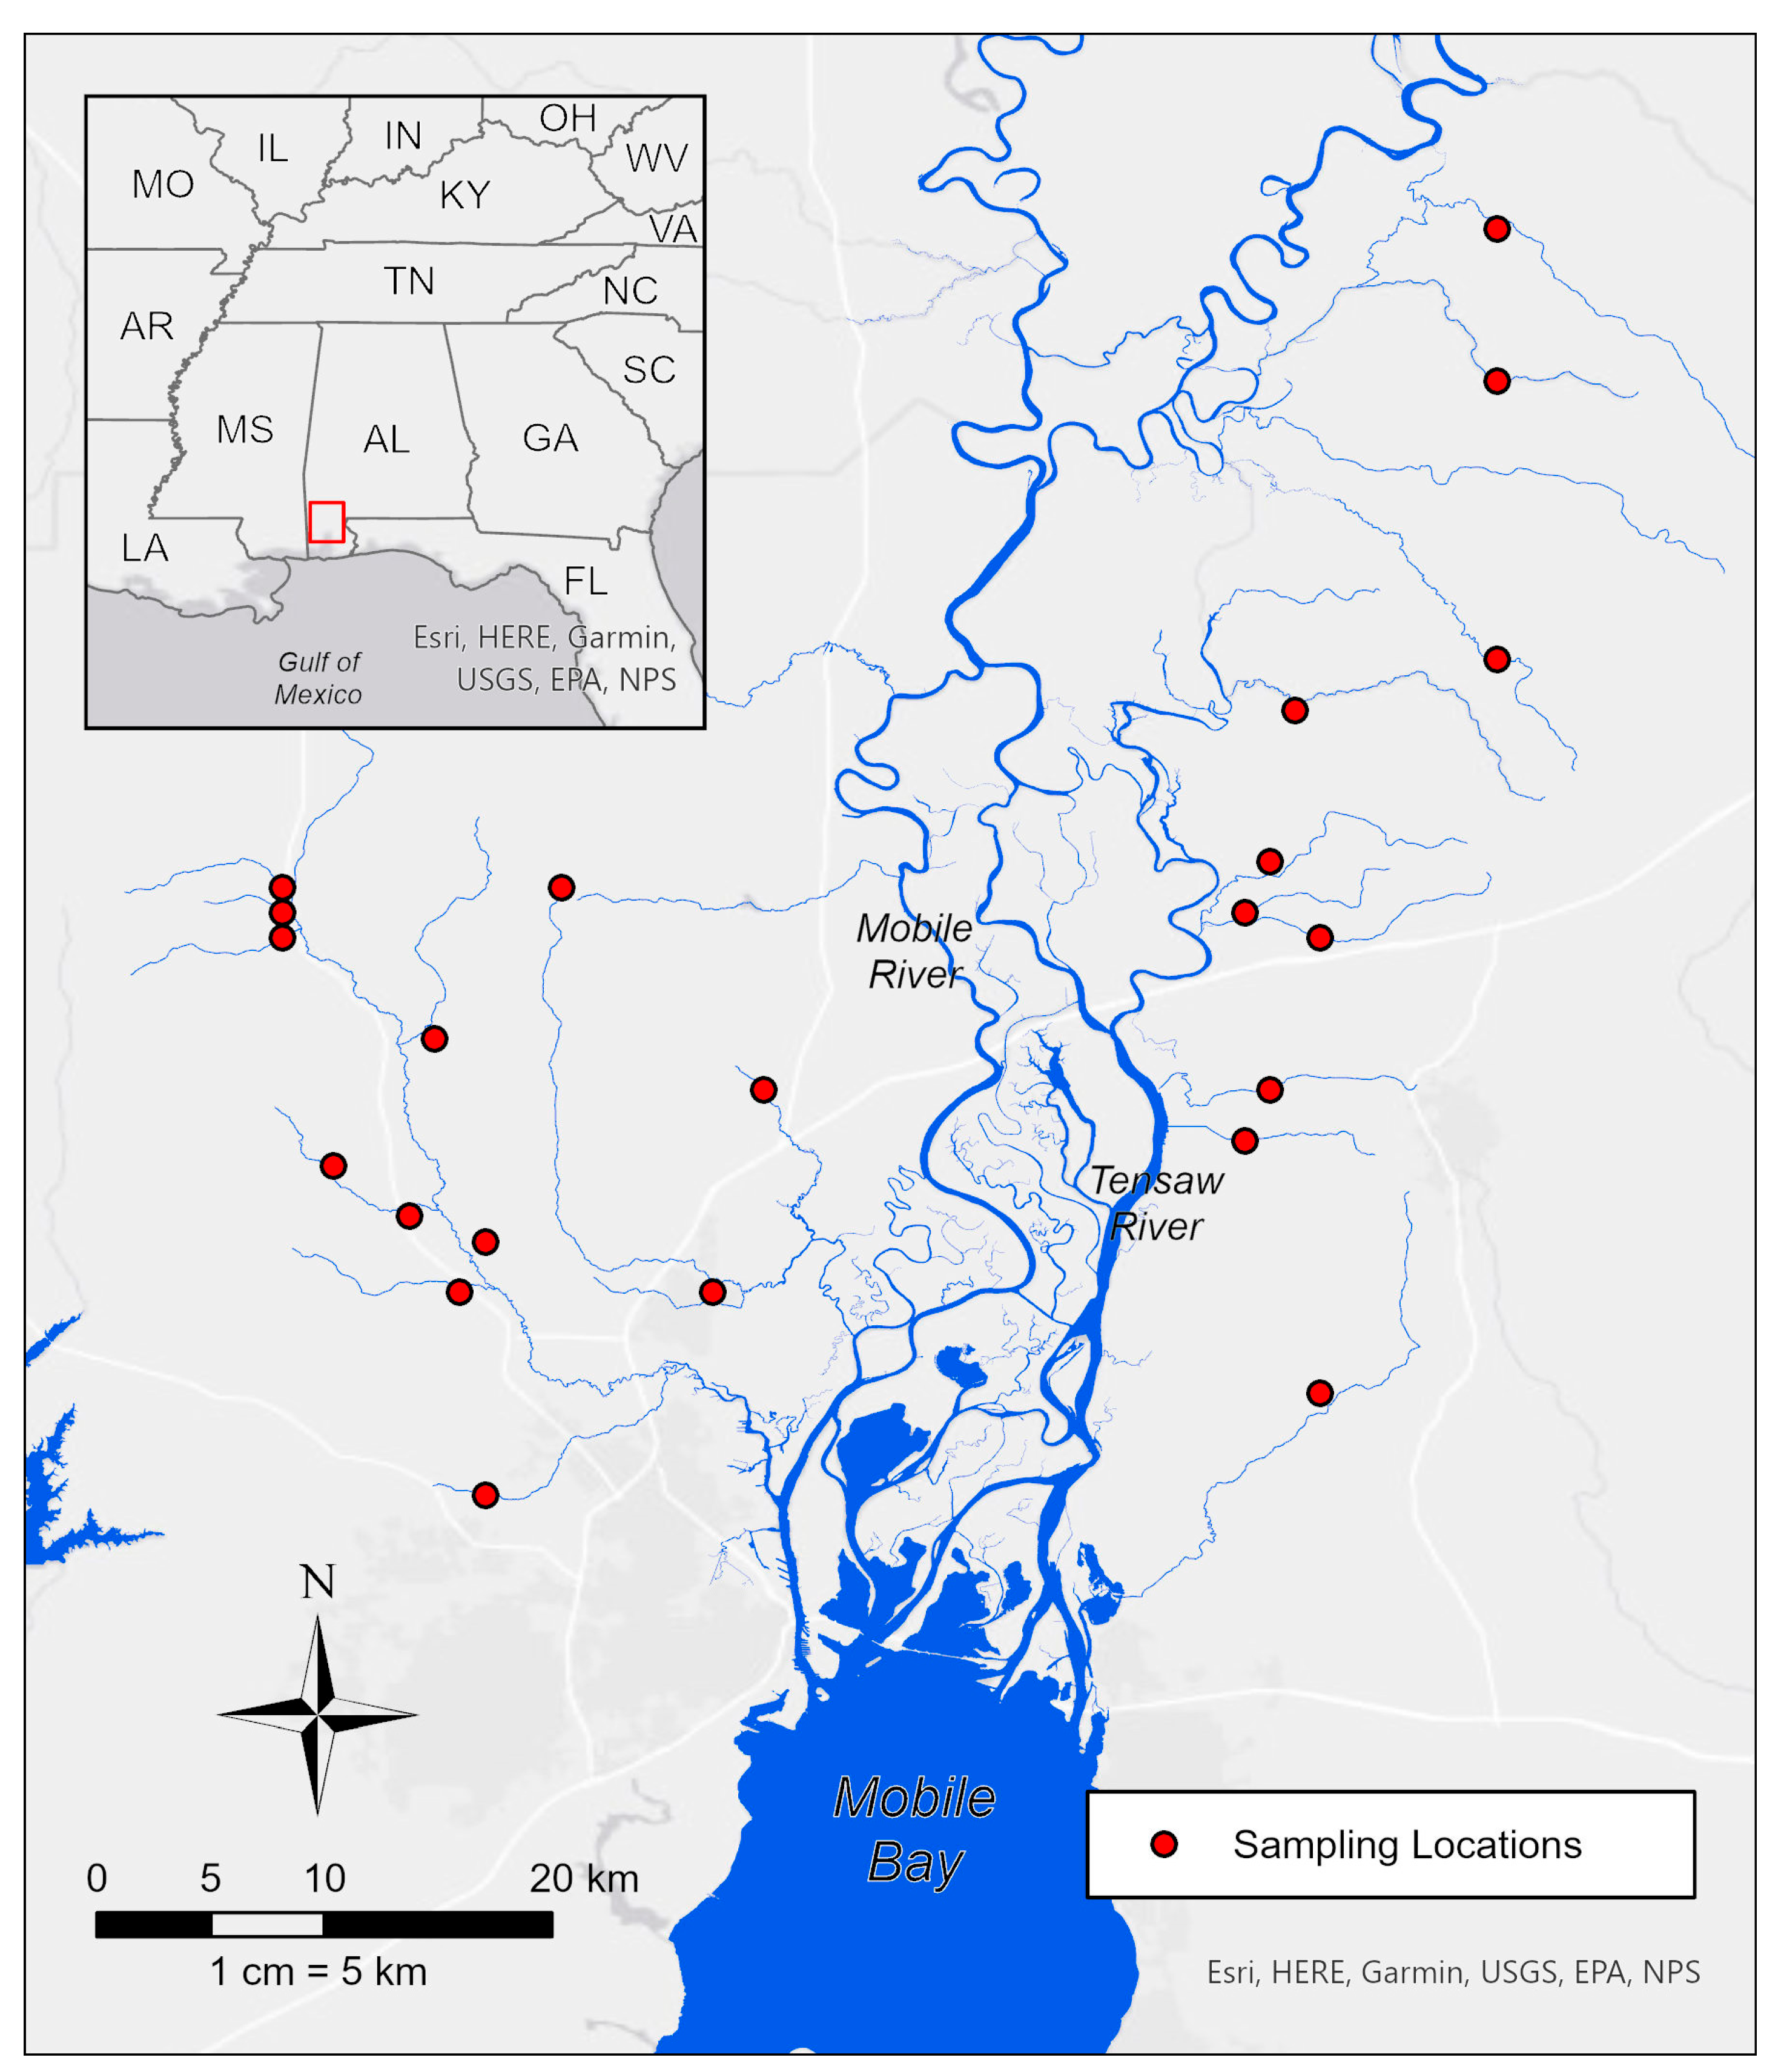
Details of the study area, sampling protocols, and measurements of stream conditions can be found in McCreadie and Bedwell [25]; here we present a brief summary for clarity. The study area is within the Southern Pine Hills and Coastal Lowlands districts of the lower Coastal Plain of Alabama, USA [30]. Watersheds in this area drain into the Mobile-Tensaw Delta, Mobile Bay, or the Gulf of Mexico. These coastal streams are low-gradient, meandering systems, with sand as the primary streambed substrate. Twenty-three streams between 30.74–31.25° N and 87.76–88.24° W (Figure 1) were sampled from 2 October to 17 November 2007 (fall collections), with 17 of these streams sampled from 29 May to 29 June 2007 (summer collections). Mean Euclidean distance (±SE) among sites in the fall was 26.7 ± 0.67 km and for summer sites, 25.6 ± 0.96 km.
At each stream site, a 100-m representative length of stream (scale = local assemblage) was delineated, and samples (n = 5), taken (randomly) within this length at each site for both the fall and summer sampling regimes. Insects were sampled using a standard 1 m × 1 m kick-net, mesh size 0.3 mm, over a standard quadrate size (PVC pipe) of 60 cm × 60 cm [31]. The streambed was dominated by shifting sand, with insects confined to isolated habitat patches such as snags or leaf packs. Using the protocols of McCreadie et al. [32], the following stream variables were recorded at each collection: width (W), depth (D), velocity (U), conductivity, pH, temperature, dissolved oxygen, riparian vegetation, canopy cover, and dominant streambed particle size. Riparian vegetation (open, brush, and forest), canopy cover (none, partial, and complete), and streambed (mud, sand, gravel, and cobble) were measured as rank variables. Discharge, Q (m3 s−1), was calculated as “W × D × U = Q”. Latitude and longitude were recorded using Garmin GPS units (Rino 110) (Kansas City, MO, USA). Water hardness was measured using CHEMetric® (Midland, VA, USA) titration cells. The above variables are considered to be influential determinants (or at least strong predictors) of species assemblages in stream habitats [33]. Range and mean stream conditions by site for both summer and fall collections are given in Table S1.
Samples were transported to the laboratory on ice and preserved in 95% ethanol until identification. For each sample, an effort was made to remove all insects, with no samples being sub-sampled. Of the separated insects, five taxonomic orders were selected for study due to their high abundance, functionalities, ease of identification, and broad representation of functional feeding groups. Specimens were identified following the keys of Epler [34] for Coleoptera, Pescador et al. [35] for Plecoptera, Rasmussen and Pescador [36] for Megaloptera, Daigle [37] and Richardson [38] for Odonata, and Pescador and Rasmussen [39] for Trichoptera. Ideally, identification should be at the species level; however, larvae of many aquatic species can only be identified by genus (e.g., Leuctra). In addition, while species keys exist, they are often only useful for later instars. Accordingly, all specimens were identified by either the level of genus or species. Hence, three taxonomic levels were subject to statistical analysis—mixed taxa of genus/species, generic data only, and species data only. Voucher specimens for identification were deposited in the University of South Alabama’s Arthropod Depository.
2.2. Statistical Analyses
All statistical tests were considered significant at p < 0.05, unless otherwise stated. To determine if our sampling protocol produced a reasonable estimate of the species present in the regional pool, species accumulation curves, using a bootstrap approach [40], were calculated for each combination of season (fall, summer) and level of identification (mixed genus/species, genus only, species only), with six calculations produced in total. Bootstrap estimators were based on 999 random sample-based re-orderings of observed taxonomic grouping for each level of sampling effort (number of sites), with 1 to 23 reorderings for fall collections and 1 to 17 for summer data. The maximum bootstrap estimator of species richness was then compared to the observed species richness for each season/taxonomic level combination.
Each partial Mantel test [41] was based on three matrices constructed for each season/taxonomic level combination. These matrices included one for distance, one for stream conditions, and one for β-diversity. Distance was expressed as the Euclidean pairwise distance between each site (km). Stream conditions were log-transformed and subsequently subjected to principal component analyses (PCA) for each season. PCs with eigenvalues greater than 1.00 were selected to represent stream variable proxies [42]. The interpretation of each PC was based on correlations between each PC and the original stream variable (p-value set at p < 0.01) to provide a rigorous interpretation of the PCs [42]. The third matrix was the pairwise comparison of the Sørensen index, βSor, a comparison of diversity between each site [12].
For each set of matrices, partial Mantel tests [41] were used to detect significant associations between the βSor andstream conditions (accounting for distance effects) and the βSor and distance matrix (accounting for stream conditions). Partial Mantel tests were calculated separately for both season and taxonomic resolution, with the significance of each partial correlation based on 5000 random permutations between matrices. Mantel tests have been used by previous authors and are considered a powerful approach for detecting spatial correlations [43].
We then extended the use of the βSor pairwise index to a multiple-site dissimilarity index, βMult, following Baselga [44]. βMult can further partition the pattern of species occurrences in the site-by-species matrix into spatial turnover (βTurn) and nestedness (βNest) or combinations thereof [44,45]. These two broad processes—replacement of species (spatial turnover) and species loss (nestedness)—determine the pattern of species occurrences on the site by species matrix [43]. These were presented as single measurements for each combination of season x taxonomic level data sets. Nestedness among local assemblages results when assemblages with fewer species are subsets of species in larger assemblages, reflecting processes that result in species loss from local assemblages [44,46,47]. Spatial turnover results from the replacement of species with other species across local assemblages [44].
3. Results
3.1. Collection and Identification
Table 1 summarizes the genera found in over 50% of sites, with the entire fauna collected presented in Table S2. For the summer collections, a total of 6281 specimens were identified from 17 stream sites, belonging to either genus or species, in 27 families and 61 genera. The most common genera encountered (>80% of sites) included the Elmidae (Dubiraphia, Stenelmis) and Leuctridae (Leuctra). A total of 20,739 specimens were identified from 23 sites in the fall for either genus or species, in 27 families and 66 genera. In these collections, the most frequent genera encountered (>80% of sites) included the Elmidae (Ancyronyx, Stenelmis), Coenagrionidae (Argia), Philopotamidae (Chimarra), Hydropsychidae (Hydropsyche, Cheumatopsychidae), Gomphidae (Progomphus), Perlidae (Acroneuria), and Leuctridae (Leuctra).
Differences between the number of taxa observed and the estimated bootstrap estimate of taxa (Table 2) were between 7.3 and 11.6%, with all estimated taxa higher than the observed number of taxa. We interpreted this to indicate a reasonable representation of the local insect stream fauna during the dates of collection.
3.2. Principal Component Analyses of Stream Variables
Five PCs were selected to express stream conditions for both the fall and summer data sets. Correlation analysis (p < 0.001) for the fall collections (Table 3) suggested PCs were largely a measure of stream size (discharge, depth) and water column variables (pH, conductivity, temperature, and hardness). In a similar vein, correlation analysis (p < 0.001) for the summer collections (Table 4) indicated PCs were also a measure of stream size (width and depth) and water column variables (pH, conductivity, oxygen, and hardness), in addition to the type of riparian vegetation (i.e., ranked as open, brush, or forest) [32].
3.3. Partial Mantel Test Correlations
Results of the partial Mantel tests (Table 5) showed that changes in βSor among sites were highly correlated (p = 0.0041–0.0001) with stream variables expressed as PCs. Given the correlations between stream variables and PCs, we interpreted this to indicate that β-diversity changed largely along gradients of stream size and water chemistry for both fall and summer collections, as well as riparian vegetation for summer collections. Mantel test correlations for species-level identification data were slightly lower than data for generic or mixed levels, regardless of season (Table 5). In contrast, distance among sites was never correlated with β-diversity (Table 5).
βMult was relatively consistent among all combinations of season and level of identification (βMult = 0.8210–0.8616). In addition, changes in βMult diversity among sites were largely the result of species turnover (βTurn = 0.7084 to 0.7916) as opposed to local species loss (βNest = 0.0697–0.1220) (Table 5).
4. Discussion
We examined two aspects of β-diversity: βSor was calculated as the dissimilarity for each pairwise site comparison, whereas βMult extended to all sites, producing a single estimate of overall β-diversity. Our results suggest that stream conditions had a profound effect on β-diversity of lotic insects, as indicated by the significant correlations between site conditions (expressed as PCs) and βSor. In contrast, spatial factors (i.e., distance among sites) showed no significant correlations with βSor at a regional scale. The level of taxonomic precision (species, mixed, and genus) had minimal influence on the correlation, with βSor correlations using species-level identification being marginally lower than data using mixed or generic-level identifications. Correlations between stream condition and taxonomic level of identification showed little difference between seasons (fall and summer). The complementary analysis of multisite estimates of β-diversity indicated that species turnover, βTurn, was consistently higher than species loss, βNest, for all data sets.
β-diversity is a measurement of differences in species composition among sites across gradients of habitat conditions or time. Accordingly, there has been substantial interest in β-diversity recently [8,11,12,44,50] as a means of understanding the causal factors that both determine and modulate community assemblages over space and time. In the current study, as stream conditions diverged among sites, so did the composition of the lotic insect assemblages. Changing habitat conditions over a gradient increases the number of niches and the potential for more species; thus, variation in species composition should increase among habitats [51,52], which in turn should increase β-diversity, as seen in our study. Correlation analysis with PCs and stream conditions suggested that the stream size and water column conditions were the main drivers of species replacement among sites. Stream size and water column conditions have been shown to be important factors (or at least predictors) in shaping local species assemblages of stream macroinvertebrates in both tropical and temperate streams [50,53,54,55,56].
Change in β-diversity among habitats is generally considered the result of two different processes, species turnover and species loss or gain [43], measured by βTurn and βNest, respectively. Species turnover is generally viewed as a result of niche-based species sorting along abiotic and biotic factors [43,44,57], although other processes can determine local assemblages [57,58]. Our analysis of partitioning βMult into these components of turnover and nestedness shows species turnover (βTurn) was much higher than nested patterns (βNest) in all six data sets. Hence, βTurn is essentially a measure of βMult at a regional scale in our study. To date, the majority of studies that have partitioned βMult show that changes in species composition are largely the result of species turnover (βTurn), with nested effects having minimal influence at regional scales [59]. Nestedness has often been viewed as a limitation in dispersal ability, particularly in aquatic habitats [60,61]. The consistently low βNest values and the nonsignificant results of distance in the Mantel tests suggest dispersal limitation was not an important mechanism for structuring species assemblages. However, the use of spatial variables as proxies for dispersal is not without criticism [62]. The low influence of spatial factors on insects at a regional level may be the result of at least three factors. First, all the insects we investigated have a winged adult stage, which would promote dispersal ability [50]. The second factor is a distribution/time element. Hence, though a species may not be able to directly disperse between two large distances, intervening habitats (i.e., other streams) could provide a means of ‘leap frogging’ to new sites. Given enough time, a species could then disperse to all viable sites within a region. It must also be noted that the scale of our study is relatively small (mean distance between sites ~25–30 km), which may have limited the influence of distance.
The minimal influence of taxonomic resolution (genus, mixed, and species) may be advantageous for studies of diversity that include taxa that are difficult or impossible to identify as species based on the morphology of early instars. We suggest the minimal effect of the season (fall, spring) in our results may be due to the fact that many of the species encountered in our study are multivoltine and are thus present throughout most or all of the year.
5. Conclusions
Despite the importance of aquatic insects as bioindicators of stream health, little is known about the spatiotemporal patterns of aquatic insect diversity. Additionally, even less is known about those that inhabit the coastal streams of Alabama, which drain into the highly diverse Mobile-Tensaw River Delta. Researching patterns of diversity in these insect communities has become especially pertinent as we continue to face a global crisis of insect decline. Our study provides foundational insight into the influences that drive aquatic insect diversity in coastal Alabama, but there is still more work to be done to understand the specific impacts and extent of these environmental changes over time. We suggest that future studies address the impacts of stream conditions on coastal Alabama’s insect diversity across both spatial and temporal scales.
Supplementary Materials
The following supporting information can be downloaded at: https://www.mdpi.com/article/10.3390/insects14110847/s1, Table S1: Mean stream conditions for stream insect collections, Mobile and Baldwin counties, Alabama for both summer and fall collections. Table S2: All genera found in summer (29 May to 29 June, 2007) and fall (2 October to 17 November, 2007) collections.
Author Contributions
Conceptualization, J.M. and C.S.; methodology, J.M. and C.B; formal analysis, J.M., C.S. and C.B.; data curation, C.B.; writing—original draft preparation, J.M. and C.S.; writing—review and editing, J.M. and C.S.; funding acquisition, J.M. All authors have read and agreed to the published version of the manuscript.
Funding
This research has been supported by grants from the Alabama Center for Estuarine Studies (ACES, R827072C030) under the U.S. Environmental Protection Agency’s Science to Achieve Results (STAR) program. Although the research described in the article has been funded by the U.S. Environmental Protection Agency’s STAR program, it has not been subjected to any EPA review and therefore does not necessarily reflect the views of the Agency, and no official endorsement should be inferred.
Data Availability Statement
Data is available (from JW McCreadie) to all interested parties once the manuscript is published. All generic identification of frequency of occurrence across sites is given in Table S2.
Acknowledgments
We would like to thank ACES under the STARS program for providing funding for this project. We would also like to thank Crystal Bedwell, Valerie Tollett, Znar Barwary, Elizabeth Benton, Rachel Larson, Rachel Ruttley, Katie Van Deven, and T.G. Jackson for assisting in the field collections for either one, or both, of the sampling seasons.
Conflicts of Interest
The authors declare no conflict of interest.
References
- Rosenzweig, M. Species Diversity in Space and Time, 1st ed.; Cambridge University Press: Cambridge, UK, 1995. [Google Scholar]
- Stevens, R.D.; Cox, S.B.; Strauss, R.E.; Willig, M.R. Patterns of functional diversity across an extensive environmental gradient: Vertebrate consumers, hidden treatments and latitudinal trends. Ecol. Lett. 2003, 6, 1099–1108. [Google Scholar] [CrossRef]
- Whittaker, R.H. Vegetation of the Siskiyou Mountains, Oregon and California. Ecol. Monogr. 1960, 30, 279–338. [Google Scholar] [CrossRef]
- Whittaker, R.H. Evolution and measurement of species diversity. Taxon 1972, 21, 213–251. [Google Scholar] [CrossRef]
- Whittaker, R.J.; Willis, K.J.; Field, R. Scale and species richness: Towards a general, hierarchical theory of species diversity. J. Biogeogr. 2001, 28, 453–470. [Google Scholar] [CrossRef]
- Ricklefs, R.E. Community diversity: Relative roles of local and regional processes. Science 1987, 235, 167–171. [Google Scholar] [CrossRef]
- Mouquet, N.; Loreau, M. Community patterns in source-sink metacommunities. Am. Nat. 2003, 162, 544–557. [Google Scholar] [CrossRef] [PubMed]
- Legendre, P.; Cáceres, M. Beta diversity as the variance of community data: Dissimilarity coefficients and partitioning. Ecol. Lett. 2013, 16, 951–963. [Google Scholar] [CrossRef]
- Vellend, M. Do commonly used indices of β-diversity measure species turnover? J. Veg. Sci. 2001, 12, 545–552. [Google Scholar] [CrossRef]
- Tuomisto, H.; Ruokolainen, K. Analyzing or explaining beta diversity? Understanding the targets of different methods of analysis. Ecology 2006, 87, 2697–2708. [Google Scholar] [CrossRef]
- Tuomisto, H. A diversity of beta diversities: Straightening up a concept gone awry. Part 1. Defining beta diversity as a function of alpha and gamma diversity. Ecography 2010, 33, 2–22. [Google Scholar] [CrossRef]
- Anderson, M.J.; Crist, T.O.; Chase, J.M.; Vellend, M.; Inouye, B.D.; Freestone, A.L.; Sanders, N.J.; Cornell, H.V.; Comita, L.S.; Davies, K.F.; et al. Navigating the multiple meanings of β diversity: A roadmap for the practicing ecologist. Ecol. Lett. 2011, 14, 19–28. [Google Scholar] [CrossRef] [PubMed]
- Castro, D.M.P.; Callisto, M.; Solar, R.R.C.; Macedo, D.R.; Fernandes, G.W. Beta diversity of aquatic invertebrates increases along an altitudinal gradient in a Neotropical mountain. Biotropica 2019, 51, 399–411. [Google Scholar] [CrossRef]
- Timoner, P.; Marle, P.; Castella, E.; Lehmann, A. Assessment of the stream invertebrate β-diversity along an elevation gradient using a bidimensional null model analysis. Ecol. Evol. 2022, 12, e9135. [Google Scholar] [CrossRef] [PubMed]
- Costa, S.S.; Melo, A.S. Beta diversity in stream macroinvertebrate assemblages: Among-site and among-microhabitat com-ponents. Hydrobiologia 2008, 598, 131–138. [Google Scholar] [CrossRef]
- Hepp, L.U.; Landeiro, V.L.; Melo, A.S. Experimental assessment of the effects of environmental factors and longitudinal position on alpha and beta diversities of aquatic insects in a Neotropical stream. Int. Rev. Hydrobiol. 2012, 97, 157–167. [Google Scholar] [CrossRef]
- Fine, P.V. Ecological and evolutionary drivers of geographic variation in species diversity. Annu. Rev. Ecol. Evol. Syst. 2015, 46, 369–392. [Google Scholar] [CrossRef]
- Qian, H.; Wang, X. Global relationships between beta diversity and latitude after accounting for regional diversity. Ecol. Inform. 2015, 25, 10–13. [Google Scholar] [CrossRef]
- Heino, J.; Alahuhta, J.; Fattorini, S.; Schmera, D. Predicting beta diversity of terrestrial and aquatic beetles using ecogeographical variables: Insights from the replacement and richness difference components. J. Biogeogr. 2019, 46, 304–315. [Google Scholar] [CrossRef]
- Magurran, A.E. Measuring biological diversity. Curr. Biol. 2021, 31, R1174–R1177. [Google Scholar] [CrossRef]
- Reid, A.J.; Carlson, A.K.; Creed, I.F.; Eliason, E.J.; Gell, P.A.; Johnson, P.T.J.; Kidd, K.A.; MacCormack, T.J.; Olden, J.D.; Ormerod, S.J.; et al. Emerging threats and persistent conservation challenges for freshwater biodiversity. Biol. Rev. 2019, 94, 849–873. [Google Scholar] [CrossRef]
- Pound, K.L.; Larson, C.A.; Passy, S.I. Current distributions and future climate-driven changes in diatoms, insects and fish in US streams. Glob. Ecol. Biogeogr. 2021, 30, 63–78. [Google Scholar] [CrossRef]
- Benke, A.C.; Wallace, J.B. Trophic basis of production among net-spinning caddisflies in a southern Appalachian stream. Ecology 1980, 61, 108–118. [Google Scholar] [CrossRef]
- Benke, A.C.; Henry, R.L.; Gillespie, D.M.; Hunter, R.J. Importance of snag habitat for animal production in southeastern streams. Fisheries 1985, 10, 8–13. [Google Scholar] [CrossRef]
- McCreadie, J.W.; Bedwell, C.R. Patterns of co-occurrence of stream insects and an examination of a causal mechanism: Ecological checkerboard or habitat checkerboard? Insect Conserv. Divers. 2013, 6, 105–113. [Google Scholar] [CrossRef]
- McCreadie, J.W.; Bedwell, C. Species composition of local riffle beetle assemblages in small coastal streams of the Gulf of Mexico: The influences of local and regional factors. Aquat. Ecol. 2014, 48, 127–141. [Google Scholar] [CrossRef]
- Smith, W.E. A Field Guide to Mobile Delta Geomorphology; Geological Survey of Alabama: Tuscaloosa, AL, USA, 1997; Volume 80. [Google Scholar]
- Sørensen, T. A method of establishing groups of equal amplitude in plant sociology based on similarity of species content and its application to analyses of the vegetation on Danish commons. Biol. Skr. 1948, 5, 1. [Google Scholar]
- Baselga, A.; Orme, C.D.L. Betapart: An R package for the study of beta diversity. Methods Ecol. Evol. 2012, 3, 808–812. [Google Scholar] [CrossRef]
- Burr, B.M.; Eisenhour, D.J.; Mettee, M.F.; O’Neil, P.E.; Pierson, J.M. Fishes of Alabama and the Mobile Basin, 1st ed.; Oxmoor House: Birmingham, AL, USA, 1996. [Google Scholar]
- Merritt, R.W.; Cummins, K.W. An Introduction to the Aquatic Insects of North America, 4th ed.; Kendall/Hunt: Dubuque, IA, USA, 2008; pp. 15–37. [Google Scholar]
- McCreadie, J.W.; Hamada, N.; Grillet, M.E. Spatial-temporal distribution of preimaginal blackflies in Neotropical streams. Hydrobiologia 2004, 513, 183–196. [Google Scholar] [CrossRef]
- Lancaster, J.; Allan, J.D. Stream Ecology: Structure and Function of Running Waters, 3rd ed.; Springer Nature: Berlin, Germany, 2007. [Google Scholar]
- Epler, J.H. Identification Manual for the Water Beetles of Florida: (Coleoptera: Dryopidae, Dytiscidae, Elmidae, Gyrinidae, Haliplidae, Hy-draenidae, Hydrophilidae, Noteridae, Psephenidae, Ptilodactylidae, Scirtidae); State of Florida, Department of Environmental Protection, Division of Water Facilities: Tallahassee, FL, USA, 1996. [Google Scholar]
- Pescador, M.L.; Rasmussen, A.K.; Richard, B.A.; McCarron, E. A Guide to the Stoneflies (Plecoptera) of Florida; State of Florida, Department of Environmental Protection, Division of Water Resource Management: Tallahassee, FL, USA, 2000. [Google Scholar]
- Rasmussen, A.K.; Pescador, M.L. A Guide to the Megaloptera and Aquatic Neuroptera of Florida; Department of Environmental Protection: Tallahassee, FL, USA, 2002. [Google Scholar]
- Daigle, J.J. Florida Dragonflies (Anisoptera): A Species Key to the Aquatic Larval Stages. Fla. Dep. Environ. Regul. Tech. Ser. 1992, 12, 29. [Google Scholar]
- Richardson, J.S. Identification Manual for the Dragonfly Larvae (Anisoptera) of Florida; State of Florida, Department of Environmental Protection: Tallahassee, FL, USA, 2003. [Google Scholar]
- Pescador, M.L.; Rasmussen, A.K.; Harris, S.C. Identification Manual for the Caddisfly (Trichoptera) Larvae of Florida; State of Florida, Florida Department of Environmental Protection: Tallahassee, FL, USA, 2004. [Google Scholar]
- Clarke, K.; Gorley, R. Plymouth Routines in Multivariate Ecological Research; Plymouth Marine Laboratory: London, UK, 2006. [Google Scholar]
- Mantel, N. The detection of disease clustering and a generalized regression approach. Cancer Res. 1967, 27 Pt 1, 209–220. [Google Scholar]
- Quinn, G.P.; Keough, M.J. Experimental Design and Data Analysis for Biologists, 1st ed.; Cambridge University Press: Cambridge, UK, 2002. [Google Scholar]
- Borcard, D.; Legendre, P. Is the Mantel correlogram powerful enough to be useful in ecological analysis? A simulation study. Ecology 2012, 93, 1473–1481. [Google Scholar] [CrossRef] [PubMed]
- Baselga, A. Partitioning the turnover and nestedness components of beta diversity. Glob. Ecol. Biogeogr. 2010, 19, 134–143. [Google Scholar] [CrossRef]
- Qian, H.; Ricklefs, R.E.; White, P.S. Beta diversity of angiosperms in temperate floras of eastern Asia and eastern North America. Ecol. Lett. 2005, 8, 15–22. [Google Scholar] [CrossRef]
- Patterson, B.D.; Atmar, W. Nested subsets and the structure of insular mammalian faunas and archipelagos. Biol. J. Linn. Soc. 1986, 28, 65–82. [Google Scholar] [CrossRef]
- Ulrich, W.; Gotelli, N.J. Disentangling community patterns of nestedness and species co-occurrence. Oikos 2007, 116, 2053–2061. [Google Scholar] [CrossRef]
- Clarke, K.; Gorley, R. PRIMER v6: User Manual/Tutorial; PRIMER-E: Plymouth, UK, 2006; p. 192. [Google Scholar]
- Hammer, Ø.; Harper, D.A.; Ryan, P.D. PAST–Palaeontological Statistics, version 1.90; University of Oslo: Oslo, Norway, 2009. [Google Scholar]
- Heino, J.; Melo, A.S.; Bini, L.M.; Altermatt, F.; Al-Shami, S.A.; Angeler, D.G.; Bonada, N.; Brand, C.; Callisto, M.; Cottenie, K.; et al. A comparative analysis reveals weak relationships between ecological factors and beta diversity of stream insect metacommunities at two spatial levels. Ecol. Evol. 2015, 5, 1235–1248. [Google Scholar] [CrossRef]
- Currie, D.J. Energy and large-scale patterns of animal-and plant-species richness. Am. Nat. 1991, 137, 27–49. [Google Scholar] [CrossRef]
- Leibold, M.A.; Holyoak, M.; Mouquet, N.; Amarasekare, P.; Chase, J.M.; Hoopes, M.F.; Holt, R.D.; Shurin, J.B.; Law, R.; Tilman, D.; et al. The metacommunity concept: A framework for multi-scale community ecology. Ecol. Lett. 2004, 7, 601–613. [Google Scholar] [CrossRef]
- Heino, J. Biodiversity of aquatic insects: Spatial gradients and environmental correlates of assemblage-level measures at large scales. Freshw. Rev. 2009, 2, 1–29. [Google Scholar] [CrossRef]
- McCreadie, J.W.; Adler, P.H. The roles of abiotic factors, dispersal, and species interactions in structuring stream assemblages of black flies (Diptera: Simuliidae). Aquat. Biosyst. 2012, 8, 14. [Google Scholar] [CrossRef]
- Al-Shami, S.A.; Heino, J.; Salmah, M.R.C.; ABU Hassan, A.; Suhaila, A.H.; Madrus, M.R. Drivers of beta diversity of macroinvertebrate communities in tropical forest streams. Freshw. Biol. 2013, 58, 1126–1137. [Google Scholar] [CrossRef]
- Ya’cob, Z.; Takaoka, H.; Pramual, P.; Low, V.L.; Sofian-Azirun, M. Distribution pattern of black fly (Diptera: Simuliidae) assemblages along an altitudinal gradient in Peninsular Malaysia. Parasites Vectors 2016, 9, 219. [Google Scholar] [CrossRef] [PubMed]
- Leibold, M.A.; Chase, J.M.; Ernest, S.K.M. Community assembly and the functioning of ecosystems: How metacommunity processes alter ecosystems attributes. Ecology 2017, 98, 909–919. [Google Scholar] [CrossRef] [PubMed]
- Thompson, P.L.; Guzman, L.M.; De Meester, L.; Horváth, Z.; Ptacnik, R.; Vanschoenwinkel, B.; Viana, D.S.; Chase, J.M. A process-based metacommunity framework linking local and regional scale community ecology. Ecol. Lett. 2020, 23, 1314–1329. [Google Scholar] [CrossRef] [PubMed]
- Leprieur, F.; Tedesco, P.A.; Hugueny, B.; Beauchard, O.; Dürr, H.H.; Brosse, S.; Oberdorff, T. Partitioning global patterns of freshwater fish beta diversity reveals contrasting signatures of past climate changes. Ecol. Lett. 2011, 14, 325–334. [Google Scholar] [CrossRef]
- Maloney, K.O.; Munguia, P.; Mitchell, R.M. Anthropogenic disturbance and landscape patterns affect diversity patterns of aquatic benthic macroin-vertebrates. J. N. Am. Benthol. Soc. 2011, 30, 284–295. [Google Scholar] [CrossRef]
- De Bie, T.; Meester, L.; Brendonck, L.; Martens, K.; Goddeeris, B.; Ercken, D.; Hampel, H.; Denys, L.; Vanhecke, L.; Gucht, K.; et al. Body size and dispersal mode as key traits determining metacommunity structure of aquatic organisms. Ecol. Lett. 2012, 15, 740–747. [Google Scholar] [CrossRef]
- Brown, B.L.; Wahl, C.; Swan, C.M. Experimentally disentangling the influence of dispersal and habitat filtering on benthic invertebrate com-munity structure. Freshw. Biol. 2018, 63, 48–61. [Google Scholar] [CrossRef]
Figure 1.
Location of stream sites sampled from October to November 2007, and May to June 2007. The inset map displayed in the top-left shows the proximity of the study region with respect to the Gulf of Mexico and surrounding states. The red outline within the inset map indicates the current map view.

Table 1.
Family and genera found in over 50% of sites for the summer (29 May to 29 June 2007) and fall (2 October to 17 November 2007) collections. A complete list of all genera is given in Table S2.
Table 1.
Family and genera found in over 50% of sites for the summer (29 May to 29 June 2007) and fall (2 October to 17 November 2007) collections. A complete list of all genera is given in Table S2.
| Summer Collections | Fall Collections | ||||
|---|---|---|---|---|---|
| Family | Genus | % Occurrence | Family | Genus | % Occurrence |
| Elimidae | Ancyronyx | 94.1 | Elmidae | Ancyronyx | 100.0 |
| Aeshnidae | Boyeria | 94.1 | Elmidae | Stenelmis | 95.7 |
| Elimidae | Stenelmis | 94.1 | Coenagrionidae | Argia | 91.3 |
| Elimidae | Dubiraphia | 82.4 | Philopotamidae | Chimarra | 91.3 |
| Leuctridae | Leuctra | 82.4 | Hydropsychidae | Hydropsyche | 91.3 |
| Gomphidae | Gomphus | 76.5 | Gomphidae | Progomphus | 91.3 |
| Hydropsychidae | Chimarra | 70.6 | Hydropsychidae | Cheumatopsyche | 87.0 |
| Elimidae | Gonielmis | 70.6 | Perlidae | Acroneuria | 82.6 |
| Perlidae | Acroneuria | 64.7 | Leuctridae | Leuctra | 82.6 |
| Perlidae | Neoperla | 64.7 | Gomphidae | Gomphus | 78.3 |
| Libellulidae | Neurocordulia | 64.7 | Libellulidae | Neurocordulia | 78.3 |
| Hydropsychidae | Cheumatopsyche | 58.8 | Leptoceridae | Oecetis | 78.3 |
| Macromiidae | Macromia | 58.8 | Calamoceratidae | Anisocentropus | 73.9 |
| Gomphidae | Progomphus | 58.8 | Elmidae | Gonielmis | 73.9 |
| Perlidae | Perlesta | 52.9 | Elmidae | Microcylloepus | 73.9 |
| Elmidae | Dubiraphia | 69.6 | |||
| Perlidae | Perlinella | 69.6 | |||
| Aeshnidae | Boyeria | 65.2 | |||
| Brachycentridae | Brachycentrus | 65.2 | |||
| Perlidae | Paragnetina | 65.2 | |||
| Psephenidae | Ectopria | 56.5 | |||
| Calopterygidae | Calopteryx | 52.2 | |||
| Polycentropodidae | Neuroclipsis | 52.2 | |||
Table 2.
Observed number of taxa for each data set and the bootstrap estimate of the number of taxa.
Table 2.
Observed number of taxa for each data set and the bootstrap estimate of the number of taxa.
| Data Set | Observed No. of Taxa | Bootstrap Estimator of Taxa |
|---|---|---|
| Fall | ||
| Genus/species | 98 | 107.8 |
| Genus | 75 | 80.9 |
| Species | 44 | 49.2 |
| Summer | ||
| Genus/species | 83 | 93.9 |
| Genus | 62 | 67.8 |
| Species | 50 | 56.5 |
Table 3.
Principal component analysis of stream variables and correlation analysis of principal component scores to the original stream variables, fall 2007. Mean values and ranges of the stream variables are listed in Table S1.
Table 3.
Principal component analysis of stream variables and correlation analysis of principal component scores to the original stream variables, fall 2007. Mean values and ranges of the stream variables are listed in Table S1.
| Principal Components (PC) | |||||
|---|---|---|---|---|---|
| PC1 | PC2 | PC3 | PC4 | PC5 | |
| Eigen Analysis | |||||
| Eigenvalue | 3.1060 | 2.7122 | 1.9497 | 1.3903 | 1.1557 |
| % Proportion variance explained | 0.239 | 0.209 | 0.150 | 0.107 | 0.089 |
| % Cumulative variance explained | 0.239 | 0.448 | 0.598 | 0.704 | 0.793 |
| Correlation analysis 1 | |||||
| Depth | 0.363 | −0.650 ** | 0.377 | 0.343 | −0.190 |
| Velocity | 0.622 * | 0.184 | −0.081 | 0.526 * | −0.240 |
| Elevation | −0.449 | −0.567 * | 0.065 | 0.126 | 0.379 |
| Width | 0.511 | 0.215 | 0.276 | −0.548 * | 0.060 |
| Discharge | 0.815 ** | −0.196 | 0.343 | 0.148 | −0.153 |
| Temperature | 0.110 | −0.252 | 0.372 | −0.743 ** | −0.211 |
| pH | 0.359 | 0.314 | 0.649 ** | 0.086 | 0.158 |
| Dissolved O2 | 0.537 * | 0.298 | −0.426 | 0.016 | −0.278 |
| Conductivity | −0.409 | 0.662 ** | 0.500 | 0.133 | 0.134 |
| Hardness | −0.240 | 0.707 ** | 0.541 * | 0.139 | −0.052 |
| Canopy | −0.472 | −0.454 | 0.457 | −0.053 | −0.359 |
| Riparian Veg. | 0.394 | −0.586 * | 0.216 | 0.135 | 0.506 |
| Bed Substrate | 0.558 * | 0.382 | −0.146 | −0.199 | 0.477 |
1 p < 0.01 *, p < 0.001 **.
Table 4.
Principal component analysis of stream variables and correlation analysis of principal component score and original stream variables, summer 2007. Mean values and ranges of the stream variables are listed in Table S1.
Table 4.
Principal component analysis of stream variables and correlation analysis of principal component score and original stream variables, summer 2007. Mean values and ranges of the stream variables are listed in Table S1.
| Principal Components (PC) | |||||
|---|---|---|---|---|---|
| PC1 | PC2 | PC3 | PC4 | PC5 | |
| Eigen Analysis | |||||
| Eigenvalue | 3.5595 | 2.5328 | 1.9530 | 1.4662 | 1.1505 |
| % Proportion variance explained | 0.274 | 0.195 | 0.150 | 0.113 | 0.089 |
| % Cumulative variance explained | 0.274 | 0.469 | 0.619 | 0.732 | 0.820 |
| Correlation analysis 1 | |||||
| Depth | 0.628 * | 0.188 | −0.535 | 0.026 | 0.175 |
| Velocity | 0.016 | −0.621 * | −0.218 | −0.091 | −0.059 |
| Elevation | 0.551 | 0.318 | −0.156 | 0.058 | 0.373 |
| Width | 0.176 | −0.803 ** | −0.330 | −0.021 | 0.228 |
| Discharge | 0.590 | −0.352 | −0.669 * | 0.050 | 0.043 |
| Temperature | −0.530 | −0.139 | 0.407 | −0.196 | 0.578 |
| pH | −0.323 | −0.166 | −0.071 | −0.789 ** | 0.338 |
| Dissolved O2 | −0.125 | −0.855 ** | 0.183 | 0.157 | 0.011 |
| Conductivity | −0.777 ** | −0.011 | −0.487 | −0.302 | −0.115 |
| Hardness | −0.720 ** | 0.227 | −0.422 | −0.248 | −0.345 |
| Canopy | 0.269 | 0.626 * | −0.233 | −0.224 | 0.289 |
| Riparian Veg. | 0.799 ** | −0.122 | 0.322 | −0.358 | −0.262 |
| Bed Substrate | 0.483 | −0.272 | 0.353 | −0.606 * | −0.426 |
1 p < 0.01 *, p < 0.001 **.
Table 5.
Partial Mantel tests, matrix fill, and multisite β-diversity estimates 1.
| Data Set | Partial Mantel Correlations 2 | Matrix Fill 3 | βMult | βturn | βnest | |
|---|---|---|---|---|---|---|
| Stream Conditions | Distance among Sites | |||||
| Fall | ||||||
| Genus/species | 0.6693 p = 0.0001 | −0.0612 p = 0.7100 | 0.1852 | 0.8471 | 0.7692 | 0.0778 |
| Genus | 0.6333 p = 0.0001 | −0.1071 p = 0.8907 | 0.1417 | 0.8291 | 0.7297 | 0.0994 |
| Species | 0.4464 p = 0.0003 | 0.0684 p = 0.2098 | 0.0831 | 0.8616 | 0.7916 | 0.0697 |
| Summer | ||||||
| Genus/species | 0.6182 p = 0.0013 | 0.1458 p = 0.1216 | 0.2871 | 0.8436 | 0.7525 | 0.0911 |
| Genus | 0.5859 p = 0.0028 | 0.1436 p = 0.1259 | 0.2145 | 0.8210 | 0.7084 | 0.1126 |
| Species | 0.4980 p = 0.0041 | 0.1776 p = 0.0619 | 0.1730 | 0.8479 | 0.7280 | 0.1200 |
1 βMult = total β-diversity among all sites. βTurn = β-diversity due to species turnover. βNest = β-diversity due to loss (nested pattern). 2 Top value partial correlation 3 Matrix fill is the proportion of cells in the species matrix with at least one taxon compared to the total number of cells in the matrix.
Disclaimer/Publisher’s Note: The statements, opinions and data contained in all publications are solely those of the individual author(s) and contributor(s) and not of MDPI and/or the editor(s). MDPI and/or the editor(s) disclaim responsibility for any injury to people or property resulting from any ideas, methods, instructions or products referred to in the content. |
© 2023 by the authors. Licensee MDPI, Basel, Switzerland. This article is an open access article distributed under the terms and conditions of the Creative Commons Attribution (CC BY) license (https://creativecommons.org/licenses/by/4.0/).
Share and Cite
MDPI and ACS Style
Sankone, C.; Bedwell, C.; McCreadie, J. Regional β-Diversity of Stream Insects in Coastal Alabama Is Correlated with Stream Conditions, Not Distance among Sites. Insects 2023, 14, 847. https://doi.org/10.3390/insects14110847
AMA Style
Sankone C, Bedwell C, McCreadie J. Regional β-Diversity of Stream Insects in Coastal Alabama Is Correlated with Stream Conditions, Not Distance among Sites. Insects. 2023; 14(11):847. https://doi.org/10.3390/insects14110847
Chicago/Turabian StyleSankone, Carlos, Chris Bedwell, and John McCreadie. 2023. "Regional β-Diversity of Stream Insects in Coastal Alabama Is Correlated with Stream Conditions, Not Distance among Sites" Insects 14, no. 11: 847. https://doi.org/10.3390/insects14110847
Note that from the first issue of 2016, this journal uses article numbers instead of page numbers. See further details here.