Article

Extraction Chromatography Materials Prepared with HDEHP on Different Inorganic Supports for the Separation of Gadolinium and Terbium

by
Fabiola Monroy-Guzman
1,*,
Celia del Carmen De la Cruz Barba
1,
Edgar Jaime Salinas
1,
Vicente Garibay-Feblés
2 and
Tobias Noel Nava Entzana
2
1
Instituto Nacional de Investigaciones Nucleares; Carretera México-Toluca S/N, La Marquesa, Ocoyoacac, Edo de México 52750, Mexico
2
Instituto Mexicano del Petróleo, Eje Central Lázaro Cárdenas 152, Col. San Bartolo Atepehuacan, Ciudad de Mexico 07730, Mexico
*
Author to whom correspondence should be addressed.
Metals 2020, 10(10), 1390; https://doi.org/10.3390/met10101390
Submission received: 7 September 2020 / Revised: 12 October 2020 / Accepted: 13 October 2020 / Published: 19 October 2020
(This article belongs to the Special Issue Solvent Extraction of Transition Metals)

Abstract

:
Bis(2-ethylhexyl)phosphoric acid (HDEHP) is frequently used as an extractant in the separation and recovery of lanthanides by solvent extraction and extraction chromatography, where HDEHP (stationary phase) is fixed on an inert support and the mobile phase is an aqueous solution. Because the results of extraction chromatography strongly depend on the support material, in this study, we aim to prepare solid extractants (extraction chromatography materials) with different inorganic supports impregnated with HDEHP for the adsorption of Gd and Tb from HCl solutions, putting emphasis on the effect of the supports on the solid extractant behavior. Gd and Tb partition data were determined in HCl solutions from the prepared extraction chromatography materials using elution analysis. Solid extractants were characterized by X-Ray diffraction, electron microscopy, and infrared spectroscopy in order to determine their properties and to explain their extraction behavior. The characterization of the solid extractants showed a heterogeneous distribution of the HDEHP on the surfaces of the different supports studied. The irregular shape of the support particles produces discontinuous and heterogenous silanization and HDEHP coatings on the support surface, affecting the retention performance of the solid extractant and the chromatographic resolution.

1. Introduction

Extraction chromatography combines the selectivity of liquid–liquid extraction with the multistage character of chromatography. In this method, the stationary phase is an organic liquid (extractant) fixed on an inert support, and an aqueous solution is used as the mobile phase. Therefore, many extractions and re-extractions occur during the extraction chromatography process [1,2].
In most of the methods of synthesis of the materials for extraction chromatography, which is used to remove and recover metals from aqueous solutions, the support (inorganic materials or porous polymeric) is in contact with a solution of extractant in a suitable solvent. Then, the solvent is evaporated, leaving the pores of the support material filled with the extractant. Therefore, the extraction mechanism is considered to be similar to conventional solvent extraction [2,3].
A wide variety of extraction agents can be used in the separation of chemical elements by extraction chromatography since there is a direct correlation between liquid–liquid extraction and chromatographic systems. Hence, it is possible to qualitatively predict the retention capacity of a chemical element in an extraction chromatography column from its distribution coefficients obtained by liquid–liquid extraction in the extracting agent loaded on the support and the aqueous solution used as the stationary and mobile phases, respectively [2,3].
Extraction chromatography is frequently used as a pretreatment or separation technique because it is simple, rapid, highly efficient, has low organic solvent consumption, is easily automated, generates less waste than other separation techniques, and is usually applied to separate elements with similar distribution coefficients, such as lanthanides [4,5].
Lanthanides are used in medicine, nuclear fuel control, metallurgy, lasers (Nd, La), and electronic devices, to name a few application areas. In the nuclear industry, radiolanthanides are one of the main fission products in the waste of nuclear reprocessing plant. Gadolinium (Gd) is mainly used as shielding and fluxing devices in nuclear power reactors; therefore, its content is considerable in nuclear waste [6]. Moreover, 147Pm (t½ 1.6 y) and 151Sm (t½ 90 y) pure beta emitters need radiochemical separations to be quantified [7]. In medicine, radioactive lanthanides such as 161Tb (T1/2  =  6.89 days; Eβ͞max  =  0.593 MeV), 149Pm (T1/2  =  2.21 days; Eβ͞max  =  1.07 MeV), 166Ho (T1/2  =  1.11 days; Eβ͞max  =  1.855 MeV) or 177Lu (T1/2  =  6.73 days; Eβ͞max  =  0.492 MeV), conjugated to chemically-guided agents such as labeled monoclonal antibodies or isotopically-labelled polypeptides are applied in radiotherapy because of their advantageous nuclear properties: half-lives long enough to allow preparation and distribution of the radiopharmaceuticals, high LET (linear energy transfer) particle emissions, photon emissions for monitoring therapy with imaging, follow-up as well as adsorbed dose distributions, and they can be produced at high specific activities (carrier-free) via the L Z A n ( n , γ ) L z A + 1 n L Z + 1 A + 1 n nuclear reaction [4,8,9].
The difficulty in separating adjacent lanthanides and micro- from macro-amounts of lanthanides for radiopharmaceuticals production, and in their recovery in nuclear waste management is particularly arduous because rare earths present significant similarities in their chemical properties due to lanthanide contraction [4,8]. To successfully separate or recover lanthanides, numerous extractants used as stationary phases have been investigated and tested. Among others, the most commonly used are: (1) acid phosphorus compounds [(RO2)PO(OH) or (RO)PO(OH)2] such as HDEHP (di(2-ethylhexyl) phosphoric acid), or HEHΦP (2-ethylhexyl phenyl phosphonic acid); (2) neutral phosphorus compounds [(RO3)PO or R3PO] such as TBP (dibutyl phosphate), P350 (dimethyl methyl phosphate heptyl ester), or TOPO (trioctylphosphine oxide); (3) organic amines such as Aliquat-226 (methyl-tricaprylyammonium), N1923 (se-carbon primary amine), N235 (trialkylamine), N263 (chloride methyl trialkyl amine), or TNOA (tri-n-octylamine); (4) neutral oxygen-containing compounds such as naphthenic acid, MIBK (methyl isobutyl ketone), or sec-caprylic alcohol; (5) chelates such as TTA (thenoyltrifluoroacetone) or PMBP (1-phenyl-3-methyl-4-benzoyl-pyrazolone), and (6) supramolecules such as crown ethers and calixarenes [1,3,5,9,10]. However, the higher separation factors (>2.5) between adjacent lanthanides have been obtained with HDEHP, because the H’s of their hydroxyl groups are easily substituted by Ln3+, exhibiting good extraction ability for lanthanide ions either under low-acidity or high-acidity conditions [5]. Additionally, the low cost and high availability of HDEHP have made it one of the most widely used extractants.
HDEHP has been usually supported on silanized kieselguhr (Celite, Filter Cel, Chromosorb Anakrom, Chromaton, Porokhrom), hydrophobized silica gel (Silikagel Merck 7754, Bio-Sil A, Whatman Silica Gel SG32) and Kel-F (polytrifluorochloroethylene) for lanthanide separation [3,11,12,13,14]. Other supports, such as Corvic (vinyl chloride–vinyl acetate copolymer), cellulose powder, PVDF (polyvinylidene difluoride), aluminum oxide, or PTFE (polytetrafluoroethylene), have also been tested [3,15,16,17]. More recently polymeric supports have been developed and applied. Wei et al. coated HDEHP onto XAD-7 (polystyrene with divinylbenzene) to investigate kinetic differences and distribution ratios of Am, Gd, Eu, Ce, and Nd [14,18]. McAlister and Horwitz used HDEHP coated onto AMBERCHROM CG71M (polymethacrylate) to determine distribution ratios and capacity factors for Am Al, Ga, Sr, Y, Ac, La, Ce, Pr, and Nd [14,19]. Zhang et al. studied HDEHP supported on macro-porous silica-polymer (SiO2-P) to separate rare earth elements from Sc [20]. Sasaki et al. reported the fixation of HDEHP on the dodecylamino group of a polymer chain grafted onto a 6-nylon fiber to separate Dy and Nd [21]. Momen and Dietz prepared polysulfone macro- and microcapsules impregnated with HDEHP and evaluated their performance in the extraction of europium (Eu3+) from nitric acid solution [22], whereas Eichrom’s commercial Ln Resin, developed by Horwitz and his group, comprises HDEHP-loaded poly (methyl methacrylate) beads [14,23]. Even if the polymeric supports used to prepare extraction chromatography materials allow the preparation of a whole range of extraction chromatography materials combining diverse polymeric supports and liquid extractants, the main disadvantage of these resins is the loss of the extractant due to its solubility in the aqueous phase and, as a consequence, a loss of adsorptive capacity towards metals ions in aqueous solution rendering the resin ineffective after several cycles of application [10].
It is known that extraction chromatography behavior depends on the nature of the support employed. However, no specific works are available on the comparison of different supports in regard to their adsorptive properties, capacity for the extractant, specific surface area, or the method for extractant loading under identical experimental conditions [2,3,6,24]. For this reason, this work presents a study of the effect of the support on the extraction chromatography behavior of solid extractants prepared with six inorganic supports loaded with HDEHP tested on the separation of gadolinium and terbium.

2. Materials and Methods

2.1. Preparation of Solid Extractants (HDEHP + Supports Silanized)

HDEHP (2-ethylhexyl) phosphoric acid) from Fluka Biochemika was used as an extractant agent and six powdered materials were used as supports: Kieselguhr, alumina, fluorite, and three volcanic rocks from Mexico: tezontle, chiluca, and cantera.
Ln spec resin (50–100 µm) from Eichrom Industries of Darien, IL (USA), constituted of HDEHP (40% by weight) loaded onto Amberchrom CG-71 (60% by weight), was also tested to compare the performance of this commercial resin and our solid extractants.

2.1.1. Support

Kieselguhr was supplied by Sigma Aldrich and neutral alumina by Fluka Biochemika. The natural fluorite was donated by Fluorita de México S.A. de C.V., and the volcanic rocks tezontle, chiluca, and cantera were purchased from local distributors. The volcanic rocks were crushed and ground and the particle diameters of all supports, including kieselguhr, alumina, and fluorite, were standardized by sieving to 52–73 μm.
Kieselguhr (52–73 μm) was dried by heating to 100 °C for 24 h. Alumina, fluorite, tezontle, chiluca, and cantera were washed with 10% v/v H2O2 for 2 h, distilled water for 1 h, and 0.1 M HNO3 for 2 h, and finally dried at 100 °C for 48 h. The powdered supports were filtered after each washing stage.

2.1.2. Hydrophobization of Supports

Deactivation and hydrophobization of the supports were achieved by silanization with dimethyldichlorosilane (DMCS).
Dried support particles were exposed to DMCS vapors for 4 days; the dried supports and DMCS were poured into Petri dishes and placed on a desiccator. Vacuum was applied to remove air and to saturate the desiccator with DMCS vapors. Once a day the formed HCl and the excess DMCS vapors were pumped off and fresh DMCS was added. The support was dried at 100 °C for 1 h after the silanization process.
Kieselguhr was also hydrophobized with DMCS diluted in heptane. Silanization in the DMCS/heptane solutions was performed as follows: kieselguhr was mixed with DMCS/heptane (1:30 v/v) solution. The resulting slurry was heated to gentle boiling with continuous swirling for 24 h. The support was then filtered and washed twice with acetone and twice with methanol before being dried at 100 °C for 24 h.

2.1.3. Loading of Silanized Supports with HDEHP

The solvent evaporation technique was used for loading the HDEHP on the silanized kieselguhr with the DMCS/heptane solution. Dry silanized kieselguhr was slurried in HDEHP dissolved in acetone at different ratios (see Table 1). The acetone was then evaporated by gentle stirring and heat until the mixture was completely dry. The resulting solid extractant was finally dried by heating to 40 °C for 24 h.
The loaded packed columns technique was used for loading the HDEHP on to the silanized supports with DMCS vapors. The dry silanized supports were introduced into chromatography columns in small amounts. The columns were vertically tapped on the table after each addition of silanized support to ensure a dense packing. Then, a surplus of HDEHP dissolved in acetone (see Table 1) was added to the column and the flow of the HDEHP/acetone solution was maintained until all air bubbles disappeared. The surplus HDEHP was then removed by rinsing the column with acetone and the solid resulting extractant was dried to 100 °C for 24 h.

2.2. Extraction Capacity of Solid Extractants

The extraction capacity (distribution coefficient Kd) of the prepared solid extractants was tested for two adjacent lanthanides, gadolinium and terbium, using the radiotracer technique and elution analysis in chromatography columns.

2.2.1. Radiotracer Production

Radiolanthanides were produced by irradiation of 10 mg Gd2(NO)3 in the TRIGA MARK III Reactor at the National Institute of Nuclear Research (ININ) in Mexico to a neutron fluence rate of 1.68 × 10¹² n·cm−2·s−1. Gadolinium salt was irradiated for 15 min, producing Gd-153 (241.6 d), Gd-159 (18.6 h), and Gd-161(3.2 min) (see Table 2). The latter disappeared after 30 min and Gd-153 required longer counting times for its half-life. Therefore, Gd-159 was used as a radiotracer for gadolium and Tb-161 (17.6 h) was used for terbium, as only one terbium radioisotope is produced by Gd irradiation and its decay [8]. The irradiated gadolinium nitrate salt was dissolved in 300 μL of 0.15 mol/L HNO3 with a specific activity of 0.148 kBq/μL.

2.2.2. Column Packing

Dry solid extractant (1 g) was suspended in a surplus of 0.15 M HCl or 0.15 M HNO3 and stirred until all air bubbles disappeared. Small portions of the well-stirred slurry were then poured in a Wheaton (12 × 80 mm2) glass column. The solution in the column was gently stirred during the settling of the solid extractant, and after addition and settling of each of slurry, the bed was gently tamped with a glass rod and supported by a wool plug to prevent disturbances of the solid extractant by the entrance of solutions to the bed. The flow rate was controlled by a stopcock placed after the column outlet to prevent the bed from running dry. Columns were then preconditioned with 0.15 M HCl or 0.15 M HNO3, and 50 μL of the radioactive gadolinium (Tb-161) solution was introduced into the column. Columns were then eluted using 0.8M HCl for Gd and 3M HCl for Tb to construct the respective elution profiles. Collected fractions of the eluates were measured under a coaxial gamma detector HPGe (Canberra 7229P) connected to a PC-multichannel analyzer (ACCUSSPECT-A, Canberra, Australia). Gamma-ray spectra were analyzed using the gamma software for “Genie 2000” Canberra Acquisition and analysis with fixed geometry at 300 s, using the photopeaks 363.64 keV for Gd-159 and 74.6 keV for Tb-161.

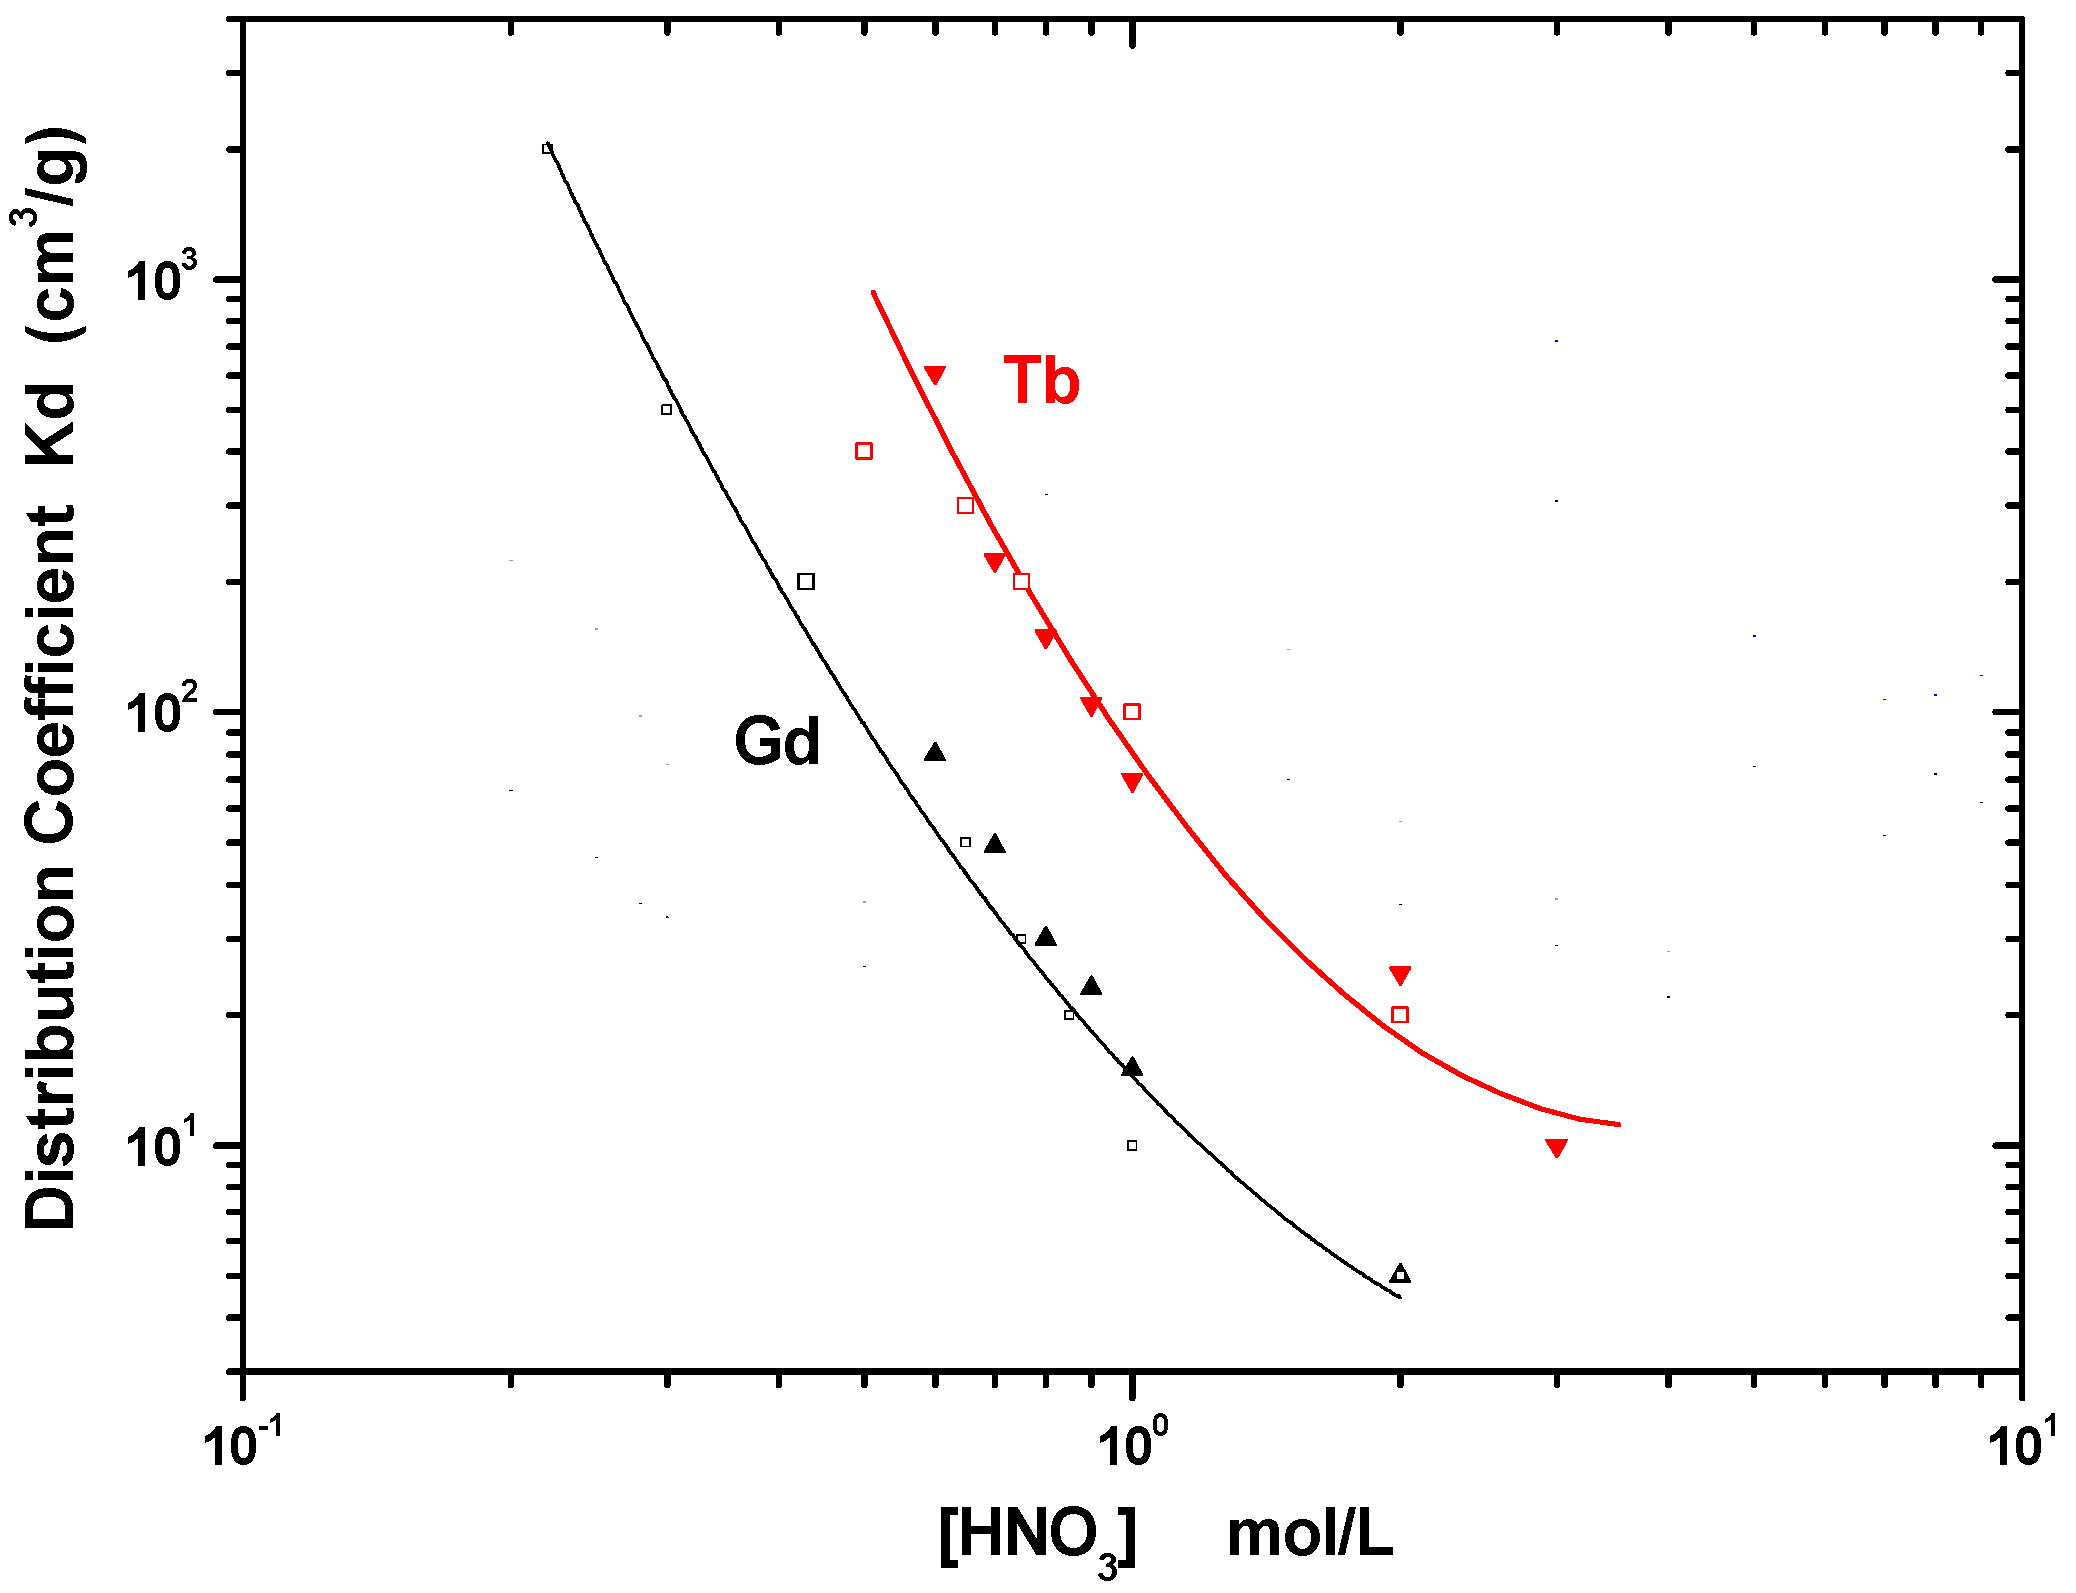
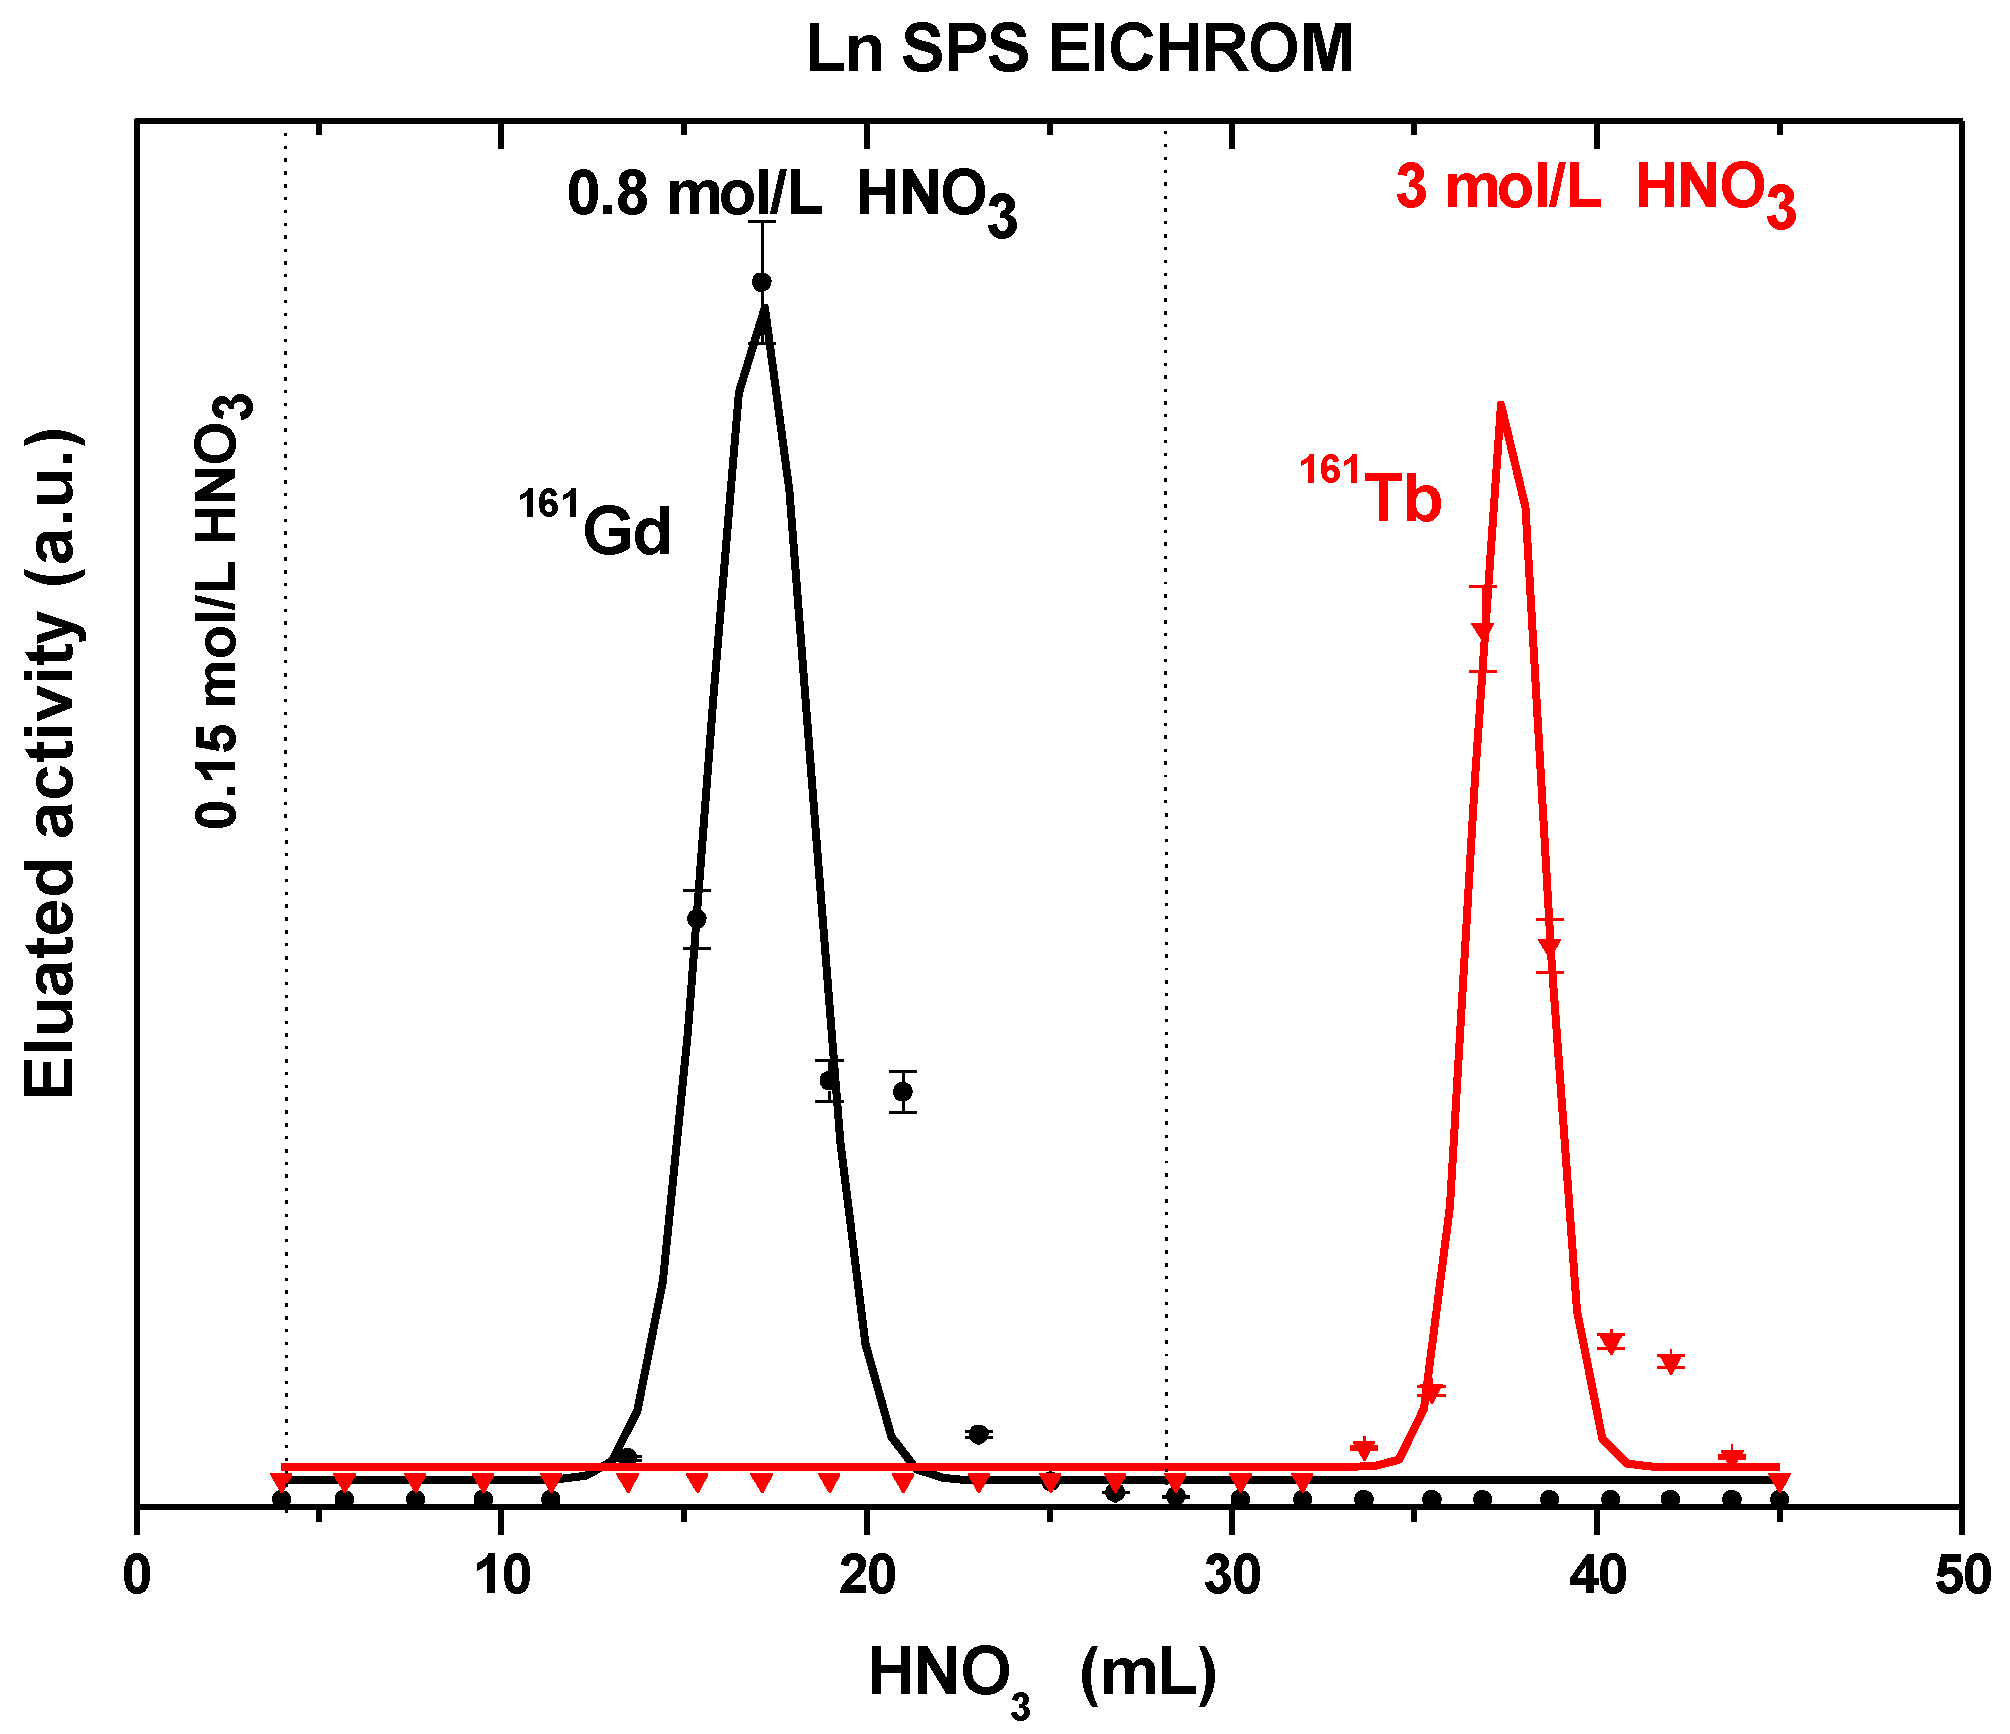
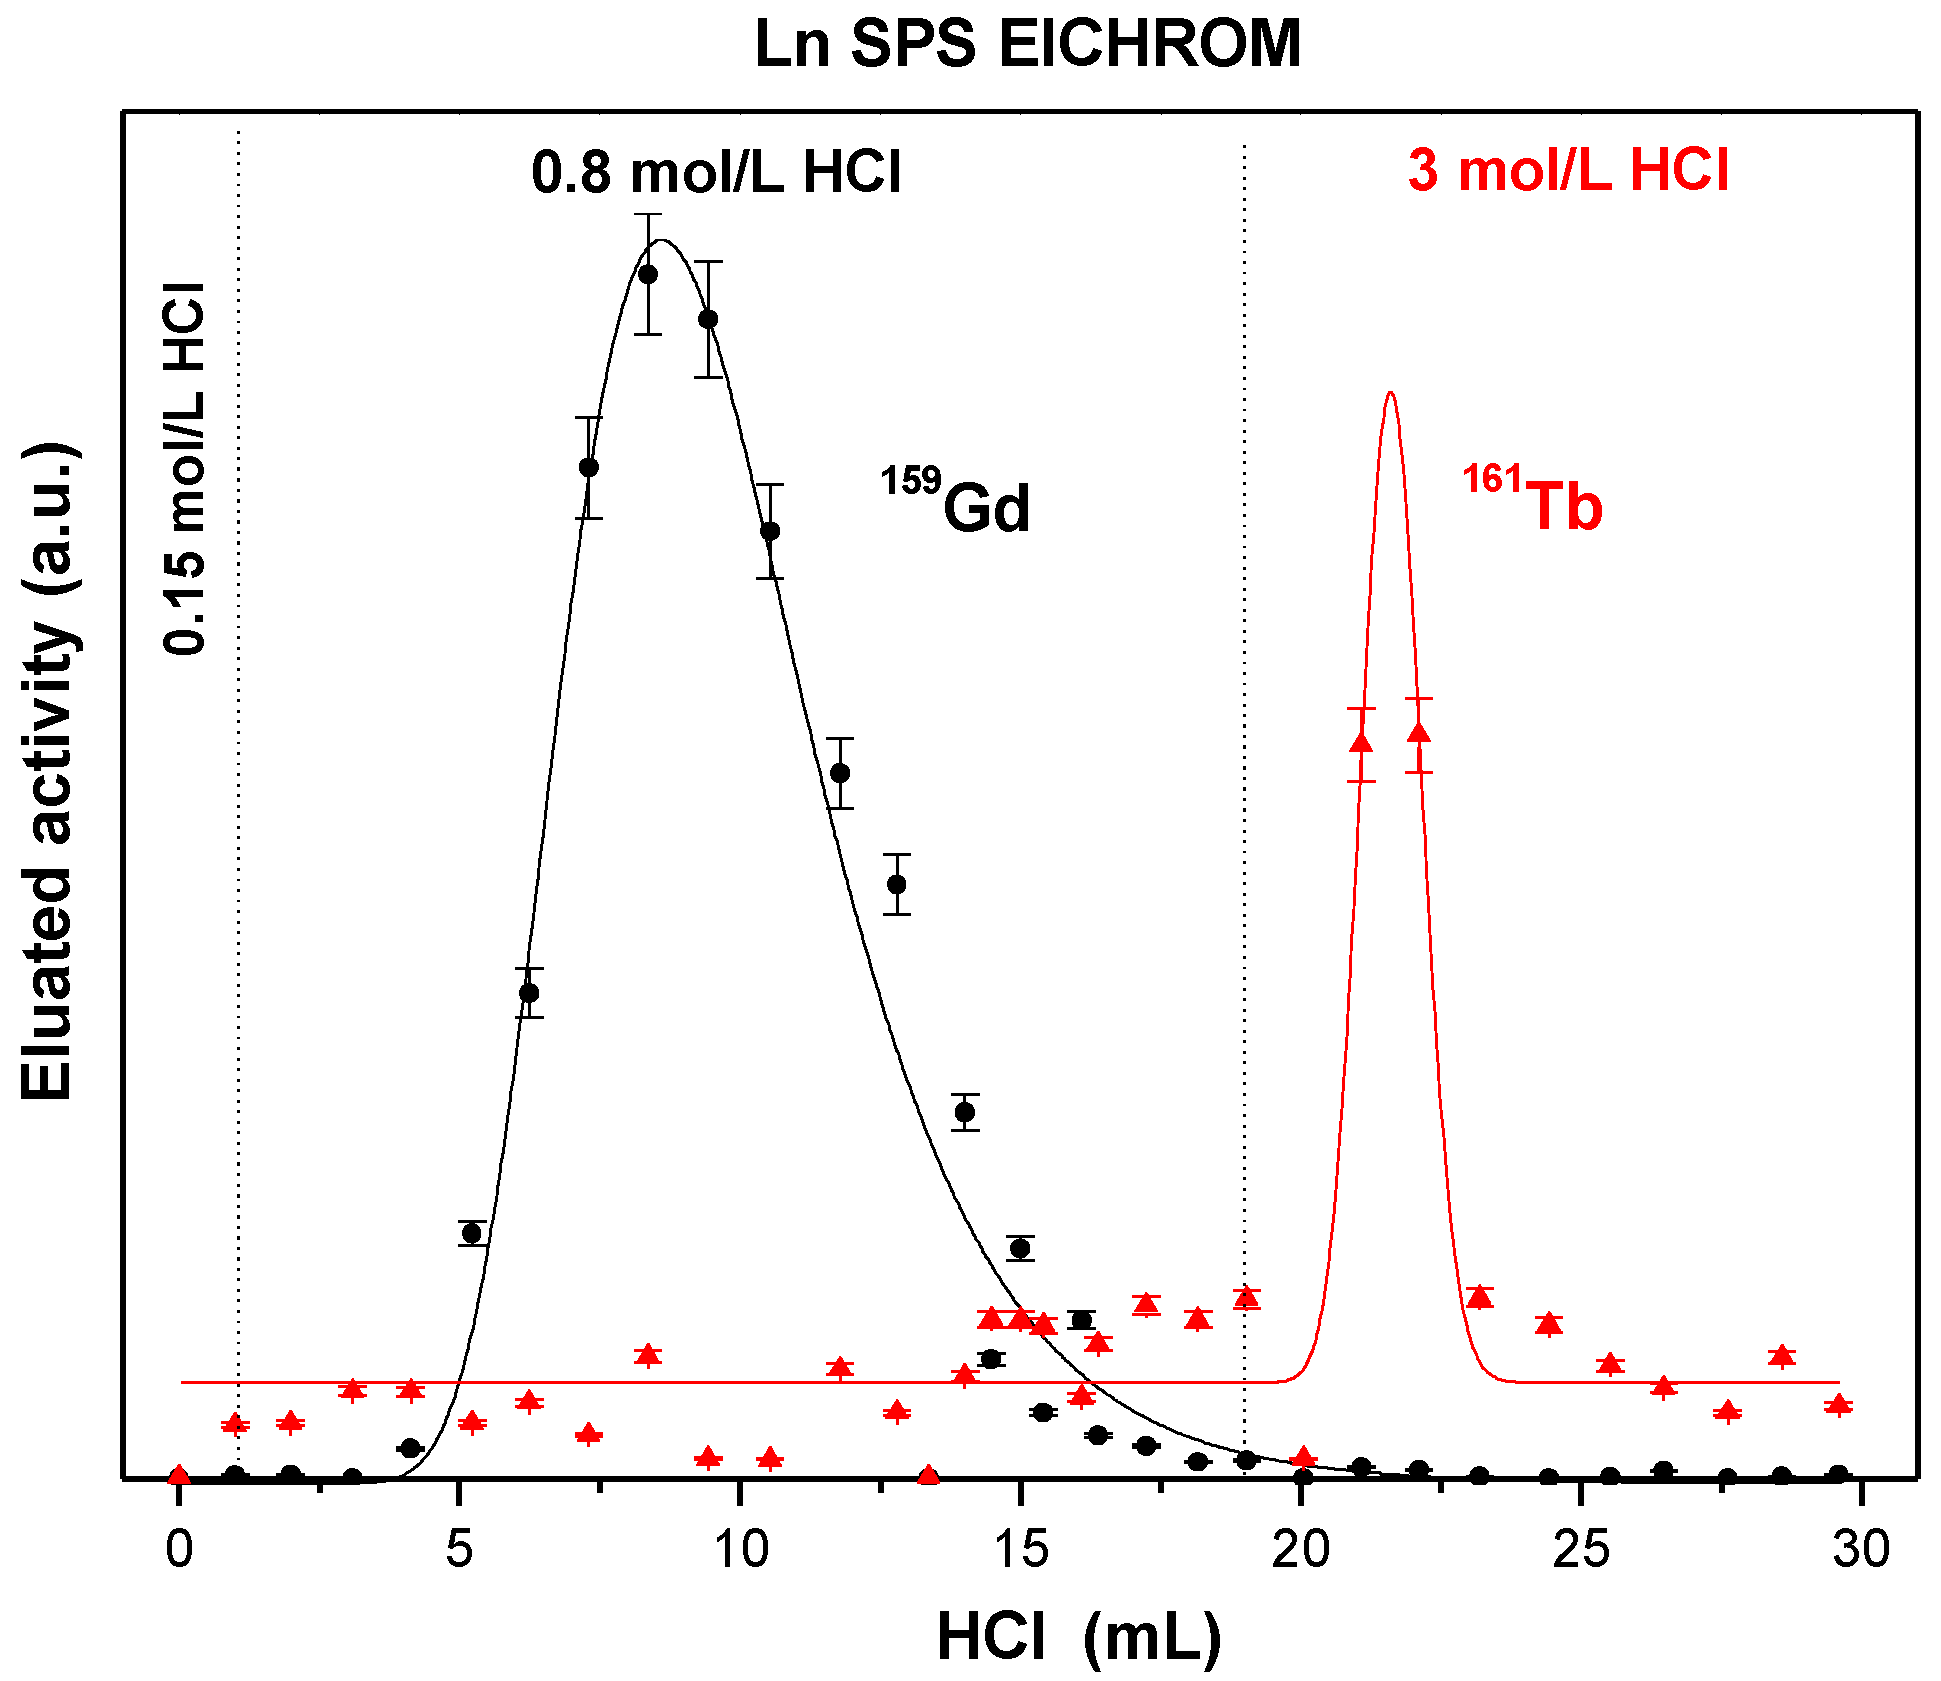
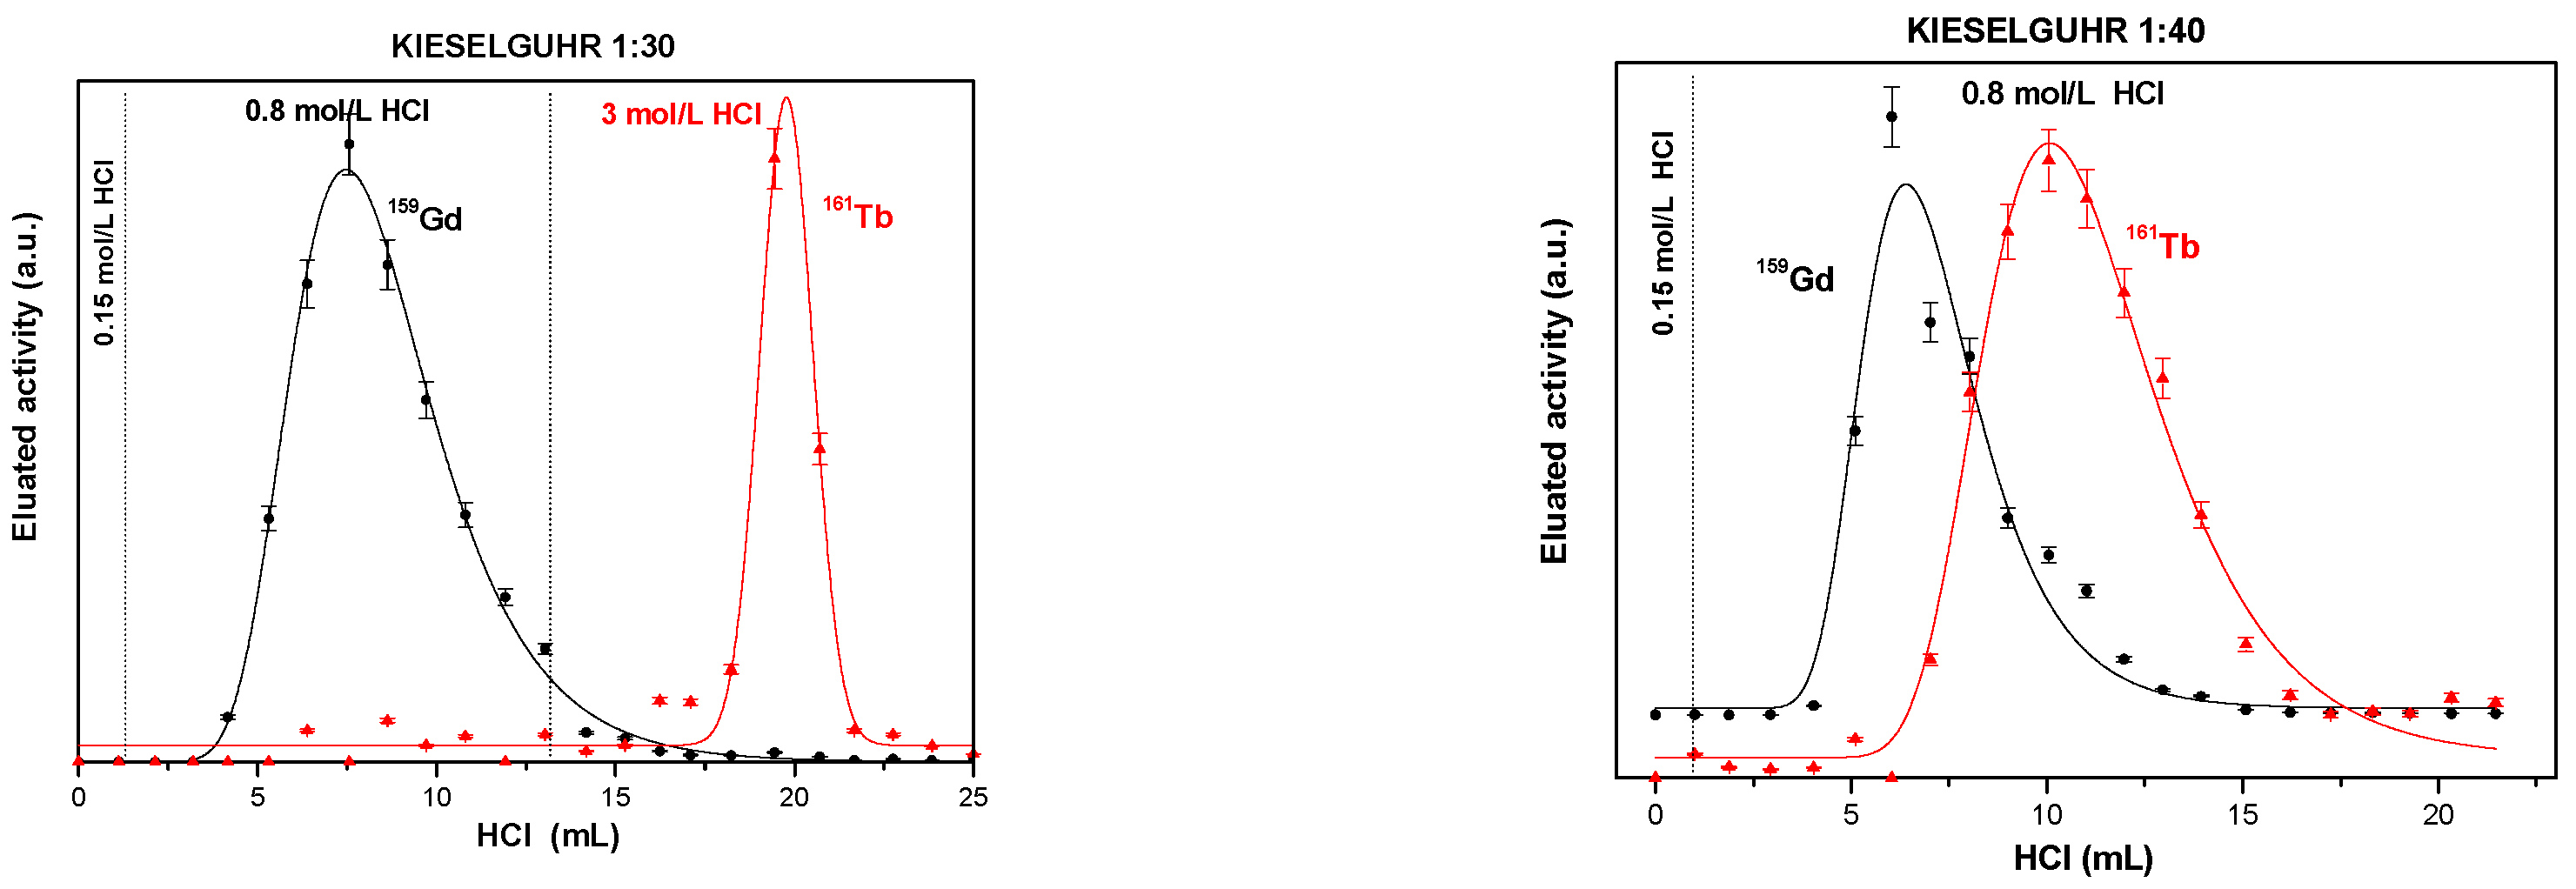
2.2.3. Distribution Coefficients

Elution analysis was applied for the determination of the distribution coefficients (Kd) which were calculated from Equation (1) [8]:
Kd = [ V max V i m ]
where Vmax is the eluate volume to the peak maximum or retention volume, vi is the mobile phase volume (void volume), and m is the solid extractant mass.
The separation resolution of the parent/daughter pair Gb/Tb was determined by Equation (2) [8]:
α = 2 ( V max Tb   V max Gd V Gd V Tb )
where VmaxTb and VmaxGd are the retention volume of Tb and Gd, and ΔVGd and ΔVTb the widths of the elution peaks of Tb and Gd.

2.3. Characterization of Solid Extractants

Raw supports and the prepared solid extractants were analyzed by infrared spectroscopy (IR), scanning electron microscopy (SEM), X-ray diffraction (XRD), and surface area analysis. The infrared measurements were taken on a Nicole Mgna-IR spectrometer 550 with the samples pressed in KBr pellets. The spectra were measured with 40 scans per measurement between 4000 and 390 cm−1 normalized and baseline corrected before evaluation. The X-ray diffraction patterns were obtained on a Siemens D5000 diffractometer with a Cu anode X-ray tube. Samples were scanned from 2.5° to 70° with a step size of 0.02°, step time 1 seg, range time 1, and rotation of 15 rpm. The morphology of the supports and solid extractants was observed from SEM micrographs obtained with a Philips SL30 scanning electron microscope. Samples were previously sputtered with gold (layer thickness of 4 nm) in a Denton Vacuum Desk II Microsystems sputter coater. Digital images were obtained at 100×, 500×, 1000×, 2000×, and 5000× magnifications in randomly selected areas. Only the alumina-based solid extractant was analyzed by high-resolution transmission electron microscopy (HRTEM) in a TITAN (FEI Company) microscope at 300 kV. The surface area analysis was performed with a Micromeritics Gemini Surface Area Analyzer. The sample was degassed with nitrogen (15–20 lb/in2) for 30 min at 200 °C and then analyzed using the multipoint analysis protocol.

3. Results

The HCl concentrations used as the mobile phase in the determination of the extraction capacity from the prepared solid extractants were selected from the Gd and Tb distribution coefficients determined by our group (Figure 1, in triangles) and by Horwitz and Bloomquist (Figure 1 in squares) with the commercial resin Ln spec resin from Eichrom. The Kd values of Gd and Tb decreased with an increase in HNO3 concentration. The distribution coefficients of the lanthanides substantially increased with Z (atomic number) and the concentration of nitric acid [4,8,25].
Note that the partition data reported in these works are from experiments that were performed in HNO3 solutions, while HCl was used to determine the extraction capacities of the solid extractants prepared for Gd and Tb in this work because, in nuclear medicine, the chemical state of the isolated radionuclides plays a major role in all further labeled processing. Lanthanide chloride salts (LnCl3) are the salts that are most commonly used as the starting point of many lanthanide-radiolabeling processes, largely because of their good solubility in water and in polar solvents [26]. It is possible to remove the HNO3 of the radiolanthanide solutions by evaporating to dryness; however, this process consumes time, requires the installation of heating equipment inside the hot cell, and produces highly corrosive vapors (NOx) by the decomposition of nitric acid. To avoid these drawbacks, HCl was chosen as the elution media in this work.
Kd values for Gd and Tb (see Table 3), determined from the elution curves shown in Figure 2 with Ln spec resin using HCl and HNO3 as mobile phases, and the separation resolutions obtained with HNO3 are approximately twice that obtained with HCl, while the FWHM (Full Width at Half Maximum) values of the Gd and Tb elution curves are lower in HNO3 than in HCl. These results indicate that there is a slight effect of the anion (Cl or NO3) associated with the acid used as a mobile phase in the retention and separation resolution of the extraction system (Table 3 and Figure 2). Therefore, the stability constant of the complex Ln(Cl)3 3HDEHP is less than that of the complex Ln(NO3)3∙3HDEHP and, consequently, the distribution coefficients in chloride medium are lower than in nitrate. The extraction mechanism of Ln3+ by HDEHP can be represented as shown in Reactions (3) and (4), in the case of moderate or high acid concentrations of both the mineral acid and the lanthanide salts. In these reactions, the inorganic anions of HCl or HNO3 neutralize the charge of the lanthanide cation and the HDEHP behaves as a neutral extractant [3,9]:
Ln 3 + + 3 X + 3 HDEHP   Ln ( X ) 3 3 HDEHP
Ln ( X ) 3 3 HDEHP Ln ( X ) 3 3 HDEHP ¯
Barred symbols denote the organic phase, Ln denotes lanthanides (III), and X denotes the inorganic anion of the mineral acid (NO3 or Cl).
The Kd values for Gd and Tb obtained with the Ln resin in HNO3 provide an acceptable guide for reckoning the performance of the solid extractants prepared with HDEHP on different supports, using HCl as the mobile phase. This is probably due to the similar performance of the Ln resin in HNO3 and HCl (Figure 2 and Table 3).

3.1. Solid Extractant Prepared with Kieselguhr

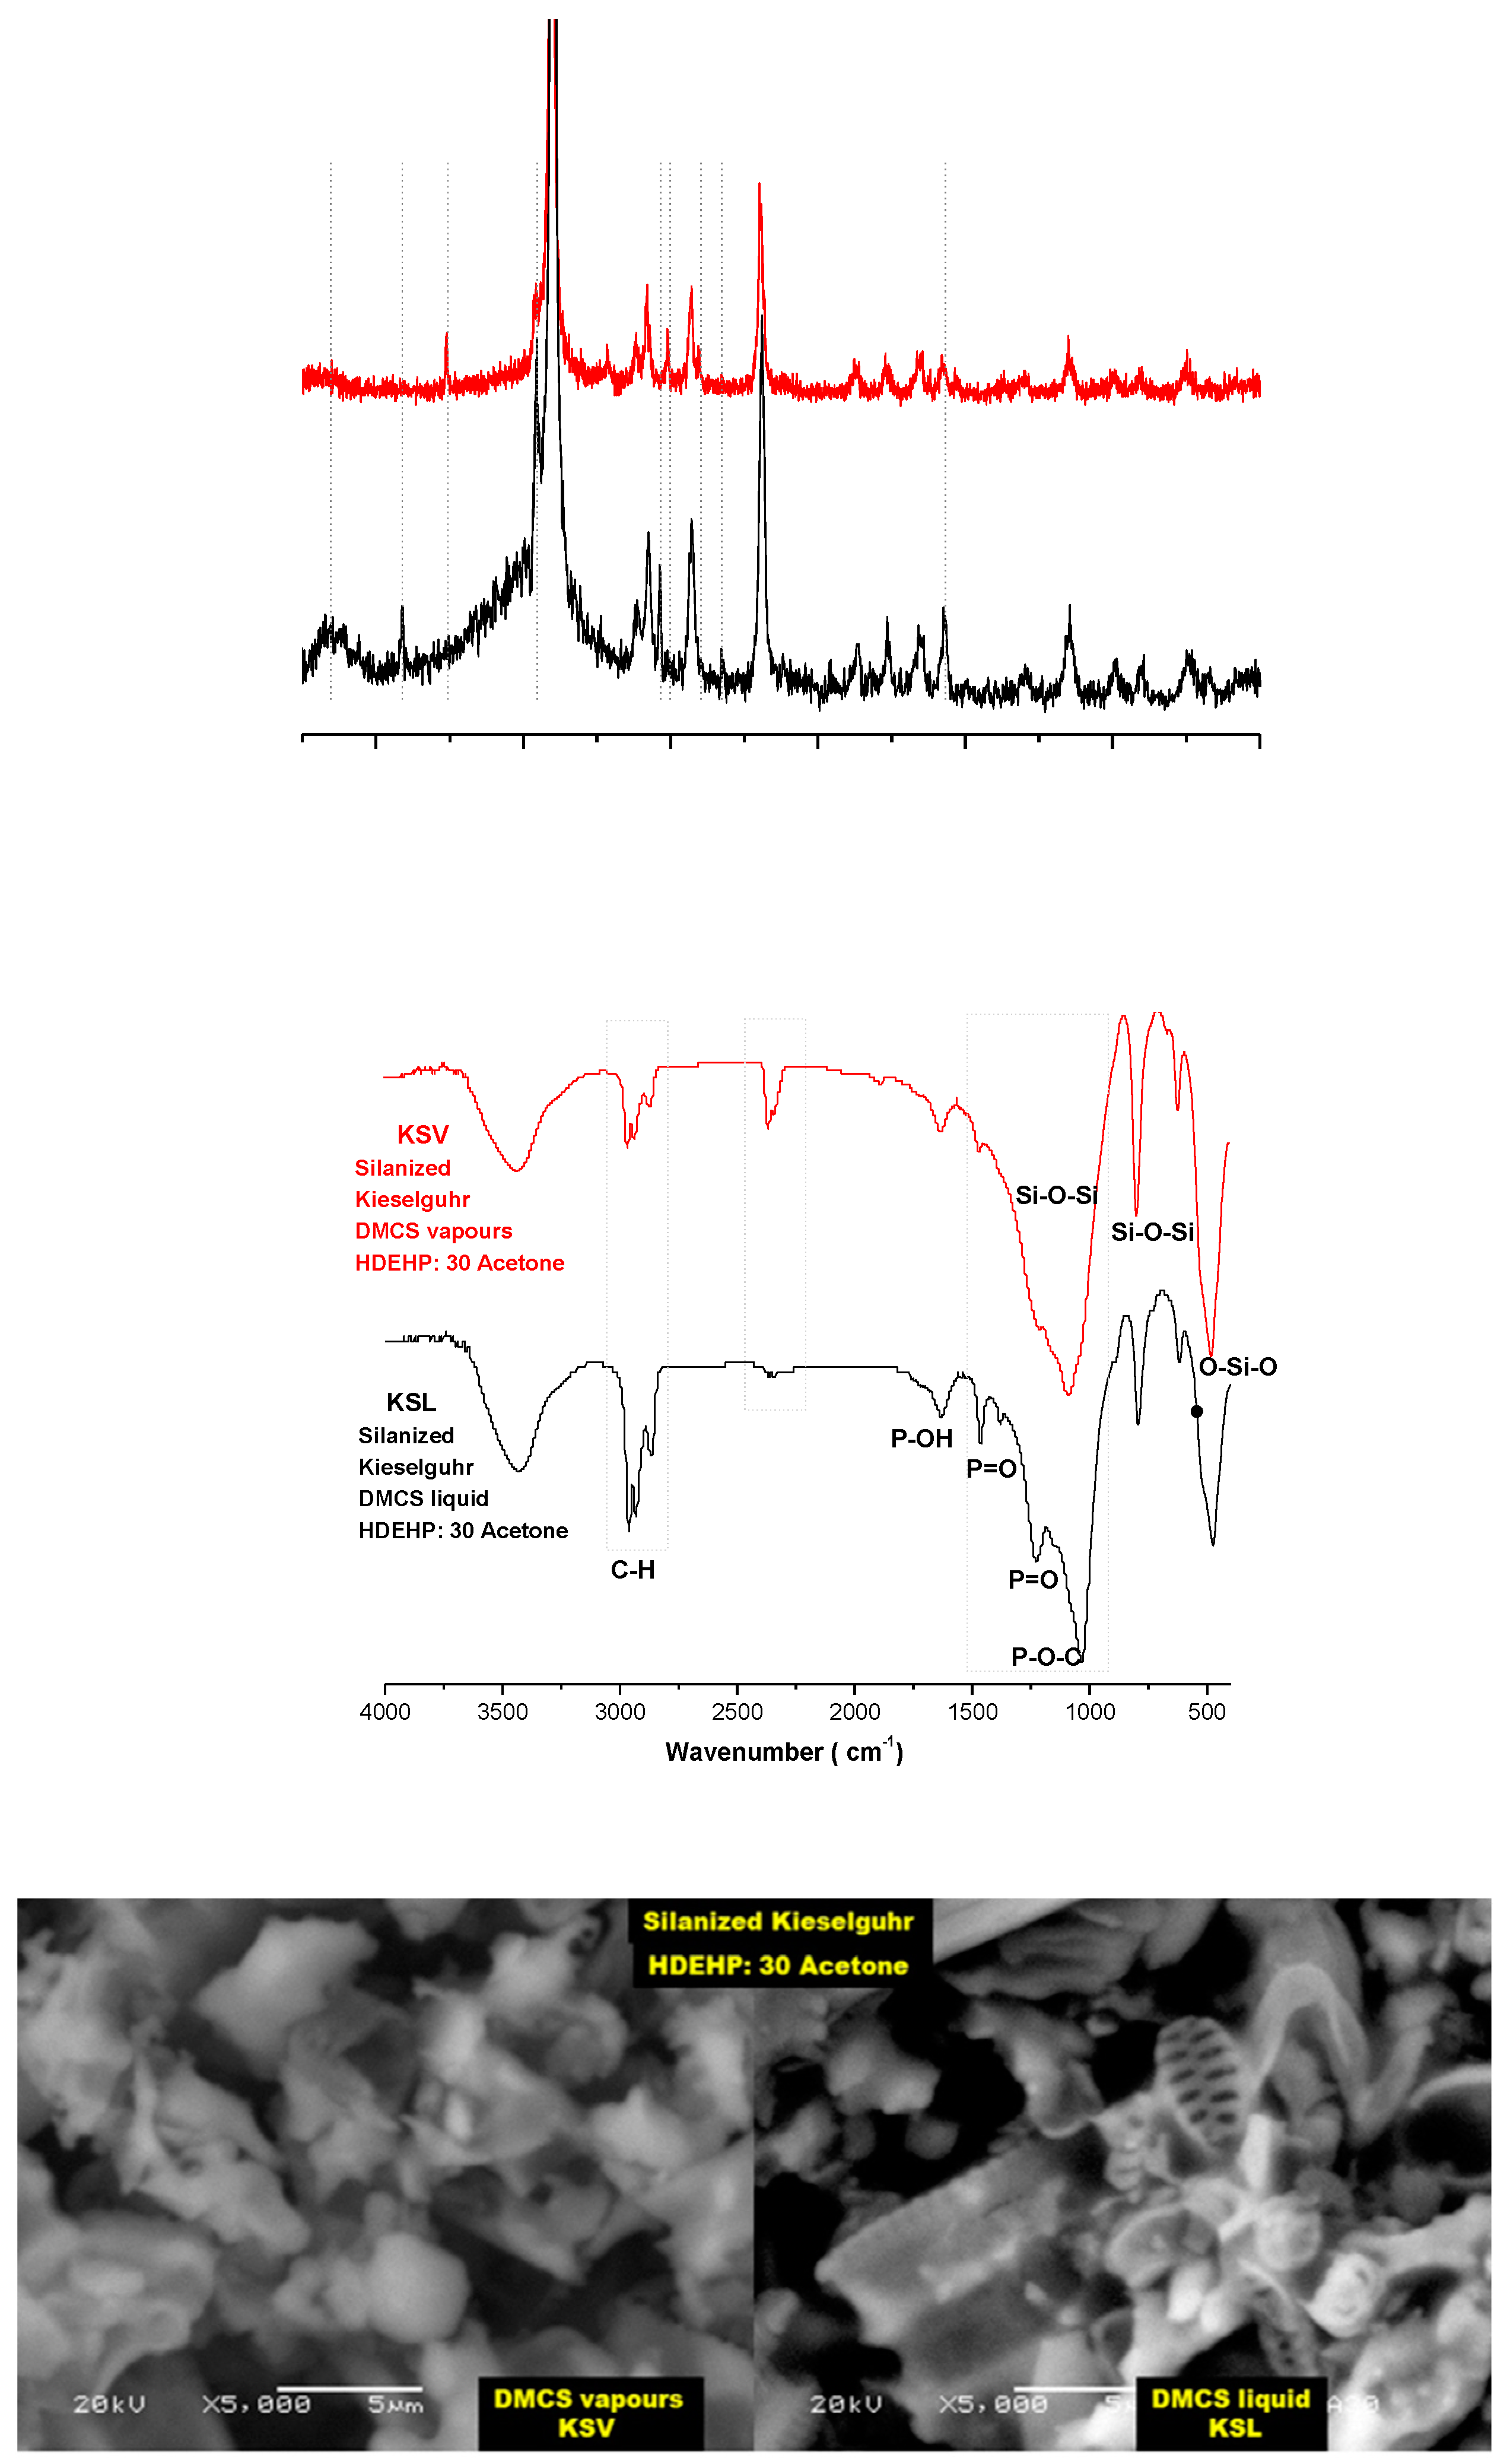
3.1.1. Silanization of Kieselguhr

Kieselguhr is composed of diatomaceous skeletons (frustules) and belongs to the group of near pure sedimentary silica rock and consists predominantly of opal-CT (cristobalite (C) and tridymite (T)), as shown in Figure 3, ergo the kieselguhr structure is basically constituted of silicon oxide [27,28]. The silanization of kieselguhr by DMCS vapors or liquid solutions produces an increase in XRD peak intensities relative to those of pure kieselguhr. This increase is greater in kieselguhr silanized with DMCS vapors and, in particular, the proportions of its XRD peaks: 25.8, 27.6, 30.2, 49.5 and 54.4° 2θ, assigned to the tridymite, and the 15° 2θ unidentified peak, are different from those of pure kieselguhr and the kieselguhr silanized with DMCS liquid, thus indicating slight changes in kieselguhr structure by its silanization with DMCS vapors. The morphology of the pure kieselguhr and kieselguhr silanized with DMCS vapors and liquid revealed that DMCS is heterogeneously deposited on the frustules (Figure 3) and that the shape of the deposit depends on the silanization process. The treatment with DMCS vapors formed thin, uniform deposits, and with DMCS dissolved in heptane, the deposit was thick, probably formed by several layers of DMCS on the frustules. Note that the majority of identified frustule species presented perforated linear and isopolar valve mantles, with more or less pointed ends, probably from the family Fragilariopsis. The apical axes were around 10 μm, the transapical axes were around 3 μm, and there were 7–8 transapical striae. The striae were straight, curved toward the ends, and each of them contained two rows of poroids which become incomplete or irregular toward the center of the valve [29].
The spectra FTIR from pure kieselguhr and kieselguhr silanized with DMCS vapors and liquid (Figure 3) displayed bands at 3440 and 1632 cm−1 which were assigned to the -OH bending vibrations; at 1090, 795, and 620 cm−1 and attributed to the Si−O−Si asymmetric stretching vibrations at 473 cm−1 due to O−Si−O bending vibrations, respectively (Figure 3) [30,31]. The presence of DMCS was confirmed only in the FTIR spectrum of the kieselguhr silanized with DMCS vapors, which displayed two new bands at 2972 and 1267 cm−1 related to the C–H asymmetrical stretching vibration in –CH3 and the symmetrical bending vibrations in Si–CH3 from DMCS, respectively. Additionally, the spectrum showed an increase in the intensities of 1100, 790, and 480 cm−1 bands from kieselguhr (Si–O–Si) due to the addition of bending vibration in Si–CH3 from the absorption peaks at 1260, 802, and 530 cm−1 from DMCS [32]. These validate that the dimethyl silane groups exist in the kieselguhr silanized with DMCS vapors. However, these changes were not present in the infrared spectrum of the kieselguhr silanized with DMCS liquid.

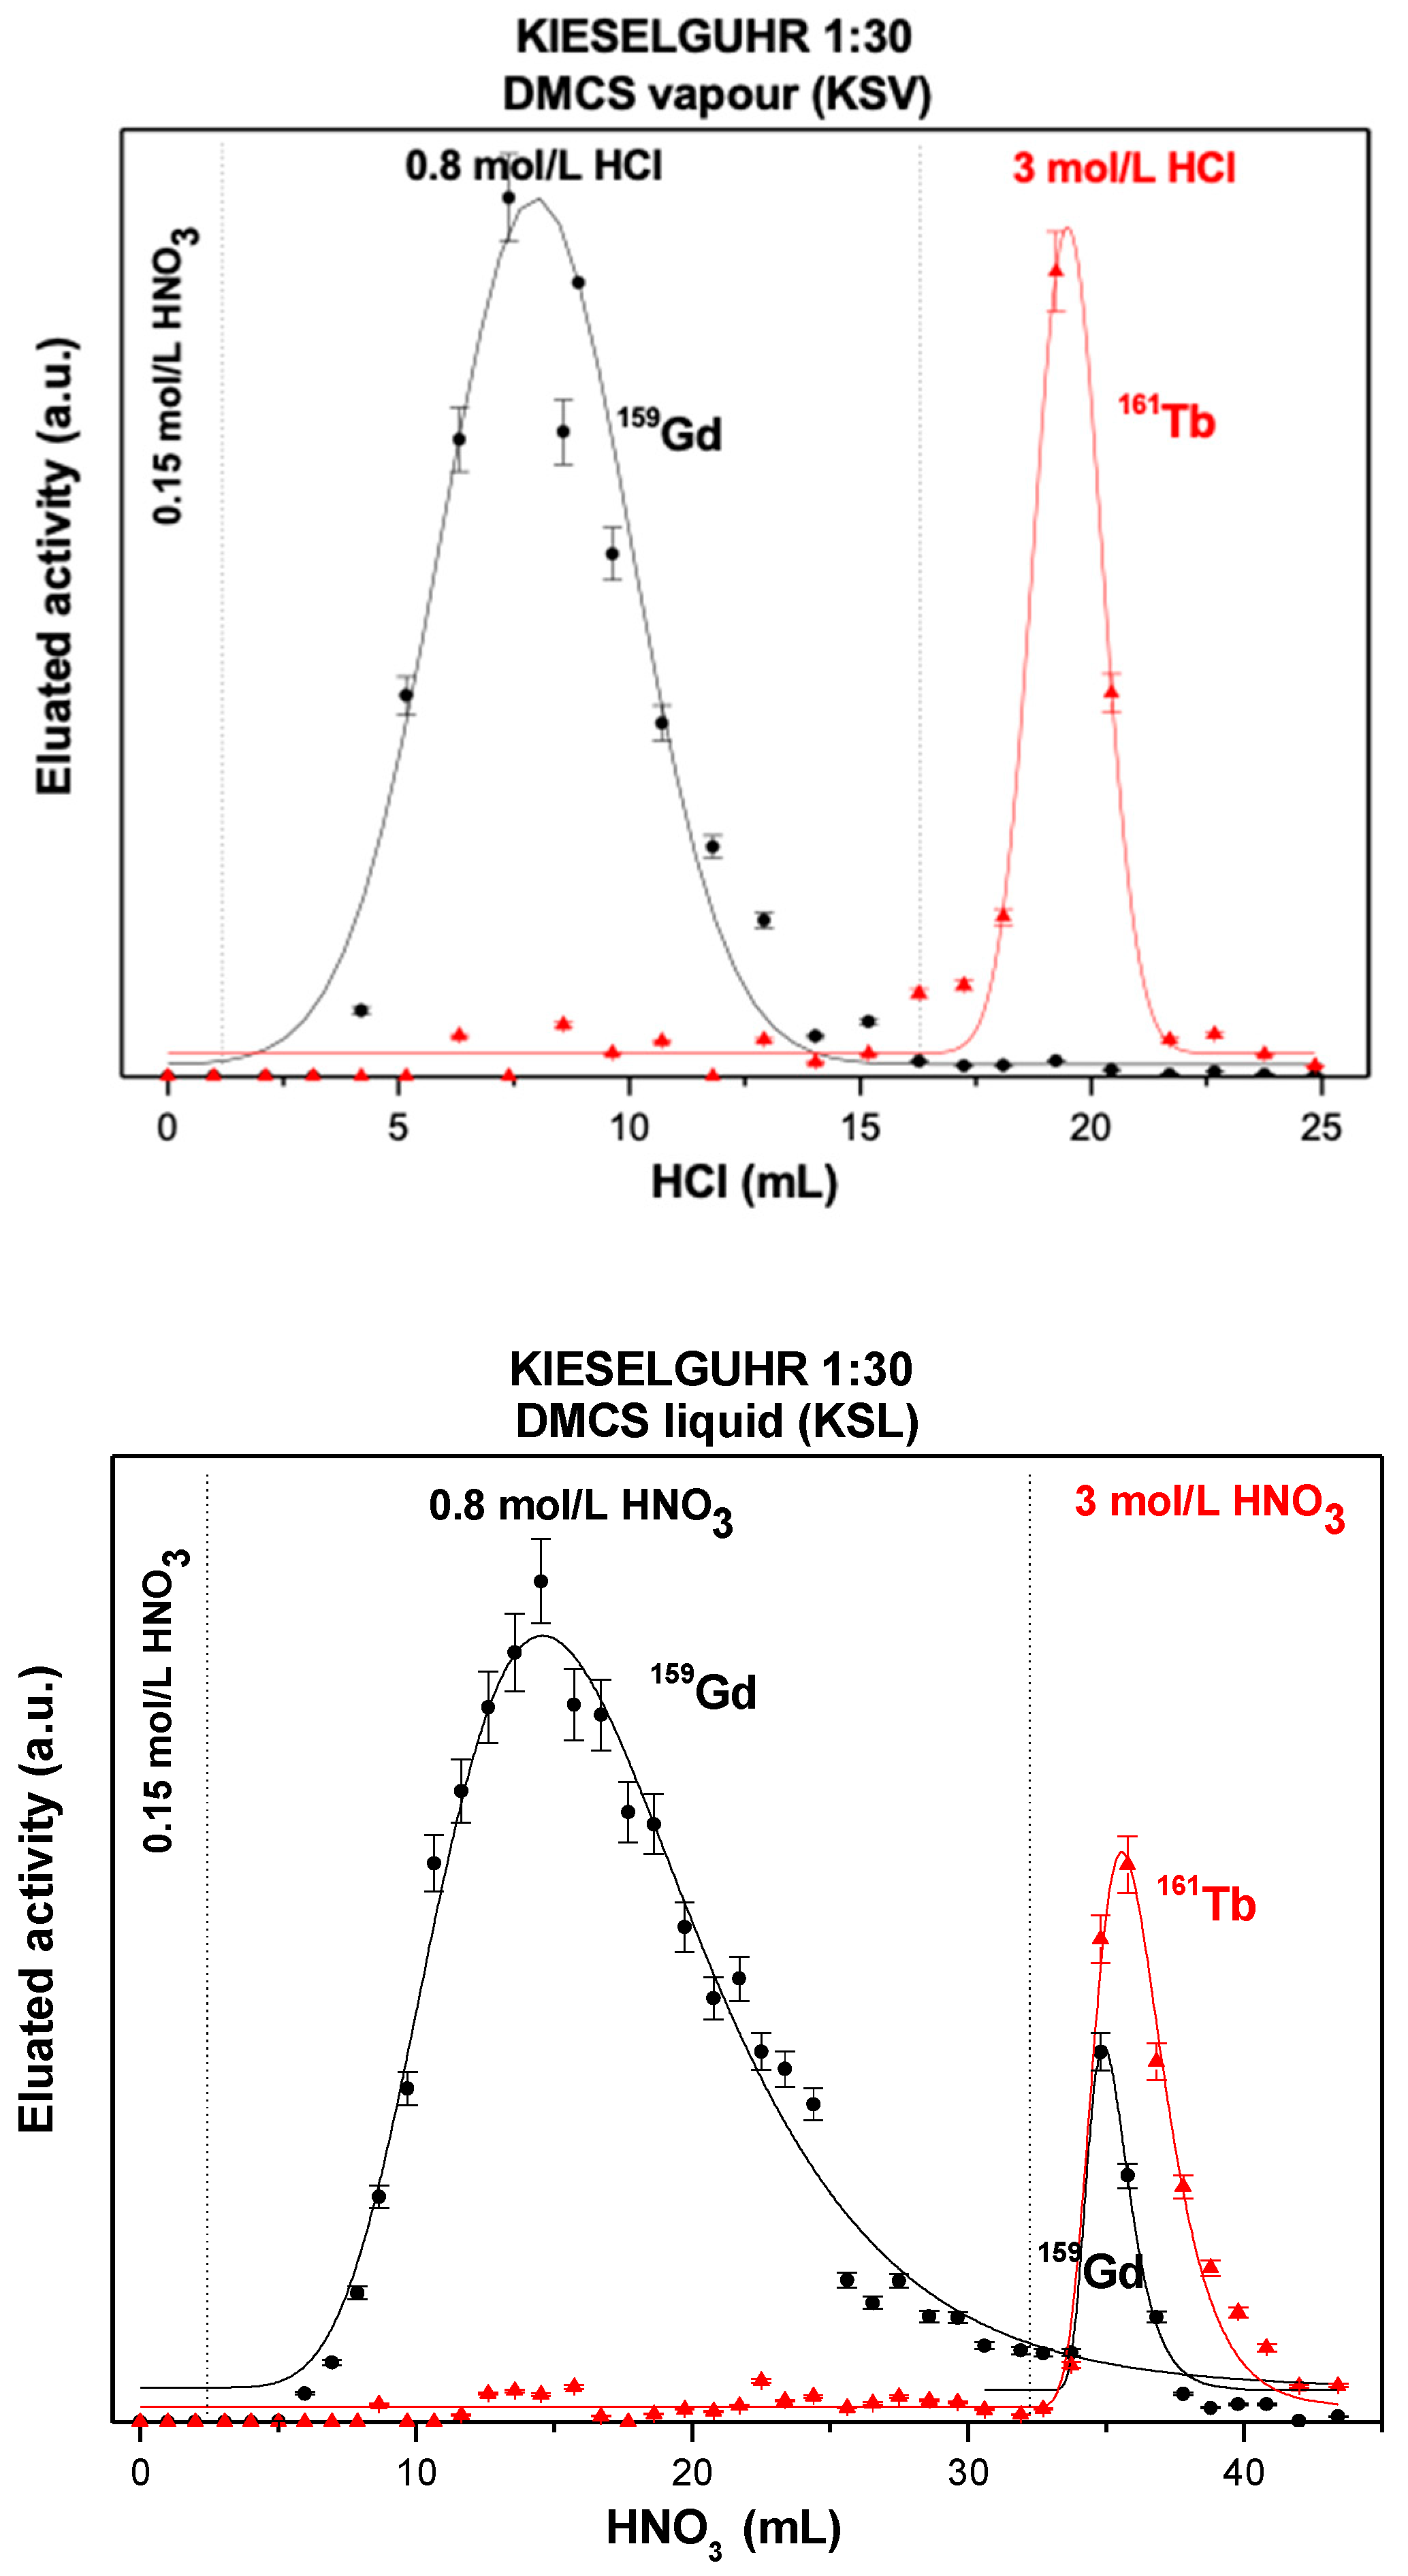
3.1.2. HDEHP-Impregnated Kieselguhr Silanized with DMCS Vapors

The capacity of kieselguhr silanized with DMCS vapors to load HDEHP is around 0.1 g HDEHP/g kieselguhr (see Table 3), i.e., 10% of the kieselguhr contains HDEHP, and is practically independent of the HDEHP concentration used for the preparation of solid extractants at an HDEHP:acetone ratio less than 1:30. When the ratio HDEHP:acetone is at 1:40, the amount of HDEHP loaded on the silanized kieselguhr is at 0.04 g HDEHP/g kieselguhr. Consequently, Kd values of Gd and Tb in these solid extractants (<1:30) should be similar since they have practically the same amount of HDEHP impregnated on kieselguhr. However, these Kds showed variations between 8.5 and 3.2 cm3/g (Table 3) that could be associated with Kd’s calculation errors (Equations (5) and (6)), which are significant at low Kd values, and mainly linked to the estimation of Vmax due to the uncertainty in the measurements of the volumes of each elution fraction, the activity, and the fit mathematical models [33].
Kd = | Kd V max | V max + | Kd V i | V i + | Kd m | m
Kd = V max m + V i m + ( V max V i m 2 ) m
However, the separation resolution and FWHM values of the Gd and Tb elution curves in these solid extractants, shown in Figure 4, present significant differences. Particularly, the solid extractant prepared with HDEHP at a 1:4 ratio showed the lowest separation resolution (0.58) and the highest FWHM for Gd (8.78 mL), while the solid extractant prepared at a 1:20 (HDEHP:acetone) ratio showed the highest separation resolution (1.23) and the lowest FWHM for Gd (4.6 mL).
It is known that chromatographic column dimensions and the speed of the mobile phase significantly influence the characteristics of the elution peaks. The increase in the diameter and length of the column produces an increase in the retention and the elution volumes and consequently in the FWHM and generates a decrease in the heights of the peaks. Meanwhile, an increase in the speed of the mobile phase causes an increase in the elution volume and therefore the FWHM, keeping the retention volume constant, and a decrease in separation resolution [33,34].
Considering that the extraction capacity tests of the solid extractants prepared from kieselguhr silanized with DMCS vapors and impregnated with HDEHP at different concentrations were performed with the same chromatography columns, amounts of solid extractants, and particle size (52–73 μm), the differences in their separation resolutions, peak height, and peak broadening (FWHM) (Figure 4, Table 3) are then associated with the elution velocity of the mobile phase, and therefore with the plate number of the chromatography column (efficiency).
Peak height and peak broadening are governed, in terms of the Van Deemter model, by kinetic processes in the column such as Eddy diffusion, longitudinal diffusion and mass transfer [1,35]. Under these concepts, the dispersion or widening (peak-broadening) of the elution peaks for Gd and Tb from these solid extractants (Figure 4) is the sum of these processes. Taking into account that these solid extractants contained the same amount of HDEHP loaded in the kieselguhr (<1:30) and that all the chromatography columns were packed and eluted at similar speeds, it would then be expected that these three kinetic factors (Eddy diffusion, longitudinal diffusion, and mass transfer) were similar. However, the variations in the elution curves, the Kd values, FWHM, and the separation resolutions of these solid extractants reflect that the characteristics of these materials are not similar, as is evident from the X-ray diffraction patterns, the infrared spectra, the microphotographs of these materials, shown in Figure 5, and data from the elemental analysis (Table 4).
Kieselguhr X-ray diffraction patterns present the XRD peak characteristics of the cristobalite (C) and tridymite (T) crystalline phases, as shown in Figure 3 and Figure 5 [27,28]. Note that the XRD peak intensities of silanized kieselguhr are twice those of solid extractants prepared with different concentrations of HDEHP.
The variations in the HDEHP concentration on the silanized kieselguhr produce changes in the structure of these solid extractants, as evidenced in their infrared spectra, with the appearance and increase of the band intensities at 1230 cm−1 and 1466 cm−1 and the broadband from 2847 to 2978 cm−1. The latter is the conjunction of the stretch vibrations P=O and C–H stretch (sym and antisym) from HDEHP [6]. The broadening of the 1090 cm−1 band was attributed to asymmetric stretching vibrations Si−O−Si from kieselguhr [30], due to the presence of the 1230 cm−1 band from HDEHP. In addition to the above, the elemental analysis made by the energy-dispersive X-ray spectroscopy (EDS) in micro-areas on the surface of the solid extractants (Table 4) shows that the P concentration on kieselguhr increase with augmented concentrations of the HDEHP used in the preparation of the solid extractant. This increase of the HDEHP concentration on kieselguhr is clearly shown in the brightest areas of the photomicrographs of these extractant solids (Figure 5). This confirms that the HDEHP exists in the kieselguhr. However, the incongruity between the amount of HDEHP impregnated on kieselguhr, similar in all solid extractants prepared at concentrations lower than 1:30 (HDEHP:acetone), and the variations in the Kd values, separation resolution, and FWHM of these materials (Table 3) could be explained by the HDEHP distribution on the kieselguhr surface. As can be seen in the photomicrographs of Figure 5, only in certain areas is HDEHP embedded and an increase in its concentration causes over-deposition of the extractant in these same areas until it reaches saturation, while at lower concentrations of HDEHP its distribution is more homogeneous (see photomicrograph 1:20).
Therefore, these solid extractants present the same amounts of g HDEHP/g kieselguhr. Alternatively, EDXA (energy dispersive spectroscopy X-ray analysis) analyses indicate an increase in the P concentration on kieselguhr with an increase of HDEHP. However, given the heterogeneity of the HDEHP deposition on kieselguhr, these results could be considered semi-quantitative because they were measured at only about 400 μm.

3.1.3. HDEHP-Impregnated Kieselguhr Silanized with DMCS Liquid

The solid extractants prepared with kieselguhr silanized with DCMS liquid presented an oily, pasty, and very viscous consistency which increased with the HDEHP concentration used for loading the kieselguhr. Therefore, the use of these solid extractants in the chromatography columns was technically not feasible, except for the solid extractant prepared with the lowest concentration of HDEHP (1:30). Hence, only the results of this material are reported in Table 3. The amount of HDEHP loaded on the kieselguhr silanized with DMCS liquid was 0.089 g HDEHP/g kieselguhr, 10% less than that obtained in the extractive solids prepared with kieselguhr silanized with DMCS vapors loaded also with HDEHP 1:30. Even when these solid extractants were compared under two different mediums (HCl, HNO3), it was assumed that in HNO3 the separation performance between Gd and Tb was better, given that the Ln(NO3)3∙3HDEHP complexes are more stable than Ln(Cl)33HDEHP (see Figure 2), as previously discussed. However, the separation factors of HDEHP impregnated into kieselguhr silanized with DMCS liquid (KSL) were lower by 23% than those of HDEHP impregnated into kieselguhr silanized with DMCS vapor (KSV), and the values of FWHM and Kd in KSL were practically double that in KSV (see Figure 6). Note that the Tb eluates collected from KSL still carried Gd, which means that it was not completely eluted in the first phase of separation (3M HNO3) and that the Gd elution peak is even wider, possibly due to a slow mass transfer between the stationary phase (KSL) and the mobile phase (HNO3) because the HDEHP is mainly impregnated on the kieselguhr surface and, to a lesser extent, in its pores.
The bands associated with HEDHP present in the KSL and KSV spectra FTIR (Figure 7)—2850 to 2992 cm−1 assigned to C–H stretching (sym and antisym), 1638 cm−1 ascribed to the P–O–H group, and 1472, 1227, and 1034 cm−1 stretching vibrations of the P=O and P–O–(C) [6] clearly show a greater definition in the spectrum FTIR of KSL; however, the intensities of these peaks are greatest in the KSV spectrum. The KSL spectrum FTIR is closer to the pure HDEHP spectrum, while the KSV spectrum FTIR amalgamates the bands at 1227 cm−1 and 1034 cm−1 from HDEHP with that at 1090 cm−1 attributed to the Si−O−Si from kieselguhr [30]. The elemental analysis of these materials indicated a concentration of P three times higher in KSL with respect to that present in KSV, and the microphotographs of these extractant solids clearly showed that the impregnation of HDEHP was heterogeneous, particularly in KSL, and the extractant was preferentially located in certain areas. KSL and KSV X-ray diffraction patterns showed a drastic decrease in their intensities as compared to those of pure and silanized kieselguhr. The XRD peaks at 14.9 and 31.9 2θ disappeared and those at 11.7 and 6.95 2θ appeared from the KSL XRD pattern, while that of KSV retained a similar XRD pattern to those of silanized kieselguhr.
According to these data, the kieselguhr hydrophobization methodology has a direct effect on how HDEHP is loaded on the support and consequently on the extraction performance of the solid extractant in the chromatographic process. The HDEHP loaded on the support was more uniform and homogeneous when the silanization process was carried out with DMCS vapor, producing a higher chromatographic resolution (greater number of theoretical plates), while the treatment with DMCS liquid solutions produced a non-homogeneous distribution of the HDEHP on the kieselguhr. In this case, the extractant agglomerated in some areas of the kieselguhr surface and caused a decrease in the separation resolution and a widening (peak-broadening) of the elution peaks.

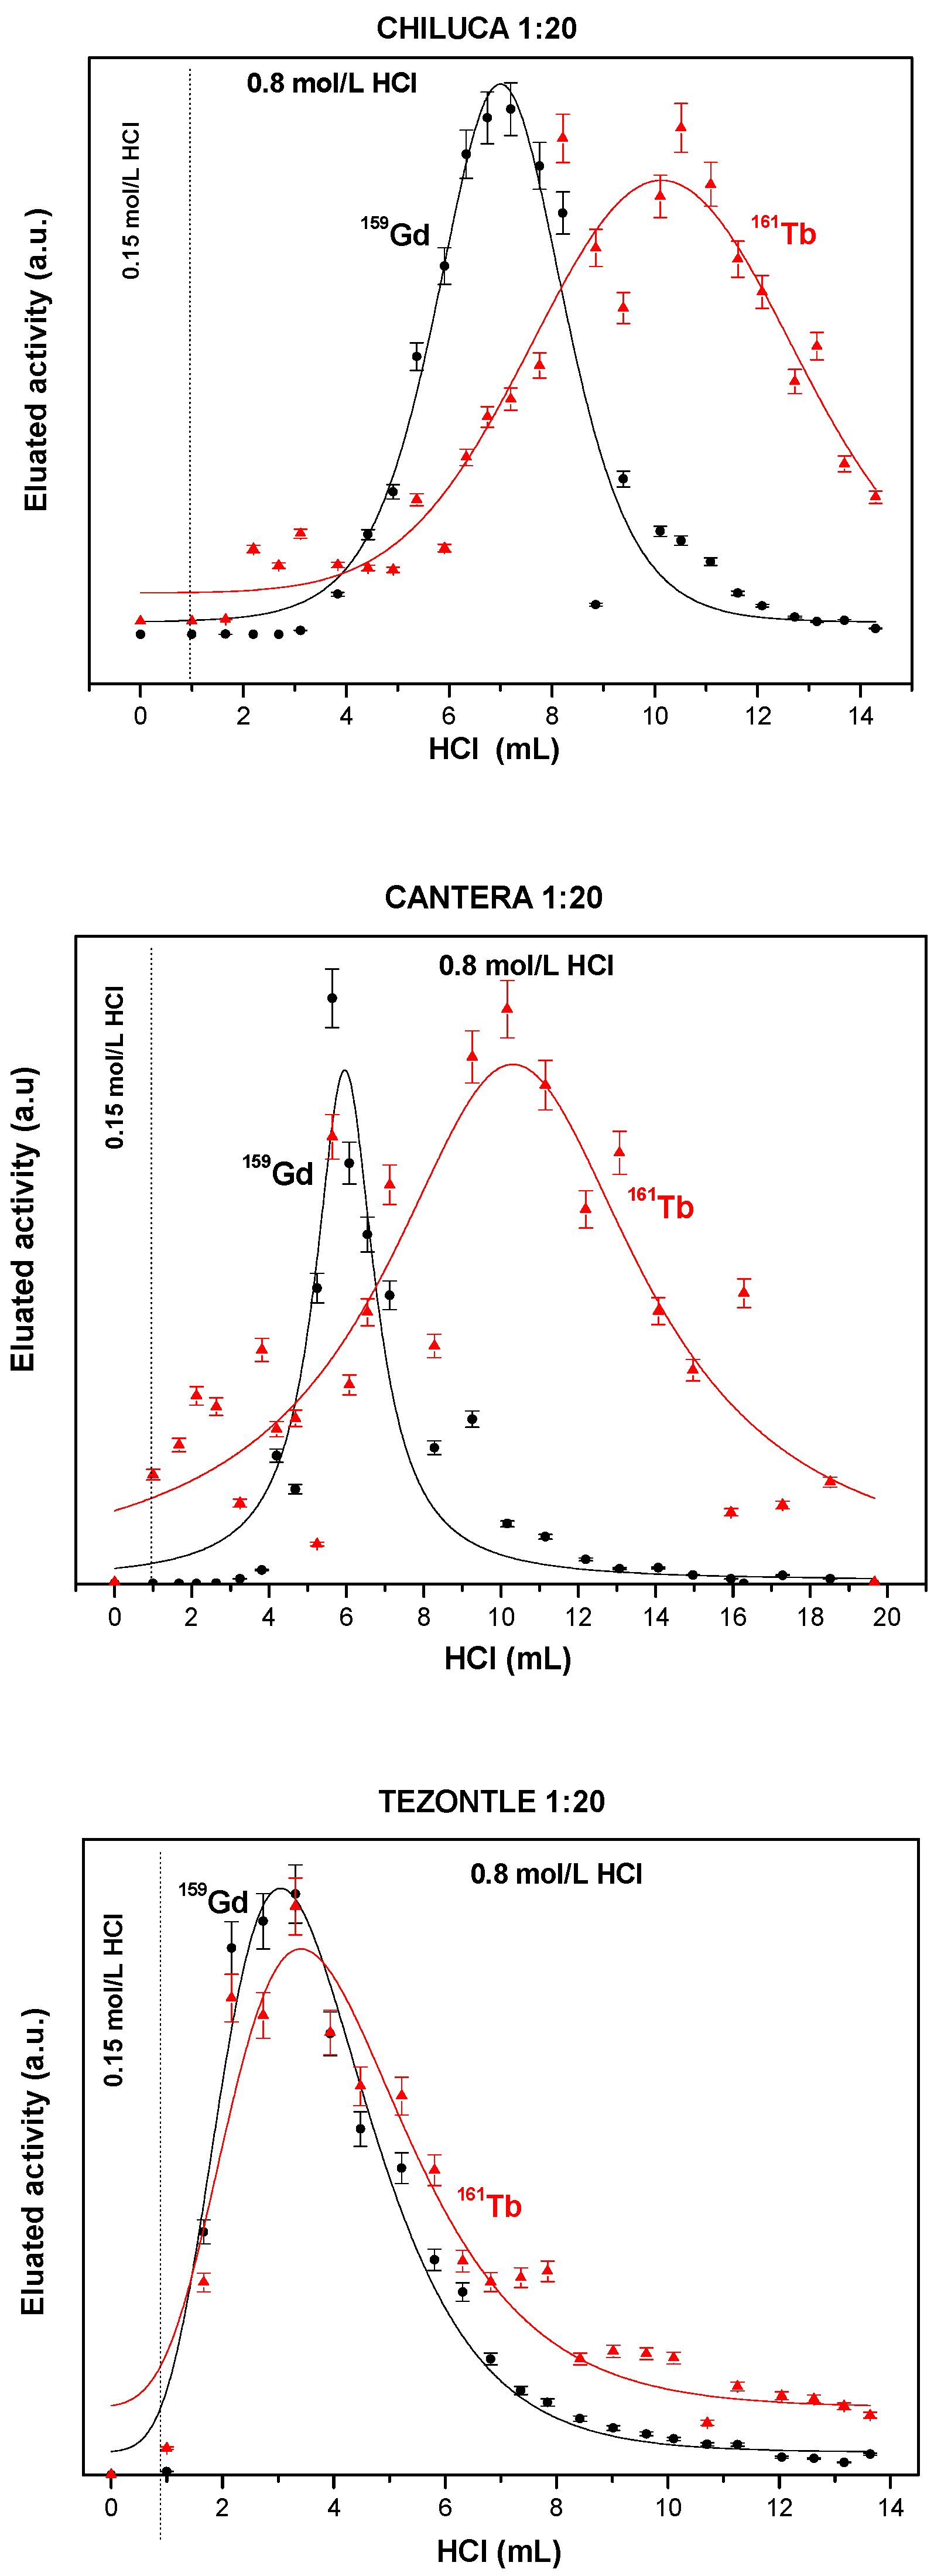
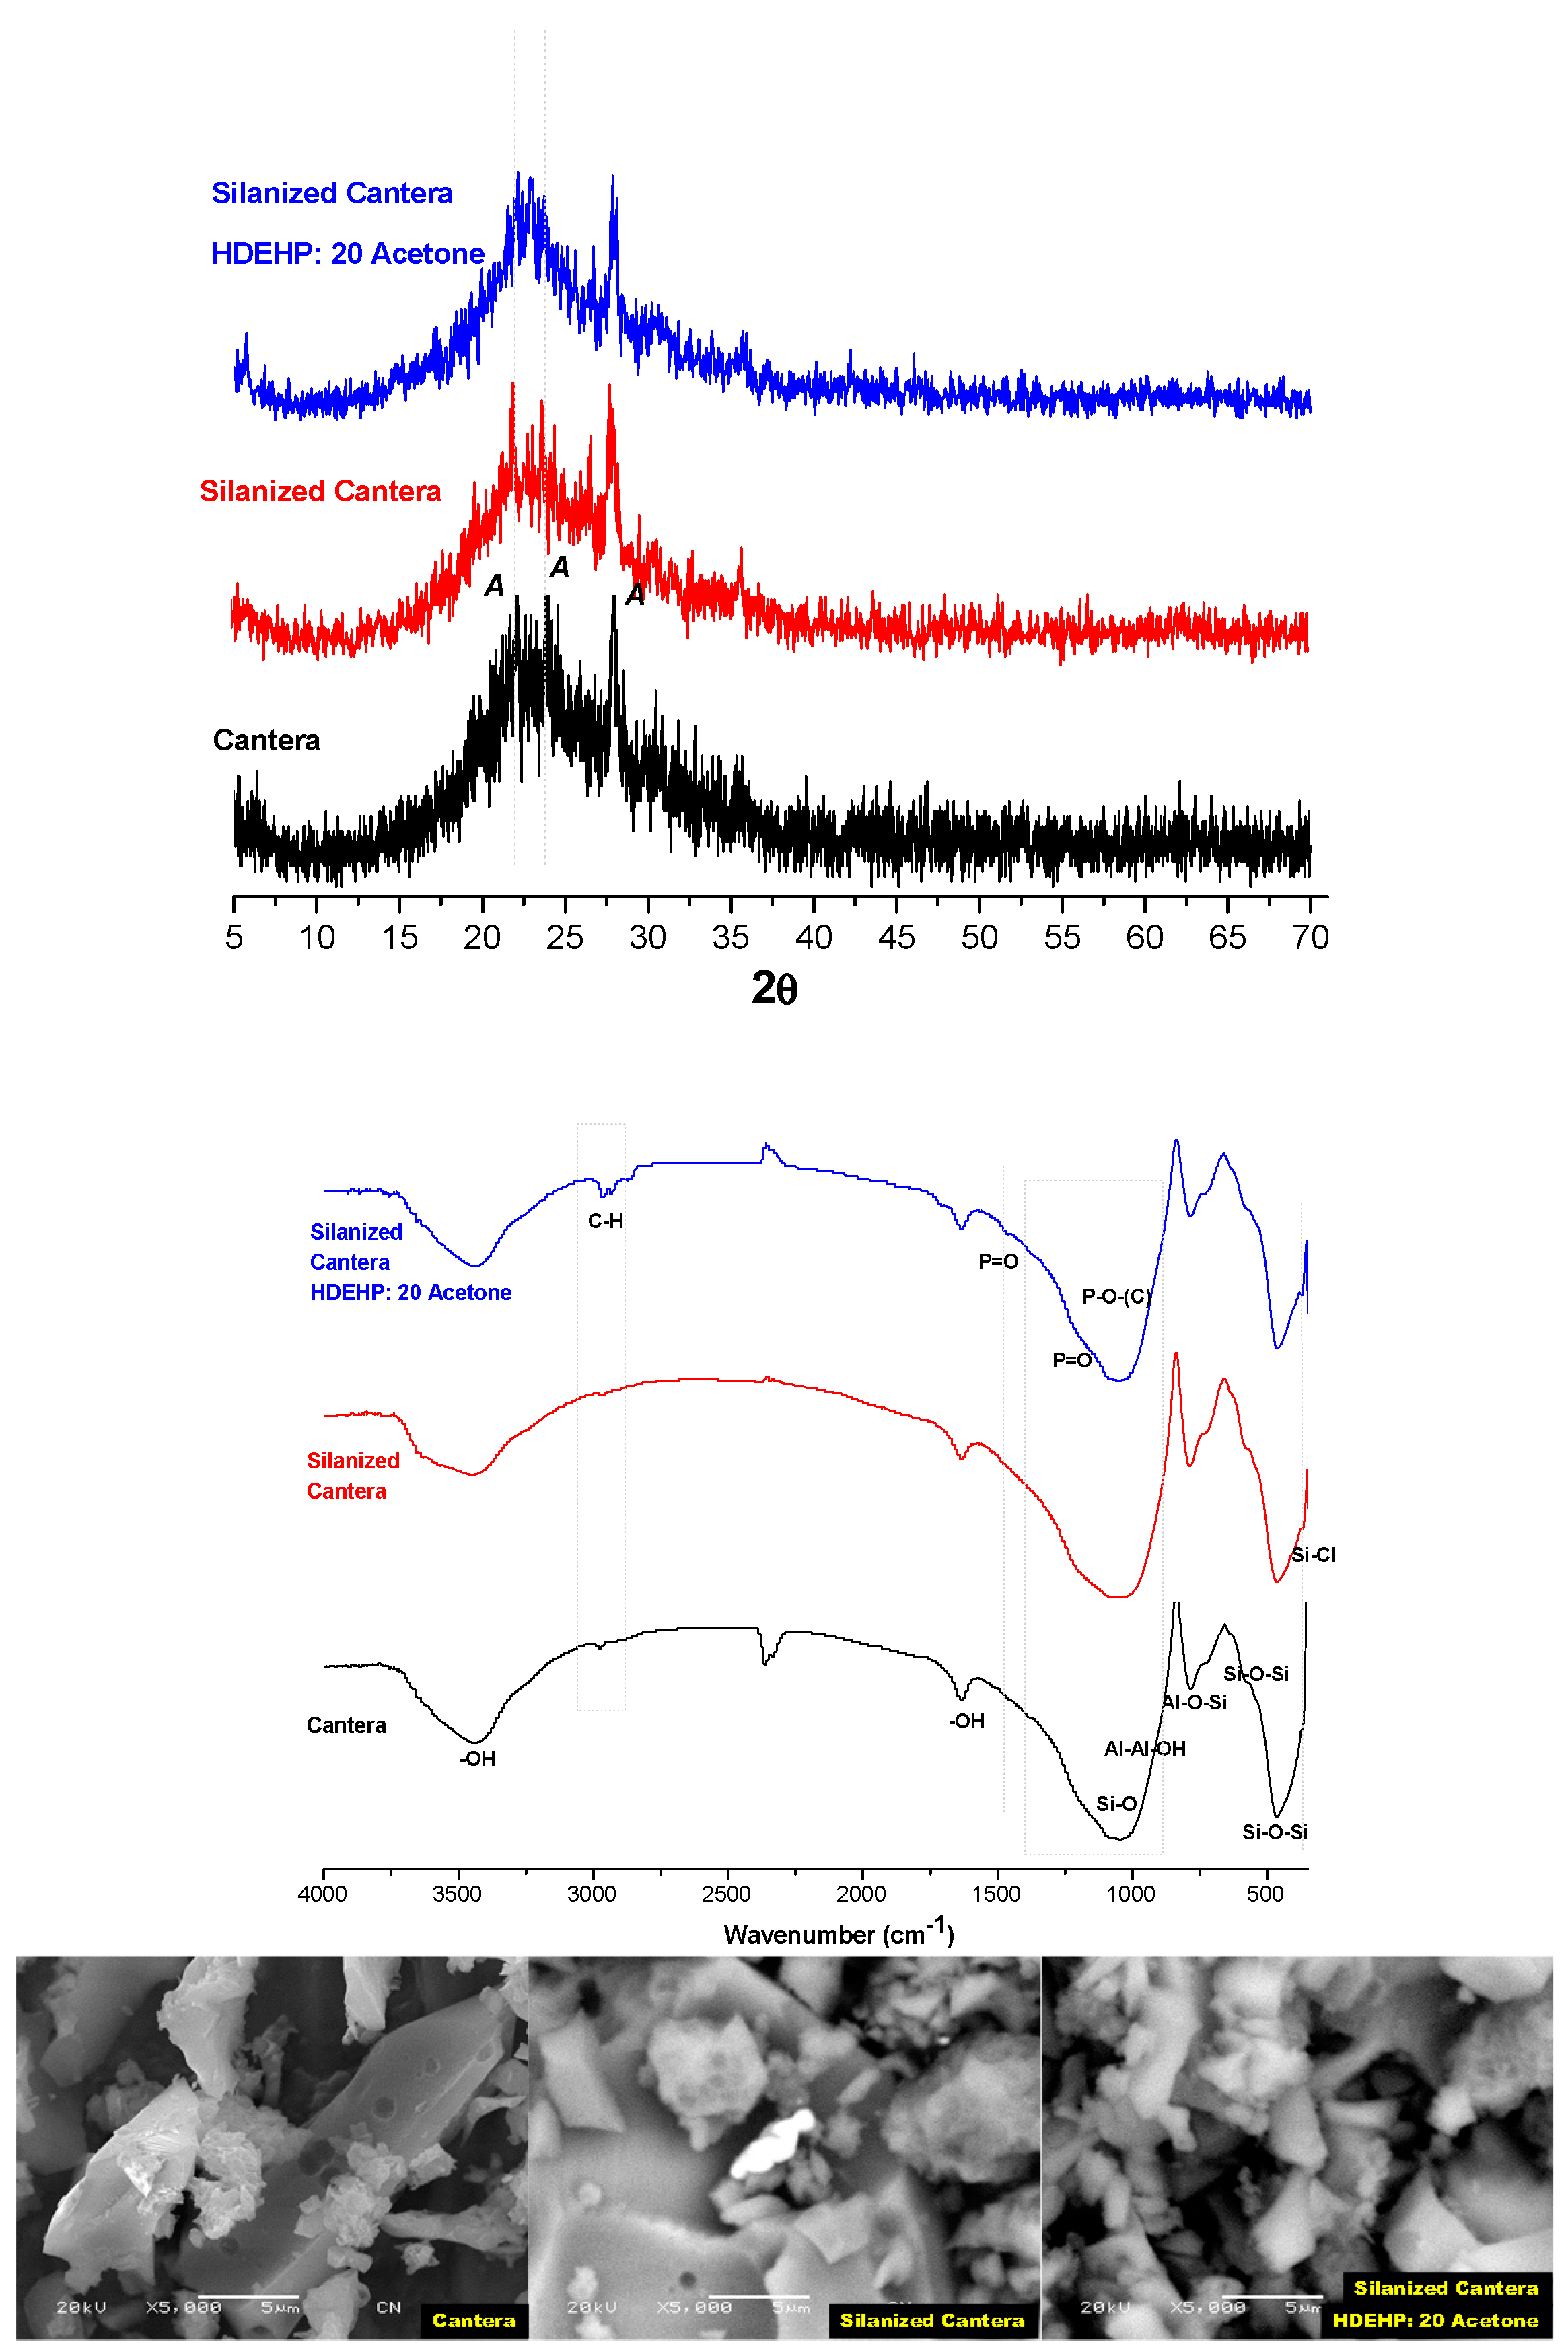
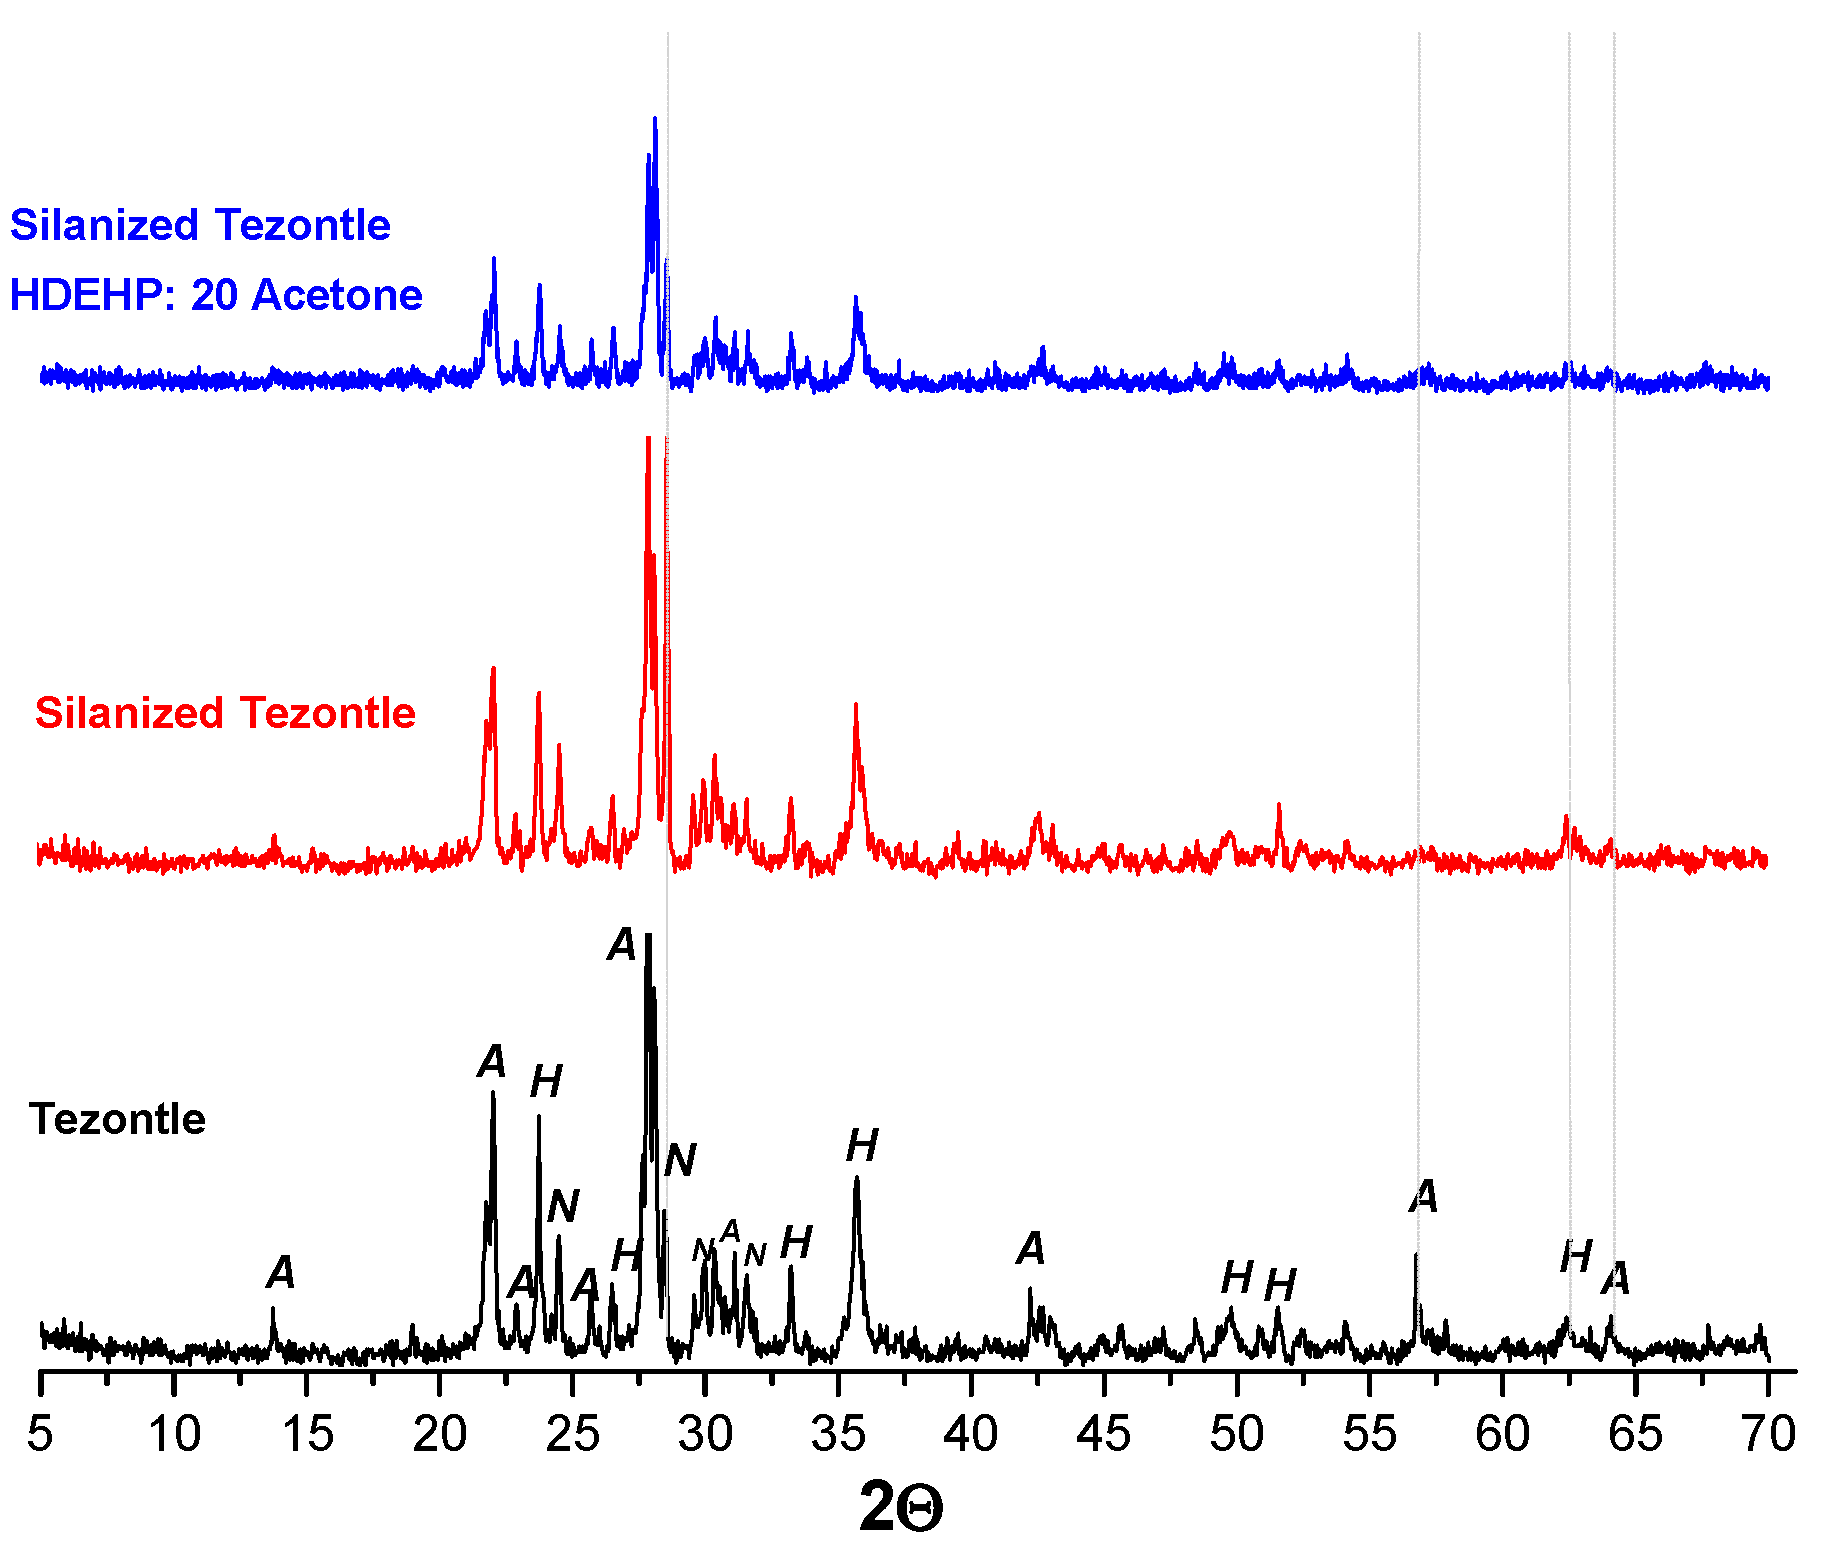
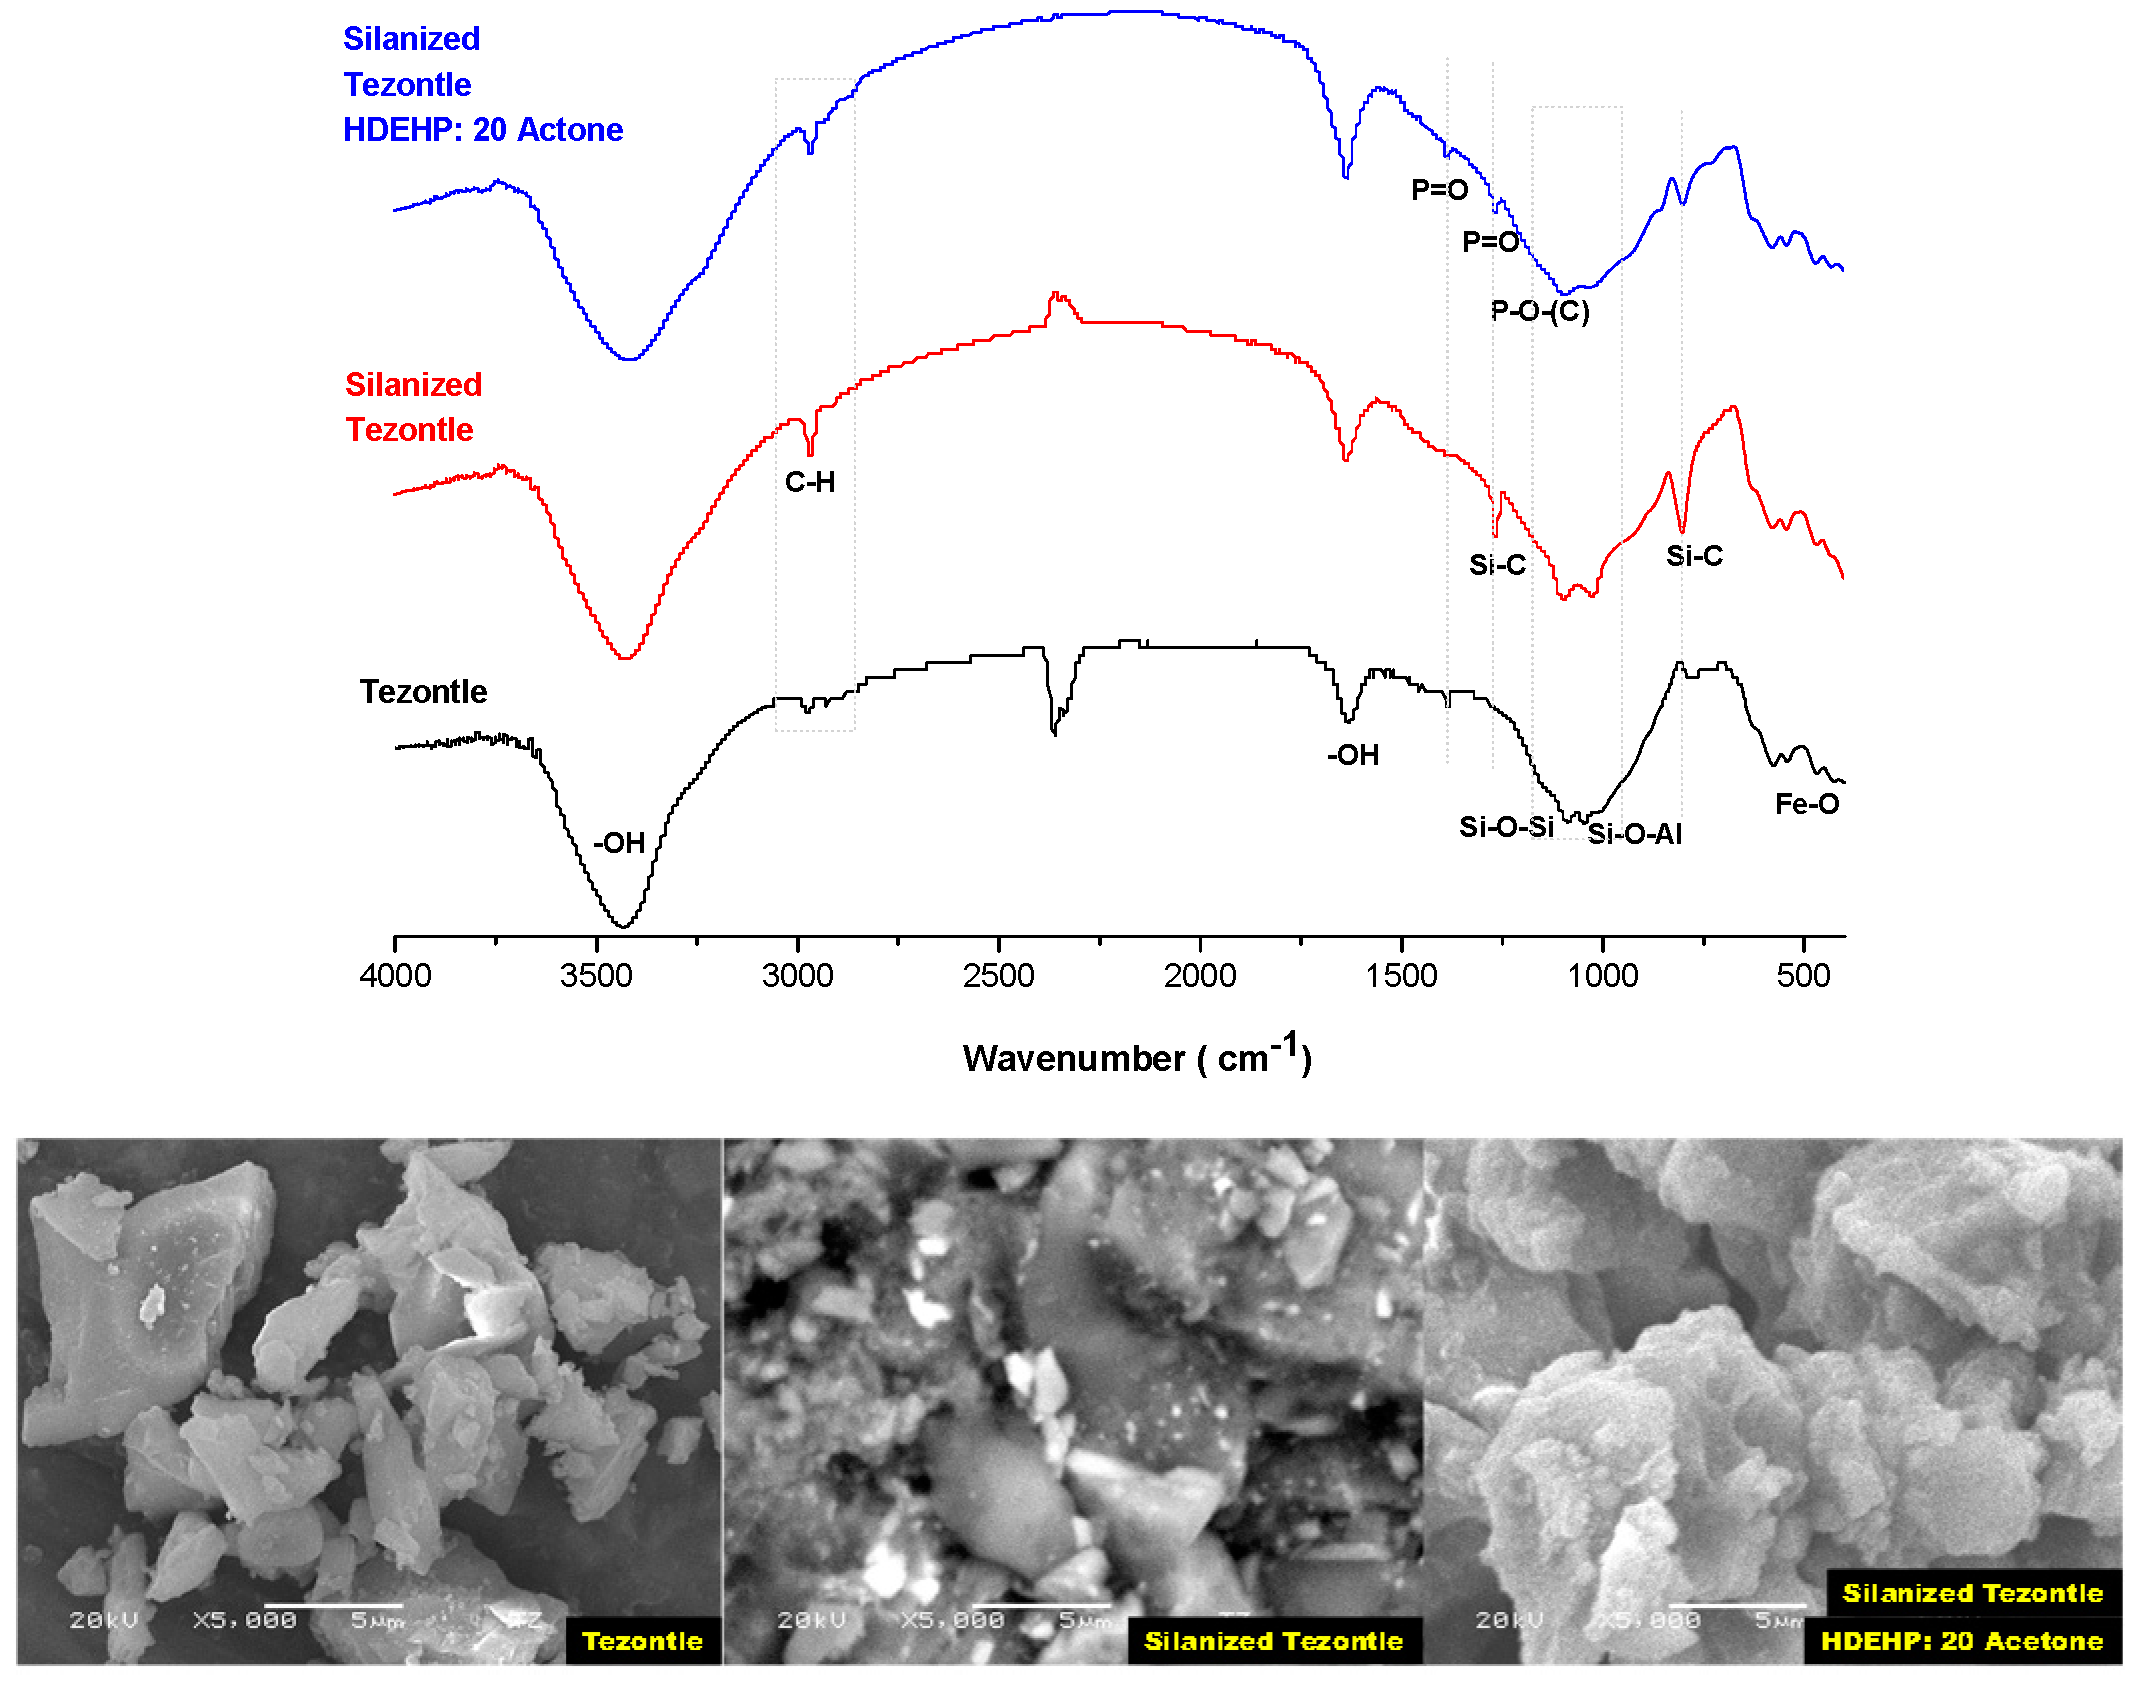
3.2. Solid Extractant Prepared with Volcanic Rocks

The amount of HDEHP loaded in the cantera and tezontle (0.02 g HDEHP/g support) was around 5 times less than those obtained in kieselguhr, and in the case of chiluca (0.01 g HDEHP/g support) 10 times lower (Table 3). The elution of Gd and Tb was performed only with 0.8 M HCl (Figure 8) since both elements were eluted at about the same time from the first elution volumes, hence the low values of Kd and separation resolution, particularly in the tezontle. There was practically no retention of Gd and Tb in these extractant solids.
Cantera, tezontle, and chiluca (volcanic rocks) are constituted of feldspars (see Figure 9, Figure 10 and Figure 11): cantera contains albite (NaAlSi3O8), chiluca contains albite and quartz (SiO2), and tezontle contains albite, anorthoclase (Na,K)(AlSi3O8), and hematite (Fe2O3). Feldspars are anhydrous three-dimensional aluminosilicates of linked SiO4 and AlO4 tetrahedra, with the Si ions in the center of such tetrahedra being partly replaced by Al ions, which contain cavities within the framework to accommodate Na+, K+, or Ca2+ for maintaining electroneutrality [36]. Water reacts with the surfaces of oxide minerals such as feldspars, silicate minerals, or hematite, adding hydrogen to their oxygen atoms, and hydroxyls to the metals, resulting in a surface of metal-hydroxides and bridging oxygen. These hydroxyls participate in acid–base reactions and ion exchange, so these volcanic rocks display adsorptive properties. These supports were then hydrophobized by DMCS to depress these adsorptive properties and convert surface silanol groups (Si–OH) of these materials to silyl ether groups (–Si–O–Si–(CH3) 2-) by silanization with DMCS.
The silanization and loading of HDEHP on the three volcanic rocks do not produce a modification of their structures, only changes in its XRD peak intensities. In the cantera, a somewhat amorphous material, the intensities of the XRD peaks increased with silanization and additionally with loading of HDEHP (Figure 9). In chiluca, the intensities of the XRD peaks decreased with silanization and increased with the HDEHP loading (Figure 10), and in tezontle, the intensity of the XRD peaks decreased with silanization and also with the loading of HDEHP (Figure 11).
The most significant spectral bands of albite in cantera, assigned to the following vibrations: 3434 cm−1 structural hydroxyl groups, 1054 cm−1 Si-O, 784 cm−1 O–Si–O, 724 cm−1 O–Si–O, 588 cm−1 O–Al–O, 546 cm−1 Al-O-Si, and 470 cm−1 Si-O-Si [37,38], are also present in the infrared spectra of the albite silanized and loaded with HDEHP. The silanization of albite is manifested with the appearance of the small band at 365 cm−1 belonging to the vibration νSi-Cl [39], also present in the spectrum of the extractant solid (HDEHP-impregnated kieselguhr silanized with DMCS vapor). Moreover, the HDEHP deposition on silanized albite is expressed by the presence of the broad band from 3008–2898 cm−1 assigned to C–H stretching from HDEHP and the better definition of the 1230 cm−1 band from HDEHP in the broadband of the 1054 cm−1 from albite [6].
The following stretching modes were observed in the FTIR spectrum of pure chiluca: stretching vibration of OH at 3432 and 1635 cm−1, Si–O–Si vibration in the doublet 1107 and 1025 cm−1, vibration stretching of Si–O at 770 cm−1, O–Si–O and O–Al–O bending vibrations at 689, 633, and 582 cm−1 and vibrations of Al–O–Si at 540 cm−1 [37,38]. The chiluca that was silanized and loaded with HDEHP presented the same infrared pattern as the pure form, but the band intensities of the silanized chiluca were approximately 6 times greater than those of the pure form and that with HDEHP. The presence of DMCS in the silanized chiluca was manifested by the band at 1889 cm−1, and the HDEHP was exhibited by the broadband of 3002–2852 cm−1.
The spectrum FTIR of pure tezontle (Figure 11) presents characteristic bands at 3440 and 1633 cm−1 assigned to the adsorbed water and vibration of the OH groups, the band of strong absorption between 1215 and 836 cm−1, and the bands at 631 and 581 cm−1 attributed to O–Si–O and O–Al–O due to the stretching vibration of both SiO4 and AlO4 tetrahedron of albite and anorthoclase, and the three vibration modes of Fe(II)-O at 544, 473, and 434 cm−1 are attributed to hematite [38]. The silanization of tezontle was corroborated with the presence of bands at 2965, 1270, and 807 cm−1 associated with C–H and Si–CH3 vibrations of the DMCS [32], while the loading of HDEHP was manifested by the bands at 2968, 1389, 1274, and 802, cm−1 and the fusion of bands at 1089 cm−1 (Si–O–Si) of the tezontle and at 1100 cm−1 (P–O–(C)) of HDEHP (Figure 11).
These XRD and FTIR data are congruent with the elemental analyses of the silanized cantera, chiluca, and tezontle (Table 4). This analysis showed a slight increase in Si concentration in relation to the pure volcanic rocks due to the presence of DMCS, and when HDEHP is loaded on the silanized cantera and chiluca a decreased of Si concentration and the P presence were observed. Phosphorus concentration in these cases was lower than that obtained in the solid extractants prepared with kieselguhr, hence the lower retention of Gd and Tb. Note that, in the tezontle, there was no presence of P, that is, the HDEHP did not deposit on the surface of this support, therefore there was no extraction of Gd and Tb (see Figure 8) and both elements were practically eluted immediately.
Volcanic rocks have morphologies similar to that of glass. Cantera is a practically amorphous material (see the XRD pattern), and presented sets of conglomerated particles with dimensions smaller than 5 mm where DMCS and HDEHP were preferably deposited, manifesting in the brightest areas of the photomicrographs shown in Figure 9, Figure 10 and Figure 11. As in the case of kieselguhr, the deposition of these materials was heterogeneous.

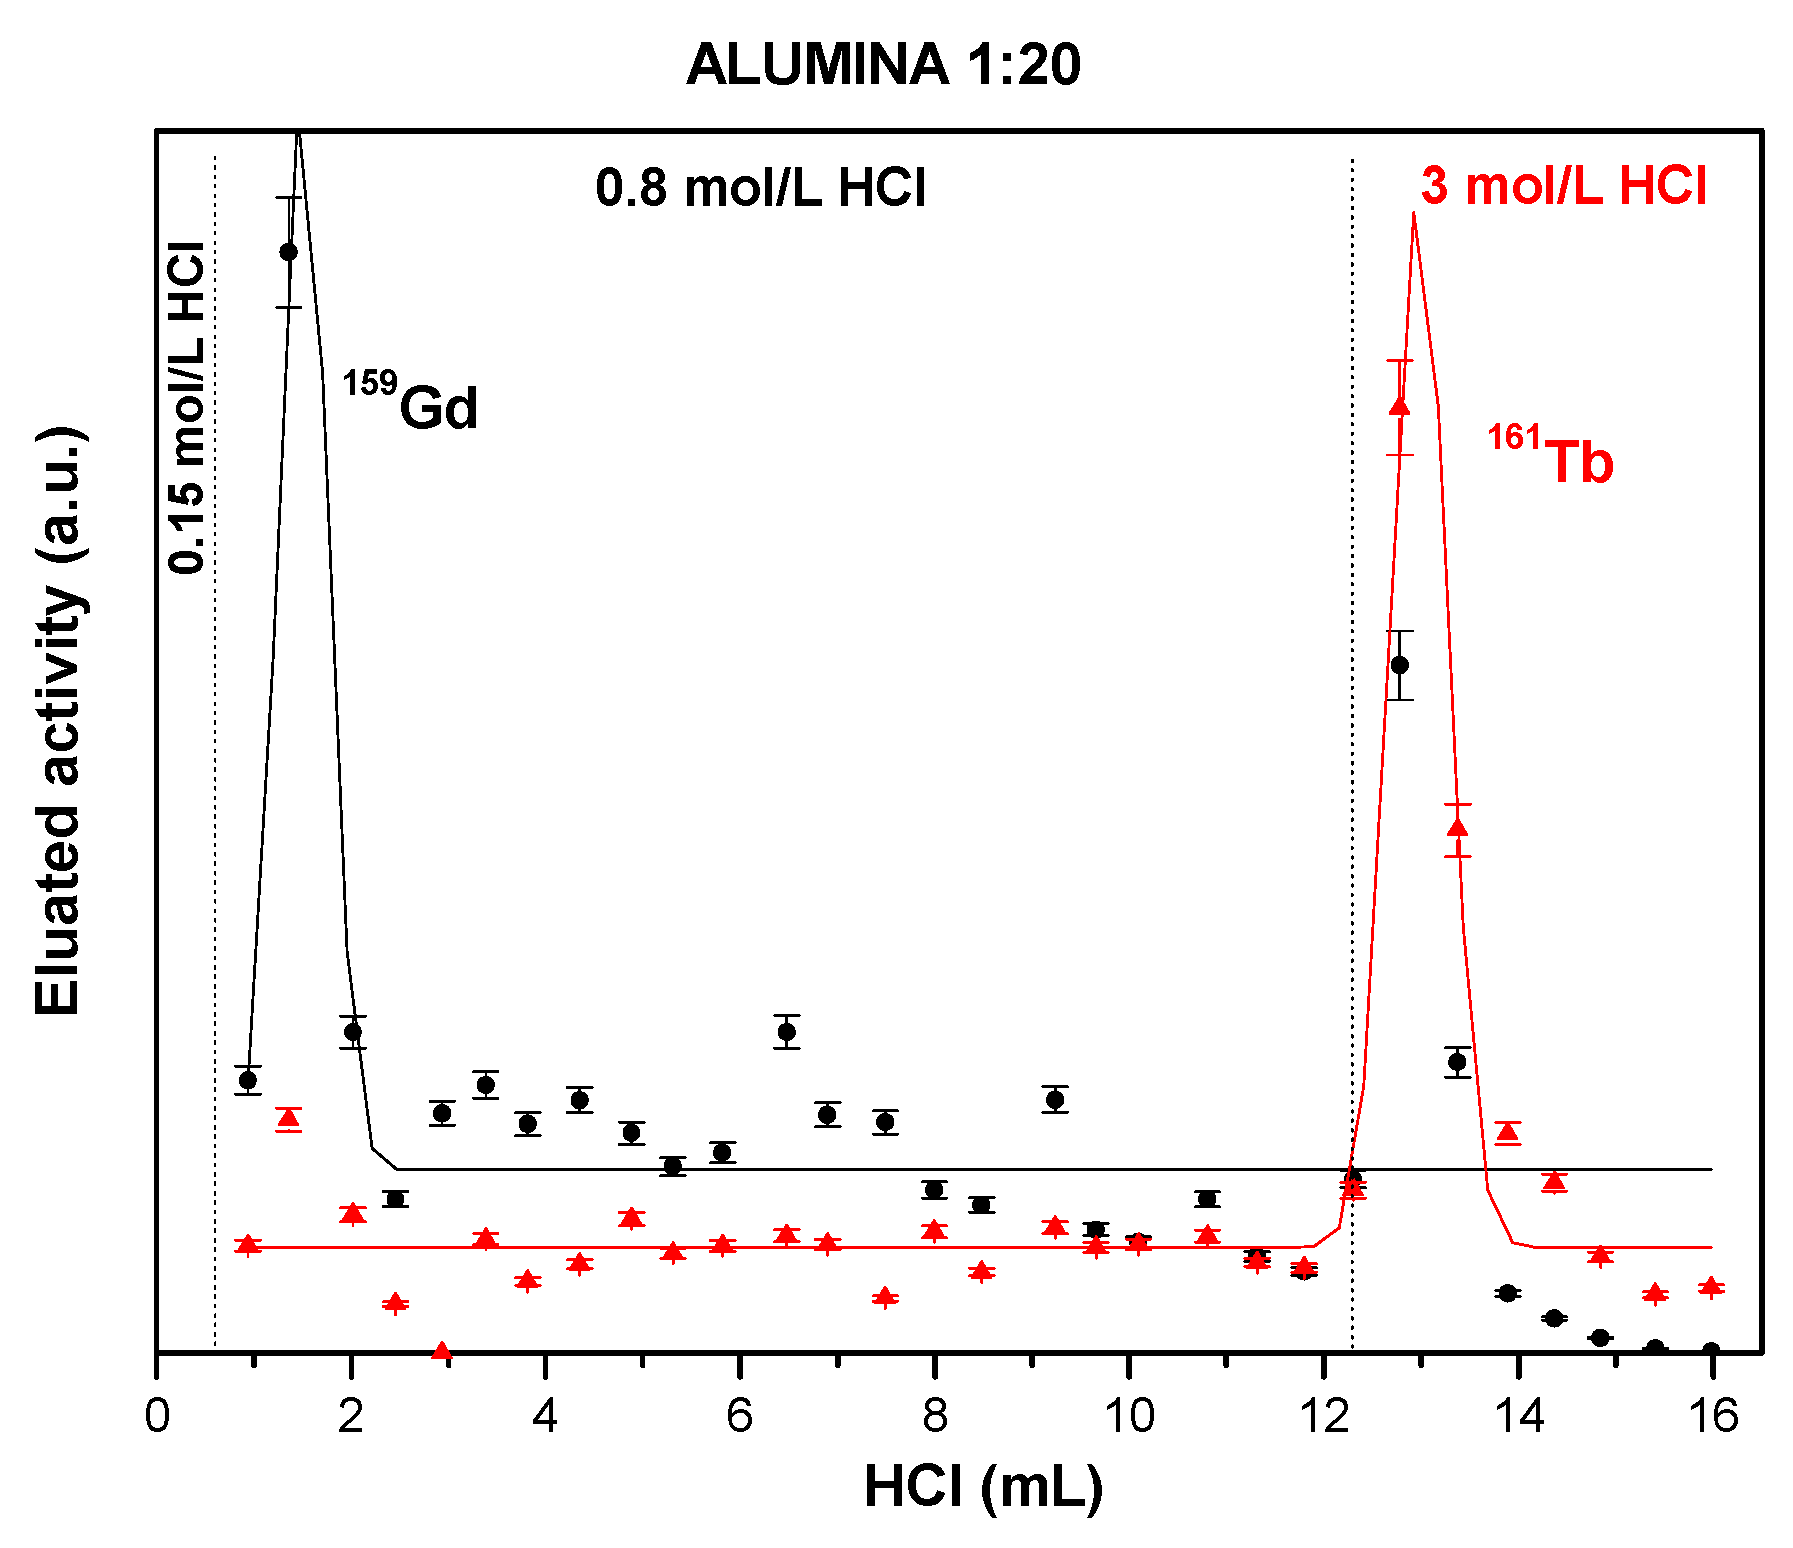
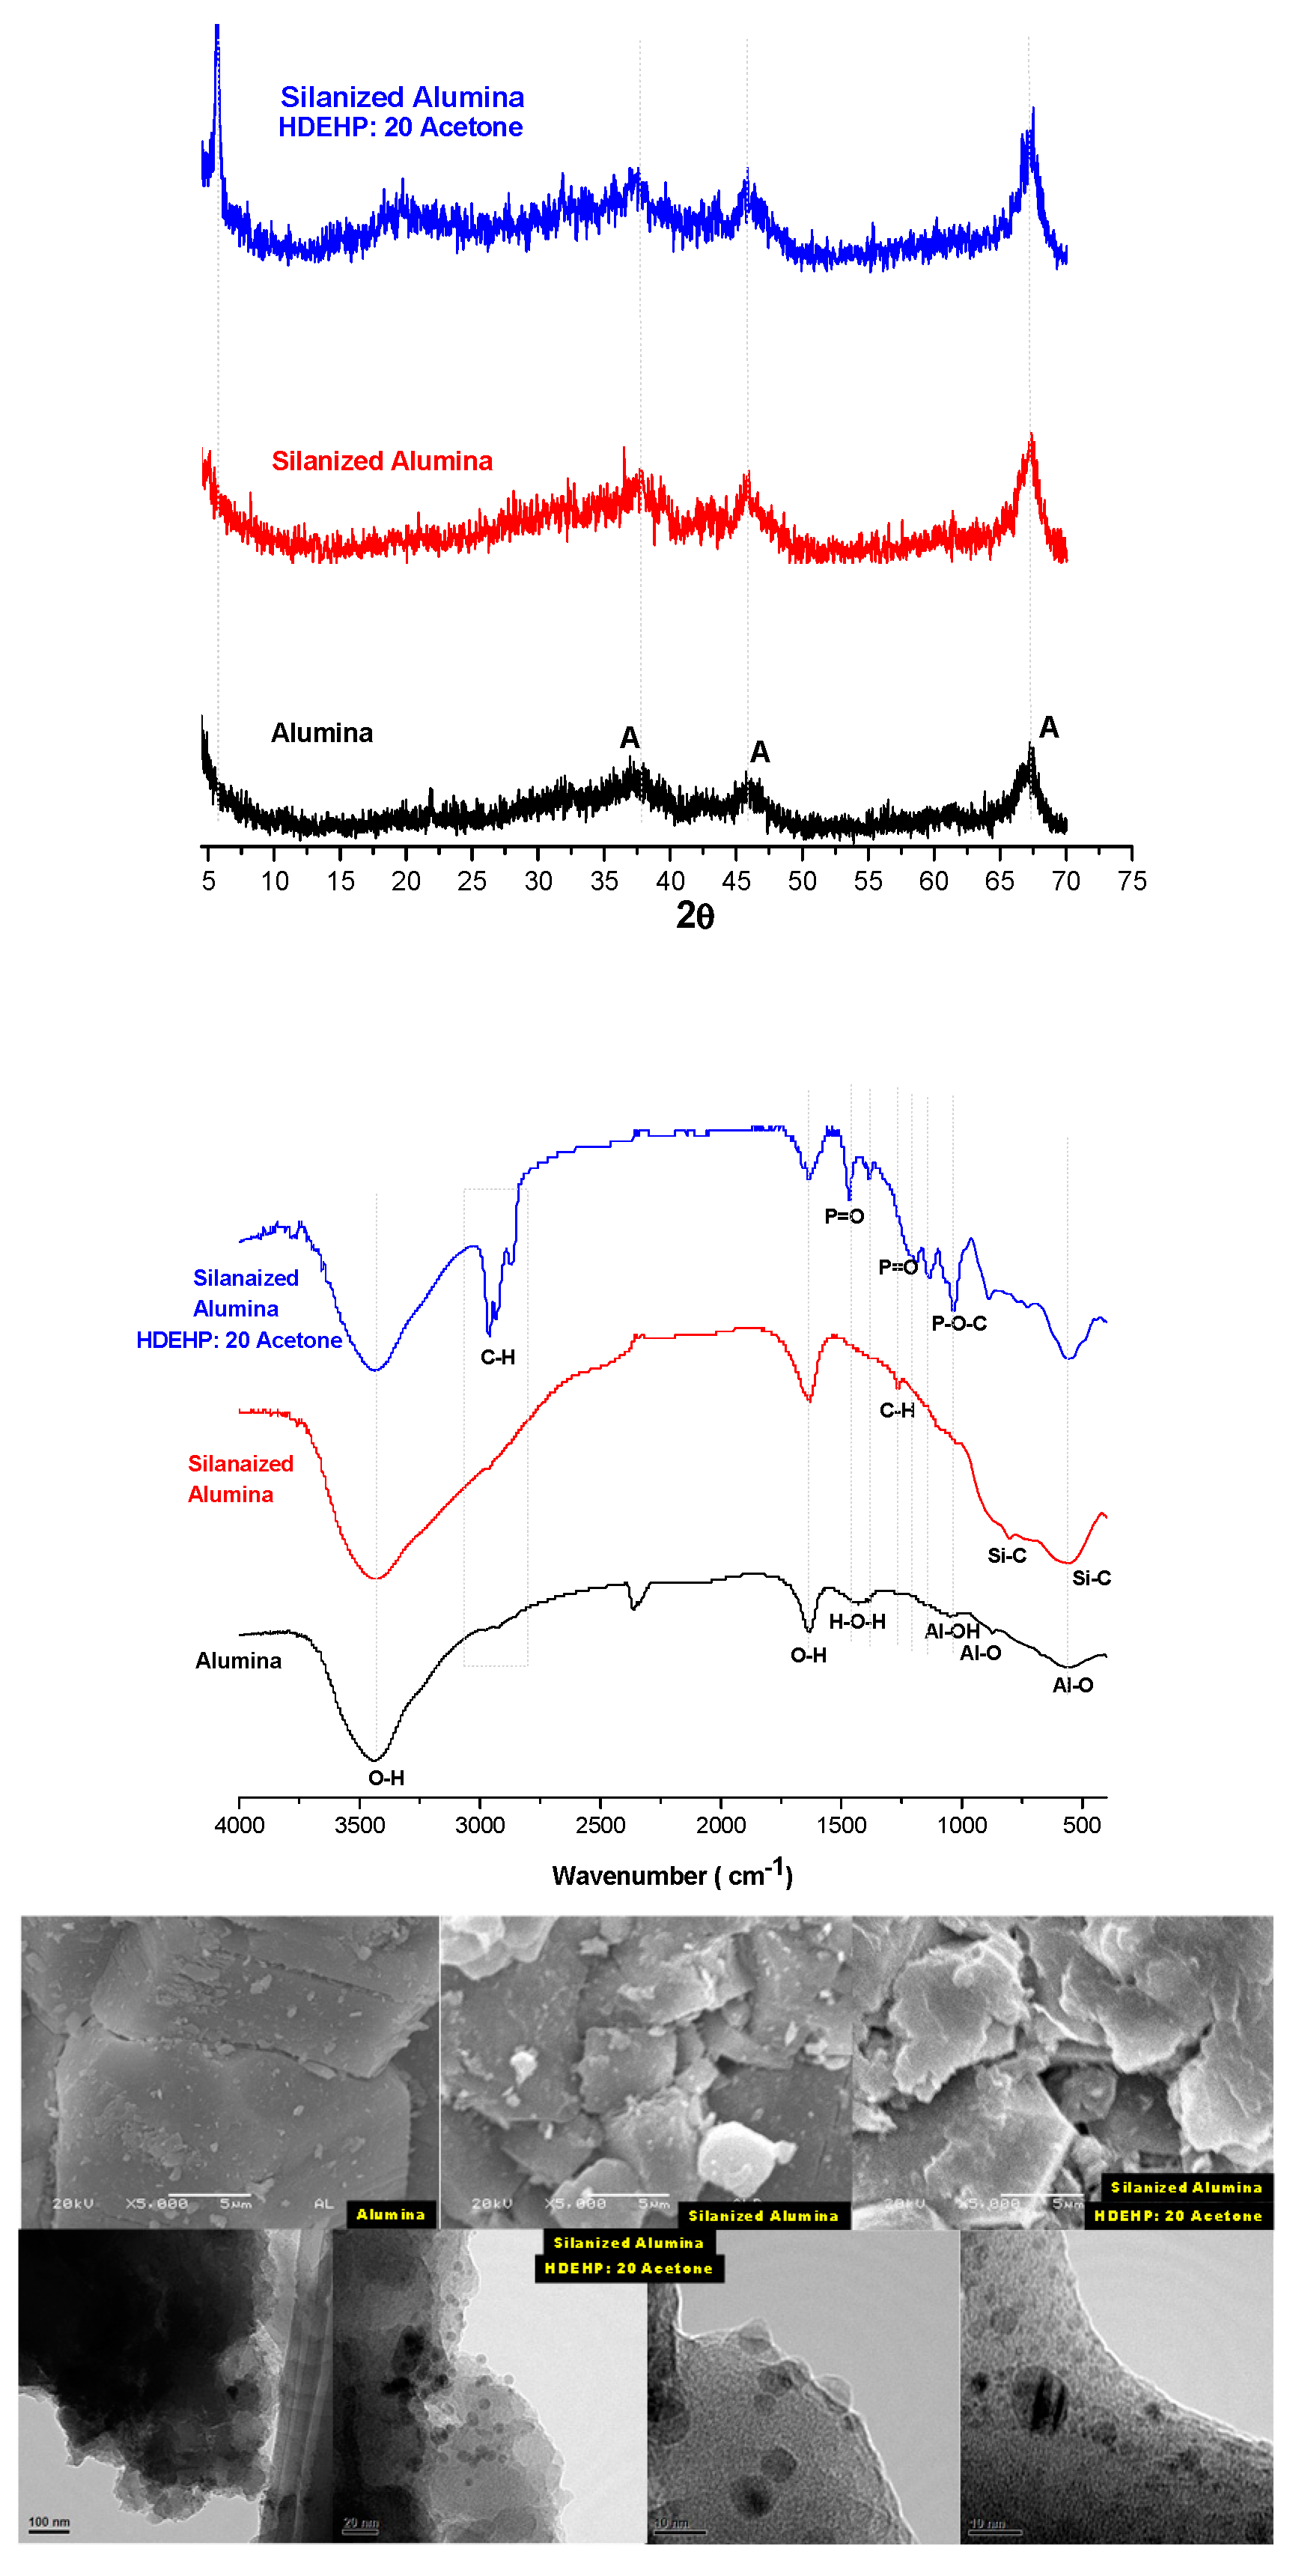
3.3. Solid Extractant Prepared with Alumina

The amount of HDEHP loaded on the alumina was 0.07 g HDEHP/g alumina, 30% less than the amount present in the solid extractants prepared with kieselguhr. Alumina impregnated with HDEHP silanized with DMCS vapors showed the highest Kd values of Gd and Tb, the highest separation resolutions, and the lowest values of FWHM from the Gd and Tb elution curves (Figure 12) of all the extractant solids prepared in this work and even of those obtained with the commercial resin Ln spec from Eichrom (Table 3).
Pure and silanized alumina (aluminum oxide) presented an amorphous halo pattern (Figure 13), with some XRD peaks characteristic of boehmite (γ-Al2O3) at 37.9, 45.17, and 67.3 2θ. While alumina loaded with HDEHP additionally showed an XRD peak at 5.8 2θ and a thick amorphous peak around 19 2θ [40]. The infrared spectrum of pure alumina strongly exhibited changes in its structure when it was silanized and loaded with HDEHP. The characteristic vibration bands of pure alumina present at 3446 cm−1 were assigned to OH stretching vibration that binds Al3+, 1637 cm−1 corresponding to physisorbed water, 1427 cm−1 due to deformation vibrations of the water, 1040 cm−1 attributed to the symmetrical bending of Al–O–H, 882 cm−1 assigned to the bending vibration of the Al–O bond and 563 cm−1 attributed to the Al–O stretch mode in the octahedral structure [40]. The infrared spectrum of silanized alumina clearly showed the incorporation of DMCS into alumina, given the presence of the absorption peaks at 1260, 802, and 530 cm−1 that corresponded to the Si–CH3 bending vibrations from DMCS [32,41]. The FTIR spectrum of the alumina loaded with HDEHP (solid extractant) presented the bands at 1464, 1388, 1196, 1138, 1038, 869, and 735 cm−1, corresponding to the vibrations of the functional groups associated with HDEHP [6], shown in Figure 14, and ratifying the deposition of HDEHP in alumina.
Because of the amorphous nature of alumina (see X-Ray diffraction patterns), its morphology is similar to that of glass, as can be seen in SEM microphotographs, where the presence of DMCS and HDEHP are reflected on whiter surfaces. The morphological analyses carried out by HRTEM showed how the molecules of DMCS (white lumps) adhered to the alumina (black area of the microphotograph) and the molecules of HDEHP (dark circles) were fixed on these lumps in the form of small droplets. Not all of the surface containing the DMCS was impregnated with HDEHP.
The presence of Cl and the decrease in the percentage of Al and O in the silanized alumina indicated the presence of DMCS on the surface of the alumina (Table 4). HDEHP is expressed on silanized alumina by the P presence, the decrease of the Al and O percentage, and the C increase in this solid extractant.

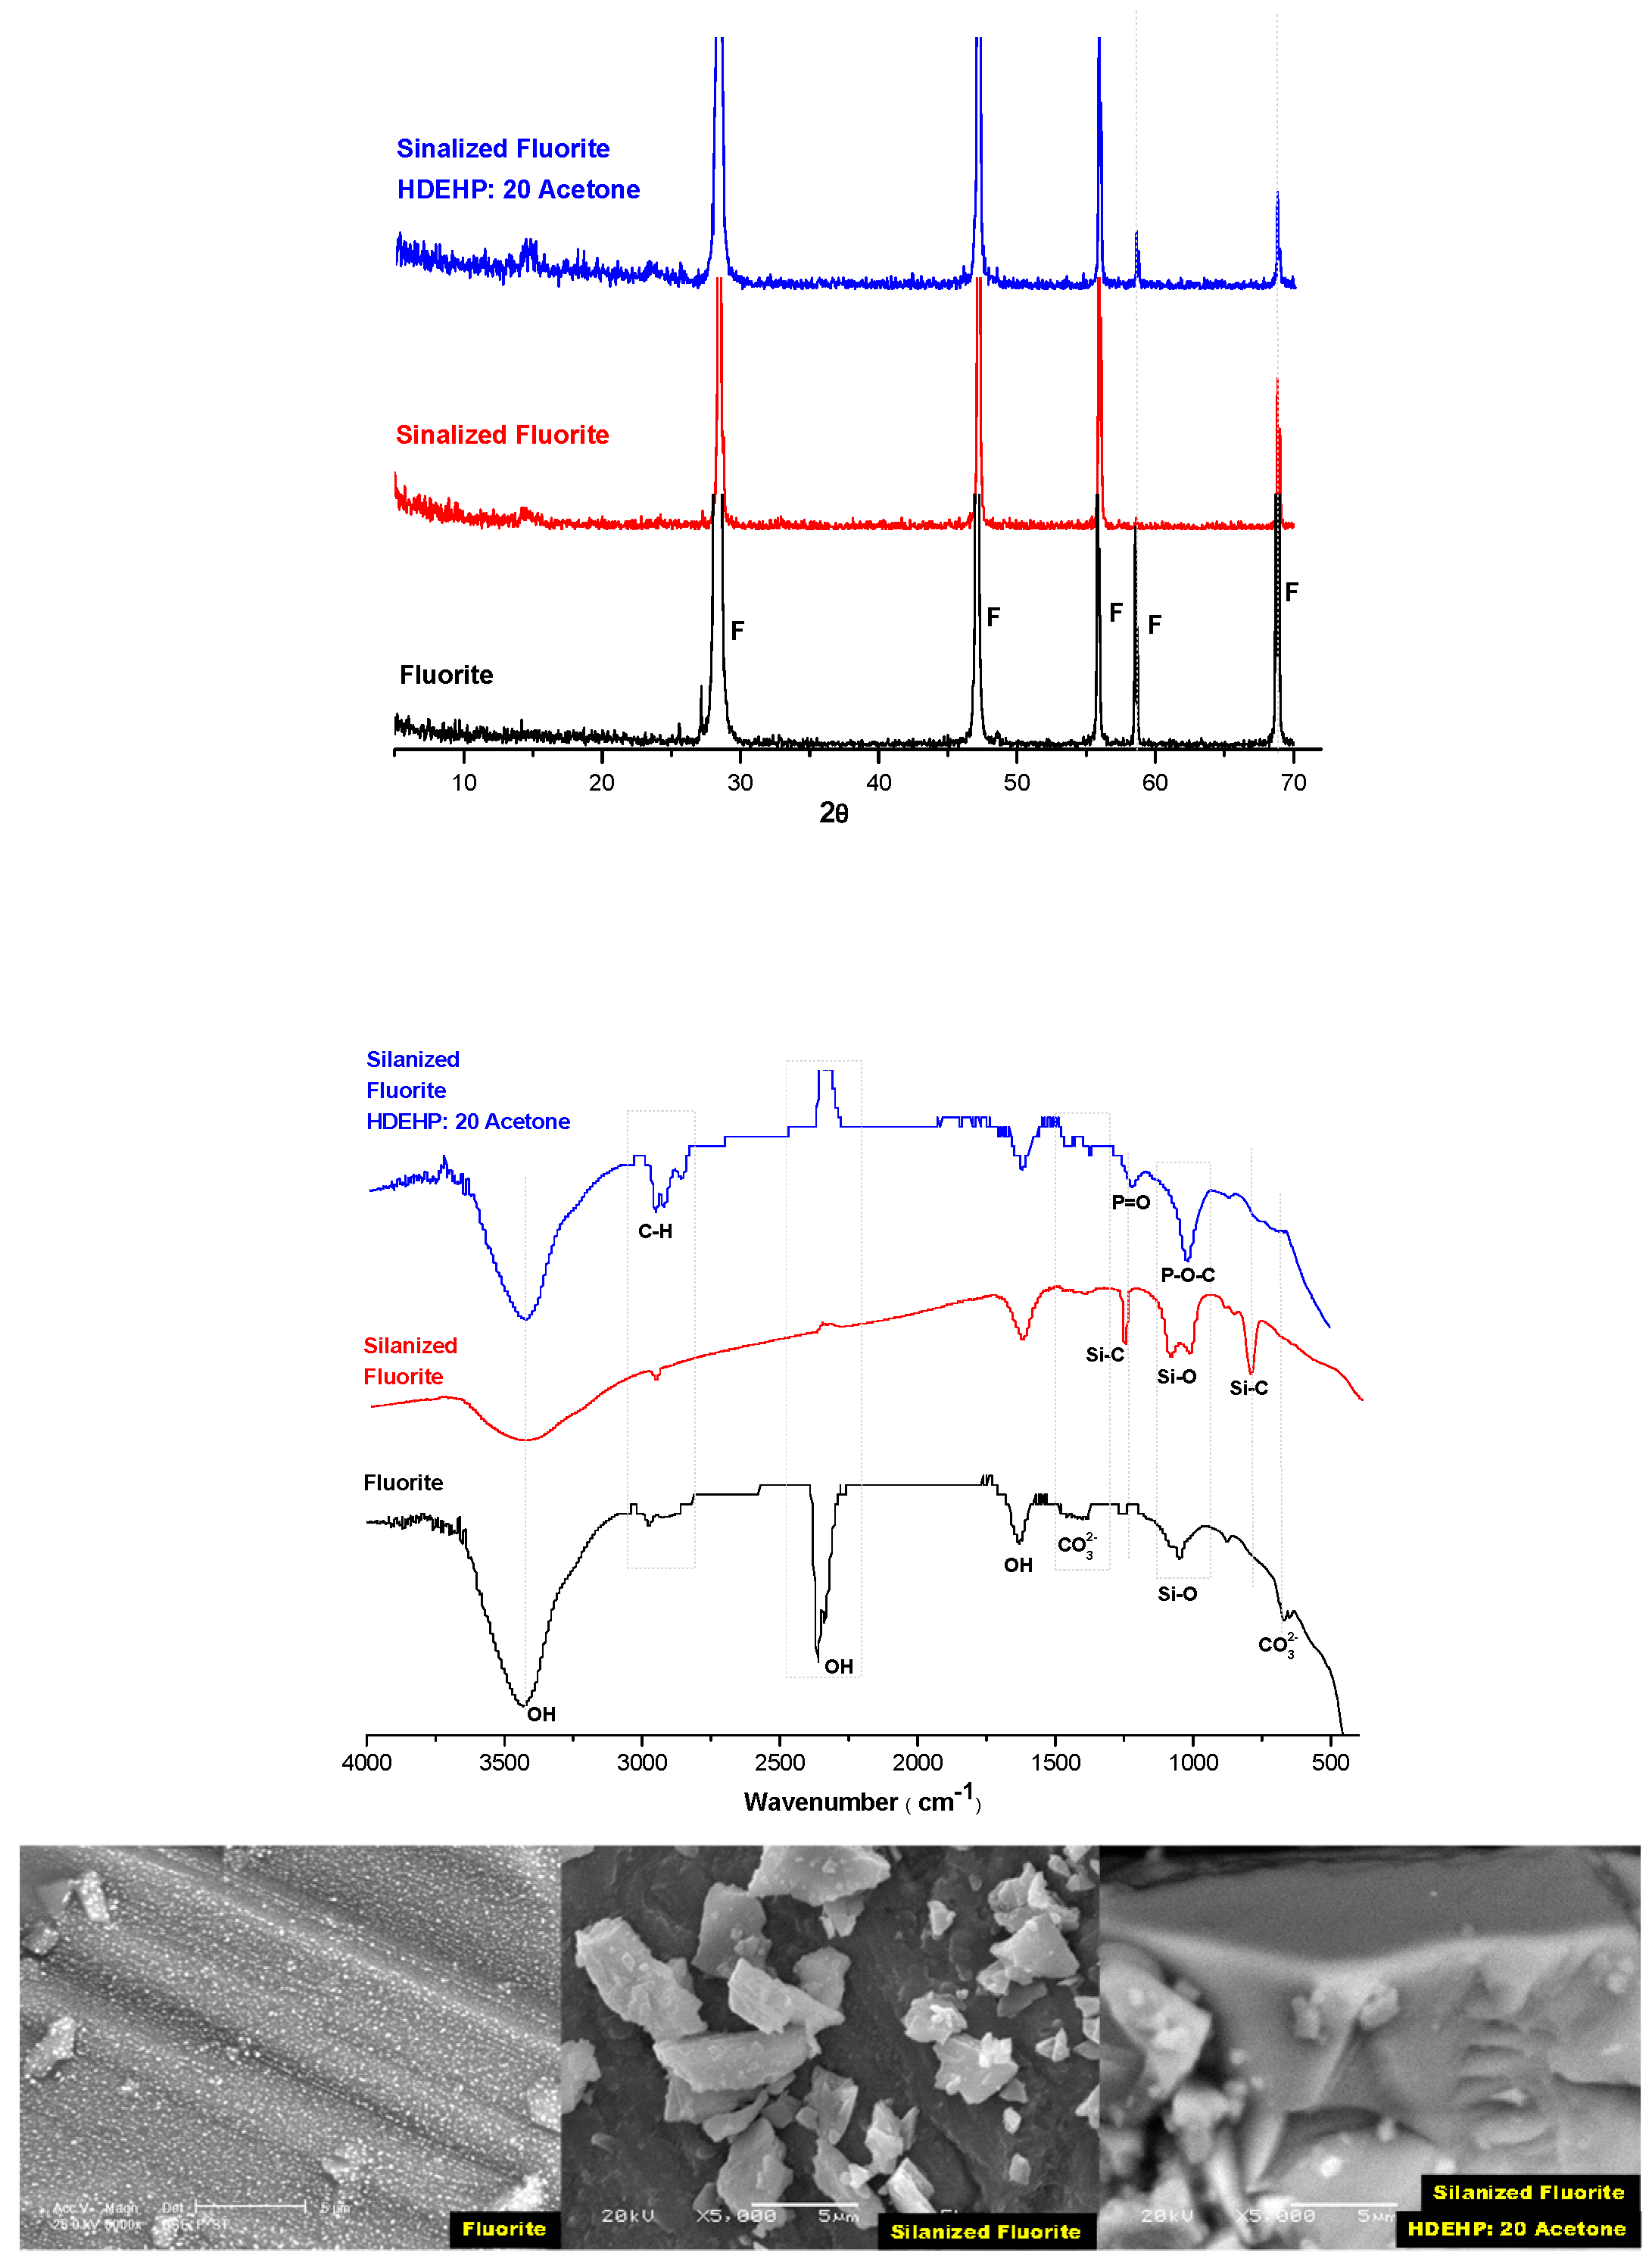
3.4. Solid Extractant Prepared with Fluorite

The solid extractant supported by fluorite presented the lowest Kds and separation resolution for Gd and Tb; therefore, the elution curves of both elements were practically together, as shown in Figure 14. This solid extractant did not retain these lanthanides. This was consistent with the low amounts of HDEHP contained in the support (0.010 g HDEHP/g fluorite) and the characterization results of the fluorite samples: virgin, silanized, and loaded with HDEHP (see Figure 15).
The XRD pattern of the fluorite (Figure 15) shows the characteristic XRD peaks of the CaF2 at 28, 47, 55, 58, and 68 2θ [42,43]. The XRD pattern of silanized fluorite also shows the characteristic peaks of fluorite, but the XRD peak at 58° 2θ disappeared and were from 3 to 8 times lower than that of pure fluorite, meaning there is a change in the structure of the fluorite by adding the DMCS. In the case of the solid extractant (silanized fluorite and loading with HDEHP), its XRD patterns were similar to that of virgin fluorite but with intensities on average 2 times lower. The intensity ratios between the most intense XRD peaks of fluorite (28° and 47° 2θ) varied from 12 in the virgin fluorite, to 4 in the silanized fluorite, and 6 in the solid extractant.
The infrared spectrum of the fluorite exhibited the characteristic bands 3432, 2362, 1634, 1430, 1044, and 884 cm−1 of CaF2, [42,43,44], two additional small bands at 1413 and 668 cm−1 associated with the asymmetric stretching and deformation vibrations of carbonate (CO32−) groups [45], and an intense band at 401 cm−1. The bands at 3432, 2360, and 1636 cm−1 were assigned to the stretching vibration absorption of –OH and bending vibration absorption of H2O, respectively. The silanized fluorite exhibited the following bands of very low intensity: 2962 cm−1 related to the asymmetric -CH3 stretching vibration band, 1267 cm−1 associated with the Si–C asymmetric stretching vibration of the Si–CH3 bond, 1110–1024 cm−1 attributed to Si–O asymmetric vibration of the Si–O–Si bond, and 805 cm−1 associated with the Si–C symmetric vibration (Si–CH3) [46], and the decrease of the intensities of the bands at 1633 and 3452 cm−1 due to the reduction of silanol groups [41]. The IR spectrum of solid extractant (silanized fluorite with HDEHP) displayed a multi-peak at 2979–2867 cm−1 attributed to Si–CH3 bond, and the characteristic bands at 1238 and 1030 cm−1 assigned to P–O and P–O–C groups, respectively, from HDEHP [6]. However, the elemental characterization of this solid extractor (see Table 3) did not contain P, indicative of the presence of HDEHP, and included Cl, associated with DMCS from the silanization process. The Ca percentage decreased slightly in silanized fluorite, which suggested that DMCS would bind to Ca, although a very low concentration, considering that the silanized fluorite with HDEHP practically did not extract Gd and Tb, given its low Kd and separation resolution values. The presence of Si and Al presumed the content of impurities in the fluorite, possibly alumino-silicates.
Fluorite has a compact, glass-like surface that contains small white-encrusted grains. The fluorite that was silanized and loaded with HDEHP did not have embedded grains, but particles of various sizes and shapes deposited on its surface. However, the microphotographs did not reveal any evidence of anchoring of DMCS in fluorite or HDEHP in silanized fluorite.
In conclusion, fluorite is silanized by DMCS, but its low content could be explained by the fact that DMCS does not find anchor sites in the structure of CaF2, where HDEHP can be additionally fixed. The presence of DMCS and HDEHP in the support could be associated with its fixation in Si and Al compounds, such as quartz or alumino-silicates present as impurities in fluorite.

4. Discussion

HDEHP is predominantly hydrophobic. Consequently, it is difficult to fix it on hydrophilic materials such as kieselguhr, volcanic rock (cantera, chiluca, tezontle), or alumina. Therefore, these materials must be made hydrophobic before loading of HDEHP and deactivating its adsorption and ion exchange properties, which can also reduce the extraction properties of HDEHP.
The density and homogeneity of the DMCS coating on the kieselguhr particles depend on the silanization method applied. Liquid treatment allows to coverage of a greater quantity of kieselguhr particles, apparently even by several DMCS films (Figure 3). However, the low permeability of the resulting silanized kieselguhr (viscous and sticky) obstructs the flow of the mobile phase and it is impossible to use on chromatography columns. In this case, the DMCS was diluted in heptane, and perhaps another solvent such as hexane could increase the permeability of the silanized kieselguhr. The silanization treatment with DMCS vapors produces materials coated with a thin layer of DMCS in some areas of the kieselguhr particles, as can be seen in the microphotographs of Figure 3.
This discontinuous DMCS coating on the support surface is probably caused by the irregular shape of the kieselguhr particles, which may limit the availability of sites where DMCS can attach to the kieselguhr (see Figure 16). This same effect can also limit the anchoring of HDEHP on DMCS and of the metal ion (Ln3+) on HDEHP. This heterogeneous distribution of the HDEHP into the supports causes anomalous diffusion effects in the chromatographic column, directly linked to the chromatographic resolution (theoretical plates). Thus, the elution curves and the chromatographic properties of the extractant solids prepared with kieselguhr using different concentrations of HDEHP (Figure 4 and Table 3) show differences, even when these solids have been loaded with the same amount of HDEHP.
Therefore, even when the HDEHP concentration increases during the preparation of the solid extractant, HDEHP will only be able to anchor to the hydrophobic surfaces. This factor limits the maximum concentration of extractant that can be loaded in the silanized support and, in consequence, the capacity of our extraction chromatography system. For this reason, the amounts of HDEHP loaded on to kieselguhr presented in Table 3 are similar to the solid extractants prepared with HDEHP:acetone between 1:4 and 1:30. Therefore, there is an optimal extractant concentration to use for the preparation of the solid extractants. This same concept can be applied to the rest of the studied supports (volcanic rocks, alumina, and fluorite), which also present irregular morphologies and as a result the silanization of their surfaces is limited to certain areas.
The characterization of the supports and the solid extractants (Figure 3, Figure 5, Figure 7, Figure 9, Figure 10, Figure 11, Figure 13 and Figure 15) shows the heterogeneous distribution of the HDEHP on the surfaces of the different supports studied. This is mainly the cause of the differences between the P concentrations listed in Table 4, linked to the presence of HDEHP loaded into the supports, obtained by EDAX analysis in areas of a few micrometers, and the amounts of HDEHP loaded to these supports reported in Table 3, carried out by gravimetry.
The surface area of the support has an important influence on the chromatographic capacity of the prepared extractant solid [31]. A greater surface area provides a greater surface where the extractant can be anchored and therefore a greater chromatographic capacity of the solid extractant. The surface areas of the supports used in this study (Table 3) show that alumina and fluorite have the highest and lowest surface area, separation resolution, and Kd values of Gd and Tb, respectively. However, the porosity of the support also influences the chromatographic separation parameters (Kd values, separation resolution, FWHM), because even when the pore surface provides more sites to interact with the silanization agent (i.e., the extractant and the analyte) the size of the pores can also limit access, first for DMCS, then for HDEHP, and finally for the lanthanide. Thus, cantera has a lower capacity and resolution chromatographic than kieselguhr, although its surface area is twice that of kieselguhr, because its total pore volume is less than that of kieselguhr (see Table 3).
Therefore, it is possible that DMCS can be anchored to the support, but not HDEHP, due to problems of access or pore size (steric effects), or both DCMS and HDEHP can be anchored, but not the analyte (Figure 16). Thus, the support capacity to fix the silanization and extractant agents and to retain the analyte will depend on its shape, specific area, porosity, pore size, and the accessibility of these pores. Additionally, the irregular particles of the support can reduce the packing density, which could decrease the reproducibility of the chromatographic process.
The evaluation of partition data from elution curves resulted in the separation coefficients for several species in one single operation. Different oxidation states or complexes of an element or contamination can be reveled in elution curves with more than one peak, and kinetically labile species by the distortion or tailing of the peak [3]. Thus, the tailing of the elution curves shown in Figure 4, Figure 6 and Figure 8 were mainly associated with the resistance to mass transfer of Gd and Tb from the solid extractant to the mobile phase in the chromatography column. This could be due to the irregularity of the size and shape of the support, the heterogeneous distribution of HDEHP, and to the intrinsic adsorption properties of each support.

5. Conclusions

This paper presents a systematic examination of Gd and Tb behavior on a series of extraction chromatography materials prepared with different supports silanized with DMCS and impregnated with HDEHP as an extractant agent. The change in the nature of the support produced a variation in the extraction capacity and in the chromatographic resolution of the solid extractant. The amount of HDEHP loaded and its distribution on support particles determines the chromatographic capacity. The irregular shape of the support particles produces discontinuous and heterogenous DMCS and HDEHP coatings on the support surface, allowing the active sites of the supports to interfere with the retention performance of the solid extractant and the chromatographic resolution. These factors are the reason for most of the observed differences in chromatographic performances (Kd, separation resolution, FWHM) of the solid extractant prepared in this study.
The specific surface area and the size and pore shape of the support also affects the extraction capacity of the prepared solid extractant. Supports with large surfaces retain a greater amount of HDEHP (extractant). However, the size and pore shape of the support play key roles in the performance of the silanization, HDEHP loading amount, and the resolution of the separation process. The accessibility to the area to be silanized, and subsequently loaded with HDEHP, is a determining factor in defining the performance of the extractive solid. If the DMCS or HDEHP cannot enter into the support pores, they can only be anchored on the support surface, inducing the broadening of the elution peaks.
DMCS vapor or liquid silanization methods do not lead to uniformly coated substrates. DMCS liquid treatment allows deposition of a greater amount of DMCS on the support but produces silanized supports with low permeability that are difficult to use in column chromatography. The use of DMCS vapor increases the reproducible of this technique and the amount of HDEHP anchored in these materials strongly depends on the silanized sites.
Future studies will be aimed to improve the silanization performance of the supports, a determinant procedure to increase the chromatographic capacity of solid extractants, paying special attention to the size and shape of the support particles and their pores, in order to also increase the resolution of the chromatographic process.

Author Contributions

F.M.-G.: Conceptualization, methodology, formal analysis, resources, data curation, writing—original draft preparation, writing—review and editing, supervision, project administration, funding acquisition. C.d.C.D.l.C.B.: Validation, formal analysis, investigation. E.J.S.: Validation, investigation. V.G.-F.: Validation. T.N.N.E.: Resources. All authors have read and agreed to the published version of the manuscript.

Funding

This research was funded by Consejo Nacional de Ciencia y Tecnología, grant number CONACYT-SALUD-2004-C01-001 and Instituto Nacional de Investigaciones Nucleares, grant number AS-186.

Acknowledgments

The authors are indebted to the technical staff of the nuclear reactor Triga Mark III, to the chemical nuclear laboratory for performing the surface areas analysis and to Juan Navarrete Bolaños for performing the IR analysis.

Conflicts of Interest

The authors declare no conflict of interest. The funders had no role in the design of the study; in the collection, analyses, or interpretation of data; in the writing of the manuscript, or in the decision to publish the results.

References

  1. Dietz, M.L.; Horwitz, E.P.; Bond, A.H. Extraction Chromatography: Progress and Opportunities; ACS Symposium Series Vol. 716, Symposium Proceedings: Progress in Metal Ion Separation and Preconcentration; American Chemical Society: Washington, DC, USA, 1999; pp. 234–250. [Google Scholar] [CrossRef]
  2. Horwitz, E.P.; McAlister, D.R. Extraction Chromatography Versus Solvent Extraction: How similar are they? Sep. Sci. Technol. 2006, 41, 2163–2182. [Google Scholar] [CrossRef]
  3. Braun, T.; Ghersini, G. (Eds.) Extraction Chromatrography; Journal of Chromatograpy Library-Volume 2; Elservier: Amsterdam, The Netherlands, 1975. [Google Scholar]
  4. Monroy-Guzman, F.; Jaime Salinas, E.; Jimenez Barreiro, F.; Vera Treviño, A.L. Radiolanthanides device production. World J. Nucl. Sci. Technol. 2015, 5, 111–119. [Google Scholar] [CrossRef] [Green Version]
  5. Alfred, G. (Ed.) Handbook of Rare Earth Elements: Analytics; Walter de Gruyter GmbH: Berlin, Germany, 2017. [Google Scholar]
  6. Shu, Q.; Khayambashi, A. Studies on adsorption of rare earth elements from nitric acid solution with macroporous silica-based bis(2-ethylhexyl)phosphoric acid impregnated polymeric adsorbent. Adsorpt. Sci. Technol. 2018, 1–17. [Google Scholar] [CrossRef] [Green Version]
  7. Lehto, J.; Hou, X. Chemistry and Analysis of Radionuclides; Wiley-VCH Verlag GmbH & Co. KGaA: Weinheim, Germany, 2011; ISBN 978-3-527-32658-7. [Google Scholar]
  8. Monroy-Guzman, F.; Jaime Salinas, E. Separation of micro-macrocomponent systems: 149Pm–Nd, 161Tb-Gd, 166Ho-Dy and 177Lu-Yb BY extraction chromatography. J. Mex. Chem. Soc. 2015, 59, 143–150. [Google Scholar] [CrossRef]
  9. Van de Voorde, M.; Van Hecke, K.; Cardinaels, T.; Binnemans, K. Radiochemical processing of nuclear-reactor-produced radiolanthanides for medical applications. Coord. Chem. Rev. 2019, 382, 103–125. [Google Scholar] [CrossRef]
  10. Kabay, N.; Cortina, J.L.; Trochimczuk, A.; Streat, M. Solvent-impregnated resins (SIRs)—Methods of preparation and their applications Reactive & Functional. Polymers 2010, 70, 484–496. [Google Scholar]
  11. Sochacka, R.J.; Siekierski, S. Reversed-phase partition chromatography with di-(2-ethylhexyl) orthophosphoric acid as the stationary phase: Part I. Separation of rare earths. J. Chromatogr. A 1964, 16, 376–384. [Google Scholar] [CrossRef]
  12. Yizhong, Q.; Weiming, S.; Nuping, P.; Qiaozhen, L. Quick separation and determination of Pm-147m~ in water by HDEHP-KeL-F chromatography. China Nuclear Sci. Technol. Rep. 1980, 0, 81. [Google Scholar]
  13. Larsen, N. High-pressure liquid chromatography of irradiated nuclear fuel: Separation of neodymium for burn-up determination. J. Radioanal. Nucl. Chem. 1979, 52, 85–91. [Google Scholar] [CrossRef]
  14. Klug, C.L. Preparation and Characterization of Extraction Chromatography Resins Using N-Donor Extractants for Trivalent Actinide and Lanthanide Separations. Ph.D. Theses, University of Nevada, Reno, NV, USA, 2010. [Google Scholar]
  15. Xizhen, Q.; Xianwen, R. Use of HDEHP-PVDF columns in extraction chromatography:Ⅰ.Principles of the sequential separation scheme for fission products analyses. Radialization Prot. 1981, 4, 28–32. [Google Scholar]
  16. Winchester, J.W. A Preliminary Investigación of a Chromatographic Column Separation of Rare Earths Using di(2-ethylhexyl)phosphoric Acid; Report X-822; Oak Ridge National Laboratory: Oak Ridge, TN, USA, 1958; pp. 1–7. [Google Scholar]
  17. Martin, D.B.; Pope, D.G. Separation of tervalent lanthanides from actinides by extraction chromatography. Anal. Chem. 1982, 54, 2552–2556. [Google Scholar] [CrossRef]
  18. Wei, Y.; Kumagai, M.; Takashima, Y.; Modolo, G.; Odoj, R. Studies on the separation of minor actinides from high-level wastes by extraction chromatography using novel solica-based extraction resins. Nucl. Technol. 2000, 132, 413–423. [Google Scholar] [CrossRef] [Green Version]
  19. McAlister, D.R.; Horwitz, E.P. Characterization of extraction of chromatographic materials containing bis(2-ethyl-1-hexyl)phosphoric acid, 2-etyhl-1-hexyl (2- ethyl-1-hexyl) phosphonic acid, and bis(2,4,4-trimethyl-1-pentyl) phosphinic acid. Solv. Extr. Ion Exch. 2007, 25, 757–769. [Google Scholar] [CrossRef]
  20. Zhang, W.; Yu, S.; Zhang, S.; Zhou, J.; Ning, S.; Wang, X.; Wei, Y. Separation of scandium from the other rare earth elements with a novel macro-porous silica-polymer based adsorbent HDEHP/SiO2-P. Hydrometallurgy 2019, 185, 117–124. [Google Scholar] [CrossRef]
  21. Sasaki, T.; Uchiyama, S.; Fujiwara, K.; Sugo, T.; Umeno, D.; Saito, K. Similarity of rare earth extraction by acidic extractant bis(2-ethylhexyl) phosphate (HDEHP) supported on a dodecylamino-group-containing graft chain and by HDEHP dissolved in dodecane. Kagaku Kogaku Ronbun. 2014, 40, 404–409. [Google Scholar] [CrossRef]
  22. Momen, M.A.; Dietz, M.L. High-capacity extraction chromatographic materials based on polysulfone microcapsules for the separation and preconcentration of lanthanides from aqueous solution. Talanta 2019, 197, 612–621. [Google Scholar] [CrossRef] [PubMed]
  23. Bertelsen, E.R.; Jackson, J.A.; Shafer, J.C. A Survey of Extraction Chromatographic f-Element Separations Developed by E. P. Horwitz. Solv. Extr. Ion Exch. 2020, 38, 251–289. [Google Scholar] [CrossRef]
  24. Cortina, J.L.; Miralles, N.; Aguilar, M.; Sastre, A.M. Solvent impregnated resins containing di(2-ethylhexyl)phosphoric acid II. Study of the distribution equilibria of Zn(II), Cu(II), and Cd(II). Solv. Extr. Ion Exch. 1994, 12, 371–391. [Google Scholar] [CrossRef]
  25. Horwitz, E.P.; Bloomquist, C.A.A. Chemical separations for super-heavy element searches in irradiated uranium targets. J. Inorg. Nucl. Chem. 1975, 37, 425–434. [Google Scholar] [CrossRef]
  26. Huang, C.H. Rare Earth Coordination Chemistry; Fundamentals and Applications; Wiley: Hoboken, NJ, USA, 2010. [Google Scholar]
  27. Lutynski, M.; Sakiewicz, P.; Lutynska, S. Characterization of Diatomaceous Earth and Halloysite Resources of Poland. Minerals 2019, 9, 670. [Google Scholar] [CrossRef] [Green Version]
  28. Hernández-Ortiz, M.; Hernández-Padrón, G.; Bernal, R.; Cruz-Vázquez, C.; Castaño, V.M. Nanocrystalline mimetic opals: Synthesis and comparative characterization vs. natural stones. Int. J. Basic Appl. Sci. 2015, 4, 238. [Google Scholar]
  29. Cefarelli, A.O.; Ferrario, M.E.; Almandoz, G.O.; Atencio, A.G.; Akselman, R.; Vernet, M. Diversity of the diatom genus Fragilariopsis in the Argentine Sea and Antarctic waters: Morphology, distribution and abundance. Polar Biol. 2010, 33, 1463–1484. [Google Scholar] [CrossRef] [Green Version]
  30. Correchera, V.; Garcia-Guinea, J.; Bustillo, M.A.; Garcia, R. Study of the thermoluminescence emission of a natural α-cristobalite. Radiat. Eff. Defect. S. 2009, 164, 59–67. [Google Scholar] [CrossRef]
  31. Emam, S.; Gasser, M.S.; El-Hefny, N.E.; Mahmoud, W.H.; Aly, H.F. Sorption of certain lanthanides by kieselguhr loaded with Cyanex 572 from sulfate medium. J. Rare Earth. 2020, 38, 299–305. [Google Scholar] [CrossRef]
  32. Wang, L.; Lu, A.; Xiao, Z.; Ma, J.; Li, Y. Modification of nano-fibriform silica by dimethyldichlorosilane. Appl. Surf. Sci. 2009, 255, 7542–7546. [Google Scholar] [CrossRef]
  33. Monroy-Guzman, F. Comportement a l’echelle des indicateurs des elements zirconium, hafnium, et l’element 104, niobium, tantale et protactinium (element 105) en milieux tres complexants. Ph.D. Thesis, University of Paris, Paris, France, 1997. [Google Scholar]
  34. Herter, A. Etude de l’influence de paramètres géométriques et cinétiques sur les courbes d’élution en chromatographie d’échange d’ions. In Rapport de fin de Cycle CES TNRP, CRN; Strasbourg, France, 1996. [Google Scholar]
  35. Hayes, R.; Ahmed, A.; Edge, T.; Zhang, H. Core-shell particles: Preparation, fundamentals and applications in high performance liquid chromatography. J. Chromatogr. A 2014, 1357, 36–52. [Google Scholar] [CrossRef] [Green Version]
  36. Al-Anber, M.A. Adsorption of ferric ions onto natural feldspar: Kinetic modeling and adsorption isotherm. Int. J. Environ. Sci. Technol. 2015, 12, 139–150. [Google Scholar] [CrossRef] [Green Version]
  37. Ritz, M.; Vaculíková, L.; Plevová, E.; Matýsek, D.; Mališ, J. Determination of chlorite, muscovite, albite and quartz in claystones and clay shales by infrared spectroscopy and partial least-squares regression. Acta Geodyn. Geomater. 2012, 9, 511–520. [Google Scholar]
  38. Jovanovski, G.; Makreski, P. Minerals from Macedonia. XXX. Complementary use of Vibrational Spectroscopy and X-Ray Powder Diffraction for spectra-structural study of some cyclo-, phyllo- and tectosilicate minerals. A Review. Maced. J. Chem. Chem. En. 2016, 35, 125–155. [Google Scholar] [CrossRef] [Green Version]
  39. Boal, D.; Ozin, G.A. Vibrational spectra, vibrational analysis and stereochemistries of the pentacoordinate molecules SiC13X - N(CH3)3 and SiC13X. N(CD3)3 where X = H, F, Br, or I. Can. J. Chem. 1973, 51, 609–617. [Google Scholar] [CrossRef]
  40. Romero Toledo, R.; Ruíz Santoyo, V.; Moncada Sánchez, D.; Martínez Rosales, M. Effect of aluminum precursor on physicochemical properties of Al2O3 by hydrolysis/precipitation method. Nova Sci. 2018, 10, 1–11. [Google Scholar] [CrossRef]
  41. Pakizeh, M.; Moghadam, A.N.; Omidkhah, M.R.; Namvar-Mahboub, M. Preparation and characterization of dimethyldichlorosilane modified SiO2/PSf nanocomposite membrane. Korean J. Chem. Eng. 2013, 30, 751–760. [Google Scholar] [CrossRef]
  42. Chen, Z.; Ren, Z.; Gao, H.; Zheng, R.; Jin, Y.; Niu, C. Flotation studies of fluorite and barite with sodium petroleum sulfonate and sodium hexam- etaphosphate. J. Mater. Res. Technol. 2018. [Google Scholar] [CrossRef]
  43. Huang, L.; Zeng, Q.; Hu, L.; Hu, Y.; Zhong, Z.; He, Z. The Contribution of Long-Terms Static Interactions Between Minerals and Flotation Reagents for the Separation of Fluorite and Calcite. Minerals 2019, 9, 699. [Google Scholar] [CrossRef] [Green Version]
  44. Sasmaz, A.; Kryuchenko, N.; Zhovinsky, E.; Suyarko, V.; Konakci, N.; Akgul, B. Major, trace and rare earth element (REE) geochemistry of different colored fluorites in the Bobrynets region, Ukraine. Ore. Geol. Rev. 2018, 102, 338–350. [Google Scholar] [CrossRef]
  45. Al Hameed, Z.; Saleem, J.; Hussain, S.S.; Ghani, A.A.; Lal, H. Study of indigenous fluorspar as metallurgical flux. J. Eng. Appl. Sci. 2017, 36, 1. [Google Scholar]
  46. Chrusciel, J.J.; Fejdys, M.; Fortuniak, W. Synthesis, Characterization and Microstructure of New Liquid Poly(methylhydrosiloxanes) Containing Branching Units SiO4/2. Polymers 2018, 10, 484. [Google Scholar] [CrossRef] [Green Version]
Figure 1. Effect of HNO3 concentration on the distribution coefficients of Gd and Tb in Ln SPS Eichrom resin [8,25].
Metals 10 01390 g001
Figure 2. Elution curves of Gd and Tb separation from Ln SPS resin using HNO3 and HCl as the mobile phases.
Metals 10 01390 g002aMetals 10 01390 g002b
Figure 3. X-ray diffraction patterns, infrared spectra, and morphology of kieselguhr and kieselguhr silanized with DMCS vapors and DMCS liquid.
Metals 10 01390 g003
Figure 4. Elution curves of Gd and Tb separation from HDEHP-impregnated kieselguhr silanized with DMCS vapors as a function of the [HDEHP] using HCl as the mobile phase.
Metals 10 01390 g004aMetals 10 01390 g004b
Figure 5. Morphology, X-ray diffraction patterns, and infrared spectra of HDEHP-impregnated kieselguhr silanized with DMCS vapors as a function of the [HDEHP].
Metals 10 01390 g005
Figure 6. Elution curves of Gd and Tb separation from HDEHP-impregnated kieselguhr silanized with DMCS vapors and DMCS liquid using HCl as the mobile phase.
Metals 10 01390 g006
Figure 7. X-ray diffraction patterns, infrared spectra, and morphology of HDEHP (1:30)-impregnated kieselguhr silanized with DMCS vapors (KSV) and DMCS liquid (KSL).
Metals 10 01390 g007
Figure 8. Elution curves of Gd and Tb separation from HDEHP (1:20)-impregnated volcanic rocks silanized with DMCS vapors using HCl as the mobile phase.
Metals 10 01390 g008
Figure 9. X-ray diffraction patterns, infrared spectra, and morphology of cantera, silanized cantera with DMCS vapors, and HDEHP (1:20)-impregnated cantera.
Metals 10 01390 g009
Figure 10. X-ray diffraction patterns, infrared spectra, and morphology of chiluca, silanized chiluca with DMCS vapors, and HDEHP (1:20)-impregnated chiluca.
Metals 10 01390 g010
Figure 11. X-ray diffraction patterns, infrared spectra, and morphology of tezontle, silanized tezontle with DMCS vapors, and HDEHP (1:20)-impregnated tezontle.
Metals 10 01390 g011aMetals 10 01390 g011b
Figure 12. Elution curves of Gd and Tb separation from HDEHP (1:20)-impregnated alumina silanized with DMCS vapors using HCl as the mobile phase.
Metals 10 01390 g012
Figure 13. X-ray diffraction patterns, infrared spectra, and morphology of alumina, silanized alumina with DMCS vapors, and HDEHP (1:20)-impregnated alumina.
Metals 10 01390 g013
Figure 14. Elution curves of Gd and Tb separation from HDEHP (1:20)-impregnated fluorite silanized with DMCS vapors using HCl as the mobile phase.
Metals 10 01390 g014
Figure 15. X-ray diffraction patterns, infrared spectra, and morphology of fluorite, silanized fluorite with DMCS vapors, and HDEHP (1:20)-impregnated fluorite.
Metals 10 01390 g015
Figure 16. Mechanisms of hydrophobization, silanization, and loading of HDEHP on to supports.
Metals 10 01390 g016
Table 1. Preparation conditions of solid extractants.
Support Silanization Method Loading of HDEHP
Technique
HDEHP/Acetone
KieselguhrDMCS solutionEvaporation1:4
Kieselguhr DMCS solution Evaporation 1:8
Kieselguhr DMCS solution Evaporation 1:15
Kieselguhr DMCS solution Evaporation 1:20
Kieselguhr DMCS solution Evaporation 1:30
Kieselguhr DMCS vapors Packed column 1:4
Kieselguhr DMCS vapors Packed column 1:8
Kieselguhr DMCS vapors Packed column 1:15
Kieselguhr DMCS vapors Packed column 1:20
Kieselguhr DMCS vapors Packed column 1:30
Kieselguhr DMCS vapors Packed column 1:40
Alumina DMCS vapors Packed column 1:20
Fluorite DMCS vapors Packed column 1:20
Tezontle DMCS vapors Packed column 1:20
Cantera DMCS vapors Packed column 1:20
Chiluca DMCS vapors Packed column 1:20
Table 2. Nuclear reactions of the gadolinium target irradiation [8].
TargetNuclear Reaction
152Gd 0.2%152Gd(n, γ)153Gd(241.6 d)→ 153Eu (stable)
154Gd 2.18%154Gd(n, γ) 155Gd(stable)
155Gd 14.8%155Gd(n, γ) 156Gd(stable)
156Gd 20.47%156Gd(n, γ) 157Gd(stable)
157Gd 15.6%157Gd(n, γ) 158Gd(stable)
158Gd 24.84%158Gd(n, γ) 159Gd(18.6 h) → 149Tb(stable)
160Gd 21.86% 160Gd(n, γ)161Gd(3.7 min) → 161Tb*(17.6 h) → 161Dy (stable)
Table 3. Distribution coefficients, separation resolution, and FWHM for Gd and Tb on solid extractants prepared with HDEHP on different supports.
Solid Extractantg HDEHP/
g Support
KdGd
HCl
(0.8 mol/L)
KdTb
HCl
(3 mol/L)
Separation ResolutionFWHM
Gd
(mL)
FWHM
Tb
(mL)
Surface Area (m2/g)Total Pore Volume (cm3/g)
Kieselguhr/DMCS vapor/
HDEHP: 4 Acetone
0.1016 ± 0.00368.5 ± 1.32.8 ± 0.70.59 ± 0.028.78 ± 0.361.65 ± 0.062.8064 ± 0.02810.6445 ± 0.019
Kieselguhr/DMCS vapor/
HDEHP: 8 Acetone
0.1045 ± 0.00375.9 ± 1.41.5 ± 0.41.02 ± 0.037.82 ± 0.641.78 ± 0.072.8064 ± 0.02810.6445 ± 0.019
Kieselguhr/DMCS vapor/
HDEHP: 15 Acetone
0.1138 ± 0.00403.2 ± 0.91.8 ± 0.60.77 ± 0.024.65 ± 0.151.87(9.6) ± 0.142.8064 ± 0.02810.6445 ± 0.019
Kieselguhr/DMCS vapor/
HDEHP: 20 Acetone
0.1051 ± 0.00374.0 ± 0.81.3 ± 0.41.23 ± 0.044.64 ± 0.171.44 ± 0.042.8064 ± 0.02810.6445 ± 0.019
Kieselguhr/DMCS vapor/
HDEHP: 30 Acetone
0.1070 ± 0.00384.8 ± 0.94.8 ± 1.21.2 ± 0.044.84 ± 0.261.7 ± 0.392.8064 ± 0.02810.6445 ± 0.019
Kieselguhr/DMCS vapor/HDEHP: 40 Acetone0.0474 ± 0.00173.4 ± 1.05.7 1 ± 1.60.29 ± 0.013.65 ± 0.385.2 ± 0.322.8064 ± 0.02810.6445 ± 0.019
Kieselguhr/DMCS liquid/HDEHP: 30 Acetone0.0888 ± 0.00319.9 2 ± 1.72.7 3 ± 0.90.92 ± 0.0310.99 ± 0.653.12 ± 0.172.8064 ± 0.02810.6445 ± 0.019
Ln SPS eluted with HCl6.7 ± 1.92.2 ± 0.80.98 ± 0.035.39 ± 0.220.64 ± 0.08
Ln SPS eluted with HNO314.3 ± 2.28.0 ± 2.21.58 ± 0.053.29 ± 0.192.23 ± 0.12-–
Alumina/DMCS vapor/
HDEHP: 20 Acetone
0.0711 ± 0.002514 ± 2.113 ± 2.93.15 ± 0.10.59 ± 0.060.69 ± 0.04193.1729 ± 1.93270.8864 ± 0.0227
Chiluca/DMCS vapor/
HDEHP: 20 Acetone
0.0100 ± 0.00044.9 ± 1.17.4 1 ± 1.50.27 ± 0.012.94 ± 0.185.90 ± 0.232.1730 ± 0.02170.0025 ± 0.00012
Cantera/DMCS vapor/
HDEHP: 20Acetone
0.0273 ± 0.0017.9 ± 1.412.3 1 ± 2.50.31 ± 0.012.15 ± 0.327.6 ± 1.395.8283 ± 0.05830.0650 ± 0.0026
Tezontle/DMCS vapor/
HDEHP: 20Acetone
0.0193 ± 0.00072.8 ± 0.73.2 1 ± 1.20.03 ± 0.0033.35 ± 0.293.79 ± 0.361.7738 ± 0.01770.0036 ± 0.00012
Fluorite/DMCS vapor/
HDEHP: 20Acetone
0.0102 ± 0.00041.6 ± 0.61.7 1 ± 0.60.03 ± 0.0030.98 ± 0.061.02 ± 0.190.0204 ± 0.00020.0002 ± 0.00001
1 in 0.8 M HCl, 2 in 0.8 M HNO3 3 in 3M HNO3.
Table 4. Elemental analysis of supports pure silanized and loaded with HDEDHP (solid extractants) by EDXA.
Kieselgurhr (K) HDEHP:Acetone Cantera
(CA)
Chiluca
(CH)
Tezontle
(TE)
Al2O3
(AL)
CaF2
(FL)
ElementKDMCS
Vapour
(KSV)
KSV
1:4
KSV
1:8
KSV
1:15
KSV
1:20
KSV
1:30
KSV
1:40
DMCS
Liquid
(KSL)
KSL
1:30
CADMCS
Vapour
(CAS)
CAS
1:20
CHDMCS
Vapour
(CHS)
CHS
1:20
TEDMCS
Vapour
(TES)
TES
1:20
ALDMCS
Vapour
(TES)
1:20FLDMCS
Vapour
(FL)
1:20
Si31.1 ± 0.3434.85 ± 0.4631.26 ± 0.2832.81 ± 0.3540.25 ± 0.3831.32 ± 0.3630.13 ± 0.3143.31 ± 0.4136.03 ± 0.4424.27 ± 0.2930.23 ± 0.2932.57 ± 0.3128.53 ± 0.2624.45 ± 0.2723.95 ± 0.2520.52 ± 0.2121.98 ± 0.2123.94 ± 0.2321.74 ± 0.20 3.13 ± 0.093.10 ± 0.083.02 ± 0.07
C22.1 ± 0.6222.89 ± 0.7925.30 ± 0.5124.10± 0.6114.04 ± 0.6125.86 ± 0.6925.90 ± 0.6212.80 ± 0.6216.41 ± 00.7734.88 ± 0.5912.35 ± 0.5611.22 ± 0.6119.08 ± 0.5422.50 ± 0.6222.85 ± 0.6320.07 ± 0.568.51 ± 0.087.97 ± 0.096.75 ± 0.0917.53 ± 0.3415.45 ± 0.3839.37 ± 0.437.62 ± 0.267.57 ± 0.257.51 ± 0.22
O42.8 ± 0.4939.15 ± 0.6036.43 ± 0.3937.35 ± 0.4740.86 ± 0.4438.19 ± 0.5039.73 ± 0.4640.11 ± 0.4444.15 ± 0.5735.75 ± 0.5240.38 ± 0.4242.53 ± 0.4339.70 ± 0.4139.76 ± 0.4141.57 ± 0.4740.87 ± 0.4451.24 ± 0.4149.53 ± 0.4649.09 ± 0.4243.31 ± 0.4541.94 ± 0.4732.85 ± 0.53.51 ± 0.883.48 ± 0.873.25 ± 0.84
P 2.52 ± 0.092.36 ± 0.111.19 ± 0.091.25 ± 0.081.07 ± 0.07 3.16 ± 0.11 0.69 ± 0.06 0.2 ± 0.04 2.90 ± 0.1
Na0.82 ± 0.070.58 ± 0.080.60 ± 0.050.69 ± 0.070.68 ± 0.070.56 ± 0.060.58 ± 0.050.69 ± 0.070.79 ± 0.090.45 ± 0.071.54 ± 0.071.82 ± 0.081.60 ± 0.072.67 ± 0.082.28 ± 0.072.57 ± 0.071.88 ± 0.062.12 ± 0.071.72 ± 0.07
Al0.63 ± 0.060.65 ± 0.080.57 ± 0.050.50 ± 0.060.65 ± 0.060.54 ± 0.050.47 ± 0.050.69 ± 0.060.66 ± 0.080.48 ± 0.0610.90 ± 0.136.44 ± 0.15.54 ± 0.086.98 ± 0.125.56 ± 0.095.73 ± 0.086.49 ± 0.067.58 ± 0.076.75 ± 0.0939.16 ± 0.5338.84 ± 0.4522.99 ± 0.511.91 ± 0.071.90 ± 0.071.88 ± 0.07
S0.44 ± 0.060.37 ± 0.070.82 ± 0.050.38 ± 0.060.49 ± 0.060.33 ± 0.050.4 ± 0.040.46 ± 0.060.31 ± 0.070.12 ± 0.05
K 3.65 ± 0.084.04 ± 0.083.59 ± 0.071.51 ± 0.042.16 ± 0.061.20 ± 0.040.91 ± 0.071.12 ± 0.071.18 ± 0.07
Ca0.82 ± 0.070.61 ± 0.081.71 ± 0.060.82 ± 0.070.88 ± 0.070.72 ± 0.060.68 ± 0.050.82 ± 0.070.75 ± 0.080.28 ± 0.060.27 ± 0.040.42 ± 0.050.35 ± 0.041.41 ± 0.040.76 ± 0.041.36±0.042.22 ± 0.073.31 ± 0.074.36 ± 0.06 41.28 ± 0.5140.98 ± 0.4741.19 ± 0.5
Fe0.86 ± 0.130.90 ± 0.160.78 ± 0.100.98 ± 0.130.97 ± 0.121.11 ± 0.120.92 ± 0.11.11 ± 0.130.89 ± 0.150.60 ± 0.120.67 ± 0.060.84 ± 0.080.66 ± 0.060.40 ± 0.060.65 ± 0.060.37±0.054.33 ± 0.072.29 ± 0.065.12 ± 0.07
Ti 0.12 ± 0.060.12 ± 0.05 0.31 ± 0.060.22 ± 0.040.1±0.030.54 ± 0.040.42 ± 0.030.48 ± 0.03
Cl 0.14 ± 0.040.26 ± 0.04 0.63 ± 0.051.02 ± 0.05 3.76 ± 0.071.88 ± 0.04 0.71 ± 0.050.55 ± 0.04
F 42.56 ± 0.5442.26 ± 0.5342.6 ± 0.54
Mg 1.94 ± 0.061.52 ± 0.071.77 ± 0.06
Publisher’s Note: MDPI stays neutral with regard to jurisdictional claims in published maps and institutional affiliations.

