
Transfer of Early-Stage Lithium Recovery from Laboratory-Scale Water Leaching to Upscale Challenges


IME Process Metallurgy and Metal Recycling, Institute of RWTH Aachen University, Intzestr. 3, 52056 Aachen, Germany
*
Author to whom correspondence should be addressed.
Metals 2024, 14(1), 67; https://doi.org/10.3390/met14010067
Submission received: 8 December 2023
/
Revised: 27 December 2023
/
Accepted: 4 January 2024
/
Published: 6 January 2024
(This article belongs to the Special Issue New Science Based Concepts for Increased Efficiency in Battery Recycling 2023)
Abstract
:The early-stage lithium recovery (ESLR) process associates thermal treatment of the black mass from lithium-ion batteries (LIB) with subsequent leaching, especially with water, targeting Li recovery in the first step of the process chain as lithium carbonate. The validation of ESLR has resulted in high Li efficiencies; however, currently, researchers have not yet been established the optimum parameters, which brings uncertainties to a further upscale. Based on that, four parameters, including different black masses previously thermally treated in the industry, were investigated in a leaching step in laboratory scale targeting Li and F leaching efficiencies. Through ANOVA statistical analysis, regression equations of the leaching efficiencies for both elements were generated, which supports an optimization study. The optimum parameters were then transferred to an upscale 100 L leaching trial and evaluated. The results in laboratory scale showed that Li maximization and F minimization were achieved at an S/L ratio of 30 g/L, 80 °C, and 6 L/min of CO2 gas addition, as well as with a sample of bigger particle size and probably more efficient thermal treatment. However, the upscale result with the same parameters showed a lower Li leaching efficiency, which is related to the poor geometric similarity between laboratory and upscale reactors.
1. Introduction
The combination of pyro- and hydrometallurgical routes stands out as beneficial for the lithium recovery from lithium-ion batteries (LIB) in most of the cases. Firstly, pyrometallurgical pyrolysis or incineration of the cathode, anode, and electrolyte can degrade the organic fraction (electrolytes, binders, and separators) through thermal treatment at temperatures up to 600 °C. The undesirable PVDF (polyvinylidene fluoride), for example, is decomposed, which makes the removal through the off-gases easy. In addition, the carbothermic reactions that occur among the elements present in the black mass (BM) can be guided towards the generation of Li compounds that might be more suitable for hydrometallurgical treatment [1,2]. Secondly, the hydrometallurgical leaching via the following step might provide higher recovery efficiencies than a solely pyrometallurgical smelting process. The formation of Li-aluminate, for example, in the slag phase demands further treatment. Moreover, a fraction is generally lost in the off-gases due to high temperatures [3,4].
The final compound targeted in most Li recovery routes is lithium carbonate (Li2CO3), which is the precursor in LIB. It has been proven that this compound can be obtained through different hydrometallurgical steps after proper thermal treatment. For example, in- and organic acid leaching combined with sodium carbonate (Na2CO3) as the precipitating agent achieved > 98% Li recovery in the form of carbonate [5,6]. However, strong acids also usually leach the other battery metals, such as Ni, Co, Mn, and Al. In both these cases, Li was recovered in the last step, which may increase contamination by precipitating agents or losses during previous metals’ precipitation.
With this in mind, one of the established routes that focuses on recovering Li as the first and—ideally—unique element in the liquor phase after a leaching step is so-called early-stage lithium recovery (ESLR). The other battery metals such as Ni, Co, Mn, and Al, as well as the graphite, remain in the residue fraction [7]. Normally, this strategy is carried out after thermal treatment and with water or carbonated water as leaching agent, in which the Li2CO3 can be achieved as the final product through evaporation, i.e., taking advantage of the solubility property of the salt, without the addition of other chemicals. It is expected that the aforesaid strategy makes it easier to refine the targeted product.
Since water is not a strong leaching agent, the optimized combination between the thermal treatment factors and leaching factors might provide the highest Li recoveries. On the side of the thermal treatment, the atmosphere, time, and initial BM content are the most relevant factors; meanwhile, for water leaching, the solid/liquid ratio and temperature of the leaching are more relevant. The kinetics of Li2CO3 dissolution in water is fast, which makes time an irrelevant factor [1,8].
A few studies have already provided results regarding the combination of pyro- and hydrometallurgical processes with water leaching. With NMC active material (cathode + anode without Al or Cu foils) after two different thermal treatments at 500 °C and 750 °C, 1 h and air atmosphere, water leaching with the factors adjusted at 50 g/L, 80 °C, and 2 h was performed, in which the results showed Li efficiency recovery of 39.7% and 60.1%, respectively [9]. Cathode material (LiNixCoyMnzO2) + 5% anode material (graphite) was thermally treated at optimum factors at 650 °C, 1 h, and argon atmosphere, and then the mixture was leached with water at 25 °C, 2 h, and S/L of 33.3 g/L to achieve a maximum leaching efficiency of 82.2% [10]. Cathode material from NMC batteries was treated thermally with 10% coke added at 650 °C for 30 min under argon atmosphere and then leached with water for 1 h at room temperature with a S/L ratio of 33.3 g/L, resulting in 93.7% Li recovery [11]. A powder simulating the content of real LCO batteries was mixed with graphite and treated thermally at 600 °C, 1 h, and argon, with further water leaching at room temperature for 1 h and 10 g/L, resulting in 98.3% Li recovery [12]. The combination of 500 °C of thermal treatment under air + H2 for 15 min with water leaching in 50 g/L, 30 °C, and 30 min resulted in 97% Li recovery from NMC cathode materials of batteries [8]. These studies and others [13,14,15] point out the high Li recovery efficiencies obtained when combined methods are used, while showing different parameters’ settings.
From academic research to upscaled LIB recycling processes, the target continues to focus on the optimization of parameters that leads to a higher Li recovery rate, which in the end translates to economic feasibility. However, the challenge is to produce marketable products, such as Li2CO3, that must generate profit while the environmental regulations are matched [16]. A few companies in Europe have already upscaled battery recycling processes. For example, Umicore in Belgium, Accurec and Duesenfeld in Germany, Recupyl in France, and AkkuSer in Finland show different technologies and process steps; however, they are focused on valuable metals like Ni, Mn, and Co rather than Li recovery [17,18].
Based on that, the aim of this work is to firstly optimize Li and F leaching efficiencies with water in laboratory scale in relation to S/L ratio, temperature, CO2 gas addition, and sample type. Secondly, with the optimized set of parameters, we carry out the transition from laboratory scale to upscale in the leaching process using water, focusing on Li recovery efficiency and F impurity levels.
2. Materials and Methods
Two different batches of black mass originating in the same industry were used in this work: Sample A and Sample B, which went through thermal treatments under unknown conditions. Additionally, Sample A was crushed and sieved to a particle size < 63 µm, and Sample B was just sieved to a particle size < 1000 µm. The composition of each sample was obtained through ICP OES (Agilent SVDS 5900, Agilent Technologies, Santa Clara, USA), where the samples were digested in microwave (Multiwave, Anton Paar, Graz, Austria) according to the method DIN EN 13657, Carbon Analyzer via the combustion method (Eltra CS 2000, ELTRA GmbH, Kleve, Germany), and Fluorine analysis via Combustion Ion Chromatography—CIC (AQF-2100, A1-Envirosciences, Düsseldorf, Germany); meanwhile, an XRD analysis (MiniFlex, 40 kC, Cu-tube, Rigaku, Tokyo, Japan) was performed to investigate the components of these black masses as input material and residue. The phases were detected using the HighScore Plus 4.9 (Malvern Panalytical B.V., Almelo, The Netherlands) Software.
2.1. Laboratory-Scale Leaching
A doubled-walled 2 L glass reactor was used in the laboratory-scale trials, connected to a thermostat bath (Huber CC-304B, Kältemaschconinenbau AG, Offenburg, Germany) to provide the heat according to the temperature of each experiment. The reactor was sealed by a three-neck glass lid for temperature and pH sensors (InPro 3100/225/PT100, Mettler Toledo, Gießen, Germany), CO2 gas injection (ø5 mm lance), and a stirring impeller. The setup scheme is shown in Figure 1a.
Deionized water (DI) was used as the leaching agent for black mass following a 2k design of experiments (DoE) by Minitab® 21.0 (Minitab Inc., State College, PA, USA), in which the parameters were four (k = 4) in two levels, according to Table 1: black mass batch, CO2 gas flow injected into water, temperature of leaching trials, and S/L ratio. In total, 16 trials were carried out. The constant parameters were a leaching time of 60 min and stirring rate of 350 rpm, according to previous observations and literature reviews mentioned in the Introduction section. After each trial, the solution was filtered, resulting in two streams: filter cake and leach liquor. The filter cake was dried for 24 h and weighed, while the metallic content of the leach liquor was analyzed quantitatively via ICP OES (Agilent SVDS 5900).
The leaching efficiency (LE, in %) was calculated according to the equation below:
where ci is the measured concentration of the element i (mg/L) in solution after leaching, V is final solution volume (L), mBM is the input mass of the black mass (mg), and ωi is the content (in %) of the element i in input black mass.
Subsequently, to check the reliability of the regression model generated, more laboratory-scale trials were performed with the same parameters but in different levels according to a process optimization method, which is detailed in the results section.
2.2. Upscale Leaching
A duplicate water leaching trial was upscaled to a 100 L volume reaction, in which the parameters were established according to the optimized results of the laboratory trials, based on the Li and F leaching efficiencies regression equation. The agitation rate was established in 150 rpm, and the trial time was 60 min. After the trials, the solution was filtered, the final liquor was analyzed through ICP OES to provide the metals concentration, and the filter cake residue was analyzed through XRD. The same equation mentioned above was used to calculate the leaching efficiencies. The setup scheme is shown in Figure 1b.
3. Results
The characterization of Sample A and B first provided the chemical content, which is observed in Table 2. It indicates lower graphite content in Sample B, as well as higher contents of Li, Ni, Co, and Mn. In addition, the content revealed that these samples are probably black masses from battery type NMC 111 due to the similarity in the values for Ni, Mn, and Co in each sample. Secondly, in the XRD analysis in Figure 2a,b, it is shown that both samples mostly contain the same compounds, e.g., C, Ni, and MnO. However, there is an absence of LiNixCoyMnzO2 peaks in Sample B and the presence of Li2CO3 peaks.
The leaching efficiencies (LE) of both Li and F were evaluated statistically as a response to the parameter’s variation according to the ANOVA methodology in Minitab® 21.0. The analysis of variance (ANOVA) is a statistical method used to numerically evaluate the quality of the regression model. It is based on the decomposition of the deviations of means and the concepts of degrees of freedom and error. It is probably the most useful technique in the field of statistical inference [19]. This type of analysis generates interactions of the first, second, third, and fourth order due to the number of parameters (k = 4). However, in this investigation, the authors opted for the exclusion of the third and fourth orders to facilitate the analysis’ evaluation. This manipulation only increased the error of the regression equations by 2.03% and 2.07%, respectively, for Li and F, which was considered a safe assumption. Therefore, for each metal leaching efficiency, a regression equation was given based on the first- and second-order interactions.
3.1. Laboratory-Scale Water Leaching Efficiency—Lithium
The ANOVA analysis for Li showed that only the first-order parameters S/L ratio and sample type were significant (p-value < 0.05). It means that the change in levels within the parameter did not affect the leaching efficiency greatly for temperature and CO2 gas addition.
The regression equation (Equation (2)) showed a R² = 97.96%, which demonstrated a satisfactory adjustment of the experimental data. Based on this equation, it was possible to build color maps (Figure 3a–d) in which the x- and y-axis vary between the low and high levels of parameters’ S/L ratios and CO2 gas flows, respectively. In red, we display the highest Li leaching efficiencies, and in blue, we display the lowest. It is important to mention that since the sample type is not a quantifiable measurement (categorical parameter), for the purpose of the regression equation through the ANOVA method, values of −1 and +1 for samples A and B, respectively, are attributed to this parameter.
Firstly, it was observed that the biggest gap in Li leaching efficiency overall is in Sample A at 80 °C (Figure 3b): from close to 42% at S/L ratio of 70 g/L and no CO2 gas flow (dark blue) to circa 81% at S/L ratio of 10 g/L and 6 L/min of CO2 gas flow (red). At 20 °C, both samples (Figure 3a,c) presented a lower leaching efficiency gap between extremes: from 46% to 72%. On average, regardless of other parameters’ levels’ changes, the increase in S/L ratio from 10 g/L to 70 g/L had a decreasing effect on the Li leaching efficiency of 25%, which is an indication of a significant parameter for the evaluated system. For the opposite tendency, on average, only a 5% increase happens when individually increasing the value of the CO2 gas addition (0 to 6 L/min), temperature (20 °C to 80 °C), or sample (A to B). However, the analysis of variance of the data states that the sample type parameter is also significant due to a slightly higher average difference in leaching efficiency. This situation can be observed deeply when comparing both samples A and B. The difference in color grade is less intense in Sample B than in Sample A. It is also interesting to note that in Sample B, independently of the amount of CO2 gas addition, the change in leaching efficiency is lower than 5%. This is not the case for Sample A, where the change reaches 11%. The reason for this might be the thermal treatment, where the compounds are formed prior to the leaching process.
3.2. Laboratory-Scale Water Leaching Efficiency—Fluorine
The same statistical analysis was used for fluorine, in which the ANOVA analysis showed that not only the first order parameter S/L ratio and sample were significant (p-value < 0.05) but also the CO2 gas addition. It means that the change in levels within the parameter did not affect the leaching efficiency greatly only for temperature.
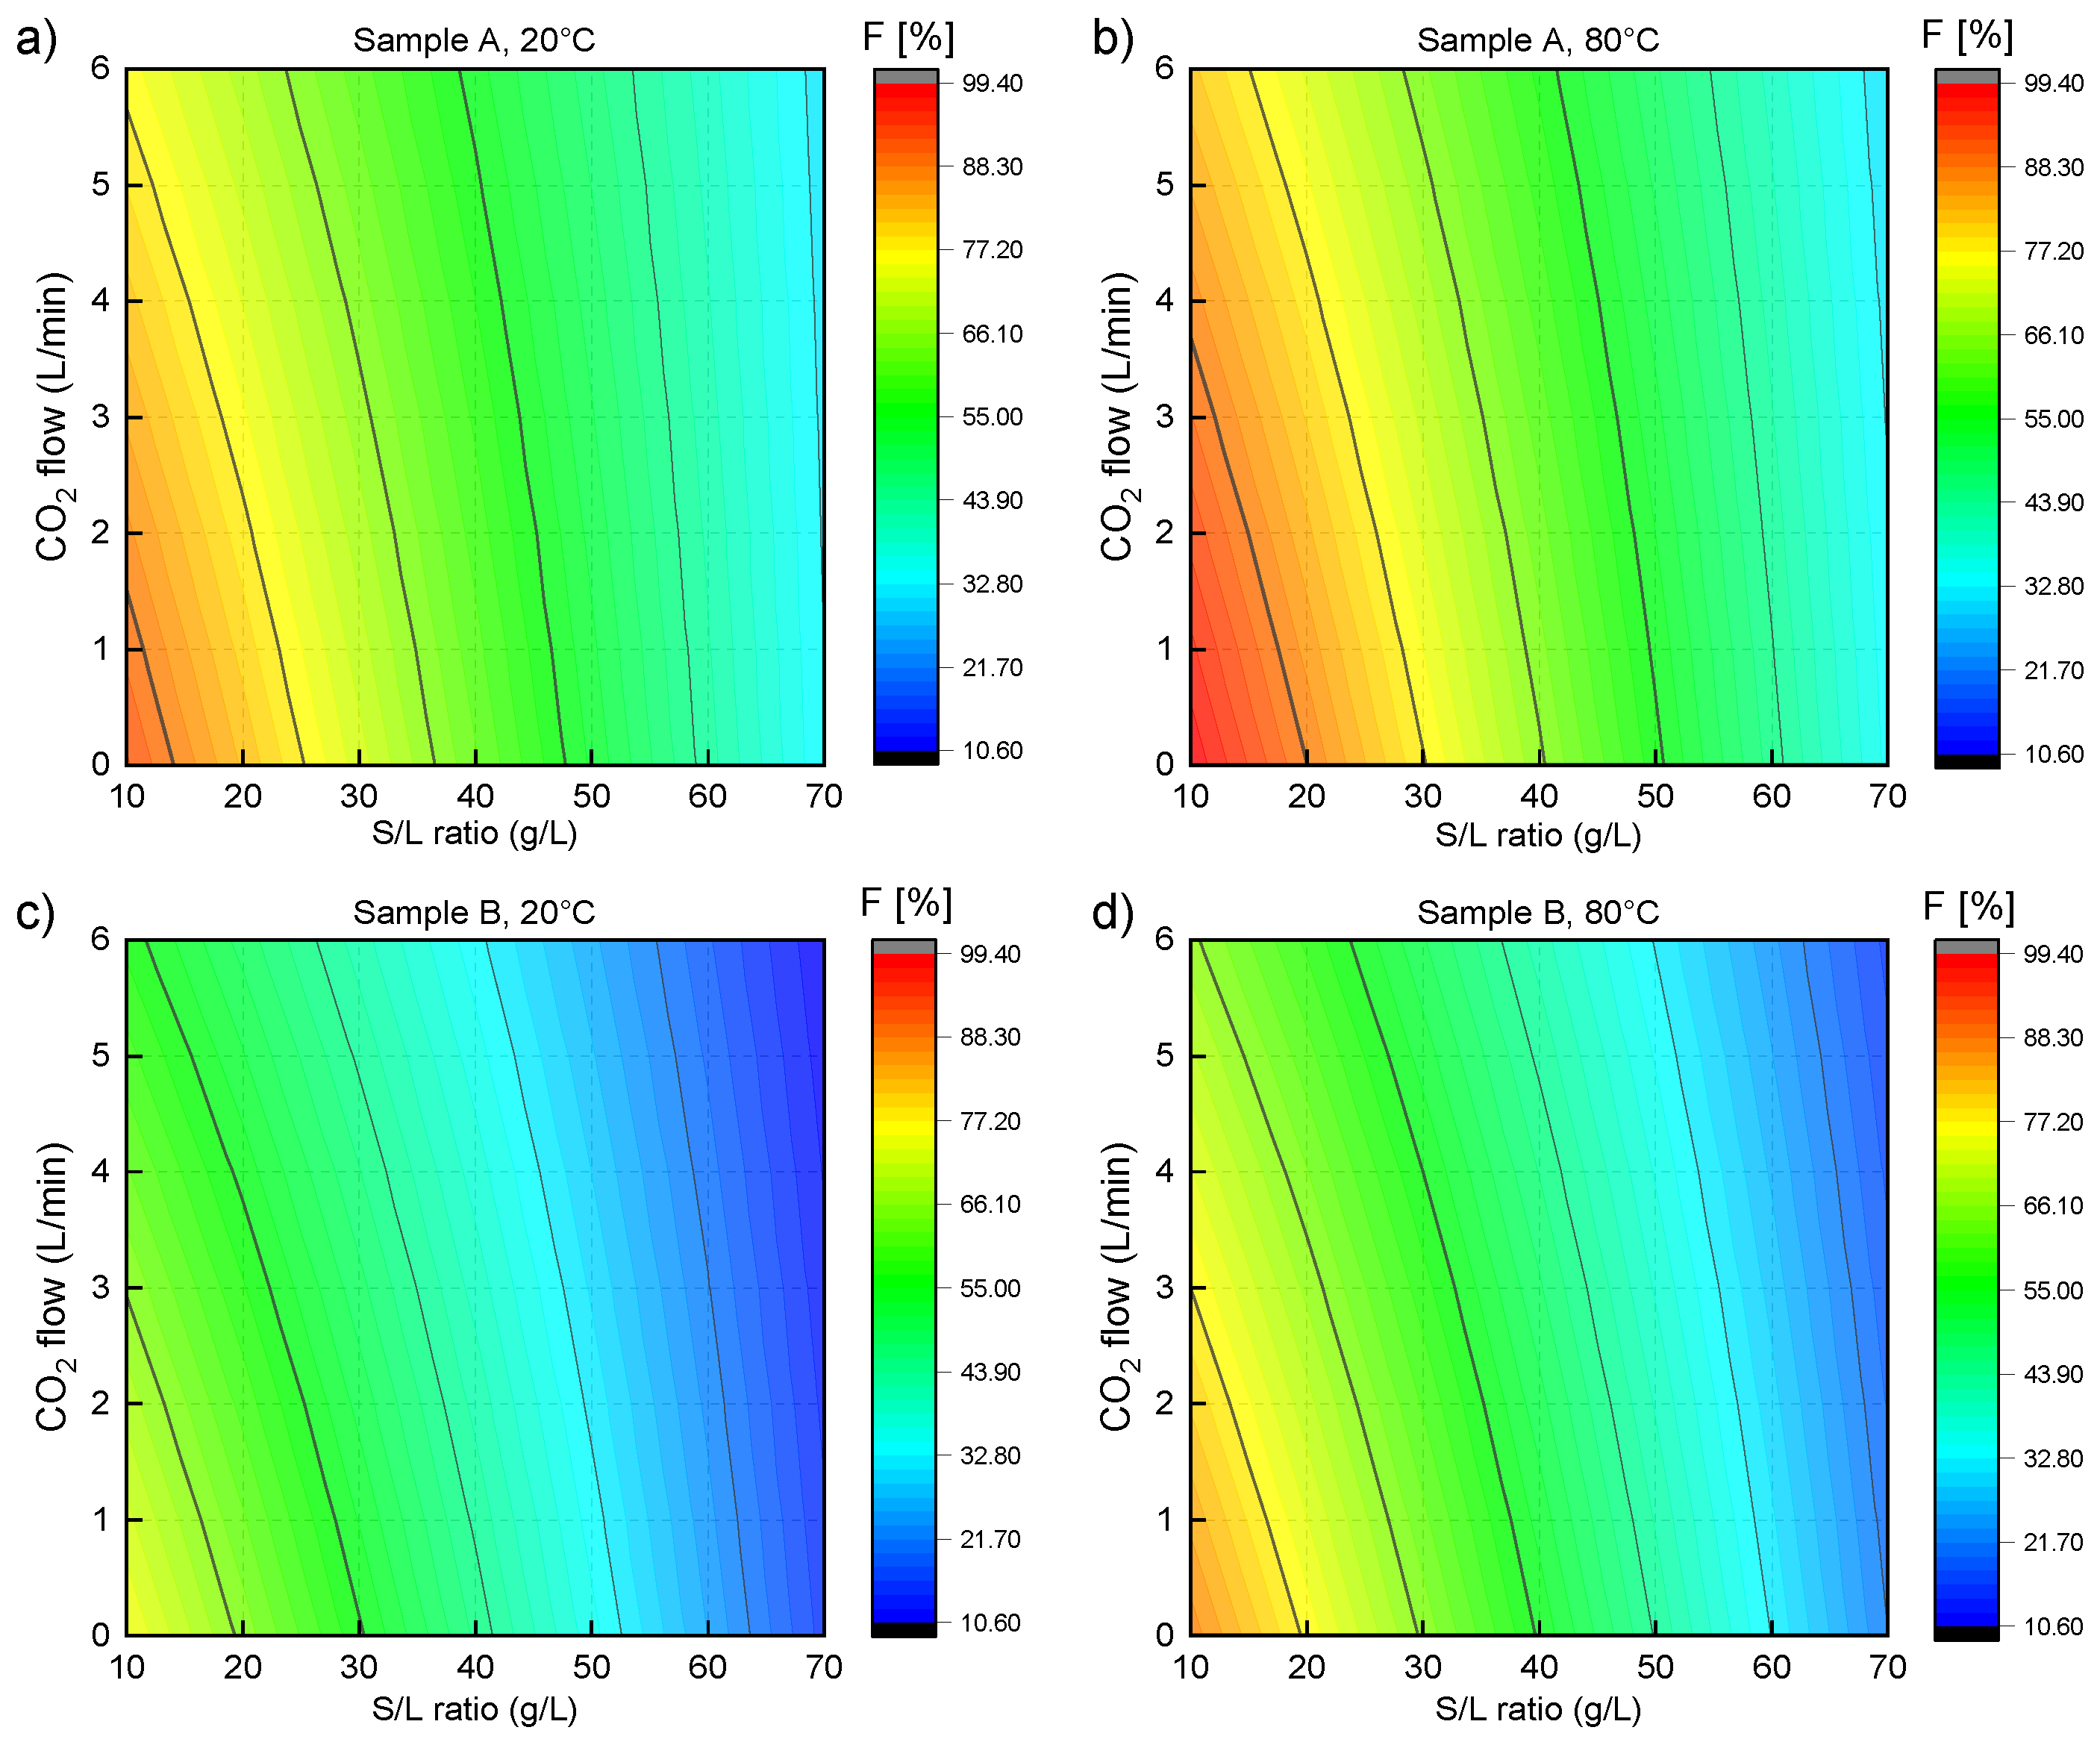
The regression equation (Equation (3)) showed that R² = 97.93%, which demonstrated a satisfactory adjustment of the experimental data. Based on this equation, it was possible to build color maps (Figure 4a–d) in which the x- and y-axis vary between the low and high levels of parameters’ S/L ratios and CO2 gas flows, respectively. In red, we displayed the highest F leaching efficiencies, and in blue, we displayed the lowest.
Since the F is undesired in the solution that targets Li recovery, the analysis will focus on the lowest values of leaching efficiency. The greatest difference, on average, of F leaching efficiencies came from the S/L ratio variation: from nearly 80% at 10 g/L to 20% at 70 g/L. The other significant parameters have also presented, on average, decreasing leaching efficiency behavior when the levels increased. The only opposite behavior is for temperature, in which the leaching efficiency increases only 5% from 20 °C to 80 °C.
In more detail, according to Figure 4a–d, the difference in leaching efficiency stands out when comparing the samples. In Figure 4a,b, the reddish color indicating higher leaching efficiency is present in a stronger manner than in Figure 4c,d, which indicates that F in Sample A might be in the form of a compound with greater susceptibility to water dissolution, once LiF solubility is extremely low in such conditions.
In relation to CO2 gas addition, it plays an important role only when the S/L ratio is low in both samples. The decrease in leaching efficiency when S/L ratio is 70 g/L and CO2 gas addition varies from 0 to 6 L/min is only 3%. On the opposite side, at a S/L ratio of 10 g/L, the decrease in leaching efficiency reaches nearly 21%. The CO2 gas addition is beneficial for enhancing the Li leaching efficiency and avoiding F dissolution because the lowest F dissolutions are paired with the highest CO2 gas addition.
3.3. pH Evaluation
In Table 3, it can be seen how the pH behaves during the water leaching, where zero means the point before the black mass addition. Without CO2 gas addition, the starting pH is close to 7, which is a standard water value, but it was increased, reaching values of 10.12 and 10.60, respectively, for S/L ratios of 10 g/L and 70 g/L, independent of the sample type or temperature. The higher pH value for the S/L ratio of 70 g/L might probably be attributed to the black mass amount in the same leaching volume. In water leaching, the dissolution of basic compounds (Li2CO3, LiF) and the reaction of Li2O with water generating LiOH increase the pH [7].
With 6 L/min of CO2 gas addition, the starting pH was lower due to the formation of carbonic acid in reaction with water. The increase in pH value during the trial reached 6.49 and 7.30, respectively, for S/L ratios of 10 g/L and 70 g/L, again independent of the sample type and temperature. Here, the difference was smaller because the formation of the carbonic acid (more H+ is formed) hinders the sharp pH increase, maintaining the lower value, despite the formation of basic molecules.
3.4. Optimization and Upscale Water Leaching
Based on the laboratory-scale data and the regression equation, an optimization of the parameters was possible using Minitab® 21.0, in which a combination of Li leaching efficiency maximization and F leaching efficiency minimization was set. To achieve the best fit that suits these criteria, some assumptions were made in two different scenarios:
Scenario 1.
- No upper limit was set for F leaching efficiency, and the target was set for 0% leaching efficiency;
- The lower limit set for Li leaching efficiency was 42.2%, which was the low value resulting from the laboratory-scale trials, and the target was set for 100%;
- The proportional weights of Li and F leaching efficiency in the optimization were set as equal, meaning that Li or F have the same importance for the result.
Scenario 2.
- The upper limit set for F leaching efficiency was 50%, and the target was the lowest achieved leaching efficiency of 10.6%;
- The lower limit set for Li leaching efficiency was 60%, and the target was the highest achieved leaching efficiency of 81.6%;
- The proportional weight of Li leaching efficiency in the optimization was higher than F leaching efficiency, meaning that it is more important to maximize Li leaching efficiency than to minimize F leaching efficiency.
The two optimized solutions in each scenario are provided and presented in Table 4. The leaching efficiencies for both Li and F that matched the assumptions mentioned above were circa 69% and 40% in Scenario 1 and 74% and 50% in Scenario 2, respectively. Composite desirability is a number between 0 and 1, and it is calculated by the geometric average between both responses. It showed a low value in Scenario 1 due to the F leaching efficiency, which is far from the target value established in the assumptions.
Taking into account that Li leaching efficiency must be as high as possible, the optimization of Scenario 1 was selected as the one to be further validated. Consequently, with the set of optimized parameters, laboratory-scale and upscale black mass water leaching trials were performed to check the optimization and fit leaching efficiency values. Hence, the black mass used was of Sample B, the CO2 gas addition was 6 L/min, the temperature was set at 80 °C, and the S/L ratio was set at 30 g/L. The setup of the trials was the same as that described in Section 2.
The laboratory-scale trial showed results of 70.52 ± 2.11% for Li leaching efficiency and 34.54 ± 4.47% for F leaching efficiency. In comparison to the optimization fit, the Li leaching efficiency is only 3% different, while the F leaching efficiency is circa 15% different.
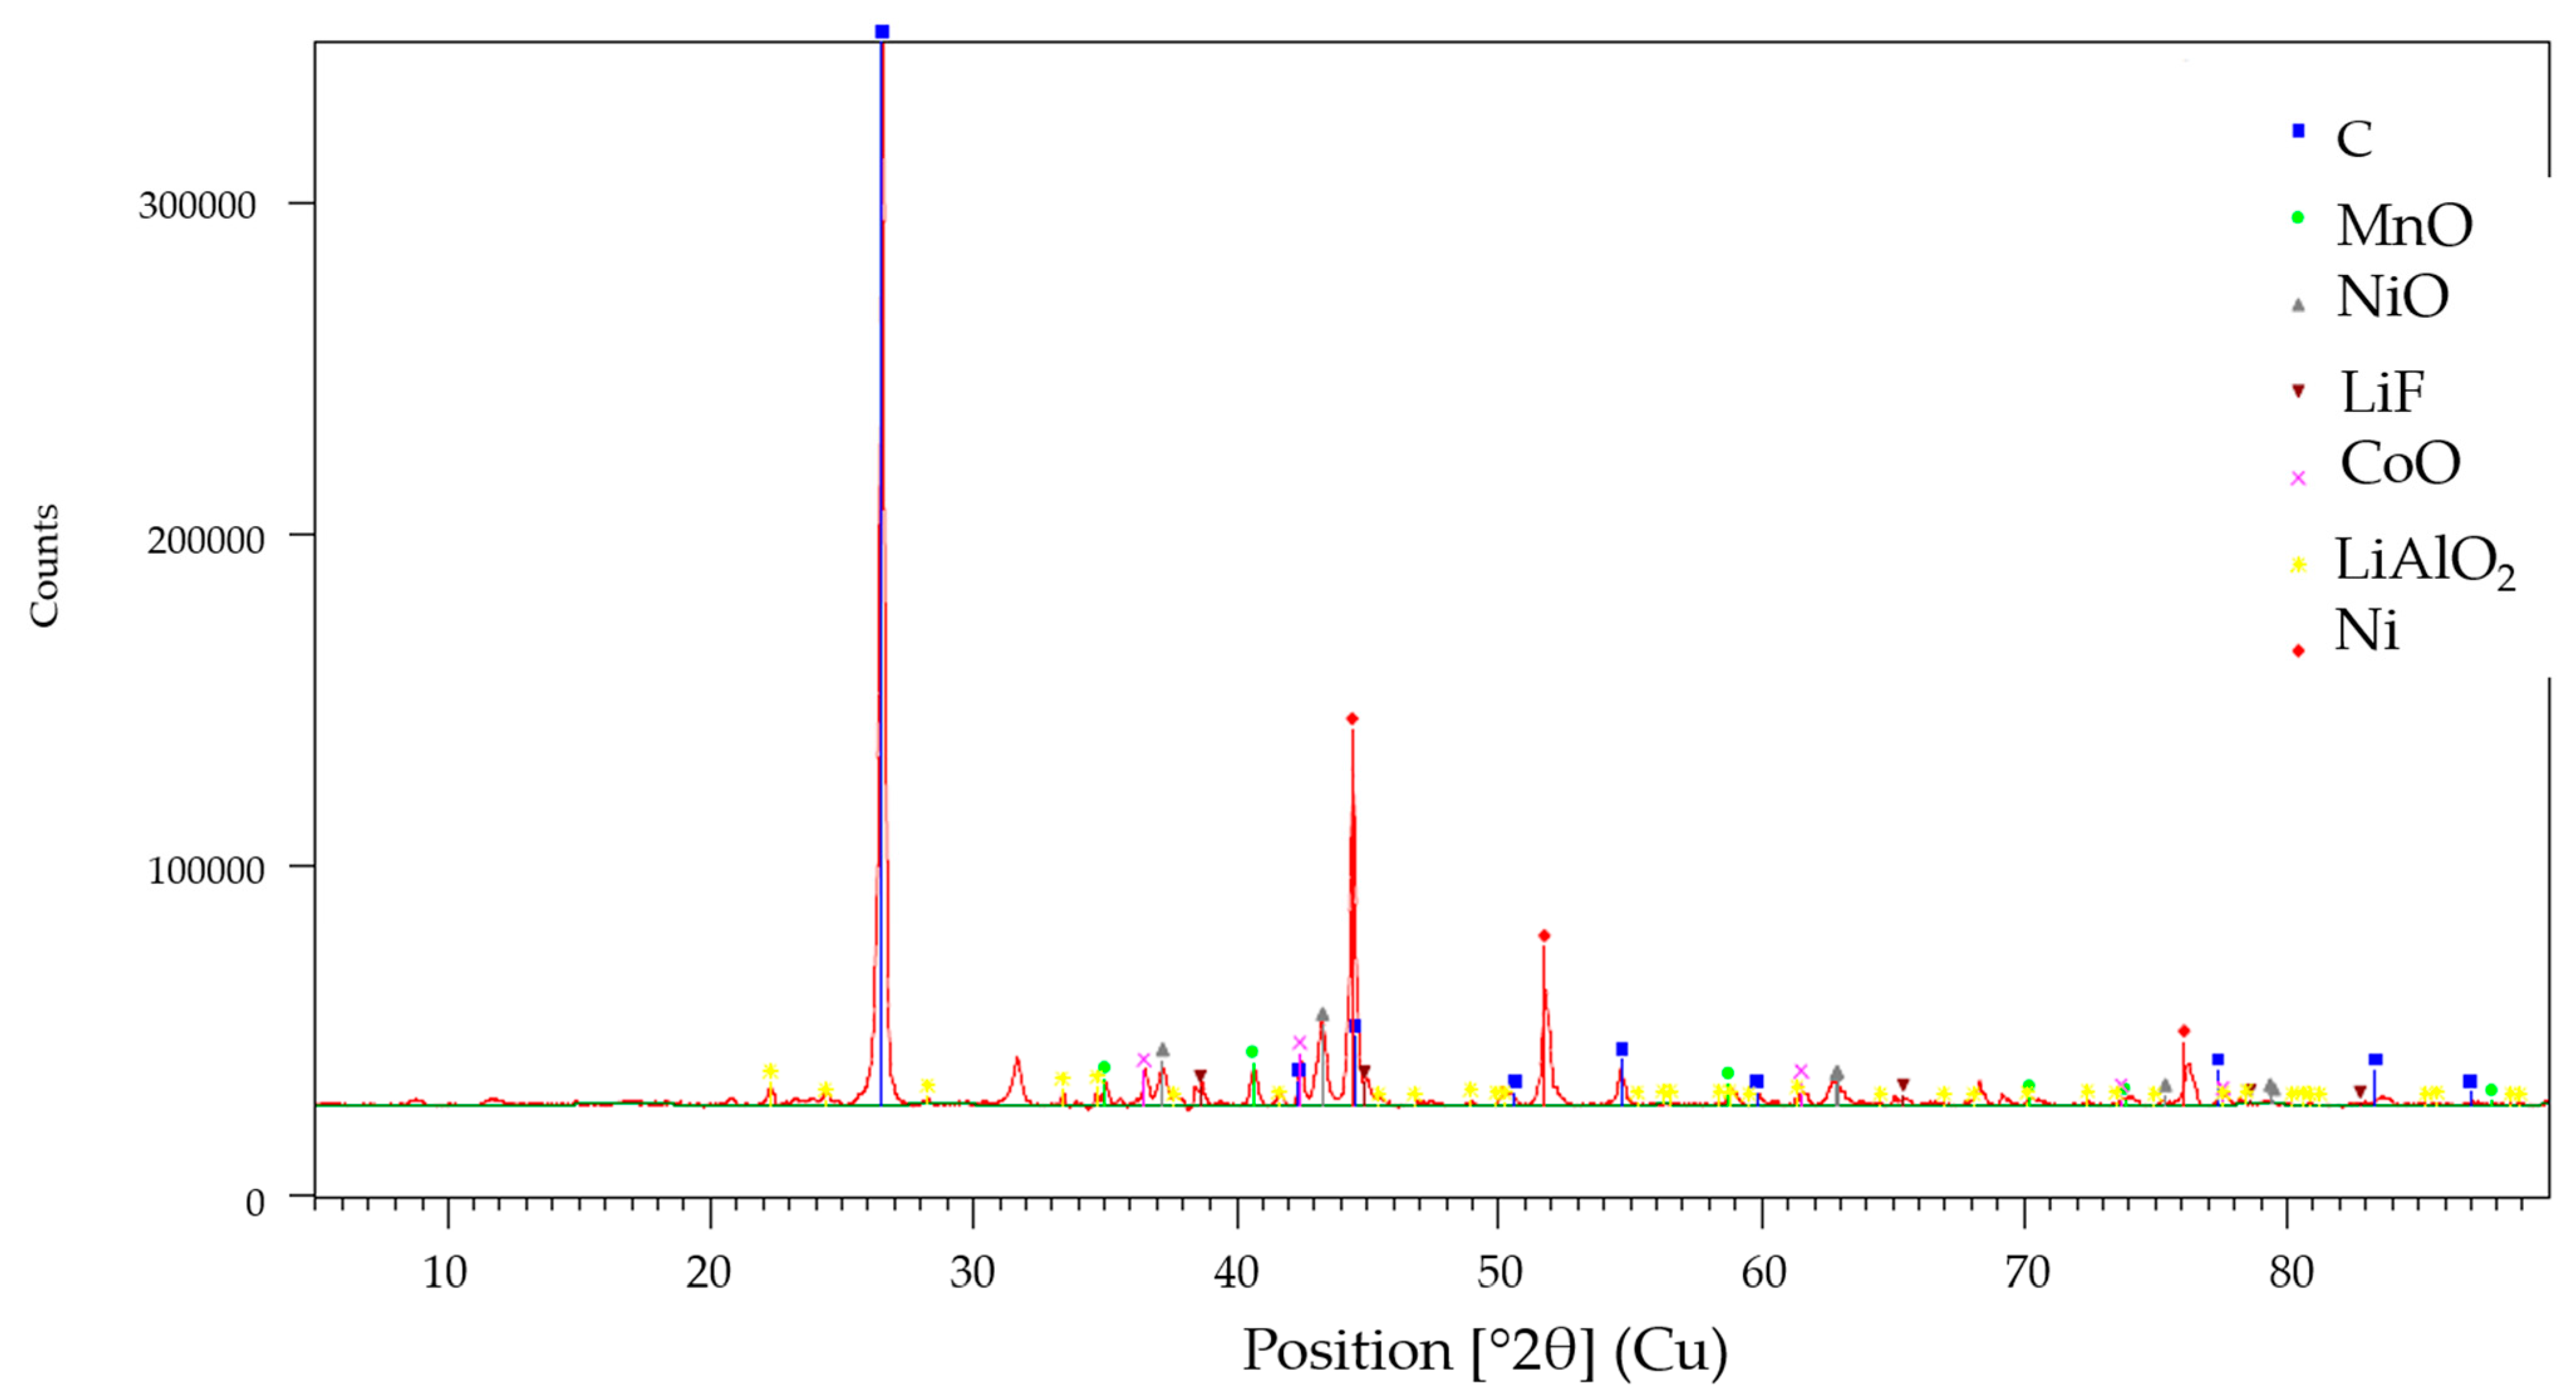
In the upscale trial under these conditions, the Li leaching efficiency achieved only 60.95 ± 3.12%, which is more distant than the result of the optimization, and F leaching efficiency was 52.93 ± 3.19%, as is summarized in Table 5. The pH in the upscaling was also investigated, and it varied the same way as the laboratory-scale trials, from circa 4.0 at the beginning of the leaching to approximately 6.9 at the end. The reasons for the lower Li leaching efficiency in upscaling relies on a few construction/dimension equivalence factors, for example, the different type of impeller and, thus, the stirring speed. The XRD in Figure 5 shows the residue of the upscale trial, in which is possible to observe peaks identified as graphite, Mn-, Ni-, and Co-oxides, as well as LiF and LiAlO2. The letter might be present due to a thermochemical reaction between the small fractions of Al foils and Li2O, which is insoluble [15].
4. Discussion
The leaching process of black mass, as any other input material, is deeply influenced by the compounds that are present. A few studies have characterized BM through XRD, which provides an insight into the compounds. It is reported that untreated BM contains mostly graphite and lithium-nickel-manganese-cobalt-oxides (LNMCO) that after water leaching at room temperature, for 90 min, and at an S/L ratio of 40 g/L showed only 13% Li efficiency [20], while room temperature, 1 h, and an S/L ratio of 20 g/L showed 7.5% [1], and 7.5% was also obtained with 80 °C, 3 h, and an S/L ratio of 50 g/L [21]. In this situation, the precursor of the leached Li might be LiPF6, which is found in the electrolyte, or the Li2O remaining from the manufacturing process [1].
When BM undergoes thermal treatment above 500 °C and at different times and atmospheres, XRD peaks match with Li, Mn, Ni, and Co as individual oxides or in other reduced compounds. For example, in an inert atmosphere, the LiCoO2, LiMn2O4, and LiNiO2 may be converted to Co, CoO, Mn3O4, MnO, Ni, NiO, Li2O, CO, and CO2 through the equations below (Equations (4)–(6)). In addition, the compound Li2CO3 is formed in some of these intermediate reactions (Equation (5)) [20,21,22].
However, other intermediate reactions (Equations (9) and (10)) that might occur are the interactions between the formed Li2CO3 and Li2O and the HF gas decomposed from the LiPF6 (Equations (7) and (8)), leading to the generation of LiF [21,23]. The precise amount of each component in the initial BM is difficult to track. LiF was also observed in the residue after leaching in another study [1], emphasizing the presence of this compound.
The Li2CO3 dissociates in water, according to Equation (11), via the process of hydrolysis, which produces basic solution by generating LiOH and LiHCO3 (Equation (12)) and, hence, influences the pH value by increasing it [24]. When CO2 gas addition happens in the system, the reaction (Equation (13)) tends to find an equilibrium, dislocating according to the pH. At the beginning of the trials, the pH is between 4 and 5, which, according to a speciation diagram, concentrates the species in the form of H2CO3. However, when the BM is introduced and basic compounds are formed, the species more stable at pH between 7 and 8 is [7], making it more suitable for reacting with Li+. And when there is no CO2 gas addition, the pH rises up to 11 with the BM addition, where the species dominates.
The solubility of these lithium compounds is important to address in water leaching. While for Li2CO3, the increase in temperature decreases the solubility from 13.3 g/L at 20 °C to 8.5 g/L at 80 °C [25], the solubility of LiF increases slightly from 1.32 g/L at 23 °C [25] to 1.50 g/L at 81.8 °C [26], which was observed in Figure 4b,d. In addition, the solubility of LiHCO3 is reported as 55 g/L at 18 °C [27]. Although the solubility of Li2CO3 is impacted negatively by the increase in temperature, the increase in Li leaching efficiency is probably driven by CO2 gas addition, which decreased the pH value. In the range of 7–8, the species is dominant, which forms the compound LiHCO3, with much a higher solubility value. The optimized S/L ratio of 30 g/L means that it was added in the water leaching process, according to the input material of Sample B, 1.26 g Li/L, which, converted to Li2CO3, corresponds to 6.66 g/L. If the input material contained Li solely in the form of Li2CO3, which is not the case due to other Li-phases identified in Figure 2, then the solubility limit of 13.3 g/L [25] would not have been achieved; thus, in theory, 100% Li leaching efficiency would happen. This situation is not verified in the S/L ratio of 70 g/L, since a corresponding 15.53 g Li2CO3/L is higher than the solubility limit of 13.3 g/L. Therefore, with theoretical calculations, the amount of BM from Sample B if there was only Li2CO3 would be ~60 g/L. Nonetheless, this hypothetical situation is not valid due to the other phases identified in the XRD of the input material. When taking into account Sample A, the XRD showed no Li2CO3 phase, but it is believed that the phase is present in lower quantities due to the inferior Li leaching efficiency. This is an indication of a less efficient thermal treatment.
In relation to F leaching efficiency, which may be linked to the compound LiF, the values decrease sharply with increase in S/L ratio and CO2 gas addition and slightly with increasing temperature, which is expected based on the LiF solubility values. However, this tendency had a higher impact on Sample B, probably due to the better thermal treatment, which was able to convert more LiPF6 into a LiF (Equation (7) sparingly soluble compound. Another study argues that in water leaching under conditions of 30 °C, an S/L ratio of 100 g/L, 1 h, and BM not thermally treated, the LiPF6 reacted with water to HF in the gas form [23], which may be the case here if the thermal treatment was not completely successful. It is mentioned that LiPF6 exists in equilibrium with LiF in water, alongside PF5 (Equation (7)). In Sample A, supposedly with a worsened thermal treatment, the F leaching efficiency was higher due to the equilibrium shifting towards the formation of HF and PF5 [28].
When upscaling a process, some aspects might interfere with the results and cause deviations from the laboratory scale. For example, the similarity principle states that geometric, kinematic, and dynamic aspects should be similar; however, the rigorous application of modeling theory is rarely practical due to an extensive list of parameters that affect the process. Often, engineers have to choose which are more important [29,30]. The transfer from laboratory scale to upscale in this study showed a 10% difference in Li leaching efficiencies under the same optimized parameters, which was expected due to the following possible reasons:
- The geometric similarity states that the ratio between the dimensions of the reactors should be proportional on both scales, which was not fully respected in this work, since, for example, the laboratory-scale reactor contained no baffles on the walls, while the upscale reactor contained four.
- The impeller, which is another construction parameter that influences the solution agitation and enhances leaching efficiencies in general, in this work was also different in size and type, not achieving the proportional similarity. It was also hypothesized that although the stirring rate of 150 rpm provided great turbulence, it was not enough, which caused the settlement of the particles on the bottom, in the cupped region of the reactor, consequently hindering the dissolution. A higher stirring speed was tested, but spilling was observed since the liquid surface was only 10 cm away from the boarder of the reactor.
- In Sample B, which has particle sizes < 1000 μm, the settlement velocity is probably higher, what contributes to the concentration of particles on the bottom of the reactor. However, lower particle sizes are unfeasible in industry application due to mechanical crushing being a costly process.
- Another aspect considered to contribute to the lower Li leaching efficiency in the upscale was the dwell time of 1 h, which might not be enough when a much higher amount of BM was used, and combined with the mentioned settlement, it affects the kinetics.
5. Conclusions
Based on a laboratory-scale evaluation—and further optimization—of black mass from NMC batteries water leaching, in which a few parameters reported in the literature that most influence lithium leaching efficiency were addressed (S/L ratio, temperature, CO2 gas addition, and sample from different batches), we investigated the transfer to an upscale water leaching batch through a regression model. The laboratory-scale Li and F leaching efficiencies optimization suggested an intermediate S/L ratio of 30 g/L, where Li leaching efficiency is maximized, and F leaching efficiency is minimized. The other parameters, which proved not as relevant as the S/L ratio, were 80 °C, despite the room temperature showing small difference; 6 L/min of CO2 gas addition, which promotes lithium high affinity compounds; and the Sample B, which has lower graphite content and bigger particle size. It was also possible to conclude that Sample B might have undergone a better thermal treatment than Sample A due to the leaching efficiencies, which is a key factor when performing ESLR with water leaching. Although the optimized parameters provided similar leaching efficiencies in the laboratory scale between the regression equation and trial, the upscale trial could not achieve the same efficiencies, which was expected due to the lack of similarities in geometric dimensions and hydrodynamics between reactors. Further upscale simulation based on theoretical dimensionless numbers and then proofing trials should be investigated, targeting Li leaching efficiency improvement.
Author Contributions
Conceptualization, D.D.M.; methodology, D.D.M.; validation, D.D.M., K.M.N. and I.E.Ö.; formal analysis, D.D.M.; investigation, D.D.M., K.M.N. and I.E.Ö.; resources, D.D.M.; data curation, D.D.M.; writing—original draft preparation, D.D.M.; writing—review and editing, D.D.M. and B.F.; visualization, D.D.M.; supervision, B.F.; project administration, D.D.M. and K.M.N.; funding acquisition, B.F. All authors have read and agreed to the published version of the manuscript.
Funding
This research was funded by the German Federal Ministry of Education and Research (BMBF), in the framework of the project “EarLiMet”, grant number 03XP0332C.
Data Availability Statement
The data presented in this study are available on request from the corresponding author (privacy).
Acknowledgments
The authors acknowledge all project partners for their support.
Conflicts of Interest
The authors declare no conflicts of interest. The authors declare that the research was conducted in the absence of any commercial or financial relationships that could be construed as a potential conflict of interest. The funders had no role in the design of the study; the collection, analyses, or interpretation of data; the writing of the manuscript; or the decision to publish the results.
References
- Rouquette, L.M.; Lemaître, T.; Vieceli, N.; Petranikova, M. Intensification of lithium carbonation in the thermal treatment of spent EV Li-ion batteries via waste utilization and selective recovery by water leaching. Resour. Conserv. Recycl. Adv. 2023, 17, 200125. [Google Scholar] [CrossRef]
- Neumann, J.; Petranikova, M.; Meeus, M.; Gamarra, J.D.; Younesi, R.; Winter, M.; Nowak, S. Recycling of Lithium-Ion Batteries—Current State of the Art, Circular Economy, and Next Generation Recycling. Adv. Energy Mater. 2022, 12, 2102917. [Google Scholar] [CrossRef]
- Hu, X.; Mousa, E.; Ye, G. Recovery of Co, Ni, Mn, and Li from Li-ion batteries by smelting reduction—Part II: A pilot-scale demonstration. J. Power Sources 2021, 483, 229089. [Google Scholar] [CrossRef]
- Dobó, Z.; Dinh, T.; Kulcsár, T. A review on recycling of spent lithium-ion batteries. Energy Rep. 2023, 9, 6362–6395. [Google Scholar] [CrossRef]
- Gao, W.; Zhang, X.; Zheng, X.; Lin, X.; Cao, H.; Zhang, Y.; Sun, Z. Lithium Carbonate Recovery from Cathode Scrap of Spent Lithium-Ion Battery: A Closed-Loop Process. Environ. Sci. Technol. 2017, 51, 1662–1669. [Google Scholar] [CrossRef] [PubMed]
- Sattar, R.; Ilyas, S.; Bhatti, H.N.; Ghaffar, A. Resource recovery of critically-rare metals by hydrometallurgical recycling of spent lithium ion batteries. Sep. Purif. Technol. 2019, 209, 725–733. [Google Scholar] [CrossRef]
- Schwich, L.; Schubert, T.; Friedrich, B. Early-Stage Recovery of Lithium from Tailored Thermal Conditioned Black Mass Part I: Mobilizing Lithium via Supercritical CO2-Carbonation. Metals 2021, 11, 177. [Google Scholar] [CrossRef]
- Liu, F.; Peng, C.; Ma, Q.; Wang, J.; Zhou, S.; Chen, Z.; Wilson, B.P.; Lundström, M. Selective lithium recovery and integrated preparation of high-purity lithium hydroxide products from spent lithium-ion batteries. Sep. Purif. Technol. 2021, 259, 118181. [Google Scholar] [CrossRef]
- Di, C.; Yongming, C.; Yan, X.; Cong, C.; Yafei, J.; Fang, H. Selective Recovery of Lithium from Ternary Spent Lithium-Ion Batteries Using Sulfate Roasting-Water Leaching Process. In Energy Technology 2020: Recycling, Carbon Dioxide Management, and Other Technologies; Chen, X., Zhong, Y., Zhang, L., Howarter, J.A., Baba, A.A., Wang, C., Sun, Z., Zhang, M., Olivetti, E., Luo, A., et al., Eds.; Springer International Publishing; Springer: Cham, Switzerland, 2020; pp. 387–395. [Google Scholar]
- Ma, Y.; Tang, J.; Wanaldi, R.; Zhou, X.; Wang, H.; Zhou, C.; Yang, J. A promising selective recovery process of valuable metals from spent lithium ion batteries via reduction roasting and ammonia leaching. J. Hazard. Mater. 2021, 402, 123491. [Google Scholar] [CrossRef]
- Liu, P.; Xiao, L.; Tang, Y.; Chen, Y.; Ye, L.; Zhu, Y. Study on the reduction roasting of spent LiNixCoyMnzO2 lithium-ion battery cathode materials. J. Therm. Anal. Calorim 2019, 136, 1323–1332. [Google Scholar] [CrossRef]
- Kuzuhara, S.; Ota, M.; Tsugita, F.; Kasuya, R. Recovering Lithium from the Cathode Active Material in Lithium-Ion Batteries via Thermal Decomposition. Metals 2020, 10, 433. [Google Scholar] [CrossRef]
- Tao, R.; Xing, P.; Li, H.; Sun, Z.; Wu, Y. Recovery of spent LiCoO2 lithium-ion battery via environmentally friendly pyrolysis and hydrometallurgical leaching. Resour. Conserv. Recycl. 2022, 176, 105921. [Google Scholar] [CrossRef]
- Yan, Z.; Sattar, A.; Li, Z. Priority Lithium recovery from spent Li-ion batteries via carbothermal reduction with water leaching. Resour. Conserv. Recycl. 2023, 192, 106937. [Google Scholar] [CrossRef]
- Zhang, G.; Yuan, X.; Tay, C.Y.; He, Y.; Wang, H.; Duan, C. Selective recycling of lithium from spent lithium-ion batteries by carbothermal reduction combined with multistage leaching. Sep. Purif. Technol. 2023, 314, 123555. [Google Scholar] [CrossRef]
- Chordia, M.; Nordelöf, A.; Ellingsen, L.A.-W. Environmental life cycle implications of upscaling lithium-ion battery production. Int. J. Life Cycle Assess. 2021, 26, 2024–2039. [Google Scholar] [CrossRef]
- Sommerville, R.; Zhu, P.; Rajaeifar, M.A.; Heidrich, O.; Goodship, V.; Kendrick, E. A qualitative assessment of lithium ion battery recycling processes. Resour. Conserv. Recycl. 2021, 165, 105219. [Google Scholar] [CrossRef]
- Saju, D.; Ebenezer, J.; Chandran, N.; Chandrasekaran, N. Recycling of Lithium Iron Phosphate Cathode Materials from Spent Lithium-Ion Batteries: A Mini-Review. Ind. Eng. Chem. Res. 2023, 62, 11768–11783. [Google Scholar] [CrossRef]
- Montgomery, D.C. Design and Analysis of Experiments, 5th ed.; John Wiley & Sons: Hoboken, NJ, USA, 2001; ISBN 0471316490. [Google Scholar]
- Stallmeister, C.; Friedrich, B. Influence of Flow-Gas Composition on Reaction Products of Thermally Treated NMC Battery Black Mass. Metals 2023, 13, 923. [Google Scholar] [CrossRef]
- Balachandran, S.; Forsberg, K.; Lemaître, T.; Vieceli, N.; Lombardo, G.; Petranikova, M. Comparative Study for Selective Lithium Recovery via Chemical Transformations during Incineration and Dynamic Pyrolysis of EV Li-Ion Batteries. Metals 2021, 11, 1240. [Google Scholar] [CrossRef]
- Mishra, G.; Jha, R.; Meshram, A.; Singh, K.K. A review on recycling of lithium-ion batteries to recover critical metals. J. Environ. Chem. Eng. 2022, 10, 108534. [Google Scholar] [CrossRef]
- Porvali, A.; Mäkelä, T.; Bachér, J. Observations on the Leaching of Milled Black Mass with Additives. J. Sustain. Metall. 2023, 9, 816–825. [Google Scholar] [CrossRef]
- Nylén, P.; Wigren, N.; Joppien, G. Einführung in die Stöchiometrie: Kurzes Lehrbuch der Allgemeinen und Physikalischen Chemie; mit 516 Aufgaben und Lösungen, 18., Vollst. Überarb. Aufl.; Steinkopff: Darmstadt, Germany, 1991; ISBN 3798508038. [Google Scholar]
- Haynes, W.M. CRC Handbook of Chemistry and Physics, 97th ed.; CRC Press: Boca Raton, FL, USA; London, UK; New York, NY, USA, 2017; ISBN 9781498754286. [Google Scholar]
- Stubblefield, C.B.; Bach, R.O. Solubility of lithium fluoride in water. J. Chem. Eng. Data 1972, 17, 491–492. [Google Scholar] [CrossRef]
- Yi, W.-T.; Yan, C.-Y.; Ma, P.-H. Kinetic study on carbonation of crude Li2CO3 with CO2-water solutions in a slurry bubble column reactor. Korean J. Chem. Eng. 2011, 28, 703–709. [Google Scholar] [CrossRef]
- Plakhotnyk, A.V.; Ernst, L.; Schmutzler, R. Hydrolysis in the system LiPF6—Propylene carbonate—Dimethyl carbonate—H2O. J. Fluor. Chem. 2005, 126, 27–31. [Google Scholar] [CrossRef]
- Ende, D.J. Chemical Engineering in the Pharmaceutical Industry: R&D to Manufacturing; Scale-Up of Mixing Processes: A Primer; John Wiley & Sons, Inc.: Hoboken, NJ, USA, 2011; ISBN 0470882220. [Google Scholar]
- Coker, A.K. Modeling of Chemical Kinetics and Reactor Design; Scale-Up in Reactor Design; Gulf Professional Pub: Boston, MA, USA, 2001; ISBN 978-0-88415-481-5. [Google Scholar]
Figure 1.
Setup scheme of the reactors used in water leaching trials: (a) 2 L laboratory scale and (b) 100 L upscale.
Figure 1.
Setup scheme of the reactors used in water leaching trials: (a) 2 L laboratory scale and (b) 100 L upscale.

Figure 2.
XRD analysis of both samples (a) A—63 µm and (b) B—1000 µm.
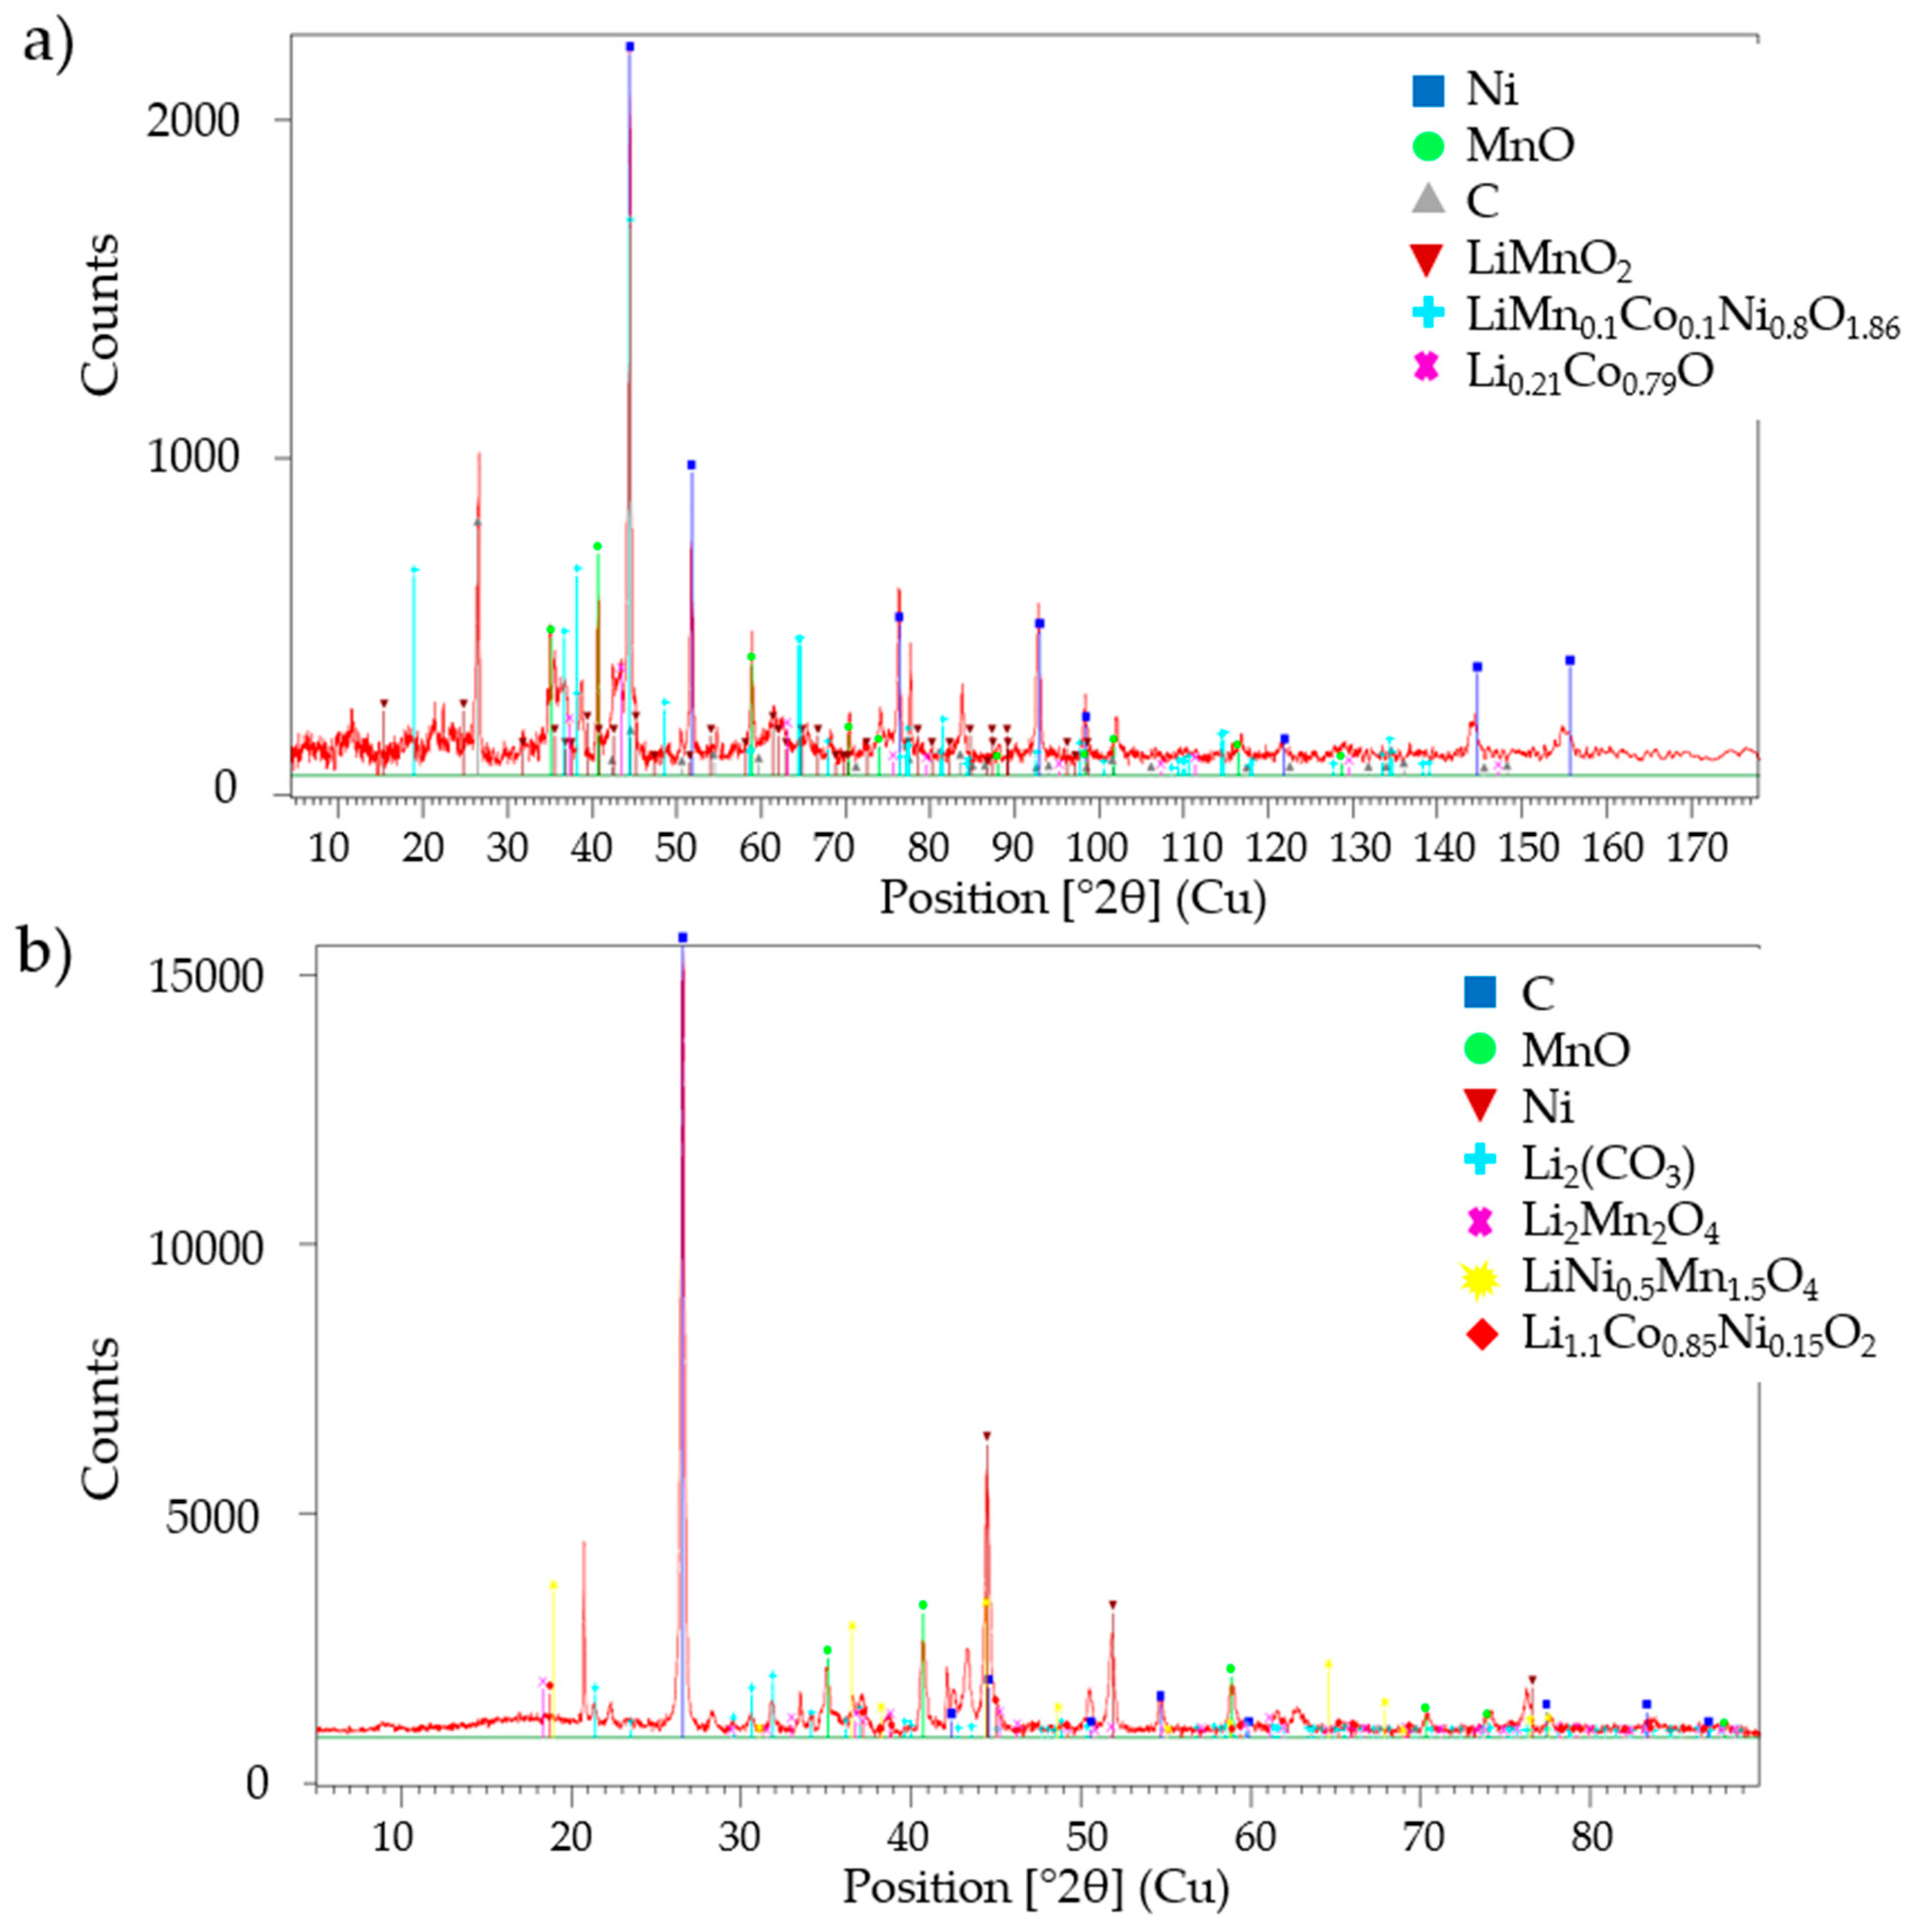
Figure 3.
Color map of Li leaching efficiency (%) in relation to S/L ratio and CO2 gas flow: (a) Sample A, 20 °C; (b) Sample A, 80 °C; (c) Sample B, 20 °C; and (d) Sample B, 80 °C. Red corresponds to the higher values, while blue corresponds to the lower values.
Figure 3.
Color map of Li leaching efficiency (%) in relation to S/L ratio and CO2 gas flow: (a) Sample A, 20 °C; (b) Sample A, 80 °C; (c) Sample B, 20 °C; and (d) Sample B, 80 °C. Red corresponds to the higher values, while blue corresponds to the lower values.
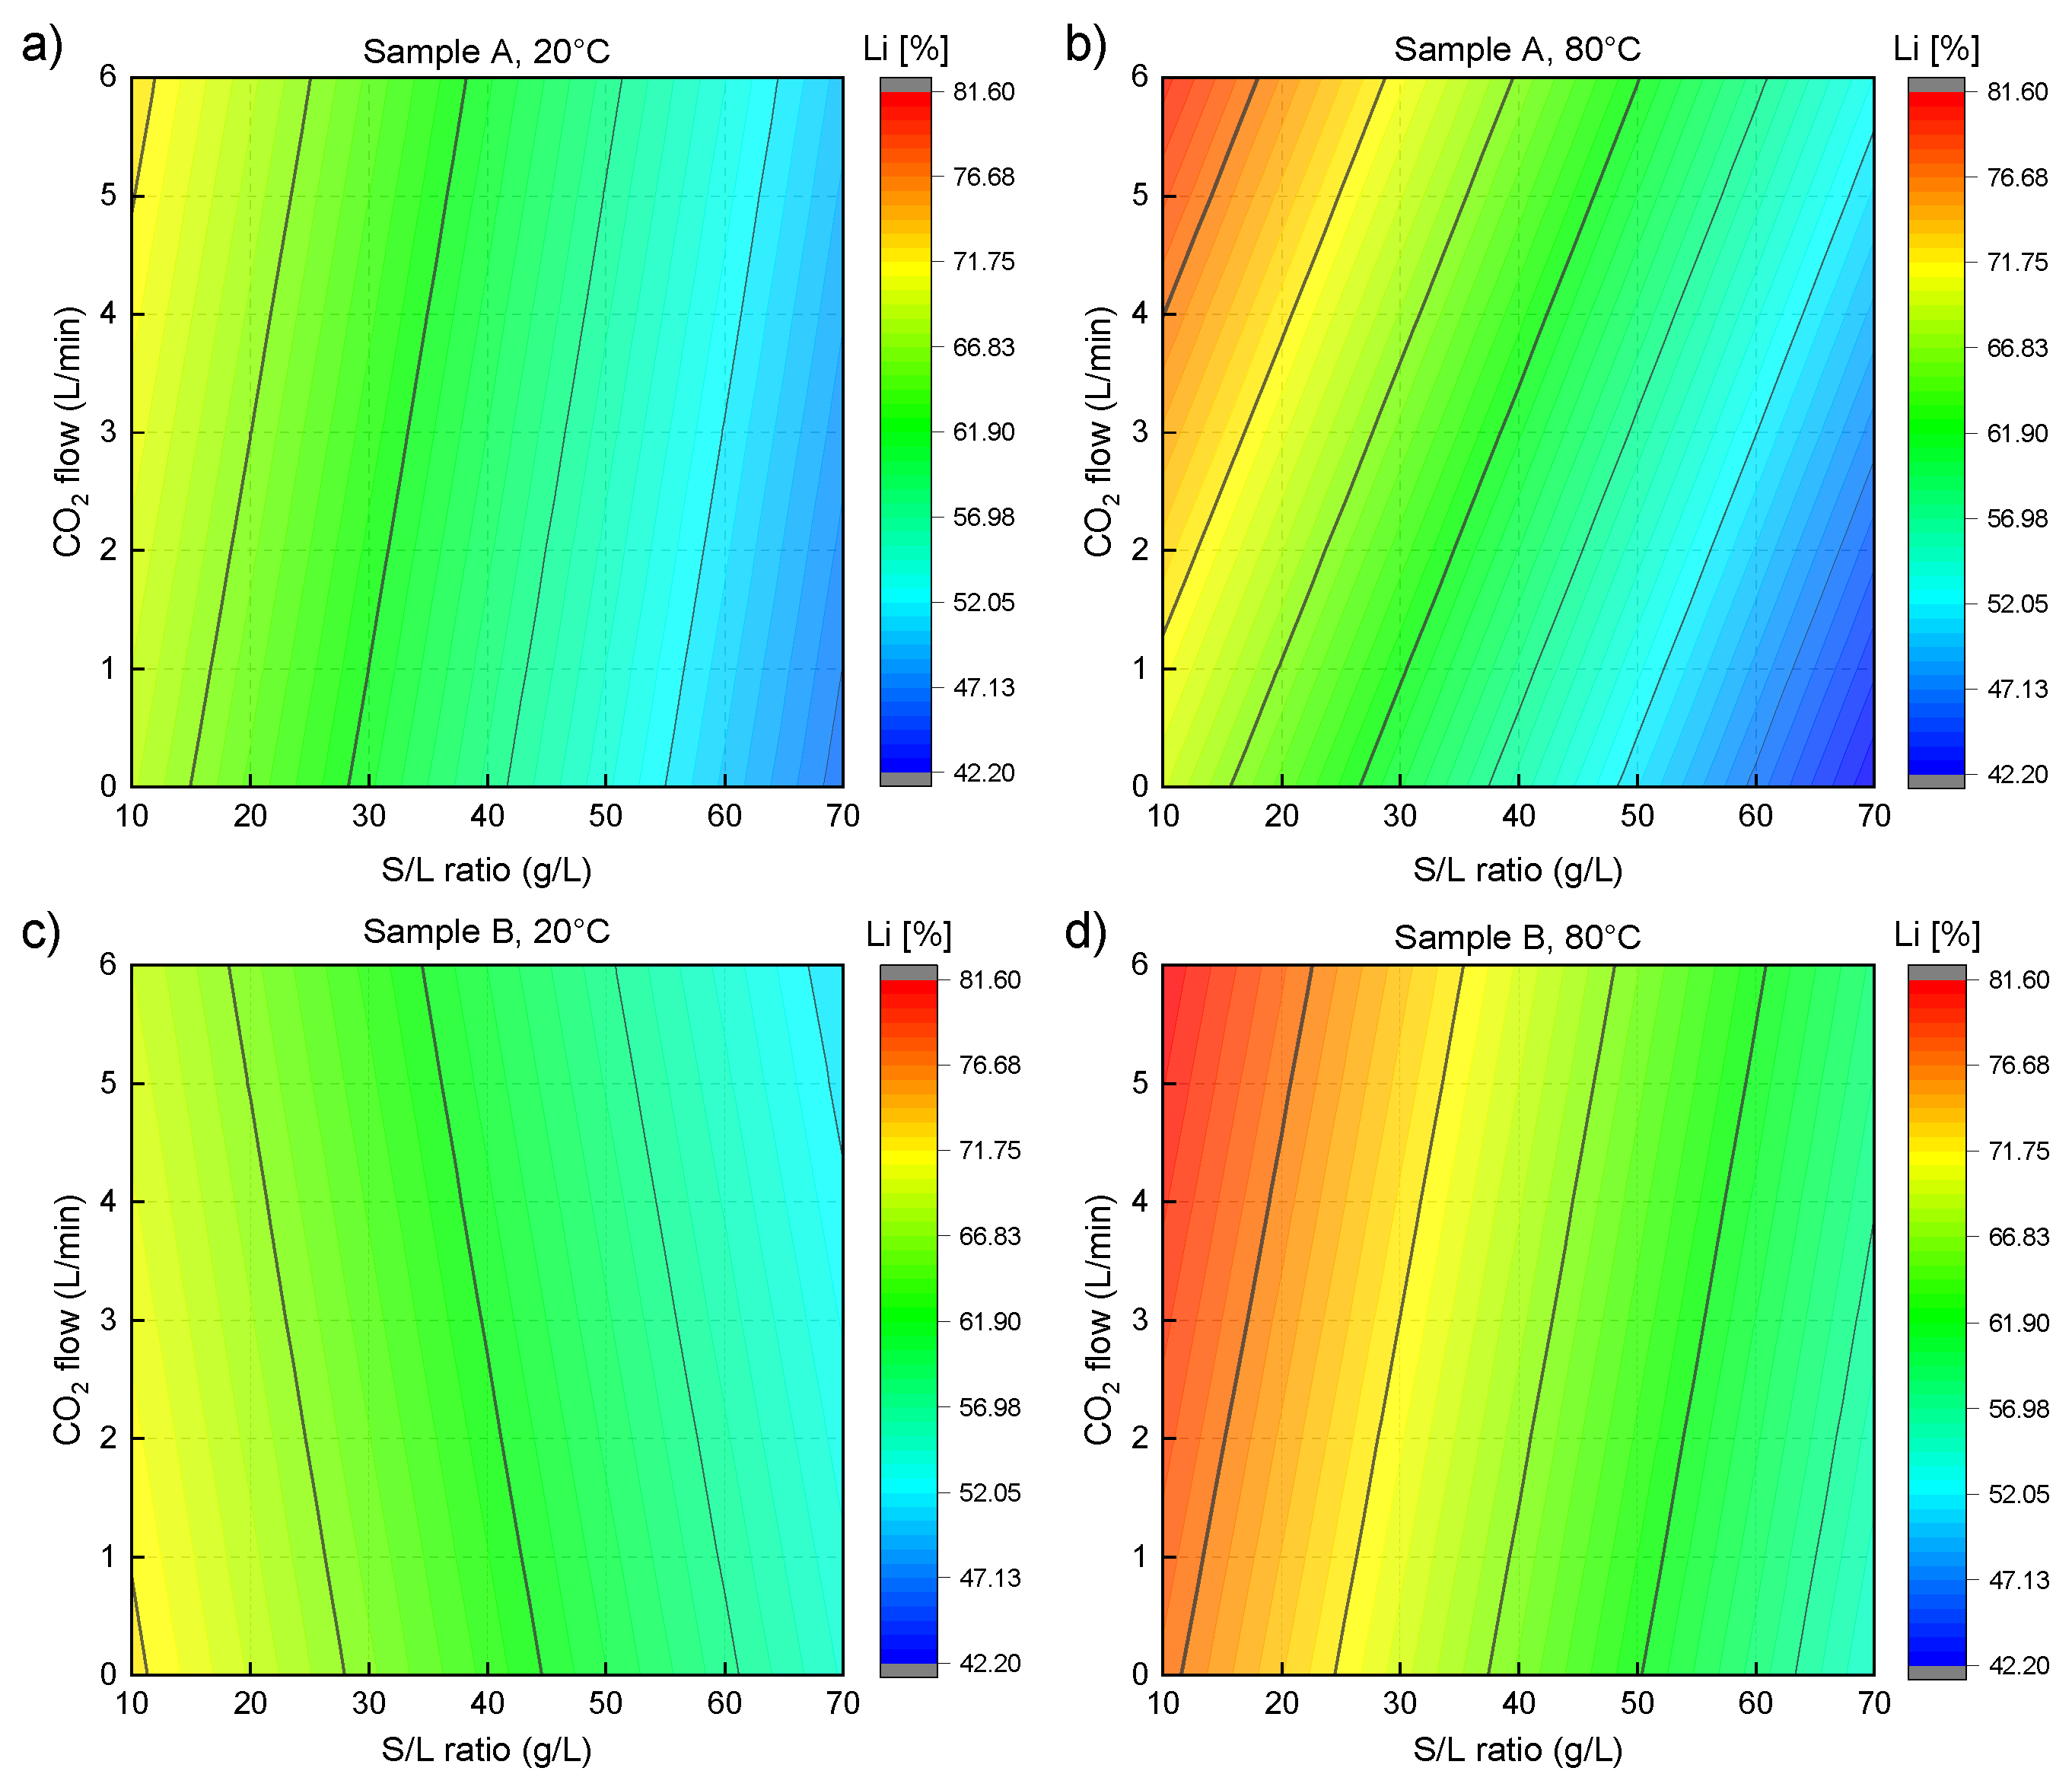
Figure 4.
Color map of F leaching efficiency (%) in relation to S/L ratio and CO2 gas flow: (a) Sample A, 20 °C; (b) Sample A, 80 °C; (c) Sample B, 20 °C; and (d) Sample B, 80 °C. Red corresponds to the higher values, while blue corresponds to the lower values.
Figure 4.
Color map of F leaching efficiency (%) in relation to S/L ratio and CO2 gas flow: (a) Sample A, 20 °C; (b) Sample A, 80 °C; (c) Sample B, 20 °C; and (d) Sample B, 80 °C. Red corresponds to the higher values, while blue corresponds to the lower values.

Figure 5.
XRD of the residue of upscale trial (input material: Sample B) with the corresponding identified phases.
Figure 5.
XRD of the residue of upscale trial (input material: Sample B) with the corresponding identified phases.

Table 1.
Parameters and levels used in laboratory-scale water leaching according to DoE.
| Parameter/Levels | Low | High |
|---|---|---|
| Black mass batch | Sample A—63 µm | Sample B—1000 µm |
| CO2 gas flow (L/min) | 0 | 6 |
| Temperature (°C) | 20 | 80 |
| S/L ratio (g/L) | 10 | 70 |
Table 2.
Chemical composition, in %, of both samples A and B used in water leaching trials.
| Li | F | Ni | Co | Mn | Fe | Al | Cu | P | C | |
|---|---|---|---|---|---|---|---|---|---|---|
| % | ||||||||||
| Sample A | 2.64 | 2.44 | 5.20 | 4.83 | 5.77 | 2.66 | 3.06 | 3.30 | 0.69 | 47.0 |
| Sample B | 4.17 | 2.96 | 12.6 | 11.0 | 9.20 | 1.19 | 4.57 | 3.38 | 0.73 | 25.8 |
Table 3.
Behavior of pH during water leaching before (0 min) and after (60 min) black mass addition in relation to CO2 gas addition and S/L ratio.
Table 3.
Behavior of pH during water leaching before (0 min) and after (60 min) black mass addition in relation to CO2 gas addition and S/L ratio.
| pH | ||||
|---|---|---|---|---|
| Time (min) | No CO2 Gas S/L Ratio 10 g/L | No CO2 Gas S/L Ratio 70 g/L | CO2 Gas 6 L/min S/L Ratio 10 g/L | CO2 Gas 6 L/min S/L Ratio 70 g/L |
| 0 (initial) | 6.91 | 6.72 | 4.39 | 4.60 |
| 60 | 10.12 | 10.60 | 6.49 | 7.30 |
Table 4.
Optimization of Li and F leaching efficiencies and corresponding parameters set in both assumption cases.
Table 4.
Optimization of Li and F leaching efficiencies and corresponding parameters set in both assumption cases.
| Solution | Sample | Temperature (°C) | CO2 Flow (L/min) | S/L Ratio (g/L) | F Fit (%) | Li Fit (%) | Composite Desirability a |
|---|---|---|---|---|---|---|---|
| Scenario 1 | B | 80 | 6 | 30 | 49.87 | 73.75 | 0.027 |
| Scenario 2 | B | 80 | 6 | 41.51 | 40.08 | 69.26 | 0.529 |
a The closer the response is to the target, the closer the desirability value is to 1.0.
Table 5.
Comparison between laboratory and upscale leaching trials with optimized set of parameters (S/L ratio of 30 g/L, 80 °C, 6 L CO2/min, and Sample B).
Table 5.
Comparison between laboratory and upscale leaching trials with optimized set of parameters (S/L ratio of 30 g/L, 80 °C, 6 L CO2/min, and Sample B).
| Li Leaching Efficiency (%) | F Leaching Efficiency (%) | |
|---|---|---|
| Laboratory Scale | 70.52 ± 2.11 | 34.54 ± 4.47 |
| Upscale | 60.95 ± 3.00 | 52.93 ± 3.19 |
Disclaimer/Publisher’s Note: The statements, opinions and data contained in all publications are solely those of the individual author(s) and contributor(s) and not of MDPI and/or the editor(s). MDPI and/or the editor(s) disclaim responsibility for any injury to people or property resulting from any ideas, methods, instructions or products referred to in the content. |
© 2024 by the authors. Licensee MDPI, Basel, Switzerland. This article is an open access article distributed under the terms and conditions of the Creative Commons Attribution (CC BY) license (https://creativecommons.org/licenses/by/4.0/).
Share and Cite
MDPI and ACS Style
Munchen, D.D.; Milicevic Neumann, K.; Öner, I.E.; Friedrich, B. Transfer of Early-Stage Lithium Recovery from Laboratory-Scale Water Leaching to Upscale Challenges. Metals 2024, 14, 67. https://doi.org/10.3390/met14010067
AMA Style
Munchen DD, Milicevic Neumann K, Öner IE, Friedrich B. Transfer of Early-Stage Lithium Recovery from Laboratory-Scale Water Leaching to Upscale Challenges. Metals. 2024; 14(1):67. https://doi.org/10.3390/met14010067
Chicago/Turabian StyleMunchen, Daniel Dotto, Ksenija Milicevic Neumann, Ilayda Elif Öner, and Bernd Friedrich. 2024. "Transfer of Early-Stage Lithium Recovery from Laboratory-Scale Water Leaching to Upscale Challenges" Metals 14, no. 1: 67. https://doi.org/10.3390/met14010067
Note that from the first issue of 2016, this journal uses article numbers instead of page numbers. See further details here.