Article

Removal of Antimony from Industrial Crude Arsenic by Vacuum Sublimation: Combination of Thermodynamics and Ab Initio Molecular Dynamics

1
The State Key Laboratory of Complex Non-Ferrous Metal Resources Clean Utilization, Kunming University of Science and Technology, Kunming 650093, China
2
National Engineering Research Center for Vacuum Metallurgy, Kunming University of Science and Technology, Kunming 650093, China
3
Faculty of Metallurgical and Energy Engineering, Kunming University of Science and Technology, Kunming 650093, China
*
Authors to whom correspondence should be addressed.
Metals 2024, 14(5), 490; https://doi.org/10.3390/met14050490
Submission received: 2 April 2024 / Revised: 17 April 2024 / Accepted: 18 April 2024 / Published: 23 April 2024

Abstract

:
Thermodynamic theory was employed in this study to investigate the feasibility of separating antimony (Sb) from crude arsenic (As) using vacuum sublimation. Ab initio molecular dynamics simulations are used to calculate the structure, stability, and diffusion properties of AsmSbn (m + n ≤ 6) clusters. As4, As3Sb, As2Sb2, and AsSb3 are the possible clusters in this thermodynamic calculation, and the molecular dynamics results confirmed their structural stability and stabilization in the gas phase. As4 had the largest diffusion coefficients, which is the reason it separates from the Sb-containing clusters (As3Sb, As2Sb2, and AsSb3) during gas-phase diffusion and condensation processes. The experimental results show that As vapor was transformed from crystalline to amorphous with increasing subcooling, and the Sb-containing clusters that enter the gas phase were mainly condensed and deposited at the proximal end of the heating zone. Not considering the volatilization rate, the removal rate of Sb in products can reach 99.35% by increasing the condensation disk and expanding the condensation zone; thus, experiments confirmed that industrial crude arsenic can realize deep Sb removal after vacuum sublimation.

1. Introduction

Arsenic is widely used in the semiconductor industry due to its unique electronic properties and ability to meet specific technological needs [1,2]. With the rapid development of the semiconductor industry, the purity requirements for arsenic have become more stringent. During the preparation of high-purity arsenic, antimony was primarily removed as it is the main impurity element due to the similar physical and chemical properties shared by both main group elements. Chlorination distillation is the main method for deep removal of antimony from crude arsenic. This is achieved by taking advantage of the different boiling points of AsCl3 (130.2 °C) and SbCl3 (220.3 °C) [3]. However, this process has some problems, such as a long production process, high production cost, and low treatment capacity. The advantages of vacuum distillation are high recovery efficiency, low energy consumption, environmental friendliness, etc. It has been widely used in the purification of crude metals, separation of alloys, recovery of secondary resources, etc. [4]. It is an important method for industrial arsenic purification as the oxidation of highly volatile arsenic can be avoided by vacuum processes. However, there is a lack of research on the mechanism of Sb removal by vacuum sublimation of industrial crude arsenic.
Many authors have carried out studies on the structure and properties of As and Sb clusters. Liang et al. studied the neutral and charged Asn−1.0+1 (n = 2–8) structure and its electronic properties [5]. Zhao et al. investigated the structure, thermal properties, and electron affinity energies of neutral clusters of Asn (n = 1–5) and their anions [6]. Yonezo et al. designed a high-temperature nozzle apparatus for electron gas diffraction experiments to determine the structure of As4 [7]. Igelmann et al. studied the structure and ionisation potential of slightly symmetric Sbn (n ≤ 6) clusters using the SCF CI method and adjusted pseudopotentials [8]. Using a PBE/DND method based on DFT, Zhou et al. investigated the structural and electronic properties of Sbn (n = 2–10) and its anions under various conditions [9]. Kordis et al. discovered the bond lengths, binding energies, and vibrational frequencies of Sb2 using mass spectrometry and photon spectroscopy experiments [10]. Previous studies have mainly focused on either arsenic or antimony individually. Mixed arsenic–antimony clusters are more suitable for production, yet few reports exist on their structure and properties.
In this paper, thermodynamic calculations were performed to illustrate the possibility of separation Sb by vacuum sublimation of industrial crude arsenic. Density functional theory (DFT) combined with ab initio molecular dynamics (AIMD) was used to calculate the geometric structure, stability, and stable cluster diffusion properties of AsmSbn (m + n ≤ 6) clusters, which provides a theoretical basis for the migration behaviour of Sb during vacuum sublimation. The experimental results agree with the theoretical calculations, and this study provides an important theoretical basis for further experimental studies.

2. Computational and Experimental Methods

2.1. Thermodynamic Calculation

2.1.1. Saturated Vapour Pressure

Industrial vacuum distillation of crude arsenic for Sb removal is based on the large difference in saturated vapour pressure between the two components. At the same temperature, the higher the vapour pressure, the more volatile it is. The relationship between the saturation vapour pressure of the pure component and temperature can be expressed as:
lgp = AT−1 + B lgT + CT + D,
where p is the saturated vapour pressure of the pure component, T is the temperature, and A, B, C, and D are the evaporation constants. The specific parameter values are given in Table 1.

2.1.2. Gibbs Free Energy

Considering that As and Sb react during distillation, the Gibbs free energy can be used to determine the direction of the reaction. Δ r G is given by Equation (2).
Δ r G   = Δ r G θ + RTlnQ ,
Thermodynamic data were taken from Factsage 7.2 [12], where R is the gas constant, T is the temperature, and Q is the ratio of the pressure or concentration of the substance before and after the reaction under practical conditions. The possible reactions of As and Sb during vacuum sublimation are:
As(s) = As(g)
2As(s) = As2(g)
3As(s) = As3(g)
4As(s) = As4(g)
Sb(s) = Sb(g)
2Sb(s) = Sb2(g)
4Sb(s) = Sb4(g)
As(s) + Sb(s) = AsSb(g)
As(s) + 3Sb(s) = AsSb3(g)
2As(s) + 2Sb(s) = As2Sb2(g)
3As(s) + Sb(s) = As3Sb(g)

2.2. Dynamic Calculations

2.2.1. Mean Free Range

The free range of gas molecules is the distance they can travel between collisions. Due to the random nature of the collisions, this distance is constantly changing, and its average value is known as the mean free range, usually denoted by the symbol λ. The number of collisions can be derived by Maxwell using the molecular velocity distribution law:
Z = 2 π d 2 nv
where Z is the average number of collisions in units of s−1, d is the molecular diameter in units of m, n is the molecular density of the gas in units of m−3, and v is the average velocity of the molecules in units of m/s.
The molecular density n is related to the pressure and temperature of the space gas and can be calculated using Equation (15):
n = p kT = 7.2429   × 10 22 p T
Based on the average number of collisions and the distance travelled by the molecules in 1 s, the mean free range is obtained as shown in Equation (16):
λ = v Z = 1 2 π d 2 n = 3.107 × 10 - 24 T p d 2
where λ is the mean free range in units of m, d is the molecular diameter in units of m, p is the pressure of the gas in units of Pa, and T is the thermodynamic temperature in units of K.

2.2.2. Ab Initio Molecular Dynamics Calculations

To clarify the migration behaviour and diffusion of the clusters during volatilisation, ab initio molecular dynamics calculations from first principles were used. Structural optimisation and stability calculations of AsmSbn (m + n ≤ 6) clusters use density functional theory (DFT) methods. All calculations were performed using the Dmol3 package in the Materials Studio 2017 quantum chemistry calculation software. The structure optimisation process uses a dual-valued atomic basis set, DNP, with the self-joint selective generation convergence criterion set to 10−6 Ha, the trailing parameter set to 0.005, the force convergence criterion set to 0.02 eV/Å, and the energy convergence criterion set to 10−5 V/atom. The exchange correlation generalisation used was the Generalised Gradient Approximation (GGA), and the correlation gradient correction was based on the self-consistent field convergence of the system energy using the Perdew–Burke–Ernzerhof (PBE) generalisation.
Considering the initial geometric configurations of the clusters, selected configurations from previous explorations of the ground state structures of Asm and Sbn clusters, rational substitutions, and additions were made on the basis of these initial configurations to obtain candidate configurations of AsmSbn clusters [13,14]. The relative stability of these clusters was assessed by calculating the average binding energy, the second-order energy difference, and the cleavage energy. The chemical stability depends mainly on the order of the energy levels, which we analysed by assessing the energy gap between the highest occupied molecular orbital (HOMO) and the lowest unoccupied molecular orbital (LUMO). The average binding energy, the second order energy difference, and the cleavage energy were calculated as follows:
E b As m Sb n = m E t As + n E t Sb   E t ( As m Sb n ) m + n
Δ 2 E =   E t As m Sb n + 1 + E t As m Sb n - 1   - 2 E t As m Sb n + 1
D = E t As m Sb n p + E t Sb p - E t As m Sb n
where E t As , E t Sb , E t Sb p , E t As m Sb n - 1 , E t As m Sb n p ,   E t ( As m Sb n ) , and E t As m Sb n + 1 denote the total energy of the most stable structure of the cluster, respectively.
To explore the diffusive nature of the clusters, the NVT system was used throughout the simulation, with the temperature set to 698 K, the time step set to 10 fs, the total simulation time set to 20 ps, and the other setup parameters set to those of the structure optimisation process. The mean square displacement (MSD) curves over time were obtained to determine the diffusion coefficient (D).
MSD = < | r ( t )   -   r ( 0 ) 2 | >
D =   lim 1 6 t < | r ( t )   -   r ( 0 ) 2 | >
where D represents the diffusion coefficient (m2/s) and t is the time (s).

2.3. Materials and Methods

2.3.1. Materials and Reagents

The raw material for this experiment came from an As smelter in Yunnan, which was produced from As oxide by carbothermic reduction. The purity of As and the content of each impurity were determined by chemical titration and ICP-OES, as shown in Table 2. The content of As is 96.33%, with 1.86% Sb, and low presence of other impurities; this paper focuses on the behaviour of Sb. The morphology has been studied by EPMA, as shown in Figure 1. As seen in Figure 1a, the raw As material has a grey metallic appearance; when its composition was examined after polishing, it was found that the Sb elements were uniformly distributed without any obvious aggregation behaviour and were diffusely distributed throughout the observation area.
The experiments were carried out by means of passing high purity argon gas (99.99%) to realize the control of pressure, from a gas preparation company in Yunnan.

2.3.2. Experimental Equipment and Process

Figure 2 shows a schematic diagram of the vacuum sublimation furnace. The experiment of vacuum sublimation purification of crude arsenic was carried out in a tube furnace designed by ourselves. The temperature of the system was raised by heating the resistance wire, so that the crude arsenic in the graphite crucible were sublimed. There was an open condensation disc in the condensation area, the positions of the upper and lower two condensation discs’ holes were staggered, and the As vapour moved upward in the condensation area in an S-shape. To prevent the product As from condensing on the tube wall, which is difficult to remove, graphite foil was added to the inner wall of the tube. A vacuum pump was used to extract the vacuum with a limiting pressure of 1 × 10⁻² Pa, and argon gas was passed to control the system pressure. The core and condensation zone temperatures were measured by fixed thermocouples.

2.3.3. Characterization Analysis

In this study, potassium bromate titration and ICP–OES (Gilent 5110, Santa Clara, CA, USA) were employed to determine the contents of As and other elements in the samples. The structure and composition were analysed through scanning electron microscopy (SEM, EGA3 TESCAN, Brno, Czech Republic), and XRD (Rigaku Ultima IV, Tokyo, Japan). EPMA (SHIMADZU EPMA-1720H, Tokyo, Japan) was used to analyse the morphology of the elements in the samples.

3. Results and Discussion

3.1. Results of the Thermodynamic Calculations

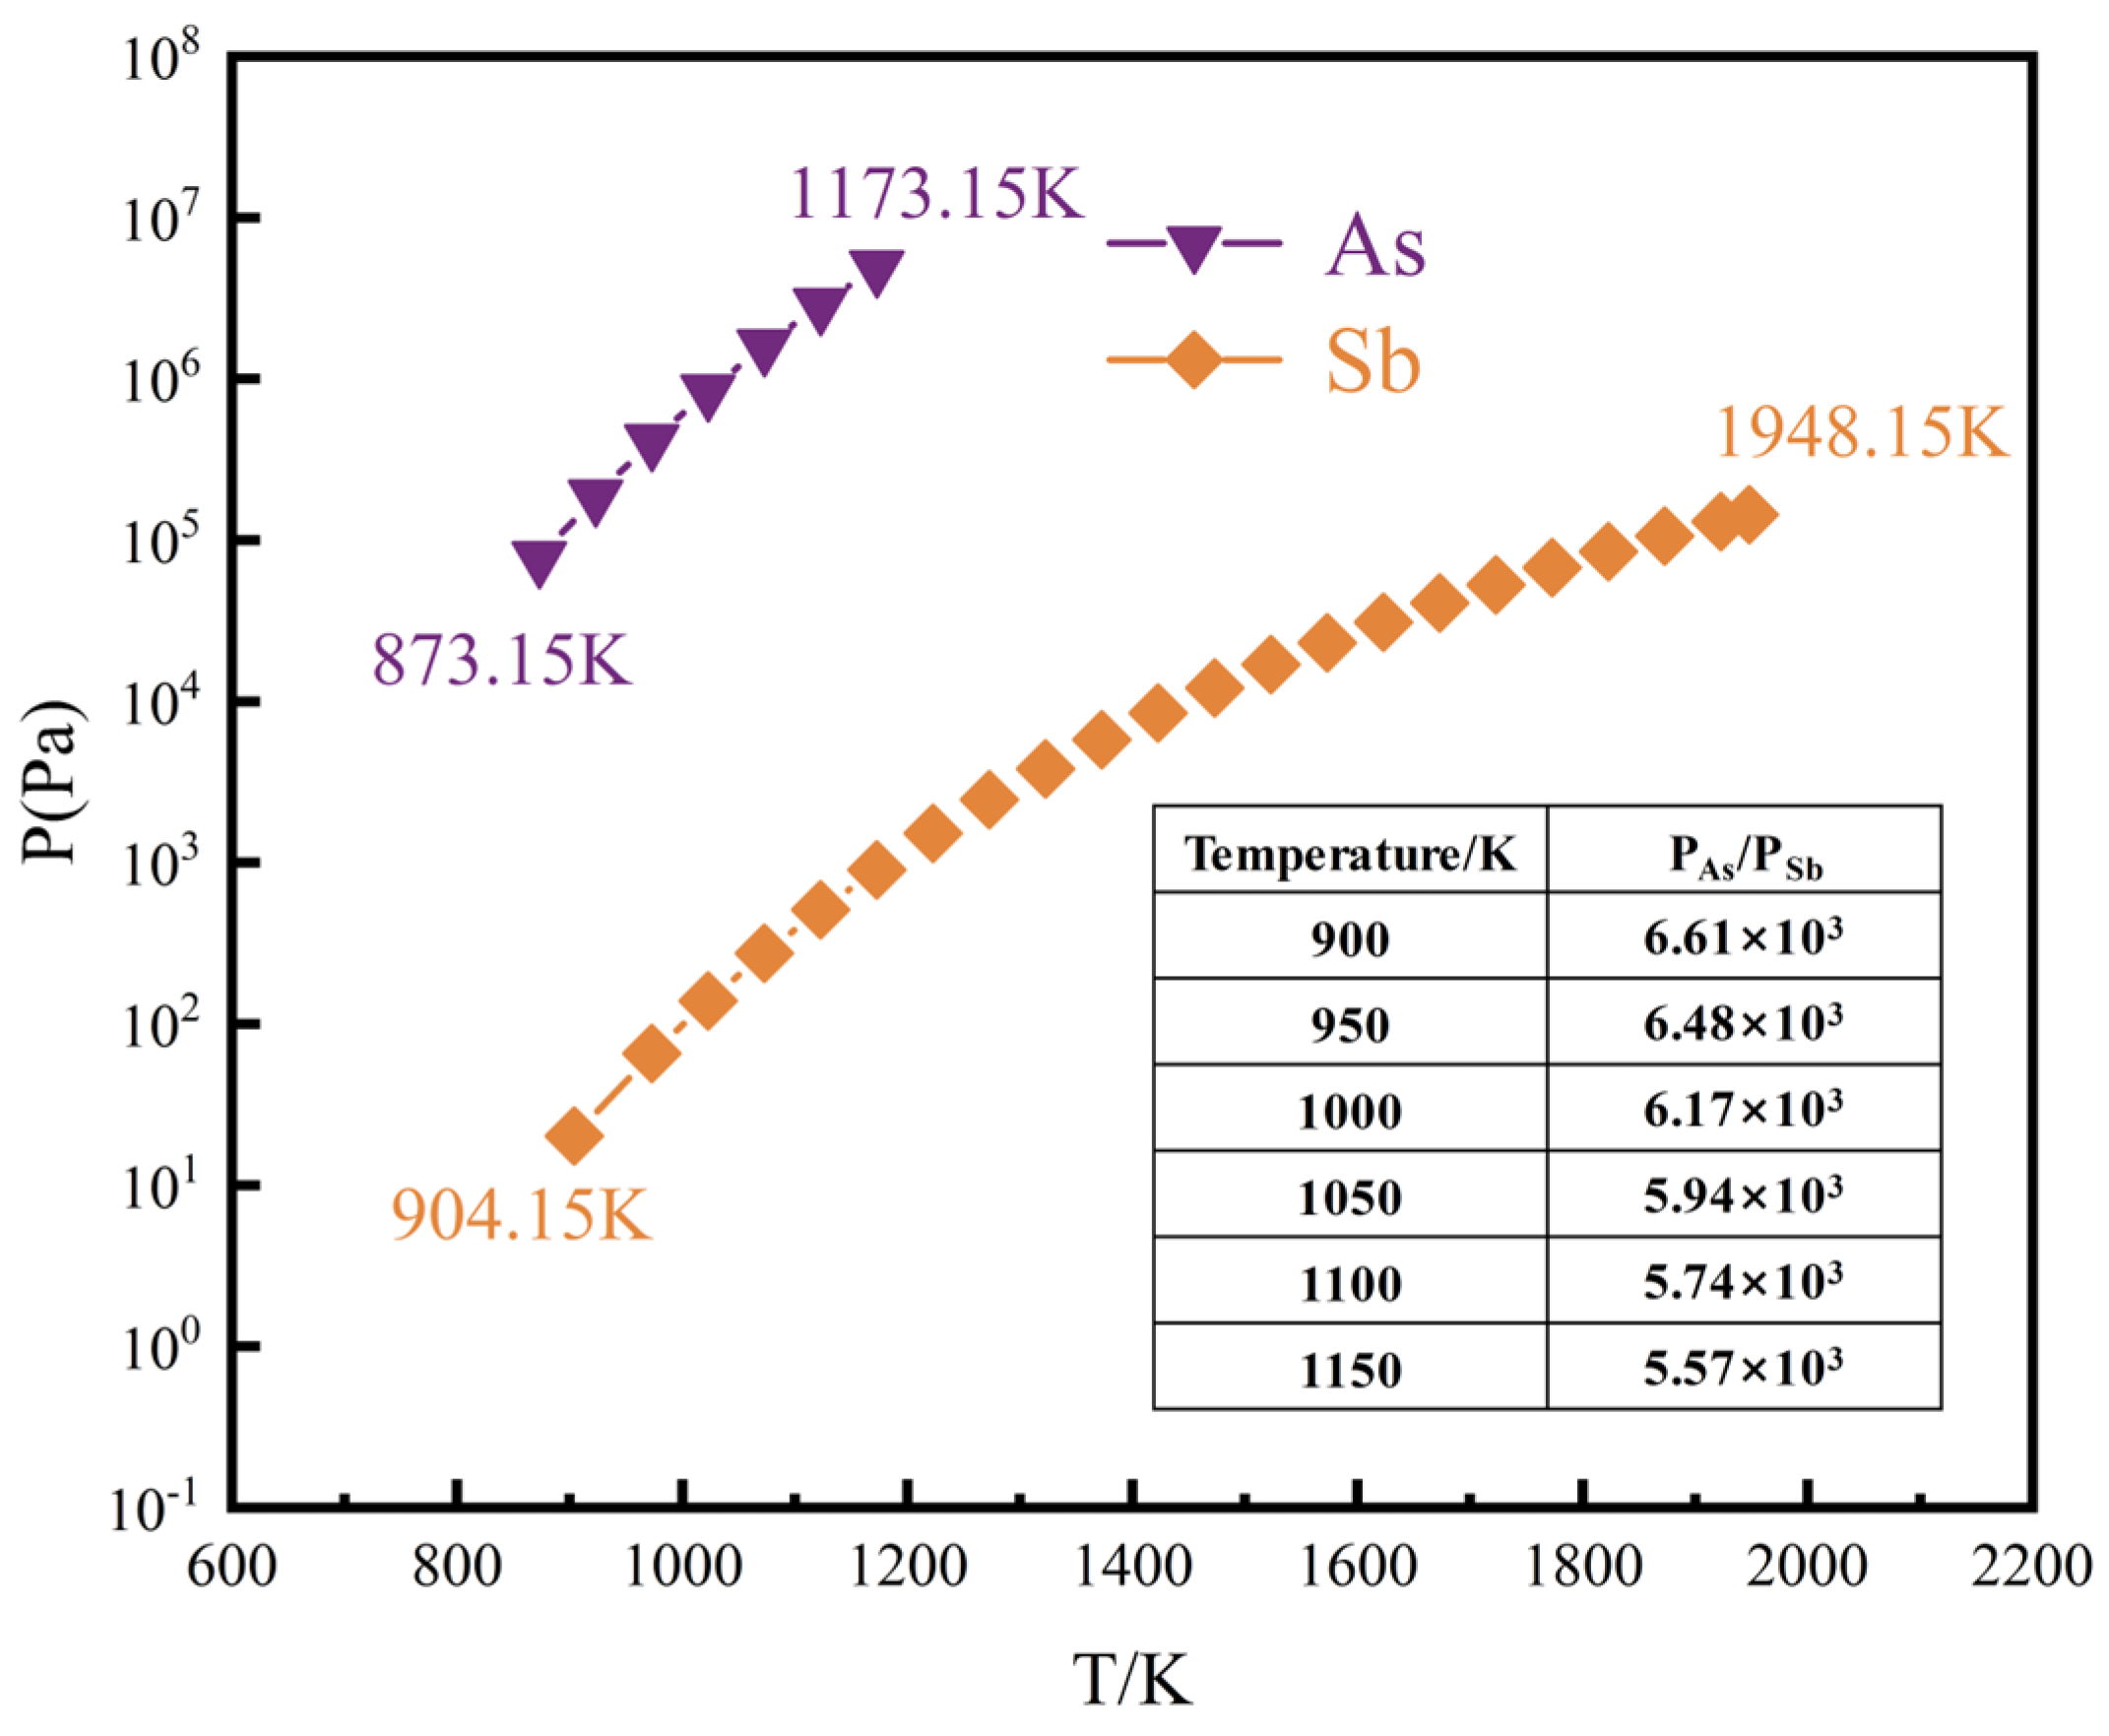
3.1.1. Saturated Vapour Pressure

There is a significant difference in the saturated vapour pressures of As and Sb, as shown Figure 3. The reaction temperature ranges for As and Sb were 873.15–1173.15 K and 904.15–1948.15 K, respectively, and the vapour pressures all increased with increasing temperature. The PAs/PSb ratio was 6.61 × 10³ at 900 K and 5.57 × 10³ when the temperature was increased to 1150 K, indicating that the saturation vapour pressure of Sb increased significantly, but the saturation vapour pressure of As was three orders of magnitude larger than that of Sb at the same temperature, and the volatility of As was much larger than Sb. Based on this property, As sublimates into the gas phase and Sb remains in the slag, allowing As and Sb to be separated.

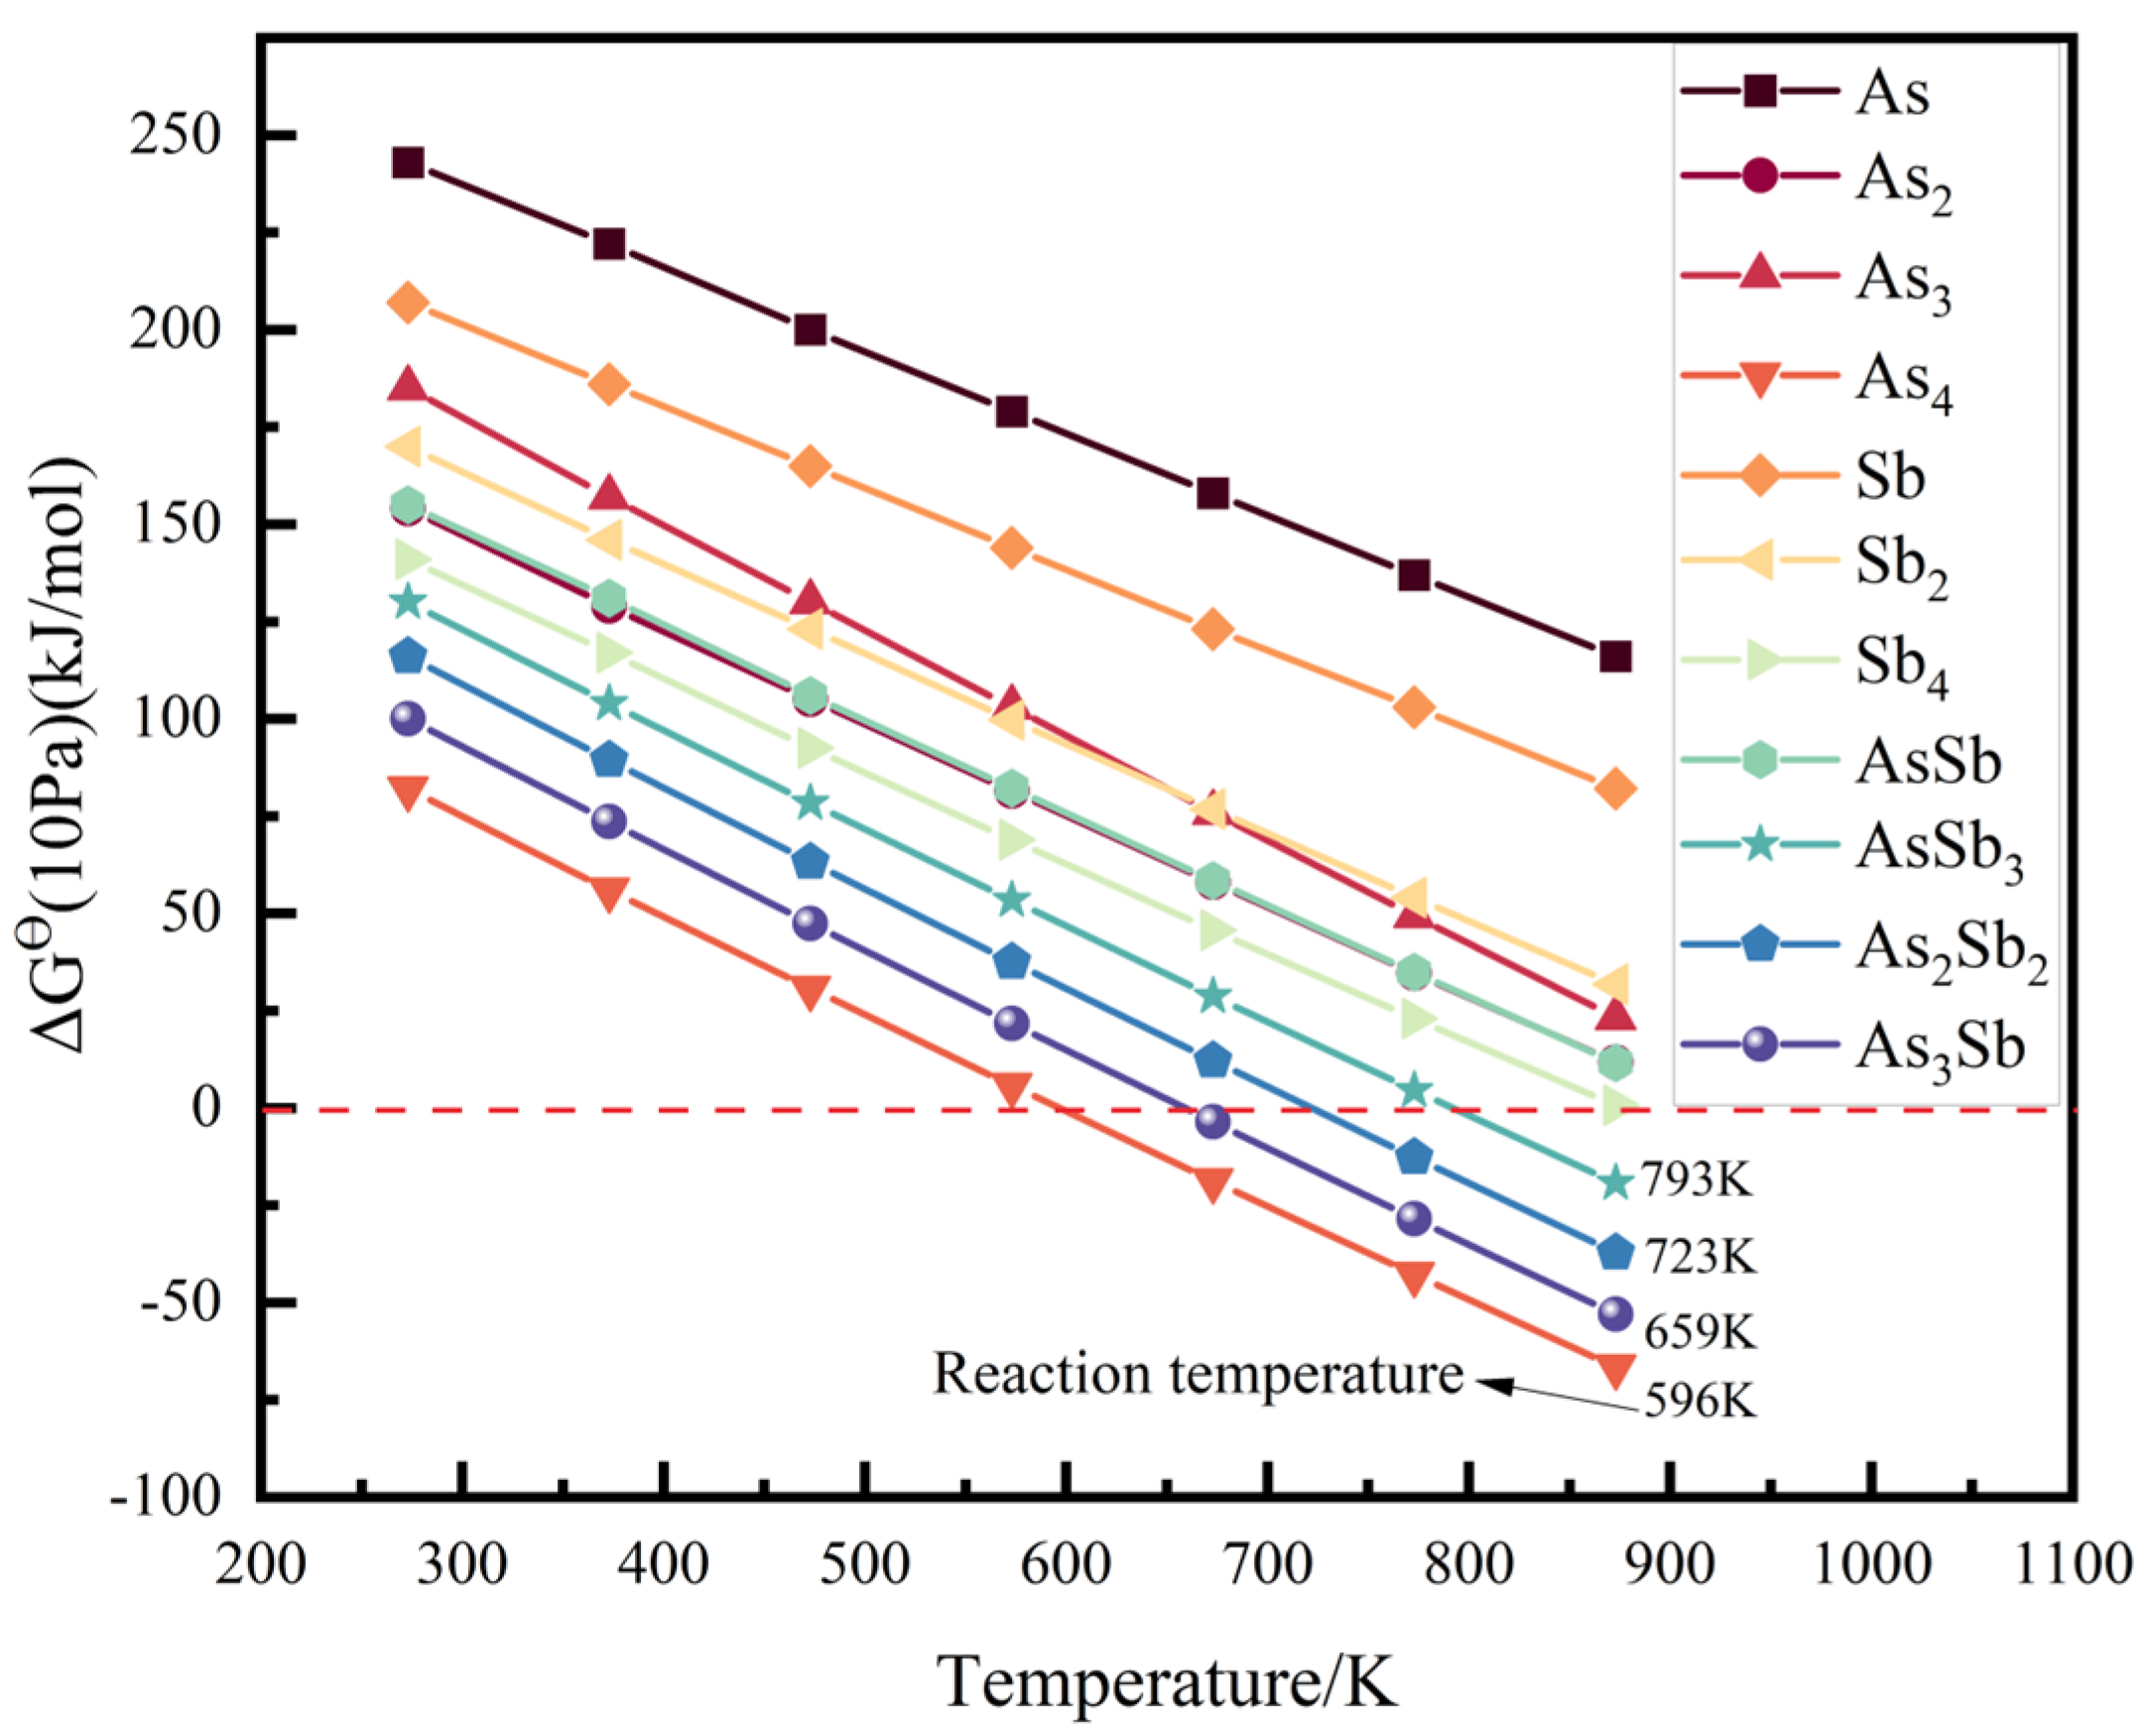
3.1.2. Gibbs Free Energy

As shown in Figure 4, where the red dashed line indicates ΔG = 0, below which the reaction is likely to occur. As and Sb undergo a solid–gas phase transition, with As generating As(g), As2(g), As3(g), and As4(g), Sb generating Sb(g), Sb2(g), and Sb4(g), and As reacting with Sb to form AsSb(g), AsSb3(g), As2Sb2(g), and As3Sb(g). It is shown that Sb is not volatile. However, it can react with As to form compounds. As4(g), AsSb3(g), As2Sb2(g), and As3Sb(g) are produced at a pressure of 10 Pa and temperatures of 273-873 K, corresponding to production temperatures of 596 K, 659 K, 723 K, and 793 K. The other compounds are not produced. Theoretically, the formation of As-Sb compounds can be inhibited by controlling the pressure and heating temperature to reduce the entry of Sb into the gas phase and achieve the removal of Sb from crude arsenic.

3.2. Results of Dynamic Calculations

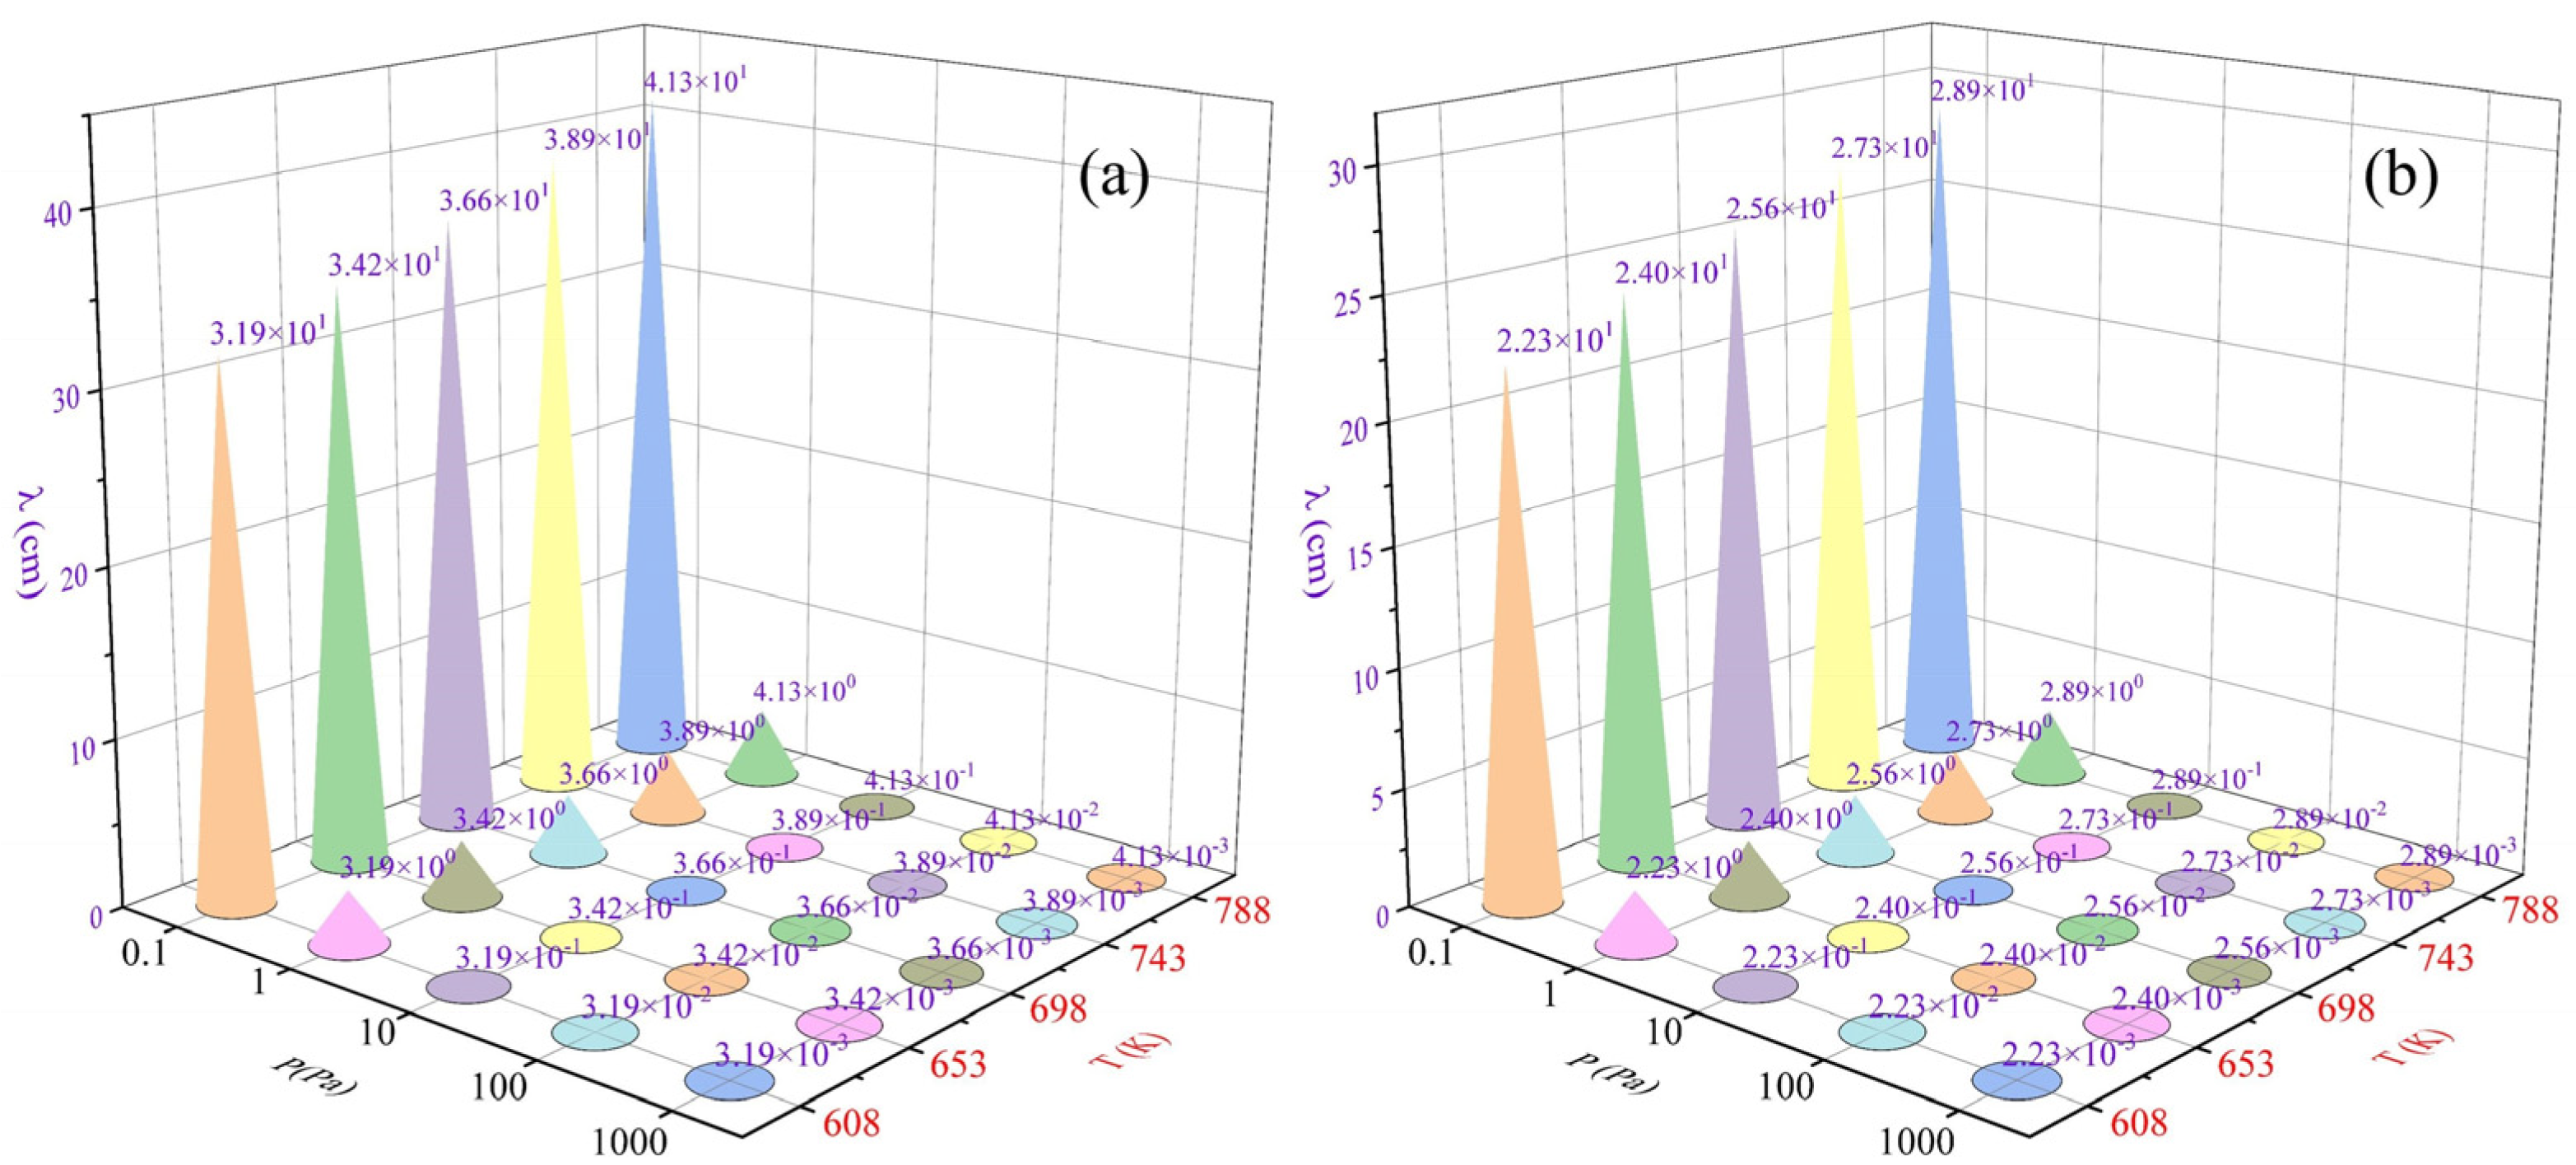
3.2.1. Mean Free Range of As4 and Sb4

As4 and Sb4 clusters are the predominant forms present in the gas phase and the ground states, and are all orthotetrahedral with diameters of 2.435 Å [6] and 2.91 Å [15], respectively, which are banded to obtain the mean free ranges at different temperatures and pressures, as shown in Figure 5. Taking As4 at 0.1 Pa condition as an example, the free range is 31.9 cm and 41.3 cm at 608 K and 788 K, respectively, from which it can be seen that the change of free range with temperature is not obvious; the free range of As4 at 698 K is 36.6 cm and 0.366 cm at 0.1 Pa and 10 Pa, respectively, showing that the pressure significantly affects the molecular mean free range, and the free range shows an exponential decrease (Figure 5a). Sb4 clusters show the same pattern (Figure 5b), and the free range of Sb4 is 0.256 cm at 698 K and 10 Pa, which is different from As4. Based on this, an open condensation disc was provided in the condensation zone, the As vapour moves upward in the condensation zone in an S-shape, and the collision between Sb-containing clusters and the condensation disc and condensation wall surface is increased, which reduces the Sb-containing clusters from diffusing upward into the product zone and allows them to condense at the proximal end of the heating zone.

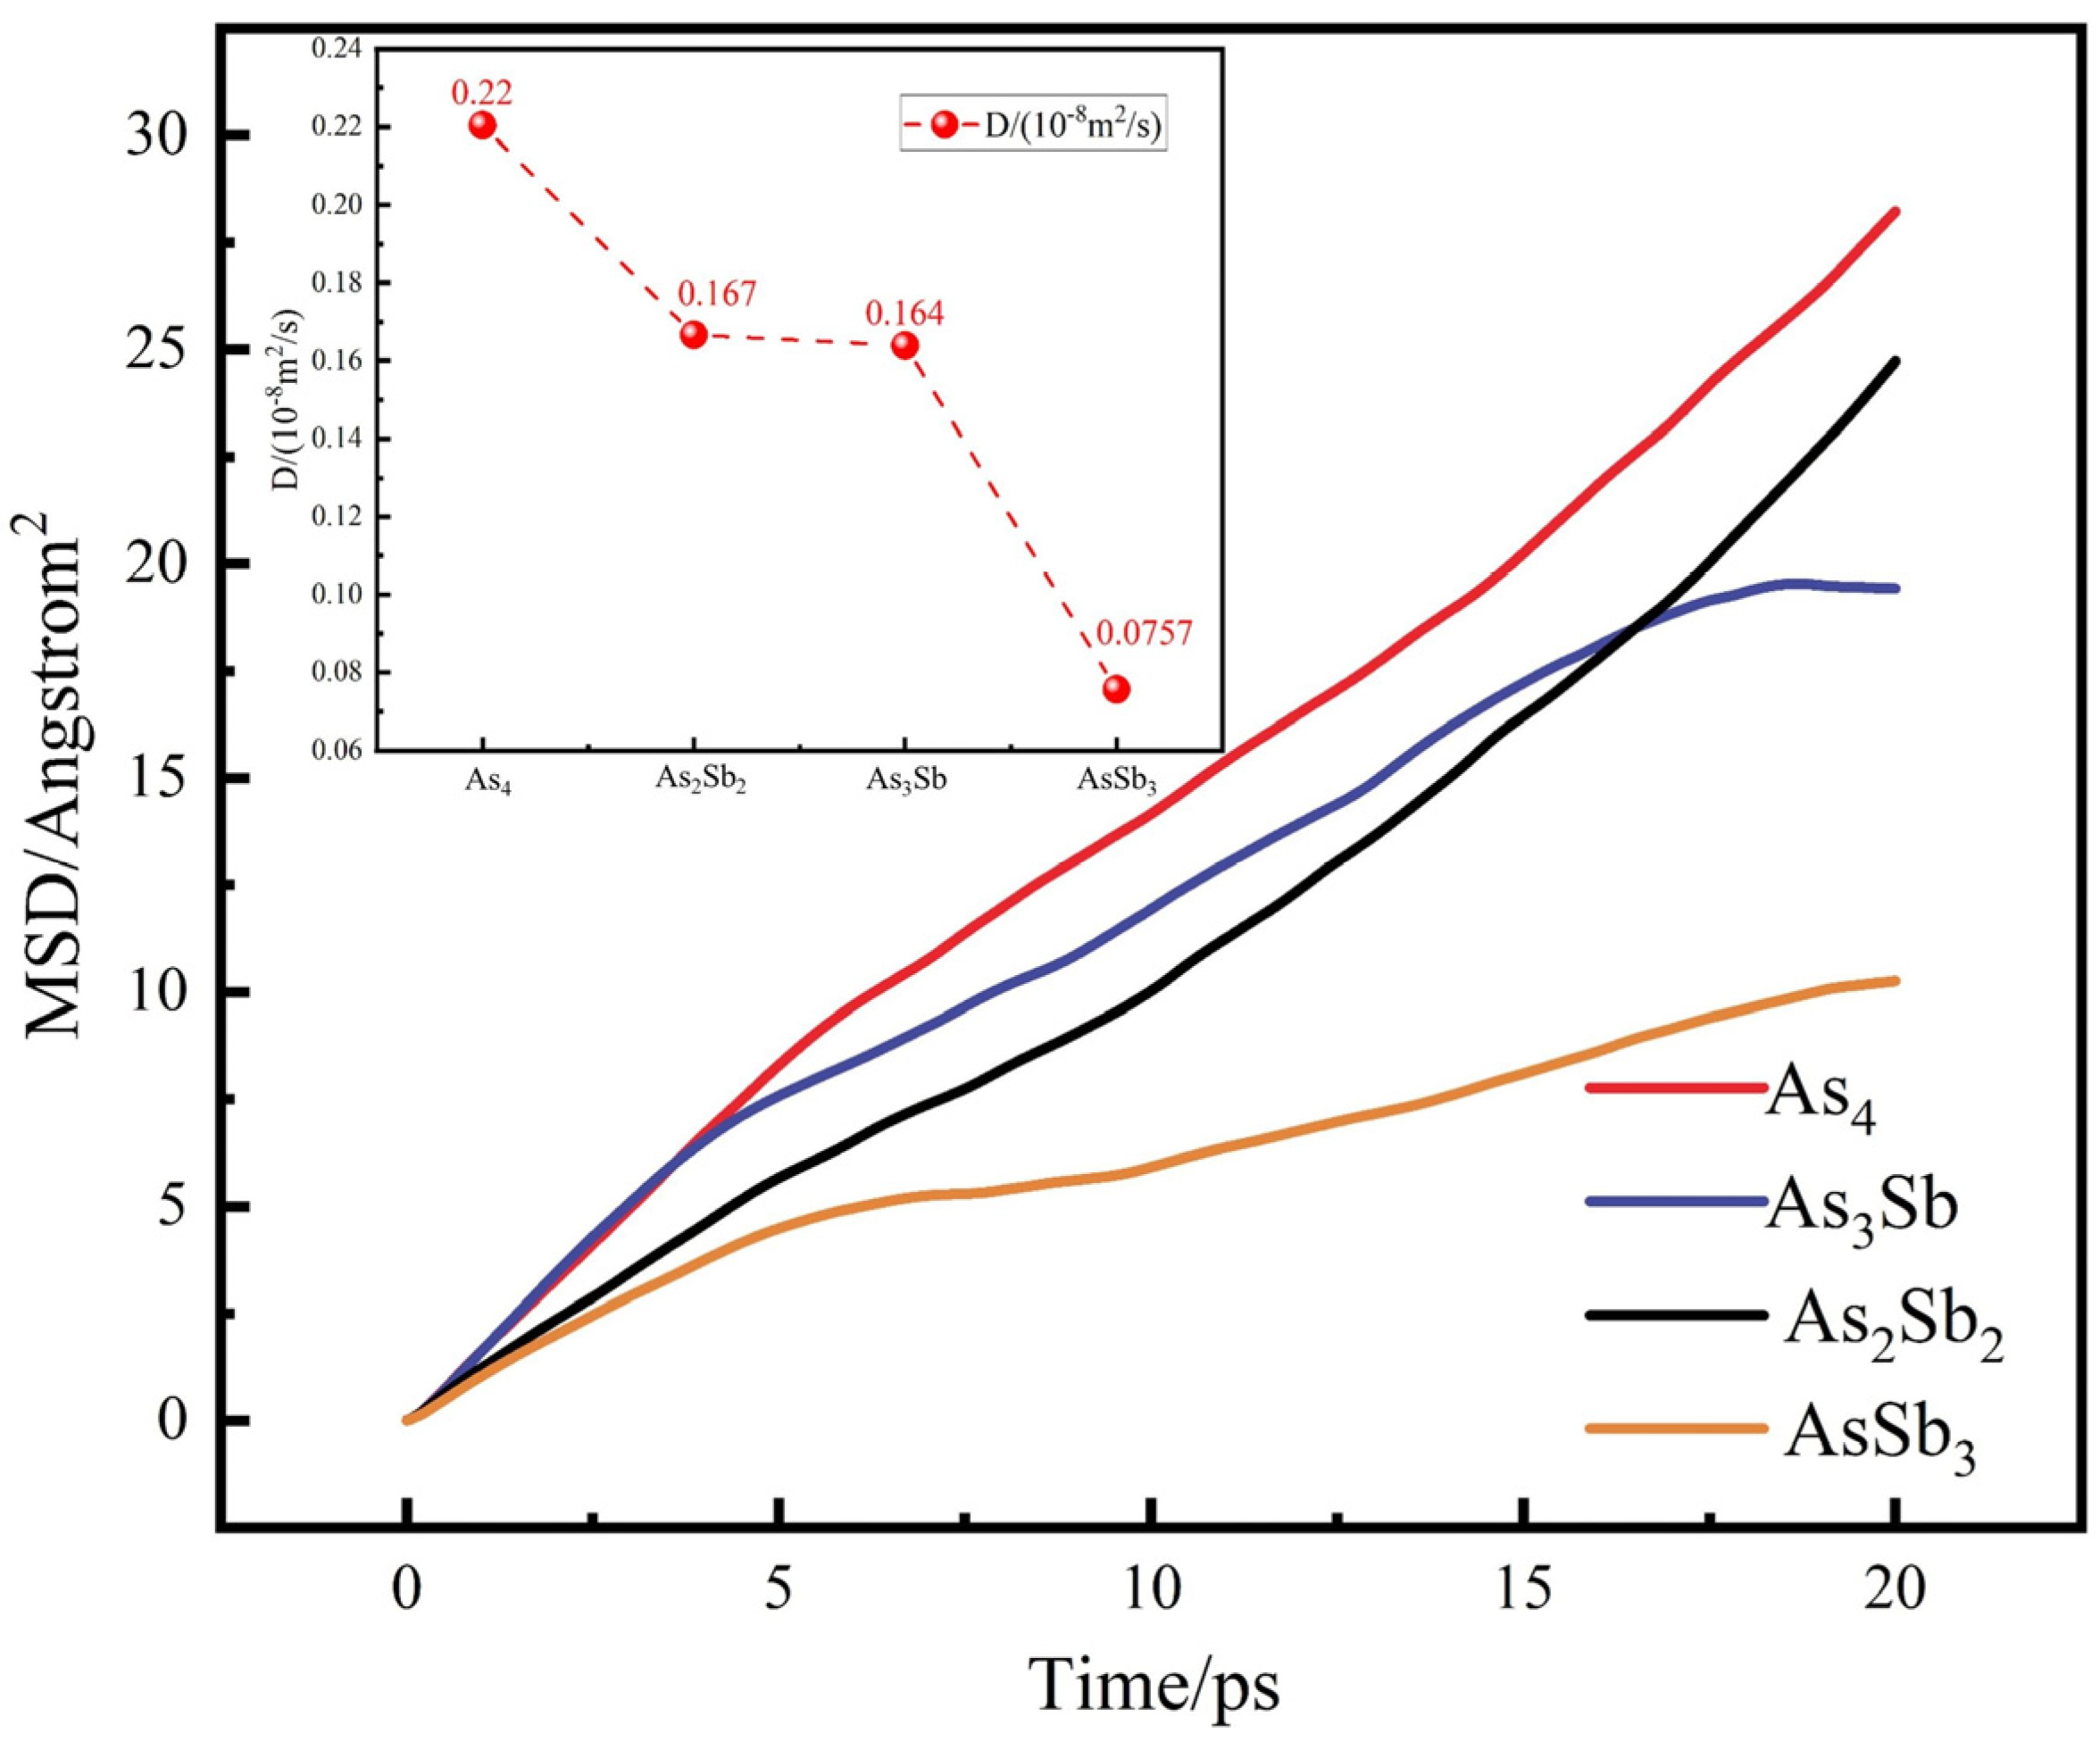
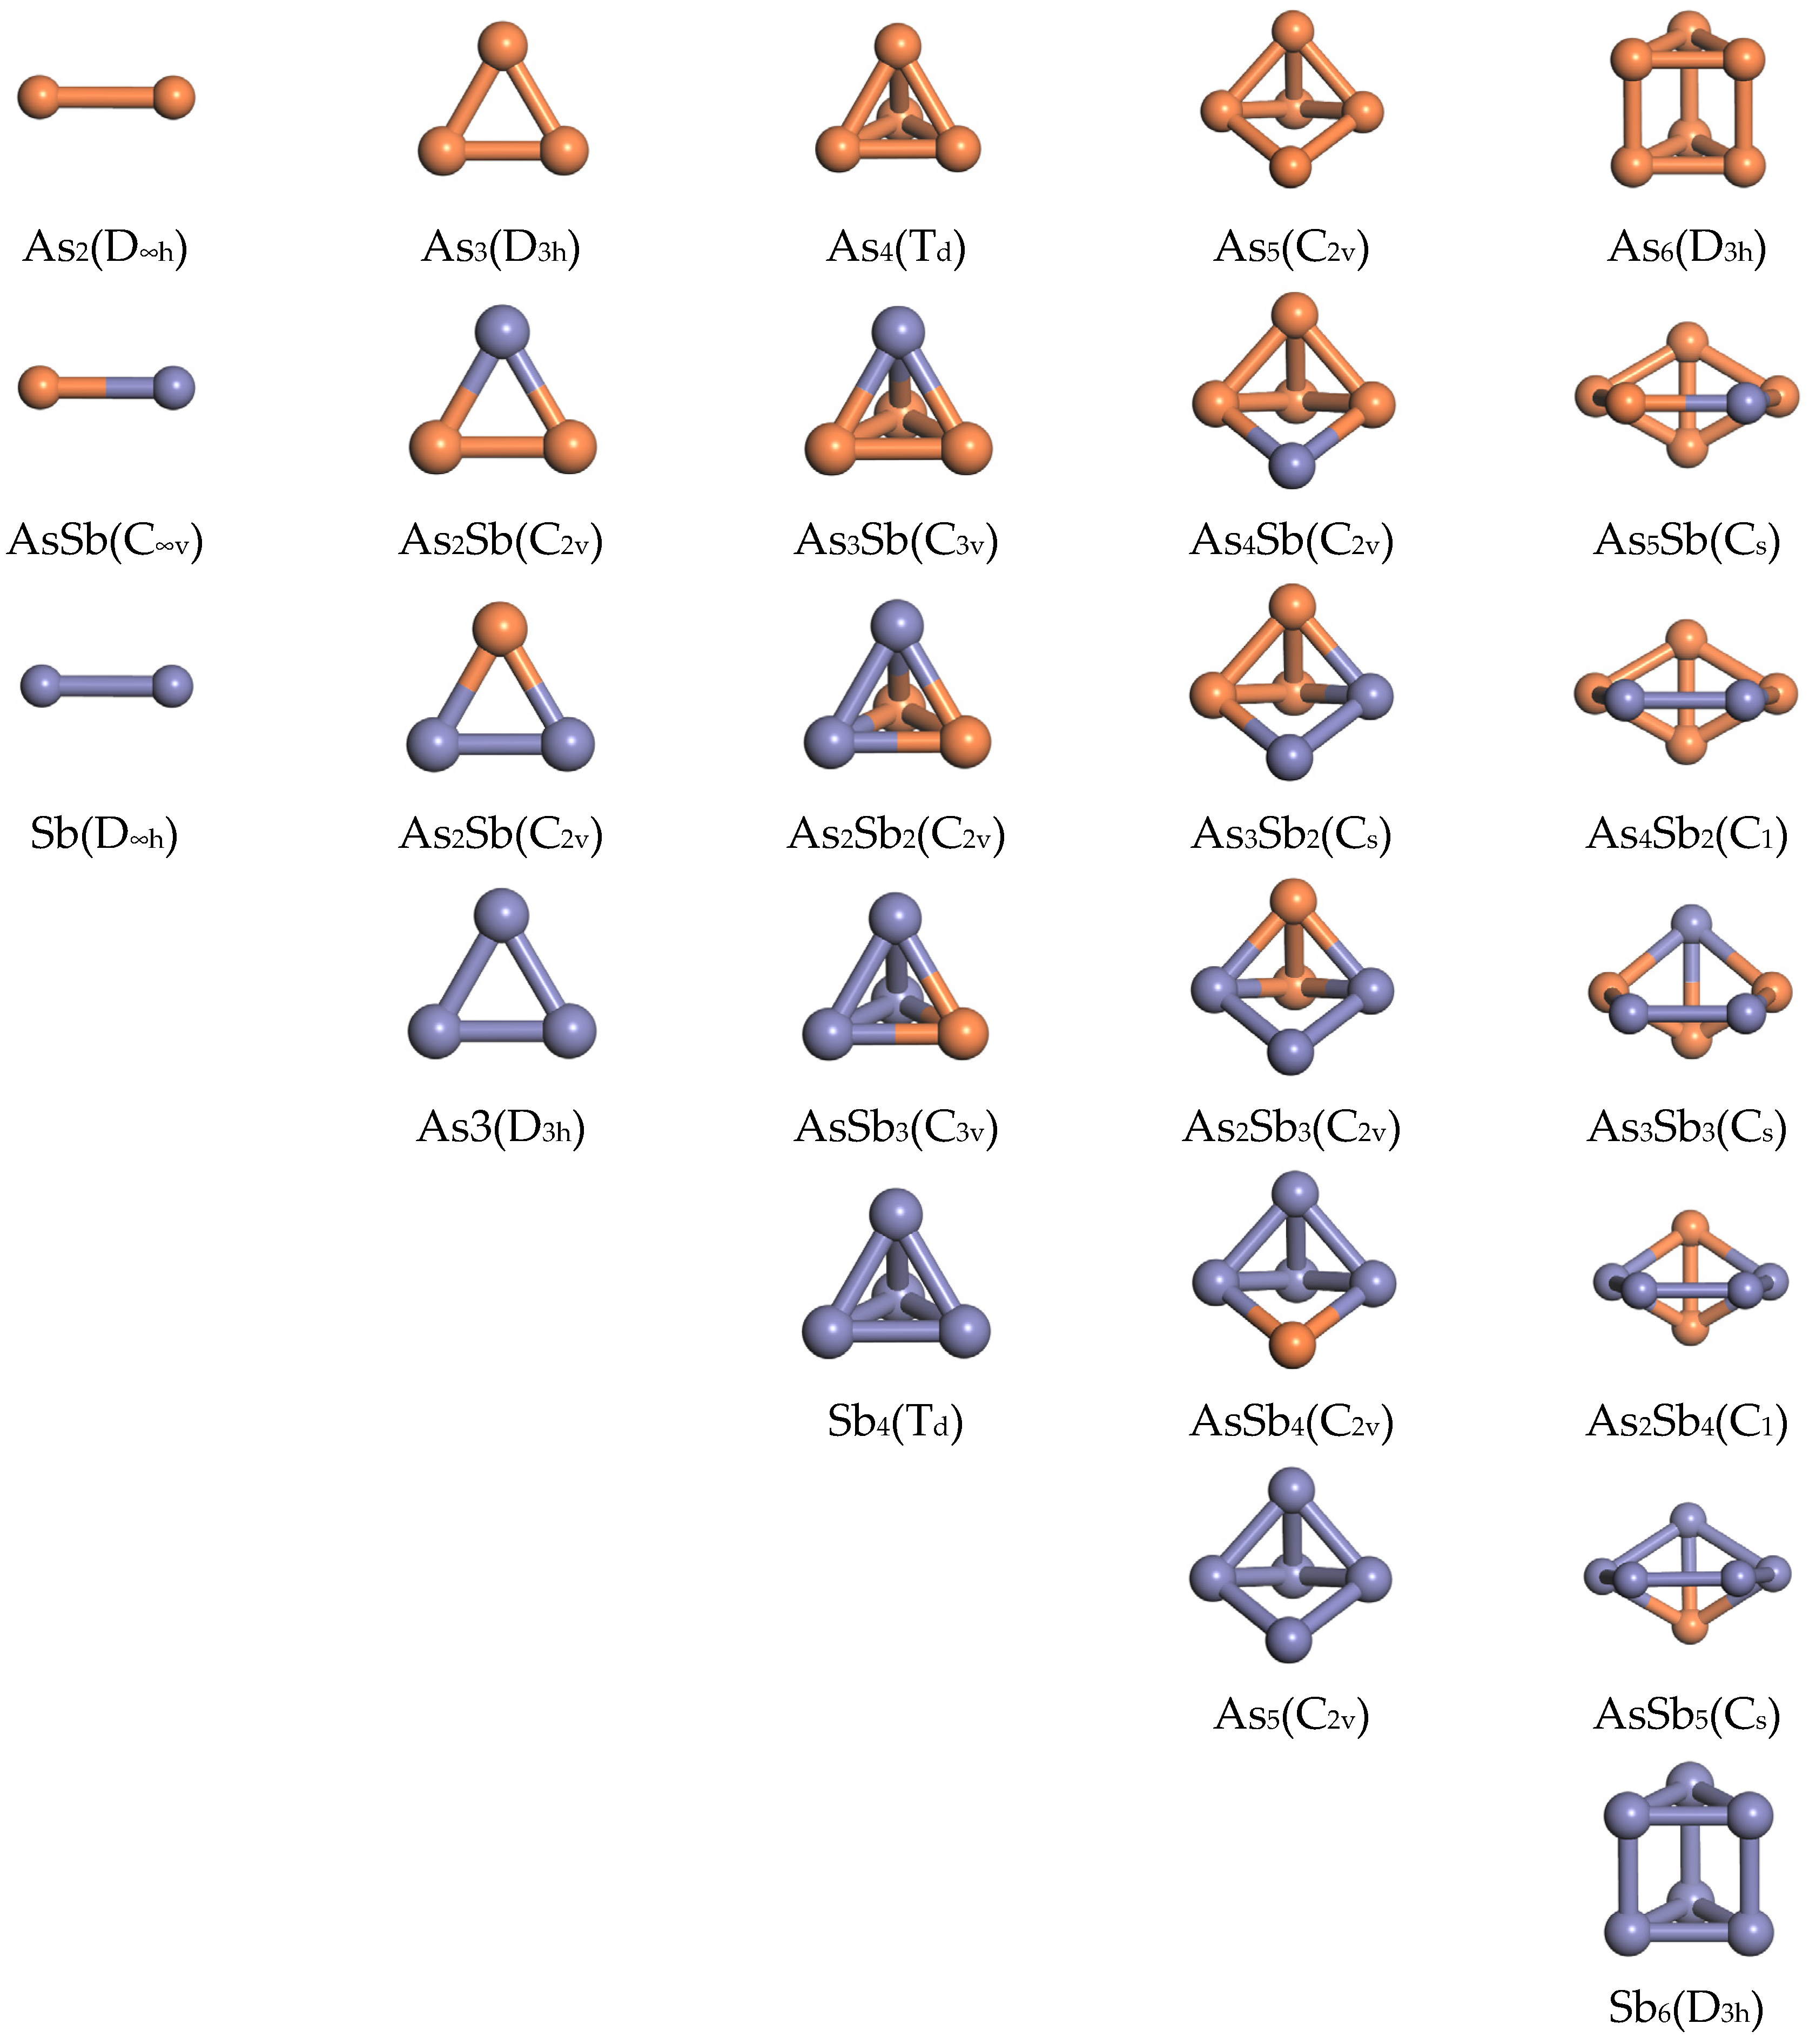
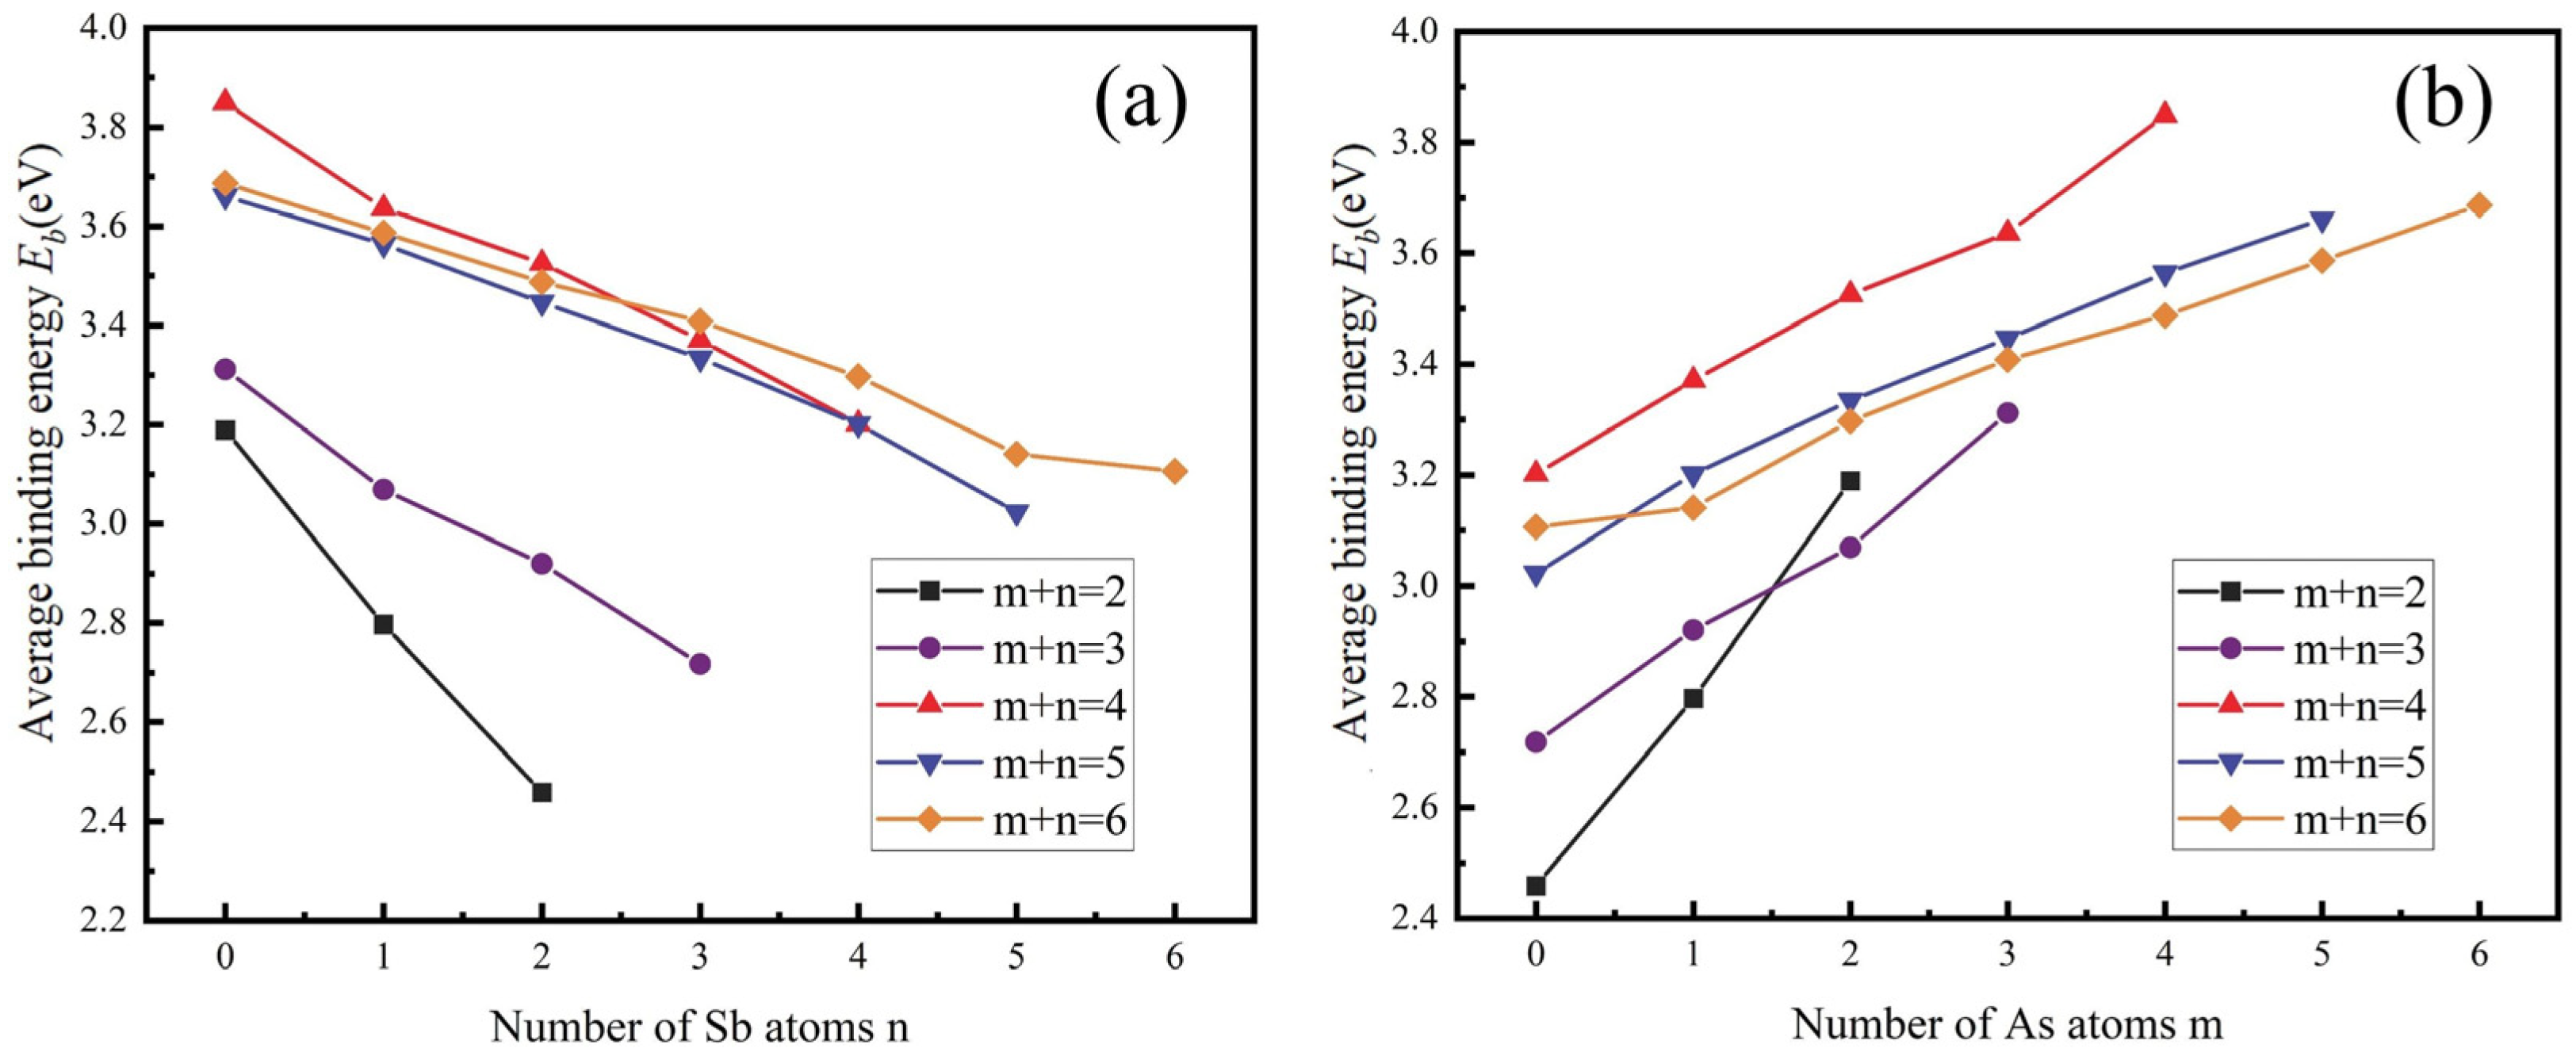
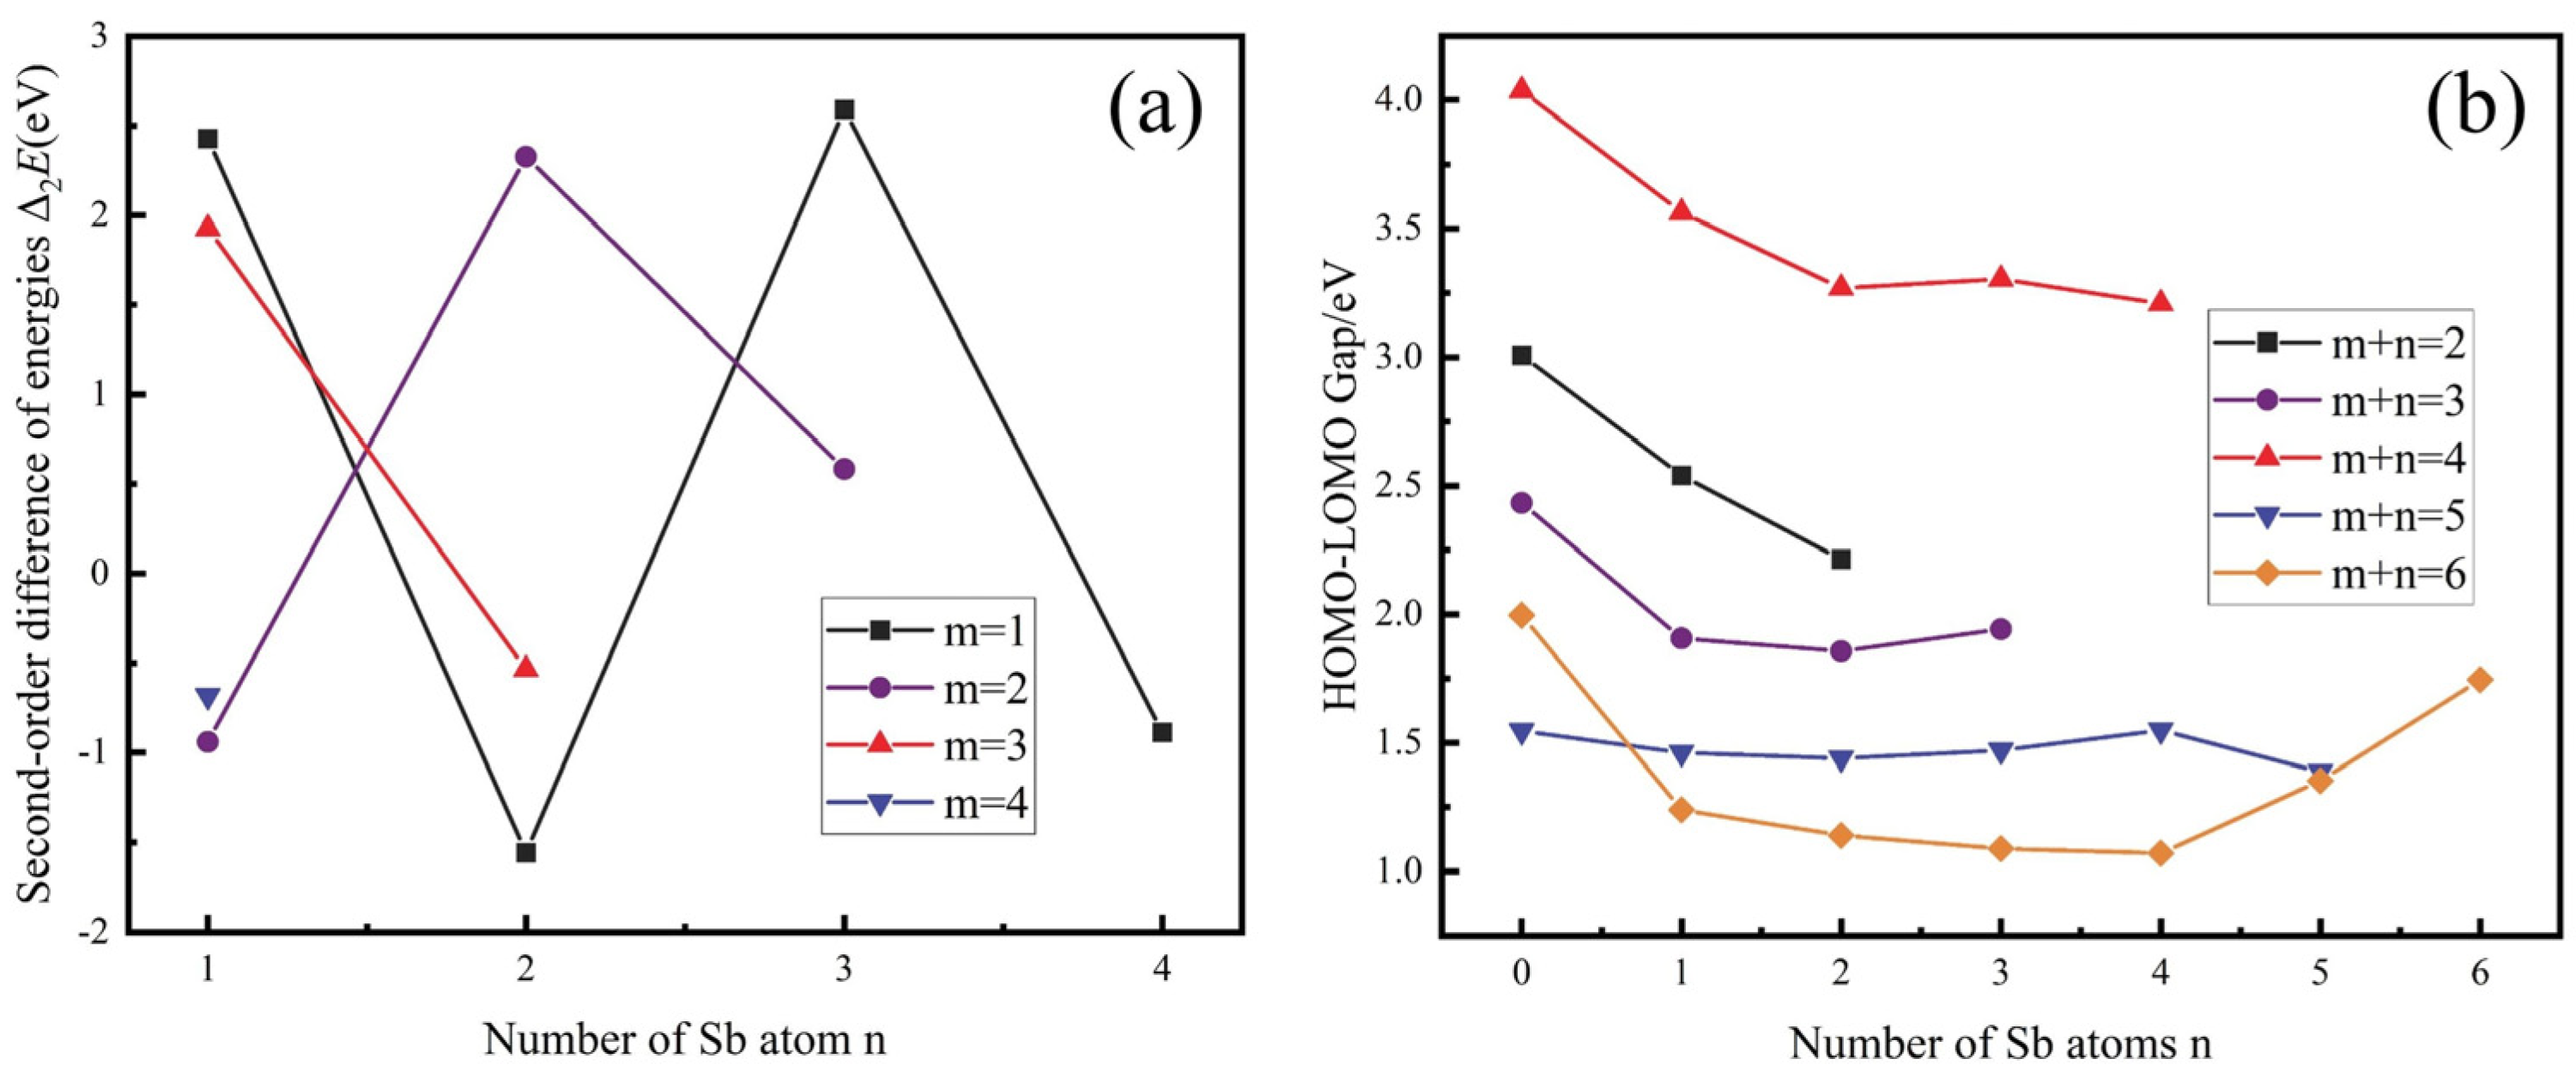
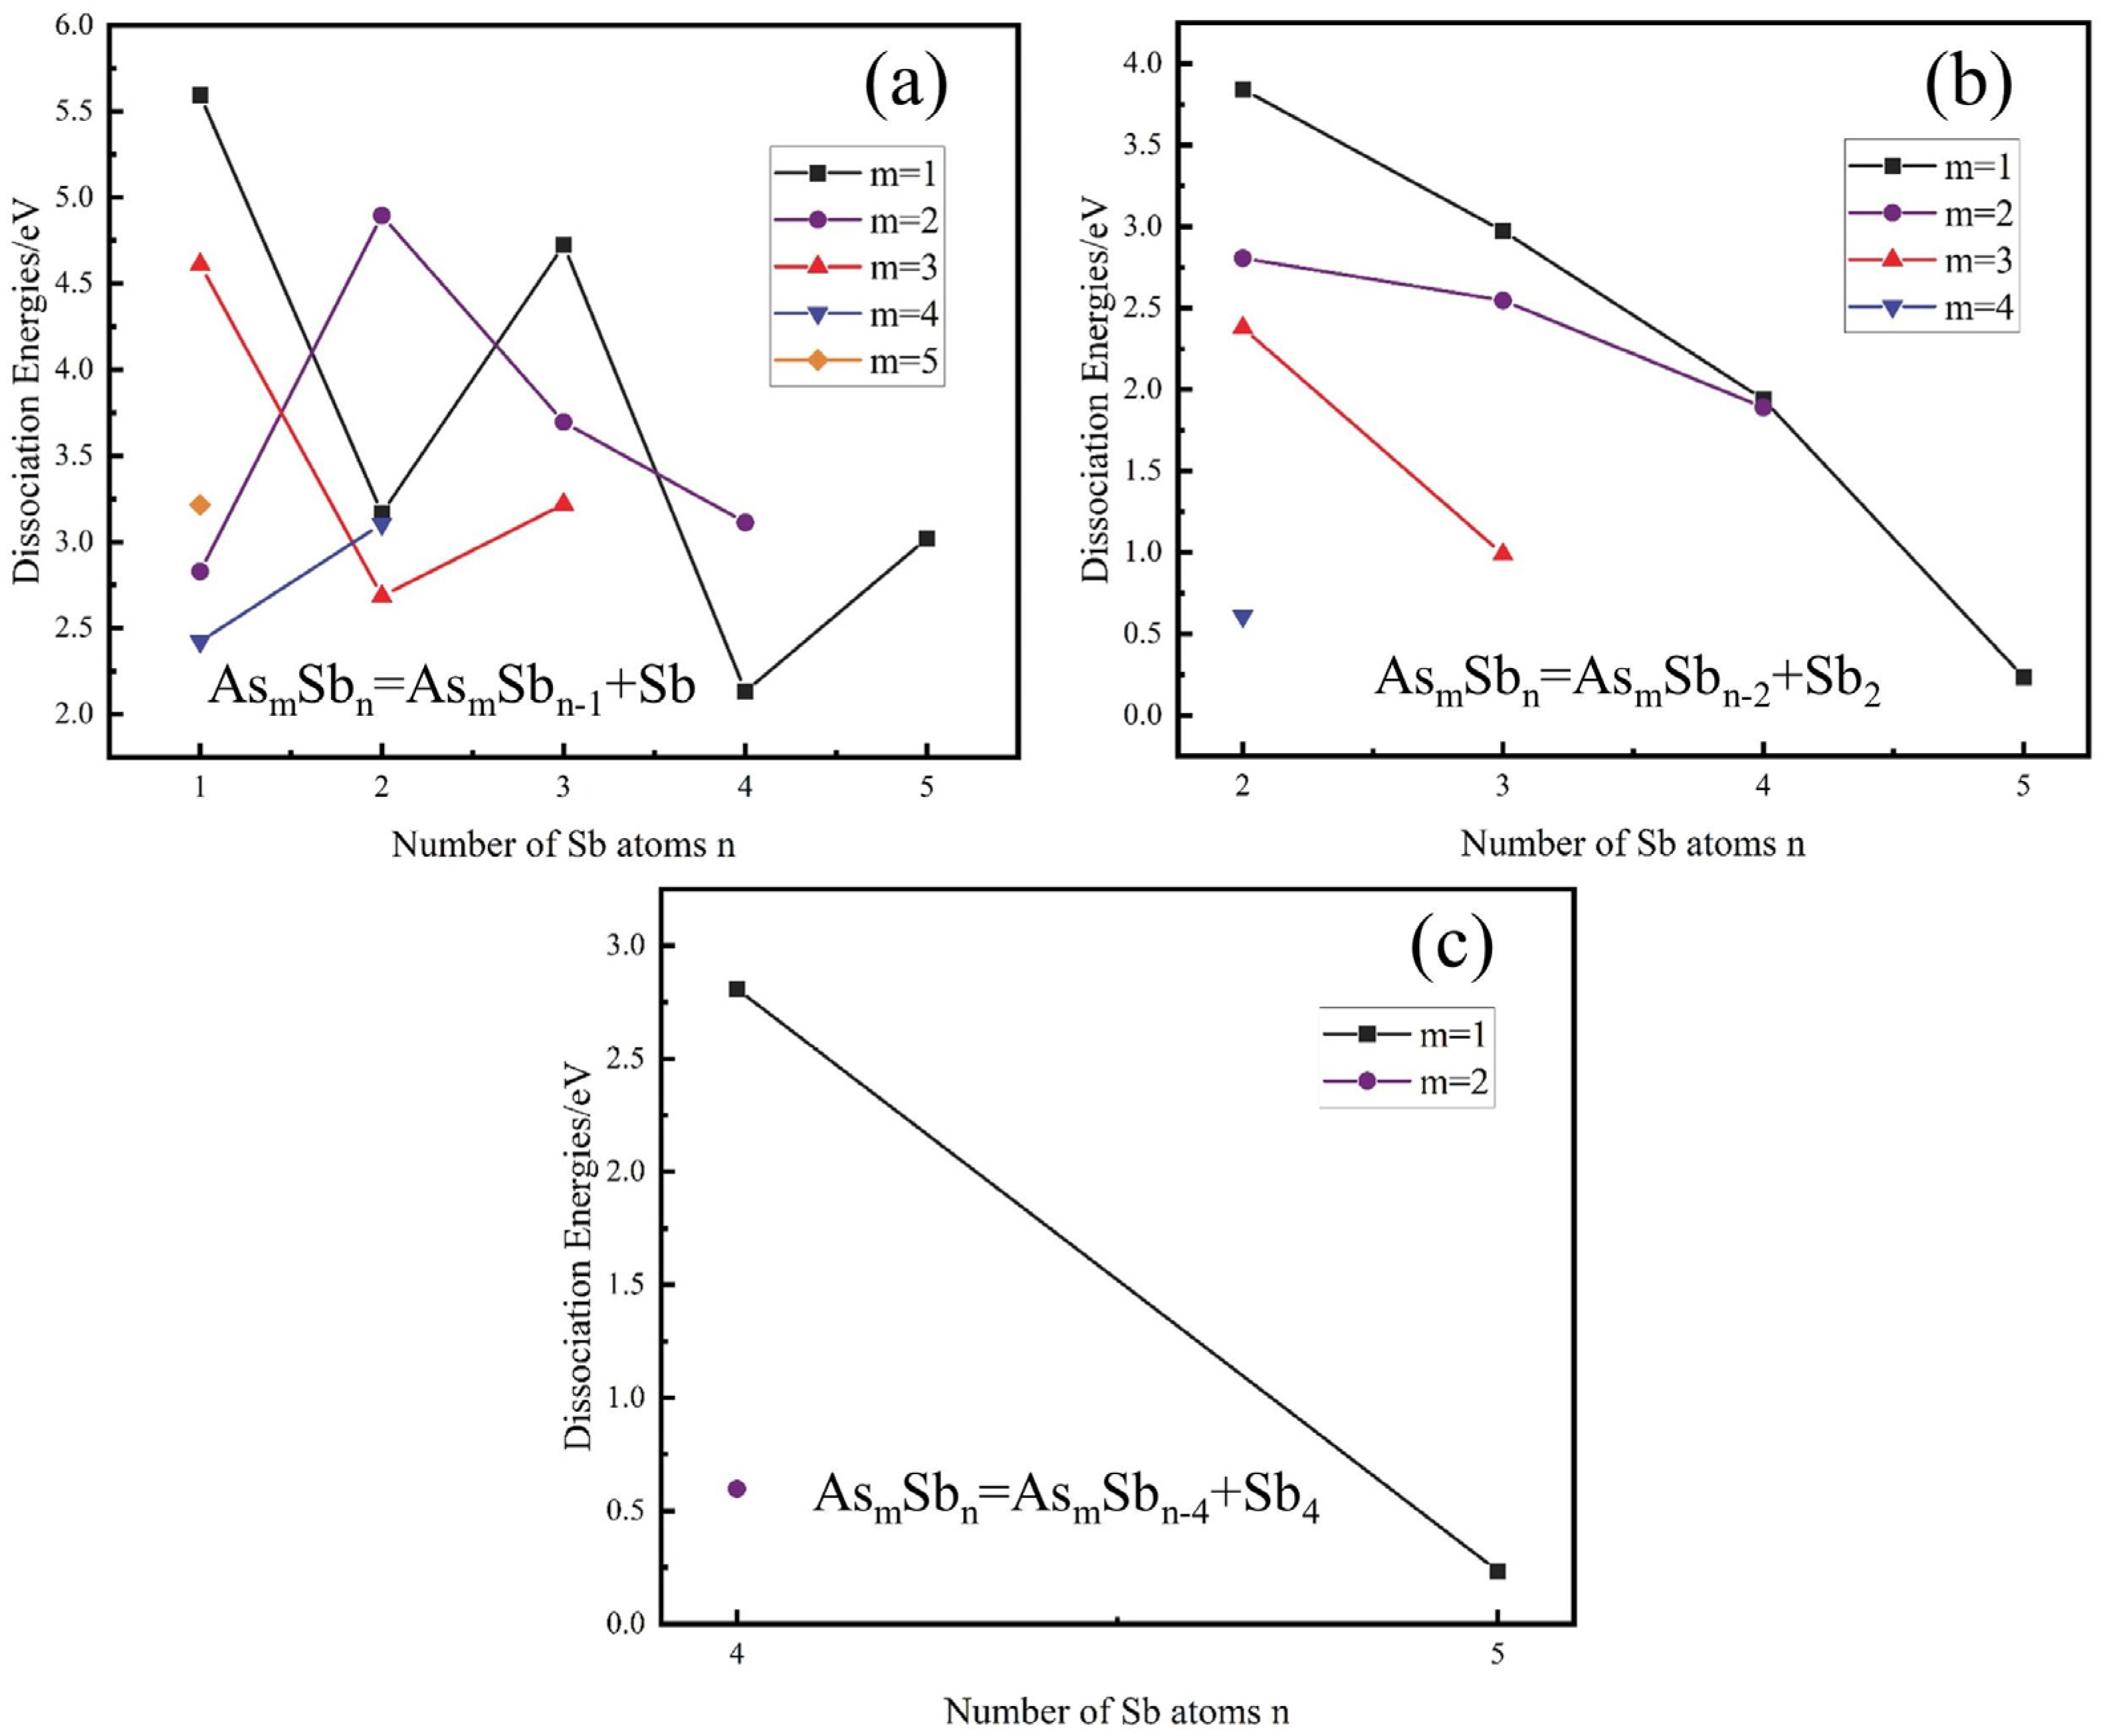
3.2.2. Results of Molecular Dynamics Calculations

To assess the validity of the chosen method, the bond lengths, average binding energies, and vibrational frequencies of As2 and Sb2 were calculated and compared with previous theoretical and experimental values, as shown in Table 3. The bond length of As2, calculated using the PBE method, is confidently determined to be 2.142 Å. This value falls within the theoretical range of 2.10–2.164 Å and is in agreement with the experimental value of 2.103 Å. The average bond energy of 3.96 eV is close to the theoretical value of 4.12–4.32 eV and is the same as the experimental value, and the frequency of 429.3 cm−1 is in good agreement with the theoretical value of 428–430 cm−1 and the experimental value of 429.55 cm−1. The calculated bond length of Sb2, 2.549 Å, is basically close to the theoretical value of 2.476–2.550 Å and the experimental value of 2.340 Å. The average bond energy, 3.01 eV, is close to the theoretical and experimental values of 3.10 and 3.18 eV, and the frequency, 276.0 cm−1, agrees with the theoretical value of 270.0–280.0 cm−1 and the experimental value of 270 cm−1. Overall, the calculated values are in good agreement with the literature, and the subsequent simulation results further validate the accuracy of the molecular dynamics simulations. Based on the above data considerations, we chose the PBE method for the calculation of AsmSbn (m + n ≤ 6) clusters.
Table 3. Bond lengths (Å), average binding energies (eV), and vibrational frequencies (cm−1) of As2 and Sb2.
This WorkTheoretical ValuesExperimental Values
As2Bond length (Å)2.1422.164 [16]2.12 [17]2.10 [18]2.103 [19]
Average binding energies (eV)3.964.12 [6]4.21 [20]4.32 [21]3.96 [22]
Vibrational frequencies (cm−1)429.3430 [23]429.5 [24]428 [24]429.55 [20]
Sb2Bond length (Å)2.5492.550 [25]2.490 [13]2.476 [13]2.340 [25]
Average binding energies (eV)3.013.18 [25]1.99 [13]3.10 [8]3.09 [8]
Vibrational frequencies (cm−1)276.0276.0 [25]280.0 [8]270.0 [26]270.0 [25]
The ground state structure and symmetry of the AsmSbn (m + n ≤ 6) cluster are shown in Figure 6. The optimised AsmSbn (m + n ≤ 2) clusters obtained have an AsSb bond length of 2.349 Å, which is between the bond length of As2 of 2.142 Å and the bond length of Sb2 of 2.549 Å. The binding energy of As-Sb, 1.71 eV/atom, is also between the binding energies of As2 (1.98 eV/atom) and Sb2 (1.590 eV/atom). This indicates that the force between As-As and As-Sb is stronger than that between Sb-Sb. AsSb has C∞v symmetry, and both As2 and Sb2 symmetries are in the D∞h point group.
In the AsmSbn (m + n = 3) cluster, the ground state structures are all triangular, with As3 and Sb3 being orthorhombic triangles with bond lengths of 2.411 A and 2.819 Å, respectively. As2Sb and AsSb2 can be regarded as isosceles triangular structures with C2v symmetry, obtained by substitution of As atoms in As3 clusters with D3h symmetry by Sb one by one. The bond lengths in the basal structure As2Sb are 2.372 Å for As-As and 2.638 Å for As-Sb, and the bond lengths in the equilibrium structure AsSb2 are 2.834 Å for Sb-Sb and 2.622 Å for As-Sb.
In the AsmSbn (m + n = 4) cluster, the ground state structures of As4 and Sb4 have Td symmetry and are both orthotetrahedral, with an As4 bond length of 2.495 Å and a Sb4 bond length of 2.909 Å. The most stable structures of As3Sb, As2Sb2, and AsSb3 are the tetrahedral structures formed by substitution of Sb atoms for As at any position in As4, demonstrating that tetrahedra have the lowest energy. Both As3Sb and AsSb3 have C3v symmetry, and As2Sb2 has C2v symmetry.
In the AsmSbn (m + n = 5) clusters, all ground state structures are steric, and both the As5 and Sb5 clusters have C2v symmetry and are composed of a tetrahedral structure of As4 with a fifth atom added between two adjacent atoms. AsSb4 and As4Sb form a C2v structure by exchanging atoms outside the tetrahedron, As2Sb3 and As3Sb2 by exchanging two of the atoms; As3Sb2 has Cs symmetry and As2Sb3 has C2v symmetry.
In the AsmSbn (m + n = 6) clusters, the As6 and Sb6 clusters are structured as highly symmetric positive triangular prisms, both with D3h symmetry, with As6 edge and prism lengths of 2.524 Å and 2.566 Å, respectively, and Sb6 edge and prism lengths of 2.932 Å and 2.960 Å, respectively. The As5Sb, As4Sb2, As3Sb3, As2Sb4, and AsSb5 cluster structures were obtained by substitution of atoms based on the energetically next lowest structure of As6 (the As5 structure based on the addition of an Sb atom at the front end), with symmetries Cs, C1, Cs, C1, and Cs respectively.
The average binding energy helps to analyse the relative stability of the clusters. For clusters with the same number of atoms, the average binding energy is positively correlated with the number of As atoms m. The larger the value of m, the more stable the cluster is, as shown in Figure 7a. The average binding energy is negatively correlated with the number of Sb atoms n. The larger the value of n, the weaker the stability of the clusters, as shown in Figure 7b. For clusters with different atomic numbers, the average binding energy increases with increasing atomic number, provided that the number of As or Sb atoms is the same, except for the special case of AsmSbn (m + n = 4). Among the pure As clusters, the average binding energy of As4 is the largest, as well as the largest among all clusters of AsmSbn (m + n = 6), suggesting that As4 is the most stable among all clusters, in agreement with the results of previous studies [6,27]. The average binding energy of Sb4 is the largest among pure Sb clusters, indicating that Sb4 is the most stable among pure Sb clusters. The higher average binding energies of the As4, As3Sb, As2Sb2, AsSb3, and Sb4 structures of AsmSbn (m + n = 4) suggest that these clusters are more stable.
The second order energy difference can reflect the stability of the cluster; A high value of the second order energy difference indicates that the cluster is stable. As shown in Figure 8a, the second-order energy differentials of AsmSbn (m + n ≤ 6) clusters show obvious odd–even oscillations, and there are extreme values of the second-order energy differentials of the corresponding clusters at n = 1 and 3, implying that As3Sb, AsSb, AsSb3, As2Sb2, and As2Sb3 clusters are highly stable.
The HOMO-LOMO energy gap reflects the ability of electrons to jump from the highest occupied molecular orbital (HOMO) to the lowest unoccupied molecular orbital (LUMO), and the larger the value, the greater the chemical stability of the cluster. As shown in Figure 8b, the HOMO-LOMO values tend to decrease as the number of Sb atoms n increases. The HOMO-LOMO values decrease with increasing number of atoms, especially for AsmSbn (m + n = 4), while As4, As3Sb, As2Sb2, AsSb3, and Sb4 have the highest HOMO-LOMO values, indicating that these clusters are the most stable.
The splitting energy of the clusters was further investigated, and when the clusters have a larger positive splitting energy, the stability of the clusters is higher, while a lower splitting energy indicates that the clusters are weakly stabilised and prone to dissociation. Three splitting modes were considered: one Sb atom, two Sb atoms, and four Sb atoms in the AsmSbn cluster. The calculated splitting energies are shown in Figure 9.
In Figure 9a, one Sb atom splits from AsmSbn, and the splitting energy exhibits significant parity oscillation behaviour. The large splitting energies of As3Sb, AsSb, AsSb3, As2Sb2, As2Sb3, and As3Sb2 indicate that these clusters are very stable. In Figure 9b, two Sb atoms are split from AsmSbn, and the splitting energy decreases gradually with the increase in Sb atoms, and the AsSb2, AsSb3, AsSb4, As2Sb2, As2Sb3, As2Sb4, and As3Sb2 clusters have high stability. In Figure 9c, the fragmentation channel has four Sb atoms split from AsmSbn, of which AsSb4 has high stability.
In summary, As4 is the most stable structure among the AsmSbn (m + n ≤ 6) clusters, and the As4 structure is the main form of elemental As in the gas phase. To sort out the volatilisation and migration laws of As in the gas phase, and combined with the results of thermodynamic calculations, the diffusion properties of As4, As3Sb, As2Sb2, and AsSb3 stable clusters based on the As4 structure were calculated. From the calculation results in Figure 10, the MSD of the gas phase clusters increases with the prolongation of the simulation time under the temperature condition of 698 K. The MSD and diffusion coefficient of As4 are the largest at the same time, and its diffusion coefficient is 0.22 × 10⁻⁸ m2/s. The larger the diffusion coefficient, the faster the migration speed and the farther the migration distance, which makes As4 separate from As3Sb, As2Sb2, and AsSb3 during the migration process, and low Sb-containing products are obtained in the product zone to realise the removal of Sb.

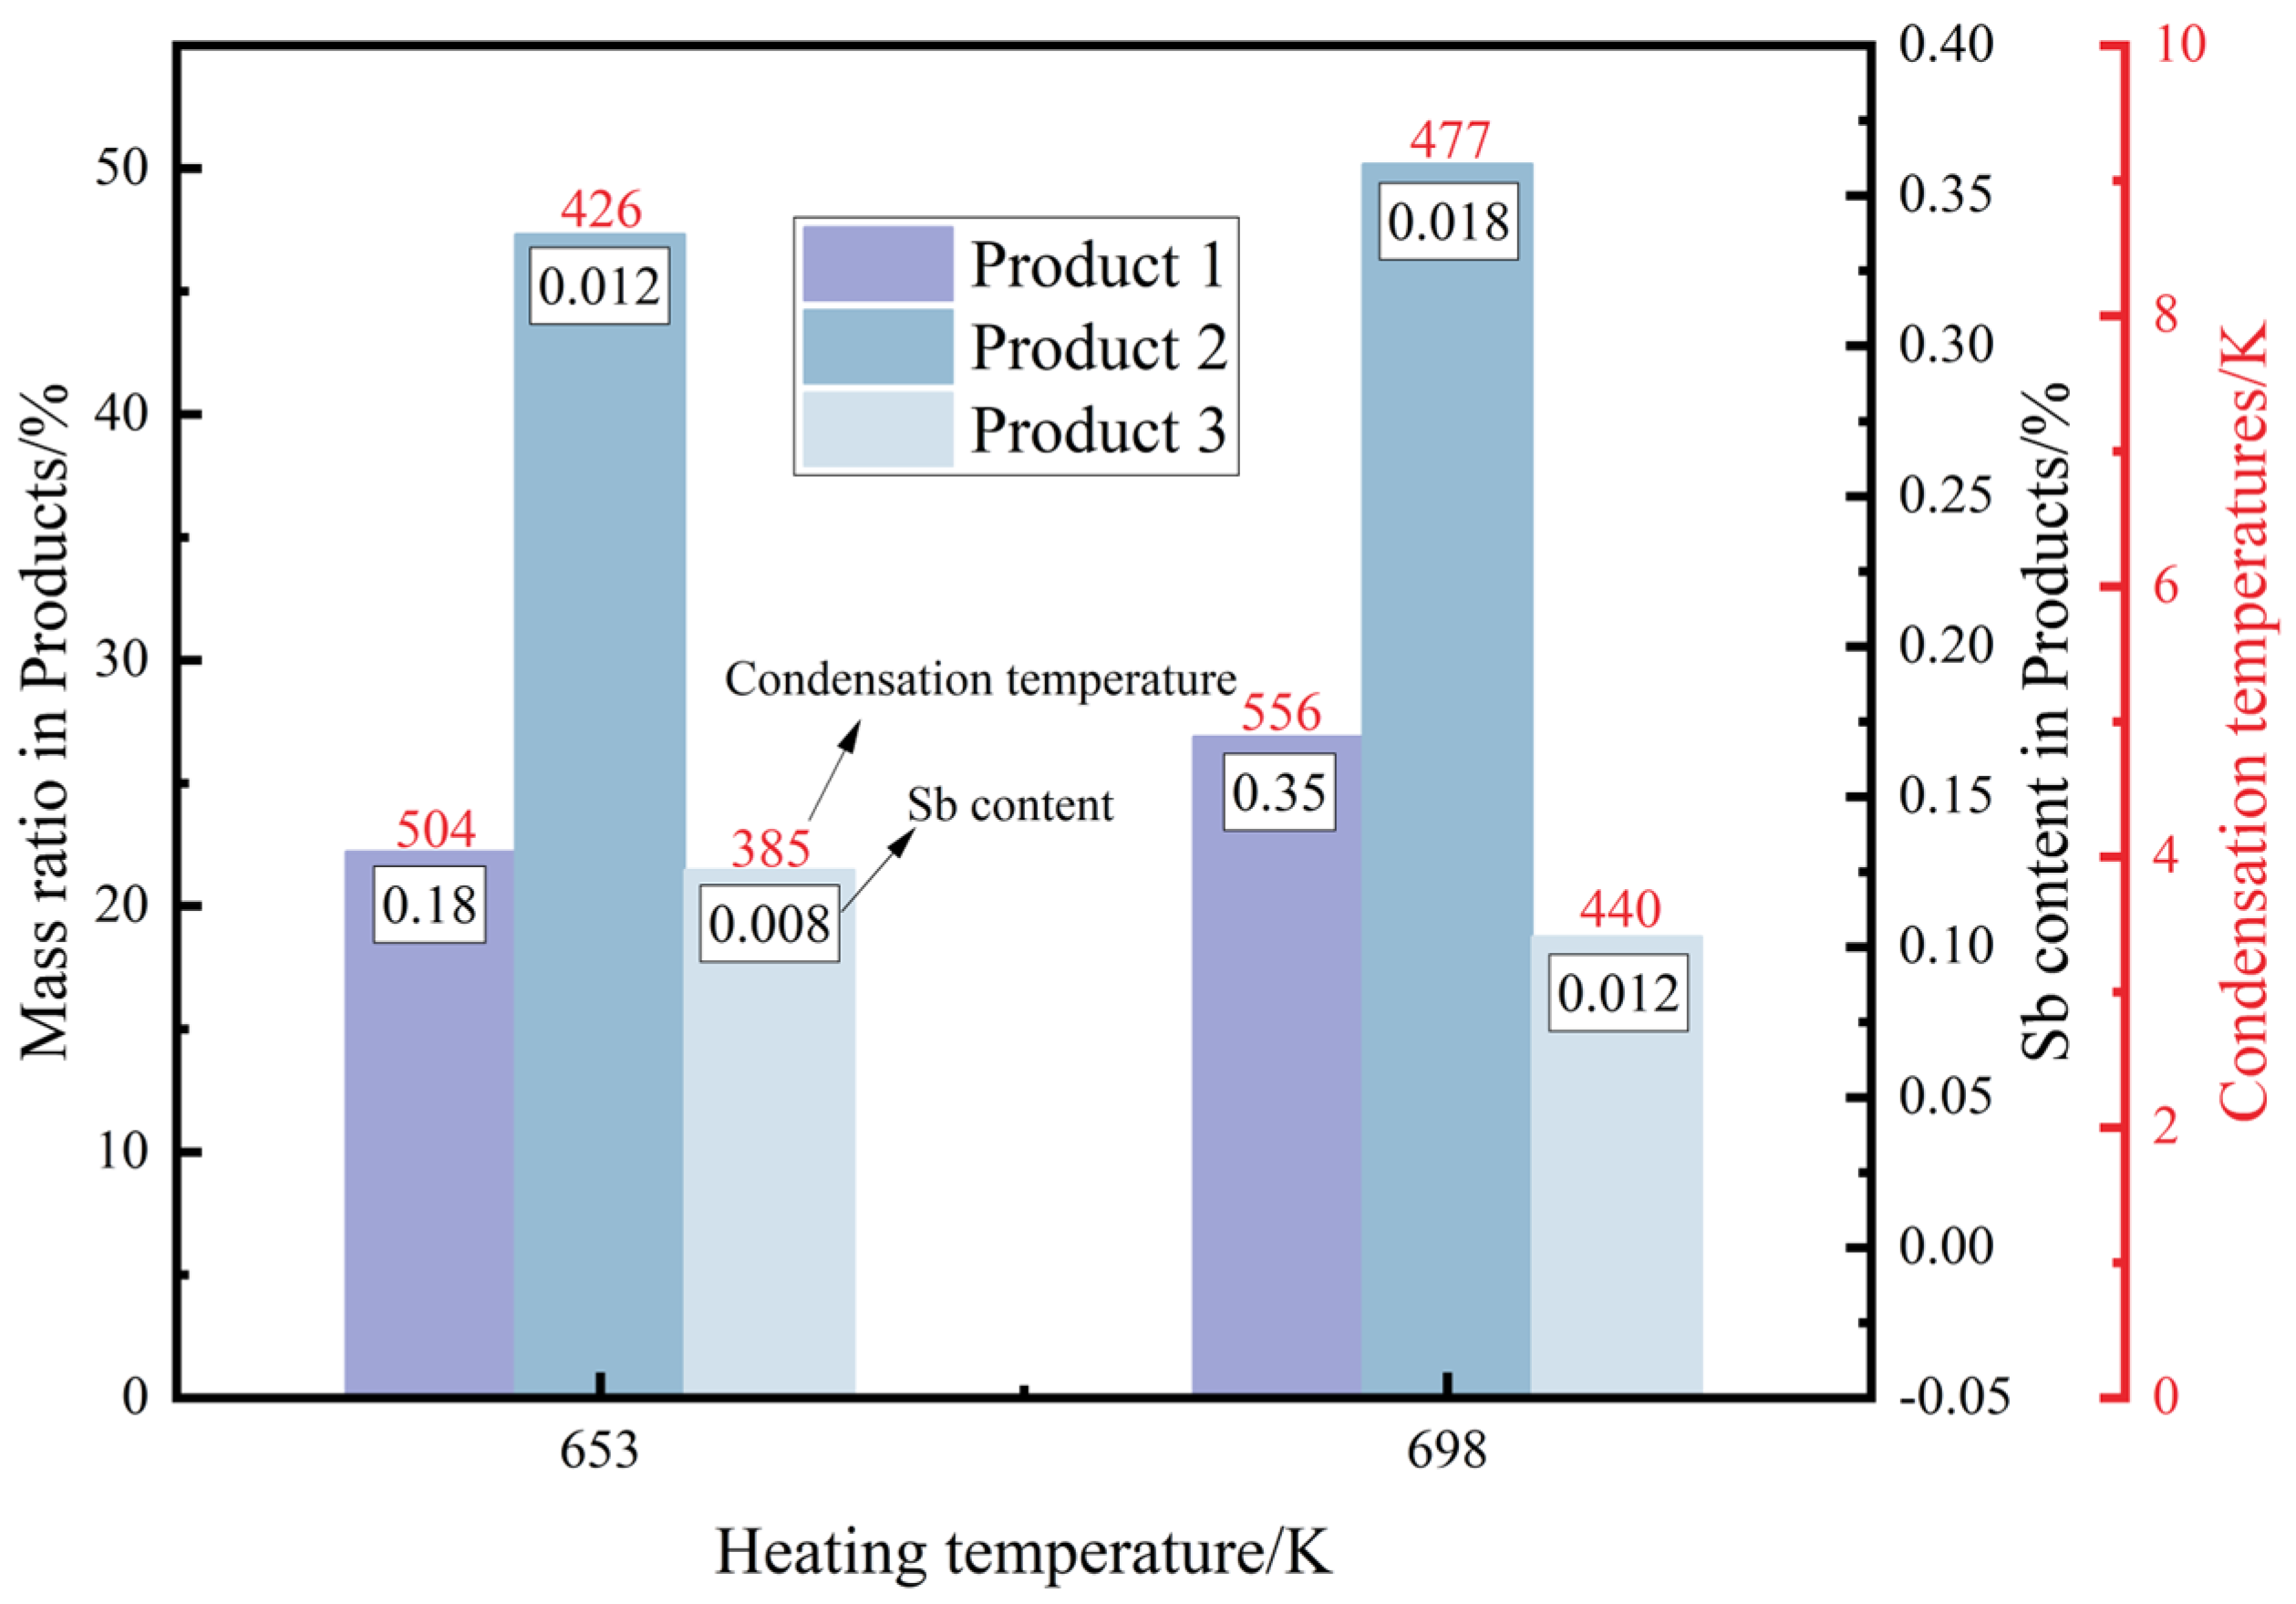
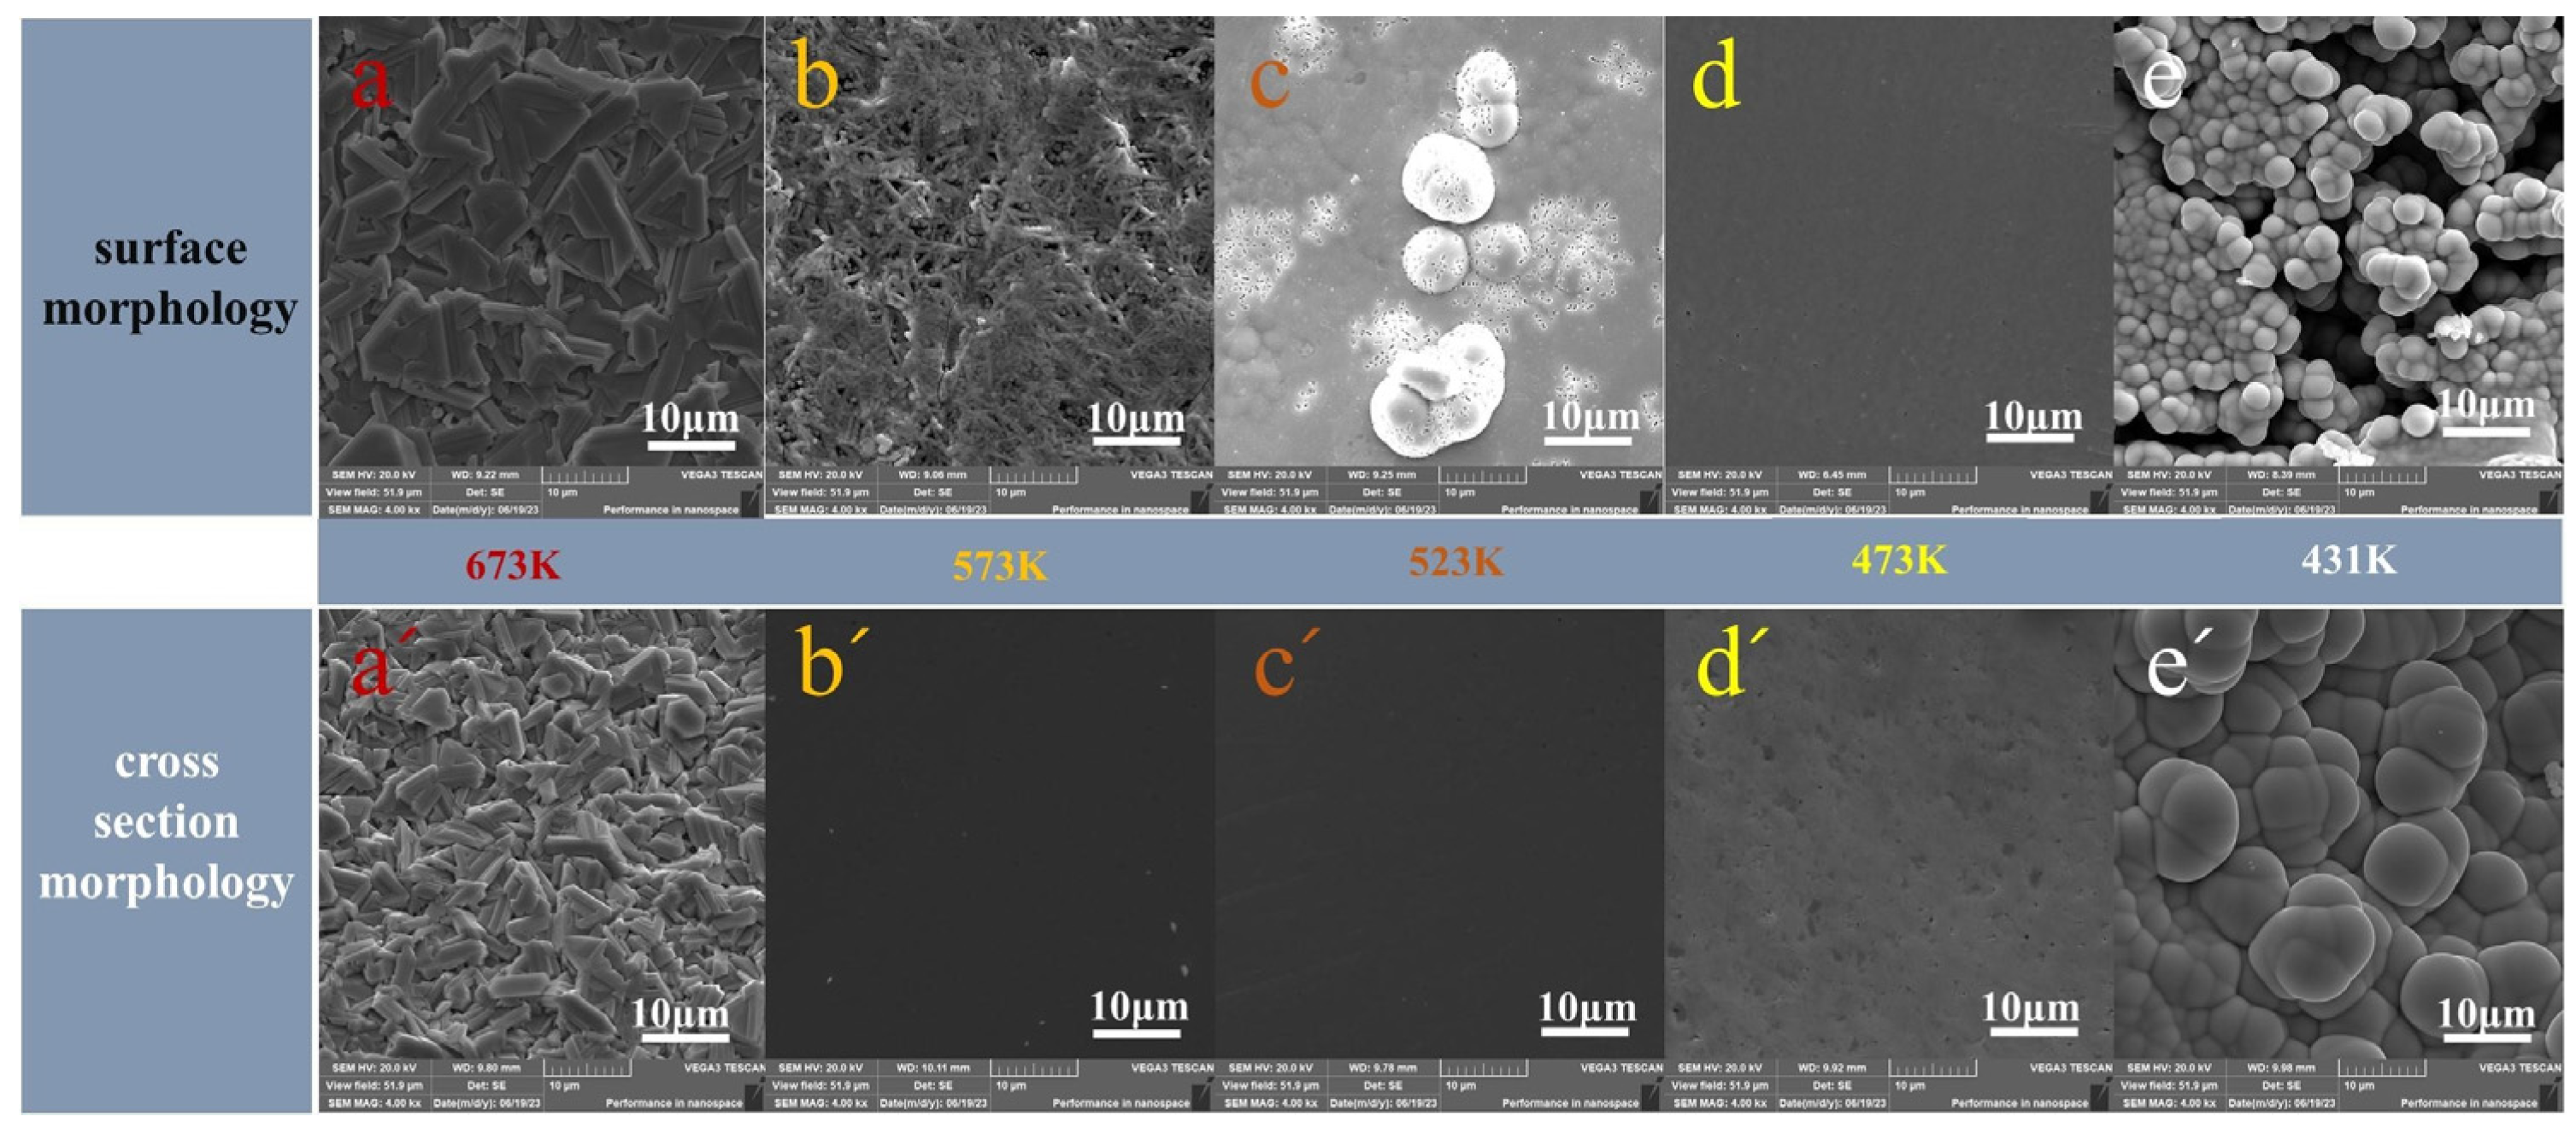
3.3. Results of the Experiment

The experiments were carried out at a pressure of 10 Pa and temperatures of 653 K and 698 K. The results are shown in Figure 11. The lowest theoretical generation temperature of As4(g) is 596 K, where the holding time of 24 h at 653 K has a low volatility of only 24.73%. Three regions of product concentration were sampled and analysed, named products 1, 2, and 3, whose mass shares in all condensation products were 22.21%, 47.32%, and 21.46%, respectively, corresponding to condensation region temperatures of 504 K, 426 K, and 385 K, respectively. The Sb content gradually decreases from the proximal end of the heating zone to the distal end of the heating zone, and the Sb-containing clusters entering the gas phase are mainly condensed and deposited at the proximal end of the heating zone. The Sb content in product 2, which had the highest mass percentage, was reduced from 1.86% to 0.012% of the feedstock, with an excellent removal rate of 99.35%. The heating temperature was increased to 698 K, holding temperature was 8h, volatility was 77.30%, and there was a significant increase in the volatility with the increase in temperature. The mass shares of products 1, 2, and 3 in all condensation products were 26.89%, 50.17% and 18.76%, respectively, corresponding to condensation region temperatures of 556 K, 477 K, and 440 K, respectively, and the temperature of the condensation region corresponds to an increase. Product 2, with the highest mass fraction, contained 0.018% Sb, and the removal rate was 99.03%, which decreased, indicating that the low-temperature sublimation purification is beneficial to inhibit the generation and diffusion of Sb-containing clusters. In conclusion, using the difference in diffusion properties of As4 and Sb-containing clusters, the deep removal of Sb can be achieved by vacuum sublimation of industrial crude arsenic by increasing the condensation disc and extending the condensation zone under low-temperature sublimation to achieve the purpose of purification [28].
To understand the condensation law of As vapour at different condensation temperatures and to analyse the results of condensation deposition in the experimental condensation zone, As vapour was condensed and deposited in the condensation zone at different temperature regions, as shown in Figure 12. As morphology varies greatly with different condensation temperatures. Figure 13 shows the XRD patterns of metal As deposited by condensation under different temperature conditions, combined with the SEM patterns of the metal As surface (Figure 14a–e) and cross-section morphology (Figure 14a’–e’) under different condensation temperature conditions in Figure 14. There is no obvious difference between the surface and cross-section morphology, and it can be seen that with the increase of the supercooling degree, the XRD diffraction peaks of the product arsenic become smaller and smaller, and it gradually transforms from the crystalline state to the amorphous state.; As grows along the (021) direction at 623 K, which is different from the growth of the parent material along the (003) direction, which is related to the pressure of the system during the growth process [29]. The temperature above 623 K shows a staggered, stepped, multifaceted surface, which is typical of crystalline As, and its growth mode is laminar growth. The transition temperature interval between crystalline and amorphous state is 573~623 K; very little As condenses and crystallises, and its growth mode is a combination of laminar growth and island growth. When the temperature is lower than 573 K, the subcooling is too large; the metal vapour is directly transformed into amorphous As, and the growth mode is island growth, which is formed by the rapidly cooling spherical As particles in the gas phase [30].

4. Conclusions

This paper investigated the microscopic mechanism of Sb removal by vacuum sublimation of industrial crude arsenic using a combination of theoretical calculations and exploratory experiments. The conclusions obtained are as follows:
  • From a thermodynamic perspective, the saturation vapour pressure of arsenic and antimony is quite different, and controlling the temperature can achieve their effective separation. Meanwhile, it may be accompanied by arsenic–antimony compounds such as As3Sb, As2Sb2, and AsSb3 in the vacuum distillation process.
  • Dynamics calculations show differences in the mean free ranges of As4 and Sb4 that can be used to guide the design of condenser structures. The ab initio molecular dynamics simulations of AsmSbn (m + n ≤ 6) clusters show that As4, As3Sb, As2Sb2, and AsSb3 are well stabilised. The maximum diffusion coefficient and migration distance of As4 make it possible to separate it from Sb-containing clusters during gas phase diffusion and condensation.
  • The experimental results show that low-temperature sublimation purification is beneficial to inhibit the formation and diffusion of Sb-containing clusters. As vapour is transformed from crystalline to amorphous with increasing subcooling, and Sb-containing clusters entering the gas phase are mainly condensed and deposited at the proximal end of the heating zone. At a pressure of 10 Pa and a vacuum sublimation temperature of 653 K, the removal rate of Sb in the product by increasing the condensation disc and extending the condensation zone was 99.35% without considering the volatility.
It was verified that industrial crude arsenic subjected to vacuum sublimation could achieve deep removal of Sb for purification purposes, and the theory was in agreement with the experiment.

Author Contributions

Z.Z.: Methodology, formal analysis, investigation, writing—original draft, visualization. M.D.: Data curation, formal analysis. X.L. (Xinyang Liu): Writing—review and editing, funding acquisition. X.C.: Data curation, formal analysis. H.L.: Formal analysis. T.S.: Writing—review and editing. X.L. (Xianjun Lei): Experimental testing and analysis. Y.T., B.Y. and B.X.: Resources, writing—review and editing, supervision, project administration, funding acquisition. All authors have read and agreed to the published version of the manuscript.

Funding

This work was financially supported by Yunnan Fundamental Research Projects (grant NO. 202301AS070054), and the Yunling Scholars of Yunnan Province, China (No. KKRC201952012).

Data Availability Statement

The original contributions presented in the study are included in the article, further inquiries can be directed to the corresponding authors.

Conflicts of Interest

The authors declare no conflict of interest.

References

  1. Tsao, J.Y.; Chowdhury, S.; Hollis, M.A.; Jena, D.; Johnson, N.M.; Jones, K.A.; Kaplar, R.J.; Rajan, S.; Van de Walle, C.G.; Bellotti, E.; et al. Ultrawide-Bandgap Semiconductors: Research Opportunities and Challenges. Adv. Electron. Mater. 2018, 4, 1600501. [Google Scholar] [CrossRef]
  2. Wu, D.; Zhao, T.; Ye, B.; Liang, X.; Chen, H.; Nie, Q.; Tian, D.; Yang, D.; Ma, X. Arsenic Precipitation in Heavily Arsenic-Doped Czochralski Silicon. Phys. Status Solidi—Rapid Res. Lett. 2023, 17, 2200403. [Google Scholar] [CrossRef]
  3. Potolokov, V.N.; Efremov, V.A.; Zhukov, E.G.; Pashinkin, A.S.; Potolokov, N.A.; Fedorov, V.A. Preparation of high-purity arsenic via hydrogen reduction of arsenic trichloride. Inorg. Mater. 2003, 39, 15–21. [Google Scholar] [CrossRef]
  4. Li, Z.; Deng, J.; Liu, D.; Jiang, W.; Zha, G.; Huang, D.; Deng, P.; Li, B. Waste-free separation and recovery of copper telluride slag by directional sulfidation-vacuum distillation. J. Clean. Prod. 2022, 335, 130356. [Google Scholar] [CrossRef]
  5. Liang, G.; Wu, Q.; Yang, J. Probing the electronic structure and property of neutral and charged arsenic clusters (Asn (+ 1, 0,–1), n ≤ 8) using Gaussian-3 theory. J. Phys. Chem. A 2011, 115, 8302–8309. [Google Scholar] [CrossRef] [PubMed]
  6. Zhao, Y.; Xu, W.; Li, Q.; Xie, Y.; Schaefer, H. The arsenic clusters Asn (n = 1–5) and their anions: Structures, thermochemistry, and electron affinities. J. Comput. Chem. 2004, 25, 907–920. [Google Scholar] [CrossRef]
  7. Morino, Y.; Ukaji, T.; Ito, T. Molecular structure determination by gas electron diffraction at high temperatures. I. Arsenic. Bull. Chem. Soc. Jpn. 1966, 39, 64–71. [Google Scholar] [CrossRef]
  8. Igel-Mann, G.; Stoll, H.; Preuss, H. Structure and ionization potentials of clusters containing heavy elements: I. homonuclear group v clusters up to hexamers. Mol. Phys. 1993, 80, 325–339. [Google Scholar] [CrossRef]
  9. Zhou, X.; Zhao, J.; Chen, X.; Lu, W. Structural and electronic properties of Sbn (n = 2–10) clusters using density-functional theory. Phys. Rev. A 2005, 72, 053203. [Google Scholar] [CrossRef]
  10. Kordis, J.; Gingerich, K.A. Mass spectroscopic investigation of the equilibrium dissociation of gaseous Sb2, Sb3, Sb4, SbP, SbP3, and P2. J. Chem. Phys. 1973, 58, 5141–5149. [Google Scholar] [CrossRef]
  11. Yang, B.; Xu, B. Vacuum Metallurgy; Central South University Press: Changsha, China, 2022; p. 519. (In Chinese) [Google Scholar]
  12. Bale, C.W.; Bélisle, E.; Chartrand, P.; Decterov, S.A.; Eriksson, G.; Gheribi, A.E.; Hack, K.; Jung, I.-H.; Kang, Y.-B.; Melançon, J.; et al. FactSage thermochemical software and databases. Calphad 2016, 54, 35–53. [Google Scholar] [CrossRef]
  13. Yang, J. Theoretical Study on the Growth Sequence and Electronic Properties of Arsenic and Antimony Clusters; Nanjing Normal University: Nanjing, China, 2018. (In Chinese) [Google Scholar]
  14. Song, B.; Xu, B.; Yang, B. Ab Initio Molecular Dynamics Studies of PbmSbn (m + n ≤ 9) Alloy Clusters. Metall. Mater. Trans. A 2017, 48, 4905–4913. [Google Scholar] [CrossRef]
  15. Kumar, V. Electronic and atomic stuctures of Sb4 and Sb8 clusters. Phys. Rev. B 1993, 48, 8470–8473. [Google Scholar] [CrossRef] [PubMed]
  16. Becke, A.D. Density-functional exchange-energy approximation with correct asymptotic behavior. Phys. Rev. A 1988, 38, 3098–3100. [Google Scholar] [CrossRef] [PubMed]
  17. Perdew, J.P. Density-functional approximation for the correlation energy of the inhomogeneous electron gas. Phys. Rev. B 1986, 33, 8822. [Google Scholar] [CrossRef] [PubMed]
  18. BelBruno, J.J. Bonding and energetics in small clusters of gallium and arsenic. Heteroat. Chem. Int. J. Main Group Elem. 2003, 14, 189–196. [Google Scholar] [CrossRef]
  19. Kim, K.; Jordan, K.D. Comparison of density functional and MP2 calculations on the water monomer and dimer. J. Phys. Chem. 1994, 98, 10089–10094. [Google Scholar] [CrossRef]
  20. Reuse, F.A.; Khanna, S.N. Geometry, electronic structure, and magnetism of small Nin (n = 2–6, 8, 13) clusters. Chem. Phys. Lett. 1995, 234, 77–81. [Google Scholar] [CrossRef]
  21. Ballone, P.; Jones, R.O. Density functional study of phosphorus and arsenic clusters using local and nonlocal energy functionals. J. Chem. Phys. 1994, 100, 4941–4946. [Google Scholar] [CrossRef]
  22. Gong, X.; Tosatti, E. Structure of Small Gallium Clusters. Phys. Lett. A 1992, 166, 369–372. [Google Scholar] [CrossRef]
  23. Zhang, J.; Li, T.; Pang, J.; Kong, L.; Yang, Z.; Chen, L.; Xu, B.; Yang, B. Sustainable safe and environmentally friendly process to recovery valuable materials from hazardous waste InP. Waste Manag. 2023, 155, 153–161. [Google Scholar] [CrossRef] [PubMed]
  24. McLean, A.D.; Liu, B.; Chandler, G.S. Computed self-consistent field and singles and doubles configuration interaction spectroscopic data and dissociation energies for the diatomics B2, C2, N2, O2, F2, CN, CP, CS, PN, SiC, SiN, SiO, SiP, and their ions. J. Chem. Phys. 1992, 97, 8459–8464. [Google Scholar] [CrossRef]
  25. Rajesh, C.; Majumder, C. Atomic and electronic structures of neutral and charged Pbn clusters (n = 2–15): Theoretical investigation based on density functional theory. J. Chem. Phys. 2007, 126, 244704. [Google Scholar] [CrossRef] [PubMed]
  26. Wang, L.S.; Niu, B.; Lee, Y.T.; Shirley, D.A.; Balasubramanian, K. Photoelectron spectroscopy and electronic structure of heavy group IV–VI diatomics. J. Chem. Phys. 1990, 92, 899–908. [Google Scholar] [CrossRef]
  27. Krebs, H.; Holz, W.; Worms, K.H. Über die Struktur und die Eigenschaften der Halbmetalle, X. Eine Neue Rhombische Arsenmodifikation und Ihre Mischkristallbildung mit Schwarzem Phosphor. Chem. Berichte 1957, 90, 1031–1037. [Google Scholar] [CrossRef]
  28. Yu, H.; Chen, X.; Xu, B.; Yang, B.; Jiang, W.; Tian, Y.; Wang, L.; Wang, W. Study on the behavior of clusters in the physical recovery of GaAs scrap. J. Environ. Manag. 2024, 352, 120049. [Google Scholar] [CrossRef] [PubMed]
  29. Liu, Z.; Lai, X.; Zhou, Y.; Deng, F.; Song, J.; Yang, Z.; Peng, C.; Ding, F.; Zhao, F.; Hu, Z.; et al. Enhancing the anti-oxidation stability of vapor-crystallized arsenic crystals via introducing iodine. J. Hazard. Mater. 2022, 439, 129573. [Google Scholar] [CrossRef] [PubMed]
  30. Chernov, A.A. Modern Crystallography III: Crystal Growth; Springer Science & Business Media: New York, NY, USA, 2012. [Google Scholar]
Figure 1. (a) Physical image of crude arsenic feedstock; (b) electron probe microanalysis (EPMA) images of crude arsenic; (c,d) EPMA mapping of As and Sb.
Metals 14 00490 g001
Figure 2. Schematic structure of vacuum sublimation furnace.
Metals 14 00490 g002
Figure 3. As and Sb saturation vapour pressure relationship.
Metals 14 00490 g003
Figure 4. Gibbs free energy of reactions of As and Sb.
Metals 14 00490 g004
Figure 5. Average free range of (a) As4 and (b) Sb4.
Metals 14 00490 g005
Figure 6. AsmSbn (m + n ≤ 6) cluster ground state structure and symmetry (yellow and purple balls represent As and Sb atoms, respectively).
Metals 14 00490 g006
Figure 7. Binding energies of AsmSbn (m + n ≤ 6) clusters versus (a) number of As atoms; (b) number of Sb atoms.
Metals 14 00490 g007
Figure 8. (a) Second-order energy difference with respect to the number of Sb atoms and (b) HOMO-LOMO energy gap with respect to the number of Sb atoms for AsmSbn (m + n ≤ 6) clusters.
Metals 14 00490 g008
Figure 9. Splitting energy of AsmSbn (m + n ≤ 6) clusters as a function of the number of Sb atoms. (a) 1 Sb atom; (b) 2 Sb atoms; (c) 4 Sb atoms.
Metals 14 00490 g009
Figure 10. MSD and diffusion coefficients of As4, As3Sb, As2Sb2, and AsSb3 at 698 K.
Metals 14 00490 g010
Figure 11. 653 K and 698 K on the efficiency of Sb removal.
Metals 14 00490 g011
Figure 12. Results of condensation deposition in the experimental condensation zone at 698 K.
Metals 14 00490 g012
Figure 13. XRD patterns of As condensate under different temperature conditions.
Metals 14 00490 g013
Figure 14. As surfaces (ae) with corresponding cross-sectional morphologies (a’e’), where different colours represent different condensation temperatures.
Metals 14 00490 g014
Table 1. Vapour pressure of substances and associated constants-Reprinted from Ref. [11].
MaterialisticlgP/PaTemperature Range/K
ABCD
As−6160--11.94873.15–1173.15
Sb−6500--8.49904.15–1948.15
Table 2. Results of quantitative analysis of crude arsenic composition.
ElementAsSbOthers
Wt.%96.331.861.81
Disclaimer/Publisher’s Note: The statements, opinions and data contained in all publications are solely those of the individual author(s) and contributor(s) and not of MDPI and/or the editor(s). MDPI and/or the editor(s) disclaim responsibility for any injury to people or property resulting from any ideas, methods, instructions or products referred to in the content.

