
Quasi In Situ Study on the Slipping Behavior and Residual Stress of Copper Strip

1
School of Mechatronics Engineering, Henan University of Science and Technology, Luoyang 471023, China
2
School of Materials Science and Engineering, Henan University of Science and Technology, Luoyang 471023, China
3
Henan Academy of Sciences, Zhengzhou 450002, China
*
Author to whom correspondence should be addressed.
Metals 2024, 14(5), 491; https://doi.org/10.3390/met14050491
Submission received: 16 March 2024
/
Revised: 20 April 2024
/
Accepted: 22 April 2024
/
Published: 23 April 2024
(This article belongs to the Section Metal Casting, Forming and Heat Treatment)
Abstract
:The preparation method of integrated circuit lead frames has transitioned from stamping to etching, rendering them more sensitive to residual stress. Consequently, the dimensional deviations caused by residual stress become more pronounced, necessitating a thorough investigation into the copper strip processing process, particularly considering the high-precision requirements of the lead frame. A quasi in situ method was employed to monitor the deformation process, and quantitative analyses and graphical reconstructions of the residual stress were conducted. The results indicated that the orientation evolution did not exhibit a significant correlation with grain size or grain aspect ratio. However, the stored energy of the different grains was related to their orientations. Further analysis of slip traces revealed that single or multiple slipping may be activated in grain subdivisions, and the Schmid factor difference ratio (SFDR) value proved to be an effective tool for analyzing this deformation mode. An even more interesting finding was that the deformation mode directly affected the residual stress distribution in local regions. The relationship between residual stress, Schmid factor, and SFDR was further analyzed, and a clear correlation between SFDR and residual stress was found in this study.
1. Introduction
As the essential conductor material of integrated circuit (IC) lead frames, electric copper strips find extensive applications in electronic information, aerospace, and new energy fields [1,2]. The trend toward miniaturization in ICs demands more intricate and precise lead frames. Consequently, the manufacturing approach for lead frames has evolved from mechanical stamping to chemical etching. Etching involves the chemical removal of copper to form the designed frame, and it is particularly sensitive to residual stresses present in the copper strip [3,4]. Higher residual stress can easily cause strip warping, affecting the stability of the etching process and the precision of the lead frame.
Electric copper strip exhibits residual stress characteristics at two length scales: macro and micro. Macro-residual stress arises from the uneven distribution of flow stress caused by inhomogeneous cold processing or heat treatment, often referring to forces existing within multiple grain size scales, while micro-residual stress is primarily confined within the interior of grains, involving crystal defects such as dislocations and vacancies [5,6,7,8]. The non-uniform distribution of dislocations, encompassing different types, configurations, and densities of dislocations, constitutes the primary factor influencing the distribution of residual stress [5,9,10]. From this perspective, the warping of the strip during etching essentially results from an imbalanced stress distribution introduced by the presence of local dislocations. Therefore, the dislocation morphology and evolution trend upon machining are critical to the magnitude and distribution of residual stress and the subsequent operation stability of the IC chip.
Dislocations primarily arise from slipping, which is the primary deformation mechanism observed in copper strips during machining processes such as stretching, hot rolling, and cold rolling [11]. As the machining process progresses, dislocations accumulate, become entangled, rearrange, and give rise to high-density dislocation configurations, commonly resulting in elevated residual stress in localized regions [12,13,14]. From this perspective, the initial dislocation type, slip, and transition stages play a pivotal role in shaping and evolving the subsequent dislocation configurations [15,16].
Deformation mechanisms and the resulting strengthening effects have been extensively studied in many face-centered cubic metals such as aluminum, nickel, and γ-iron [17,18,19]. Moreover, research efforts have explored microalloying and its interactions with dislocations during the solution and subsequent aging processes of these metals [20,21,22]. However, there have been few quantitative reports that specifically investigated the initial deformation process, the factors influencing dislocation morphology, and the deeper relationship between dislocation and residual stress in high-end electric copper strips. Nonetheless, understanding residual stress is crucial for the fabrication of lead frames, particularly those utilized in current 5G technology, electronic information applications, and the emerging field of new energy.
This paper places emphasis on the topics mentioned above, delving into the selective activation mechanism of the slip system during the initial deformation, the factors that influence the slipping process, and its correlation with classical deformation models, such as the Schmid factor (SF). It establishes the intricate relationship between slipping behavior and residual stress. Furthermore, it quantitatively assesses the magnitude of residual stress and presents its distribution through figures. Lastly, this paper evaluates the applicability and limitations of the EBSD-based residual stress analysis method.
2. Experimental
2.1. Materials Preparation and Microstructure
A high purity Cu (99.9999 wt.%) sheet was annealed at 805 °C for 2 h to achieve a fully recrystallized microstructure before deformation. A block of 7 mm × 6 mm × 6 mm specimen was cut from the Cu sheet, and its transverse direction (TD) plane was carefully polished with sandpaper, followed by an electropolishing using a mixture of nitric acid, alcohol, and distilled water (1:1:2 by volume) at room temperature for 0.5 min. The copper strips used for lead frames are still mainly produced by rolling, and in the early rolling process, compression dominates due to process efficiency. Therefore, compression was chosen as the main deformation method in this study, to closely mimic actual production conditions. The compression experiment was carried out on a Shimadzu AG-X (50 kN) machine at room temperature and at an equivalent initial strain rate of ~10−3 s−1, until a thickness reduction of 5.25%. The specific process route is shown in Figure 1.
The electron backscatter diffraction (EBSD) technique was applied to characterize the microstructure in the middle region of the TD plane before and after compression. EBSD measurements were conducted on a JEOL JSM-7800F scanning electron microscope (SEM) with an accelerating voltage of 20 kV and working distance of 14 mm. The data acquisition and analysis were performed on an Aztec EBSD system (Oxford Instruments, Abingdon, UK) and using HKL Channel 5 software, respectively, and the data indexation rates were higher than 98% to ensure accuracy. To ensure the surface quality of the testing plane, the specimen was soaked in acetone for 1 h, followed by a 30 min ultrasonic cleaning at 25 °C before the EBSD measurement.
It should be noted that many indentations were randomly made on the testing plane, enclosing multiple regions. Once a region had been chosen for characterization, several figures were captured at different magnifications to ensure consistency before compression. Moreover, meticulous position correction work was performed on the SEM during the EBSD measurement, to minimize orientation errors resulting from specimen alignment. This study shows that the SEM maps and OIMs exhibited good agreement before and after compression.
2.2. Quasi In Situ Slip Traces Analysis
Slip trace analysis was conducted to identify the active slip modes based on the obtained SEM images and EBSD data. The methodology employed to determine the active slip mode is illustrated in Figure 2. Here, ‘CD’ signifies the compress direction. Combining the SEM map (Figure 2a), where slip trace was observed in Grain A, and the crystallographic orientation for this slip trace obtained from the EBSD orientation imaging map (Figure 2b), a visualized slip system chart (Figure 2c) of all the possible slip systems could be tabulated by inputting the Euler angle of Grain A into Excel. Based on the best match of the slip traces, a specific slip system was selected as the activated slip system. Whenever more than one slip system could be chosen, the one with the largest SF was chosen, as shown in Figure 2d. SF is an effective method to reveal the likelihood of slip system activation [23].
The SFs of each slip system were calculated based on the following equation [24]:
SFcompress = −cosφND × cosλND
In which φND is the angle between the slip plane and the compress direction, and λND is the angle between the slip direction and the compress direction. The SF were calculated using the {111}<110> slip systems of the face center cubic lattice.
3. Results
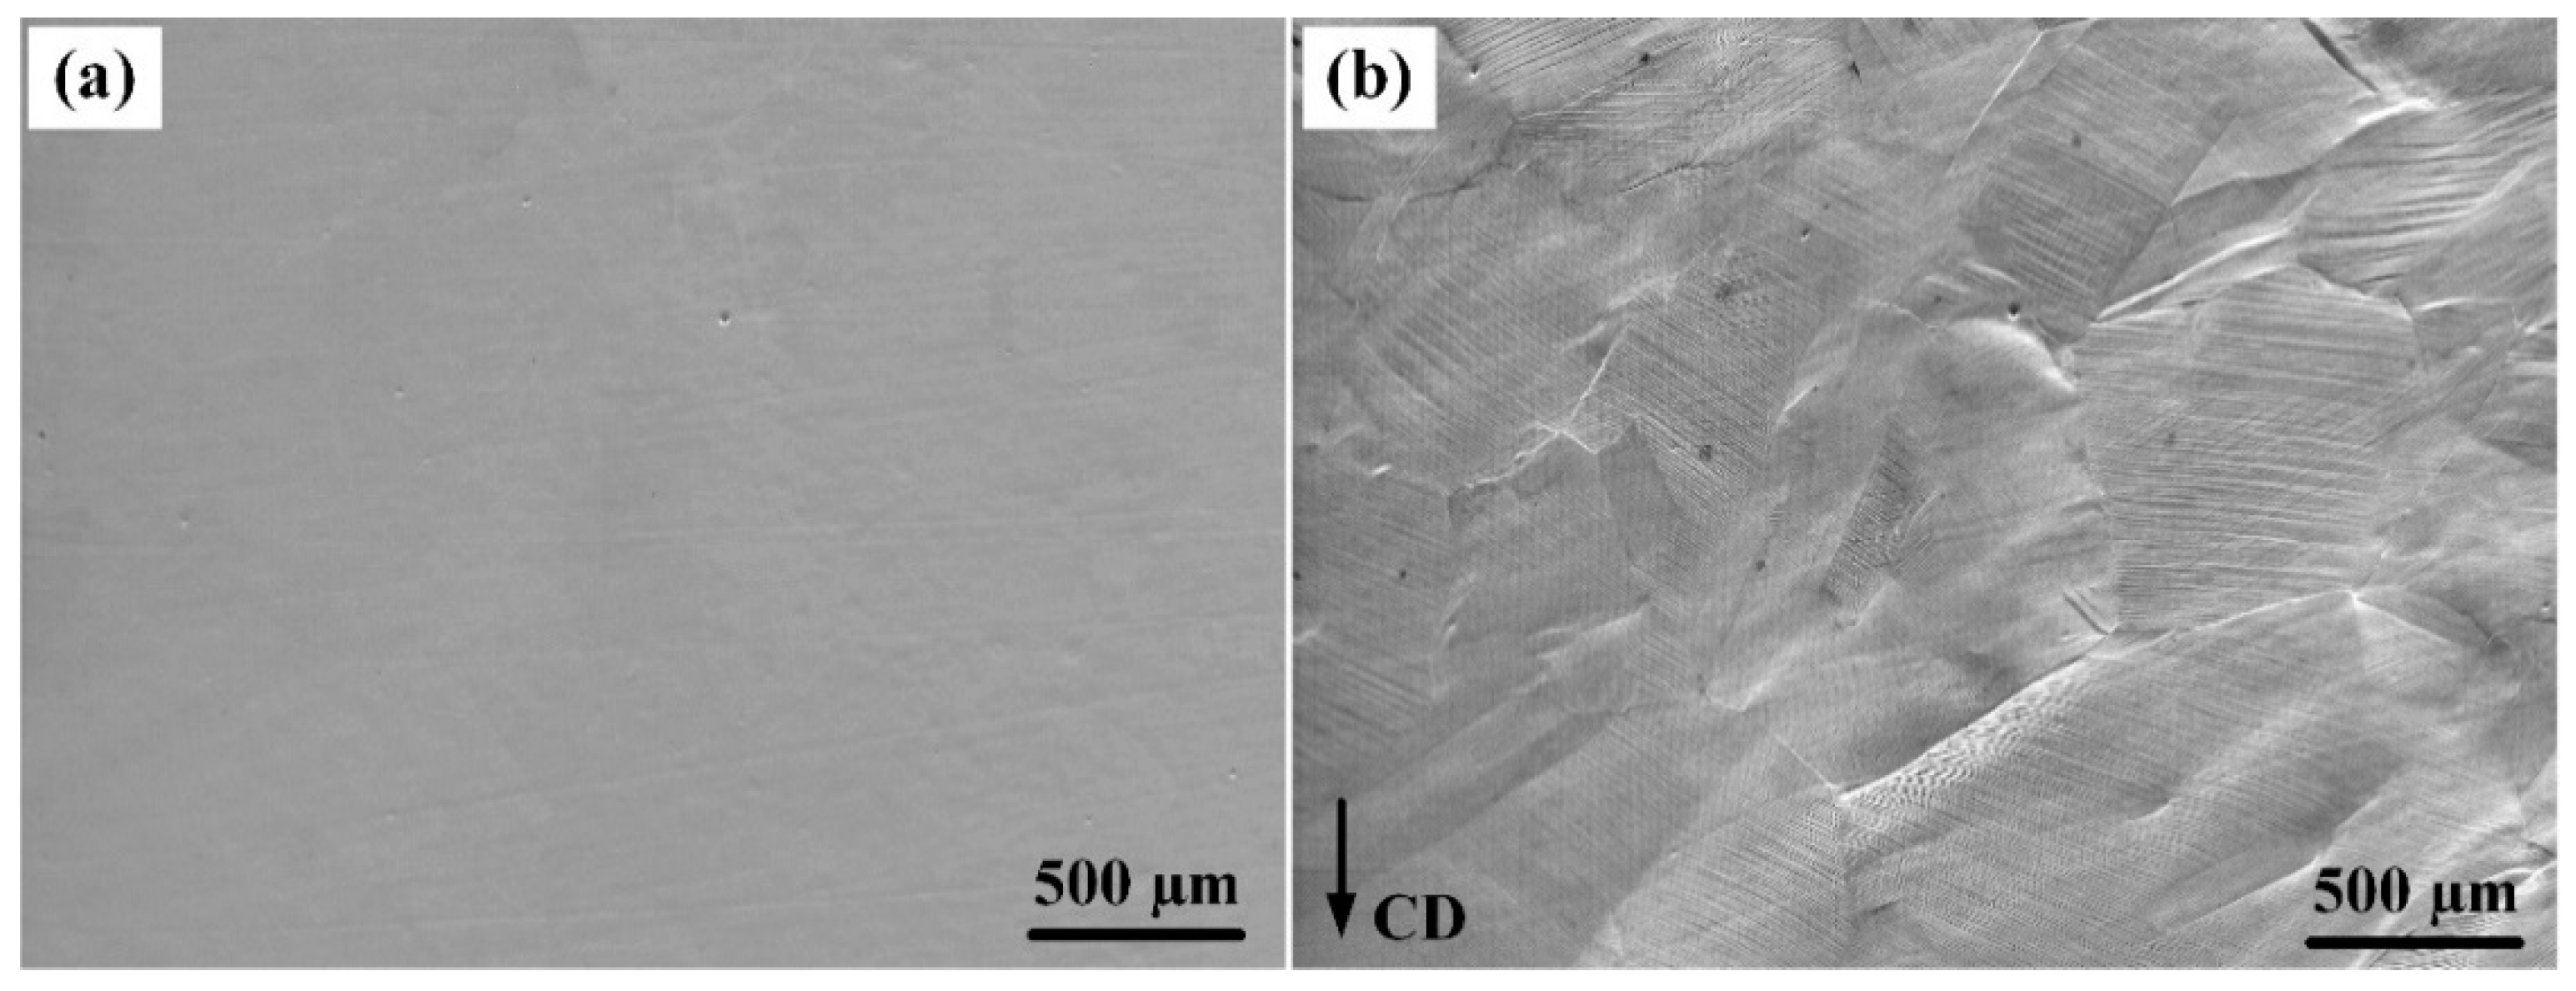
Figure 3a,b show the microstructure of the specimen before and after the compression, respectively. The compression process led to a transition from a smooth surface to an uneven pattern, and most grains can be readily distinguished by their outlines (Figure 3b). Upon close inspection of Figure 3b, numerous slip traces are observed within the grains, with different grains displaying distinct trace morphologies, including direction, density, and combination type. Figure 3b depicts the occurrence of multiple slip traces in certain regions. These multiple slip traces are not uniformly distributed across the entire grain but are confined to specific parts of the grain.
Figure 4 shows EBSD maps before and after compression. Grains were compressed along the normal direction (ND), and changes in the crystallographic orientation were observed in most grains. Some grains that underwent serious subdivision show obvious orientation spread, and in some cases, grains even present combinations of multiple orientations in local regions.
It is important to note that no new twin structures were identified during the compression process, a fact corroborated by the misorientation distribution analysis. The misorientation evolution maps, as depicted in Figure 4c,d, illustrate various misorientation degrees using different colors. Upon closer examination of the misorientation degree, it becomes apparent that prior to compression, most grain boundaries exhibited misorientations larger than 40° (shown in blue color). However, after compression, many low-angle grain boundaries appeared within the grains, particularly at the original grain boundaries. This observation is further supported by the misorientation spectrum.
In this testing region, the misorientation distribution of grain boundaries exhibited a distinct bimodal character. The first peak fell within the range of misorientations less than 5°, while the second peak spanned from 55° to 60° (Figure 4e). During the compression process, there was an increase in low-angle grain boundaries and a decrease in larger ones. As shown in Figure 4e, the first peak was significantly enhanced, while the second was noticeably weakened.
Figure 5a,b illustrate the texture evolution before and after compression via inverse pole figures. Before compression, the orientations tended to cluster in specific regions, while after compression, these orientations were noticeably dispersed, nearly filling the entire inverse pole figure, as depicted in Figure 4b. The increased orientation dispersion, to a certain extent, mirrored the splitting of original grains and the formation of substructures. Consequently, the maximal orientation density increased from 3.05 to 3.92 after compression. Here, the tolerance angle used to define the different texture components was 15°.
Before compression, there was a substantial presence of Copper, Brass, S, and Dillamore orientations. However, after compression, the content of Brass, S, and Dillamore orientations seemed to show a significant reduction. Notably, the Brass orientation experienced the most pronounced decrease, at 65.3%. Conversely, the Copper, Goss, and P orientations underwent a substantial increase in content after compression. Specifically, the P orientation showed a remarkable increase of 421.5%, as depicted in Figure 5c.
4. Discussion
Quasi in situ compression experiments were performed to identify the deformation mode and residual stress evolution mechanism in this study, aiming to explore the factors influencing the slipping process, the correlation between slipping behavior and residual stress, and the methodology for assessing residual stress. The following sections offer a detailed discussion of these topics.
4.1. Grain Rotation
Deformation causes the splitting of grains in metal materials. Within the limitations of grain boundaries, this splitting is always accompanied by lattice rotation. Put simply, crystallographic lattice rotation causes alterations in grain orientation, facilitating the interconnection of all grains during deformation [25,26]. However, different grains undergo varying modes of deformation, resulting in distinct degrees of deformation and ranges of orientation variation.
The primary questions stemming from this observation are twofold: First, to what extent does the difference in rotation among grains matter? Second, what factors influence this rotation behavior? To address these inquiries, it becomes essential to examine the orientation changes of individual grains during deformation. Analyzing the microtexture evolution and rotation behavior assumes significance, as alterations in microtexture essentially stem from the orientation changes of the multitude of individual grains.
In Figure 6a, a grain boundary map is presented, with most grains numbered sequentially throughout the thickness. Subsequently, the misorientation of orientations (36 points in total) before and after compression was extracted and calculated for each numbered grain. This misorientation, which essentially represents the degree of rotation for each grain during compression, was then analyzed. As illustrated in Figure 6b,c, the degree of rotation did not display a conspicuous linear relationship with either grain aspect ratio or grain size. Instead, the rotation degree points tended to concentrate within the aspect ratio range of 1–3 and the grain size range of 50–100 µm.
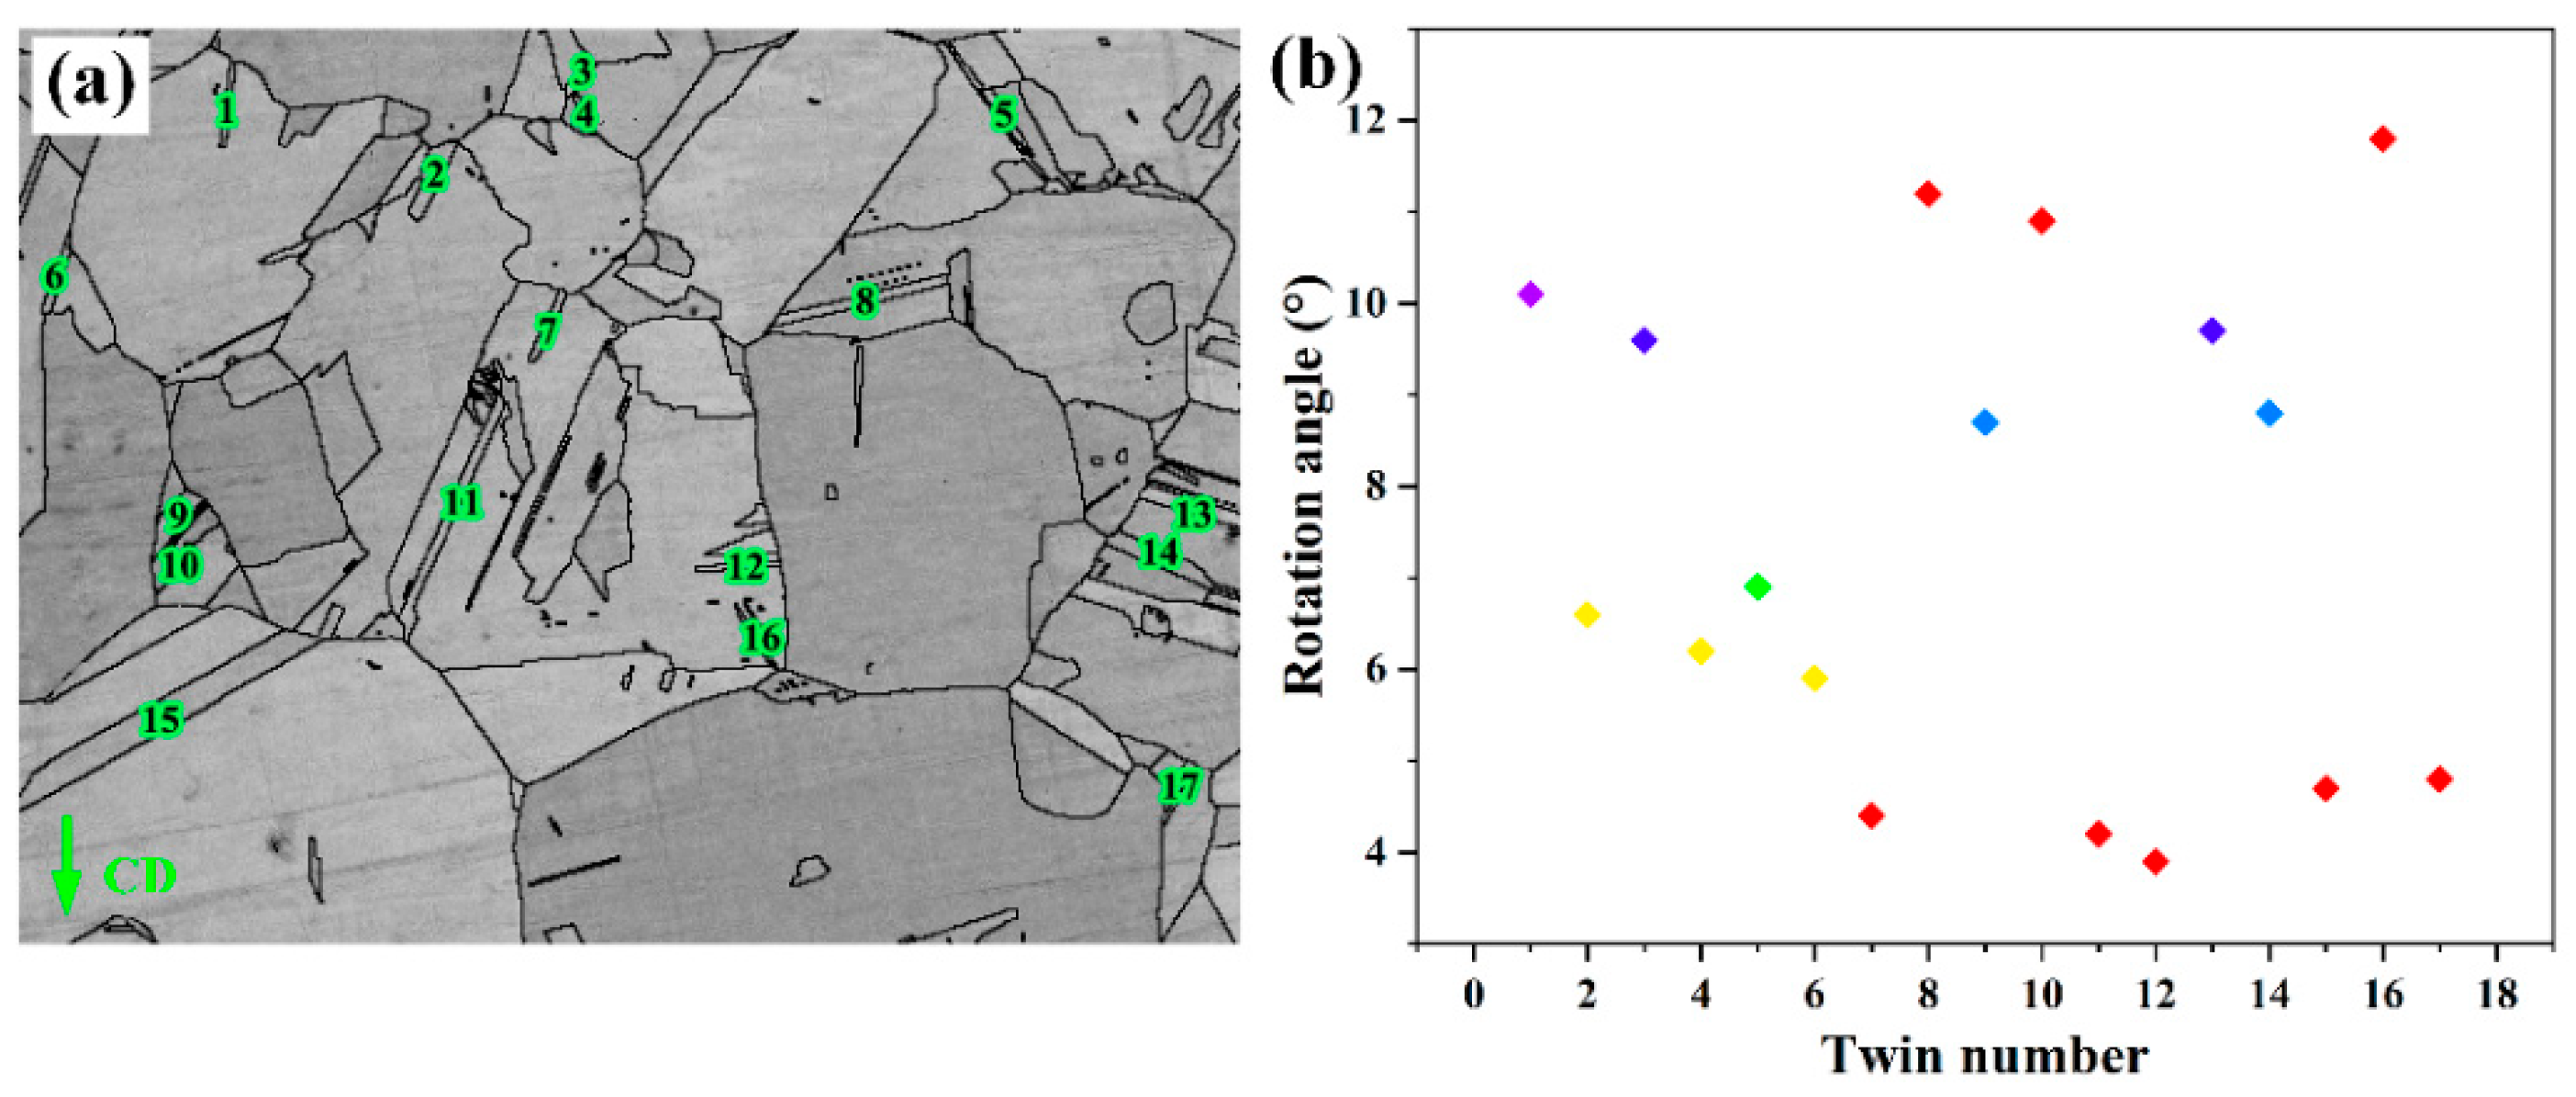
As a metal with low stacking fault energy, copper sheets may exhibit the formation of twins during deformation and annealing processes, as illustrated in Figure 7a,b. Twins or nanotwins are common morphologies found in copper, particularly nanotwins, which have become a research hotspot in recent years. The generation of nanotwins is closely related to the deformation mode and strain rate of the material, and the interaction between nanotwins and dislocations directly affects the material’s strength, electrical conductivity, fatigue performance, and so forth [27,28,29]. There are notable distinctions in the behaviors of slipping and twinning, as well as in the subsequent development of substructures. In this study, slipping was established as the primary deformation mechanism. This raises the question: How do twins participate in compression?
To address this question, 17 twins were identified and designated within the testing region, as depicted in Figure 7a. The degree of rotation fell within the range of 4.2 to 11.8 degrees, which was lower than that observed in the grains, as analyzed in Figure 6. It is worth noting that this rotation measurement only applied to twins with undamaged morphology and a high recognition degree; some other twins at the edge of the scanning field or of very small size were excluded from the count to ensure the accuracy of the analysis.
4.2. Stored Energy
The analysis above revealed that grain rotation exhibited no significant correlation with either grain size or grain aspect ratio. In theory, grain rotation is linked to grain splitting, which in turn is associated with slip activation. Slip activation, in essence, is closely tied to the crystallographic orientation of grains [30]. From this perspective, the rotational behavior is influenced by grain orientation. However, due to the diversity of orientation types within the copper strip and the finite number of identifiable grains in the testing region, this study lacked a sufficient quantity of grains to enable a statistical analysis of the orientation-dependent rotational tendencies. Nevertheless, alternative approaches were used to indirectly address this matter.
The deformation of grains gives rise to the generation of dislocations, which, in turn, results in the development of a microstress field and localized lattice distortion. These dislocations and the associated lattice distortion collectively constitute what is known as stored energy [31]. Lattice distortion causes the change in Kikuchi pattern during electron backscatter diffraction and then a change in the band contrast value of the testing point. In simpler terms, the band contrast value serves as an indicator of the magnitude of stored energy, effectively reflecting the extent of grain deformation [32,33]. This estimation is achieved by detecting grayscale levels corresponding to the minimum and maximum values within the Hough transform process [34]. Figure 8a shows the band contrast spectrum of different orientations such as Brass, Cube, and Goss. The values shown in Figure 8b and calculated from Figure 8a show that the stored energy varied from orientation to orientation. The stored energy Si is proportional to the pattern quality index Hi, as shown in the following relation [35]:
In which Si is stored energy for orientation “i”, Hi is pattern index, Qi(gi) is the pattern quality for orientation “i”, Qmin and Qmax are the minimum and maximum pattern quality of the aggregate, respectively, which can be directly collected from the Tango in the Channel 5 software. Moreover, the pattern quality index underwent normalization according to this equation, resulting in a spectrum ranging from 5 to 10. The calculated energy values for all orientations were assessed and are presented in a scattered distribution in Figure 8b.
Figure 8.
Band contrast distribution of the different orientations and the corresponding stored energy values.
Figure 8.
Band contrast distribution of the different orientations and the corresponding stored energy values.
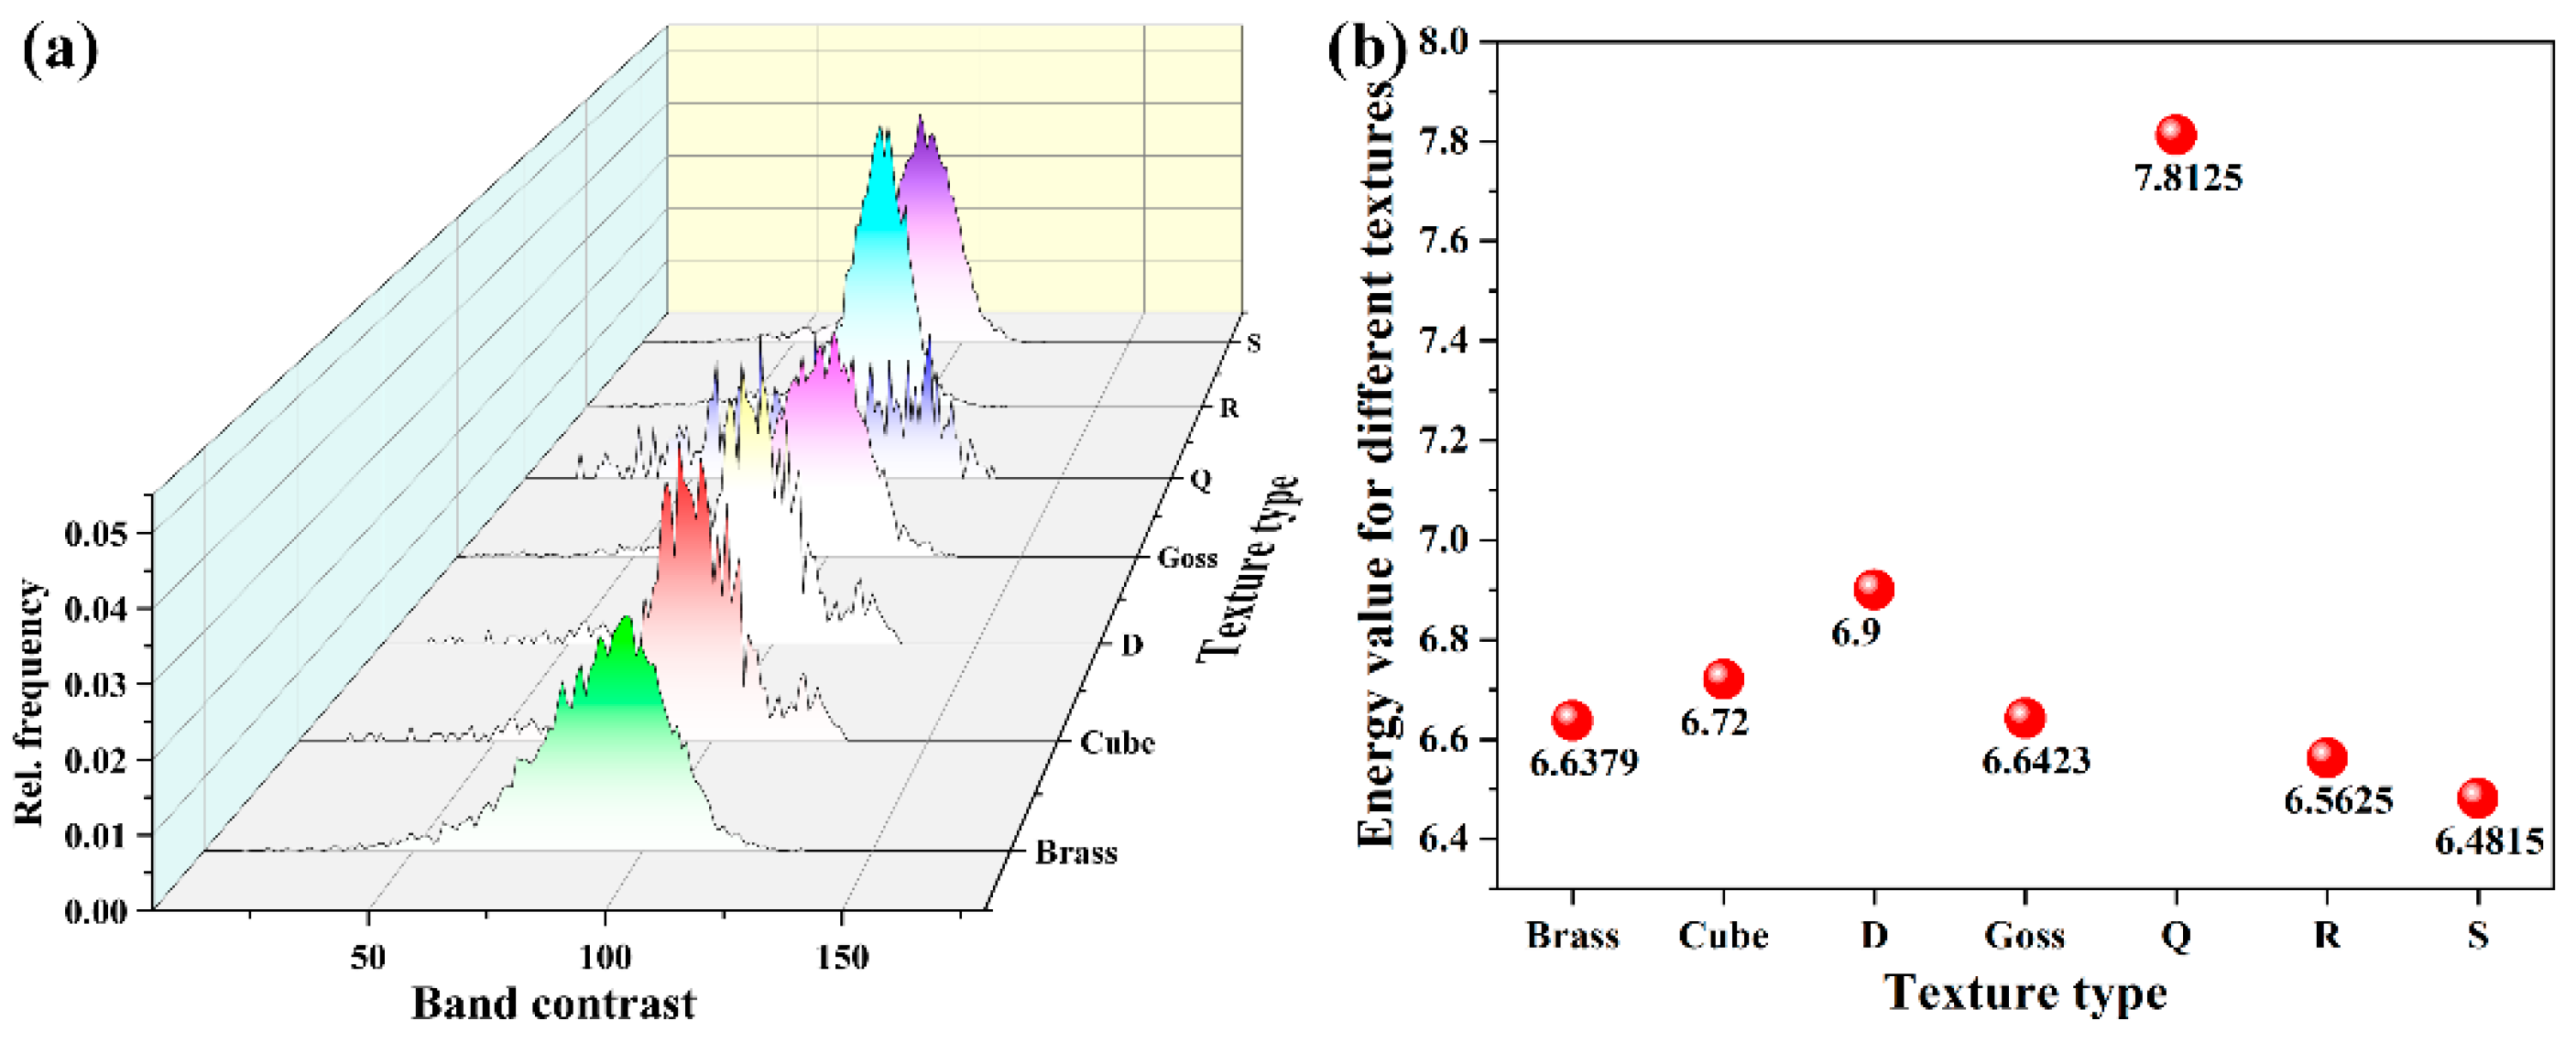
Upon close examination of Figure 8a, it becomes apparent that the peak morphology of the band contrast spectrum, including both height and width, exhibited a distinct orientation dependence. Notably, the Q orientation peak displayed a noticeable broadening. Moreover, there was a significant contrast in the estimated stored energy values among grains of different orientations, with the maximum discrepancy reaching as high as 1.331. Specifically, the maximum stored energy measured 7.8125 for the Q orientation, while the minimum was 6.4815 for the S orientation. In essence, this orientation-dependent stored energy arose from the disparate distribution of dislocation content, with the crystallographic orientation of grains playing a pivotal role in governing the initiation and progression of dislocations.
4.3. Slipping Behavior
The previous analysis elucidated the intricate relationship between grain rotation, subdivision, and the resulting distribution of stored energy, all of which are intricately linked to the orientation of grains. The elastoplastic anisotropy of grains gives rise to variations in strain across grain boundaries, leading to the relaxation of stresses within individual grains. Consequently, this relaxation activates distinct deformation modes in grains with differing orientations [36,37]. The deformation mode here mainly refers to the selective activation of the slip systems and the necessary changes as the deformation process continues. Such activation and evolution of deformation modes exert a significant influence on the volume and uniform distribution of residual stress in local regions. The question that arises is as follows: How precisely does the slip become activated? Or, put differently, how do grains undergo slipping and rotation to effectively manage stress concentration in local regions?
As shown in Figure 9, numerous slip traces appeared in the grains. The specific type of slip can be determined through the slip trace analysis method, and the SFs of the corresponding slip systems could be subsequently calculated using crystallographic computations (as explained in Section 2.2). Essentially, the SF reflects the probability of a certain type of slip system being activated under the conditions of a specific stress direction and crystallographic orientation.
As illustrated in Figure 9a, the deformation of grains was accomplished through the activation of slip systems. Some grains displayed two types of slip traces. The yellow line signifies the first slip system, while the green line corresponds to the second. It should be noted here that first and second has nothing to do with the order of the slip system activation, and those two lines here were artificially defined for ease of distinction. Close inspection of Figure 9a shows that the activation of a single or multiple slip system had no obvious relationship with the size or aspect ratio of grains.
Figure 9b shows some SFs observed in Figure 9a, including the SFs of the first and second slip systems and the theoretical maximum (SFmax) and second maximum (SFse) SFs of the testing point. As shown in Figure 9a,b, it became evident that not all the activated slip systems aligned with the theoretical slip systems having SFmax or SFse values. Some activated slip systems exhibited very small SFs. For instance, the SFs of the second slip system in grains 7, 19, and 27 are notably small, with some even falling below 0.25. This leads to the conclusion that slip system activation may not solely hinge on SF values. Similar observations have also been documented in titanium alloys. Wang et al. reported that the activation of slip systems may be associated with the degree of stress concentration and the deformation coordination of surrounding grains [38,39].
The rightmost column is the Schmid factor difference ratio (SFDR), (SFmax − SFse) × SFmax−1, which seems to be related to the case of single or multiple slip system activation. Further statistics are shown in the chart below.
As shown in Figure 10a, the SFDR of the testing points (37 points in total) were scattered successively with a wide range of 0.2185–24.9381, and the average SFDR was 9.5071. Figure 9b reveals that 54% of these points exhibited evidence of multiple slipping deformations, while the remainder displayed single slipping deformation. Close inspection of Figure 10b shows that 75% points were lower than the average SFDR during multiple slipping deformation, while the percent was 58.82% in single slipping deformation. This suggests that lower SFDR values are more inclined to trigger the activation of multiple slip systems during the deformation process. To explore this observation further, the testing region was reconstructed based on the SFDR value, and a comparison was made with the orientation imaging map and SEM maps, to further investigate this phenomenon.
As depicted in Figure 11, the SEM map and the reconstructed SFDR map exhibited perfect consistency in depicting the activation of single and multiple slip systems. This emphasizes the effectiveness of SFDR as a method for analyzing local slipping behavior. Essentially, SFDR primarily reflects the degree of deviation between the largest and second-largest Schmid factors at a given testing point. A more pronounced deviation indicates that the activation of the second slip system under a specific stress direction and crystallographic orientation becomes challenging. This dynamic can favor the dominance of single slipping in deformation behavior.
However, it is crucial to acknowledge that the grains continuously undergo rotation during deformation, resulting in alterations in their orientations. Consequently, all calculations linked to orientation, including SFs and SFDRs, undergo corresponding changes. Therefore, the SFDR undergoes actual dynamic changes as the deformation progresses. Close inspection of Figure 11c shows that the characteristic of single or multiple slipping in a grain is not unique, because there are gradient changes in the SFDR value in grains, which, to some extent, reflect the inhomogeneous deformation in some grains.
4.4. Residual Stress
In terms of its scope of influence, residual stress can be categorized into two types: macroscopic stress and microscopic stress. Macroscopic stress primarily results from the inhomogeneous plastic deformation, heating, and cooling of samples on a large scale. Its essence lies in the differential distribution of the strain in different regions of the sample.
Conversely, microscopic stress is associated with non-uniform microscopic plastic deformation, which arises due to the anisotropy of grains, and the localized lattice distortion caused by the presence of micro-sized inclusions or precipitated phases. These effects are primarily manifested through distinct configurations or densities of dislocations within localized areas [40,41]. Micro stress was the focus of the investigation and discussion in this paper.
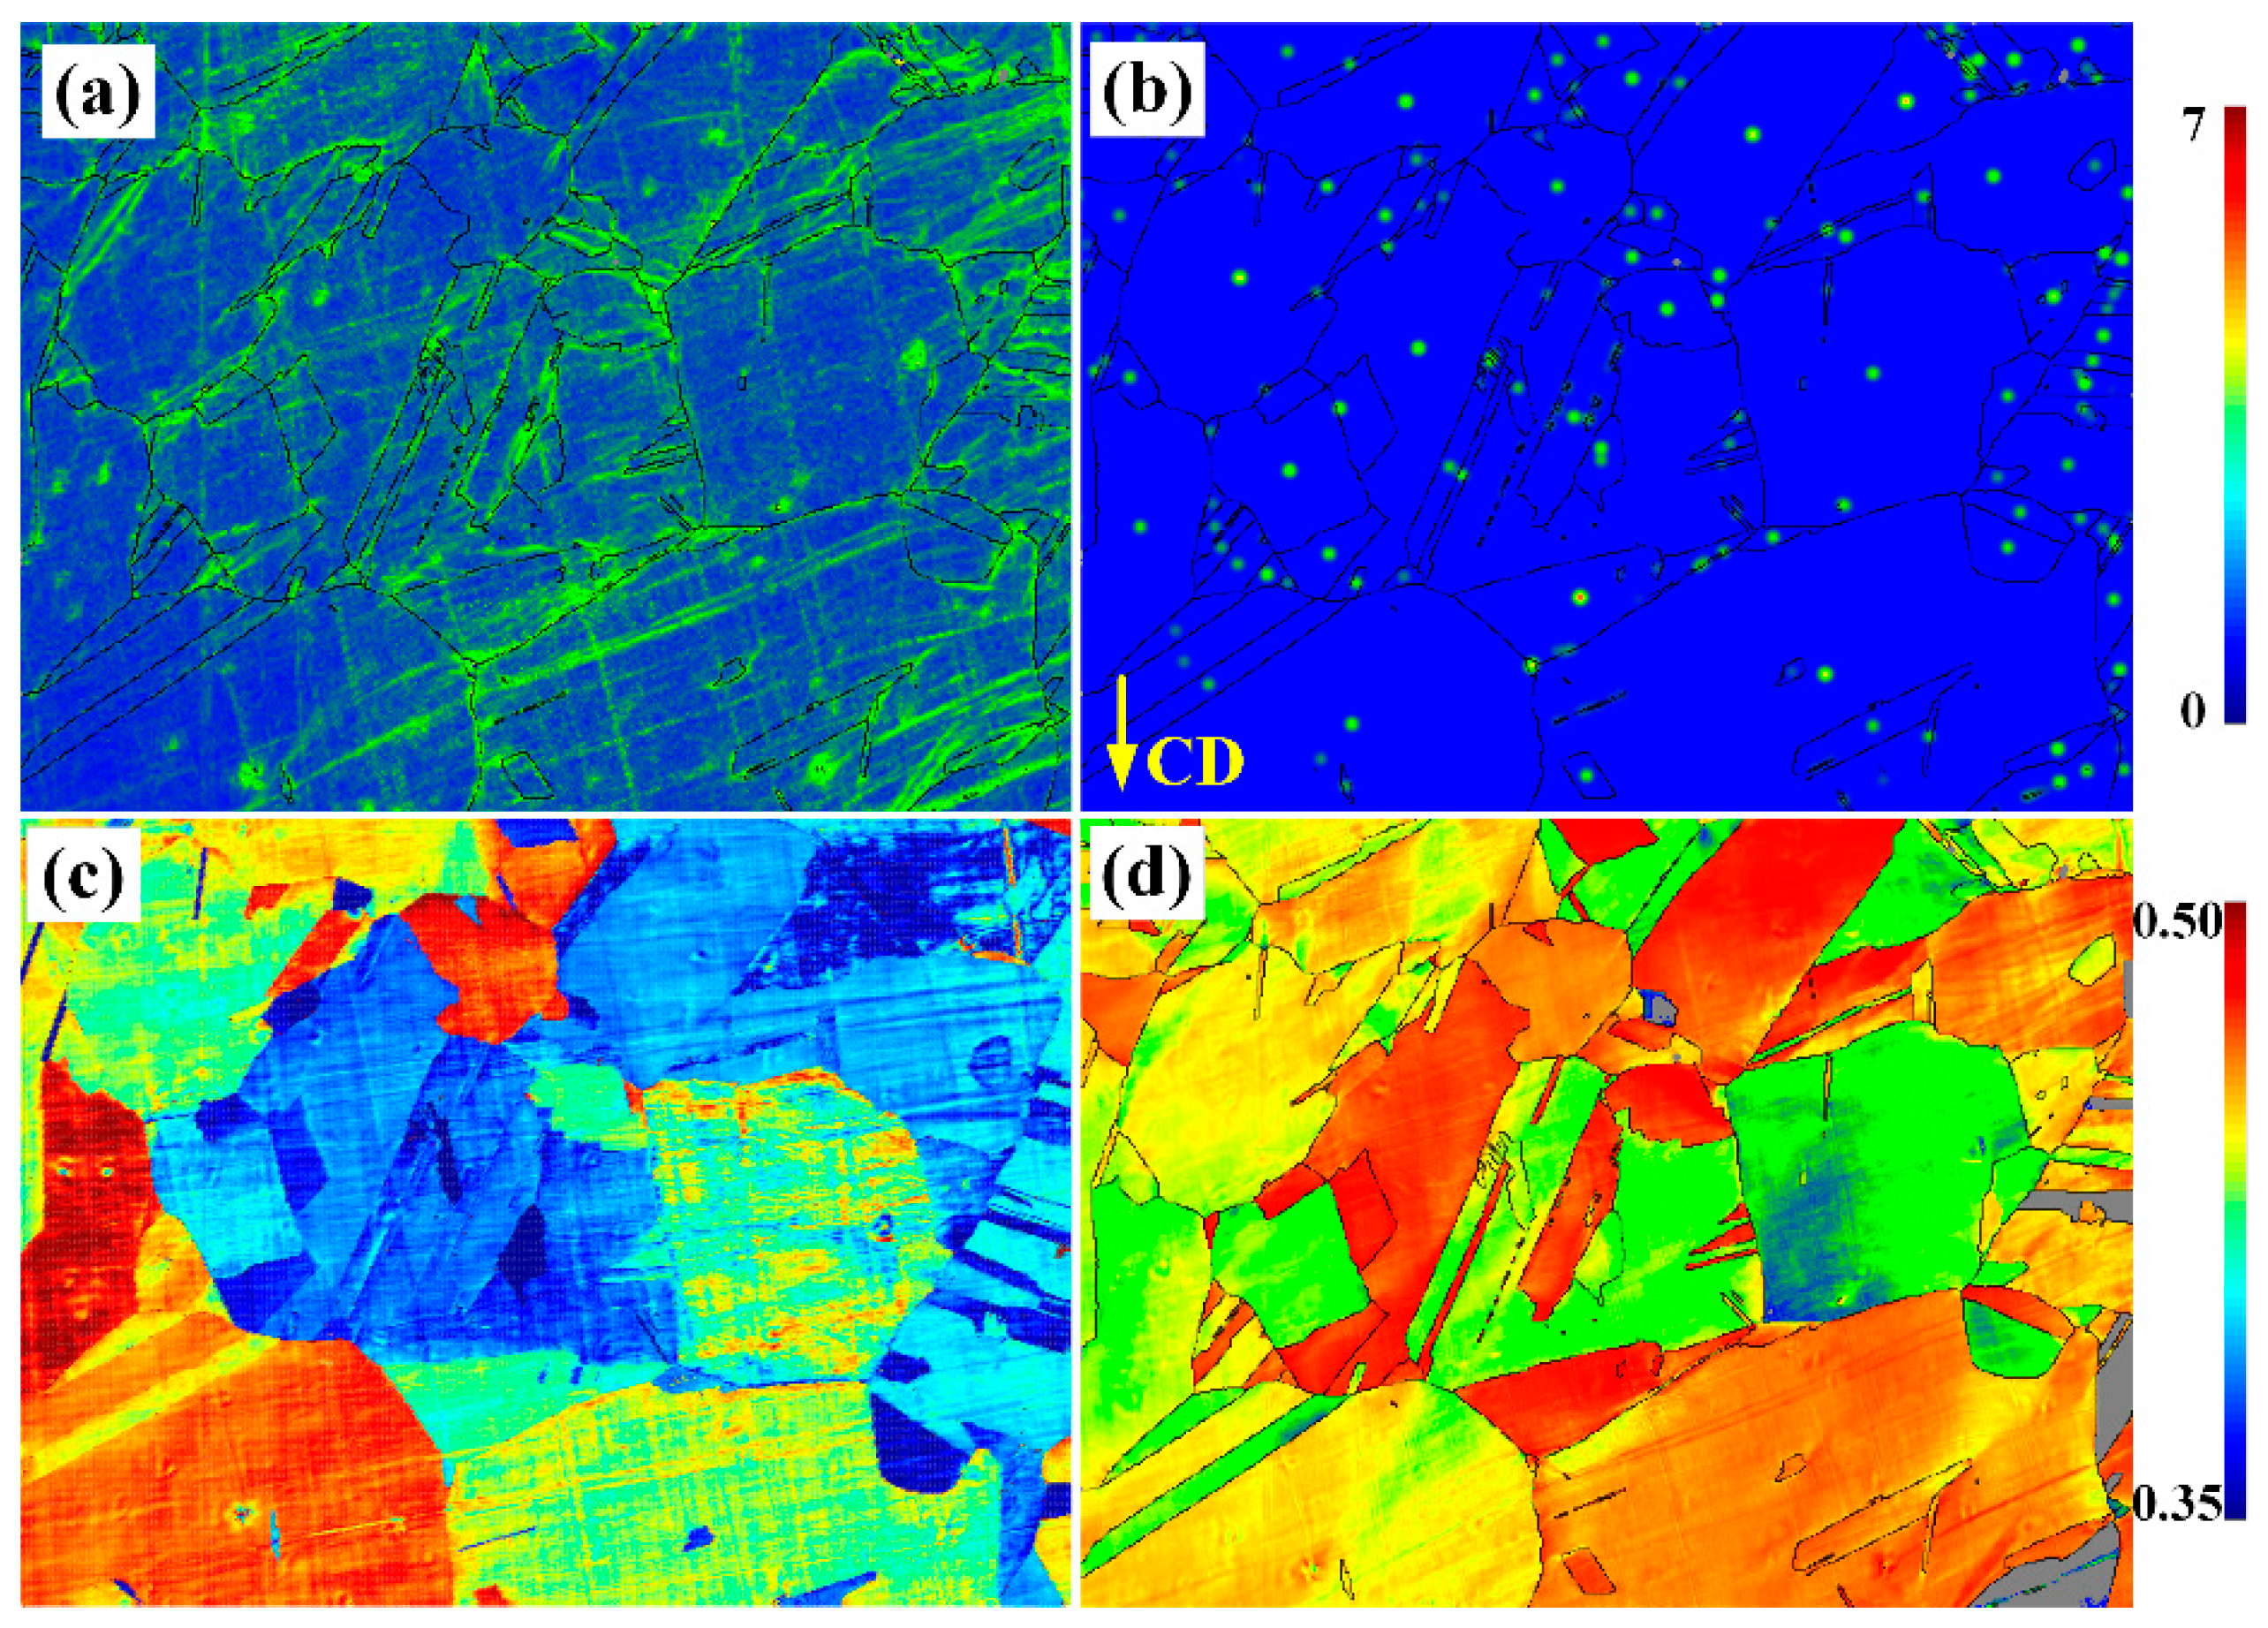
EBSD provides a visual assessment of the distribution of microscopic residual stress, with key manifestations including the kernel average misorientation map and stress concentration map, as illustrated in Figure 11a and Figure 11b, respectively. Close inspection of Figure 11a,b shows obvious stress residues near some Grain boundaries in the KAM map, while the stress concentration points in the SC diagram are mainly concentrated in the central region of grains.
Both kernel average misorientation and stress concentration maps provide valuable insights into the magnitude and distribution of residual stress. However, when it comes to examining stress within localized regions, especially within individual grains, the kernel average misorientation method holds distinct advantages. This superiority primarily stems from the differing calculation principles employed by kernel average misorientation and stress concentration for micro-stress analysis [42,43,44].
Through automated orientation imaging microscopy, the electron beam scans the designated area and records the orientation for each point. Following this, the kernel average misorientation method is utilized to calculate local misorientation using the EBSD orientation data [45,46]. The limitation of general grain boundary misorientation was set as 3°. Any misorientation larger than this critical value was excluded in the local misorientation calculation. Then, the local misorientation of a point with respect to a defined set of nearest plus second-nearest neighbor points was quantified based on the following equation [45]:
In which θ0 means the resulting local misorientation for the corresponding point and θi represents the misorientation between this point and its neighbor point i. I(θi<α) is an indicator function and α is the predefined grain boundary misorientation (here α = 3°).
Evidently, the reconstruction of the kernel average misorientation relies primarily on calculating the misorientation between adjacent points and subsequently assigning distinct colors to each point. This makes kernel average misorientation highly sensitive to individual testing points. In contrast, a stress concentration map analyzes the distribution of misorientation within a grain range. It utilizes the grain as the smallest unit to depict the extent of stress concentration, positioning each point at the center of a grain (as depicted in Figure 11b). From this perspective, kernel average misorientation provides a more accurate and intuitive representation of the distribution of residual stress, as it directly reflects the stress at each testing point.
The analysis of residual stress, grounded in the distribution and density of dislocations, encompasses a multitude of factors that impact dislocation configuration. Aspects such as initiation, evolution, and the occurrence of both single and multiple slipping during deformation all hold crucial significance in residual stress analysis. As evident from Figure 12a,c, single slipping tends to generate residual stress at grain boundaries, while multiple slipping predominantly results in residual stress within grains. This observation suggests a discernible correlation between the distribution of residual stress and the SFDR diagram.
An even more intriguing discovery is that the distribution of SFs also exerts an influence on the distribution of residual stress, particularly in regions where residual stress is more substantial. In cases of single-slipping deformation, the slip is impeded near the grain boundary, resulting in the accumulation of numerous dislocations generated by the slip at the grain boundary interface. This accumulation significantly contributes to the observed residual stress. Conversely, in instances of multiple slipping, the interaction between distinct slip systems can lead to the generation of redundant dislocations within the grain. This interaction-induced accumulation gives rise to more pronounced residual stress in the intergranular regions.
Compared to existing X-ray diffraction methods for residual stress testing, EBSD offers a more intuitive view of residual stress distribution, and it can be correlated with the microstructural features of the specimen, such as the volume and distribution of dislocations, and the size and distribution of twins. However, EBSD is sensitive to the surface condition of the sample, and there are limitations regarding the thickness and size of the region being tested.
5. Conclusions
In this study, the grain slipping behavior and the residual stress distribution were investigated during the deformation process of electronic copper strips for IC lead frames using the quasi in situ method. Utilizing the SF and slip trace analysis methods, a comprehensive analysis of the different deformation modes was conducted in this study. The analysis of the results yielded the following primary conclusions:
1. The evolution of orientation, where the maximal density increased from 3.05 to 3.92, during deformation did not exhibit a correlation with microstructural parameters such as grain size and grain aspect ratio. However, the distribution of stored energy after deformation showed a clear dependence on orientation.
2. Grains undergo deformation through either single- or multiple-slipping modes. The Schmid factor difference ratio, based on SF, provides a quantitative means to analyze the possibility of initiating different deformation modes.
3. In comparison to stress analysis conducted at the level of entire grains within the stress concentration diagram, the kernel average misorientation map proves to be more sensitive to the misorientation of neighboring points. As a result, it is better suited for the analysis and reconstruction of residual stress within localized regions.
4. A significant correlation exists between the Schmid factor difference ratio and residual stress. Single-slipping tends to induce higher residual stress at grain boundaries, whereas multiple-slipping predominantly leads to the accumulation of stress.
Author Contributions
Y.L.: conceptualization, data curation, writing—original draft preparation; Q.Z.: methodology, validation, funding acquisition; Y.Z.: software, formal analysis; K.S.: resources, supervision; X.Y.: funding acquisition, project administration; J.C.: visualization, writing—review and editing. All authors have read and agreed to the published version of the manuscript.
Funding
This research was funded by the National Natural Science Foundation of China (52105574), Key R&D and promotion projects in Henan Province (232102231017), Central Plains Talent Program—Central Plains Young postdoctoral innovative talent project in Henan Provence.
Data Availability Statement
The raw data supporting the conclusions of this article will be made available by the authors on request.
Conflicts of Interest
The authors declare no conflict of interest.
References
- Geng, Y.; Ban, Y.; Wang, B.; Li, X.; Song, K.; Zhang, Y.; Jia, Y.; Tian, B.; Liu, Y.; Volinsky, A.A. A review of microstructure and texture evolution with nanoscale precipitates for copper alloys. J. Mater. Res. Technol. 2020, 9, 11918–11934. [Google Scholar] [CrossRef]
- Zhou, F.; Zhang, Y.; Lu, L.; Song, K.; Gao, H. Effects of a thermal-ultrasonic stress relaxation process on the residual stress, mechanical properties and microstructures of C19400 copper alloy strips. Mater. Sci. Eng. A 2022, 841, 143014. [Google Scholar] [CrossRef]
- Vlcak, P.; Fojt, J.; Drahokoupil, J.; Brezina, V.; Sepitka, J.; Horazdovsky, T.; Miksovsky, J.; Cerny, F.; Lebeda, M.; Haubner, M. Influence of surface pre-treatment with mechanical polishing, chemical, electrochemical and ion sputter etching on the surface properties, corrosion resistance and MG-63 cell colonization of commercially pure titanium. Mater. Sci. Eng. C Mater. Biol. Appl. 2020, 115, 111065. [Google Scholar] [CrossRef]
- Tillmann, W.; Grisales, D.; Stangier, D.; Jebara, I.B.; Kang, H. Influence of the etching processes on the adhesion of TiAlN coatings deposited by DCMS, HiPIMS and hybrid techniques on heat treated AISI H11. Surf. Coat. Technol. 2019, 378, 125075. [Google Scholar] [CrossRef]
- Guo, J.; Fu, H.; Pan, B.; Kang, R. Recent progress of residual stress measurement methods: A review. Chin. J. Aeronaut. 2021, 34, 54–78. [Google Scholar] [CrossRef]
- Tabatabaeian, A.; Ghasemi, A.R.; Shokrieh, M.M.; Marzbanrad, B.; Baraheni, M.; Fotouhi, M. Residual Stress in Engineering Materials: A Review. Adv. Eng. Mater. 2021, 24, 2100786. [Google Scholar] [CrossRef]
- Wen, Y.; Yunxin, W.; Hai, G. Molecular dynamics simulations of the effects of annealing on the micro residual stress induced by vacancy defects in aluminum crystal. J. Cryst. Growth 2020, 546, 125754. [Google Scholar] [CrossRef]
- Lodh, A.; Tak, T.N.; Prakash, A.; Guruprasad, P.J.; Keralavarma, S.M.; Benzerga, A.A.; Hutchinson, C.; Samajdar, I. Microstructural Origin of Residual Stress Relief in Aluminum. Metall. Mater. Trans. A 2019, 50, 5038–5055. [Google Scholar] [CrossRef]
- Xiang, S.; Zhang, X. Dislocation structure evolution under electroplastic effect. Mater. Sci. Eng. A 2019, 761, 138026. [Google Scholar] [CrossRef]
- Lin, Q.; Liu, H.; Zhu, C.; Chen, D.; Zhou, S. Effects of different shot peening parameters on residual stress, surface roughness and cell size. Surf. Coat. Technol. 2020, 398, 126054. [Google Scholar] [CrossRef]
- Wei, D.; Zaiser, M.; Feng, Z.; Kang, G.; Fan, H.; Zhang, X. Effects of twin boundary orientation on plasticity of bicrystalline copper micropillars: A discrete dislocation dynamics simulation study. Acta Mater. 2019, 176, 289–296. [Google Scholar] [CrossRef]
- Wang, B.; Umeda, Y.; Miyazawa, T.; Ohtsuka, M.; Muto, S.; Arai, S.; Fujii, T. Formation mechanism of dislocation network of cell structure in cyclically deformed near-copper single crystals. Mater. Sci. Eng. A 2023, 879, 145287. [Google Scholar] [CrossRef]
- Wang, B.; Kimura, T.; Miyazawa, T.; Arai, S.; Fujii, T. Characterization of dislocation microstructures in near-[-111] single crystal copper using high-voltage scanning transmission electron microscopy. Mater. Sci. Eng. A 2023, 862, 144482. [Google Scholar] [CrossRef]
- Salandari-Rabori, A.; Fallah, V. Heterogeneity of deformation, shear band formation and work hardening behavior of as-printed AlSi10Mg via laser powder bed fusion. Mater. Sci. Eng. A 2023, 866, 144698. [Google Scholar] [CrossRef]
- Malyar, N.V.; Grabowski, B.; Dehm, G.; Kirchlechner, C. Dislocation slip transmission through a coherent Σ3{111} copper twin boundary: Strain rate sensitivity, activation volume and strength distribution function. Acta Mater. 2018, 161, 412–419. [Google Scholar] [CrossRef]
- Han, Y.; Li, H.; Feng, H.; Tian, Y.; Jiang, Z.; He, T. Mechanism of dislocation evolution during plastic deformation of nitrogen-doped CoCrFeMnNi high-entropy alloy. Mater. Sci. Eng. A 2021, 814, 141235. [Google Scholar] [CrossRef]
- Xiang, S.; Liu, X.T.; Xu, R.; Yin, F.; Cheng, G.J. Ultrahigh strength in lightweight steel via avalanche multiplication of intermetallic phases and dislocation. Acta Mater. 2023, 242, 118436. [Google Scholar] [CrossRef]
- Xue, H.; Yang, C.; Geuser, F.D.; Zhang, P.; Zhang, J.Y.; Chen, B.; Liu, F.Z.; Peng, Y.; Bian, J.J.; Liu, G.; et al. Highly stable coherent nanoprecipitates via diffusion-dominated solute uptake and interstitial ordering. Nat. Mater. 2023, 22, 434–441. [Google Scholar] [CrossRef] [PubMed]
- Cao, P.H. Maximum strength and dislocation patterning in multi–principal element alloys. Sci. Adv. 2022, 8, eabq7433. [Google Scholar] [CrossRef]
- Linne, M.A.; Bieler, T.R.; Daly, S. The effect of microstructure on the relationship between grain boundary sliding and slip transmission in high purity aluminum. Int. J. Plast. 2020, 135, 102818. [Google Scholar] [CrossRef]
- Stinville, J.C.; Callahan, P.G.; Charpagne, M.A.; Echlin, M.P.; Valle, V.; Pollock, T.M. Direct measurements of slip irreversibility in a nickel-based superalloy using high resolution digital image correlation. Acta Mater. 2020, 186, 172–189. [Google Scholar] [CrossRef]
- Xie, R.; Lu, S.; Li, W.; Tian, Y.; Vitos, L. Dissociated dislocation-mediated carbon transport and diffusion in austenitic iron. Acta Mater. 2020, 191, 43–50. [Google Scholar] [CrossRef]
- Lemarquis, L.; Giroux, P.-F.; Maskrot, H.; Castany, P. Activated twinning variant determination in cold-rolled 316L stainless steel by effective Schmid factor analysis. Materialia 2023, 30, 101812. [Google Scholar] [CrossRef]
- Li, Y.C.; Xie, H.X.; Zhen, D. Orientation effect on twin formation mechanisms of tungsten under uniaxial tension/compression. Mater. Today Commun. 2023, 36, 106790. [Google Scholar] [CrossRef]
- Swygenhoven, H.V. Grain Boundaries and Dislocations. Science 2002, 296, 66–67. [Google Scholar] [CrossRef] [PubMed]
- Poulsen, H.F.; Margulies, L.; Schmidt, S.; Winther, G. Lattice rotations of individual bulk grains. Acta Mater. 2003, 51, 3821–3830. [Google Scholar] [CrossRef]
- Kim, B.; Yasui, C.; Abe, M.; Shima, H.; Umeno, Y.; Sumigawa, T. Characteristic fatigue damage near the Σ3(111) coherent twin boundary in micron-sized copper specimen. Mater. Sci. Eng. A 2024, 899, 146470. [Google Scholar] [CrossRef]
- Chang, S.Y.; Huang, Y.C.; Li, S.Y.; Lu, C.L.; Chen, C.; Dao, M. In Situ Study of Twin Boundary Stability in Nanotwinned Copper Pillars under Different Strain Rates. Nanomaterials 2022, 13, 190. [Google Scholar] [CrossRef] [PubMed]
- Robinson, J.; Verm, A.; Homer, E.R.; Thompson, G.B. Nanotwin stability in alloyed copper under ambient and cryo-temperature dependent deformation states. Mater. Sci. Eng. A 2023, 871, 144866. [Google Scholar] [CrossRef]
- Winther, G.; Margulies, L.; Schmidt, S.; Poulsen, H.F. Lattice rotations of individual bulk grains Part II: Correlation with initial orientation and model comparison. Acta Mater. 2004, 52, 2863–2872. [Google Scholar] [CrossRef]
- Oyarzábal, M.; Martínez-de-Guerenu, A.; Gutiérrez, I. Effect of stored energy and recovery on the overall recrystallization kinetics of a cold rolled low carbon steel. Mater. Sci. Eng. A 2008, 485, 200–209. [Google Scholar] [CrossRef]
- Conde, F.F.; Ribamar, G.G.; Escobar, J.D.; Jardini, A.L.; Oliveira, M.F.; Oliveira, J.P.; Avila, J.A. EBSD-data analysis of an additive manufactured maraging 300 steel submitted to different tempering and aging treatments. Mater. Charact. 2023, 203, 113064. [Google Scholar] [CrossRef]
- Li, X.C.; Li, X.L.; Wu, T.; Lv, C.L.; Cai, C.Y. EBSD patterns simulation of dislocation structures based on electron diffraction dynamic theory. Micron 2023, 169, 103461. [Google Scholar] [CrossRef] [PubMed]
- Wilkinson, A.J.; Dingley, D.J. Quantitative deformation studies using electron back scatter patterns. Acta Metall. Mater. 1991, 39, 3047–3055. [Google Scholar] [CrossRef]
- Choi, S.-H.; Jin, Y.-S. Evaluation of stored energy in cold-rolled steels from EBSD data. Mater. Sci. Eng. A 2004, 371, 149–159. [Google Scholar] [CrossRef]
- Sun, J.; Jin, L.; Dong, J.; Wang, F.; Dong, S.; Ding, W.; Luo, A.A. Towards high ductility in magnesium alloys—The role of intergranular deformation. Int. J. Plast. 2019, 123, 121–132. [Google Scholar] [CrossRef]
- Sun, J.; Jin, L.; Dong, J.; Ding, W.; Luo, A.A. Microscopic deformation compatibility during monotonic loading in a Mg-Gd-Y alloy. Mater. Charact. 2016, 119, 195–199. [Google Scholar] [CrossRef]
- Yan, Z.; Wang, K.; Zhou, Y.; Zhu, X.; Xin, R.; Liu, Q. Crystallographic orientation dependent crack nucleation during the compression of a widmannstätten-structure α/β titanium alloy. Scr. Mater. 2018, 156, 110–114. [Google Scholar] [CrossRef]
- Wang, K.; Yan, Z.; Zhou, Y.; Wei, S.; Wang, X.; Xin, R.; Liu, Q. Slip initiation in interlayered β and corresponding slip transfer during compression of a lamellar-structure titanium alloy. Results Phys. 2020, 18, 103276. [Google Scholar] [CrossRef]
- Nazari, F.; Honarpisheh, M.; Zhao, H. The effect of microstructure parameters on the residual stresses in the ultrafine-grained sheets. Micron 2020, 132, 102843. [Google Scholar] [CrossRef]
- Mironov, S.; Ozerov, M.; Kalinenko, A.; Stepanov, N.; Plekhov, O.; Sikhamov, R.; Ventzke, V.; Kashaev, N.; Salishchev, G.; Semiatin, L.; et al. On the relationship between microstructure and residual stress in laser-shock-peened Ti-6Al-4V. J. Alloys Compd. 2022, 900, 163383. [Google Scholar] [CrossRef]
- Liang, X.Z.; Dodge, M.F.; Jiang, J.; Dong, H.B. Using transmission Kikuchi diffraction in a scanning electron microscope to quantify geometrically necessary dislocation density at the nanoscale. Ultramicroscopy 2019, 197, 39–45. [Google Scholar] [CrossRef] [PubMed]
- Wilkinson, A.J.; Britton, T.B. Strains, planes, and EBSD in materials science. Mater. Today 2012, 15, 366–376. [Google Scholar] [CrossRef]
- Wright, S.I.; Nowell, M.M.; Field, D.P. A review of strain analysis using electron backscatter diffraction, Microscopy and microanalysis: The official journal of Microscopy Society of America, Microbeam Analysis Society. Microsc. Soc. Can. 2011, 17, 316–329. [Google Scholar]
- Ma, X.; Huang, C.; Moering, J.; Ruppert, M.; Höppel, H.W.; Göken, M.; Narayan, J.; Zhu, Y. Mechanical properties of copper/bronze laminates: Role of interfaces. Acta Mater. 2016, 116, 43–52. [Google Scholar] [CrossRef]
- Calcagnotto, M.; Ponge, D.; Demir, E.; Raabe, D. Orientation gradients and geometrically necessary dislocations in ultrafine grained dual-phase steels studied by 2D and 3D EBSD. Mater. Sci. Eng. A 2010, 527, 2738–2746. [Google Scholar] [CrossRef]
Figure 1.
Schematic illuminating the quasi in situ deformation and characterization.

Figure 2.
Methodology utilized for slip analysis: (a) the occurrence of slip trace (marked using red a line) was tracked by SEM imaging. (b) EBSD OIM was carried out to identify the crystallographic orientation of the slip trace in (a). (c,d) calculation of the four possible traces and SFs for the crystallographic orientation at which a trace was detected and determination of the active slip system. CD here means the compress direction.
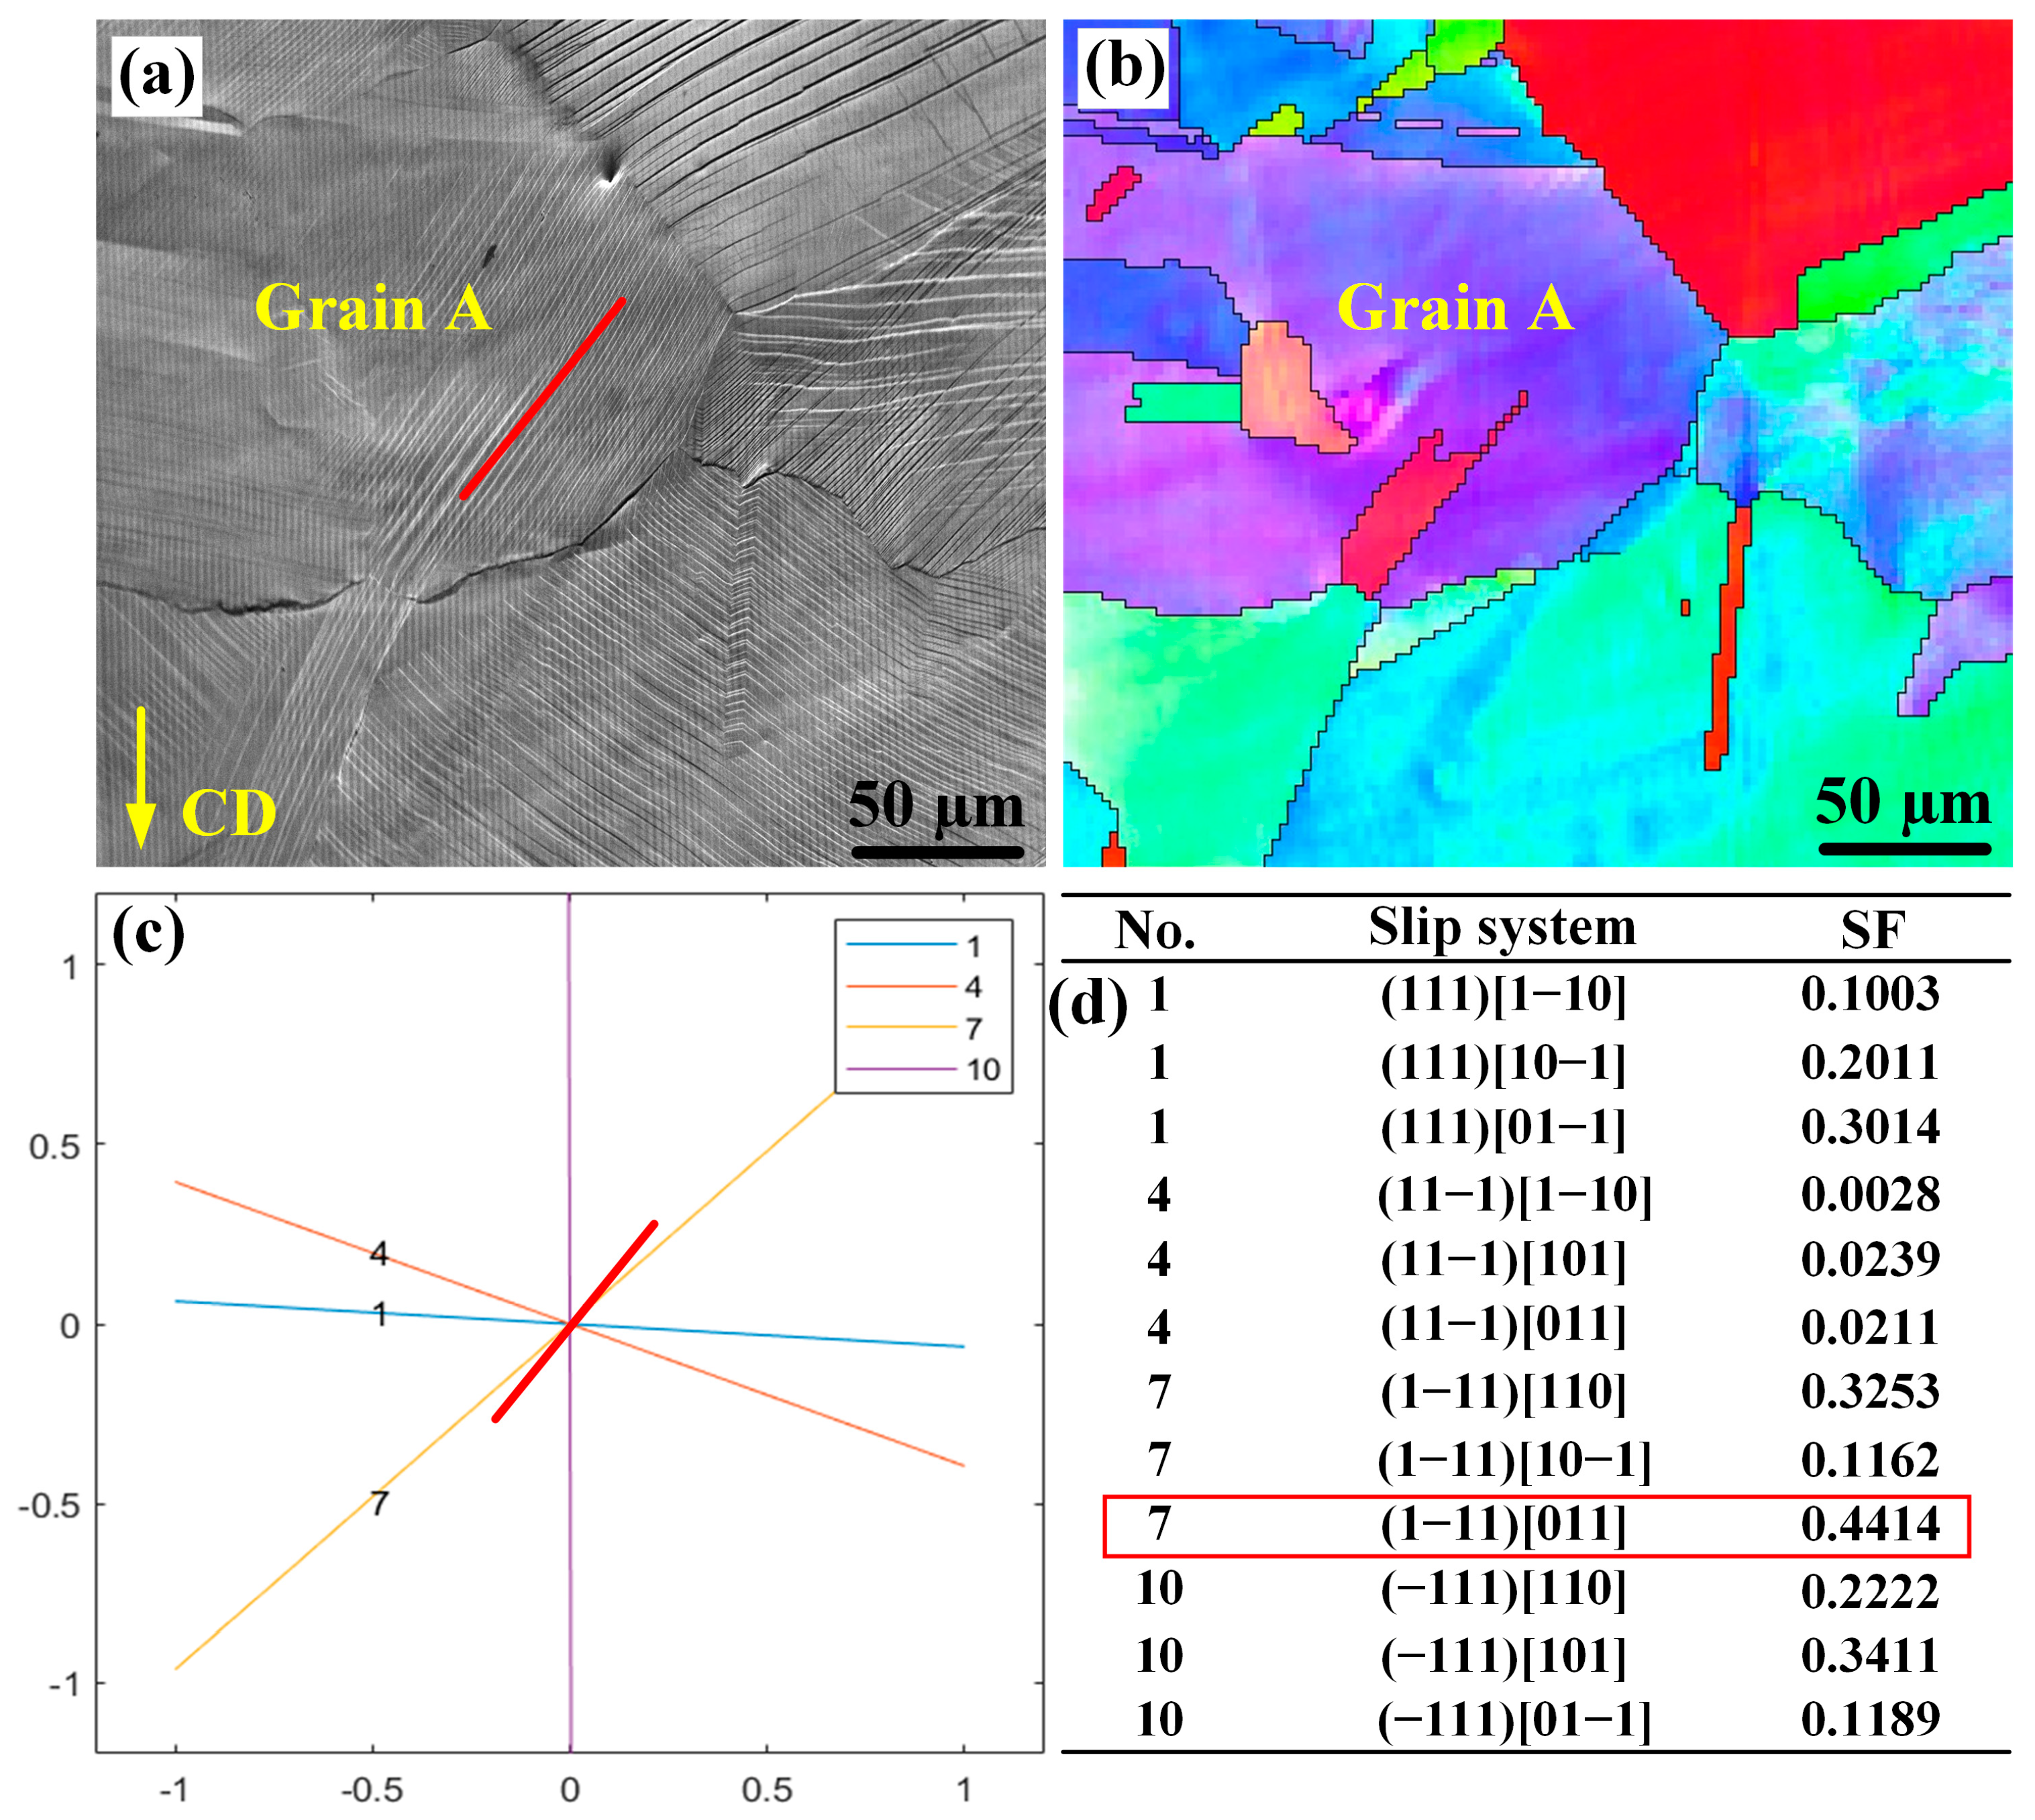
Figure 3.
SEM maps of specimen: (a) before compression, (b) after compression.

Figure 4.
EBSD maps of the specimen before and after compression. (a,b) are orientation imaging maps of the testing region. (c,d) are grain boundary maps of the testing region. (e) shows the misorientation evolution during compression.
Figure 4.
EBSD maps of the specimen before and after compression. (a,b) are orientation imaging maps of the testing region. (c,d) are grain boundary maps of the testing region. (e) shows the misorientation evolution during compression.

Figure 5.
Inverse pole figures and orientation contents of a specimen. (a) before compression. (b) after compression. (c) orientation contents change.
Figure 5.
Inverse pole figures and orientation contents of a specimen. (a) before compression. (b) after compression. (c) orientation contents change.
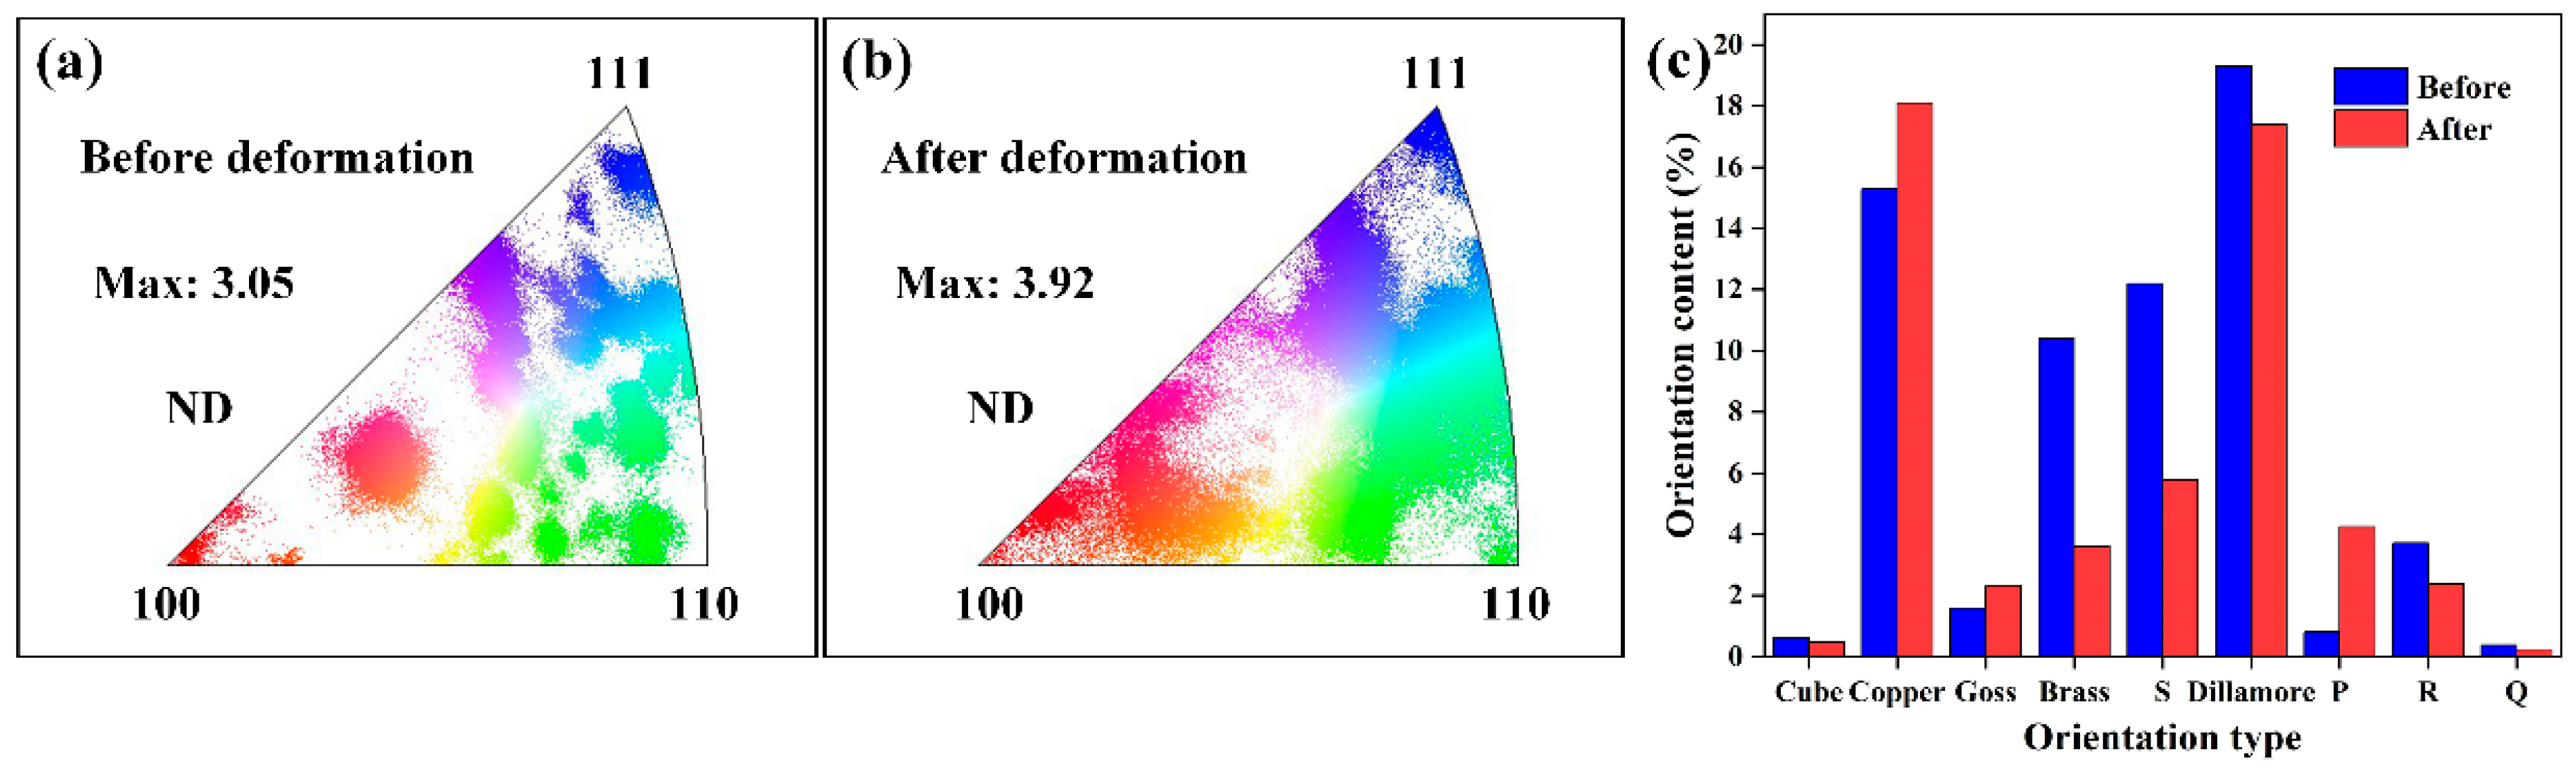
Figure 6.
Grain rotation and its influencing factors. (a) Numbered grains. (b) Aspect ratio influence on grain rotation. (c) Grain size influence on grain rotation.
Figure 6.
Grain rotation and its influencing factors. (a) Numbered grains. (b) Aspect ratio influence on grain rotation. (c) Grain size influence on grain rotation.
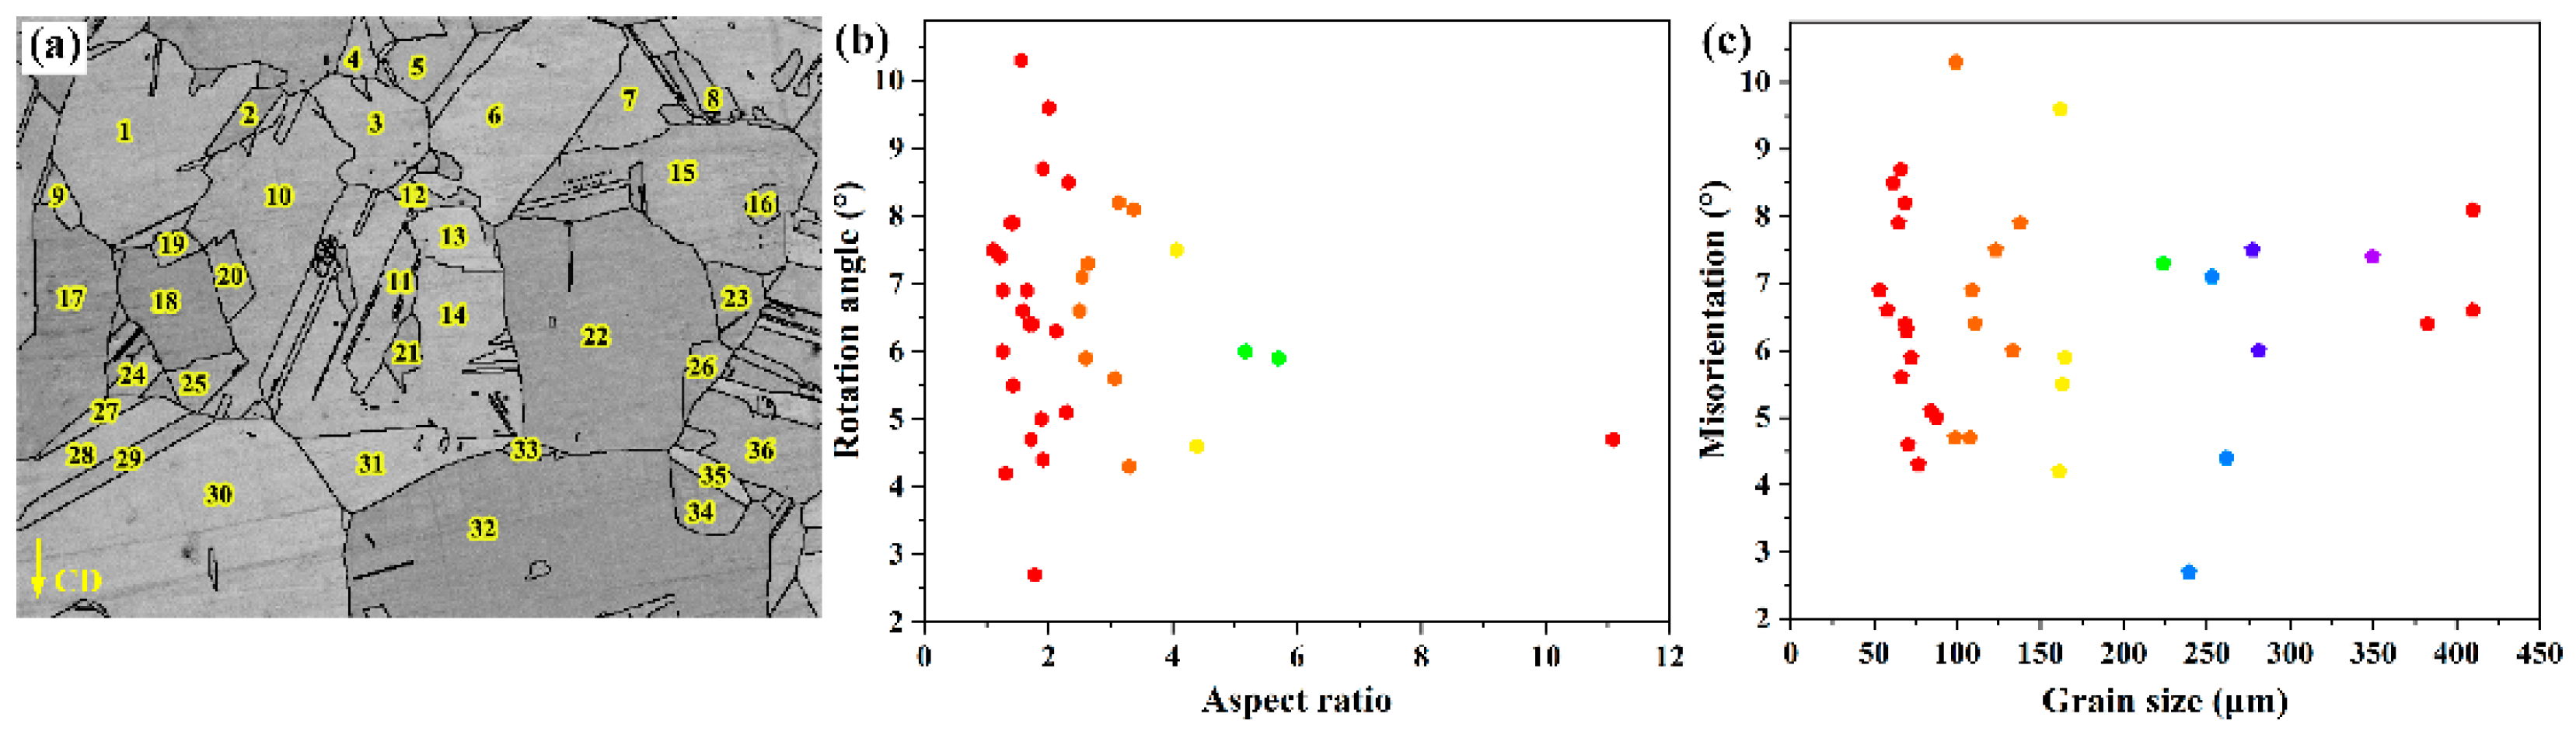
Figure 7.
Twin rotation during compression. (a) Numbered twins. (b) Rotation degrees for the numbered twins.
Figure 7.
Twin rotation during compression. (a) Numbered twins. (b) Rotation degrees for the numbered twins.

Figure 9.
Slip trace calibration and the corresponding SFs. (a) Slip trace calibration. (b) SFs of the slip systems.
Figure 9.
Slip trace calibration and the corresponding SFs. (a) Slip trace calibration. (b) SFs of the slip systems.
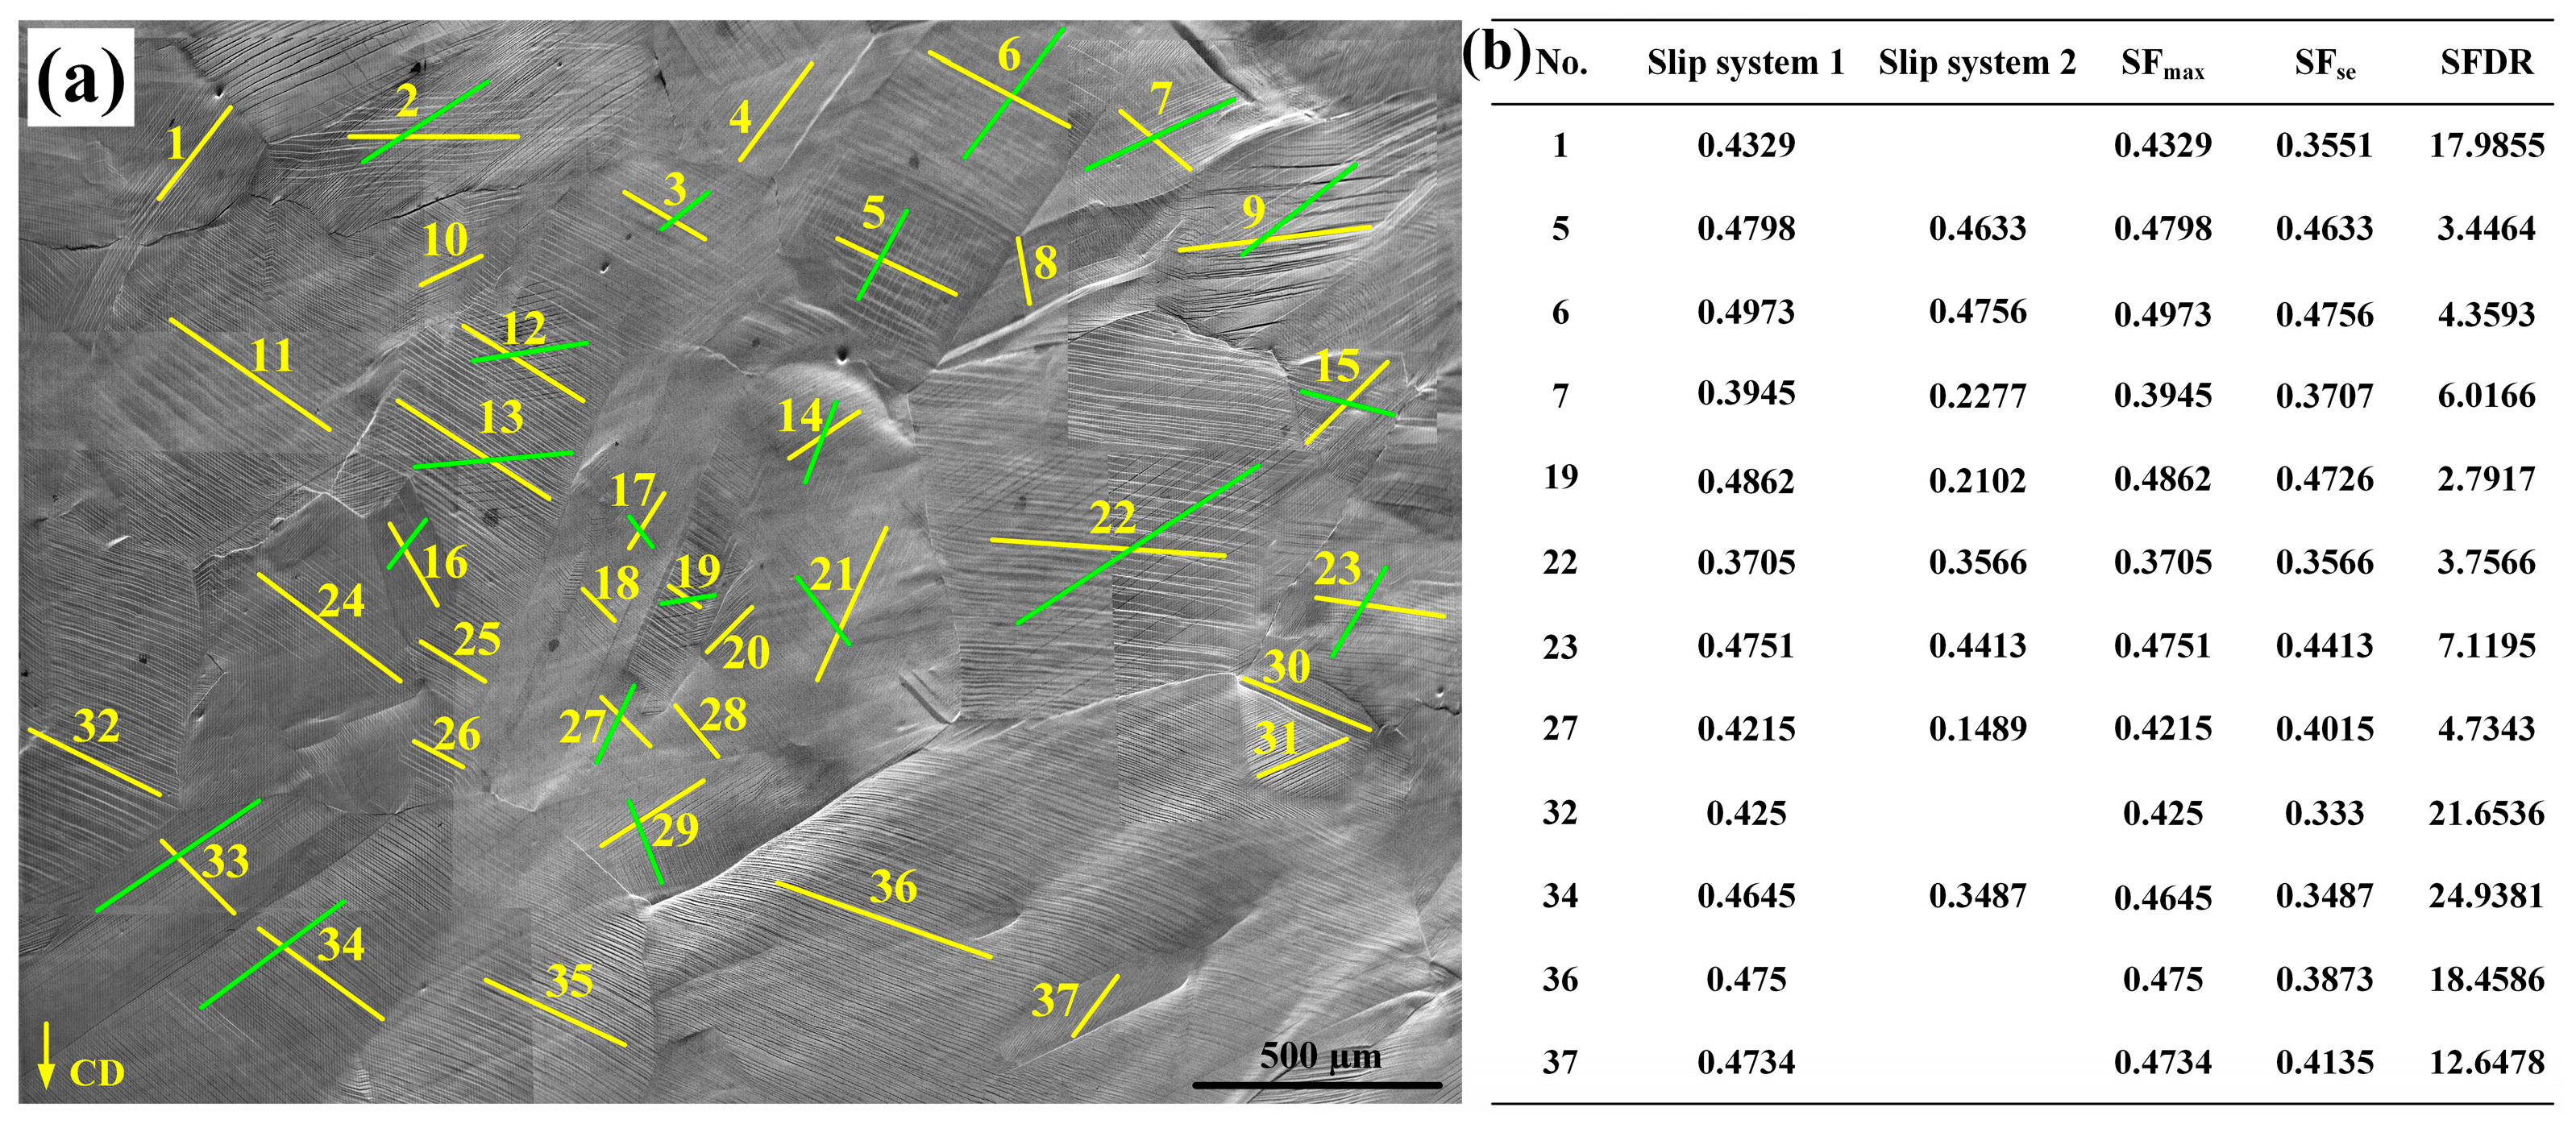
Figure 10.
SFDR for the extracted grains and its reflection for single and multiple slip system activation.
Figure 10.
SFDR for the extracted grains and its reflection for single and multiple slip system activation.
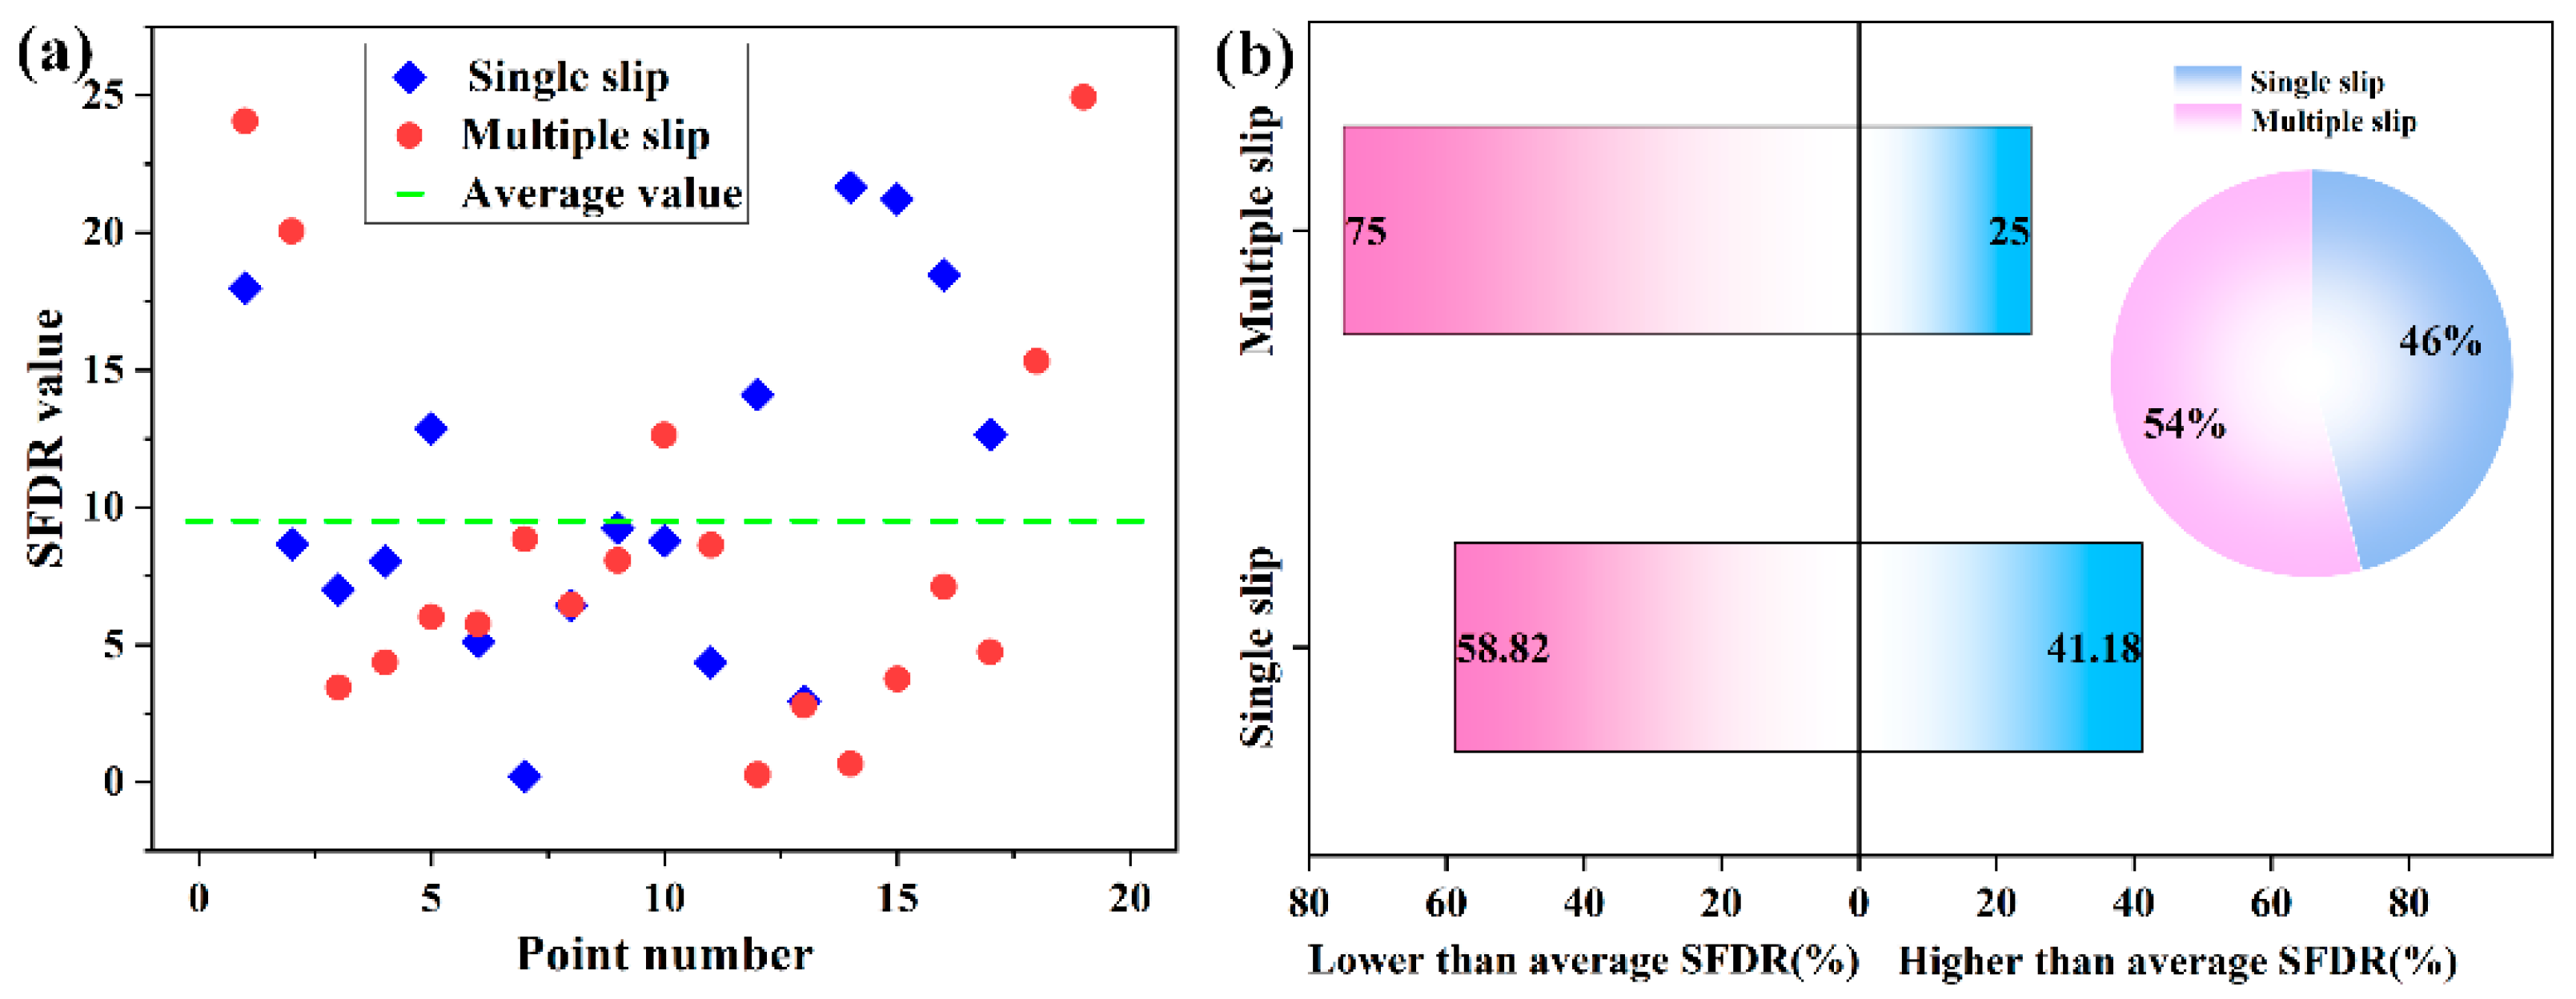
Figure 11.
Orientation imaging map, SEM map, and the reconstructed SFDR map of the testing region. (a) OIM. (b) SEM map. (c) The reconstructed SFDR map.
Figure 11.
Orientation imaging map, SEM map, and the reconstructed SFDR map of the testing region. (a) OIM. (b) SEM map. (c) The reconstructed SFDR map.

Figure 12.
Reconstructed kernel average misorientation, stress concentration, SFDR, and SF maps. (a) Kernel average misorientation map. (b) Stress concentration map. (c) SFDR map. (d) SF map.
Figure 12.
Reconstructed kernel average misorientation, stress concentration, SFDR, and SF maps. (a) Kernel average misorientation map. (b) Stress concentration map. (c) SFDR map. (d) SF map.
Disclaimer/Publisher’s Note: The statements, opinions and data contained in all publications are solely those of the individual author(s) and contributor(s) and not of MDPI and/or the editor(s). MDPI and/or the editor(s) disclaim responsibility for any injury to people or property resulting from any ideas, methods, instructions or products referred to in the content. |
© 2024 by the authors. Licensee MDPI, Basel, Switzerland. This article is an open access article distributed under the terms and conditions of the Creative Commons Attribution (CC BY) license (https://creativecommons.org/licenses/by/4.0/).
Share and Cite
MDPI and ACS Style
Liu, Y.; Zhu, Q.; Zhou, Y.; Song, K.; Yang, X.; Chen, J. Quasi In Situ Study on the Slipping Behavior and Residual Stress of Copper Strip. Metals 2024, 14, 491. https://doi.org/10.3390/met14050491
AMA Style
Liu Y, Zhu Q, Zhou Y, Song K, Yang X, Chen J. Quasi In Situ Study on the Slipping Behavior and Residual Stress of Copper Strip. Metals. 2024; 14(5):491. https://doi.org/10.3390/met14050491
Chicago/Turabian StyleLiu, Yahui, Qianqian Zhu, Yanjun Zhou, Kexing Song, Xiaokang Yang, and Jing Chen. 2024. "Quasi In Situ Study on the Slipping Behavior and Residual Stress of Copper Strip" Metals 14, no. 5: 491. https://doi.org/10.3390/met14050491
Note that from the first issue of 2016, this journal uses article numbers instead of page numbers. See further details here.