
Experimental Study of Performance of Ti-6Al-4V Femoral Implants Using Selective Laser Melting (SLM) Methodology

School of Mechanical Engineering, Jiangsu University of Science and Technology, Zhenjiang 212000, China
*
Author to whom correspondence should be addressed.
Metals 2024, 14(5), 492; https://doi.org/10.3390/met14050492
Submission received: 19 March 2024
/
Revised: 17 April 2024
/
Accepted: 19 April 2024
/
Published: 23 April 2024
(This article belongs to the Topic Alloys and Composites Corrosion and Mechanical Properties)
Abstract
:Selective laser melting (SLM) technology used for the design and production of porous implants can successfully address the issues of stress shielding and aseptic loosening associated with the use of solid implants in the human body. In this paper, orthogonal experiments were used to optimize the process parameters for SLM molding of Ti-6Al-4V (TC4) material to investigate the effects of the process parameters on the densities, microscopic morphology, and roughness, and to determine the optimal process parameters using the roughness as a judging criterion. Based on the optimized process parameters, the mechanical properties of SLM-formed TC4 alloy specimens are investigated experimentally in this paper. The main conclusions are as follows: the optimal combination of roughness is obtained by polar analysis, the microhardness of SLM-molded TC4 alloy molded specimens is more uniform, the microhardness of specimens on the side and the front as well as the abrasion resistance is higher than that of casting specimens, the yield strength and tensile strength of specimens is higher than that of ASTM F136 standard and casting standard but the elongation is not as good as that of the standard, and the elasticity and compressive strength of porous specimens are higher than that of casting specimens at different volume fractions. The modulus of elasticity and compressive strength are within the range of human skeletal requirements. This work makes it possible to fabricate high-performance porous femoral joint implants from TC4 alloy SLM-molded materials.
Keywords:
process parameters; SLM; TC4; femoral implant; molding performance; mechanical performance1. Introduction
In today’s medical field, most of the solid metal implants used are prone to aseptic loosening, leading to a decrease in the service life of the implant [1,2,3,4]. It is possible to design the implant surface or all of it as a porous structure, but conventional manufacturing techniques are not able to achieve complex porous structures [5,6]. Selective laser melting (SLM) technology can achieve the molding of almost any complex structural parts with good mechanical properties and high molding accuracy. In terms of implant molding, the molding performance of SLM technology has met the requirements, but the performance of SLM-molded parts needs further research [7]. Titanium alloy material has been widely used in the field of bone implants such as in artificial scaffolds and artificial joints and dentures because its elastic modulus is close to that of autologous bone [8,9]. Powder material properties play an important role in the SLM forming process and the density of the formed parts and good powder properties are the basic guarantee of SLM forming technology.
Elshaer et al. [10] and Sangali et al. [11] investigated the corrosion properties of Ti-6Al-4V alloys fabricated by casting and SLM methods in 0.9% NaCl, respectively, in which the corrosion rate was 0.000171 mm/yr in case of casting, and corrosion products appeared on the surface of the samples in the case of SLM, and corrosion became more pronounced the faster the scanning speed. A lot of research has been conducted on cast Ti-6Al-4V. Feng et al. [12], Zhu et al. [13], Lee et al. [14], and Wen et al. [15] have determined the mechanical properties of Ti-6Al-4V cast alloys and the mechanical properties of Ti-6Al-4V casting alloys in terms of the machining conditions, the addition of Ti-TiB2 nanoparticles, vacuum centrifugation, Ni sandwich method from a single point of view, and the mechanical properties of Ti-6Al-4V casting alloys and the mechanical properties of Ti-6Al-4V casting alloys from a single point of view, in addition to 4V casting alloy’s mechanical properties as well as strength. In addition, some scholars have also investigated the properties of Ti-6Al-4V alloys made by the SLM method: Banu et al. [16] investigated the chemical properties of SLM Ti alloys in a lactic acid environment and observed that the corrosion resistance rate of Ti alloys by the SLM method was lower than that of wrought alloys; Cheng et al. [17] investigated Ti alloys with 0.3 wt.% Zn additions, and concluded they had better impact toughness and stable high-temperature tensile mechanical properties; Ben-Hamu et al. [18] investigated the corrosion resistance of Ti-6Al-4V in 0.9 M NaCl solution under EBM and SLM fabrication methods, and the results show that the corrosion resistance of SLM method Ti-6Al-4V alloys is slightly superior to that of the EBM method Ti-6Al-4V in both the XY and XZ planes. In recent years, the corrosion resistance of the SLM method Ti-6Al-4V alloys for medical articles has also been studied: Tamaddon et al. [19], Mondal et al. [20], and Kutsukake et al. [21] investigated the performance of SLM method Ti alloys in the field of implants, and initially confirmed that SLM method Ti-6Al-4V alloys have a certain development potential in the field of medical implants.
To summarize, the difficulty is in utilizing the important properties of the good biocompatibility and structural or mechanical compatibility of titanium, and the excessive densification of the SLM method may cause problems such as stress shielding or aseptic loosening of the implant, and the current research lacks an analysis of the properties of the SLM method in making multi-hollow femoral implants out of Ti-6Al-4V alloys; in particular, the topography of the material properties of the SLM method Ti-6Al-4V alloys.
The main objective of this study was to investigate the obtaining of high-performance porous femoral implants from TC4 alloy SLM-molded materials. Firstly, the best process parameters for SLM forming of Ti-6Al-4V materials were optimized by orthogonal test, and the best process parameters based on roughness evaluation criteria were determined. Then, based on the optimized process parameters, the microstructure, microhardness, tensile properties, compressive properties, and friction and wear properties of the SLM-molded specimens were systematically analyzed, and it was discovered that the microhardness, yield strength, tensile strength, and wear resistance of the TC4 alloy SLM-molded specimens were better than those of the casting specimens, but the elongation at break was slightly lower than that of the ASTM F136 standard [22]. The feasibility of molding porous femoral implants with SLM TC4 alloys was verified. This study lays the foundation for the application of high-performance porous femoral implants.
2. Materials and Methods
2.1. Materials
The experiments use TC4 powder from EOS company in Krailling, Germany, and its main chemical composition is shown in Table 1, which meets the requirements of China GB/T 13810-2007 [23] and the American ASTM F136 standard for the use of surgical implantation of titanium and titanium alloy materials. Table 2 shows the basic characteristics of TC4 powder. The bulk density of the powder is 2.45 g/cm3.
2.2. Experimental Apparatus and Experimental Methods
2.2.1. Orthogonal Test of Process Parameters
The essence of SLM technology molding is to use the laser to melt the metal powder and then use a molding process; in this process, the laser power, powder properties, scanning parameters, and other parameters will have different degrees of influence on the molding quality of the specimen. Thus, the introduction of the concept of laser energy density per unit volume and the size of the laser energy density per unit volume directly affects the molding quality. Laser unit volume energy density expression is shown in Equation (1) [25].
According to Equation (1), it can be seen that laser power (P), scanning speed (v), scanning pitch (d), and powder spread thickness (h) are the direct factors affecting the laser energy density per unit volume. It is also found by referring to the previous experimental study that laser power, scanning speed, scanning spacing, and powder spreading thickness are the most important process parameters affecting the quality of SLM molding [26]. This chapter focuses on optimization experiments for these four process parameters. The design of the orthogonal experimental program with four levels for four factors is shown in Table 3.
The purpose of the orthogonal test is to analyze the effects of different factors and different levels on the experimental results, and then determine the best level for each factor. Extreme variance analysis, analysis of variance, and signal-to-noise ratio analysis are commonly used to analyze data from orthogonal tests, and in this chapter, the extreme variance method was used to analyze the densification and surface roughness (using the profile arithmetic mean deviation Ra) of the 16 groups of specimens.
According to the process parameters designed in Table 3, 16 groups of specimens were printed using the EOS M290 molding equipment with a specimen size of 10 mm × 10 mm × 10 mm. The display effect of the specimens in Materialise Magics 24.0 software before printing is shown in Figure 1a, and the effect display after the specimen printing is completed is shown in Figure 1b.
2.2.2. Densification Experiments Based on the Drainage Method
Based on the drainage method, this experiment uses a high-precision electronic balance with an accuracy of up to 0.0001 g to measure the quality of SLM-molded specimens. The specific steps are as follows: (1) clean the surface of the specimen by, firstly, placing the specimen in the ultrasonic cleaner with alcohol solution, cleaning the specimen for ten minutes according to the specification of the manual, and then taking the specimen out and drying it for subsequent measurement of its mass; (2) measure its mass in the air; (3) measure its mass after being completely submerged in water; and (4) calculate its densification according to the formula shown below.
where is the densification of the specimen, is the actual density of the specimen, and is the theoretical density of the specimen.
where is the mass of the specimen in air, is the mass of the specimen completely submerged in water, and is the density of water taken as 1.0 g/cm3.
2.2.3. Micromorphological Analysis of Materials
In this experiment, the shape measurement laser confocal microscope of VK-X1000 which manufactured by Keyence Corporation, Osaka, Japan (the microscope has an integrated magnification of up to 28,800×; a minimum field of view from 11 µm to 7398 µm; laser measurement speeds from 4 to 125 Hz, 7900 Hz; a height measurement resolution of 0.5 nm; a dynamic range of 16 bit; an accuracy of 0.2 + L/100 µm; a width measurement resolution of 1 nm; and the ability to observe images that include ultra-high resolution color CMOS images, 16 bit laser color confocal images, confocal and ND filter optics, and C-laser differential interference images) series was used to scan the morphology of SLM-molded specimens, which mainly included focus variation and laser confocal with a display resolution of 0.001 μm.
A scanning electron microscope (SEM) uses secondary electrons that are very sensitive to the surface state of the material and backscattered electron imaging that can produce specific compositional information. In this experiment, a FEI Quanta FEG 250, Hillsboro, OR, USA (the FEI QUANTA FEG250 field-emission scanning electron microscope has a secondary electron image resolution of 1.04 nm, a magnification of 15 to 300,000 times, an accelerating voltage of 0.2 to 30 kV, and a detection current of 0.3–22 nA) scanning electron microscope was used to observe and analyze the microscopic morphology of SLM-molded TC4 specimens.
The microstructure observation of SLM-molded TC4 specimens was carried out by a German Zeiss Observer D1m, Jena, Germany (micrometer: grid value of 0.001 mm/1 mm; differentiated eyepiece: 10× flat field zoom, grid value of 0.1 mm; and total magnification: 100–1000×; focusing mechanism: coaxial coarse micromanipulation; limit protection, lifting range of 30 mm, fine-tuning 0.002 mm) metallographic microscope. It is worth noting that before the metallographic observation of the TC4 specimen, it is first necessary to prepare a metallographic specimen, which needs to be sanded with different grits (320#, 600#, 1200#, 1500#, 2000#) of sandpaper, so that the surface of the metallographic specimen should be characterized by a basically smooth surface, free of stains and obvious scratches. After the initial formation of metallographic specimens, in order to be able to more clearly observe the microstructure of the specimen, a metallographic specimen corrosion treatment must be used. The corrosion solution chosen is Kroll reagent, the solvent ratio of the reagent is 5 mL HF:10 mL HNO3:85 mL H2O, and the corrosion time of the metallographic specimen using Kroll reagent is set to 20 s.
2.2.4. Measurement of Surface Roughness
In this experiment, the surface roughness of the SLM-molded TC4 specimen was measured using the roughness tester Mitutoyo (Kawasaki, Japan). During the measurement, three sampling points were selected on the surface of the TC4 molding specimen for measurement, and the average of the surface roughness of the three points was calculated, and this value was taken as the surface roughness value of the surface of the TC4 molded part.
2.2.5. Micro-Vickers Hardness Determination
This experiment used an HVS-1000AT/EOS100B which manufactured by NANBEI Instruments Ltd., Zhengzhou, China (measuring range of hardness value: 5–5000 HV; optical measuring system objective lens: 10× (observation), 40× (measurement); total magnification of optical measuring system: 100× (observation), 400× (measurement); measuring range: 200 μm; index value: 0.025 μm; light source: 12 V/20 W) automatic microhardness tester to test the surface hardness of SLM-molded specimens. In order to ensure the accuracy of the specimen Vickers hardness test data, before the Vickers hardness test, first of all, sandpaper of the mesh numbers 280 mesh, 400 mesh, 600 mesh, 800 mesh, 1000 mesh, 1500 mesh was used. The specimen was polished, and then the polishing paste was used to polish the specimen on the polishing machine to ensure that the surface of the specimen was clean and flat without large scratches. For the test, three parallel lines were selected in the measurement plane of the specimen, and five consecutive points with the same distance between each point were selected for measurement, with the distance between each point being 1 mm, and the distance between the starting point and the edge of the specimen in the measurement plane being more than 1 mm. The load size selected for the test was 9.8 N, and the loading duration was set to 15 s. After the load was unloaded, the microscopic images were transferred to a data transmission channel Based on the diagonal length of the rhombus measured by the four-line method, the computer automatically displayed the micro-hardness values, and the average of the micro-hardnesses of the five points was finally taken as the micro-hardness of the measurement plane of the specimen.
2.2.6. Tensile and Compression Tests
We used CMT 5105 microcomputer-controlled electronic universal testing equipment, which manufactured by JINSON Optical Instruments Ltd. in Nanjing, China, to measure the tensile and compressive properties of the specimen. The maximum test force of 100 KN was used, and was tested using constant speed loading mode: for tensile test, a loading rate of 0.5 mm/min; for compression test, a loading rate of 1 mm/min. The equipment recorded the entire experimental process of force and displacement () relationship. According to Equations (2)–(5), the force–displacement () relationship can be transformed into the actual stress–strain () relationship, and the transformation formula is as follows:
where is the nominal stress, is the nominal strain, is the initial length of the specimen, and is the initial cross-sectional area of the specimen.
2.2.7. Friction Wear Test
This experiment uses the FTM M30 modular-controlled lubrication multifunctional friction and wear tester developed by Nanjing YuanSheng Shen Intelligent Technology Company (Nanjing, China) to carry out friction and wear tests on SLM-molded titanium alloy specimens. For the friction wear test, the reciprocating motion function module is selected, with a stroke of 10 mm, a frequency of 1 Hz, a speed of 10 mm/s, an experimental time of 60 min, and an experimental loading force of 50 N. The upper fixture model is FUS063, and the specification is a flat column specimen with a diameter of 6 mm and a length of 13 mm. According to the previous research experience, the upper fixture material used in this friction wear test is polyethylene molecule (UHMWPE), and the lubricant is deionized water [27].
3. Results and Discussion
3.1. Analysis of Orthogonal Test Results
According to Table 4, it can be seen that the influence on the side roughness of the specimen is ordered in the following sequence: scanning spacing > scanning speed > laser power > paving powder layer thickness, in which the scanning speed and laser power influence the side roughness in basically the same way, although the former is slightly higher than the latter. The optimal combination of the four process parameters is as follows: laser power is 300 W, scanning speed is 1250 mm/s, scanning distance is 0.09 mm, and the thickness of powder layer is 0.05 mm.
According to Table 5, it can be seen that on the front roughness of the specimen, the order of the size of the influence is scanning speed > scanning distance > laser power > paving powder layer thickness; the optimal combination of the four process parameters is laser power of 300 W, scanning speed of 1250 mm/s, scanning distance of 0.09 mm, paving powder layer thickness of 0.05 mm.
3.2. Influence of Process Parameters on Molding Quality
3.2.1. Influence of Process Parameters on Densification
Densification is not only an important index for assessing the quality of SLM-molded parts, but also a prerequisite and basis for certain mechanical properties of molded parts [28]. In order to analyze the effects of process parameters (laser power, scanning speed, scanning spacing, and powder layer thickness) on the densities of molded specimens, each level of different influencing factors was set as the independent variable, and the densities of the molded specimens were set as the dependent variables, where the molded specimen densities were the mean values of the densities corresponding to each level of each factor.
The effect of the experimental levels of factors on the densities of the molded specimens is shown in Figure 2, and it can be seen that the densities of the molded specimens are above 95%.
3.2.2. Influence of Process Parameters on Micromorphology
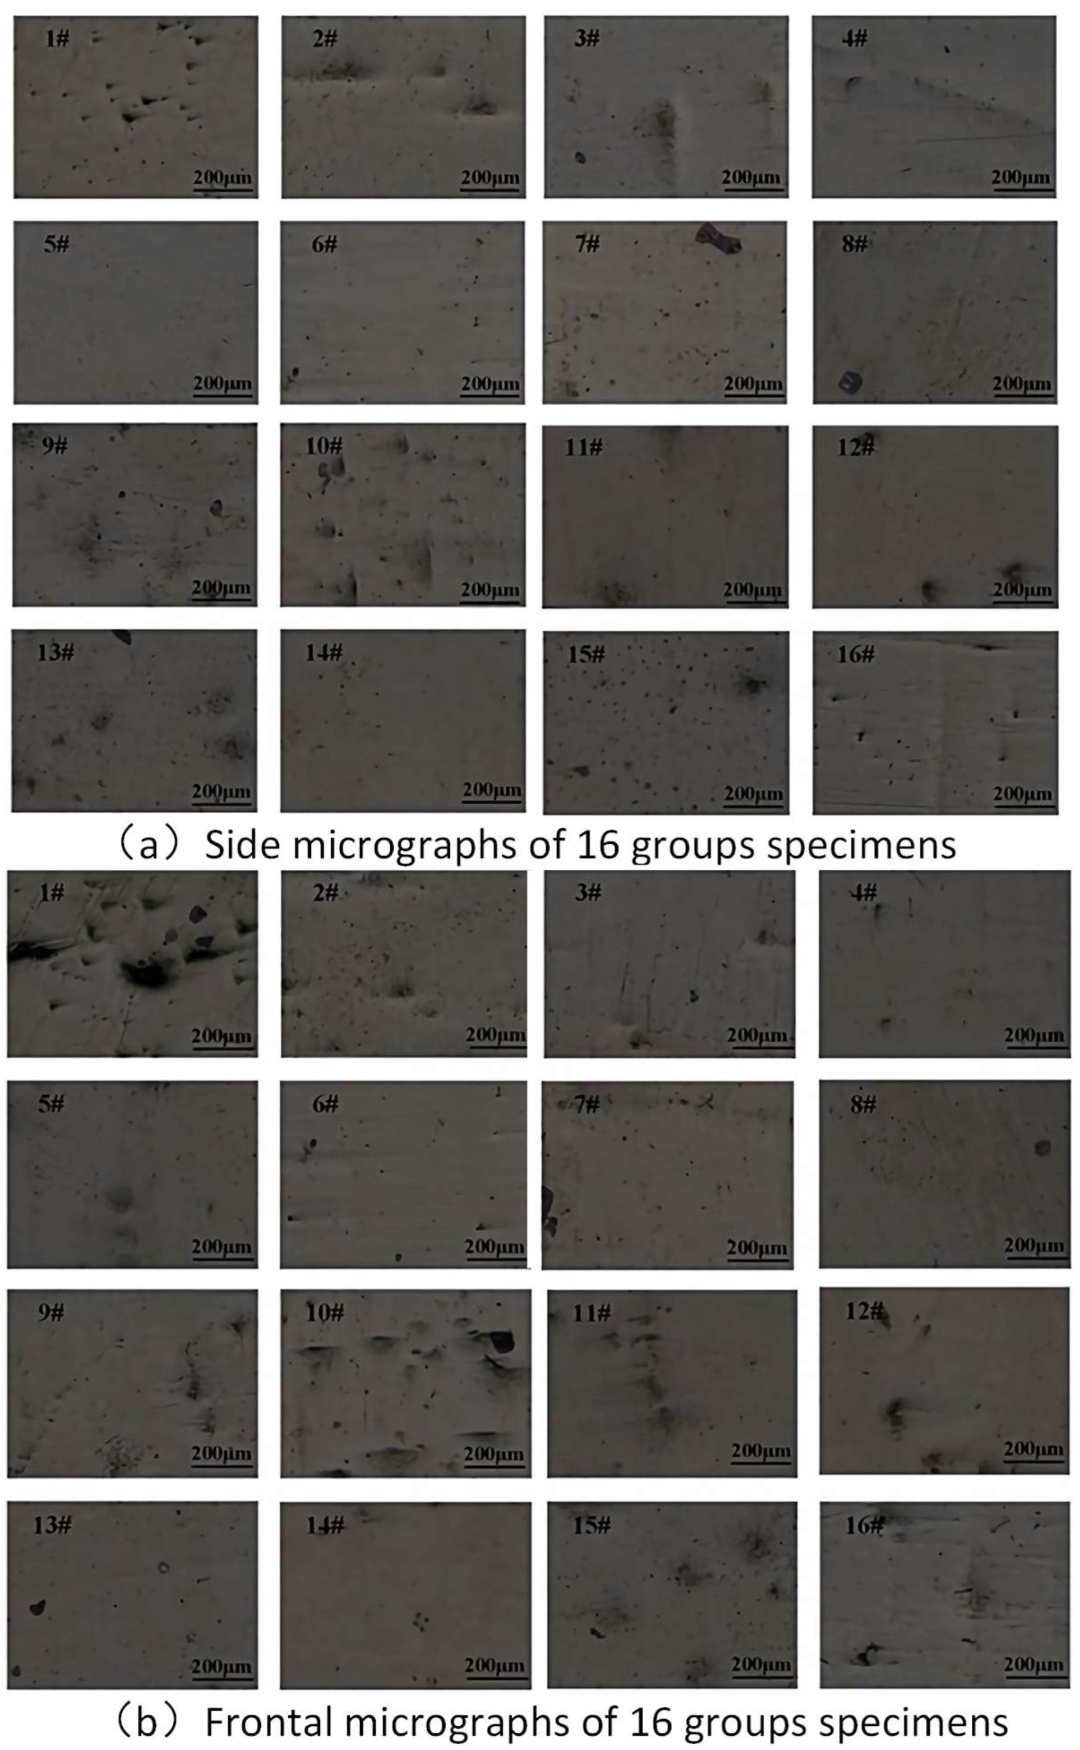
During the SLM molding process, the process parameters should be set to match the characteristics of the selected powder material, otherwise it will lead to an increase in the internal porosity of the molded specimen, which will reduce its density and affect the molding performance. In order to study the effect of different process parameters on the micromorphology of SLM-molded specimens, this paper adopts the Keens VK-X1000 series shape measurement laser confocal microscope to observe the micromorphology of SLM molding of TC4 alloy specimens; Figure 3 shows the micromorphology of 16 groups of molding specimens on the side and front of the Keens VK-X1000 series shape measurement laser confocal microscope.
According to Figure 3, it can be seen that the overall micromorphology of the 16 groups of samples is relatively good, in which the surface of the No. 5 specimen molding quality is high, the surface is relatively flat, with basically no hole defects. The surface morphology of the remaining 14 groups of specimens mainly shows unfused defects, because in the process of SLM molding, a deep melt pool is produced. The emergence of a deep melt pool can promote the melting of TC4 metal powder and, thus, less molded specimen surface defects, but due to the plateau Raleigh capillary instability, being the reason for the melt pool elongation [29], the melt pool penetration is insufficient, so the melt pool means mobility and wettability is poorer and unable to fill the molded layer overlap of the concave region of the molded layer, thus, leading to the emergence of irregular fusion of the defects. The surface morphology of specimen No. 1 is relatively poor, and more irregular hole defects appear on the surface. The reason for this phenomenon is that the laser and the metal powder in the SLM molding process are unstable, and the deep melting pool generated promotes the volatilization of elements to induce porosity, and the continuous growth of columnar grains is hindered by the plateau Raleigh capillary instability, which ultimately leads to the appearance of irregular holes in the specimen.
3.2.3. Influence of Process Parameters on Roughness
Surface roughness is one of the important parameters for evaluating the performance of implants, and SLM molding technology has a broad development prospect in the biomedical field. For artificial implants, less roughness is conducive to an improvement in the fatigue strength and wear resistance of implants, and greater roughness is a favorable basis for ensuring the attachment and proliferation of osteoblasts of artificial implants. There is currently a great deal of controversy about the optimal roughness of implants, and the differences in roughness due to different additive manufacturing methods is an important parameter to consider; all the values found are biocompatible for osteoblast adhesion and value-addition, and due to the heterogeneity of the studies, it is not possible to determine an optimal roughness [30,31]. Therefore, it is necessary to optimize the process parameters so as to obtain a better surface roughness.
Figure 4 shows the roughness curves of the side (perpendicular stacking direction) and front (parallel stacking direction) of the same specimen molded by SLM, and the roughness of the side of the molded specimen is measured to be 7.796, and the roughness of the front is 12.499. A reason for this result may be that the SLM molding layer-by-layer stacking process means that the melt channel and the real position have a certain deviation, and in the stacking direction of the phenomenon there is sticky powder, making the specimen surface uneven and rougher.
3.3. Analysis of the Results of the Experimental Study on the Evaluation of Properties of SLM-Molded TC4 Alloy
3.3.1. Microstructure Analysis of SLM-Molded TC4 Alloy
On the basis of optimizing the process parameters, the TC4 specimens were molded by SLM, and microscopic observation of the molded specimens in cross-section and longitudinal section was carried out by metallurgical microscope and scanning electron microscope, respectively. Shown in Figure 5 and Figure 6 are the micrographs of the cross-section and longitudinal section of the molded specimens, respectively, from which it can be seen that the micrographs of the molded specimens on the side and the front side show obvious differences, which is mainly due to the influence of the molding characteristics of the SLM technology (layer-by-layer powder laying, layer-by-layer deposition).
Figure 5a,b show the microstructure morphology of the longitudinal section of the molded specimen under optical microscope, and Figure 5c,d show the microstructure morphology of the longitudinal section of the molded specimen observed by SEM. Figure 5 shows that the cross-section microstructure of the TC4 molded specimen consists of several thick columnar crystals with epitaxial growth of the fusion cladding layer, the growth direction of the columnar crystals is perpendicular to the scanning direction of the laser beam and along the direction of the stacked layer growth, and the inside of the original thick columnar crystals consists of martensite almost completely, and martensite is widely present inside the grain boundaries. This is due to the fact that in the additive manufacturing process, in order to ensure the continuity between adjacent layers, the laser energy will penetrate the powder layer to melt the top of the last deposited layer [32], resulting in the remelting of the previous layer of powder, the temperature gradient in the direction of powder layer deposition, and the bottom of the melting pool has the largest temperature gradient, and the remelted grains will appear to be epitaxial along the direction of deposition, resulting in the formation of the columnar crystals [33,34].
At the same time, it can be clearly seen that along the direction of the stacking layer columnar crystal grain boundaries, adjacent to the two columnar crystal grain boundaries within the fine needle-like martensite, growth direction is different; the growth of columnar crystal grain boundaries stops growing. This is because the titanium alloy goes through a phase transformation process: the phase from the parent phase tethers in line with the Burgers orientation relationship as shown in Equations (1) and (2); in the cooling process, the phase into the phase has 12 different orientation relationships, and the martensitic lath bundle in the same crystal has a specific orientation difference to localize the shape of the strain, which is reduced to a minimum [35].
From Figure 6, it can be seen that the microstructure is not completely uniform, which is because the melting and solidification of the powder material in the SLM molding is faster, and the solidification rate is higher than the rate of martensite phase transformation, which leads to the transformation of the phase in the organization to the phase too late, so that the phase is transformed to the martensite phase. Due to the local cooling rate and residual heat, there is a certain difference, so the martensite shows a different morphology. Some black particles can also be observed in Figure 6a,b, which may be caused by the oxidized metal powder splashing into the molten pool during the high-speed laser scanning in the SLM molding process.
In order to analyze the physical phase distribution of the specimens after SLM molding, the surface of the molded specimens was subjected to XRD analysis, and the XRD patterns of the molded specimens are shown in Figure 7. According to Figure 7, it can be seen that the peaks of SLM-molded TC4 alloy specimens are mainly Ti peaks, and no other substances were detected. Compared with the data of the standard (PDF#89-2762) card [36], it was found that the position of SLM-molded specimens was positively shifted, which means that the spacing of grain boundaries had become smaller, and, thus, it is speculated that the reason for this phenomenon may be the occurrence of the martensitic phase transition.
3.3.2. Testing and Analysis of Mechanical Properties of SLM-Molded TC4 Alloy
- Microhardness Analysis
Figure 8a shows the microhardness of the side of the SLM-molded specimen. The microhardness of the side of the specimen is between 363~376 HV, and the average microhardness is 369.13 HV. It can be seen from Figure 8a that the side of the microhardness shows a waveform change of firstly increasing, then decreasing, and then increasing; the microhardness of the measuring point 2 reaches the maximum value, and the microhardness of measuring point 4 is the smallest, and the reason for this change may be that measurement point 2 is in the middle of the melt channel and the powder in the middle of the melt channel is more fully melted, resulting in a more detailed granular organization, so that the microhardness of the specimen is higher. Measurement point 4 is in the overlap of the melt channel, and the powder at the overlap of the melt channel will appear to be melted for the second time, resulting in a larger granular organization, so that the microhardness of the specimen is reduced. However, the overall difference in the hardness of the specimen is not very large, so the overall hardness of the specimen is more uniform.
Figure 8b shows the microhardness of the front side of the SLM-molded specimen. The microhardness of the front side of the specimen is between 360 and 370 HV, and the average microhardness is 364.06 HV. The difference in microhardness at different measurement points may be due to the temperature effect on the microhardness produced during the SLM molding process. If the measurement point occurs between the molding layers (measurement point 2), the laser energy absorbed by the powder here is greater, the melting is more adequate, and the microhardness is higher; if the measurement point occurs at the combination of the molding layers (measurement point 4), the energy absorbed by the powder here is less than that between the molding layers, the melting of powder is not enough, and microhardness is decreased. However, from the Figure, it can be seen that the difference between the maximum and minimum microhardness values is very small, so the microhardness is more uniform.
The microhardness of TC4 alloy SLM-molded specimens is higher than casting (320 HV), which may be due to the fact that SLM molding is a fast melting and fast solidification process, the number of grains is larger, the growth space between adjacent grains is narrow, and the growth time is short, resulting in insufficient grain growth, which results in a large number of fine grains, and, thus, the hardness of the specimen is increased.
- 2.
- Tensile Properties Analysis
The mechanical properties of SLM-molded specimens with different densities are also different, and it is generally considered that high densities are the prerequisite for guaranteeing mechanical properties. Based on the optimization of process parameters, tensile specimens were molded and tensile performance tests were conducted to verify whether the optimized process parameters could meet the requirements of mechanical properties. The preparation dimensions of the tensile specimens refer to the ASTME8/E8M-15a [37] “Standard Test Methods for Tensile Testing of Metallic Materials” standard (small-size specimens), in which the marking distance G is taken to be 25.0 mm, and the width of the cross-section T is taken to be 6 mm; the specific dimensions are shown in Figure 9.
The researchers found that the tensile properties of the molded specimens were closely related to the direction of metal powder accumulation during molding, and by placing the specimens horizontally and performing SLM molding along their thickness direction (i.e., the thickness direction is the direction of powder accumulation), the molded specimens with the highest tensile and yield strengths were obtained [38], and the molding effect is shown in Figure 10a. Figure 10b shows the effect of the molded specimen after tensile fracture, according to the recorded load–displacement () curve, and converted into the actual stress–strain () curve.
Figure 11 shows the stress–strain curves of three molded specimens obtained from the tensile experiment. The stress–strain curves show that the molded specimens in the tensile process experience a total of three stages: the elastic stage, the strengthening stage, and the deformation and fracture stage. In the elastic stage, the change curves of the three molded specimens basically overlap, and the stress–strain curve is similar to a straight line. After the elastic stage, the molded specimen enters the strengthening stage, and there is no obvious yield stage, so the yield strength of the specimen is characterized by (0.2% residual deformation of the stress value), the specimen passes through the maximum tensile strength of the stress , and the phenomenon of local deformation occurs until the specimen is fractured.
The average yield strength of the three specimens was 1217.40 MPa, the tensile strength was 1315.32 MPa, and the elongation at break was 9.6%. Table 6 shows the test results of tensile properties of SLM-molded titanium alloy specimens. From the table, it can be seen that the yield strength and tensile strength of SLM-molded titanium alloy tensile specimens are higher than those of ASTM F136 and casting standards, but the elongation of SLM-molded titanium alloy specimens is slightly lower relative to the ASTM F136 standard. The reason for this phenomenon may be that the SLM molding process is a rapid melting and rapid solidification process, the metal grains cannot grow up in time to be limited by the surrounding grains, and then the formation of a very small and balanced organization, fine grain size, and a greater number of grain boundaries more effectively prevent the occurrence of dislocations, improve the SLM molding specimens yield strength and tensile strength. However, at the same time, it may lead to certain defects at the grain boundaries, which makes the molded specimen plasticity decrease and elongation decrease.
- 3.
- Compression Performance Analysis
The femur is an important part of the human lower limb, and the study of its stress state is of strategic significance for artificial joint replacement. Some studies have shown that the maximum stress on the femur during standing can reach 27.70 MPa [39], and the compressive strength of implants with a porous structure is lower than that of implants with a solid structure. In implant applications, porous structures also need to meet the requirements of mechanical properties (e.g., compressive strength), and, therefore, compressive properties are an important mechanical property index for evaluating porous implants.
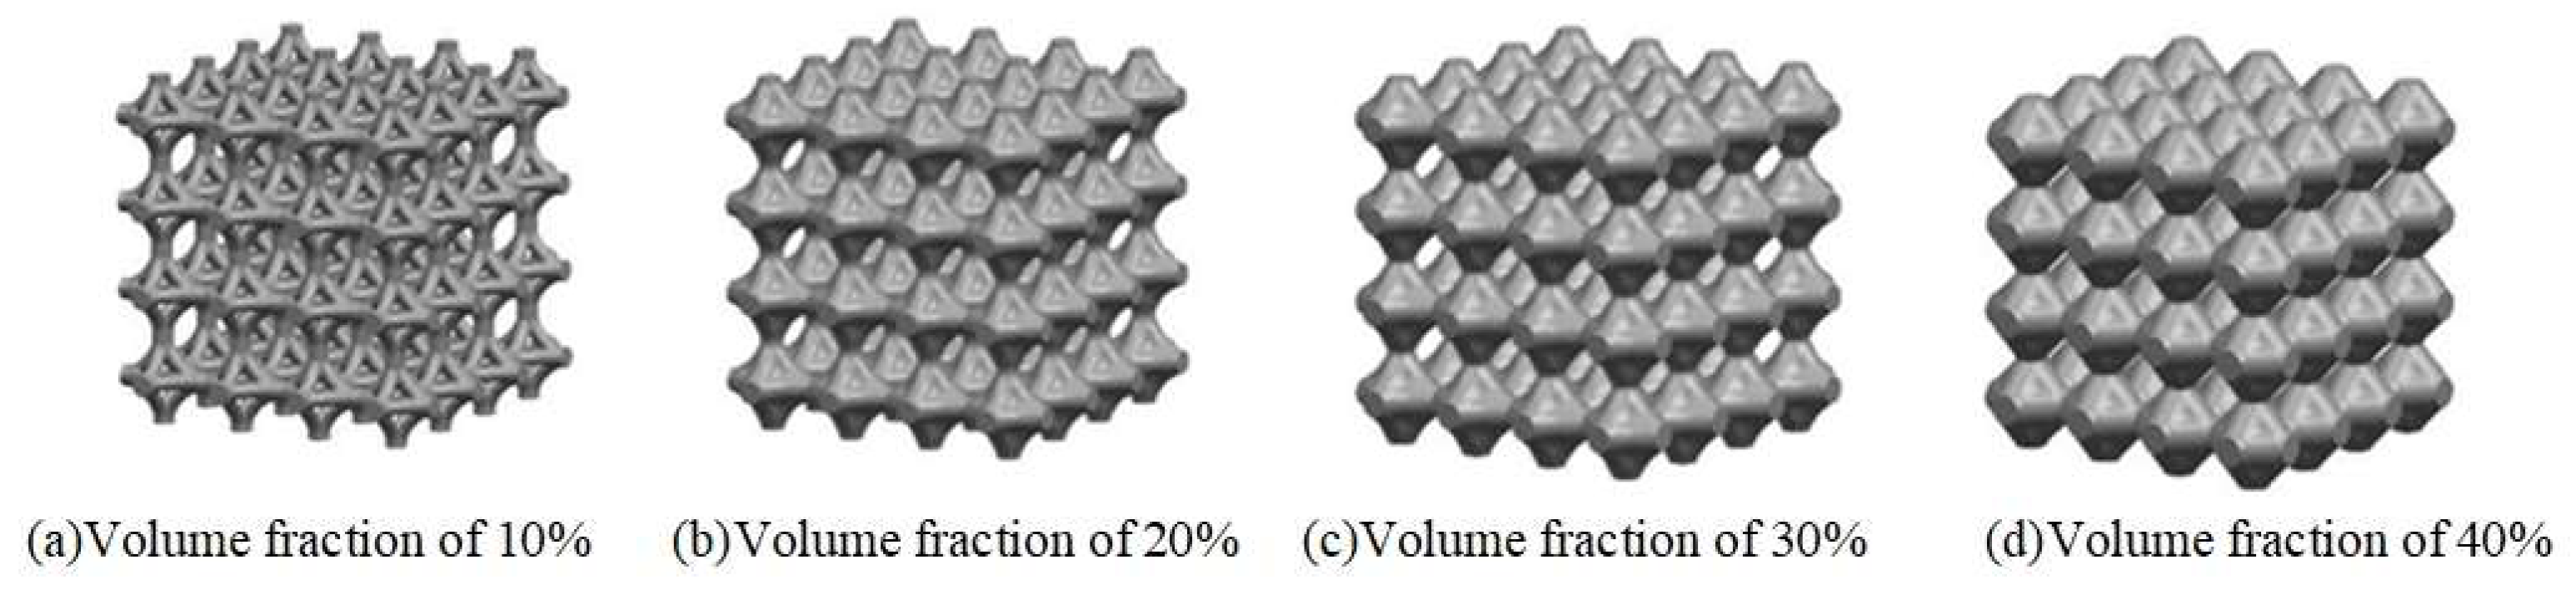
Based on the topology-optimized reconstruction model, the compression specimen model was constructed by arraying the porous unit structures with volume fractions of 10%, 20%, 30%, and 40% through Materialise Magics 24.0 software, as shown in Figure 12.
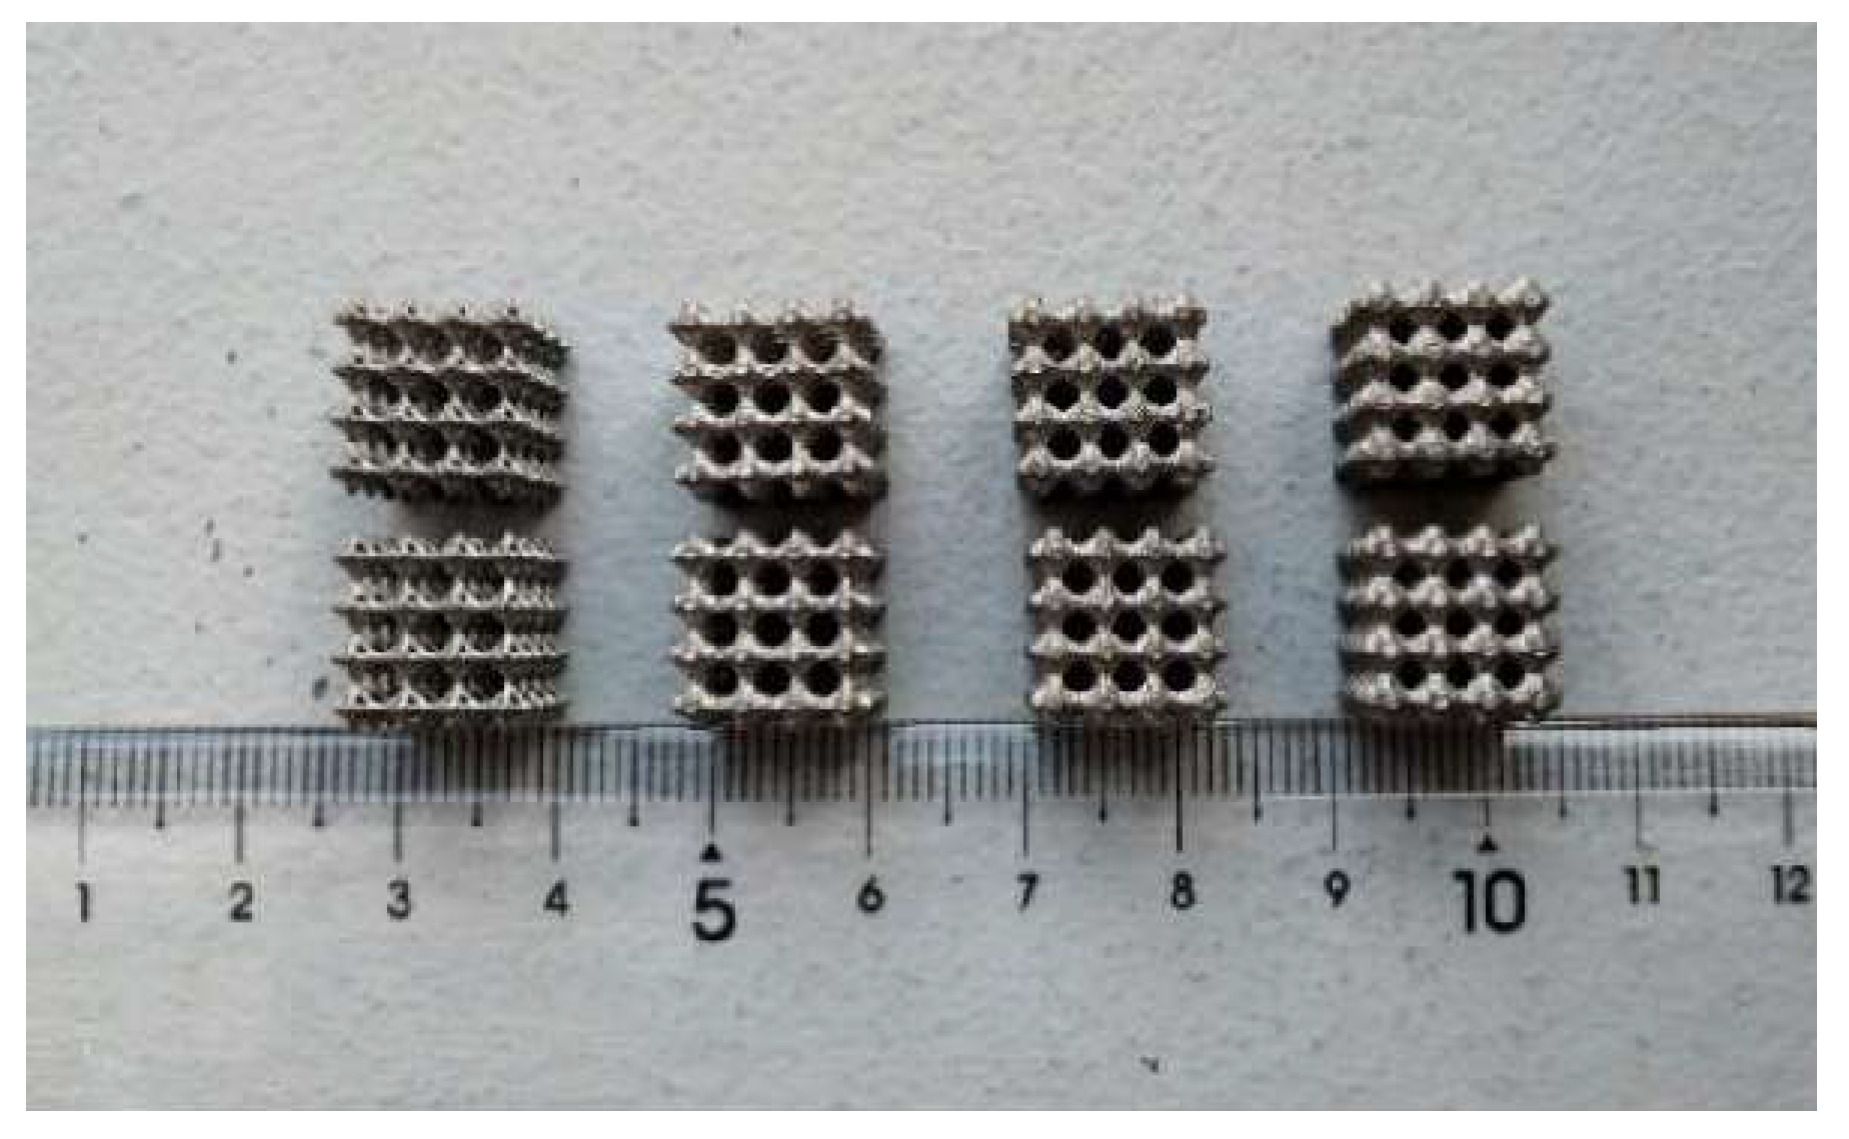
Based on the optimized process parameters, the porous compression specimen is molded by SLM technology. When the compression specimen is molded, the specimen is firstly cut from the substrate by using the wire cutting technology to ensure the bottom surface of the specimen is flat. Then the compressed specimen is subjected to a series of post-treatment processes, such as ultrasonic cleaning, blowing, sandblasting, etc., in order to remove the metal powder that is not firmly bonded inside and on the surface of the porous structure. The final molded specimen was obtained as shown in Figure 13, and from left to right, the volume fractions of the porous compression specimen were 10%, 20%, 30%, and 40%.
According to the ISO 13314 standard [40] for compression testing of porous and honeycomb metals, the compression properties of SLM-molded porous specimens of TC4 alloy were analyzed by compression testing. It was found that specimens with different volume fractions had different failure locations and different resistance to deformation when compressed, and Figure 14 shows the effect diagram of the specimens after being compressed.
The corresponding force–displacement () curves were obtained by compression tests of specimens with different volume fractions, and the stress–strain () curves shown in Figure 15 were transformed according to equation. Generally speaking, when the compression test starts, the stress–strain curve will have a linear phase, but according to Figure 15, it is found that although the volume fractions of the compression specimens are different, the compression specimens all have a nonlinear concave tendency at the beginning part, which can be attributed to the local deformation of the bottom of the specimen when the specimen on the substrate is wire-cut or the porous structure of the surface of the compression specimen after molding is not flat enough, leading to the stress at the initial stage not being smooth, which is not enough.
The surface of the compressed specimen after molding is not flat enough, which leads to the uneven force in the initial stage. After a small phase of nonlinear changes, the structure enters the elastic deformation phase, and the equivalent elastic modulus of the structure can be obtained from the slope of the stress–strain curve in this phase. As the strain increases, the stress appears to change nonlinearly, and then enters the plastic deformation stage of the stress–strain curve. The ability to resist deformation of the compression specimen in this stage is different; the smaller the volume fraction, the weaker the ability to resist deformation. The specimen enters the failure stage of the stress–strain curve after the phenomenon of sudden change in stress. However, the densification stage did not occur during the compression of the specimen, which was caused by the fact that the tester stopped compressing the specimen when a local failure occurred in the porous structure during the compression performance test of the porous structure. The modulus of elasticity and compressive strength of different specimens were measured according to the stress–strain curves, as shown in Table 7.
- 4.
- Friction and Wear Performance Analysis
In order to analyze the experimental results more intuitively, Origin software (Version number: 8.0) was used to realize the conversion from data to image. Figure 16 shows the graph of friction coefficient comparison between SLM-molded specimens and casting specimens under different lubrication conditions. From the Figure, it can be seen that the initial change in each curve is not regular, and it is guessed that the reason for this phenomenon is that when the TC4 alloy specimen and the UHWMPE specimen are experimented with, because the molding specimen is not identical, the initial contact state of the two specimens is different, which leads to a certain difference in the trend of the friction coefficient at the initial stage.
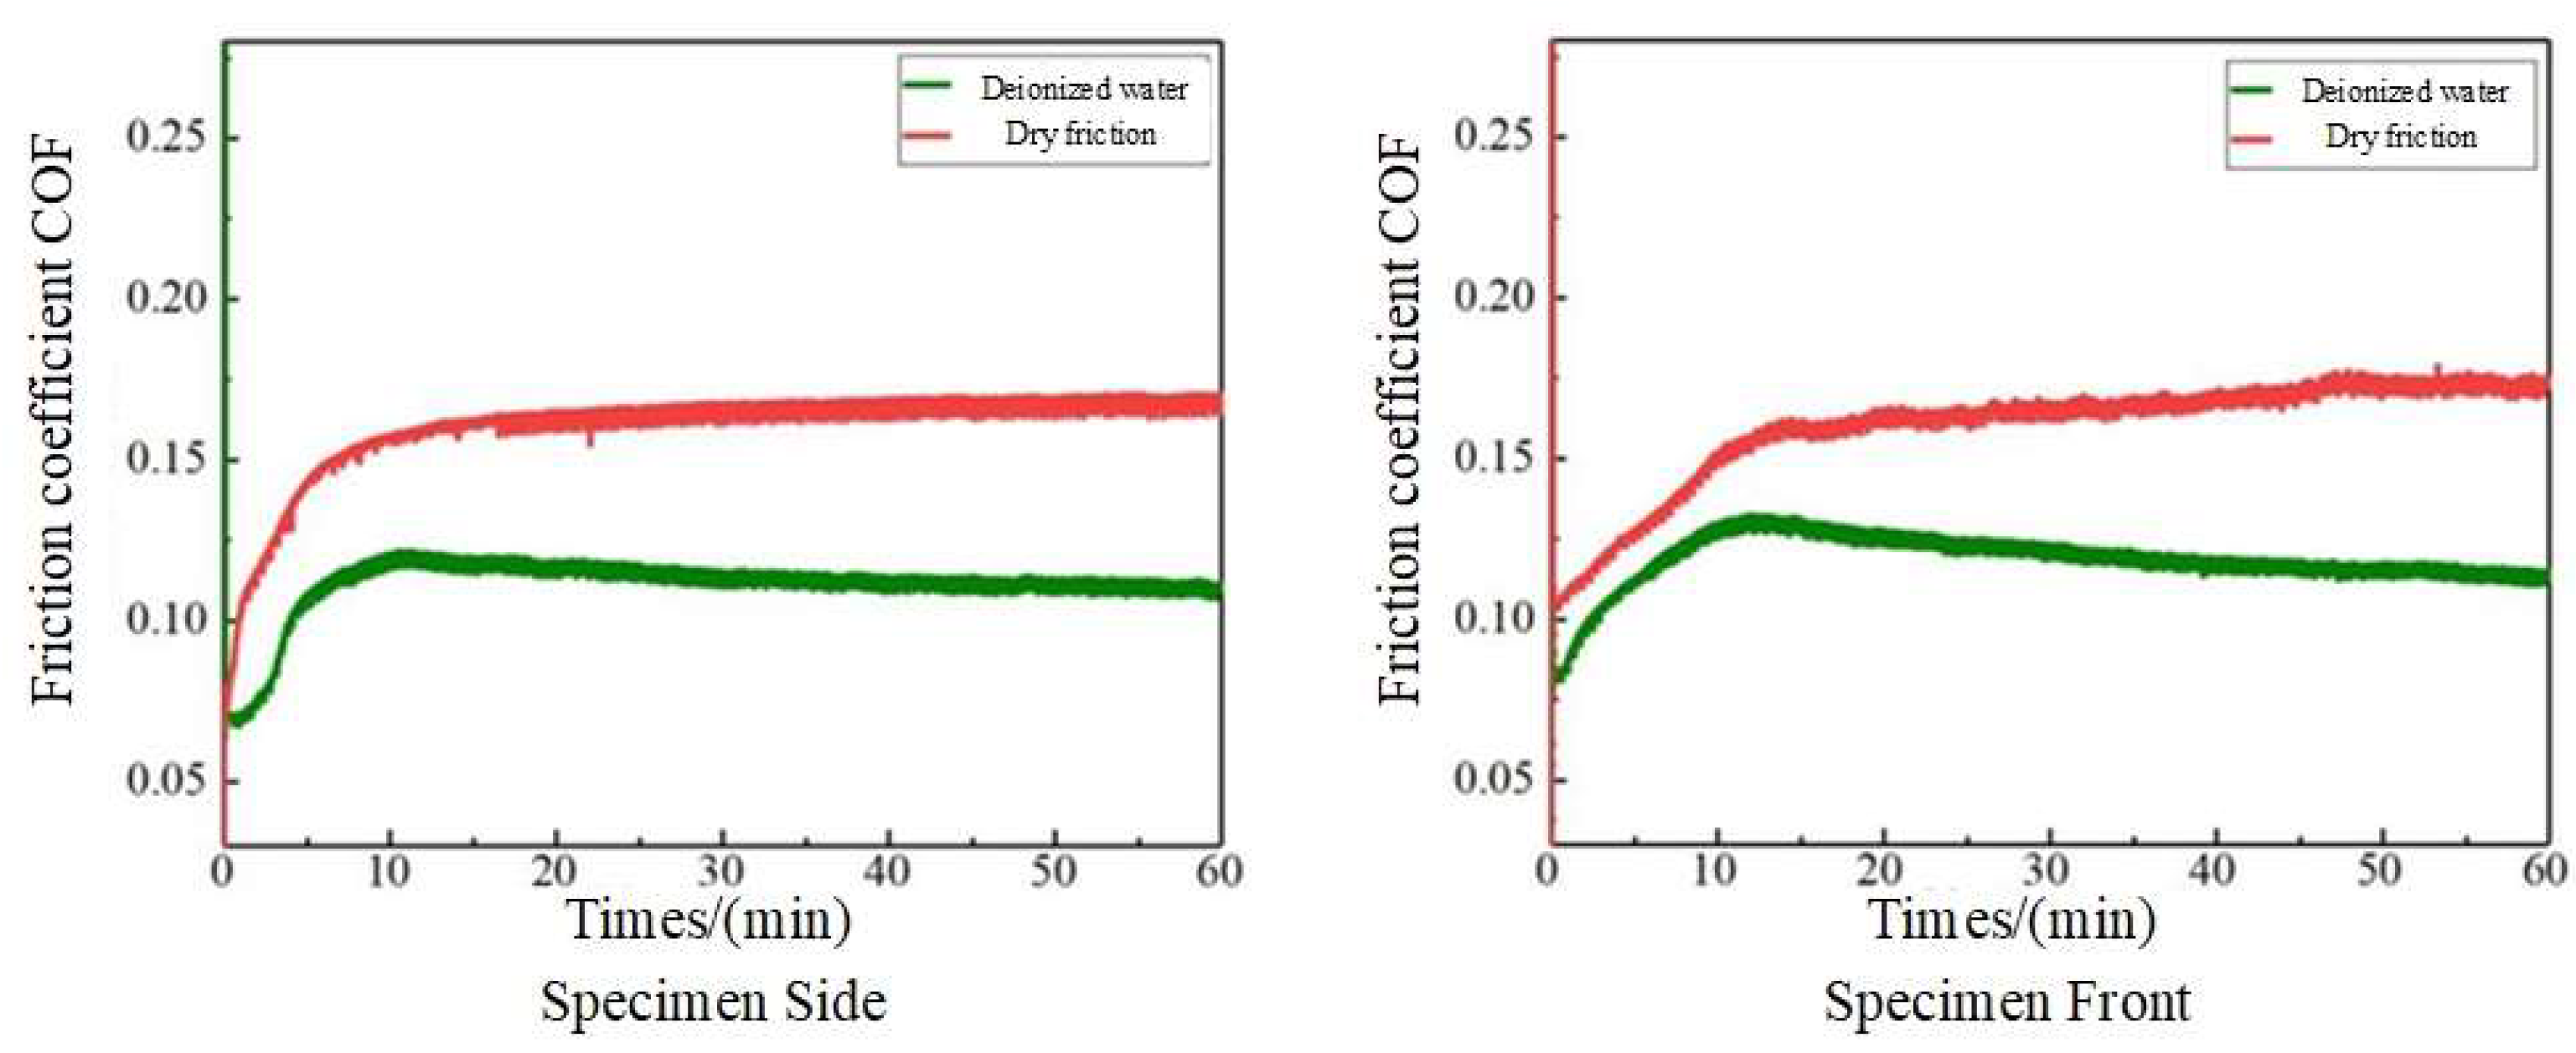
Figure 16a shows the comparison curve of the friction coefficients of the casting specimen and the SLM-molded specimen under dry friction conditions, from which it can be seen that the casting specimen maintains its friction coefficient basically unchanged and stabilized at about 0.2 after about 20 min of the break-in period, while the SLM-molded specimen maintains its friction coefficient at about 0.16 after about 10 min of the break-in period, which is obviously lower than the friction coefficient of the casting specimen. As can be seen from Figure 16b, under the condition of deionized water lubrication, the friction coefficient of the casting specimen is still higher than that of the SLM-molded specimen, and both of them have experienced the same break-in period (10 min); the friction coefficient of the casting specimen fluctuates up and down around 0.17 and the friction coefficient of the SLM-molded specimen fluctuates up and down around 0.11 after the break-in period.
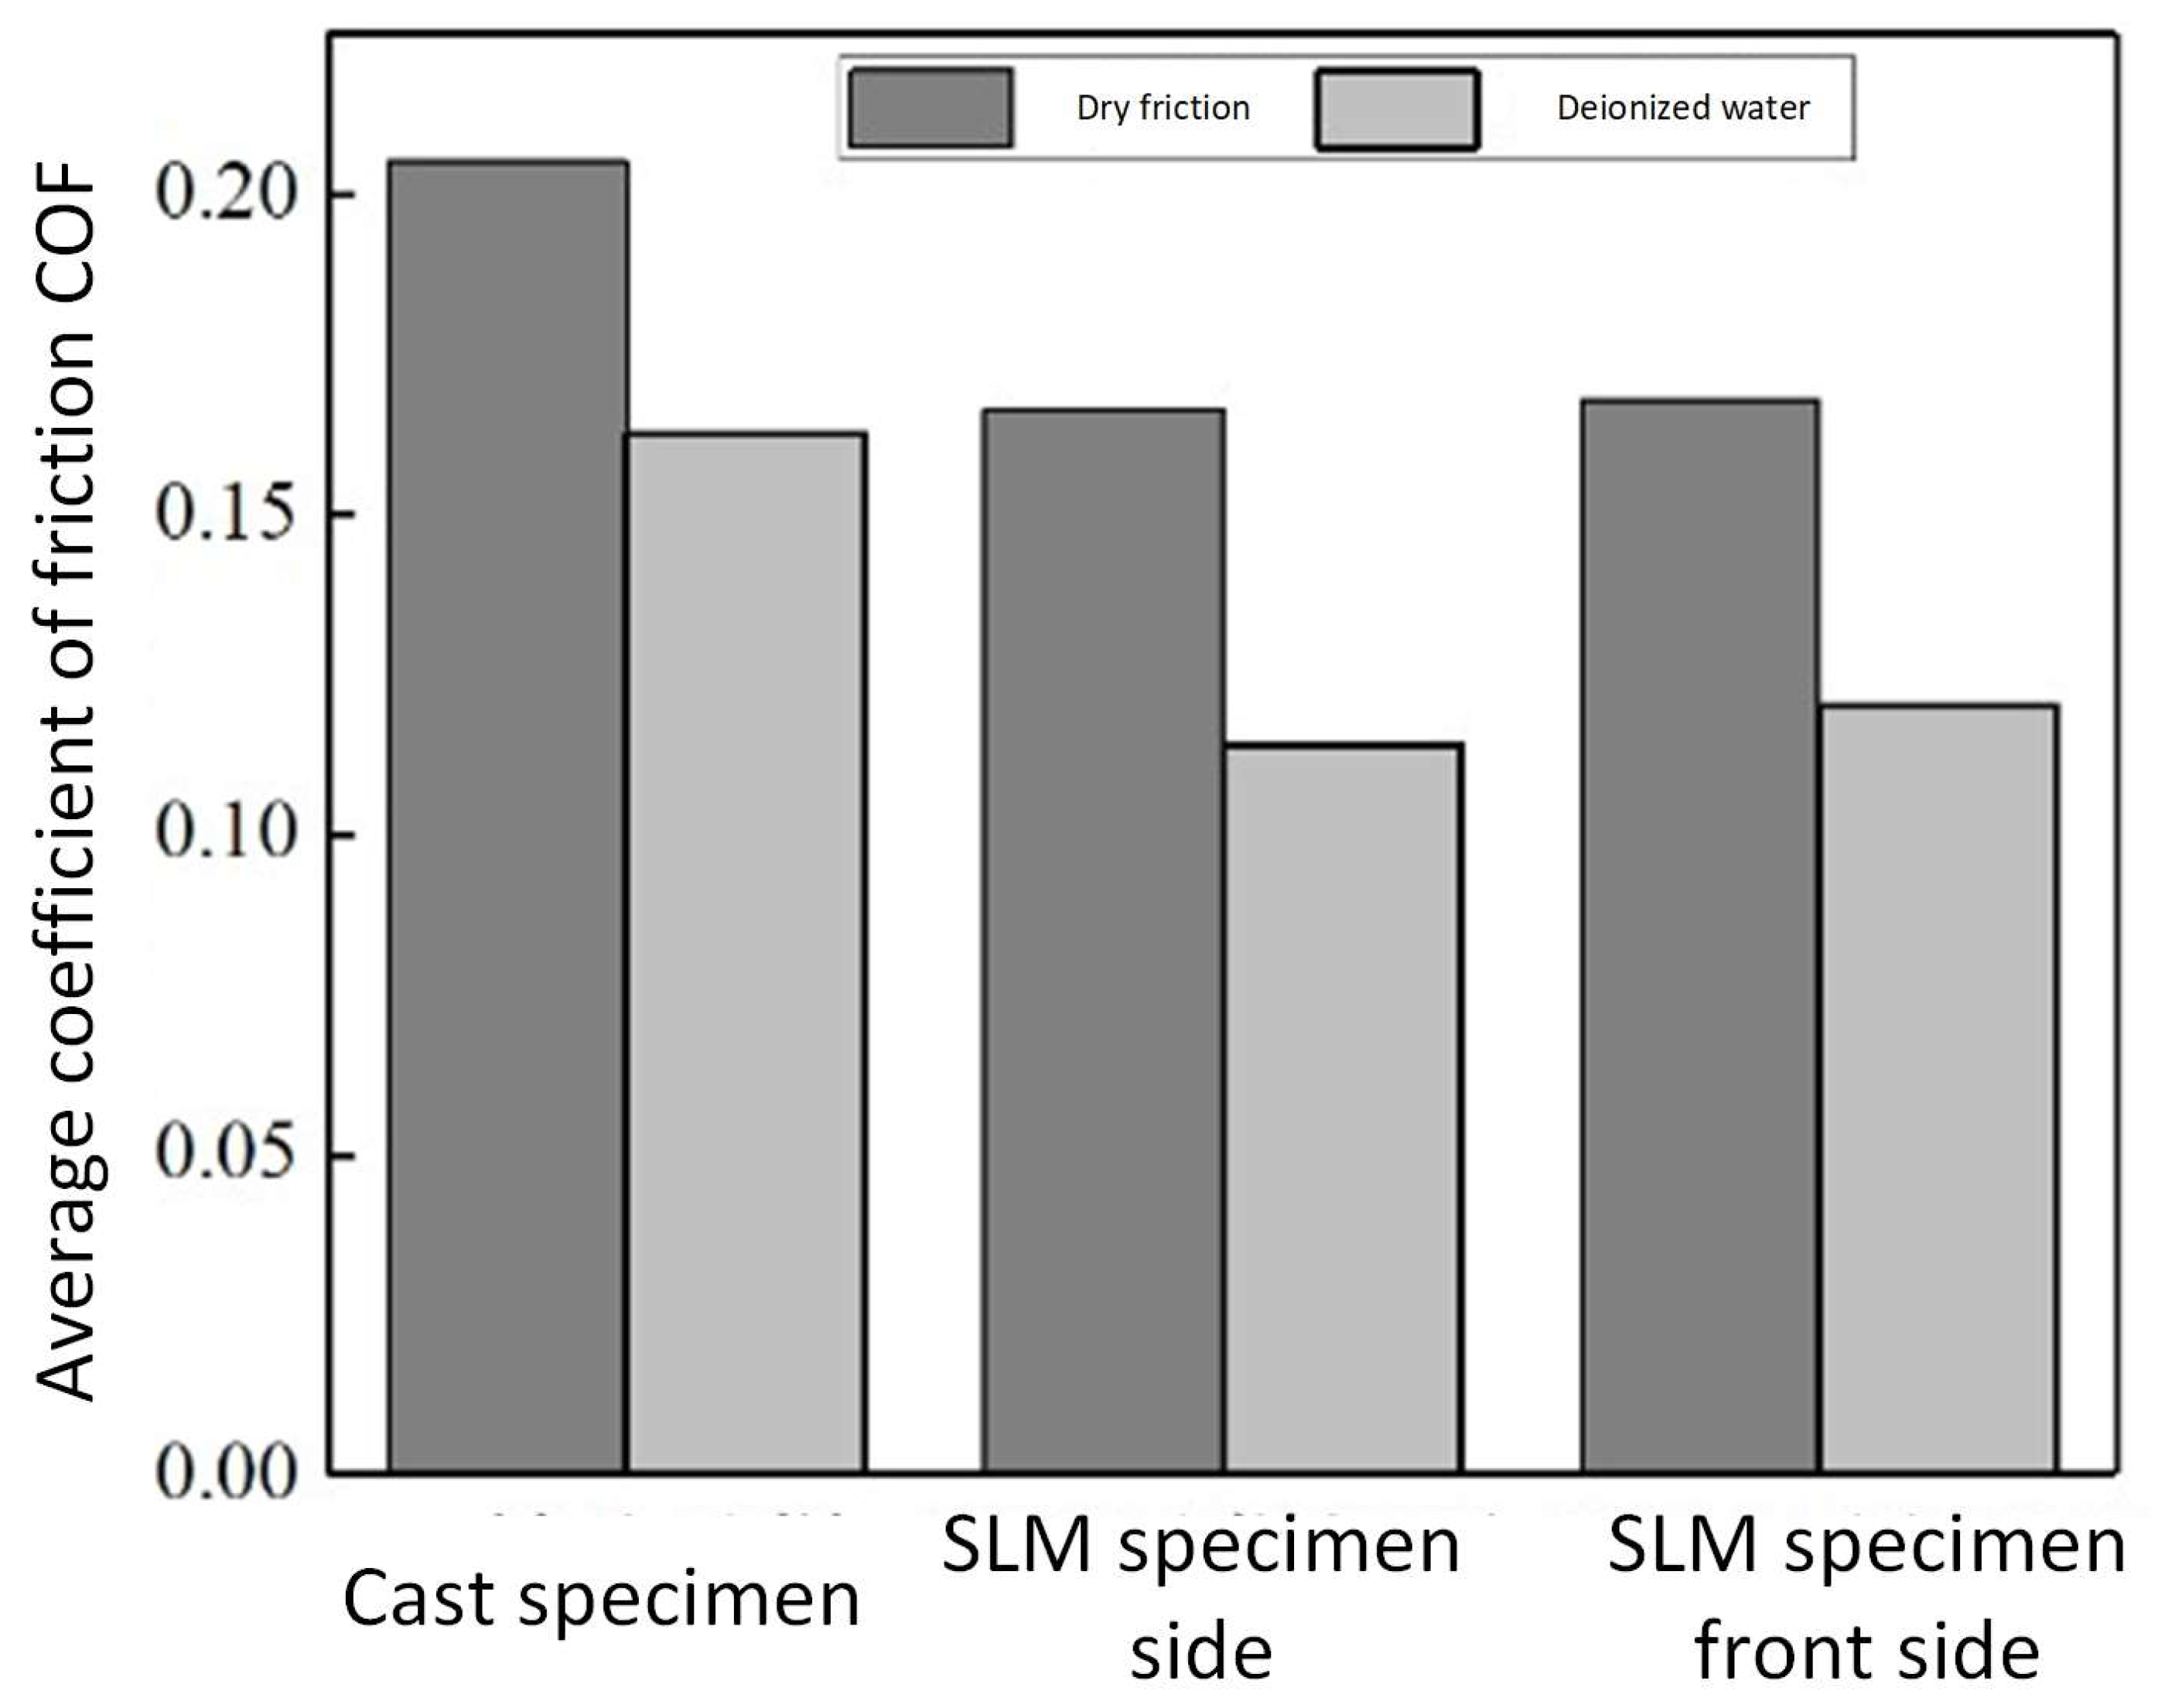
Figure 17 shows the average coefficient of friction of different specimens under different lubrication conditions. Combined with Figure 16, it can be seen that the wear resistance of TC4 specimens of both molding methods is improved under lubrication conditions, and the coefficients of friction are reduced. The reason for this result is that under dry friction conditions, the repeated friction between the specimen and the counter-abrasive specimen produces fine wear particles, and due to the lack of lubricant, the wear particles cannot be discharged in time, so that the wear particles accumulate between the specimen and the counter-abrasive specimen, and the friction coefficient between the two is larger. Under the deionized water lubrication condition, there is water lubrication between the specimen and the counter-abrasive specimen, and the wear particles are discharged in time by the hydrodynamic effect of the lubricant, which reduces the degree of wear of the specimen and the counter-abrasive specimen and the coefficient of friction between the two.
Figure 18 shows the friction coefficient comparison curves of different surfaces of SLM-molded specimens, from which it can be seen that the friction coefficient difference between the side and the front of the SLM-molded specimens is not very large, and its tendency to change and the size of the value is almost the same. However, it can be seen from the figure that the friction coefficient of the front side of the molded specimen is slightly higher than that of the side; the reason for this result is related to the surface roughness of the SLM-molded specimen. The SLM molding layer-by-layer stacking process means that the melt channel and the real position achieve a certain degree of deviation, and in the direction of the stacking of the phenomenon there is sticking powder, so that the front side of the specimen is not flat, the specimen is rougher, and, therefore, the front side of the specimen has a slightly larger coefficient of friction.
4. Conclusions
- 1.
- The SLM process parameters were optimized through orthogonal tests, and for roughness, the optimized process parameter combinations were determined as follows: laser power of 300 W, scanning speed of 1250 mm/s, scanning spacing of 0.09 mm, and a powder layer thickness of 0.05 mm. When the density of the molded specimen is high, it has fewer internal pore defects, and, on the contrary, when the density is low, the internal pore defects are more obvious;
- 2.
- The microstructure of the cross-section of the molded specimen is mainly martensite, and there are oriented columnar crystals in the microstructure of the elongated cross-section; the microhardness of the side of the molded specimen averaged 369.13 HV, and the microhardness of the front side has an average value of 364.06 HV, and the sides and fronts of the molded specimen are harder than those of the casting specimen;
- 3.
- The average yield strength of the molded specimens was 1217.40 MPa, the tensile strength was 1315.32 MPa, and the elongation at break was 9.6%. It was found that the yield strength and tensile strength of the SLM-molded specimens were higher than that of the ASTM F136 and casting standards but the elongation at break was slightly lower than that of the ASTM F136 standard; the elastic modulus of the molded specimens was in the range of 0.7~12.7 GPa and the compressive strength between 8~338 MPa, which is in line with the range of human bone requirements [41]. For the materials used to make femoral implants, Ti-6Al-4V femoral implants made by SLM meet the requirements, but in practical orthopedics application, it is necessary to apply a coating that enables osseointegration to the alloy obtained by SLM;
- 4.
- Under the same experimental conditions, the friction coefficients of SLM-molded specimens are lower than those of casting specimens, and their wear resistance is higher than that of casting specimens. The friction and wear performance of the molded specimens on the side and the front side do not differ much, and there is basically no difference in the friction coefficient trends and sizes of the two, with the friction coefficient on the front side of the specimens being slightly higher.
Author Contributions
Conceptualization, W.Z. and Y.L.; methodology, W.Z.; software, Y.H.; validation, W.Z., H.L. and Z.L.; formal analysis, W.Z.; investigation, Y.L.; resources, Y.H.; data curation, W.Z. and Y.H.; writing—original draft preparation, W.Z.; writing—review and editing, W.Z., H.L. and Z.L.; visualization, W.Z. and Y.H.; supervision, Z.L. and H.L.; project administration, Z.L.; funding acquisition, Z.L. All authors have read and agreed to the published version of the manuscript.
Funding
This research received no external funding.
Data Availability Statement
The original contributions presented in the study are included in the article, further inquiries can be directed to the corresponding author.
Conflicts of Interest
The authors declare no conflicts of interest.
References
- Shnaekel, A.; Morrison, J.C. High Rates of Aseptic Loosening in Modern Posterior-stabilized Femoral Components from a Single Manufacturer. Arthroplast. Today 2023, 22, 101132. [Google Scholar] [CrossRef]
- Apostu, D.; Lucaciu, O.; Berce, C.; Lucaciu, D.; Cosma, D. Current methods of preventing aseptic loosening and improving osseointegration of titanium implants in cementless total hip arthroplasty: A review. J. Int. Med. Res. 2018, 46, 2104–2119. [Google Scholar] [CrossRef] [PubMed]
- Munemoto, M.; Grammatopoulos, G.; Tanaka, Y.; Gibbons, M.; Athanasou, N.A. The pathology of failed McKee-Farrar implants: Correlation with modern metal-on-metal-implant failure, Journal of materials science. Mater. Med. 2017, 28, 66. [Google Scholar] [CrossRef] [PubMed]
- Levai, J.P.; Descamps, S.; Roch, G.; Boisgard, S. Early aseptic loosening of cemented cup in metal-on-metal total hip arthroplasties. Rev. Chir. Orthop. Reparatrice L’appareil Mot. 2006, 92, 575–580. [Google Scholar] [CrossRef] [PubMed]
- Doi, K.; Kobatake, R.; Makihara, Y.; Oki, Y.; Umehara, H.; Kubo, T.; Tsuga, K. Osseointegration Aspects of Implants at the Bone Reconstruction Site by a Novel Porous Titanium Scaffold. J. Oral Maxillofac. Res. 2021, 12, e4. [Google Scholar] [CrossRef] [PubMed]
- Wu, S.; Xu, J.; Zou, L.; Luo, S.; Yao, R.; Zheng, B.; Liang, G.; Wu, D.; Li, Y. Long-lasting renewable antibacterial porous polymeric coatings enable titanium biomaterials to prevent and treat peri-implant infection. Nat. Commun. 2021, 12, 3303. [Google Scholar] [CrossRef]
- Gao, B.; Zhao, H.; Peng, L.; Sun, Z. A Review of Research Progress in Selective Laser Melting (SLM). Micromachines 2022, 14, 57. [Google Scholar] [CrossRef] [PubMed]
- Li, L.; Gao, H.; Wang, C.; Ji, P.; Huang, Y.; Wang, C. Assessment of Customized Alveolar Bone Augmentation Using Titanium Scaffolds vs Polyetheretherketone (PEEK) Scaffolds: A Comparative Study Based on 3D Printing Technology. ACS Biomater. Sci. Eng. 2022, 8, 2028–2039. [Google Scholar] [CrossRef] [PubMed]
- Lim, H.-K.; Choi, Y.-J.; Choi, W.-C.; Song, I.-S.; Lee, U.-L. Reconstruction of maxillofacial bone defects using patient-specific long-lasting titanium implants. Sci. Rep. 2022, 12, 7538. [Google Scholar] [CrossRef]
- Elshaer, R.N.; Ibrahim, K.M. Performance, Study of Microstructure, Mechanical Properties, and Corrosion Behavior of As-Cast Ni-Ti and Ti-6Al-4V Alloys. J. Mater. Eng. Perform. 2022, 32, 7831–7845. [Google Scholar] [CrossRef]
- Sangali, M.; Cremasco, A.; Soyama, J.; Caram, R.; Contieri, R.J. Selective Laser Melting of Ti-6Al-4V Alloy: Correlation Between Processing Parameters, Microstructure and Corrosion Properties. Mater. Res. 2023, 26, e20230055. [Google Scholar] [CrossRef]
- Feng, X.; Qiu, J.; Ma, Y.; Lei, J.; Cui, Y.; Wu, X.; Yang, R. Influence of Processing Conditions on Microstructure and Mechanical Properties of Large Thin-Wall Centrifugal Ti–6Al–4V Casting. J. Mater. Sci. Technol. 2016, 32, 362–371. [Google Scholar] [CrossRef]
- Zhu, Y.; Zhao, Q.; Liu, X.; Geng, R.; Wang, B.; Jiang, Q.J.N. Improved Strength-Ductility of Ti-6Al-4V Casting Alloys with Trace Addition of TiC-TiB2 Nanoparticles. Nanomaterials 2020, 10, 2330. [Google Scholar] [CrossRef]
- Lee, H.-W.; Kong, B.-O.; Kim, S.E.; Joo, Y.; Yoon, S.; Lee, J.H. Microstructure and Mechanical Properties of Vacuum Centrifugal Casted Ti-6Al-4V Alloy by Casting and Heat Treatment. Korean J. Met. Mater. 2022, 60, 282–290. [Google Scholar] [CrossRef]
- Wen, F.; Zhao, J.-H.; Yuan, M.; Wang, J.; Zheng, D.; Zhang, J.; He, K.Z.; Shangguan, J.-J.; Guo, Y. Alloys, Influence of Ni interlayer on interfacial microstructure and mechanical properties of Ti-6Al-4V/AZ91D bimetals fabricated by a solid–liquid compound casting process. J. Magnes. Alloys 2021, 9, 1382–1395. [Google Scholar] [CrossRef]
- Banu, A.; Preda, L.; Marcu, M.; Dinca, L.L.; Maxim, M.E.; Dobri, G. Electrochemical Behavior of SLM Ti–6Al–4V Alloy After Long Time of Immersion in Lactic Acid Environment. Met. Mater. Trans. A 2022, 53, 2060–2070. [Google Scholar] [CrossRef]
- Cheng, Y.-J.; Hung, F.-Y.; Zhao, J.-R. Microstructural Characteristics and Material Failure Mechanism of SLM Ti-6Al-4V-Zn Alloy. Materials 2023, 16, 7341. [Google Scholar] [CrossRef] [PubMed]
- Metalnikov, P.; Ben-Hamu, G.; Eliezer, D. Corrosion behavior of AM-Ti-6Al-4V: A comparison between EBM and SLM. Prog. Addit. Manuf. 2022, 7, 509–520. [Google Scholar] [CrossRef]
- Naghavi, S.A.; Tamaddon, M.; Garcia-Souto, P.; Moazen, M.; Taylor, S.; Hua, J.; Liu, C. A novel hybrid design and modelling of a customised graded Ti-6Al-4V porous hip implant to reduce stress-shielding: An experimental and numerical analysis. Front. Bioeng. Biotechnol. 2023, 11, 1092361. [Google Scholar] [CrossRef]
- Mondal, P.; Das, A.; Mondal, A.; Chowdhury, A.R.; Karmakar, A. Fabrication of Ti-6Al-4V Porous Scaffolds Using Selective Laser Melting (SLM) and Mechanical Compression Test for Biomedical Applications. J. Inst. Eng. India Ser. D 2022, 103, 181–190. [Google Scholar] [CrossRef]
- Kutsukake, A.; Seki, A.; Yoshida, Y. Influence of Implantation Period on Bioactivity on the Surface of Ti-6Al-4V Implant Model Made by Selective Laser Melting. 2021. Available online: https://popups.uliege.be/esaform21/index.php?id=4350 (accessed on 5 March 2024).
- ASTM F136; Standard Specification for Wrought Titanium-6Aluminum-4Vanadium ELI (Extra Low Interstitial) Alloy for Surgical Implant Applications (UNS R56401). ASTM International: West Conshohocken, PA, USA, 2021.
- GB/T 13810-2007; Wrought Titanium and Titanium Alloy for Surgical Implants. Standardization Administration of China: Beijing, China, 2007.
- Hao, Y.; Liu, Z.; Yao, C.; Liang, Y.; Li, Y. Topological design and high-performance additive manufacturing of porous femoral implants. J. Phys. Conf. Ser. 2023, 2566, 012086. [Google Scholar] [CrossRef]
- Bormann, T.; Müller, B.; Schinhammer, M.; Kessler, A.; Thalmann, P.; De Wild, M. Microstructure of selective laser melted nickel-titanium. Mater. Charact. 2014, 94, 189–202. [Google Scholar] [CrossRef]
- Greco, S.; Gutzeit, K.; Hotz, H.; Kirsch, B.; Aurich, J.C. Selective laser melting (SLM) of AISI 316L—Impact of laser power, layer thickness, and hatch spacing on roughness, density, and microhardness at constant input energy density. Int. J. Adv. Manuf. Technol. 2020, 108, 1551–1562. [Google Scholar] [CrossRef]
- Li, X.; Ni, X.; Xin, M.; Kong, B.; Wu, J. Wear Behavior of Reinforced Modified UHMWPE Material under Water Lubrication. China Plast. Ind. 2019, 47, 23–26+57. [Google Scholar]
- Stwora, A.; Skrabalak, G.; Maszybrocka, J. To enhance mechanical properties of parts produced from AlSi10Mg powder with use of SLS/SLM methods by densification of the product surface layer. Mechanik 2017, 90, 426–431. [Google Scholar] [CrossRef]
- Chen, L.-Y.; Liang, S.-X.; Liu, Y.; Zhang, L.-C. Additive manufacturing of metallic lattice structures: Unconstrained design, accurate fabrication, fascinated performances, and challenges. Mater. Sci. Eng. R Rep. 2021, 146, 100648. [Google Scholar] [CrossRef]
- Tardelli, J.D.C.; Firmino, A.C.D.; Ferreira, I.; dos Reis, A.C. Influence of the roughness of dental implants obtained by additive manufacturing on osteoblastic adhesion and proliferation: A systematic review. Heliyon 2022, 8, e12505. [Google Scholar] [CrossRef]
- Matos, G.R.M. Surgery, Surface Roughness of Dental Implant and Osseointegration. J. Maxillofac. Oral Surg. 2021, 20, 1–4. [Google Scholar] [CrossRef]
- Zhang, W. Investigation on Process and Performance of TC4 Alloy Fabricated by Selective Laser Melting. Master’s Thesis, Guangdong University of Technology, Guangzhou, China, 2019. [Google Scholar]
- Vasylyev, M.; Mordyuk, B.M.; Voloshko, S.M. Wire-Feeding Based Additive Manufacturing of the Ti–6Al–4V Alloy. Part II. Mechanical Properties. 2023. Available online: https://ufm.imp.kiev.ua/en/abstract/v24/i01/005.html (accessed on 10 March 2024).
- Eskandari, H.; Lashgari, H.R.; Zangeneh, S.; Kong, C.; Ye, L.; Eizadjou, M.; Wang, H. Microstructural characterization and mechanical properties of SLM-printed Ti–6Al–4V alloy: Effect of build orientation. J. Mater. Res. 2022, 37, 2645–2660. [Google Scholar] [CrossRef]
- Simonelli, M.; Tse, Y.Y.; Tuck, C. On the Texture Formation of Selective Laser Melted Ti-6Al-4V. Met. Mater. Trans. A 2014, 45, 2863–2872. [Google Scholar] [CrossRef]
- Jiang, J. Organization and Properties of Medical Ti-6Al-4V Alloy by Selective Zone Laser Melting and Forming; Chongqing University: Chongqing, China, 2016. [Google Scholar]
- ASTME8/E8M-15a; Standard Test Methods for Tension Testing of Metallic Materials. ASTM International: West Conshohocken, PA, USA, 2016.
- Wang, D.; Yang, Y.Q.; Sun, X.B.; Chen, Y. Study on energy input and its influences on single-track, multi-track, and multi-layer in SLM. Int. J. Adv. Manuf. Technol. 2012, 58, 1189–1199. [Google Scholar]
- Yang, T.; Zheng, J.; Yao, Z.; Ma, L.; Zhang, Y. Finite element analysis of the biomechanical properties of the walking femur. Guangdong Med. J. 2016, 37, 512–515. [Google Scholar] [CrossRef]
- ISO 13314; Mechanical Testing of Metals—Ductility Testing—Compression Test for Porous and Cellular Metals. International Organization for Standardization: Geneva, Switzerland, 2011.
- Gong, M.; Tan, L.; Yang, K. Bone tissue engineering scaffold materials and their mechanical properties. Mater. Rep. 2007, 10, 43–46+54. [Google Scholar]
Figure 1.
Model display effect. Adapted from Ref. [24].
Figure 1.
Model display effect. Adapted from Ref. [24].
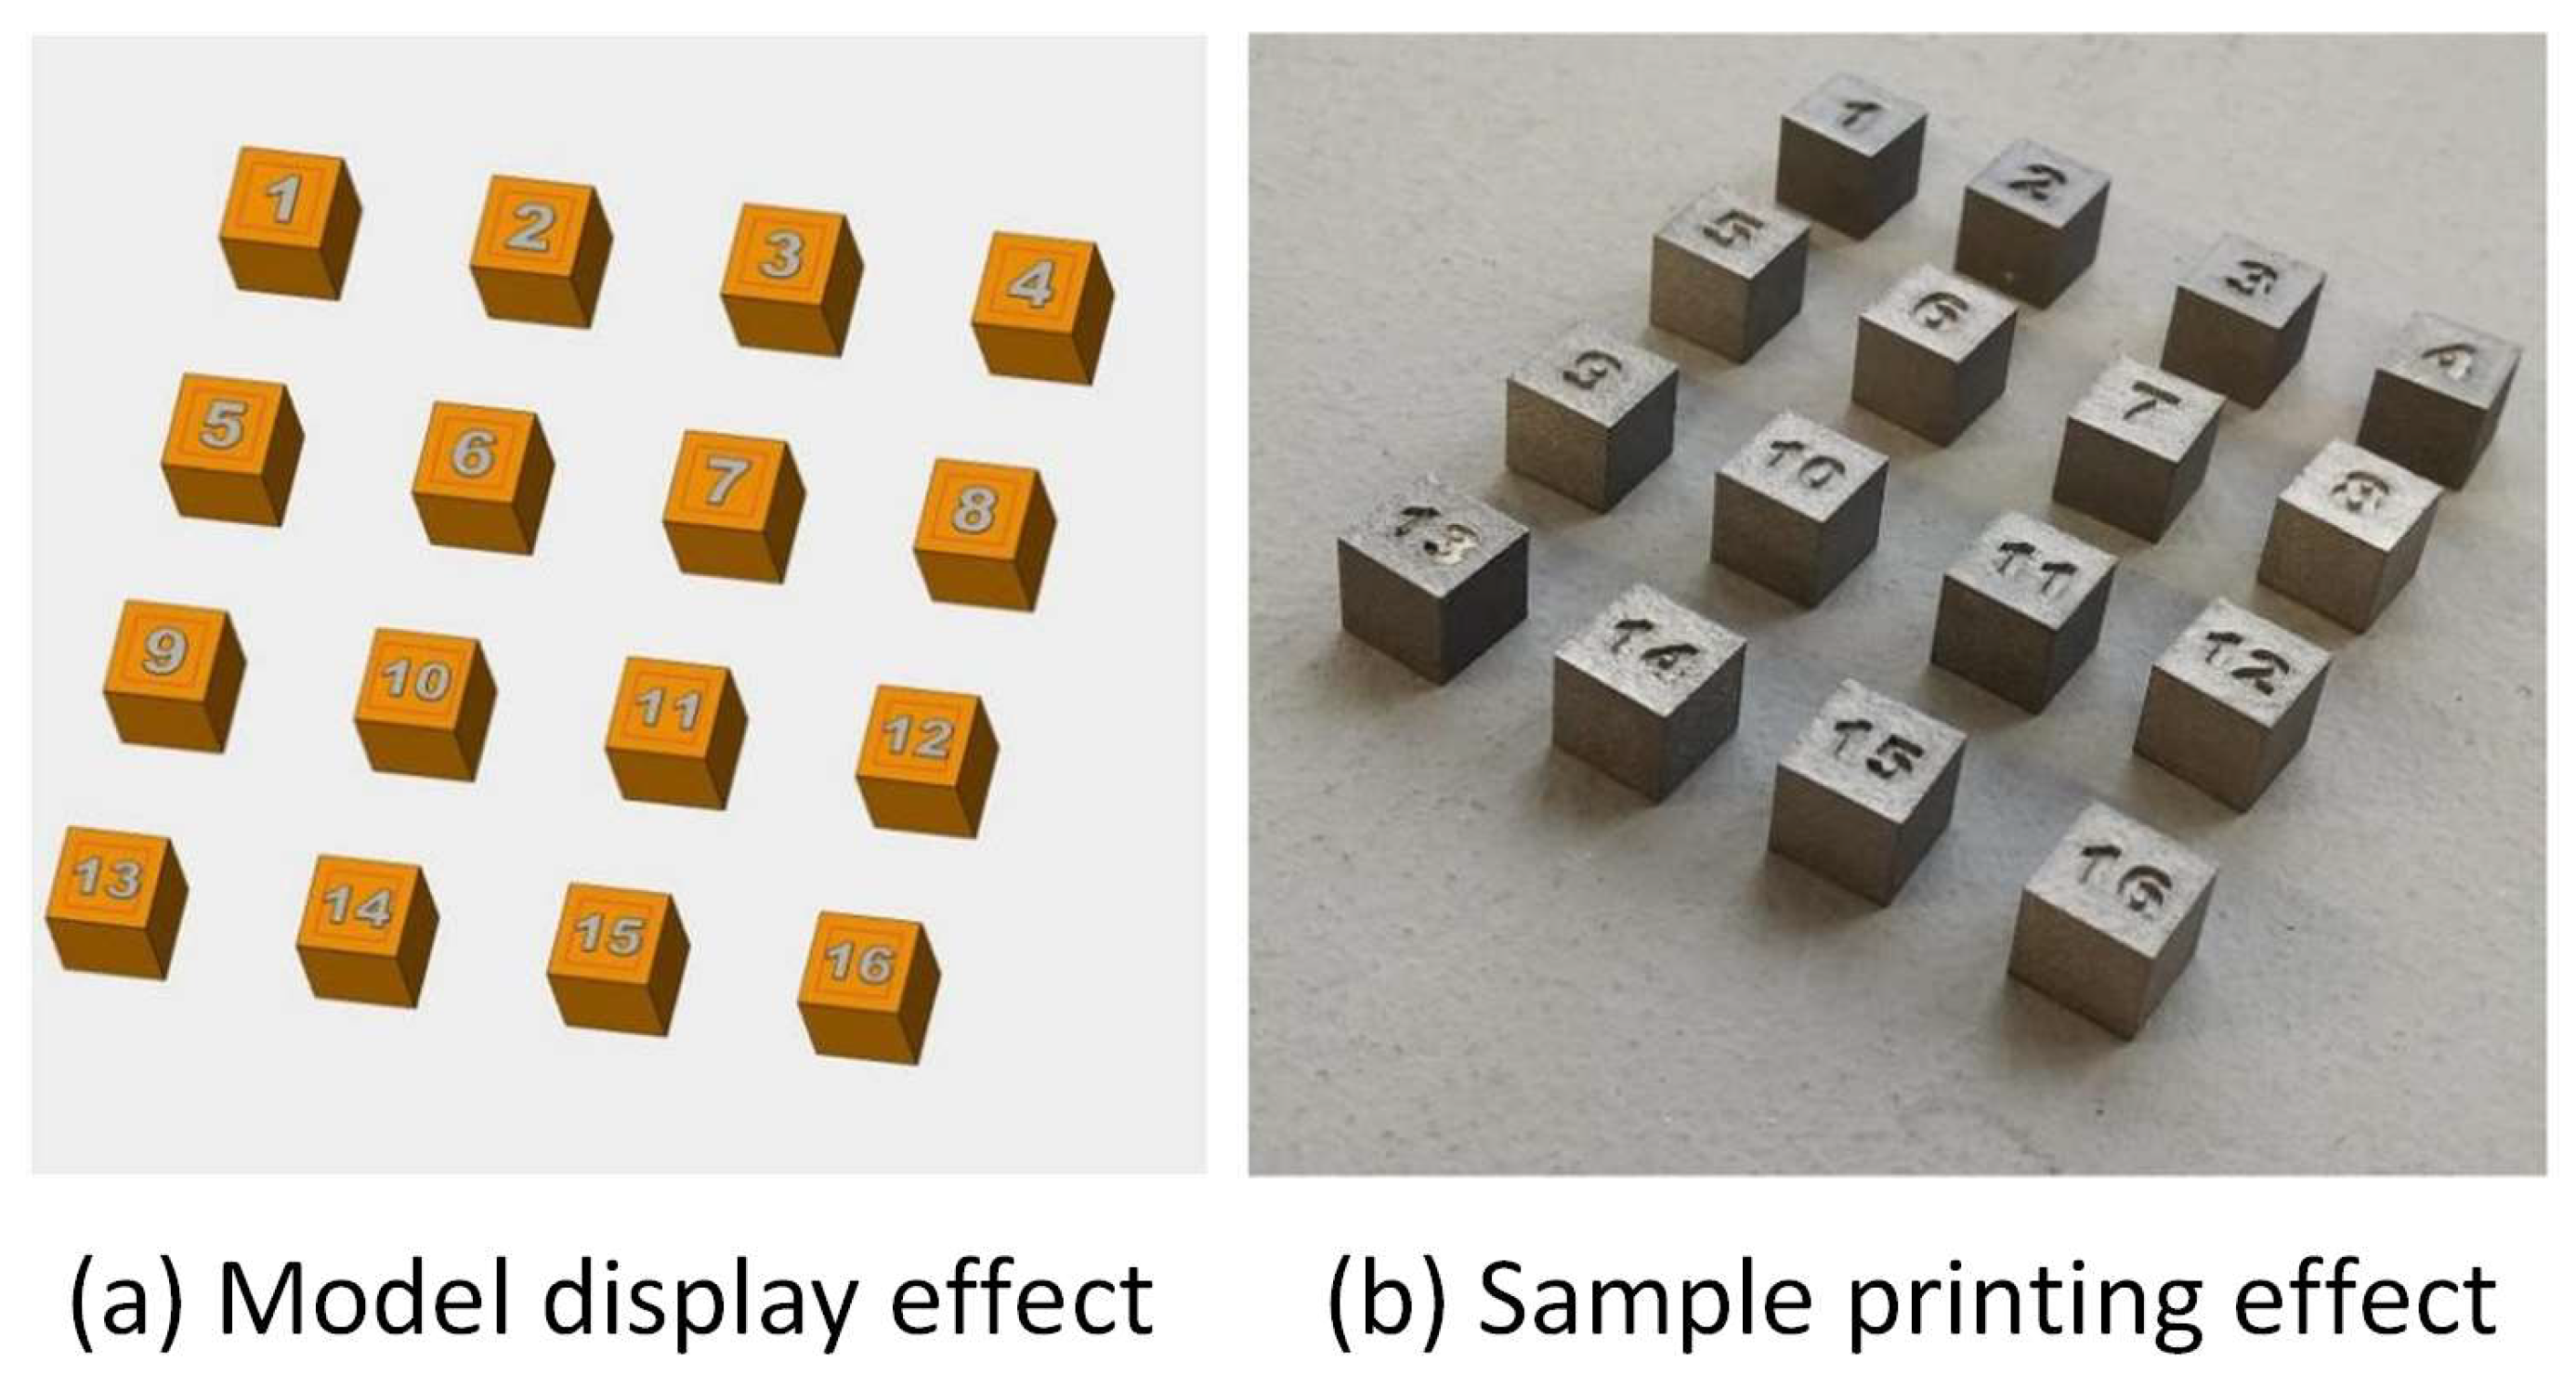
Figure 2.
Influence of each factor level value on density in orthogonal experiment.

Figure 3.
Micromorphology of 16 groups of samples.

Figure 4.
Roughness curve.

Figure 5.
Micromorphology of longitudinal section of forming sample. (a,b) show the microscopic morphology of the longitudinal section of the specimen under optical microscope, and (c,d) show the microscopic morphology of the longitudinal section of the specimen observed by SEM.
Figure 5.
Micromorphology of longitudinal section of forming sample. (a,b) show the microscopic morphology of the longitudinal section of the specimen under optical microscope, and (c,d) show the microscopic morphology of the longitudinal section of the specimen observed by SEM.
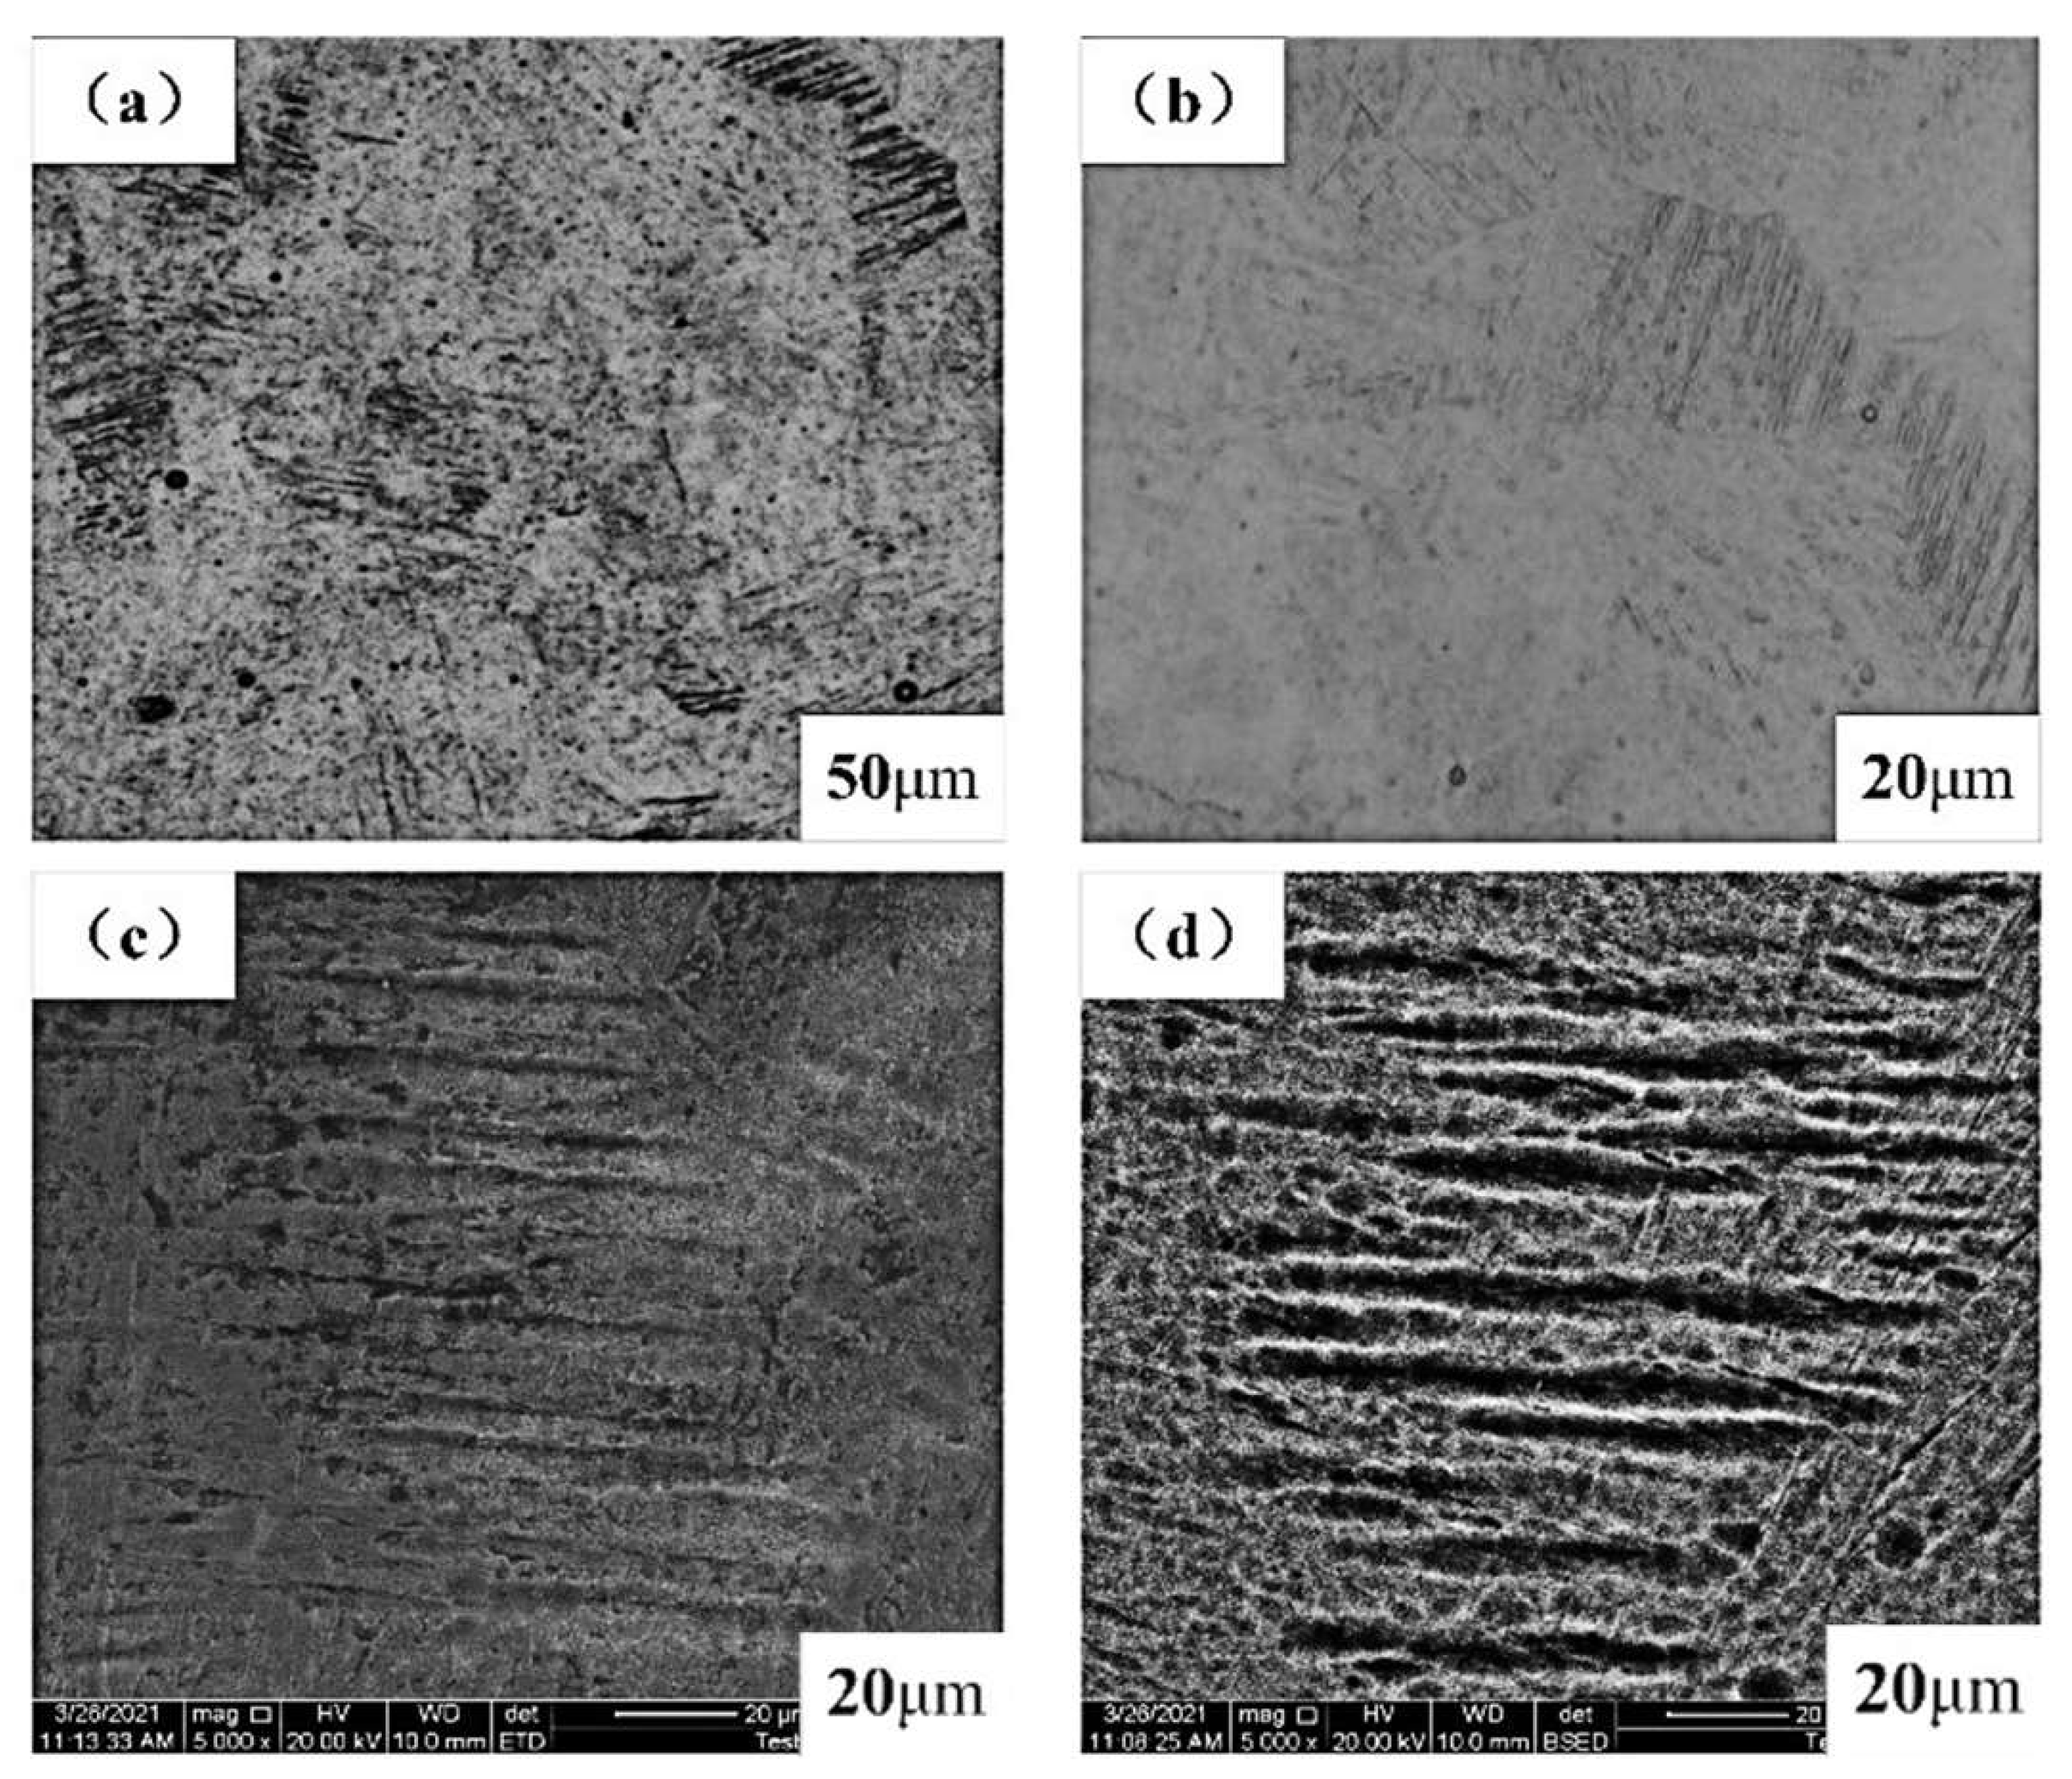
Figure 6.
Micromorphology of cross-section of molding sample. (a,b) are the microscopic morphology of the specimen cross-section under optical microscope, and (c,d) are the microscopic morphology of the specimen cross-section observed by SEM.
Figure 6.
Micromorphology of cross-section of molding sample. (a,b) are the microscopic morphology of the specimen cross-section under optical microscope, and (c,d) are the microscopic morphology of the specimen cross-section observed by SEM.

Figure 7.
XRD pattern of SLM-formed sample.

Figure 8.
Microhardness values of molding samples.
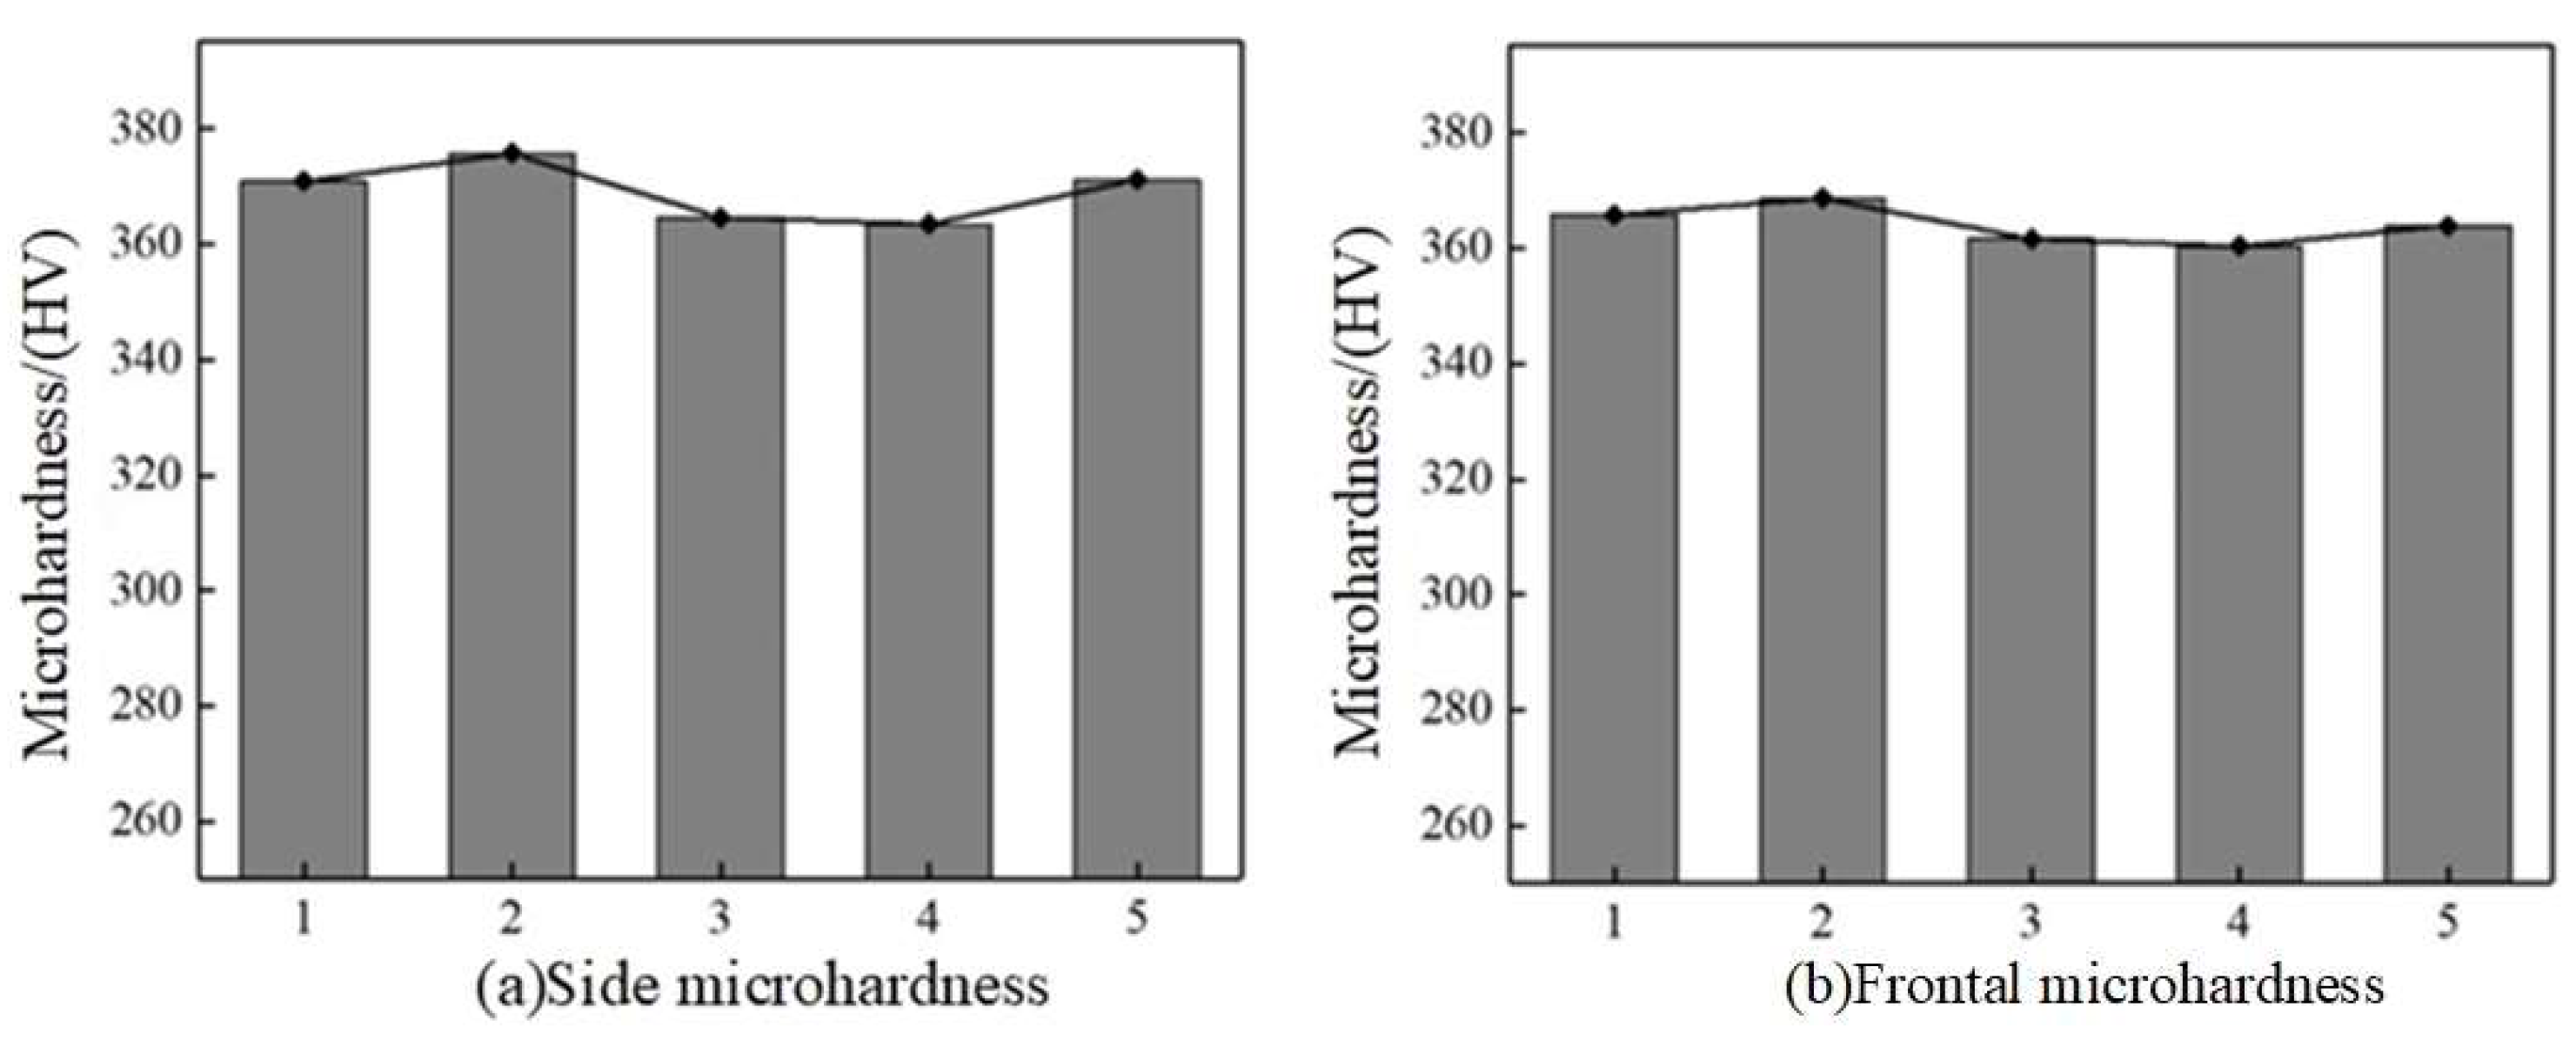
Figure 9.
Dimensions of tensile specimens.
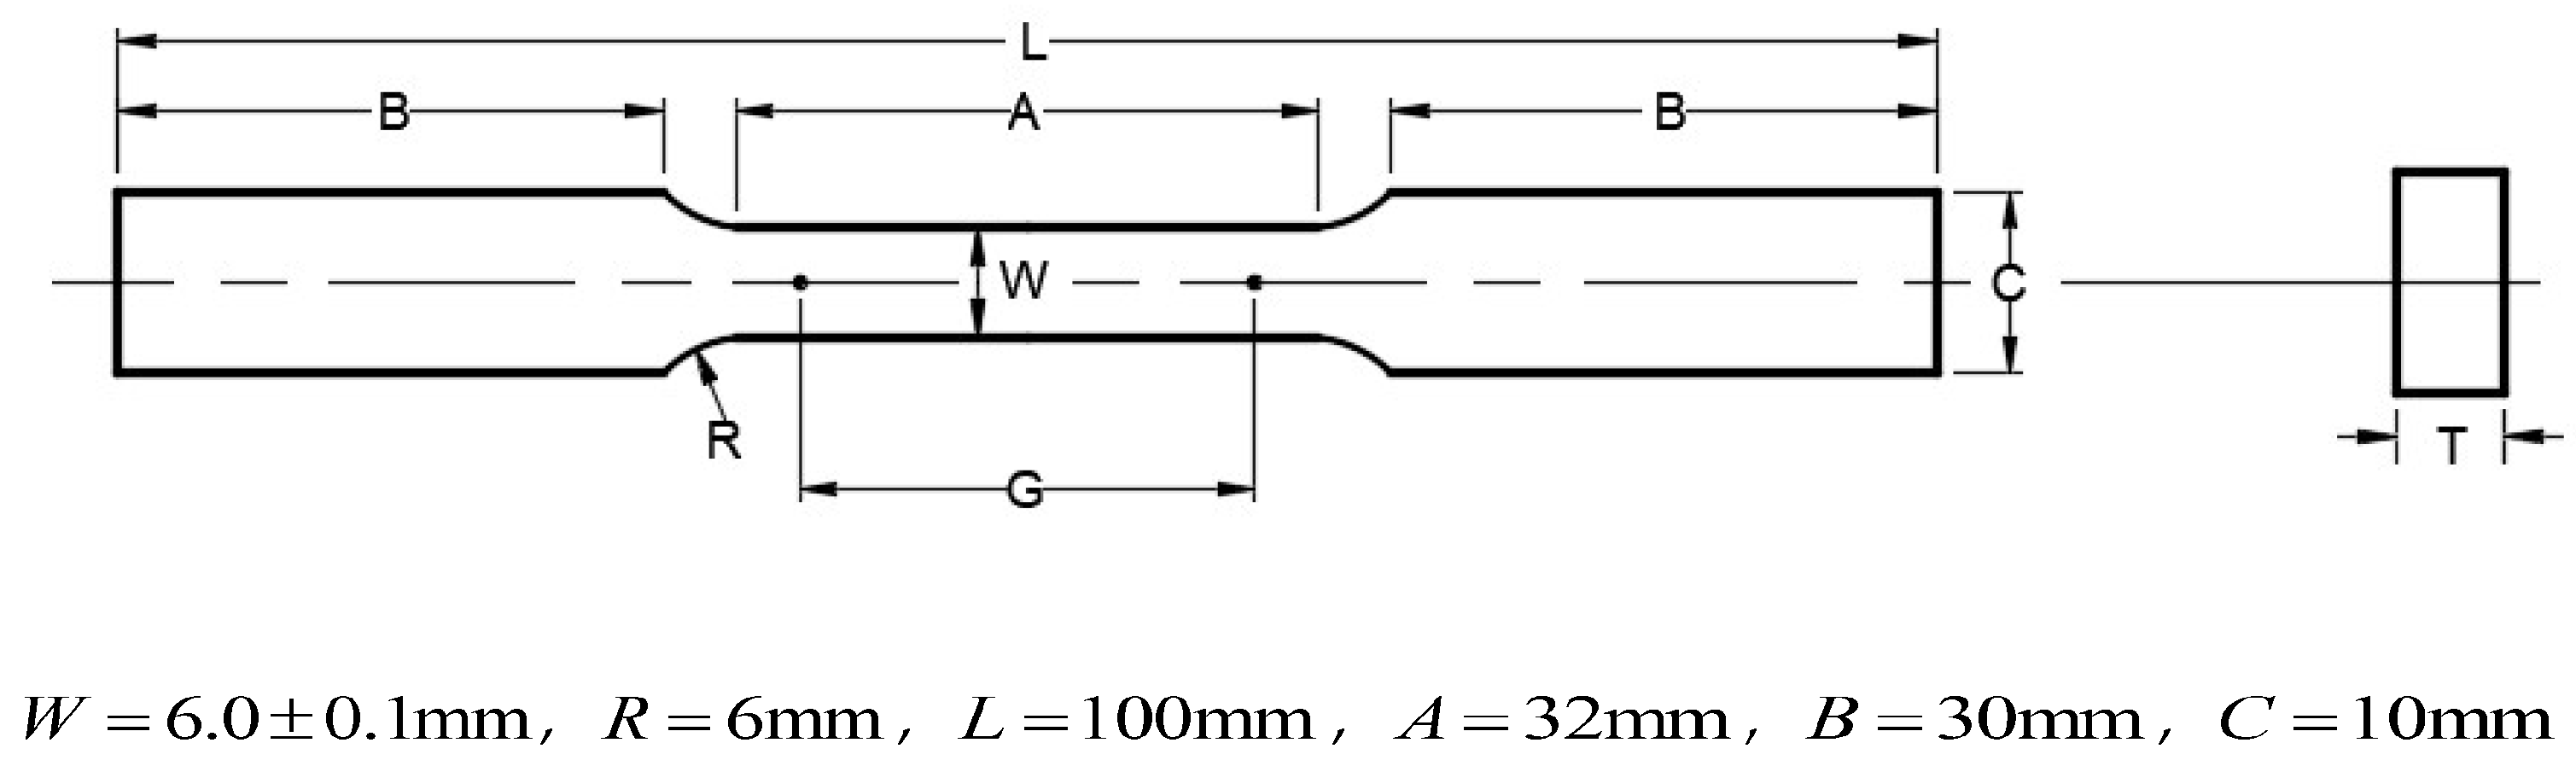
Figure 10.
Tensile specimens.
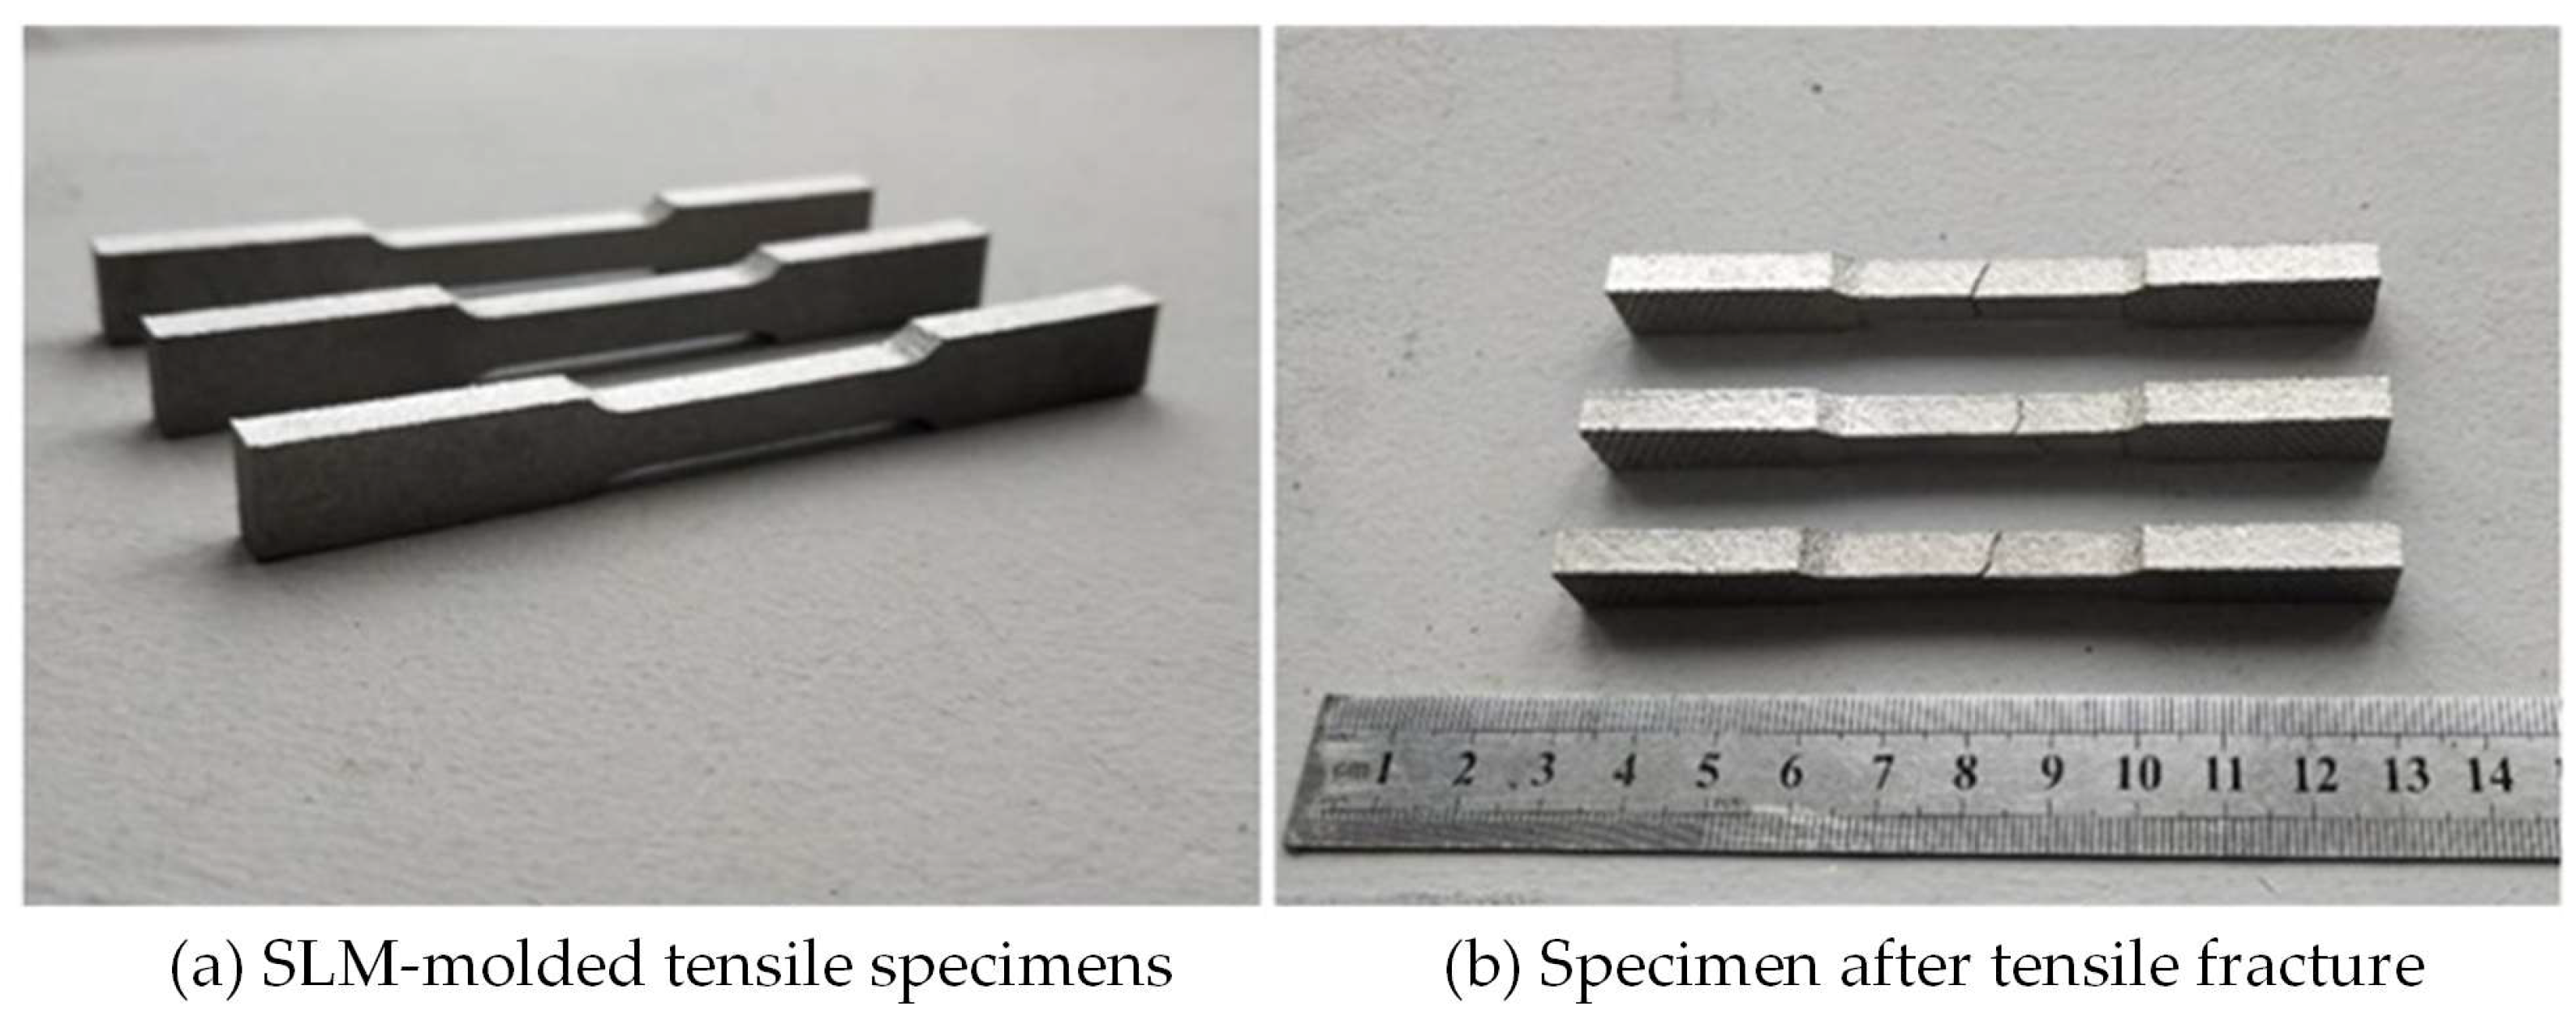
Figure 11.
Stress–strain curve.
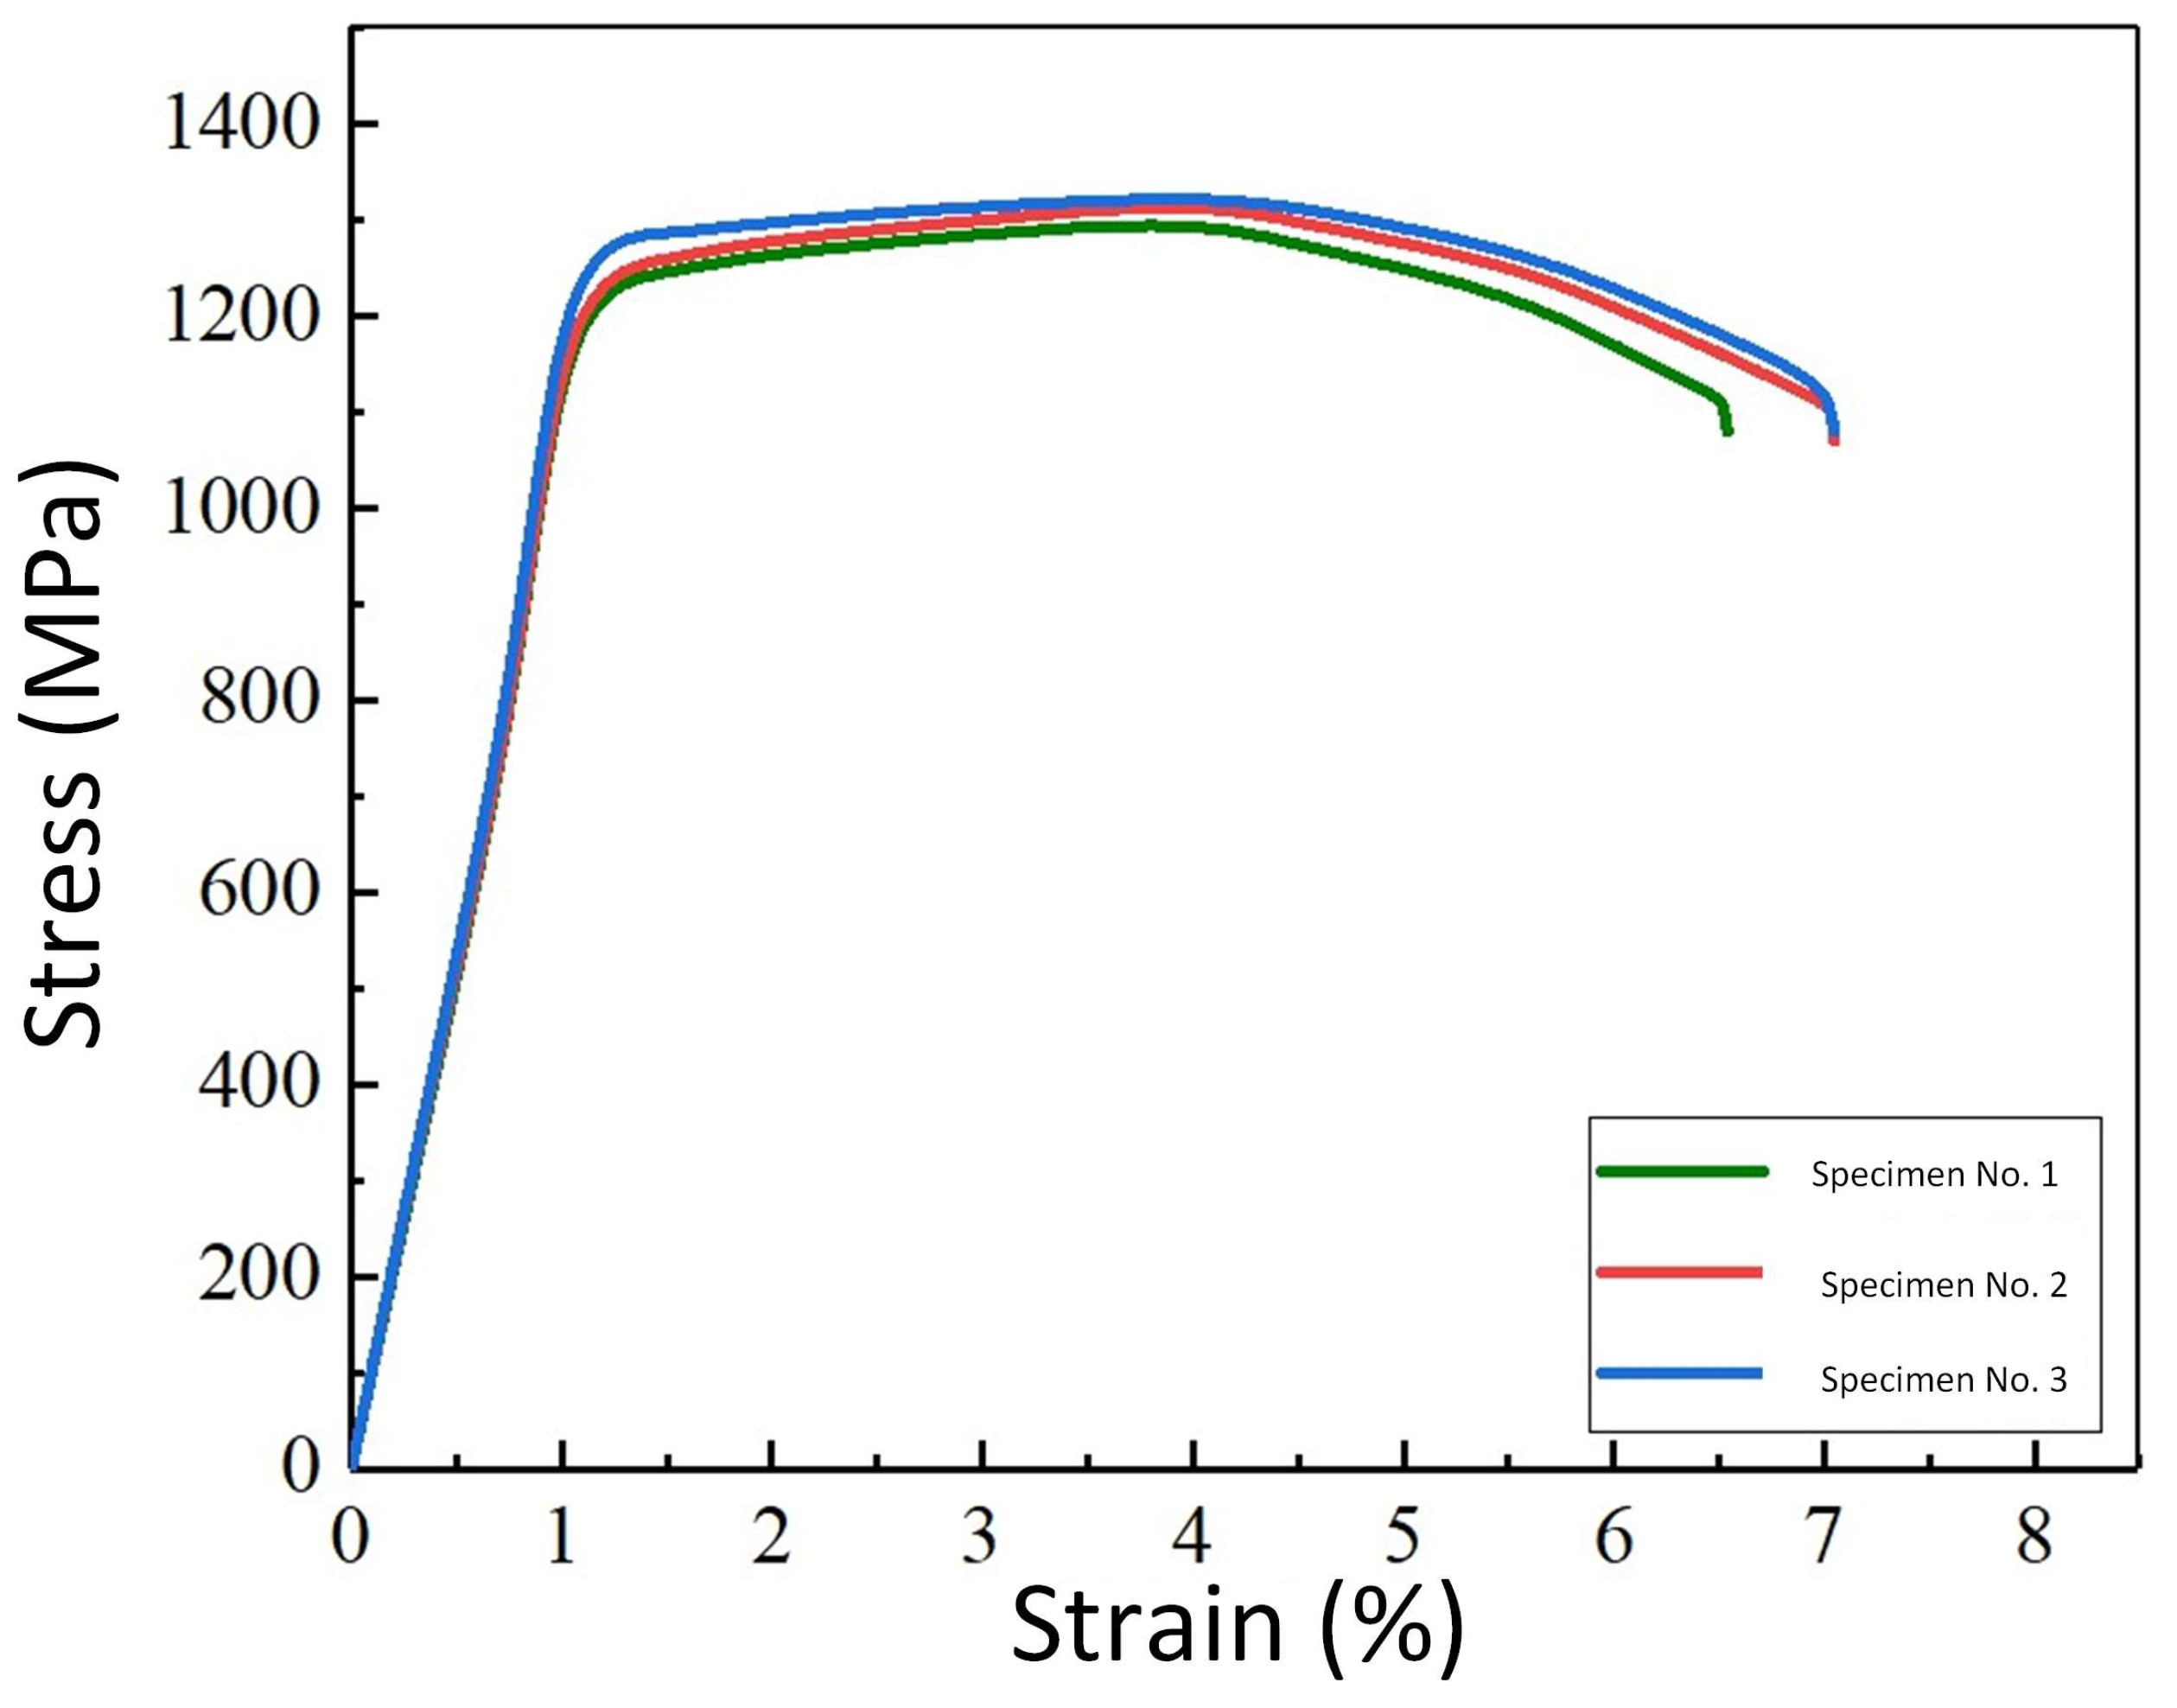
Figure 12.
Compressed sample model.

Figure 13.
Compression sample molding effect.
Figure 14.
Sample effect after compression test.
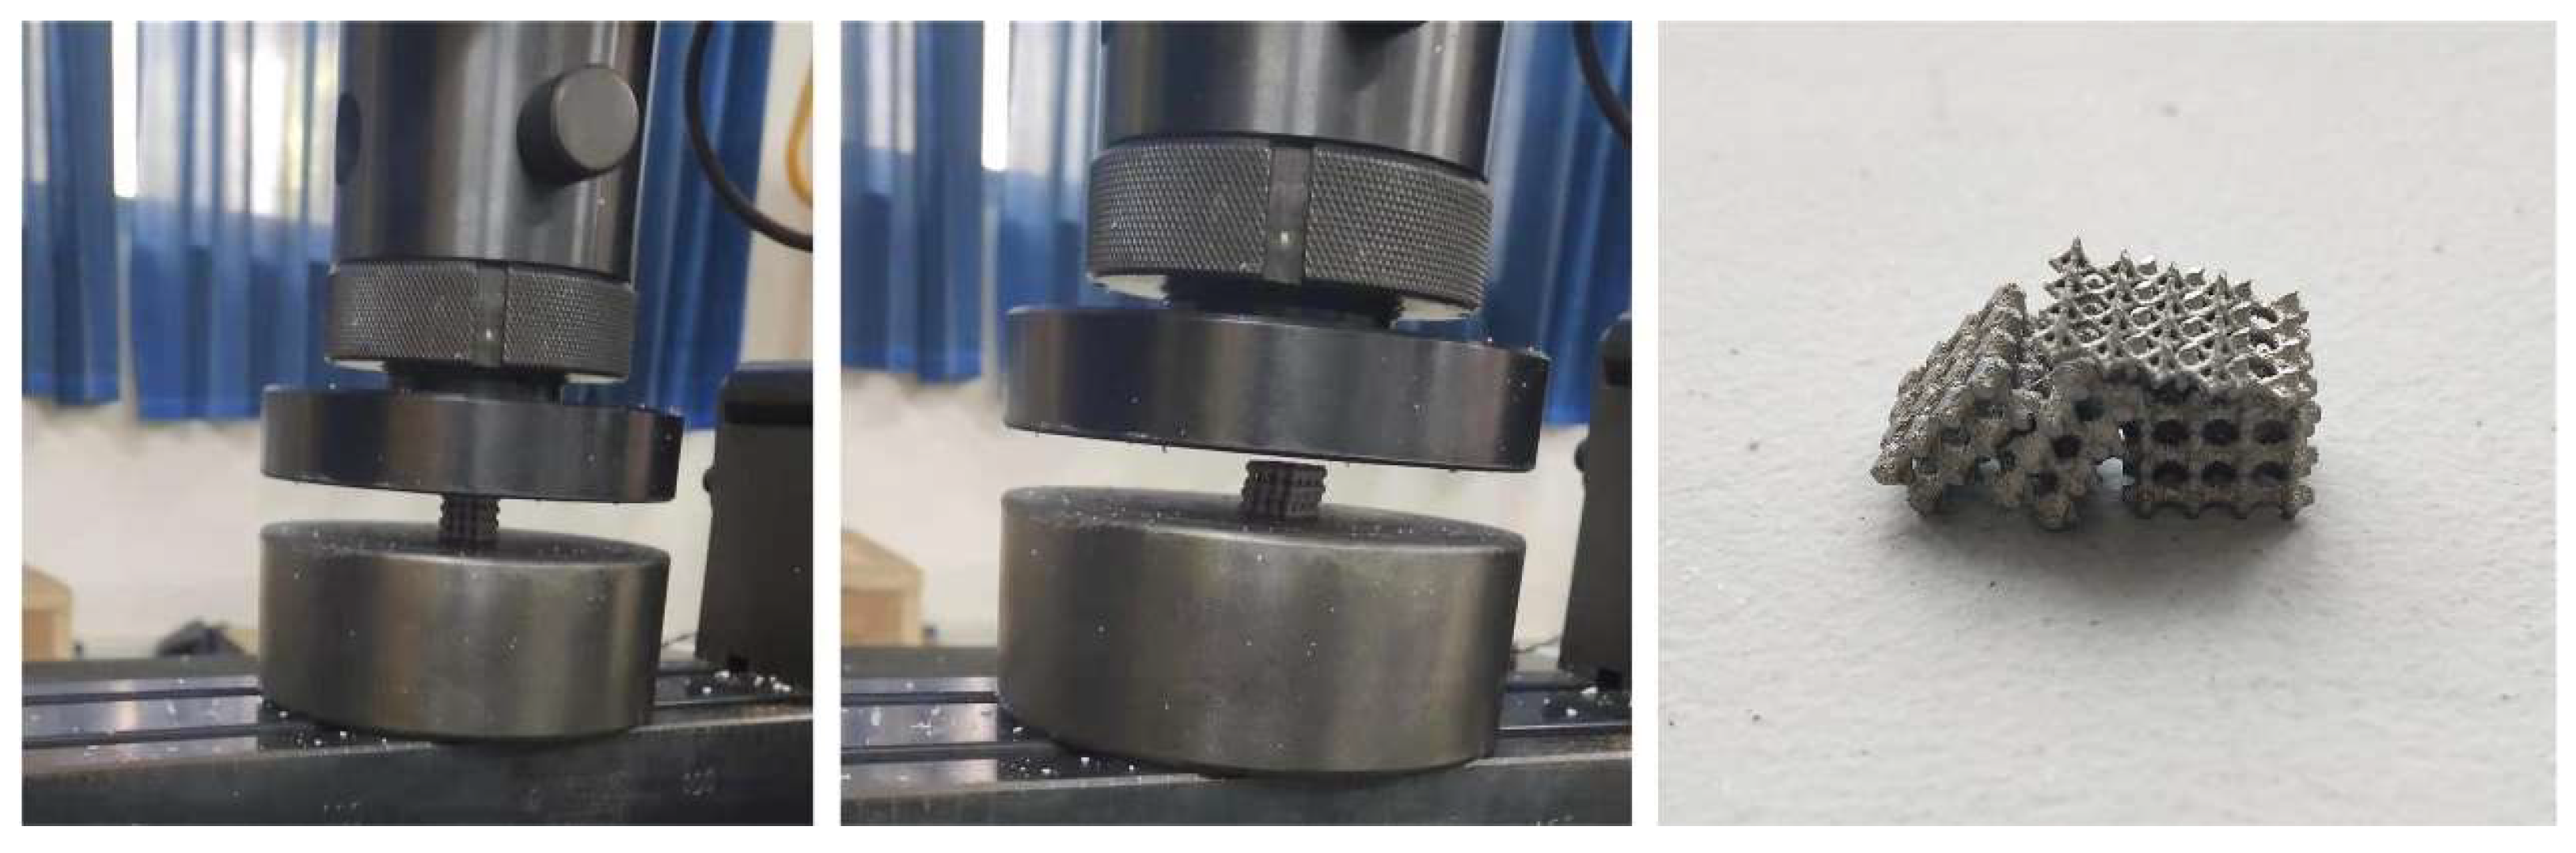
Figure 15.
Stress–strain curve.

Figure 16.
Friction coefficient of samples with different forming modes.

Figure 17.
Average friction coefficient of samples under different lubrication conditions.

Figure 18.
Friction coefficient of samples under different conditions.

Table 1.
Comparison of Ti-6Al-4V powder with GB/T 13810-2007 and ASTM F136 standard. Reprinted from Ref. [24].
Table 1.
Comparison of Ti-6Al-4V powder with GB/T 13810-2007 and ASTM F136 standard. Reprinted from Ref. [24].
| Ingredients | Ti | Al | V | Fe | C | O | N | H |
|---|---|---|---|---|---|---|---|---|
| ASTM F136 | Residual | 5.5–6.5 | 3.5–4.5 | ≤0.25 | ≤0.08 | ≤0.13 | ≤0.05 | ≤0.012 |
| GB/T 13810 | Residual | 5.5–6.75 | 3.5–4.5 | 0.3 | 0.08 | 0.02 | 0.05 | 0.015 |
| TC4 | Residual | 6.1 | 3.95 | 0.1 | 0.004 | 0.01 | 0.01 | 0.001 |
Table 2.
Basic characteristics of TC4 powder.
| D3 | D10 | D50 | D70 | D90 | D95 | D97 |
|---|---|---|---|---|---|---|
| 8.942 μm | 18.214 μm | 35.106 μm | 43.330 μm | 58.394 μm | 65.242 μm | 73.408 μm |
Table 3.
Factors and horizontal design of orthogonal experiment. Reprinted from Ref. [24].
Table 3.
Factors and horizontal design of orthogonal experiment. Reprinted from Ref. [24].
| Number | 1 | 2 | 3 | 4 |
|---|---|---|---|---|
| Laser power P/(W) | 300 | 320 | 340 | 360 |
| Scanning speed v/(mm/s) | 1050 | 1250 | 1450 | 1650 |
| Scan spacing d/(mm) | 0.08 | 0.09 | 0.10 | 0.11 |
| Thickness of powder printing layer h/(mm) | 0.04 | 0.05 | 0.06 | 0.07 |
Table 4.
Analysis results of the side roughness of the sample.
| Factors (Process Parameters) | Laser Power P | Scanning Speed v | Scan Spacing d | Thickness of Powder Layer h |
|---|---|---|---|---|
| Level index and K1 | 35.911 | 38.532 | 41.6 | 40.585 |
| Level index and K2 | 37.331 | 36.045 | 36.431 | 36.142 |
| Level index and K3 | 40.807 | 39.328 | 37.988 | 37.502 |
| Level index and K4 | 40.937 | 41.081 | 38.967 | 40.757 |
| Horizontal k1 | 8.978 | 9.633 | 10.400 | 10.146 |
| Horizontal k2 | 9.333 | 9.011 | 9.108 | 9.036 |
| Horizontal k3 | 10.202 | 9.832 | 9.497 | 9.376 |
| Horizontal k4 | 10.234 | 10.270 | 9.742 | 10.189 |
| Average index R | 1.256 | 1.259 | 1.292 | 1.153 |
Table 5.
Analysis results of the front roughness of the sample.
| Factors (Process Parameters) | Laser Power P | Scanning Speed v | Scan Spacing d | Thickness of Powder Layer h |
|---|---|---|---|---|
| Level index and K1 | 42.422 | 43.578 | 44.745 | 44.677 |
| Level index and K2 | 44.501 | 42.426 | 42.028 | 43.356 |
| Level index and K3 | 45.59 | 44.506 | 45.433 | 45.365 |
| Level index and K4 | 46.867 | 48.87 | 47.174 | 45.982 |
| Horizontal k1 | 10.606 | 10.895 | 11.186 | 11.169 |
| Horizontal k2 | 11.125 | 10.607 | 10.507 | 10.839 |
| Horizontal k3 | 11.398 | 11.127 | 11.358 | 11.341 |
| Horizontal k4 | 11.717 | 12.218 | 11.794 | 11.496 |
| Average index R | 1.111 | 1.611 | 1.287 | 0.657 |
Table 6.
Tensile test results and comparison of SLM-molded samples.
| Type | Yield Strength (MPa) | Tensile Strength (MPa) | Elongation (%) |
|---|---|---|---|
| ASTM F136 | 795 | 860 | 10.0 |
| Casting | 847 | 976 | 5.1 |
| SLM molding | 1217.40 | 1315.32 | 9.6 |
Table 7.
Compression experimental results.
| Volume Fraction | 10% | 20% | 30% | 40% |
|---|---|---|---|---|
| Modulus of elasticity (GPa) | 0.75 | 1.51 | 7.99 | 12.63 |
| Compressive strength (MPa) | 8 | 48 | 219 | 338 |
Disclaimer/Publisher’s Note: The statements, opinions and data contained in all publications are solely those of the individual author(s) and contributor(s) and not of MDPI and/or the editor(s). MDPI and/or the editor(s) disclaim responsibility for any injury to people or property resulting from any ideas, methods, instructions or products referred to in the content. |
© 2024 by the authors. Licensee MDPI, Basel, Switzerland. This article is an open access article distributed under the terms and conditions of the Creative Commons Attribution (CC BY) license (https://creativecommons.org/licenses/by/4.0/).
Share and Cite
MDPI and ACS Style
Zhang, W.; Liu, H.; Liu, Z.; Liang, Y.; Hao, Y. Experimental Study of Performance of Ti-6Al-4V Femoral Implants Using Selective Laser Melting (SLM) Methodology. Metals 2024, 14, 492. https://doi.org/10.3390/met14050492
AMA Style
Zhang W, Liu H, Liu Z, Liang Y, Hao Y. Experimental Study of Performance of Ti-6Al-4V Femoral Implants Using Selective Laser Melting (SLM) Methodology. Metals. 2024; 14(5):492. https://doi.org/10.3390/met14050492
Chicago/Turabian StyleZhang, Wenjie, Hongxi Liu, Zhiqiang Liu, Yuyao Liang, and Yi Hao. 2024. "Experimental Study of Performance of Ti-6Al-4V Femoral Implants Using Selective Laser Melting (SLM) Methodology" Metals 14, no. 5: 492. https://doi.org/10.3390/met14050492
Note that from the first issue of 2016, this journal uses article numbers instead of page numbers. See further details here.