
Stress Relaxation Cracking in 347H Stainless Steel Arc Welds: Susceptibility Evaluation of Heat-Affected Zone

1
George S. Ansell Department of Metallurgical and Materials Engineering, Colorado School of Mines, Golden, CO 80401, USA
2
National Renewable Energy Laboratory, Golden, CO 80401, USA
*
Author to whom correspondence should be addressed.
Metals 2024, 14(5), 494; https://doi.org/10.3390/met14050494
Submission received: 21 March 2024
/
Revised: 21 April 2024
/
Accepted: 21 April 2024
/
Published: 24 April 2024
(This article belongs to the Special Issue Characterization, Analysis, and Defects in Metallic Materials and Their Welds)
Abstract
:Stress relaxation cracking (SRC) is considered one of the major failure mechanisms for 347H stainless steel welds at elevated service temperatures or during post weld heat treatment (PWHT), especially within the heat-affected zone (HAZ). This work focuses on the characterization of SRC susceptibility within 347H physically simulated arc welded HAZ at elevated temperatures. A four-step SRC thermomechanical test in combination with finite element modeling (FEM) of the welding and testing processes is developed to establish a susceptibility map for HAZ. The test first runs a thermal cycle with three different peak temperatures (1335, 1275, and 1150 °C) to duplicate representative HAZ subzone microstructures, followed by time-to-failure examination under a variety of pre-stress (260–600 MPa) and pre-strain conditions (0.03–0.19) as a function of reheat temperatures between 750 and 1050 °C. With the aid of FEM, SRC susceptibility maps are generated to identify the threshold stress, plastic strain, and creep strain as a function of test temperature. It was found out that HAZ subzone with a lower peak temperature (1150 °C) appears to be slightly less susceptible to SRC than the other two subzones that experienced higher peak temperatures. Generally, time-to-fracture reduces with increasing initially applied stress and strain for all test temperatures. The pre-stress thresholds decrease from about 500 to 330 MPa as the testing temperature increases from 800 to 1050 °C, while the corresponding initial plastic strain thresholds reduces from 0.15 to 0.06. The SRC susceptibility was also evaluated through the Larson–Miller Parameter (LMP) analysis as a function of plastic strain, initial stress and starting stress upon reaching the testing temperature, respectively. The 1050 °C test with a high pre-applied strain (0.1) exhibits an extremely short time to failure (t = 3 s) that lies outside the general trend in LMP analysis. Additionally, it was identified that a plastic strain above 0.07 is identified to significantly reduce the bulk creep strain tolerance to fracture and therefore increases SRC susceptibility. Hardness measurement and fractography analysis indicated that the strain aging of niobium carbonitrides and other potential phases in conjunction with intergranular precipitates contributes to an increase in microhardness and increased intergranular cracking susceptibility.
1. Introduction
Among austenitic 3XX stainless steel (SS) grades (e.g., 304H, 316H, 321H, and 347H), 347H exhibits good sensitization resistance due to the addition of Nb as a stronger carbide former than Cr. 347H SS also exhibits higher yield and creep strengths at moderate temperatures (e.g., up to 650 °C) due to the presence of Nb carbonitride precipitates throughout the microstructure [1,2]. However, 347H SS welds made with a matching filler E347 may be subject to various weldability issues, including liquation cracking in the partially melted zone (PMZ) during welding [3,4,5,6], ductility-dip cracking in the reheated fusion zone (FZ) and heat-affected zone (HAZ) during multi-pass welding [7,8,9,10], or stress relaxation cracking (SRC)/reheat cracking in the FZ or HAZ during service or post weld heat treatment (PWHT) [7,9,11,12,13,14,15,16]. More than 50 service failures are reported [15] in the welds of precipitation strengthened SSs (including 347H) and Ni-base alloys in elevated temperature and high-pressure service conditions without the presence of a corrosive environment, and SRC is referenced as the most likely failure mechanism for these alloys [11,12,14,15,17]. Recent works on 347H SS weld service failures in concentrating solar power molten nitrate tanks during elevated temperature service conditions have been investigated with a large contributing cause argued to be SRC [18,19,20]. Additionally, chemical and refining industries report SRC concerns in recent years in 347H SS welds [21,22,23,24]. 347H SS welds are claimed to have higher SRC susceptibility at elevated temperatures than 321, 316 Nb, 310, 309, 316, and 304 SS grades, with most cracks appearing to have originated in the HAZ [11,12,14].
SRC in 347H welds are reported to occur at temperatures between 500 and 750 °C after one to two years in service [14,15] or within a year after repair with the characteristics of intergranular fracture and small-isolated cavities present ahead of cracks [25]. The susceptible microstructure argued to primarily contribute to SRC is the evolution of precipitate-free zones (PFZs) adjacent to austenite grain boundaries due to the formation of coarse grain boundary niobium carbonitrides while the interior of austenite grains are strengthened by intragranular fine Nb (C, N) particles [14]. To be more specific, during welding, stabilized niobium carbonitrides in 347H SS are dissolved in the HAZ during the welding procedure. Upon reheating (e.g., multi-pass welding, at service temperature or PWHT), fine Nb (C, N) particles may reprecipitate in the HAZ grain interiors on dislocation cores, while coarse precipitates may form along the grain boundaries [6,7], leading to the formation of a PFZ adjacent to the grain boundaries. Meanwhile, upon reheating, weld-induced residual strain/stress preferentially relaxes into the soft PFZs and therefore exhausts the local creep strain, leading to observations of creep cavities [26] and ultimately intergranular cracking [8,9]. Kant et al. used six parameters to characterize the SRC failure index, including the extent of ductility loss, degree of stress relaxation, hardness increase, failure time reduction, and intergranular fracture modes on primary and secondary fracture surfaces [13].
SRC can be mitigated by a properly designed residual stress relieving process, i.e., PWHT, which could also benefit microstructure stabilization [11,12]. The percentage of initial stress relieved in unit time increases with increasing PWHT temperature. For 347 SS, 79% of stress reduction is reported in a 0.84″ thick pipe through PWHT at 900 °C for 2 h [27,28,29,30]. Dillingh et al. [14] suggested a single-step PWHT at 875 °C for a few hours to reduce SRC susceptibility in 347H SS, while others recommended PWHT near the solutionizing temperature (>1050 °C) for complete stress relief [27,28,29,30] and ductility retention in 2″ thick welds [31]. In addition, a multi-step PWHT thermal cycle is reported being used in industry with success of crack mitigation [11,12], which included an initial stress relief step at 600 °C, solutionizing and full stress relief at 1050 °C, and then stabilization of precipitates at 900–950 °C [11,29,32]. However, it should be noted that reheat cracking may occur during PWHT, as reported in the FZ of a 347H SS fillet weld during PWHT at 900 °C [7], and in HAZ at 700–900 °C within a couple hours at temperature [13,33]. Therefore, a comprehensive understanding of stress and strain thresholds for SRC as a function of both temperature and microstructure is critical for prediction of component life and control of SRC susceptibility during PWHT and service conditions and for enhancement of standards for fabrication and assembly procedures.
Time-to-failure SRC tests have been reported for 347H weldments [7,13,14,29] in a variety of test methods, sample dimensions and chemical compositions. Among these efforts, Gleeble® thermomechanical physical simulations have been demonstrated to be an effective method for SRC susceptibility testing in 347H weldments to reveal the effects of applied strain and temperature on time to failure [7,13,33]. For example, a simulated HAZ with an applied 10% cold work failed within four hours at 700 and 800 °C testing temperatures, and no failure occurred at 900 or 1000 °C with the same plastic strain or at all temperatures without cold work [13]. SRC susceptibility test methods in general focused on characterizing the stress relaxation behavior during isothermal holding in welds, i.e., after heating to the desired test temperatures [7,13,33,34]. Some recent methods have considered stress relaxation during the heating stage, such as Fink et al. [35] and Sarich et al. [36], which may assist in understanding further the relaxation behavior during the PWHT or transient stage in service. While previous work contributed to a base knowledge on SRC in 347H SS HAZ with differing results, a systematic study on the effects of stress, strain and temperature on time-to-failure as a function of HAZ subzone microstructure and a methodology to reveal the detailed stress component evolution during SRC would contribute to a more comprehensive understanding of HAZ SRC sensitivity of 347H SS. Such knowledge will be critical for development of solutions to mitigate the SRC concerns in application of 347H SS. In this work, the threshold stress and strain for SRC in HAZ of 347H SS is thoroughly investigated as a function of the HAZ subzone microstructure and reheat temperature (750–1050 °C) through Gleeble® thermomechanical testing. The thermal cycles associated with HAZ subzone microstructures and representative stress/strain range experienced by the HAZ microstructures are extracted from finite element (FE) models built for the 347H welding procedure in our previous work [37]. In this study, FE analysis of the Gleeble® experiment is performed to quantify the stress and individual strain components’ (e.g., elastic, plastic, creep, and thermal) evolution during the heating and temperature holding stages for an in-depth analysis of SRC failure. The comprehensive database established from this study can serve as critical inputs for SRC prediction and PWHT optimization for 347H SS weldments.
2. Methods
2.1. Materials
A 15.9 mm thick 347H base plate solution annealed at 1080 °C after hot rolling followed by water quenching is used for the initial condition of the SRC test samples. The bulk chemical composition of the 347H SS plate is shown in Table 1. The American Society for Testing and Materials (ASTM) A240/A240M-23 standard specification composition of Type 347H is also provided in the table as a comparison [38]. The test plate carbon content is 0.05 wt.%, and the Nb content is 0.58 wt.%, with acceptable amounts of P and S impurity content (0.031 wt.%).
2.2. SRC Thermomechanical Test Methodology
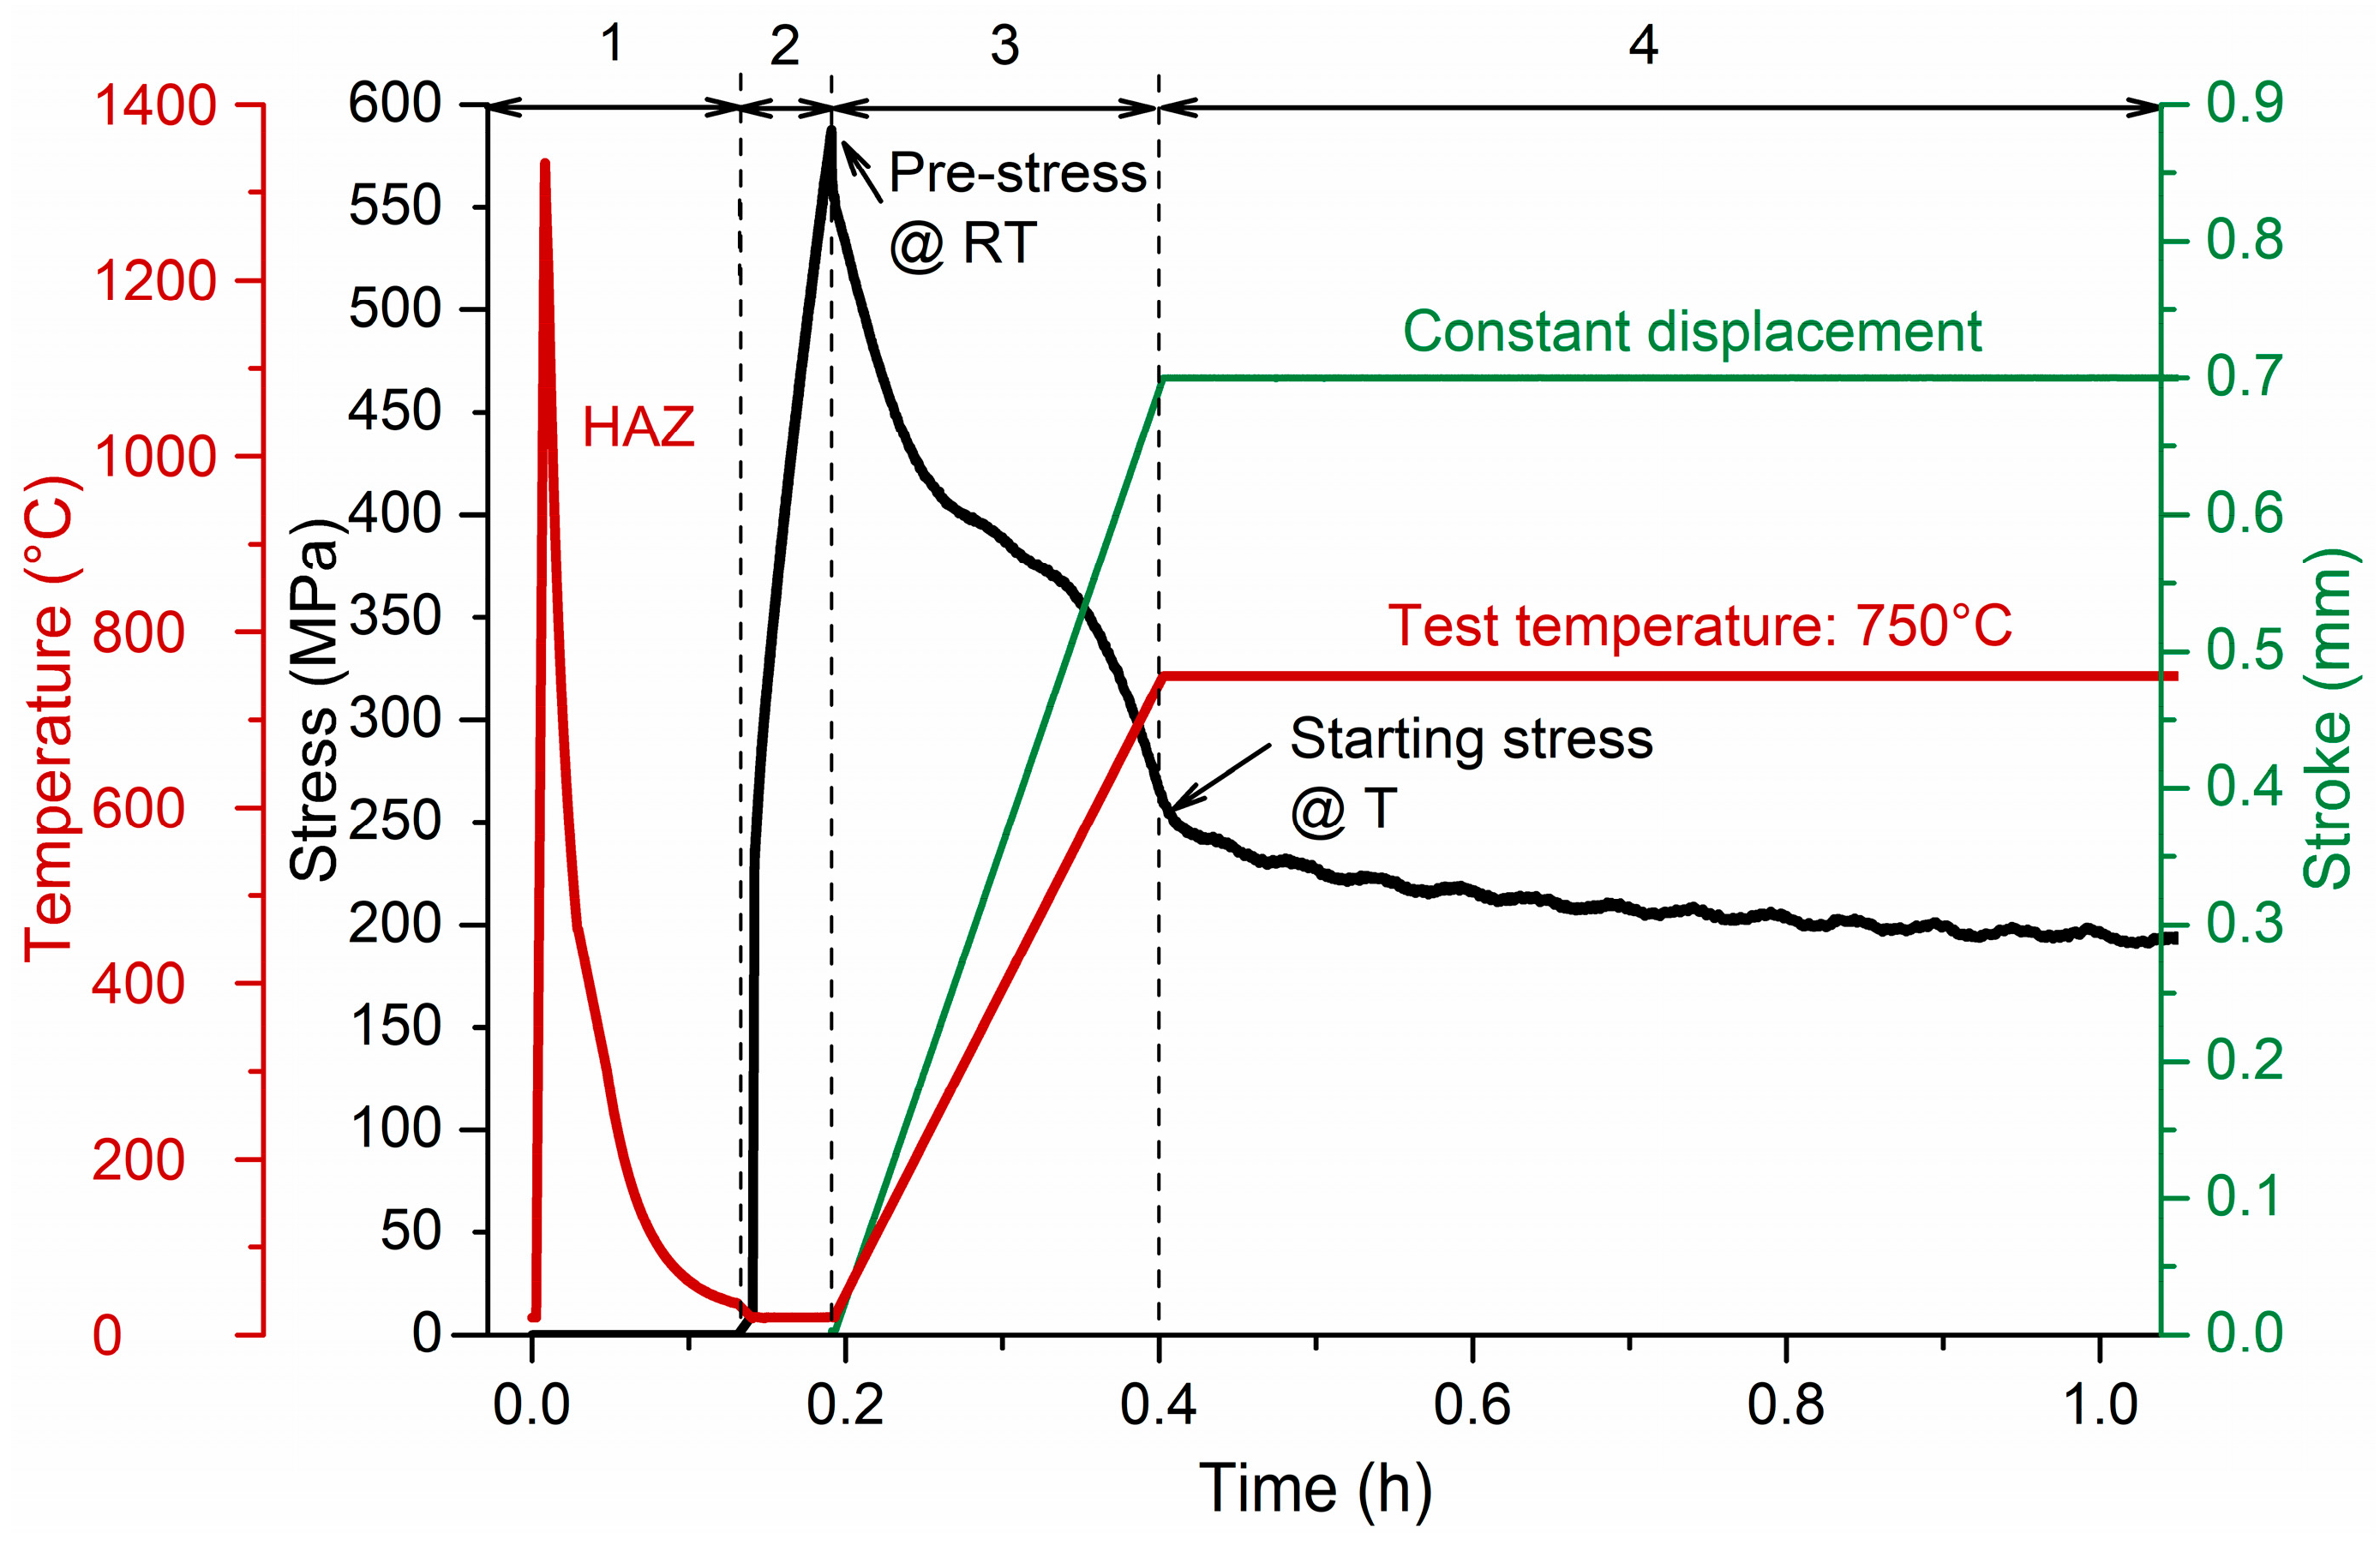
A Gleeble® 3500 thermomechanical physical simulator (manufactured by Dynamic Systems Incorporated (DSI)—Poestenkill, NY, USA) is used for SRC tests. Cylindrical tensile specimens with 6.35 mm round diameter and 31.75 mm gauge length are prepared with the tensile direction perpendicular to the rolling direction (RD) of the base plate. Three main variables in the SRC susceptibility tests for HAZ include (1) HAZ peak temperature, (2) pre-stress/strain at room temperature that simulates weld-induced residual stress/strain, prior to reheating, and (3) reheat temperature, simulating service and PWHT conditions. The test matrix includes (1) HAZ peak temperatures of 1335 (HAZ 1), 1275 (HAZ 2), and 1150 °C (HAZ 3), (2) pre-strain (stress) of 0.01 (250 MPa), 0.0175 (275 MPa), 0.025 (300 MPa), 0.04 (335 MPa), 0.05 (350 MPa), 0.08 (415 MPa), 0.1 (450 MPa) and 0.174 (600 MPa), and (3) reheat temperatures of 750, 800, 900, 950, 1000 and 1050 °C for isothermal holding until failure or up to 24 h. To physically simulate reheat cracking in 347H HAZ subzones, multiple steps of thermomechanical loading are designed, as illustrated in an example test in Figure 1. The first step simulates a weld HAZ thermal cycle with one of three peak temperatures (1150, 1275, and 1335 °C) under a zero-load using a heating rate of 66 °C/s and cooling rate of 23 °C/s within the 800–1200 °C temperature range, based on a previous FE simulation [37] using a weld arc energy per unit length of ~2.36–2.76 kJ/mm. Below 800 °C, the cooling rate is controlled at 9 °C/s from 800 °C to 500 °C, 2.5 °C/s from 500 °C to 300 °C, and then air cooled to room temperature below 300 °C. Prior to step one, the enclosed chamber is purged with argon gas after a couple rough vacuum pumps to reduce oxygen content below 30 ppm to prevent heavy surface oxidation, simulating the effect of shielding gas during welding.
During step two, a tensile stress/strain is applied at a quasi-static strain rate of 0.001 s−1 at room temperature, which is at or below the peak residual stress/strain induced by welding based on the FE predication validated by the neutron diffraction measurement [37]. After applying the desired pre-strain and prior to step three, the mechanical input is switched from “strain” to “stroke” (i.e., displacement) control and set to a “0” stroke condition prior to step three. In step three, the sample is heated to a designated temperature (between 750 and 1050 °C) with an additional stroke applied linearly with time, 0.01 mm/°C, to avoid stress reduction caused by thermal expansion. The stroke calibration data is extracted from a zero-load heat treatment to 1050 °C using a 58 °C/minute heating rate.
During step four, the temperature and displacement are a fixed constant to allow for stress relaxation at a hold time up to 24 h. One exception is made for the SRC sample with a 1335 °C HAZ thermal cycle tested at 800 °C and 0.1 pre-strain, which is tested beyond 24 h until fracture. If the load drops to near 0 (<0.5 kN), a “force level heat mute” command will be triggered, and the sample will air cool to room temperature. This safety command is used to prevent arcing and melting of the samples if the specimen fractures while at elevated temperatures. SRC test results are categorized based on (1) no failure, (2) failure during isothermal hold at temperature, and (3) failure during cooling.
Throughout each test, c-gauge is used to in situ monitor the radial displacement in the center of the gauge section during thermomechanical testing. Linear strain (Equation (1)) can be calculated using measured changes in diameter, assuming uniform plastic deformation and volume conservation [39]:
where is strain, is initial diameter and is transient change in diameter. The diametral strain is used to measure pre-strains during step two and strain in step four. True stress (Equation (2)) is calculated using transient change in diameter ()
where F is force in kN, is stress in MPa, is initial diameter in mm, and is transient change in diameter in mm.
Additionally, constants in the creep strain rate () equation (Equation (3) [39]) are determined via fitting experimental data from interested stress ranges in step four. Table 2 summarizes the fitted temperature-dependant K and n values.
where n is creep parameter, σ is stress, and K is creep constant that includes Arrhenius exponential dependency on temperature in the form of:
where A* is creep constant, Q is activation energy (556,000 J/mol [40,41]), R is gas constant (8.314 J/mol), and T is temperature in Kelvin.
2.3. Metallurgical Characterization Techniques
The metallographic samples are bisected parallel to the tensile direction of the SRC samples. The cross sections are ground and polished using standard metallographic techniques with a 1 µm diamond final polish surface. The etching procedure involved the use of electrolytic etching technique using 2 V and 90 mA settings with 40–50% diluted nitric acid solution. When samples are fully immersed in etching solution, 15–20 s etch time reveals grain boundaries and other free surfaces, such as α’ or twins. Some samples are analyzed with or without etching using light optical microscopy (LOM) or scanning electron microscopy (SEM) equipped with energy dispersive spectroscopy (EDS) for chemical mapping. Secondary electron imaging (SEI) with an accelerating voltage of 20 kV is used. Vicker’s microhardness testing is conducted using a minimum of 17 × 5 array in the center of the gauge section in the 6.35 mm diameter radial cross section with a 1 kg load using a minimum 4d spacing (d-diagonal of indent). A total of 85 microhardness points is measured for each condition.
2.4. FE Modeling of SRC Thermomechanical Test
FE modeling of the Gleeble® SRC experiment, using Abaqus software (version R2019x), is implemented to quantify the multi-components of strain (elastic, plastic, thermal and creep) and stress as a function of pre-strain and temperature. The total specimen length is 119.6 mm, the gage length is 31.75 mm, and diameter of the gauge section is 6.35 mm. The element size has a minimum value of 0.59 mm and a maximum value of 1 mm. The mesh sensitivity analysis was conducted by systematically varying the mesh density in this model. Starting with a baseline mesh, the element was refined to check the convergence and accuracy. By comparing the model and experimental temperature and stress data, the results converged and matched well by employing the mesh size in the present work with reasonable computational efficiency. In total, there are 15,360 elements with an 8-node linear brick type. A fully coupled thermal-electrical-structural analysis is performed with element type Q3D8. Concentrated current is loaded on grip area to heat the Gleeble® sample. Displacement loading is applied on the right end to simulate the displacement values used in experimental steps. Step one of heat cycle for HAZ microstructure generation is neglected in the FE model since it only changes the microstructure. The model uses HAZ physical properties as inputs directly. The temperature dependent material properties used for the Gleeble® FE model are reported in a collaborative paper [37], which includes density [42], specific heat [43], thermal conductivity [43], Young’ Modulus and Poisson’s ratio [43], thermal expansion coefficient [43], and electrical conductivity [44]. The temperature dependent flow true stress/strain data curves in the material database are extracted from Gleeble® reheat crack tests using the specific stress and strain for each temperature condition at 20 °C and 600–1050 °C. For 100–400 °C, the flow stress–strain data are obtained from the literature [45]. The creep parameters used in the FE model are obtained from thermomechanical tests, as listed in Table 2.
3. Results and Discussion
3.1. Effect of Weld-Induced Thermal Cycle(s) on HAZ Microstructure
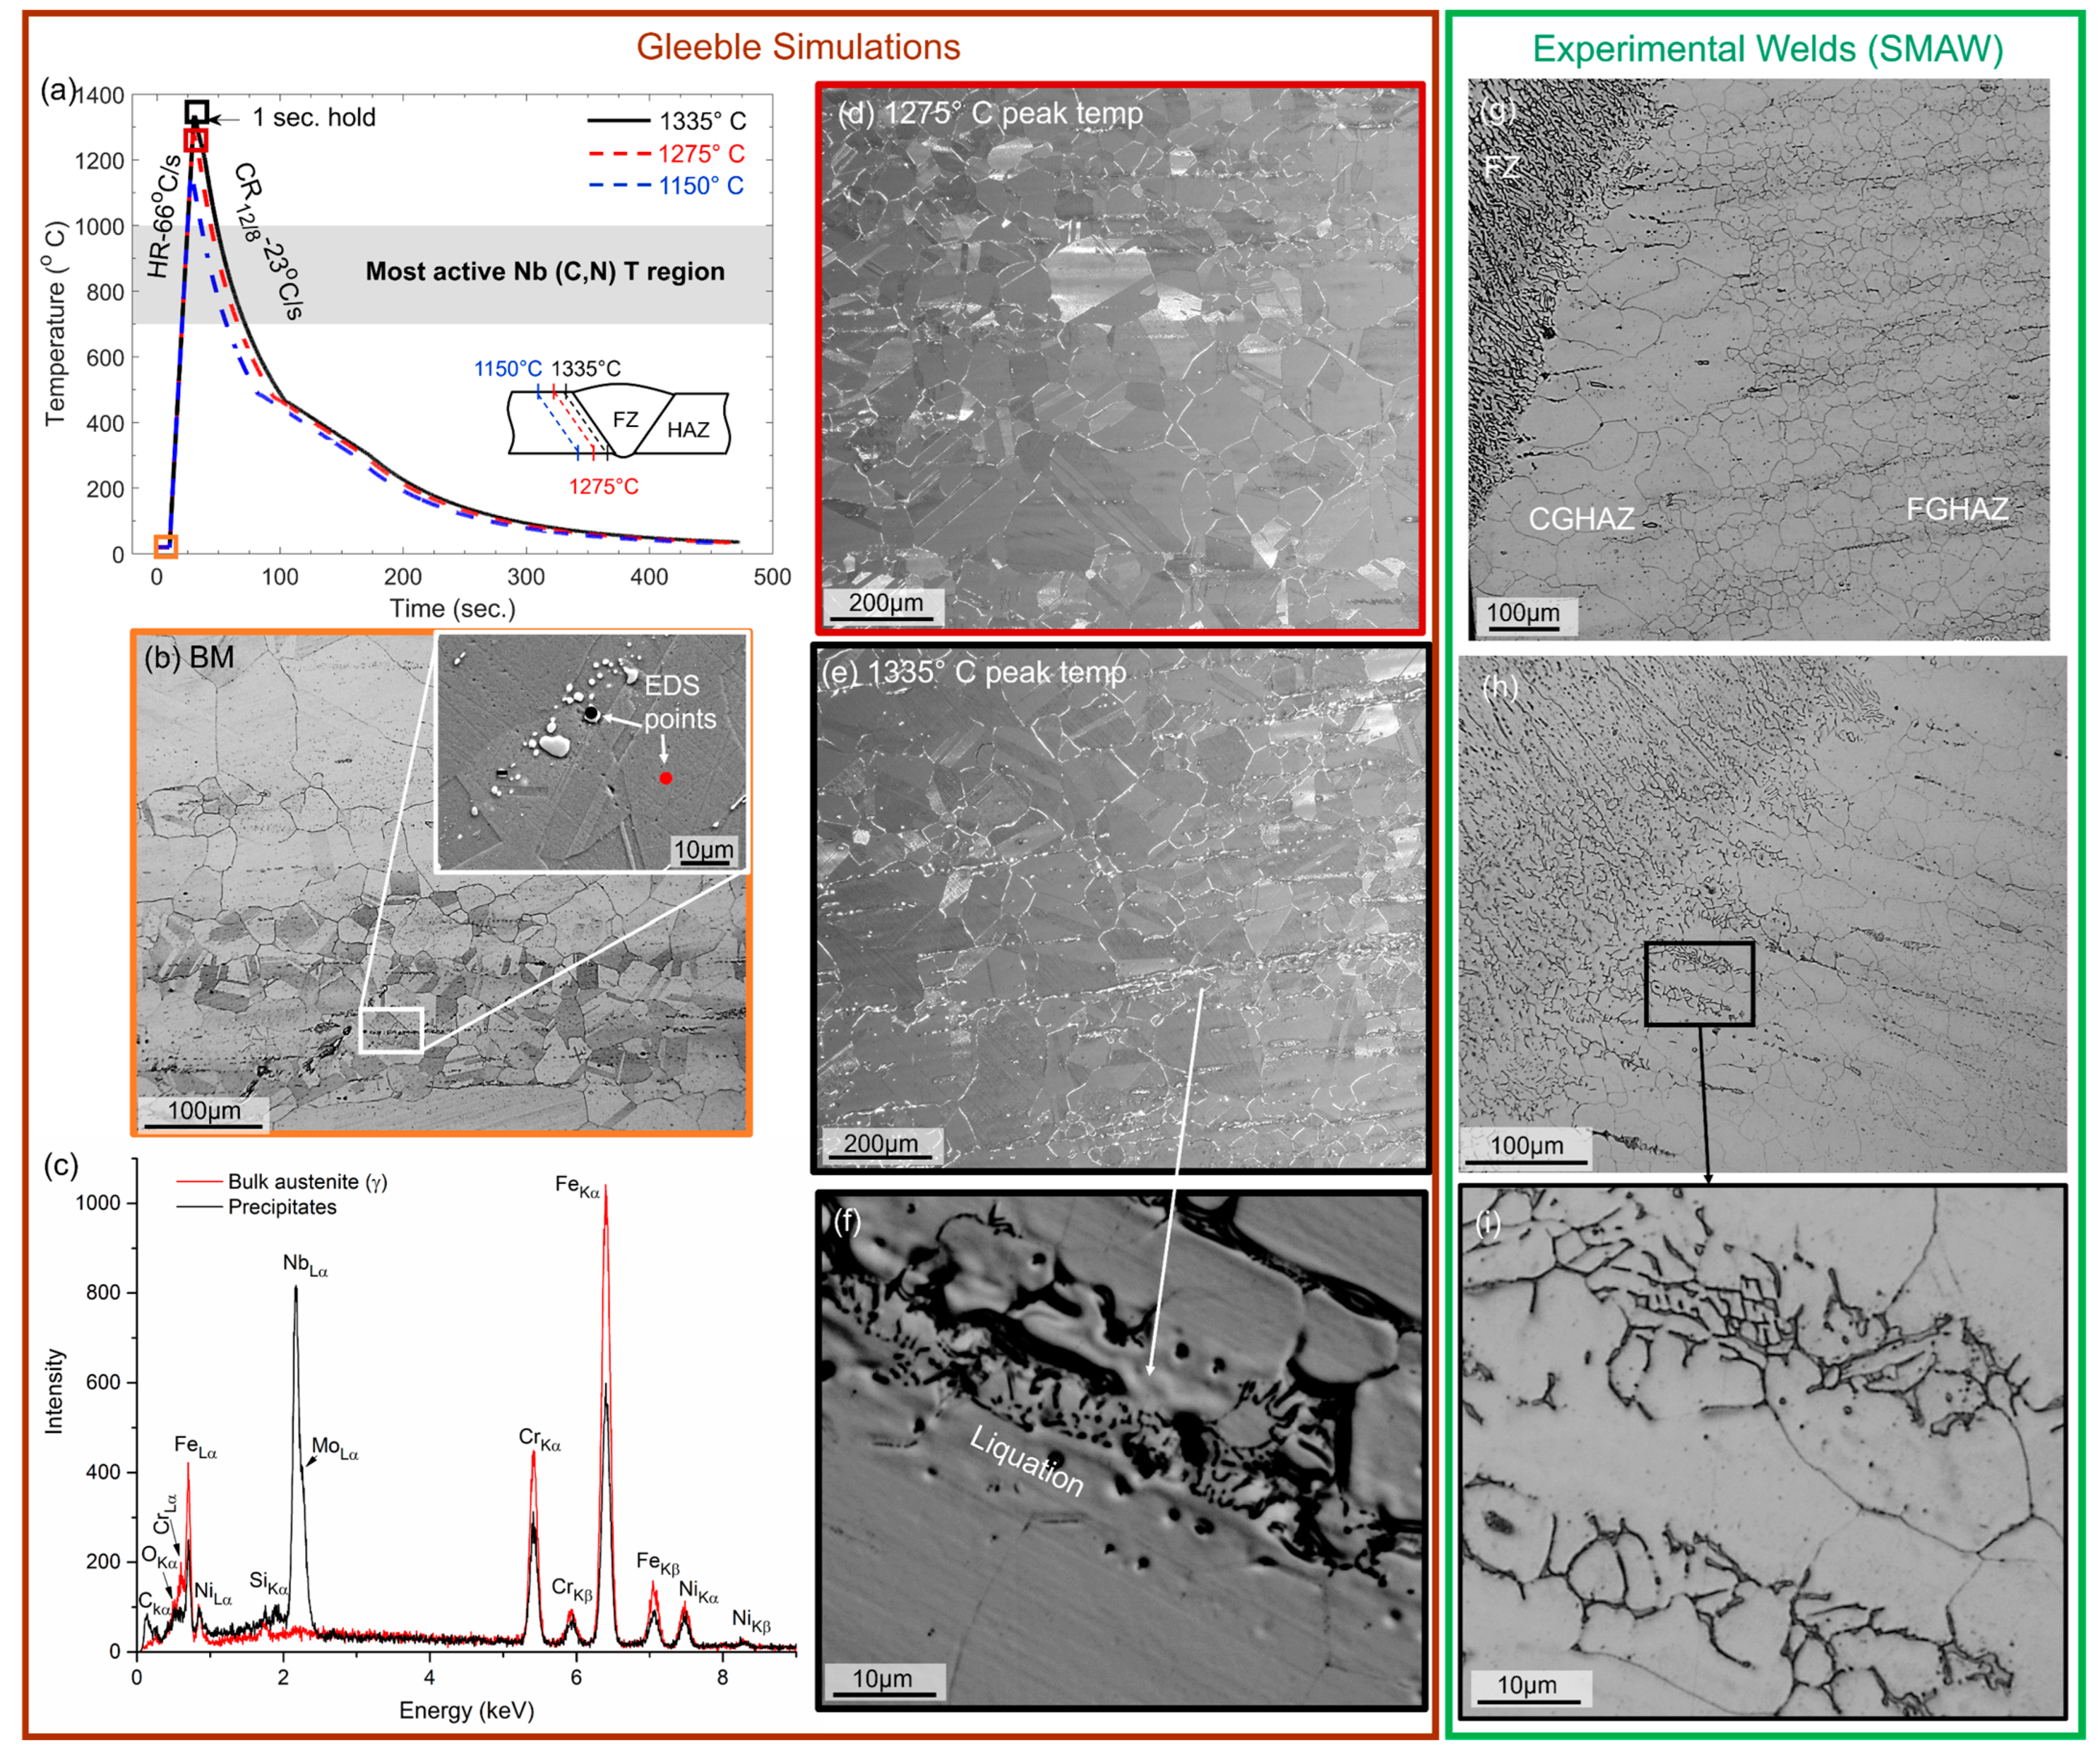
Three unique thermal cycles with varying peak temperatures of 1335, 1275, and 1150 °C are physically simulated in the first SRC test step, as illustrated in Figure 2a, to generate three subzone microstructures in HAZ, i.e., a partially melted zone (PMZ), coarse-grained HAZ (CGHAZ) and fine-grained HAZ (FGHAZ), respectively. Note that after completion of the HAZ thermal cycle, the 1335 °C peak temperature HAZ is thoroughly evaluated for SRC at all test temperatures between 750 and 1050 °C. For other duplicated HAZ microstructures (1150 and 1275 °C peak temperature), SRC test is performed at 850 and 900 °C temperatures, which encompasses the most active nucleation and growth rates for niobium carbonitrides (Nb (C, N)) that promote and accelerate SRC.
Microstructures before and after physically simulated thermal cycles are shown in Figure 2b–f. First, the microstructure of the as-received wrought condition is shown using LOM (at a low magnification) and SEI-SEM (at a high magnification) in Figure 2b. The as-received wrought hot-rolled annealed microstructure in mid-thickness of 15.9 mm thick plate exhibits a bimodal grain size distribution with fine grains at an average size of 27 µm (ranging from 21 to 38 µm) and coarse grains at an average of 63 µm (45–100 µm). It should be noted that the finer grained regions contain spherical secondary precipitates with 1–5 µm in diameter. Comparison of the EDS point scans of the secondary precipitates (marked by the black dot in Figure 2b SEM image) and bulk γ-austenite (marked by the red dot in Figure 2b SEM image), indicates the presence of Nb/Mo-rich precipitates in the as-received microstructure, as seen in Figure 2c.
Grain growth occurs non-isothermally within the short time at elevated temperatures during the weld HAZ thermal cycle. Figure 2d,e show LOM images after the 1275 °C (HAZ 2) and 1335 °C (HAZ 1) thermal cycles, respectively. The 1275 °C peak temperature thermal cycle has an average grain diameter of 94 µm (ranging 59–185 µm), and 1335 °C peak temperature thermal cycle has an average grain diameter of 121 µm (ranging 91–152 µm). A study on grain growth after hot forging shows that temperatures 1170 °C and below introduced no significant grain growth due to the Nb (C, N) pinning effect, while abnormal grain growth could be observed around 1200–1270 °C due to incomplete dissolution of Nb (C, N) at those temperatures [46]. Generally, coarser grain size microstructures have been claimed to increase SRC susceptibility [13,15], and thus the 1275 and 1335 °C peak temperature HAZ microstructures are expected to be more susceptible to SRC in 347H SS than the 1150 °C microstructure.
Furthermore, the HAZ 1 microstructure appears to develop a network of eutectic phases, as represented by the darker features in LOM in Figure 2f. The HAZ 1 microstructure is representative of PMZ between the CGHAZ and FZ boundary, similarly, seen in experimental welds in Figure 2g–i, where constitutional liquation occurs and a eutectic microstructure forms [3]. EDS analysis of the eutectic microstructure can be found in our previous publication [47], which identified a mixture of austenite and Nb-rich phases, likely Nb (C, N) or Laves phase (Fe2Nb). Similar eutectic microstructural features have been reported in other studies [3,6,11] as well. Constitutional liquation in the HAZ can be empirically evaluated as a function of 1/2Nb/(30C + 50N) in wt.%, known as the Cullen and Freeman parameter [6]. A Cullen and Freeman parameter of 0.1, using this study’s chemical composition, predicts a liquation temperature to be approximately 1335–1340 °C [6]. Another experimental study using a similar experimental chemical composition, but with more S content, exhibited a liquation temperature of 1290 °C [3]. In comparison, the 1275 °C HAZ (HAZ 2) microstructure does not exhibit extensive constitutional liquation, as demonstrated by a representative micrograph in Figure 2d.
3.2. Effect of Temperature and Pre-Strain/Stress on SRC Behavior
Table 3 summarizes the Gleeble® SRC test results as a function of the HAZ peak temperature in step one, including the initially applied strain/stress (i.e., pre-strain/stress) in step two, starting stress at isothermal holding temperature (i.e., at the beginning of step four after partial stress relief from step three), bulk strain (%) evolved at isothermal temperature holding during step four, failure condition, and time-to-failure or time to cool down if no failure occurs. The starting stress at the isothermal holding temperature, bulk strain, failure condition and time-to-failure are output results as shaded in Table 3. The failure behavior is categorized with the following three conditions: (1) failure during isothermal holding, (2) failure during cooling due to thermal shrinkage while restrained and (3) no failure during the SRC test. Overall, test results implicate stress and strain thresholds for cracking that are dependent on both temperature and initial residual stress/pre-strain.
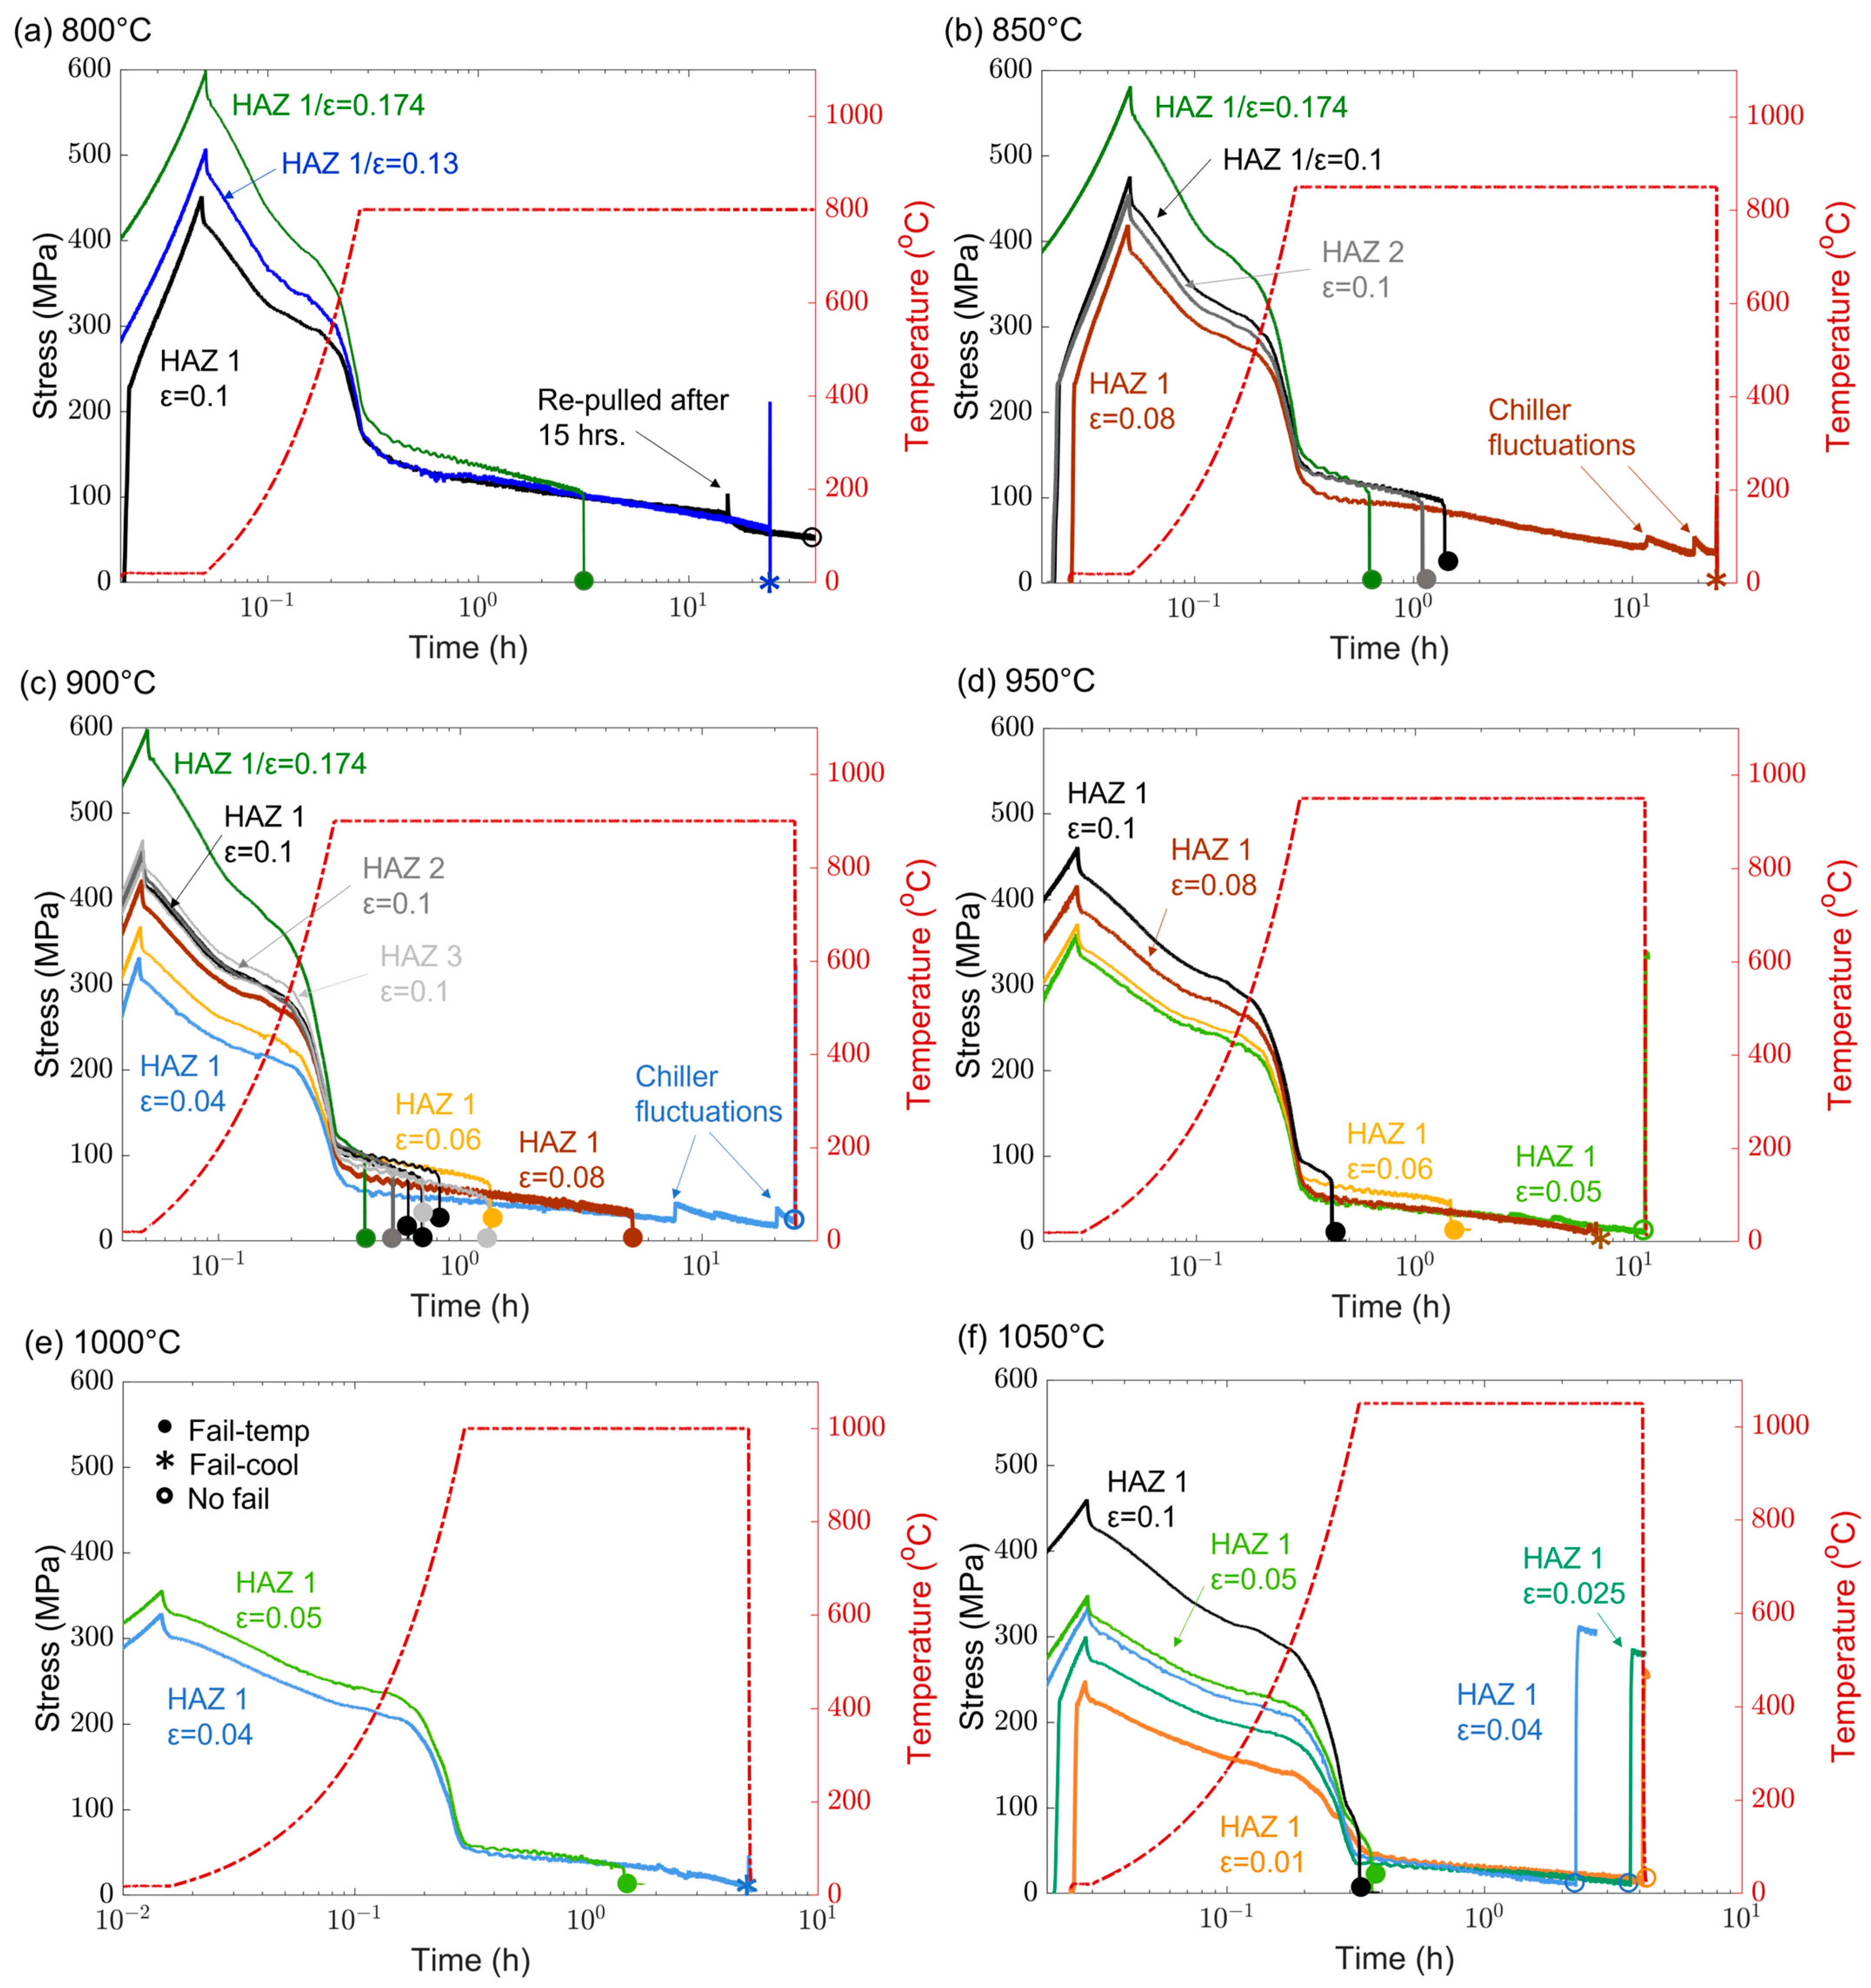
Figure 3 displays the stress versus time plots for tests at 800 °C to 1050 °C. A higher initial pre-strain/stress generally leads to a higher starting stress upon reaching the test temperature. Also, increasing the test temperature generally leads to a lower starting stress when reaching isothermal test temperatures. At each temperature, increasing pre-strain leads to a shorter time to fracture, evidenced by a sudden stress drop to 0 MPa during isothermal stage, i.e., step four. No failure samples show a stress increase upon cooling since the stroke is constrained during contraction as illustrated in the case of 0.04 pre-strain at 900 °C, 0.05 pre-strain at 950 °C, 0.04 pre-strain and below for 1050 °C. Failure on cooling curves firstly show a stress increase associated with cooling, followed by a sudden stress drop when failure occurs.
Time-to-failure map, beginning with isothermal hold time at step 4, is summarized in Figure 4. Increasing pre-strain generally results in faster times to failure for all temperatures as represented by the blue arrow in Figure 4. The trend can be explained by a higher dislocation density associated with a higher pre-strain, which facilitates faster reprecipitation before stress can be sufficiently relieved, leading to a faster SRC failure. However, exceptions exist, primarily with 0.06 pre-strain at 900 and 950 °C test temperature for 1335 °C HAZ, where 0.06 pre-strain failed at faster times than the 0.08 pre-strain. Inconsistencies in extent of stress relief during reheating to temperature may be the main reason contributing to this exception, where the 0.06 pre-strain samples are observed to exhibit higher stresses upon reaching isothermal test temperature. The starting stress upon reaching isothermal temperature in step four correlates with higher bulk strain at temperature, as shown in Table 3, which may explain the reason for faster time to fracture with 0.06 pre-strain samples compared to 0.08 pre-strain samples.
With respect to the various physically simulated HAZ peak temperatures using the 0.1 initial pre-strain condition, the 1275 °C HAZ specimens (HAZ 2) failed slightly sooner than the 1335 °C HAZ specimens (HAZ 1) at 900 and 850 °C SRC reheat temperatures, while 1150 °C HAZ specimens (HAZ 3) failed at slightly later times on average at 900 °C. Hence, HAZ 2 may be slightly more susceptible than HAZ 1 and finer-grain HAZ 3. The map shows that the time-to-failure, i.e., SRC susceptibility, is more strongly dependent on the pre-strain/stress and starting stress at reheat temperature. Note that the pre-stress/strain conditions are designed to simulate the weld-induced residual stress/strain conditions determined from the author’s previous work [37]. Additionally, recent experimental residual stress measurements on 347H SS welds show similar peak residual stress values as pre-stress conditions (~600 MPa) in as welded and after thermally aging at 650 °C for 360 h (~300 MPa) [48,49], indicating relevance for the chosen experimental pre-stress values in Gleeble® experiments. The observed high SRC susceptibility and fast failure time (e.g., less than 1h) at high reheat temperatures suggests careful PWHT parameter design, e.g., a slow heating rate or potentially the use of a multi-step PWHT process [29], to prevent SRC during PWHT in the 347H SS HAZ.
3.3. FE Analysis of Individual Strain Components in SRC Tests
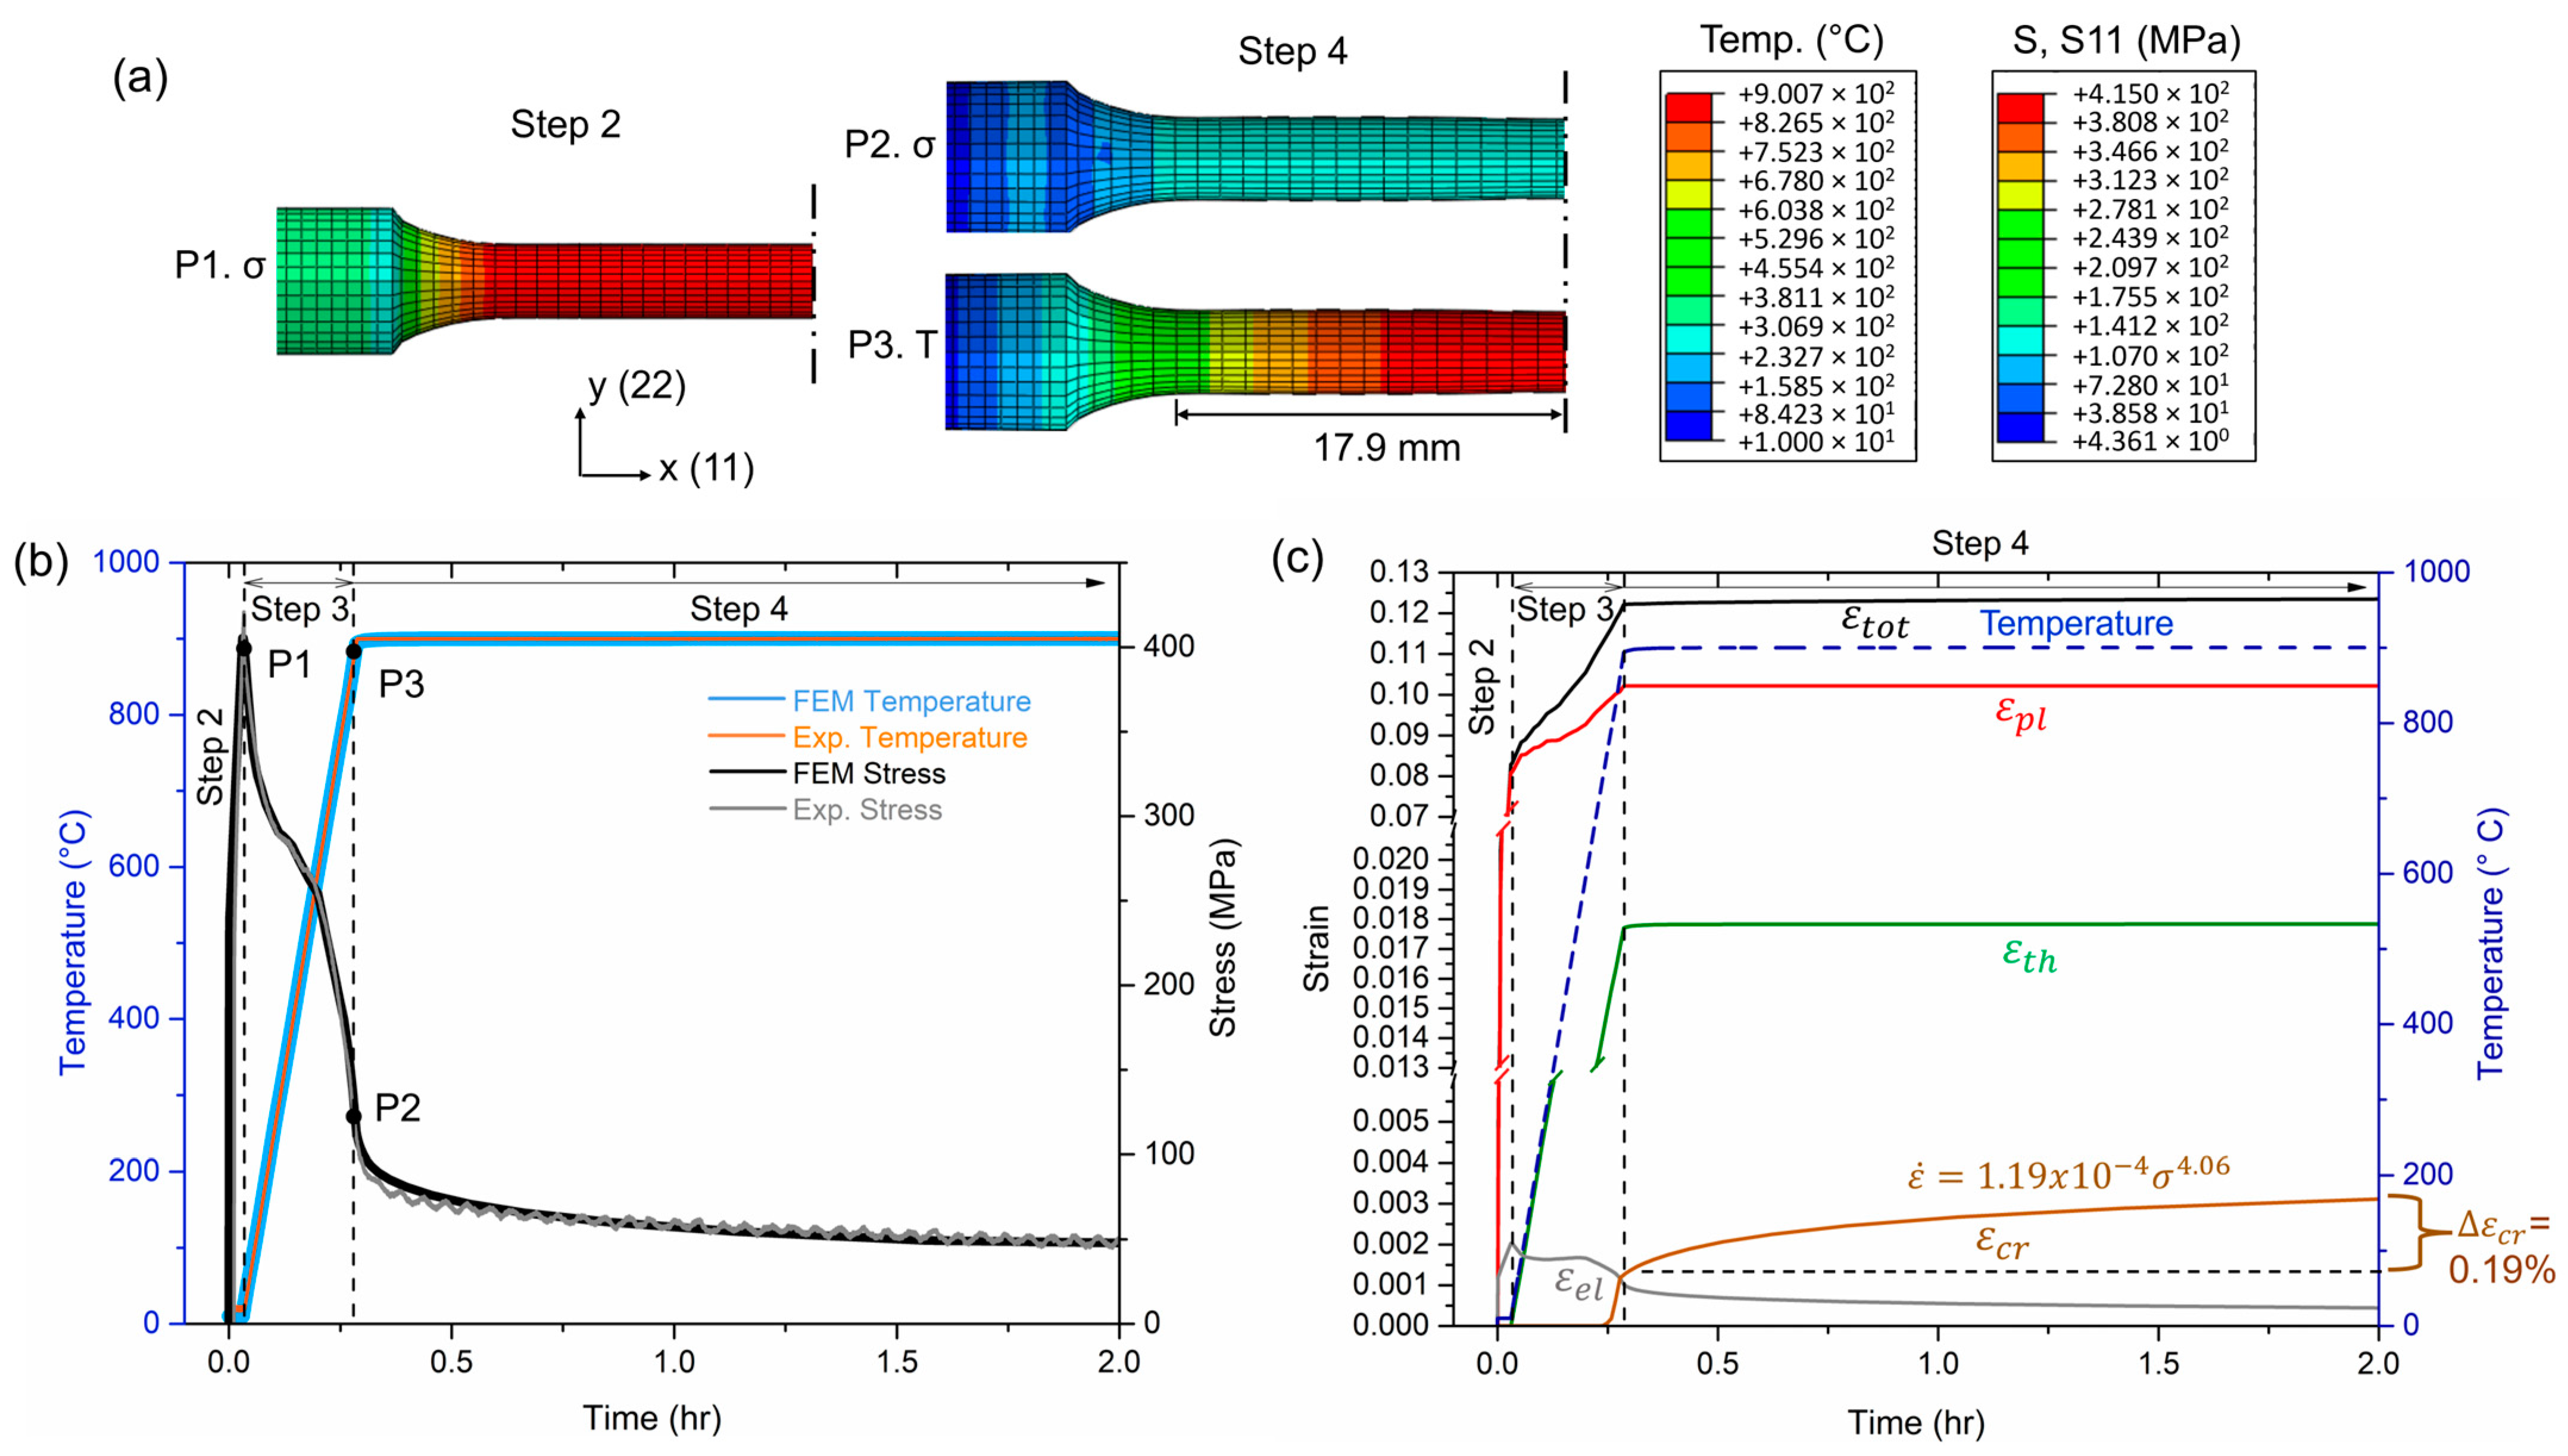
As mentioned above, finite element analysis of the Gleeble® SRC tests is performed to determine the detailed stress and strain evolution history and thus assists in analyzing the SRC susceptibility map in more depth. Figure 5a illustrates the FE simulation results of the initially applied stress profile at room temperature (step two) and stress and temperature profiles upon reaching the holding temperature (start of step four) within half of the gauge section length of the Gleeble® specimen during a SRC experiment at 900 °C with an initially applied 0.08 plastic pre-strain. As shown in Figure 5b, the temperature profiles calculated from the FE model and experimental measurement by thermocouples show a good agreement. The stress evolution within the center of the gauge section predicted by the model also shows reasonable agreement with the experimental measurement. Other simulations with 0.05–0.1 initial pre-strain and 950–1050 °C reheat temperature show similar stress relaxation validation with the experimental data, which are important for verifying the material database of 347H SS used in other models [37]. One assumption made in this model is that the whole gauge section has the same mechanical and material properties rather than in the experiment, where the properties may change along the gauge section depending on step one HAZ thermal cycle temperature gradient introduced by resistance heating in Gleeble® setup. However, experimental samples all fail on or within a few mm of the gauge section center since strain and stress is preferentially accumulated into the hottest region of the Gleeble® specimen, which minimizes the impact of this assumption.
Figure 5c illustrates individual extraction of plastic strain (), thermal strain (), creep strain (), and elastic strain () out of the total strain () for steps 2–4. The thermal strain developing from heating stage in step three during heating from RT to 900 °C comes from thermal expansion. Correspondingly, the experimental methodology includes an applied linear displacement in displacement control mode in step three to offset the thermal strain impact on stress relief. In other words, an additional mechanical plastic strain of 0.02 is intentionally introduced during step three, as evidenced by the increase in from 0.08 to 0.10 in Figure 5c, to offset the impact of 0.018 thermal strain on stress relief. No additional thermal and plastic strains develop in step four. The FE calculation reveals a continuous increase in creep strain accompanied by a decrease in elastic strain at step four during stress relaxation. The creep strain calculated from the FE model during the isothermal hold is 0.19%, while the plastic strain increases by 0.014% and elastic strain decreases by 0.056%. Therefore, creep strain contributes the most to the observed strain change during the holding stage at step four. Note that the experimental bulk strain at step four is calculated to be 0.24% by the C-gauge dilatometry method at the center of the specimens. The individual strain components calculated from the FE SRC test models provide additional analytical components, including individual strain components not measurable from the experiment, that contribute to a more thorough and accurate SRC susceptibility analysis.
3.4. Analysis of SRC Susceptibility Maps
Figure 6a illustrates the SRC failure conditions (i.e., susceptibility map) as a function of FEM calibrated pre-strain prior to step four (referred as plastic strain hereafter) and temperature. The calibration considers the additional plastic strain that occurred in step three for each test temperature, as illustrated in Figure 5c, into the plastic strains in Figure 6a. Linear fits are applied to separate samples that failed at the temperature from the samples that did not fail, and the region below is designated as low susceptibility. The fitted trends indicate that the critical plastic strain to failure decreases from 0.15 at 800 °C to 0.06 at 900 °C, and temperatures between 900 and 1050 °C maintained a consistent critical plastic strain value of ~0.06. Note that the critical plastic strain as a function of temperature accounts for both pre-applied strain at RT and plastic strain applied during heating and prior to reaching the test temperature. Overall, a drastic decrease in critical plastic strain occurs from 800 °C to 900 °C test temperature, and beyond 900 °C the critical plastic strain to fracture remains relatively unchanged.
The Larson–Miller parameter (LMP) is often used to depict the rupture life of a specimen at a given stress level that varies with test temperature [50]. In this analysis, the SRC susceptibility map of LMP vs. plastic strain is plotted in Figure 6b. The LMP can be written in Equation (5) as:
where T is temperature in Kelvin, C is LMP constant (assuming C = 20 [51]), and t is time in hours (h). Overall, the plastic strain to failure decreases with an increasing LMP, where samples with plastic strains below 0.06 did not fracture. The amount of strain development influences the strain aging behavior of the microstructure, such that increasing plastic strain increases the nucleation rate of niobium carbonitrides and facilitate increased intragranular strengthening [52], allowing intergranular precipitate-free zones to be a location for localized deformation along with coarse incoherent grain boundary precipitates potentially contributing to void formation [9].
Figure 6c shows the SRC map of pre-applied stress in step one (i.e., pre-stress) and starting stress upon reaching the test temperature in step four (i.e., starting stress @T) as a function of the test temperature. The threshold prestress and starting stress at the temperature can be represented by non-linear fits of the samples that did not fail at the temperature, which outlines the lower susceptibility regions. The pre-stress thresholds decrease from about 500 to 330 MPa as the testing temperature increases from 800 to 1050 °C. The critical starting stress at temperature changes from ~180 MPa at 800 °C to ~75 MPa at 950 °C and ~50 MPa at 1050 °C. With increasing temperature, there is a lower tolerance for threshold stress to failure. Figure 6a,c together serves as the SRC susceptibility maps that determine the plastic strain and stress thresholds as a function of temperature below which low susceptibility to cracking is expected. Additionally, the prestress and starting stress at T as a function of LMP is plotted in Figure 6d. The fitting lines (blue and red dotted lines in Figure 6d) for failed specimens show a general increase in LMP with decreasing stress, except one sample tested at 1050 °C. The 1050 °C test with 0.1 pre-applied strain (0.12 calibrated pre-strain) exhibits very short time to failure (t = 3 s) and the time to failure lies outside the general trend. Note that the 1050 °C test with 0.05 pre-applied strain also failed shortly at 2.4 min, although the result align well with the general trend. Such observations suggest that reheating 347H SS HAZ to 1050 °C (e.g., during PWHT or multipass welding) could lead to rapid fracture under a tensile residual stress as low as 50 MPa, and therefore prolonged exposure to this temperature range should be carefully avoided during design of PWHT procedure for 347H HAZ microstructure.
Figure 7a illustrates the sensitivity of creep strain to fracture as a function of the calibrated pre-applied plastic strain (prior to step four). In this study, the strain measurement from c-gauge during step four of the SRC test is referred to as bulk creep strain. Note that FE analysis confirms creep is the main strain component during step four. The experimental creep strain in Figure 7 is determined based on diametral strains, which includes mostly an increase in creep strain, minor plastic strain increase, and slight decrease in elastic strain as seen in Figure 5c. This SRC susceptibility map aims to serve as a guideline for in situ monitoring of total strain evolution using strain gauges during service to determine whether a threshold bulk strain level has been reached. A Boltzmann power law fit is applied to the fractured samples, which reveals a sharp decrease and flatline in creep strain to fracture as plastic strain increases above 0.1. It indicates creep strain tolerance to cracking is very low once the plastic strains exceed 0.1. Figure 7b shows the relationship between average bulk creep strain rates (%/h) and test temperature. The average creep rate monotonically increases with increasing test temperature and with increasing starting stresses at temperature.
Activation of different creep mechanisms could explain the trend observed in Figure 7. Strain recovery (improvement in ductility) is delayed due to competing mechanisms of dislocation recovery and strain aging when testing at prime Nb (C, N) aging temperatures, as evidenced by the low creep rates observed at 800–900 °C conditions. Re-precipitation upon heating to temperature limits dislocation creep, allowing for Coble creep (grain boundary diffusion) and grain boundary sliding to dominate. Higher creep rates at temperatures above 900 °C are likely evidence of thermal activation of dislocation or Nabarro–Herring (lattice diffusion-based) creep where creep parameter, n, approaches 1, while Coble creep is predicted to occur mostly during lower temperature tests (750–900 °C) based on creep deformation maps of 316 SS [53]. For example, 1050 °C tests with a homologous temperature of ~0.8 (T/Tm-melting temperature) and the highest creep strain rates likely consist of Nabarro–Herring creep with experimental n of 1.46.
SRC tests indicating no failure still experience formation of micro-sized cracks or voids along grain boundaries normal to loading directions, as demonstrated by metallurgical characterization of 800, 950, and 1050 °C test specimens in Figure 8. Linked micro voids are observed in Figure 8a, which develop into microcracks over time at the test temperature. Intergranular cavities have been observed elsewhere at lower temperatures ranging from 550 to 750 °C [54,55]. Microcracks are present in the center of the radial cross section of 800 and 950 °C test specimens in Figure 8a,b, and intergranular surface cracks are seen in 1050 °C test specimens in Figure 8c. While creep mechanisms depend on homologous temperature and stress ranges, intergranular cracking appears to be temperature independent with the elevated temperature stress range applied in this study.
3.5. Susceptible Microstructural Features
Fractography is conducted to verify cracking mechanisms associated with SRC. The fracture surfaces of failed specimens examined on the macro level exhibit many similarities as shown in Figure 9b,c, such as brittle intergranular fracture, with micro-voids observed at high magnification on the grain boundaries, as seen in our previous publication [47]. A cross sectional view along the tensile axis of the sample shows secondary cracks preceding the primary fracture surface in Figure 9e–h. Figure 9f,g reveals wedge or w-type cracks in the 0.194 pre-strain specimen. Wedge cracks are indicative of grain boundary sliding, a common creep mechanism leading to intergranular failure [39]. Cracks initiate primarily normal to the applied stress direction, while a combination of local shear and normal stresses contributes to wedge cracks, depending on grain boundary orientation with respect to applied tensile stress.
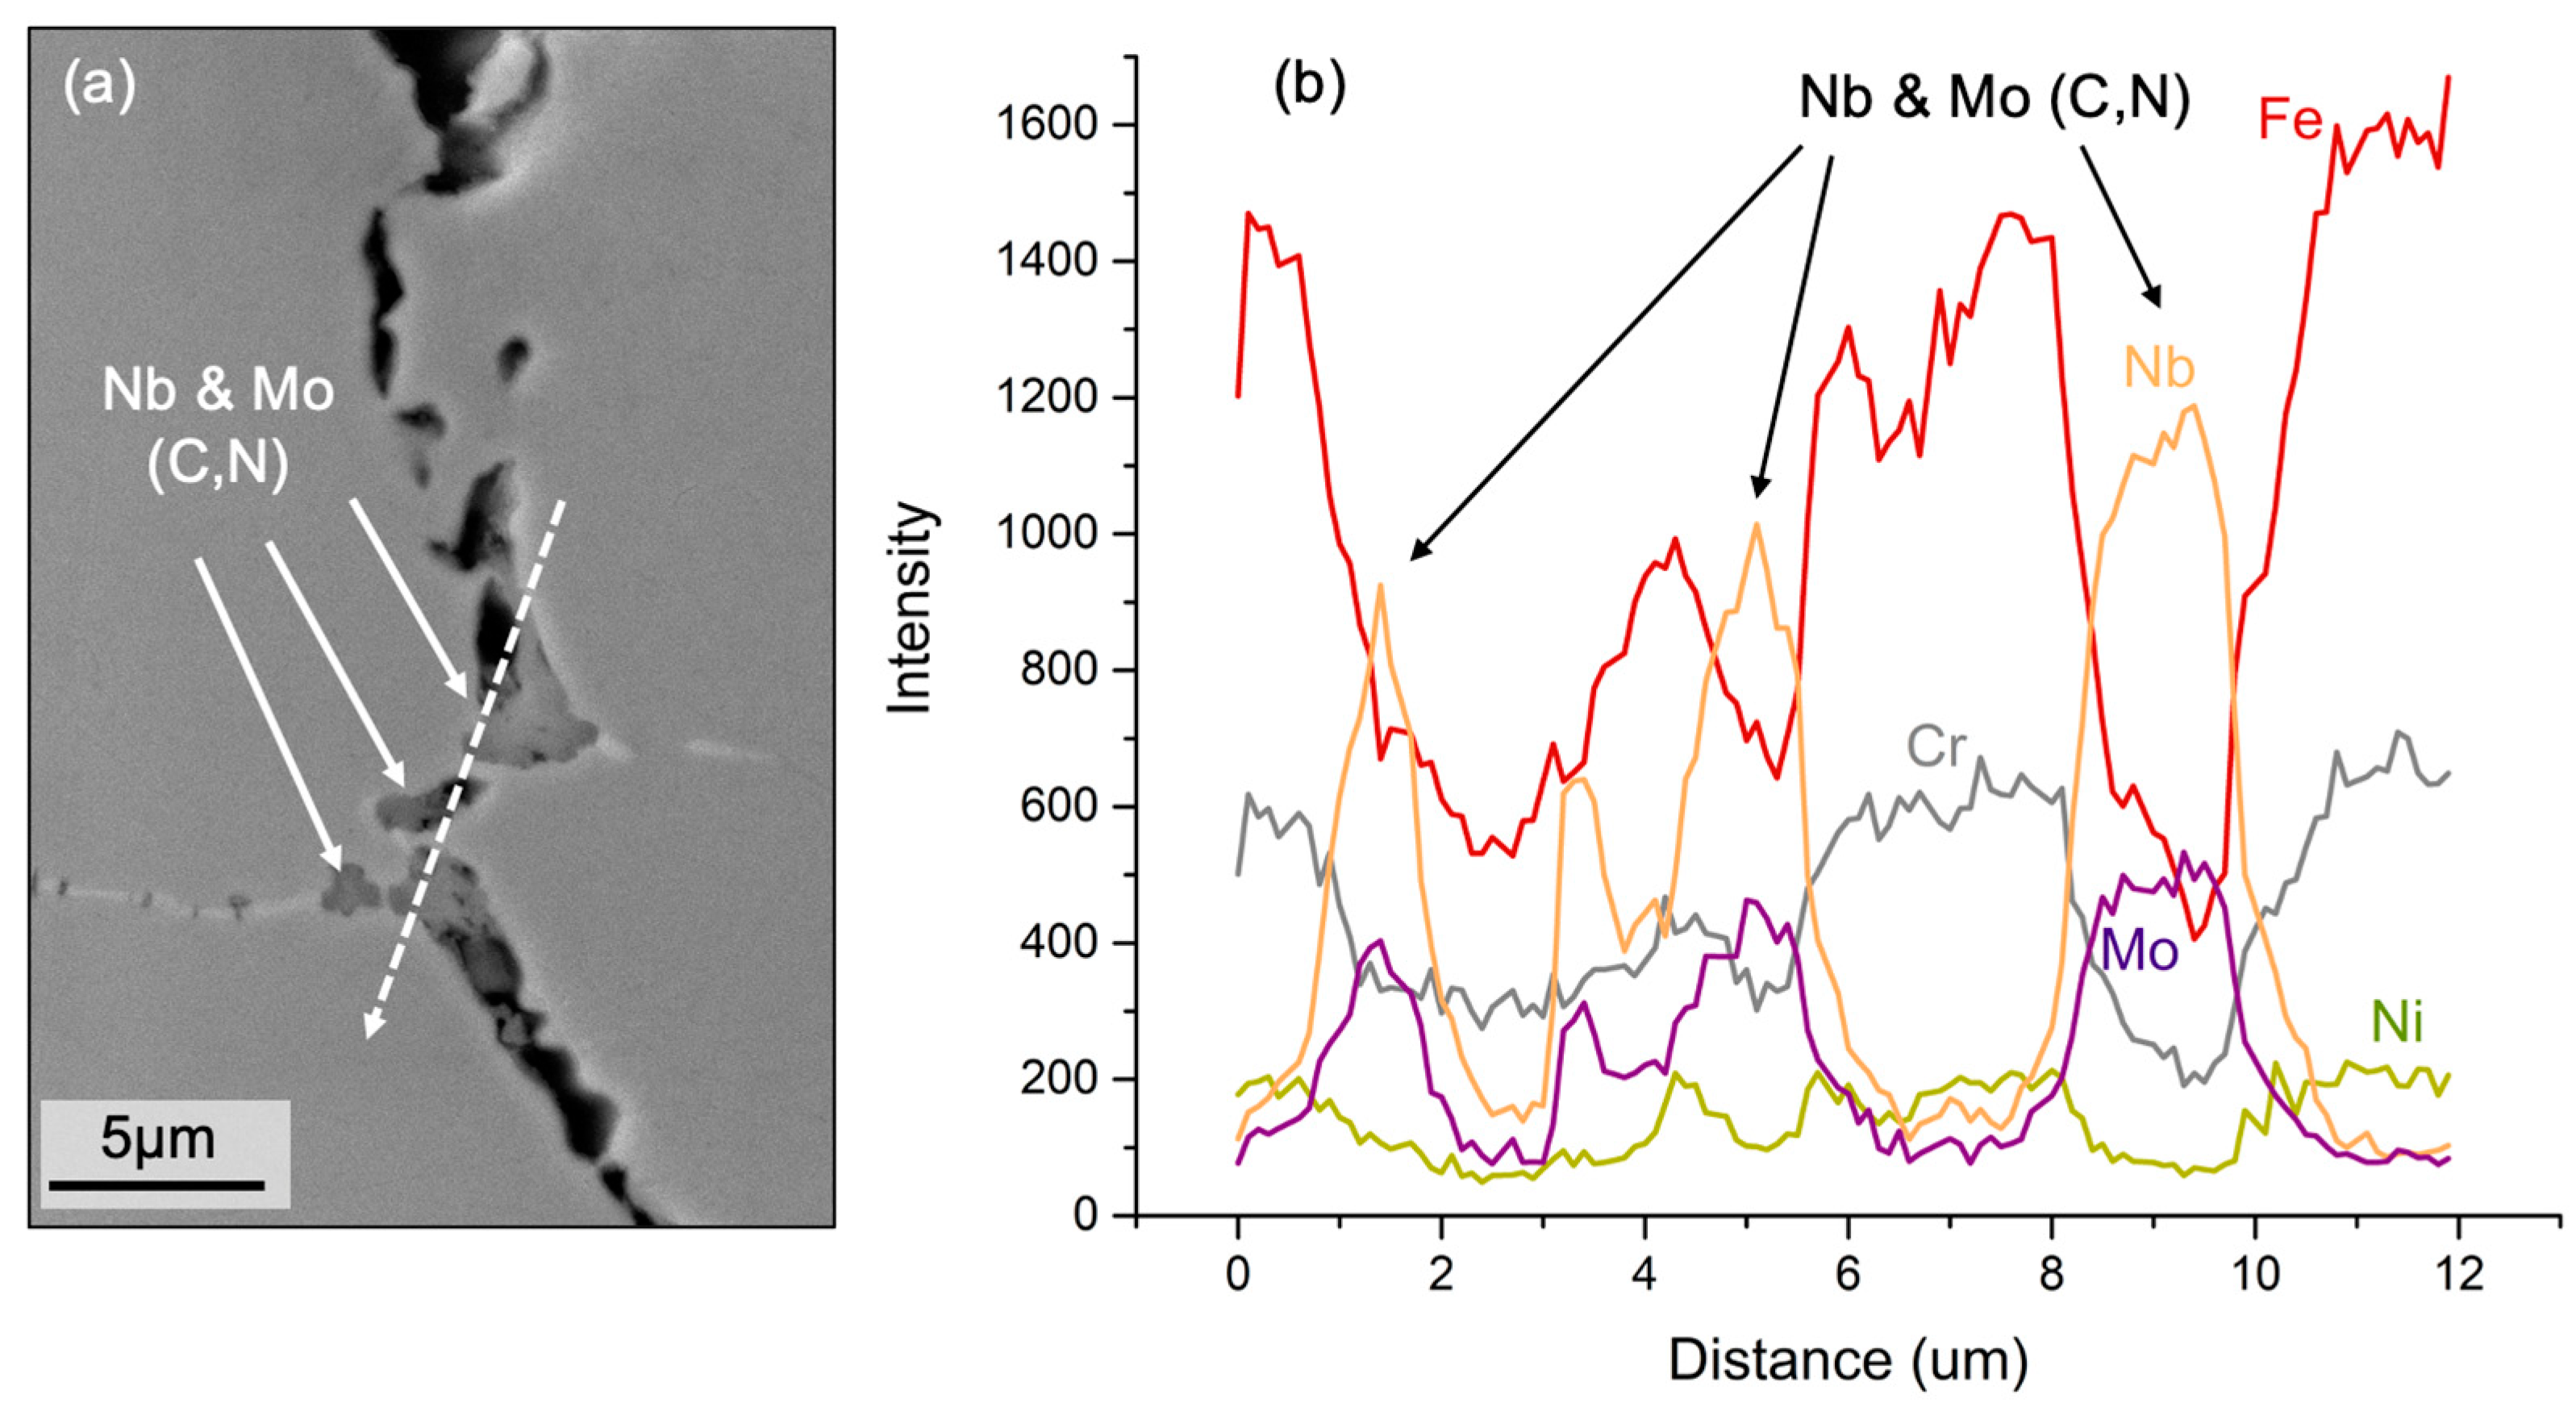
Further metallurgical analysis is performed to characterize grain boundary phases and elemental segregation post-mortem. Secondary cracks behind the primary fracture surfaces show presence of grain boundary precipitates and secondary phases, as demonstrated in 900 °C and 800 °C specimens with the highest strain conditions in Figure 10 and Figure 11, respectively. Figure 10 shows EDS maps with Cr, Fe, Nb and Mo enrichment along grain boundaries. The EDS line in Figure 11 verifies an increase in Nb and Mo and depression in Fe, Cr, and Ni within the grain boundary precipitates that are likely Nb and Mo carbonitrides. Cr and Fe partitioning in Figure 10 implicates possible δ-ferrite or sigma phase formation in addition to Nb and Mo carbonitrides. Most grain boundary Nb and Mo precipitates exist in fine-grained regions of each sample. Based on thermodynamic predictions, Nb (ferrite stabilizer) can segregate from δ-ferrite, which facilitates nucleation of Nb, Mo carbonitrides likely during cooling from the 1335 °C weld HAZ thermal cycle. δ-ferrite stringers (rich in Nb and Mo) exist in wrought microstructure prior to HAZ thermal cycle. Grain boundaries with coarse, incoherent Nb, Mo (C, N) precipitates may have high interfacial surface energy and contribute to grain boundary decohesion while under stress and could have the appearance of creep voids [11]. The presence of microcracks seen on high magnification fracture surfaces and cross sections likely develop from dis-bonding between the incoherent interface between Nb, Mo rich carbonitrides and γ-austenite when under stress in combination with a precipitation-hardened grain interior.
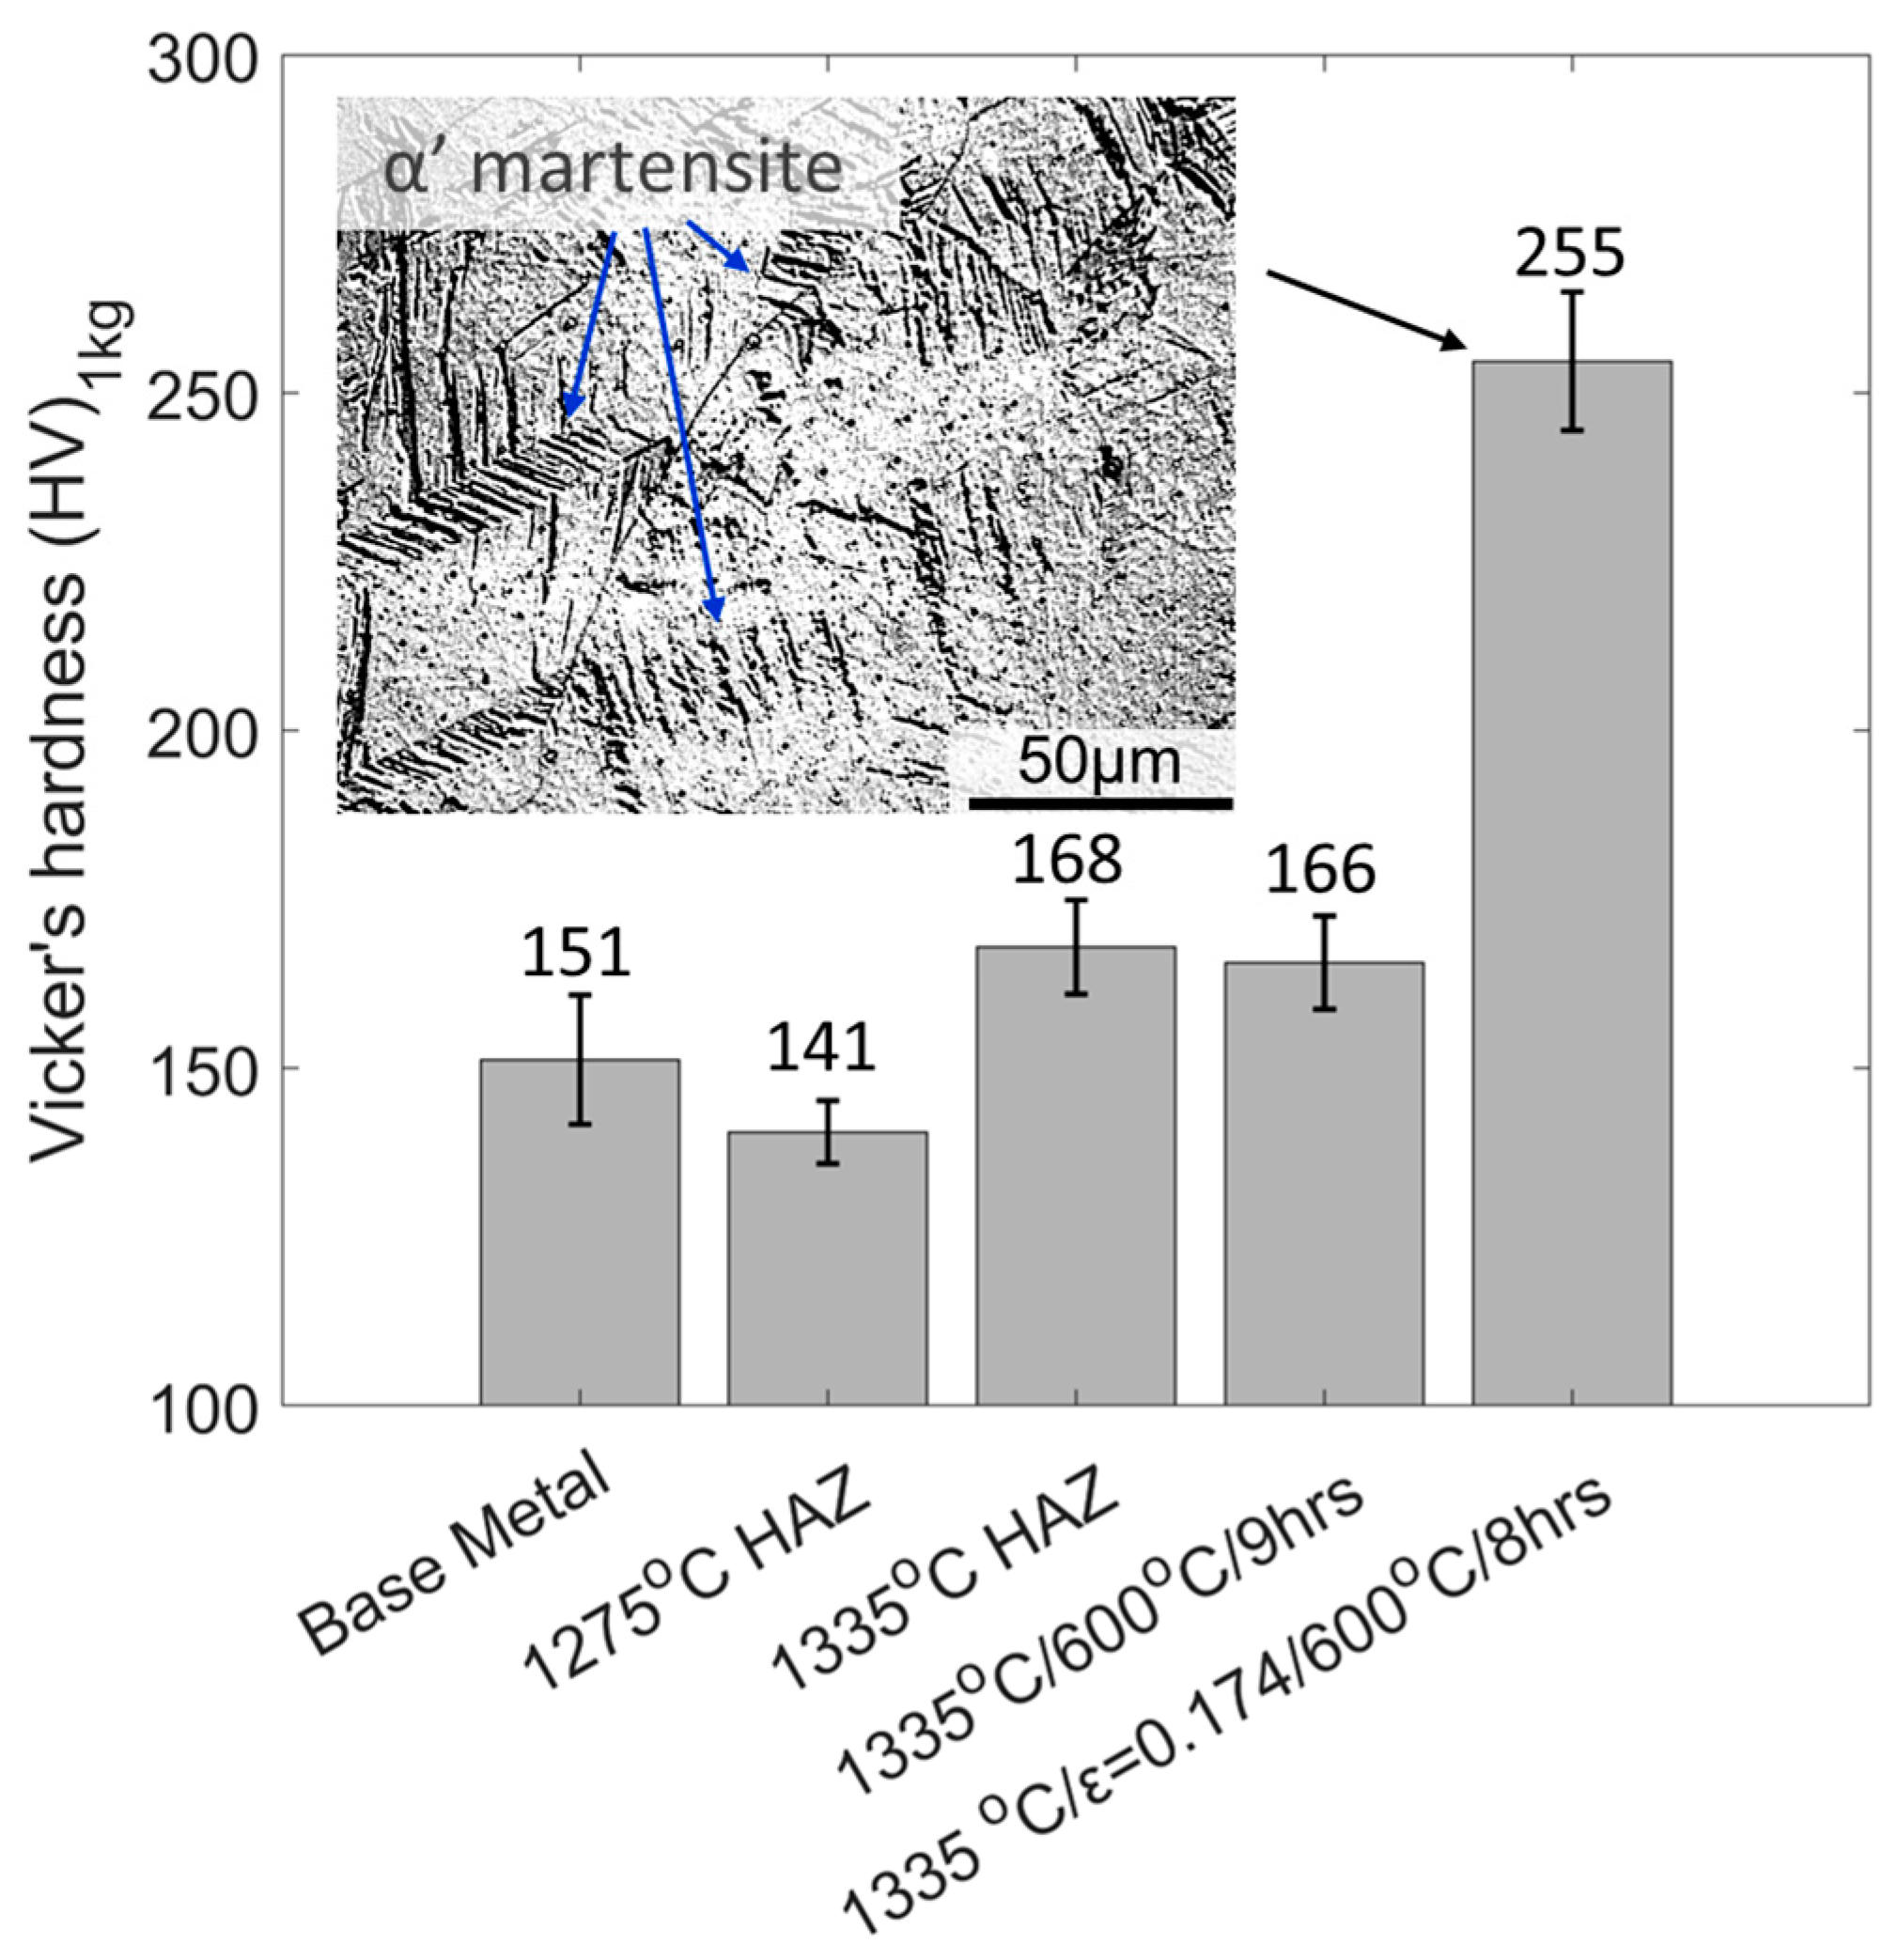
The microhardness of HAZ microstructures is performed to identify the correlation between hardness and SRC susceptibility, including the impact of cold work strains and strain aging via elevated temperature service environment (e.g., 600 °C). Figure 12 summarizes the microhardness average for five conditions: 347H SS base metal, after 1275 °C HAZ thermal cycle, after 1335 °C HAZ thermal cycle, after 1335 °C HAZ thermal cycle and 600 °C age for 9 h with no plastic strain, and after 1335 °C HAZ thermal cycle with 0.174 strain and 600 °C age for 8 h. The base metal exhibits an average microhardness of 151 HV. The 1275 °C coarse-grained HAZ (HAZ 2) microstructure exhibited a lower hardness of 141 HV, which may be due to grain coarsening and precipitate coarsening of precipitates that have not dissolved. Microhardness increases slightly with an average of 168 HV after the 1335 °C thermal cycle (HAZ 1), which could be partially due to Nb-rich eutectic phases or Laves phase as shown in Figure 2 and similar work elsewhere [47]. Additionally, HAZ 1 generated from a higher peak temperature may dissolve more niobium carbonitride precipitates and allow for re-precipitation of fine NbC particles during cooling.
An increase in average microhardness from 166 to 255 HV is observed when a plastic strain is first applied at room temperature and after aging at 600 °C for eight hours, as seen in the 0.174 strain condition. This behavior may be attributed to increased dislocation density and strain aging and partially the formation of α’ martensite as evidenced by the slip habit planes in optical micrograph in Figure 12. Cold work introduces increased dislocation density, which may promote precipitation of higher volume fractions of fine intragranular Nb (C, N) particles at elevated service temperatures via strain aging. For instance, a study on precipitate strengthening models of NbC and microhardness shows that 5–10% cold working strain followed by aging at 600 °C for various times increases the microhardness above 250 HV [52]. On the other hand, the mechanism describing γ-austenite to α’ martensite transformation at high plastic strains in austenitic stainless steels is known as transformation-induced plasticity (TRIP) [56]. For example, α’ martensite is reported in the HAZ failure region of a two-pass 347H SS pipe weld due to severe deformation after 150 days of service at 595 °C [57]. Reversion of body-centered-tetragonal (BCT) α’ martensite (or body-center-cubic (BCC) δ-ferrite) to face-center-cubic (FCC) γ-austenite upon reheating may induce localized volumetric shrinkage and increase tensile stress that can enhance SRC susceptibility [56,58]. Generally, a correlation between intergranular SRC and microstructures with a microhardness of 250 HV has been observed in the literature [13,14].
Precipitate-free zones (PFZs), a leading hypothesis associated with stress relaxation cracking, consists of strain localization along grain boundaries [9,59]. Intragranular dislocation pileups allow for dense nucleation of fine, intragranular Nb (C, N) inside of the grains and therefore strengthen the grain interior [9,59]. Siefert et al. [26] observed the presence of intergranular PFZ with a width less than 500 nm, fine intragranular Nb (C, N) present within grain interior, and coarse Nb (C, N) and Cr-rich precipitates along the grain boundary using scanning transmission electron microscopy EDS (STEM-EDS). Decohesion between intergranular precipitates and γ grains along PFZs is arguably the main contributing mechanism of intergranular SRC.
4. Conclusions
- Stress relaxation cracking tests, performed using a Gleeble 3500® thermomechanical physical simulator, indicates an increased faster time to fracture with increasing initial stress and plastic strain in a reheat test temperature range of 750–1050 °C.
- Three HAZ subzones are compared for SRC behavior at 900–950 °C with 0.1 initial strain conditions. There does not appear to be a drastic statistical difference between HAZ 1 (PMZ) and 2 (CGHAZ), while HAZ 3 (FGHAZ) appears to be slightly less susceptible to cracking.
- A FE analysis is conducted to replicate the last three steps of the SRC test methodology and delineate various strain components. Additionally, FE analysis assists to calibrate the plastic strain values used in the SRC susceptibility maps. It is found out that an additional 0.02 plastic strain is introduced during step 3 while heating to the isothermal test temperature as a result of the additional stroke applied to compensate for thermal expansion.
- The thresholds of pre-applied stress and plastic strain, and creep strain and rate at testing temperature for SRC are identified. The pre-stress thresholds decrease from about 500 to 330 MPa as the testing temperature increases from 800 to 1050 °C, while the corresponding initial plastic strain thresholds reduces from 0.15 to 0.06. Additionally, stress and strain as a function of LMP is shown to correlate fracture time, temperature, and stress/strain relationships. 1050 °C seems to be a concerning PWHT temperature for high stress/strain conditions in the HAZ. These results may serve as guidelines for mitigation of SRC in the 347H HAZ microstructure in service and design of PWHT parameters to avoid SRC occurring during stress relief.
- Hardness measurement and fractography analysis indicates that the strain aging of niobium carbonitrides and other potential phases in conjunction with intergranular precipitates contributes to an increase in microhardness and increased intergranular cracking susceptibility. A more extensive metallurgical characterization (such as TEM dark field imaging) of the secondary cracks behind the primary fracture surfaces would be needed in future to establish a more thorough understanding of the susceptible microstructure features and verification of the SRC mechanisms, namely the characteristics of the finer features of the PFZ.
Author Contributions
Conceptualization, T.P. and Z.Y.; methodology, T.P. and Y.H.; software, Y.H. and Z.Y.; validation, T.P. and Y.H.; formal analysis: T.P., Y.H. and Z.Y.; investigation, T.P., Y.H. and Z.Y.; resources, Z.Y., J.V. and C.A.; data curation, T.P.; writing—original draft preparation, T.P.; writing—review and editing, Y.H., Z.Y., J.V. and C.A.; visualization, T.P. and Z.Y.; supervision, Z.Y., J.V. and C.A.; project administration, J.V. and C.A.; funding acquisition, J.V., C.A. and Z.Y. All authors have read and agreed to the published version of the manuscript.
Funding
This research was financially supported by U.S. Department of Energy (DOE) Office of Energy Efficiency and Renewable Energy, specifically Solar Energy Technologies Office (SETO), under grant # DE-EE00033458 # DE-EE00037373.
Data Availability Statement
The original contributions presented in the study are included in the article, further inquiries can be directed to the corresponding author.
Acknowledgments
This work is authored in part by the National Renewable Energy Laboratory, operated by Alliance for Sustainable Energy, LLC, for the U.S. Department of Energy (DOE) under Contract No. DE-AC36-08GO28308. The views expressed in the article do not necessarily represent the views of the DOE or the U.S. Government. The U.S. Government retains and the publisher, by accepting the article for publication, acknowledges that the U.S. Government retains a nonexclusive, paid-up, irrevocable, worldwide license to publish or reproduce the published form of this work, or allow others to do so, for U.S. Government purposes. Use of the Tescan S8252G SEM is supported by the National Science Foundation Division of Materials Research Award No. 1828454. Special thanks to members in the Center for Welding, Joining and Coatings Research (CWJCR) at Colorado School of Mines for discussions.
Conflicts of Interest
The authors declare no conflicts of interest.
References
- “2023 Boiler and Pressure Vessel Code”, in VIII: Rules for Construction of Pressure Vessels; American Society of Mechanical Engineers (ASME): New York, NY, USA, 2023.
- “2023 Boiler and Pressure Vessel Code”, in II-Part D: Materials; American Society of Mechanical Engineers (ASME): New York, NY, USA, 2023.
- Messler, R.W.; Li, L. Weld heat affected zone liquation cracking in type 347 stainless steel. Sci. Technol. Weld. Join. 1997, 2, 43–52. [Google Scholar] [CrossRef]
- Lundin, C.D.; Lee, C.H.; Menon, R.; Osorio, V. Weldability evaluations of modified 316 and 347 austenitic stainless steels part 1. Weld. J. 1988, 67, 35s–46s. [Google Scholar]
- Lundin, C.D.; Qiao, C.Y.P. Weldability of Nuclear Grade Stainless Steels: Evaluation of HAZ Hot Cracking Susceptibility of 347 Nuclear Grade Stainless Steels. In Proceedings of the New Advances in Welding and Allied Processes, Beijing, China, 31 July 1991. [Google Scholar]
- Cullen, T.M.; Freeman, J.W. Metallurgical Factors Influencing Hot Ductility of Austenitic Piping at Weld Heat Affected Zone Temperatures. Trans. ASME Jnl. Eng. Power 1963, 85, 151–164. [Google Scholar] [CrossRef]
- Lippold, J.C.; Kotecki, D.J.C. 6 Austenitic Stainless Steel. In Welding Metallurgy and Weldability of Stainless Steels; John Wiley and Sons, Inc.: Hoboken, NJ, USA, 2005. [Google Scholar]
- Lundin, C.D.; DeLong, W.T.; Spond, D.F. Ferrite-fissuring relationship in austenitic stainless steel weld metals. Weld. J. 1975, 54, S241–S246. [Google Scholar]
- Dhooge, A. Survey on reheat cracking in austenitic stainless steels and Ni base alloys. Weld. World 1998, 41, 206–219. [Google Scholar]
- Irvine, K.J.; Murray, J.D.; Pickering, F.B. The Effect of Heat Treatment and Microstructure on the High-Temperature Ductility of 18%Cr-12%Ni-1%Nb Steels. J. Iron Steel Inst. 1960, 10, 166–179. [Google Scholar]
- Thomas, R.D., Jr.; Messler, R.W. Welding Type 347 Stainless Steel-An Interpretive Report. Weld. Res. Counc. Bull. 1997, 421, 1–127. [Google Scholar]
- Thomas, R.D., Jr. HAZ Cracking in Thick Section of Austenitic Stainless Steels-Part 2. Weld. J. 1984, 63, 355–368. [Google Scholar]
- Kant, R.; DuPont, J.N. Stress Relief Cracking Susceptibility in High-Temperature Alloys. Weld. J. 2019, 98, 29–49. [Google Scholar]
- Dillingh, E.C.; Bahrami, A.; Aulbers, A.P. Stress Relaxation Cracking-Augmented Recommended Practice; TNO Report; #0100296673; TNO: Hague, The Netherlands, 2016; pp. 1–138. [Google Scholar]
- van Wortel, H. Control of Relaxation Cracking in Austenitic High Temperature Components; NACE Corrosion: Nashville, TN, USA, 2007. [Google Scholar]
- Dhooge, A.; Vinckier, A. Reheat Cracking-a Review of Recent Studies. Int. J. Press. Vessel. Pip. 1987, 27, 239–269. [Google Scholar] [CrossRef]
- Siefert, J.A.; Shingledecker, J.P.; DuPont, J.N.; David, S.A. Weldability and weld performance of candidate nickel based superalloys for advanced ultrasupercritical fossil power plants Part II: Weldability and cross-weld creep performance. Sci. Technol. Weld. Join. 2016, 21, 397–428. [Google Scholar] [CrossRef]
- Pickle, T.; Augustine, C.; Yu, Z. Mechanical Failure Risk Management for In-Service CSP Nitrate Hot Tanks; National Renewable Energy Laboratory (NREL): Golden, CO, USA, 2024.
- Augustine, C.; Pickle, T.; Hong, Y.; Vidal, J.; Yu, Z. Stress Relaxation Cracking of Alloys at Temperatures Higher Than 540 °C; National Renewable Energy Laboratory (NREL): Golden, CO, USA, 2024.
- Osorio, J.D.; Mehos, M.; Imponenti, L.; Kelly, B.; Price, H.; Torres-Madronero, J.; Alejandro, R.-A.; Cesar, N.-L.; Chen, N.; Zhenzhen, Y.; et al. Failure Analysis for Molten Salt Thermal Energy Storage Tanks for In-Service CSP Plants; National Renewable Energy Laboratory (NREL): Golden, CO, USA, 2024.
- Penso, J.; Shargay, C. Stress Relaxation Cracking of Thick-Wall Stainless Steel Piping in Various Refining Units. In Proceedings of the ASME 2021 Pressure Vessels & Piping Conference, Online, 13–15 July 2021. [Google Scholar]
- Wang, Y.; Yang, Y.; Gao, Y.; Penso, J.; Feng, Z. A Study of Stress Relaxation Cracking Mechanism in a 347H Steel Pipe-Shoe Weldment After Five-Year Service. In Proceedings of the ASME 2023 Pressure Vessels & Piping Conference, Atlanta, GA, USA, 16–21 July 2023. [Google Scholar]
- Rensman, J.-W.; Spindler, M.W.; Shargay, C. Stress Relaxation Cracking, A Misunderstood Problem in the Process Industry. In Proceedings of the ASME 2023 Pressure Vessels & Piping Conference, Atlanta, GA, USA, 16–21 July 2023. [Google Scholar]
- Mallick, R.K.; Ghosh, M.; Bahrami, A.; Esmaeili, V. Stress relaxation cracking failure in heat exchanger connection pipes in petroechemical plant. Eng. Fail. Anal. 2022, 147, 107156. [Google Scholar] [CrossRef]
- Westhuizen, C.E.V.D. Stress Relaxation Cracking of Welded Joints in Thick Sections of a TP347 Stabilized Grade of Stainless Steel. In NACE Corrosion; NACE: Bethlehem, CA, USA, 2008. [Google Scholar]
- Siefert, J.; Shingledecker, J.; Lolla, T. Stress Relaxation Cracking (SRxC) and Strain Induced Precipitation Hardening (SIPH) Failures. In Proceedings of the DOE Workshop: Evaluation of Welding Issues in High Nickel and Stainless Steel Alloys for Advanced Energy Systems, Virtual, 10 March 2020. [Google Scholar]
- Linnert, G.E. Welding Type 347 Stainless Steel Piping and Tubing. Weld. Res. Counc. Bull. 1958, 43, 1–103. [Google Scholar]
- Satz, L.H. Stress Relief of Stainless Type 347 Investigated. Iron Age 1950, 166. [Google Scholar]
- Morishige, N.; Kuribayashi, M.; Okabayashi, N.; Naiki, T. On the Prevention of Service Failure in Type 347 Stainless Steel. Third Int. Symp. Jpn. Weld. Soc. 1978, 445–450. [Google Scholar]
- Naiki, T.; Okabayashi, N.; Kuribayashi, M.; Morishige, N. Cracking in Welded 18 Cr-12Ni-Nb Steel during Stress Relieving. Ishikawajima-Harima Gibo 1975, 15, 209–215. [Google Scholar]
- Phebus, R.L. Weldability of Heavy Sections of AISI Type 347 Stainless Steel; U.S. Navy Engineering Experiment Station: Annapolis, MD, USA, 1957. [Google Scholar]
- Messer, B.; Oprea, V.; Phillips, T. Optimized Heat Treatment of 347 Type Stainless Steel Alloys for Elevated Temperature Service to Minimize Cracking. In NACE Corrosion; NACE: New Orleans, LA, USA, 2004. [Google Scholar]
- Li, L.; Messler, R.W. Stress Relaxation Study of HAZ Reheat Cracking in Type 347 Stainless Steel. Weld. J. 2000, 79, 137–144. [Google Scholar]
- Nawrocki, J.G.; Dupont, J.N.; Robino, C.V.; Puskar, J.D.; Marder, A.R. The Mechanism of Stress-Relief Cracking in a Ferritic Alloy Steel. Weld. J. 2003, 82, 25. [Google Scholar]
- Fink, C.; Wang, H.; Alexandrov, B.T.; Penso, J. Filler Metal 16-8-2 for Structural Welds on 304H and 347H Stainless Steels for High Temperature Service. Weld. J. 2020, 99, 312–322. [Google Scholar] [CrossRef]
- Sarich, C.; Alexandrov, B.; Benatar, A.; Penso, J. Test for stress relief cracking susceptibility in creep resistant chromium-molybdenum steels. Sci. Technol. Weld. Join. 2022, 27, 265–281. [Google Scholar] [CrossRef]
- Hong, Y.U.; Pickle, T.; Vidal, J.; Augustine, C.; Yu, Z. Impact of Plate Thickness and Joint Geometry on Residual Stresses in 347H Stainless Steel Welds. Weld. J. 2023, 102, 279–292. [Google Scholar] [CrossRef]
- A240/A240M-23; Standard Specification for Chromium and Chromium-Nickel Stainless Steel Plate, Sheet, and Strip for Pressure Vessels and for General Applications. American Society for Testing of Materials (ASTM) International: West Conshohocken, PA, USA, 2023.
- Dieter, G.E. Mechanical Metallurgy, 3rd ed.; McGraw Hill: New York, NY, USA, 1986. [Google Scholar]
- Osman, H.; Tamin, M.N. Creep response of austenitic stainless steel foils for advanced recuperator applications. In Proceedings of the South East Asian Technical Universities Consortium(SEATUC)—3rd SEATUC Symposium Proceeding, Johor Bahru, Malaysia, 25–26 February 2009; p. 4. [Google Scholar]
- Amirkhiz, B.S.; Xu, S.; Liang, J.; Bibby, C. Creep properties and TEM characterization of 347H stainless steel. In Proceedings of the 36th Annual Conference of the Canadian Nuclear Society and 40th Annual CNS/CNA Student Conference, Toronto, ON, Canada, 19–22 June 2016. [Google Scholar]
- Kim, W.; Kim, K.S.; Lee, H.; Yoo, K. Welding residual stress analysis of 347H austenitic stainless steel boiler tubes using experimental and numerical approaches. J. Mech. Sci. Technol. 2016, 30, 7. [Google Scholar] [CrossRef]
- Brickstad, B.; Josefson, B. A parametric study of residual stresses in multi-pass butt-welded stainless steel pipes. International J. Press. Vessel. Pip. 1998, 75, 11–25. [Google Scholar] [CrossRef]
- Allegheny Technologies Incorporated (ATI). ATI 316™, ATI 316L™, ATI 317™, ATI 317L™ Technical Data Sheet. Available online: https://www.atimaterials.com/Products/Documents/datasheets/stainless-specialty-steel/austenitic/ati_321_347_348_tds_en2_v1.pdf (accessed on 1 October 2020).
- Sawada, K.; Kimura, K.; Abe, F.; Taniuchi, Y.; Sekido, K.; Nojima, T.; Ohba, T.; Kushima, H.; Miyazaki, H.; Hongo, H.; et al. Catalog of NIMS creep data sheets. Sci. Technol. Adv. Mater. 2019, 20, 1131–1149. [Google Scholar] [CrossRef]
- Luo, H.W.; Dong, H.; Chen, L.F. Grain Growth in Nb-Alloyed Stainless Steel of AISI 347 during Heating. Mater. Sci. Forum 2013, 753, 345–348. [Google Scholar] [CrossRef]
- Pickle, T.; Hong, Y.; Vidal, J.; Augustine, C.; Yu, Z. Stress relaxation cracking susceptibility evaluation in 347H stainless steel welds. Weld. World 2024, 68, 657–667. [Google Scholar] [CrossRef]
- Yang, Y.; Han, D.; Gao, Y.; Zhang, W.; Bunn, J.R.; Payzant, E.A.; Penso, J.; Feng, Z. Residual Stress Modeling and Advanced Diffraction Measurements of 347H Steel Weldments. In Proceedings of the ASME 2022 Pressure Vessels & Piping Conference, Las Vegas, NV, USA, 17–22 July 2022. [Google Scholar]
- Yang, Y. Stress Relaxation Cracking in 347H Austentici Steel Weldments Under Various Heat Treatments: Expeirments and Modeling. Ph.D. Thesis, Materials Science and Engineering, University of Tennessee, Knoxville, TN, USA, 2023. [Google Scholar]
- Larson, F.R.; Miller, J. A Time-Temperature Relationship for Rupture and Creep Stresses. Trans. Am. Soc. Mech. Eng. 1952, 74, 765–771. [Google Scholar] [CrossRef]
- Cui, Y.; Lundin, C.D. Ferrite number as a function of the Larson-Miller Parameter for Austenitic Stainless Steel Metals after Creep Testing. Metall. Mater. Trans. A 2004, 35A, 3631–3633. [Google Scholar] [CrossRef]
- Duch, J.E. Strain Aging and Stress Relief Cracking Susceptibility of Precipitate Strengthened Alloys INCONEL 740H and 347H. Ph.D. Thesis, Materials Science and Engineering, Lehigh University, Bethlehem, PA, USA, 2022. [Google Scholar]
- Frost, H.J.; Ashby, M.F. Deformation-Mechniasm Maps: The Plasticity and Creep of Metals an Ceramics; Pergamon Press: Oxford, UK, 1982. [Google Scholar]
- Osman, H.; Nor, F.M.; Hamdan, Y.M.; Tamin, M.N. Creep ruptures of AISI 347 austenitic stainless steel foils at elevated temperature of 750 °C. Proc. Inst. Mech. Eng. Part L J. Mater. Des. Appl. 2015, 231, 516–522. [Google Scholar] [CrossRef]
- Needham, N.G.; Gladman, T. Nucleation and growth of creep cavities in a Type 347 steel. Met. Sci. 1980, 14, 64–72. [Google Scholar] [CrossRef]
- Cios, G.; Tokarski, T.; Żywczak, A.; Dziurka, R.; Stępień, M.; Gondek, Ł.; Marciszko, M.; Pawłowski, B.; Wieczerzak, K. The Investigation of Strain-Induced Martensite Reverse Transformation in AISI 304 Austenitic Stainless Steel. Metall. Mater. Trans. A 2017, 48, 4999–5008. [Google Scholar] [CrossRef]
- Lee, H.-S.; Jung, J.-S.; Kim, D.-S.; Yoo, K.-B. Failure analysis on welded joints of 347H austenitic boiler tubes. Eng. Fail. Anal. 2015, 57, 413–422. [Google Scholar] [CrossRef]
- Elmer, J.W.; Olson, D.L.; Matlock, D.K. The Thermal Expansion Characteristics of Stainless Steel Weld Metal. Weld. J. 1982, 61, 293–301. [Google Scholar]
- van Wortel, J.C. Prevention of Relaxation Cracking By Material Selection and or Heat Treatment: Final Report; TNO Institute of Industrial Technology: Eindhoven, The Netherlands, 2000. [Google Scholar]
Figure 1.
Four-step SRC thermomechanical test methodology example displayed with temperature, stress, and stroke as a function of time for HAZ simulation with 1335 °C HAZ peak temperature, 0.174 pre-strain, and 750 °C reheat temperature condition.
Figure 1.
Four-step SRC thermomechanical test methodology example displayed with temperature, stress, and stroke as a function of time for HAZ simulation with 1335 °C HAZ peak temperature, 0.174 pre-strain, and 750 °C reheat temperature condition.

Figure 2.
(a) HAZ duplicating thermal cycles showing heating rate (HR) of 66 °C/s and initial cooling rate of 23 °C/s with a 1 s hold at peak temperatures corresponding to three subzones in HAZ illustrated in the schematic drawing; (b) optical micrograph at a low magnification along with SEM imaging of a local enlarged region of etched microstructure in as-received wrought condition; (c) EDS point measurements of bulk austenite (γ) and secondary precipitates in (b); optical micrographs of etched microstructure after (d) 1275 °C and (e) 1335 °C peak temperature thermal cycles; and (f) higher magnification optical micrograph of 1335 °C peak temperature unetched microstructure. The actual weld micrographs using SMAW are provided in (g–i) for comparison.

Figure 3.
Stress profiles as a function of testing temperature at (a) 800 °C, (b) 850 °C, (c) 900 °C, (d) 950 °C, (e) 1000 °C, and (f) 1050 °C and time for steps 2–4 with different starting strains. Solid and open circles and asterisks represent failure occurring at temp, failure during cooling and no failure, respectively, regardless of pre-strain condition. The pre-strain conditions are separated by color. Note: 750 °C test is included as an example in Figure 1.

Figure 4.
Time-to-failure (isothermal hold beginning in step 4) SRC map in 347H HAZ with three variables including HAZ simulation temperature, pre-strain and reheat test temperature. The closed, asterisk, and open symbols represent failure at temperature, failure upon imposed cooling strains, and no failure, respectively.

Figure 5.
FEM simulation of Gleeble® SRC test at 900 °C reheat temperature with 0.08 initial pre-strain: (a) stress profile of half gauge section for step two at RT (P1) and stress (P2) and temperature (P3) profiles at the beginning of step four, (b) temperature and stress profiles calculated from middle gauge section in comparison to experimental measurements; and (c) FEM predicted plastic strain (), thermal strain (), creep strain (), and elastic strain () profiles during steps 2–4. Note: P1–3 represents evaluation points 1–3 in (b).

Figure 6.
SRC susceptibility maps presented in the format of FEA calibrated plastic strain as a function of (a) testing temperature and (b) Larson–Miller parameter (LMP) and starting stress upon reaching test temperature (initial stage of step four) as a function of (c) testing temperature and (d) LMP.

Figure 7.
SRC susceptibility maps presented in the format of (a) experimentally measured bulk creep strain as a function of pre-applied plastic strain after FEA calibration and (b) creep rate as a function of testing temperature.
Figure 7.
SRC susceptibility maps presented in the format of (a) experimentally measured bulk creep strain as a function of pre-applied plastic strain after FEA calibration and (b) creep rate as a function of testing temperature.

Figure 8.
Light optical microscopy (LOM) of no failure samples showing progression of micro- voids and cracks tested at (a) 800 °C and 0.12 ε (unetched), (b) 950 °C and 0.07 ε (unetched), (c) 1050 °C and 0.06 ε (etched).
Figure 8.
Light optical microscopy (LOM) of no failure samples showing progression of micro- voids and cracks tested at (a) 800 °C and 0.12 ε (unetched), (b) 950 °C and 0.07 ε (unetched), (c) 1050 °C and 0.06 ε (etched).

Figure 9.
Fractography analysis on failed specimens: (a) schematic of gauge section illustrating characterization planes, (b–d) fracture surfaces in center of specimens tested at 750, 800, and 850 °C with 0.194 plastic strain, and (e–h) SEI-SEM images (etched) of cross sections parallel to the tensile axis showing a mix of secondary cracks and wedge type cracking along grain boundaries ahead of primary fracture surfaces.

Figure 10.
Secondary cracks with intergranular precipitation preceding crack tips in a specimen tested at 900 °C and 0.194 plastic strain: (a) SEI field of view (etched), and EDS maps of (b) Fe, (c) Cr, (d) Ni, (e) Nb, and (f) Mo.
Figure 10.
Secondary cracks with intergranular precipitation preceding crack tips in a specimen tested at 900 °C and 0.194 plastic strain: (a) SEI field of view (etched), and EDS maps of (b) Fe, (c) Cr, (d) Ni, (e) Nb, and (f) Mo.

Figure 11.
EDS line scan showing Nb and Mo rich carbonitrides along the microcracks of specimen tested at 800 °C and 0.194 plastic strain (a) SEI-SEM micrograph (unetched), and (b) line scan result.
Figure 11.
EDS line scan showing Nb and Mo rich carbonitrides along the microcracks of specimen tested at 800 °C and 0.194 plastic strain (a) SEI-SEM micrograph (unetched), and (b) line scan result.

Figure 12.
Comparison of average Vickers microhardness in the 347H base metal, 1275 °C HAZ, 1335 °C HAZ, 1335 °C HAZ after exposure to 600 °C for 9 h, 1335 °C HAZ with 17.4% plastic strain and after exposure to 600 °C for 8 h with evidence of TRIP α’ martensite in an optical micrograph pointed out with blue arrows (etched).


Table 1.
Chemical composition of main alloying elements of 347H SS wrought plate used in experiments compared to ASTM A240/A240M-23 specification (Adapted from Ref. [38]). Composition analysis provided through manufacturer (DKC Steel-Pohang, South Korea) and supplier (Sandmeyer Steel Company-Philadelphia, PA, USA) material test reports (MTR).
| wt.% | C | N | Ni | Cr | Mo | Mn | Nb | Si | Cu | S | P | Fe |
|---|---|---|---|---|---|---|---|---|---|---|---|---|
| ASTM A240 | 0.04–0.10 | - | 9.0–13.0 | 17.0–19.0 | - | 2.00 | 8 × (C + N) min. 1.00 | 0.75 | - | - | - | Bal. |
| Exp. | 0.05 | 0.031 | 9.11 | 17.14 | 0.32 | 1.01 | 0.58 | 0.51 | 0.21 | 0.002 | 0.029 |
Table 2.
Creep parameters obtained from Gleeble® experiments: n-creep exponent; K-creep constant. Assumption: no creep below 625 °C. The grey shaded data are interpolated with assumed no creep at 625 °C and below for the purpose of FE simulation.
Table 2.
Creep parameters obtained from Gleeble® experiments: n-creep exponent; K-creep constant. Assumption: no creep below 625 °C. The grey shaded data are interpolated with assumed no creep at 625 °C and below for the purpose of FE simulation.
| Exp. Temperature (°C) | Temperature Range (°C) | n | K | A* |
|---|---|---|---|---|
| N/A | 20–625 | 0.00 | 0 | 0 |
| 650 | 625–675 | 5.45 | 2.18 × 10⁻²² | 6.64 × 10⁹ |
| 700 | 675–725 | 5.45 | 9.06 × 10⁻²¹ | 6.66 × 10⁹ |
| 750 | 725–775 | 5.45 | 2.61 × 10⁻¹⁹ | 6.66 × 10⁹ |
| 800 | 775–825 | 5.41 | 3.02 × 10⁻¹⁸ | 3.66 × 10⁹ |
| 850 | 825–875 | 4.83 | 3.12 × 10⁻¹⁶ | 2.35 × 10¹⁰ |
| 900 | 875–925 | 4.06 | 1.19 × 10⁻¹⁴ | 7.08 × 10¹⁰ |
| 950 | 925–975 | 1.57 | 2.14 × 10⁻⁹ | 1.24 × 10¹⁵ |
| 1000 | 975–1025 | 1.77 | 3.23 × 10⁻⁹ | 2.18 × 10¹⁴ |
| 1050 | 1025–1075 | 1.46 | 3.03 × 10⁻⁸ | 2.80 × 10¹⁴ |
Table 3.
Summary of 347H SS HAZ Gleeble® experiments inputs (non-shaded) and outputs (shaded), including initially applied strain/stress at RT (i.e., pre-strain/stress), starting stress at isothermal holding temperature, bulk strain evolution at temperature, failure condition and time to failure or time to cool down if no failure. I = failed during isothermal; C = failed during cooling. * A high creep strain led to a rapid failure.
| Temperature (°C) | HAZ | HAZ Peak Temperature (°C) | Pre-Strain | Pre-Stress (MPa) | Starting Stress at Temperature (MPa) | Bulk Strain (%) at Temperature | Failure | Time to Failure/Cool |
|---|---|---|---|---|---|---|---|---|
| 750 | HAZ 1 | 1335 | 0.174 | 588 | 260 | 0.71 | I | 22.2 h |
| 800 | 1335 | 0.1 | 452 | 184 | 0.25 | No | 39 h | |
| HAZ 1 | 0.13 | 508 | 184 | 0.38 | C | 24 h | ||
| 0.174 | 599 | 213 | 0.36 | I | 2.9 h | |||
| 850 | HAZ 1 | 1335 | 0.08 | 419 | 144 | 0.11 | C | 24 h |
| HAZ 2 | 1275 | 0.1 | 455 | 152 | 0.80 | I | 48.5 min | |
| HAZ 1 | 1335 | 0.1 | 476 | 158 | 0.41 | I | 1.1 h | |
| 0.174 | 582 | 174 | 0.38 | I | 20.3 min | |||
| 900 | 1335 | 0.04 | 332 | 89 | 0.36 | No | 24 h | |
| HAZ 1 | 0.06 | 368 | 111 | 1.46 * | I | 1.03 h | ||
| 0.08 | 421 | 107 | 0.42 | I | 4.9 h | |||
| HAZ 3 | 1150 | 0.1 | 469 | 112 | 0.44 | I | 1 h | |
| 0.1 | 443 | 111 | 2.75 * | I | 24.1 min | |||
| HAZ 2 | 1275 | 0.1 | 457 | 117 | 0.39 | I | 13.5 min | |
| HAZ 1 | 1335 | 0.1 | 456 | 119 | 0.56 | I | 31 min | |
| 0.1 | 447 | 113 | 0.33 | I | 18.3 min | |||
| 0.1 | 446 | 114 | 0.30 | I | 23.3 min | |||
| 0.174 | 598 | 128 | 0.25 | I | 5.8 min | |||
| 950 | HAZ 1 | 1335 | 0.05 | 360 | 69 | 0.45 | No | 10.9 h |
| 0.06 | 372 | 80 | 0.76 | I | 1.2 h | |||
| 0.08 | 417 | 77 | 0.36 | C | 6.4 h | |||
| 0.1 | 461 | 97 | 0.19 | I | 7.1 min | |||
| 1000 | HAZ 1 | 1335 | 0.04 | 330 | 56 | 1.85 | C | 4.7 h |
| 0.05 | 357 | 62 | 1.45 | I | 1.2 h | |||
| 1050 | HAZ 1 | 1335 | 0.01 | 261 | 55 | 1.52 | No | 3.8 h |
| 0.025 | 300 | 35 | 1.08 | No | 3.6 h | |||
| 0.04 | 335 | 43 | 1.22 | No | 1.94 h | |||
| 0.05 | 349 | 70 | 2.80 | I | 2.4 min | |||
| 0.1 | 461 | 60 | 0.20 | I | 3 s |
Disclaimer/Publisher’s Note: The statements, opinions and data contained in all publications are solely those of the individual author(s) and contributor(s) and not of MDPI and/or the editor(s). MDPI and/or the editor(s) disclaim responsibility for any injury to people or property resulting from any ideas, methods, instructions or products referred to in the content. |
© 2024 by the authors. Licensee MDPI, Basel, Switzerland. This article is an open access article distributed under the terms and conditions of the Creative Commons Attribution (CC BY) license (https://creativecommons.org/licenses/by/4.0/).
Share and Cite
MDPI and ACS Style
Pickle, T.; Hong, Y.; Augustine, C.; Vidal, J.; Yu, Z. Stress Relaxation Cracking in 347H Stainless Steel Arc Welds: Susceptibility Evaluation of Heat-Affected Zone. Metals 2024, 14, 494. https://doi.org/10.3390/met14050494
AMA Style
Pickle T, Hong Y, Augustine C, Vidal J, Yu Z. Stress Relaxation Cracking in 347H Stainless Steel Arc Welds: Susceptibility Evaluation of Heat-Affected Zone. Metals. 2024; 14(5):494. https://doi.org/10.3390/met14050494
Chicago/Turabian StylePickle, Timothy, Yu Hong, Chad Augustine, Judith Vidal, and Zhenzhen Yu. 2024. "Stress Relaxation Cracking in 347H Stainless Steel Arc Welds: Susceptibility Evaluation of Heat-Affected Zone" Metals 14, no. 5: 494. https://doi.org/10.3390/met14050494
Note that from the first issue of 2016, this journal uses article numbers instead of page numbers. See further details here.