
Self-Heating and Fatigue Assessment of Laser Powder Bed Fusion NiTi Alloy with High Cycle Fatigue Mechanisms Identification


Abstract
:1. Introduction
2. Materials and Methods
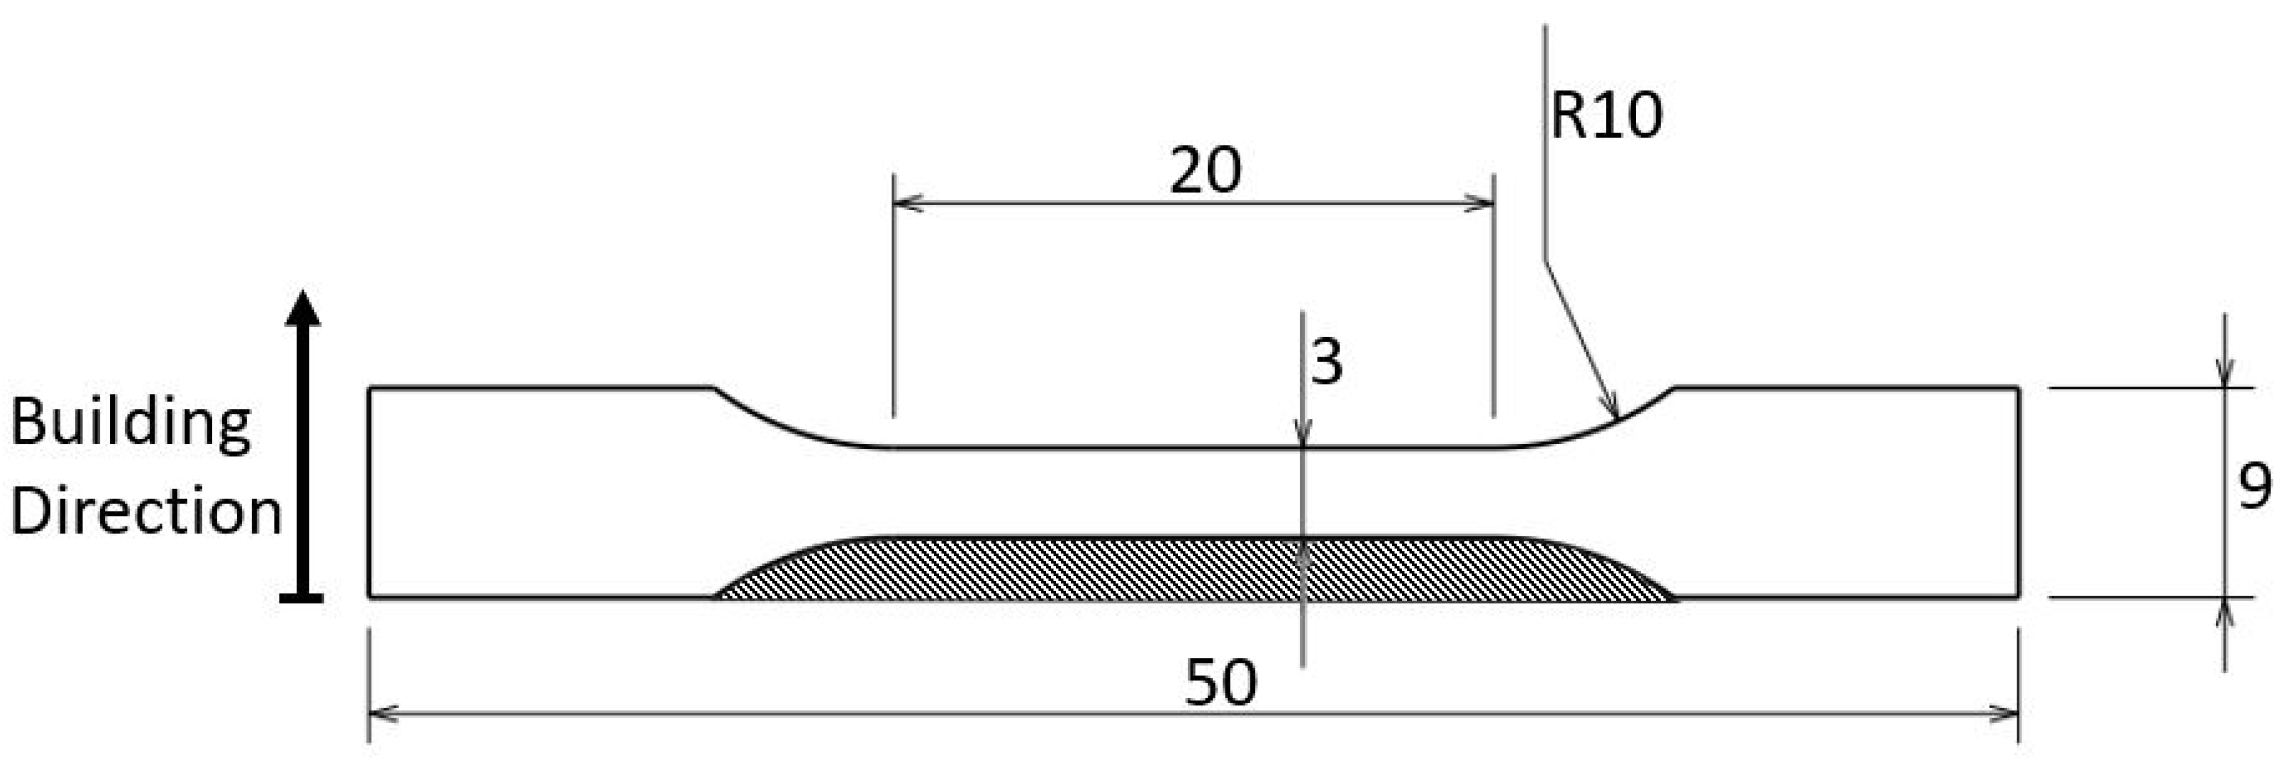
2.1. Studied Material
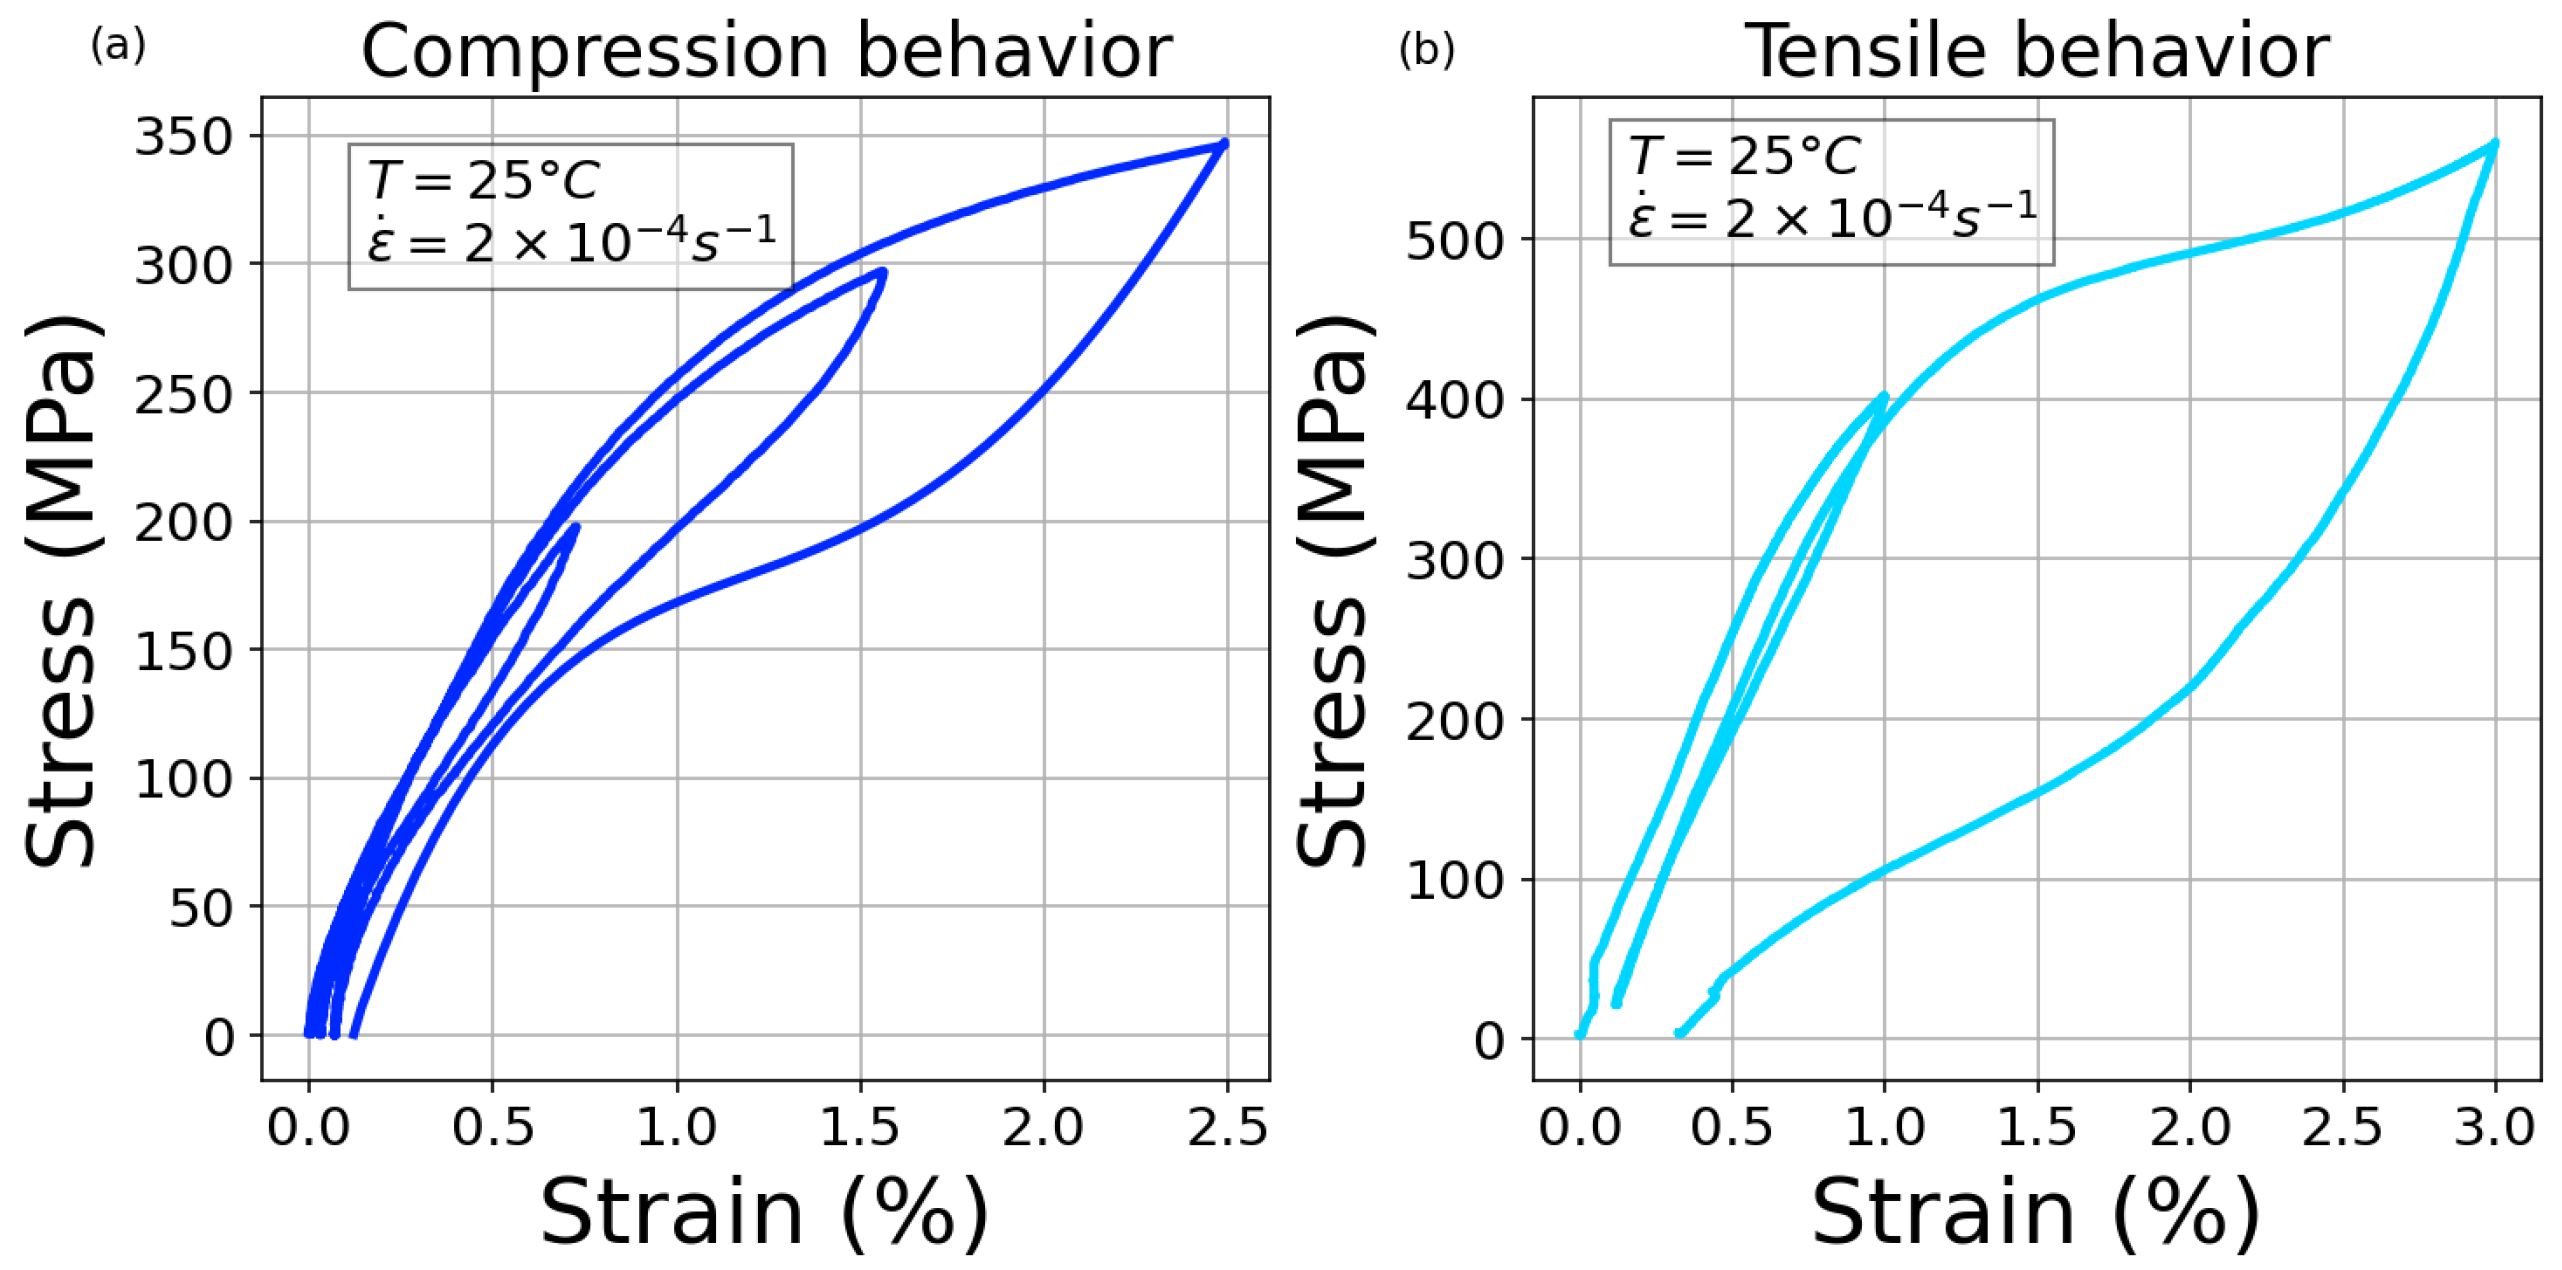
2.2. Thermomechanical Properties
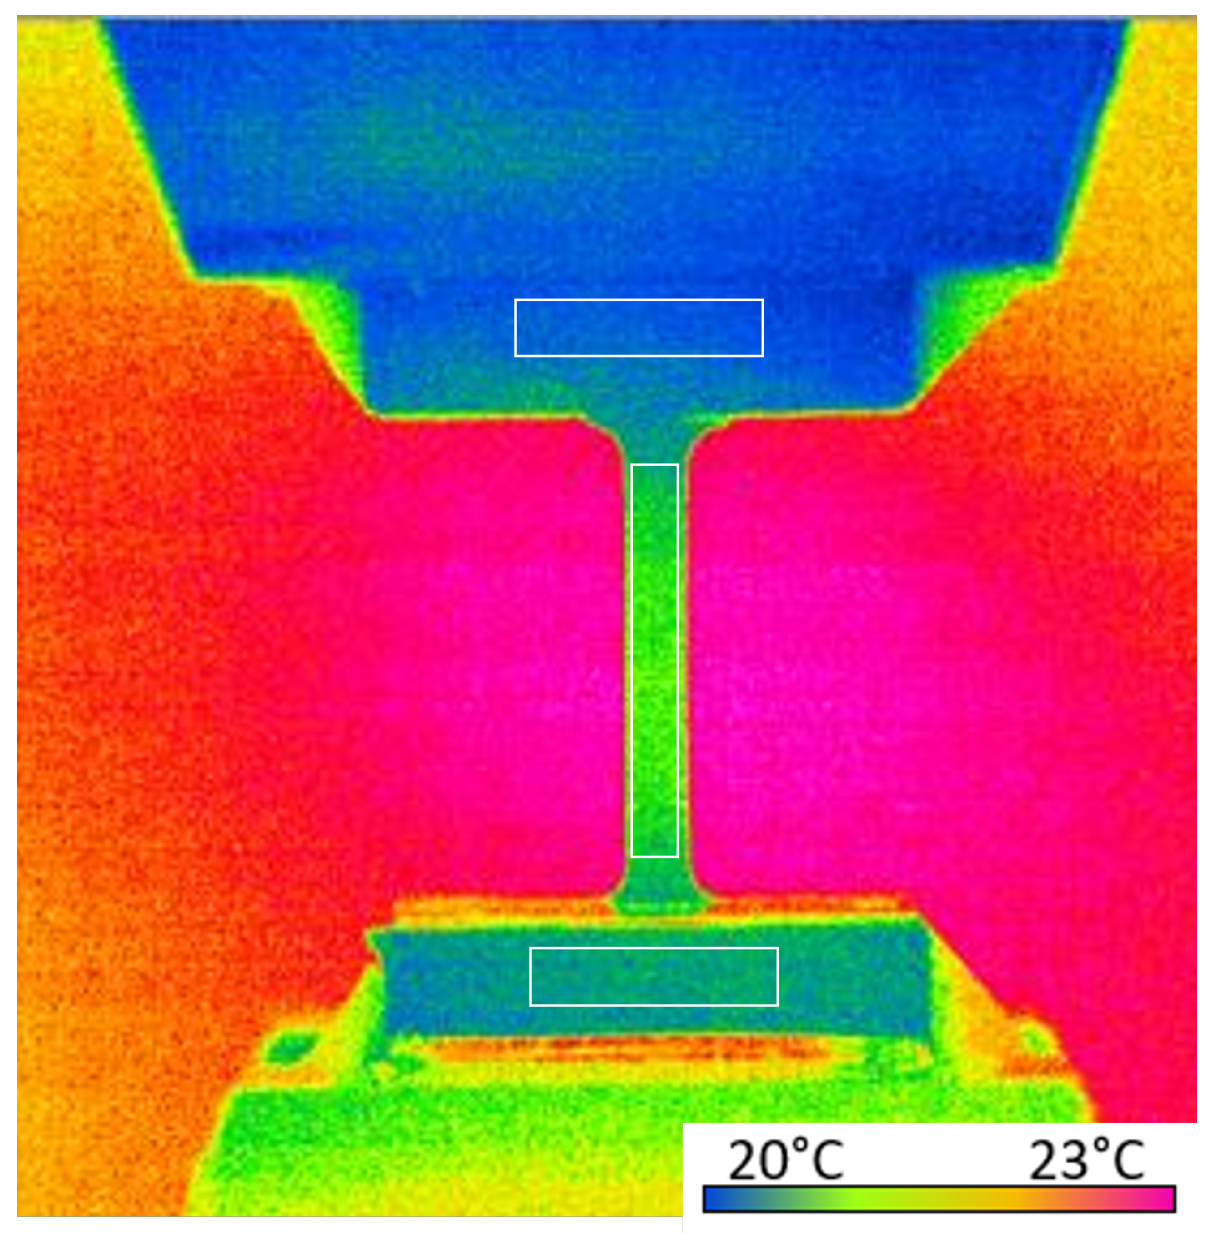
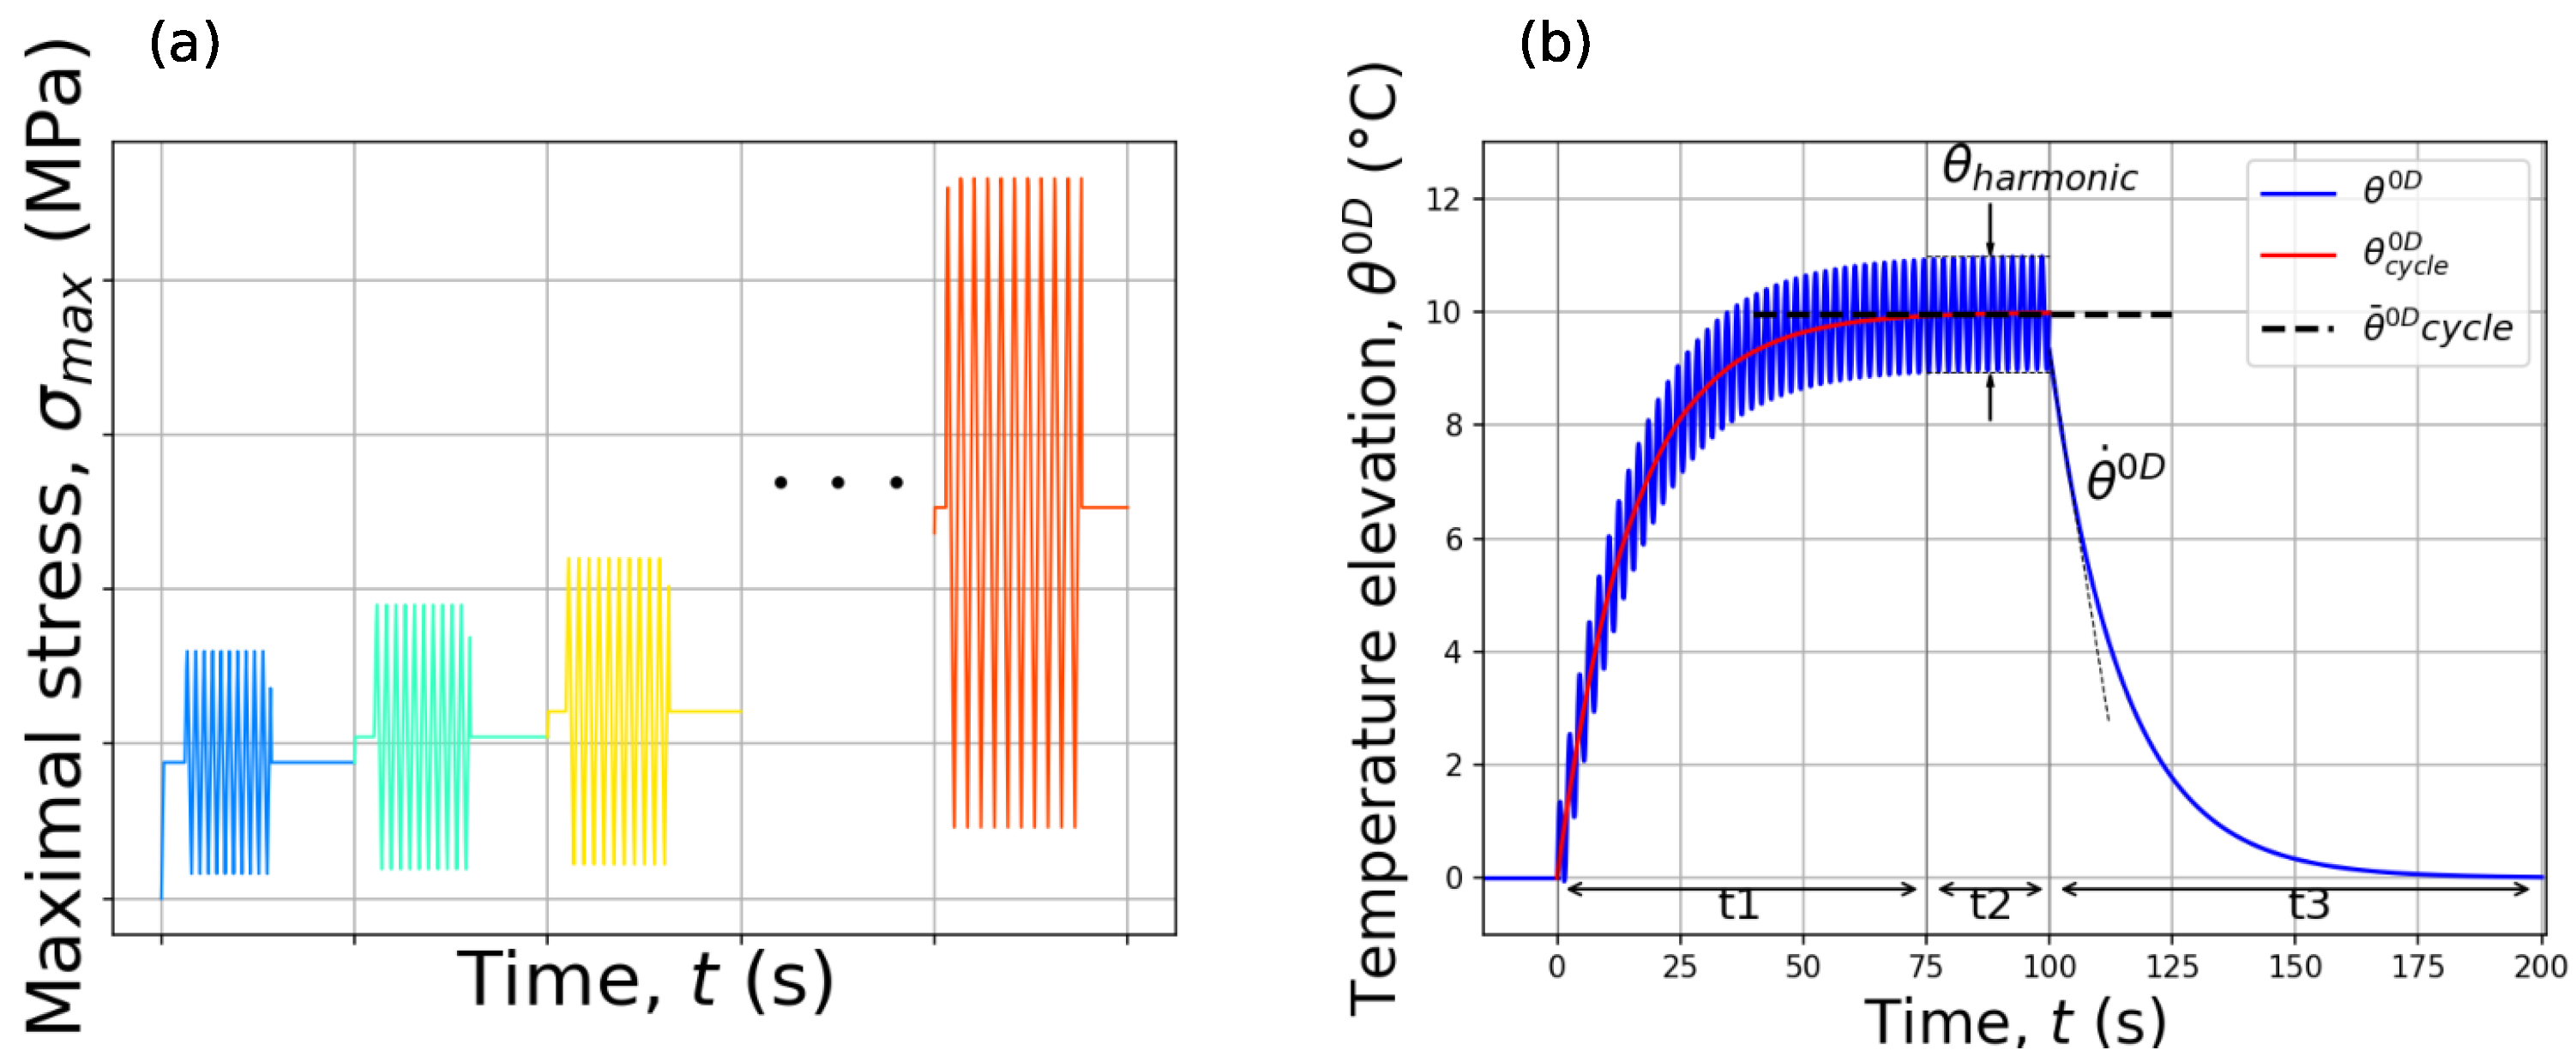
2.3. Cyclic Experimental Setup
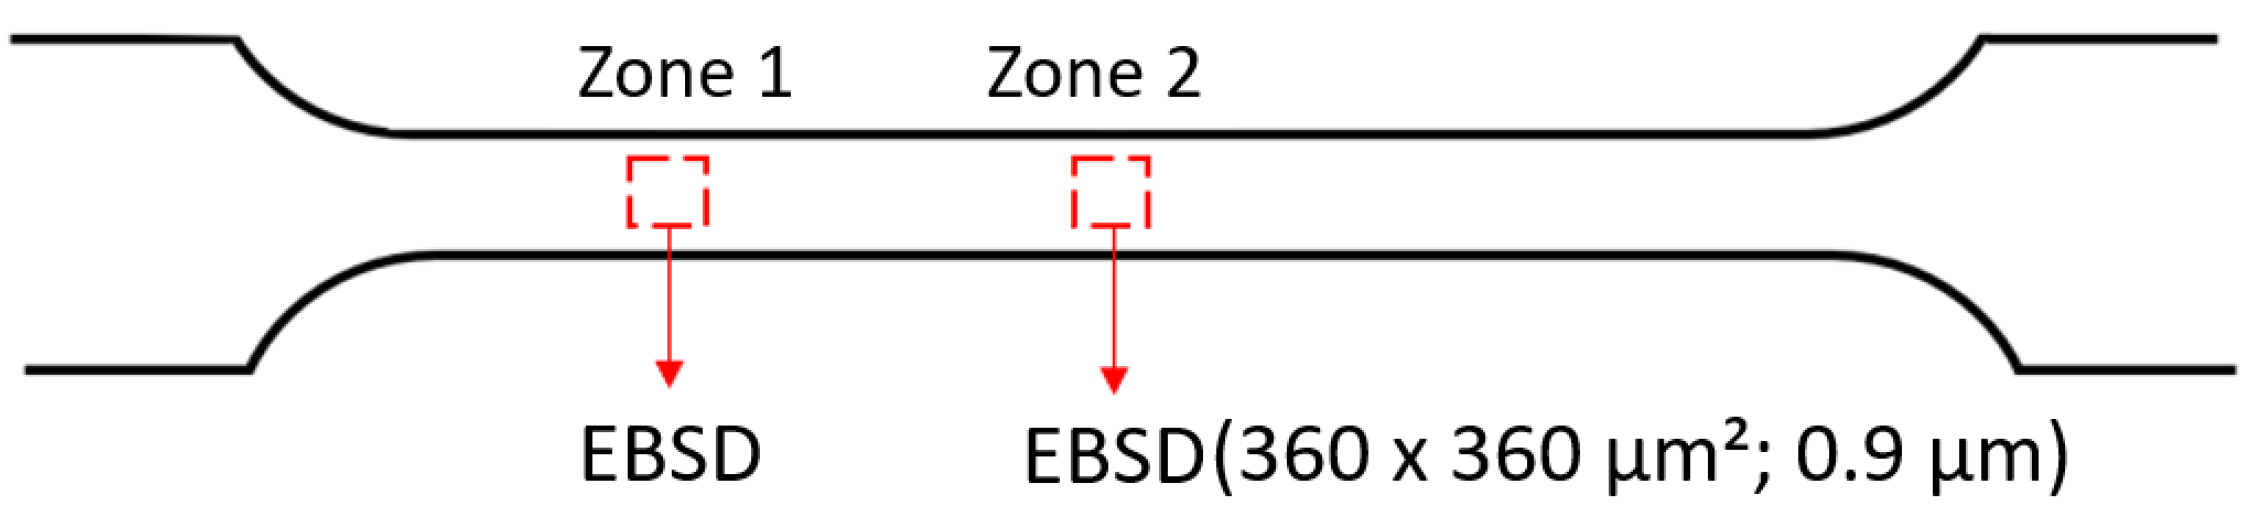
2.4. Microstructure Evolution Preparation
3. Self-Heating Assessment
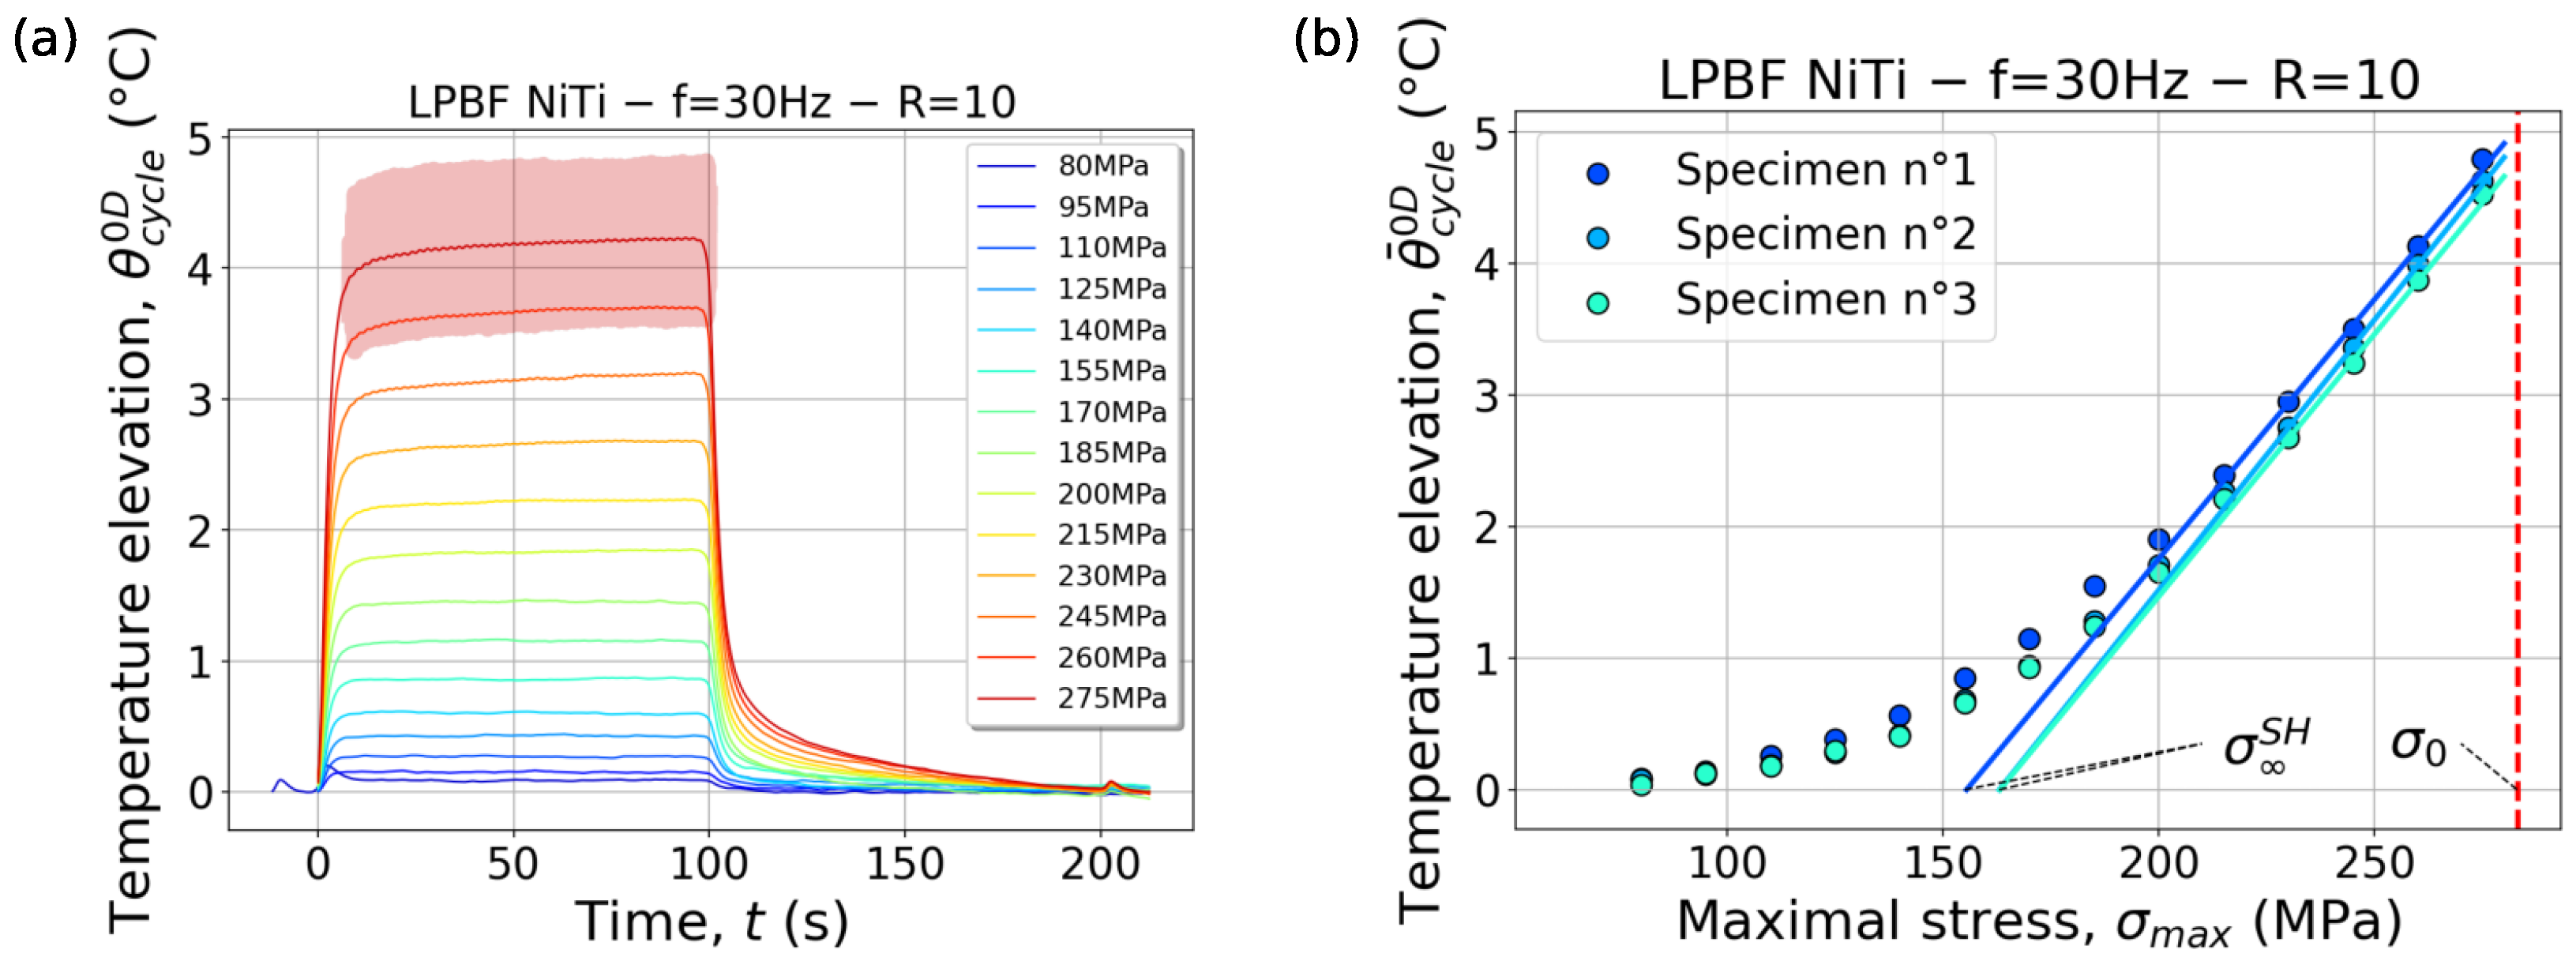
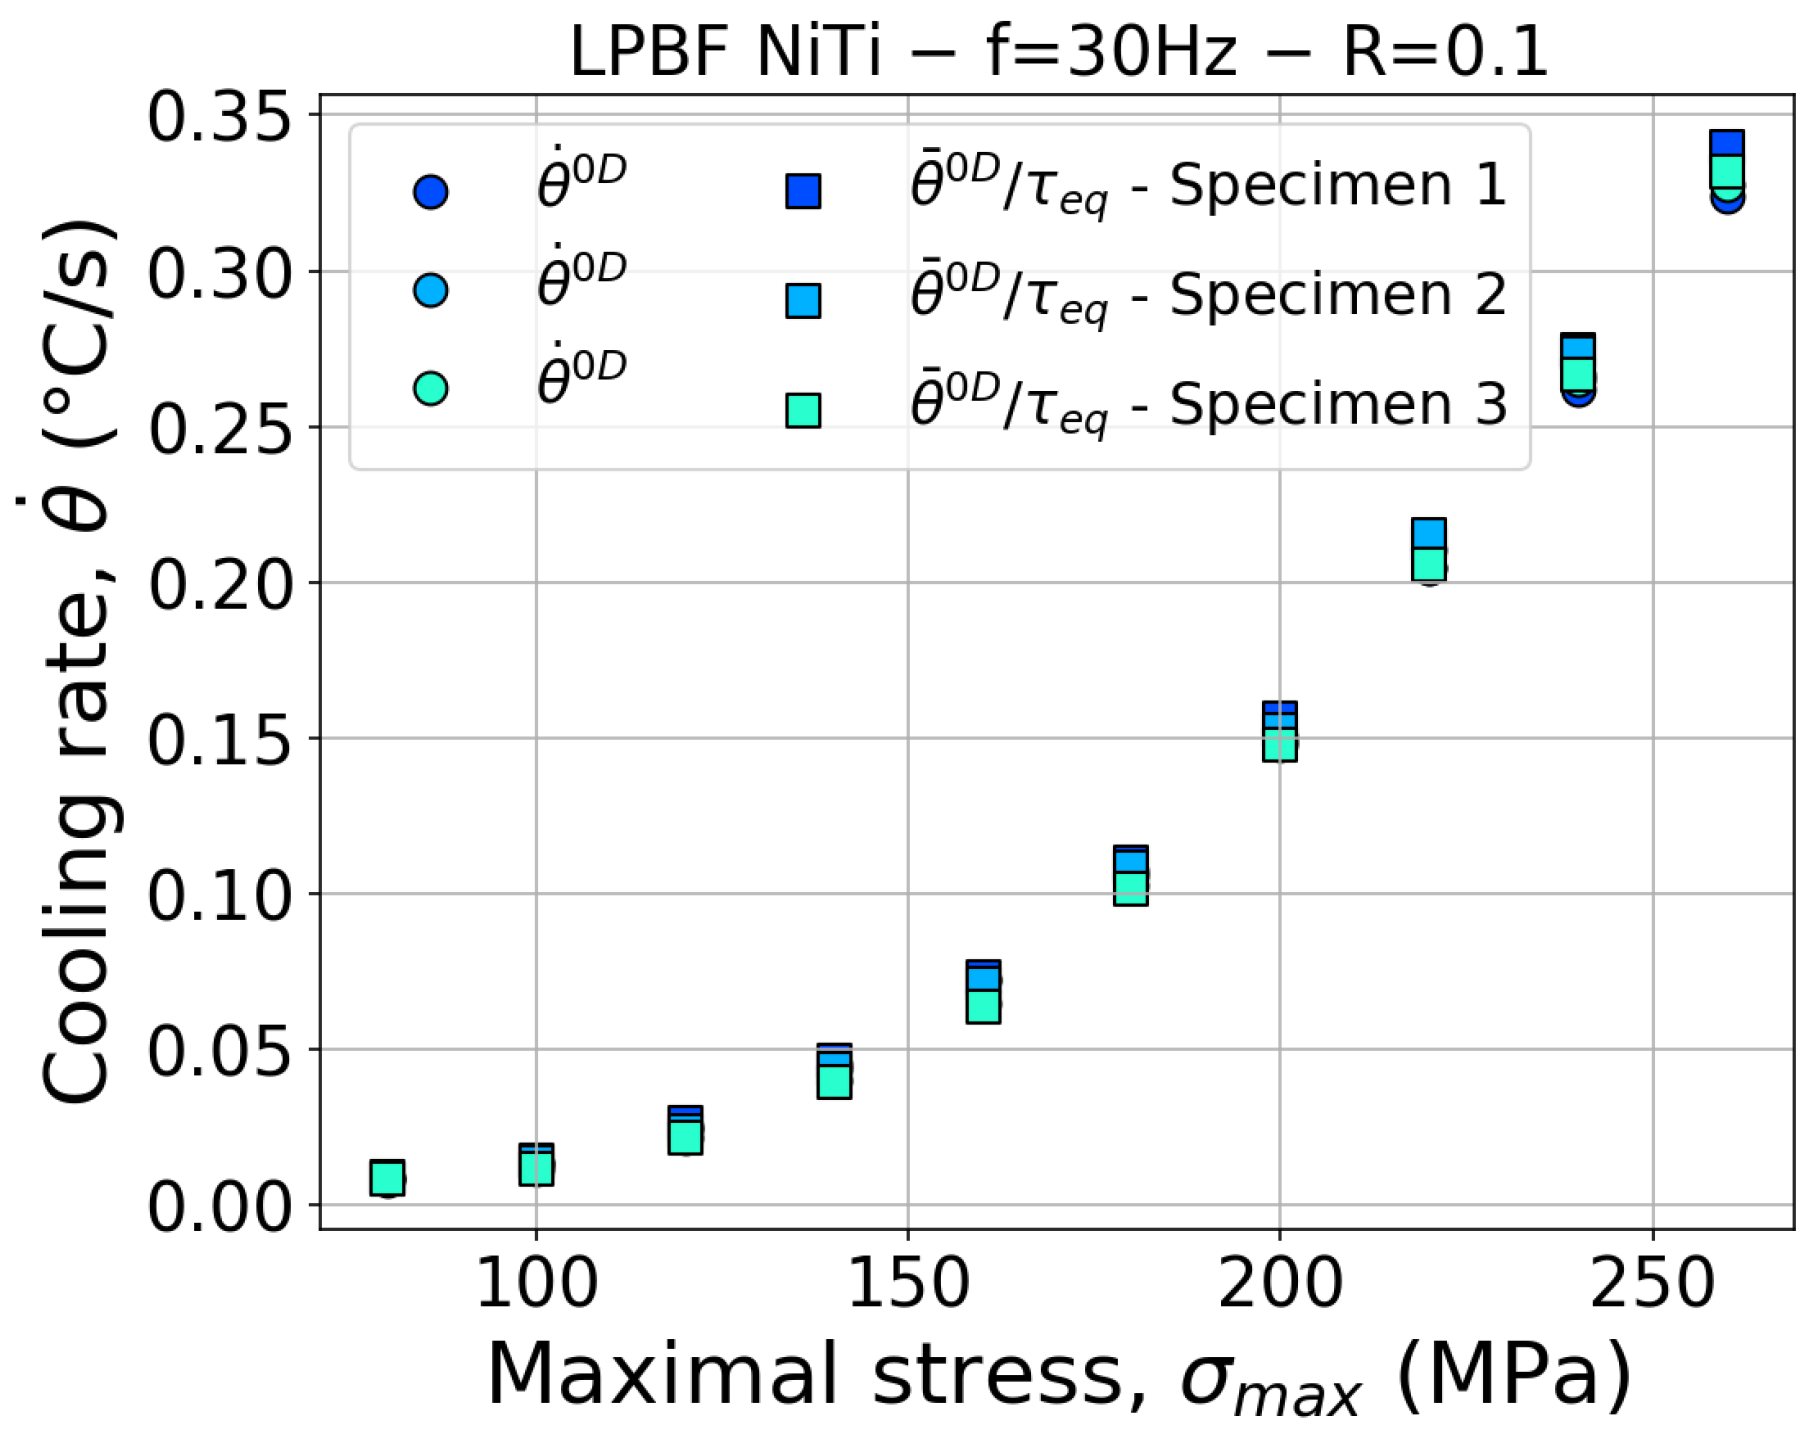
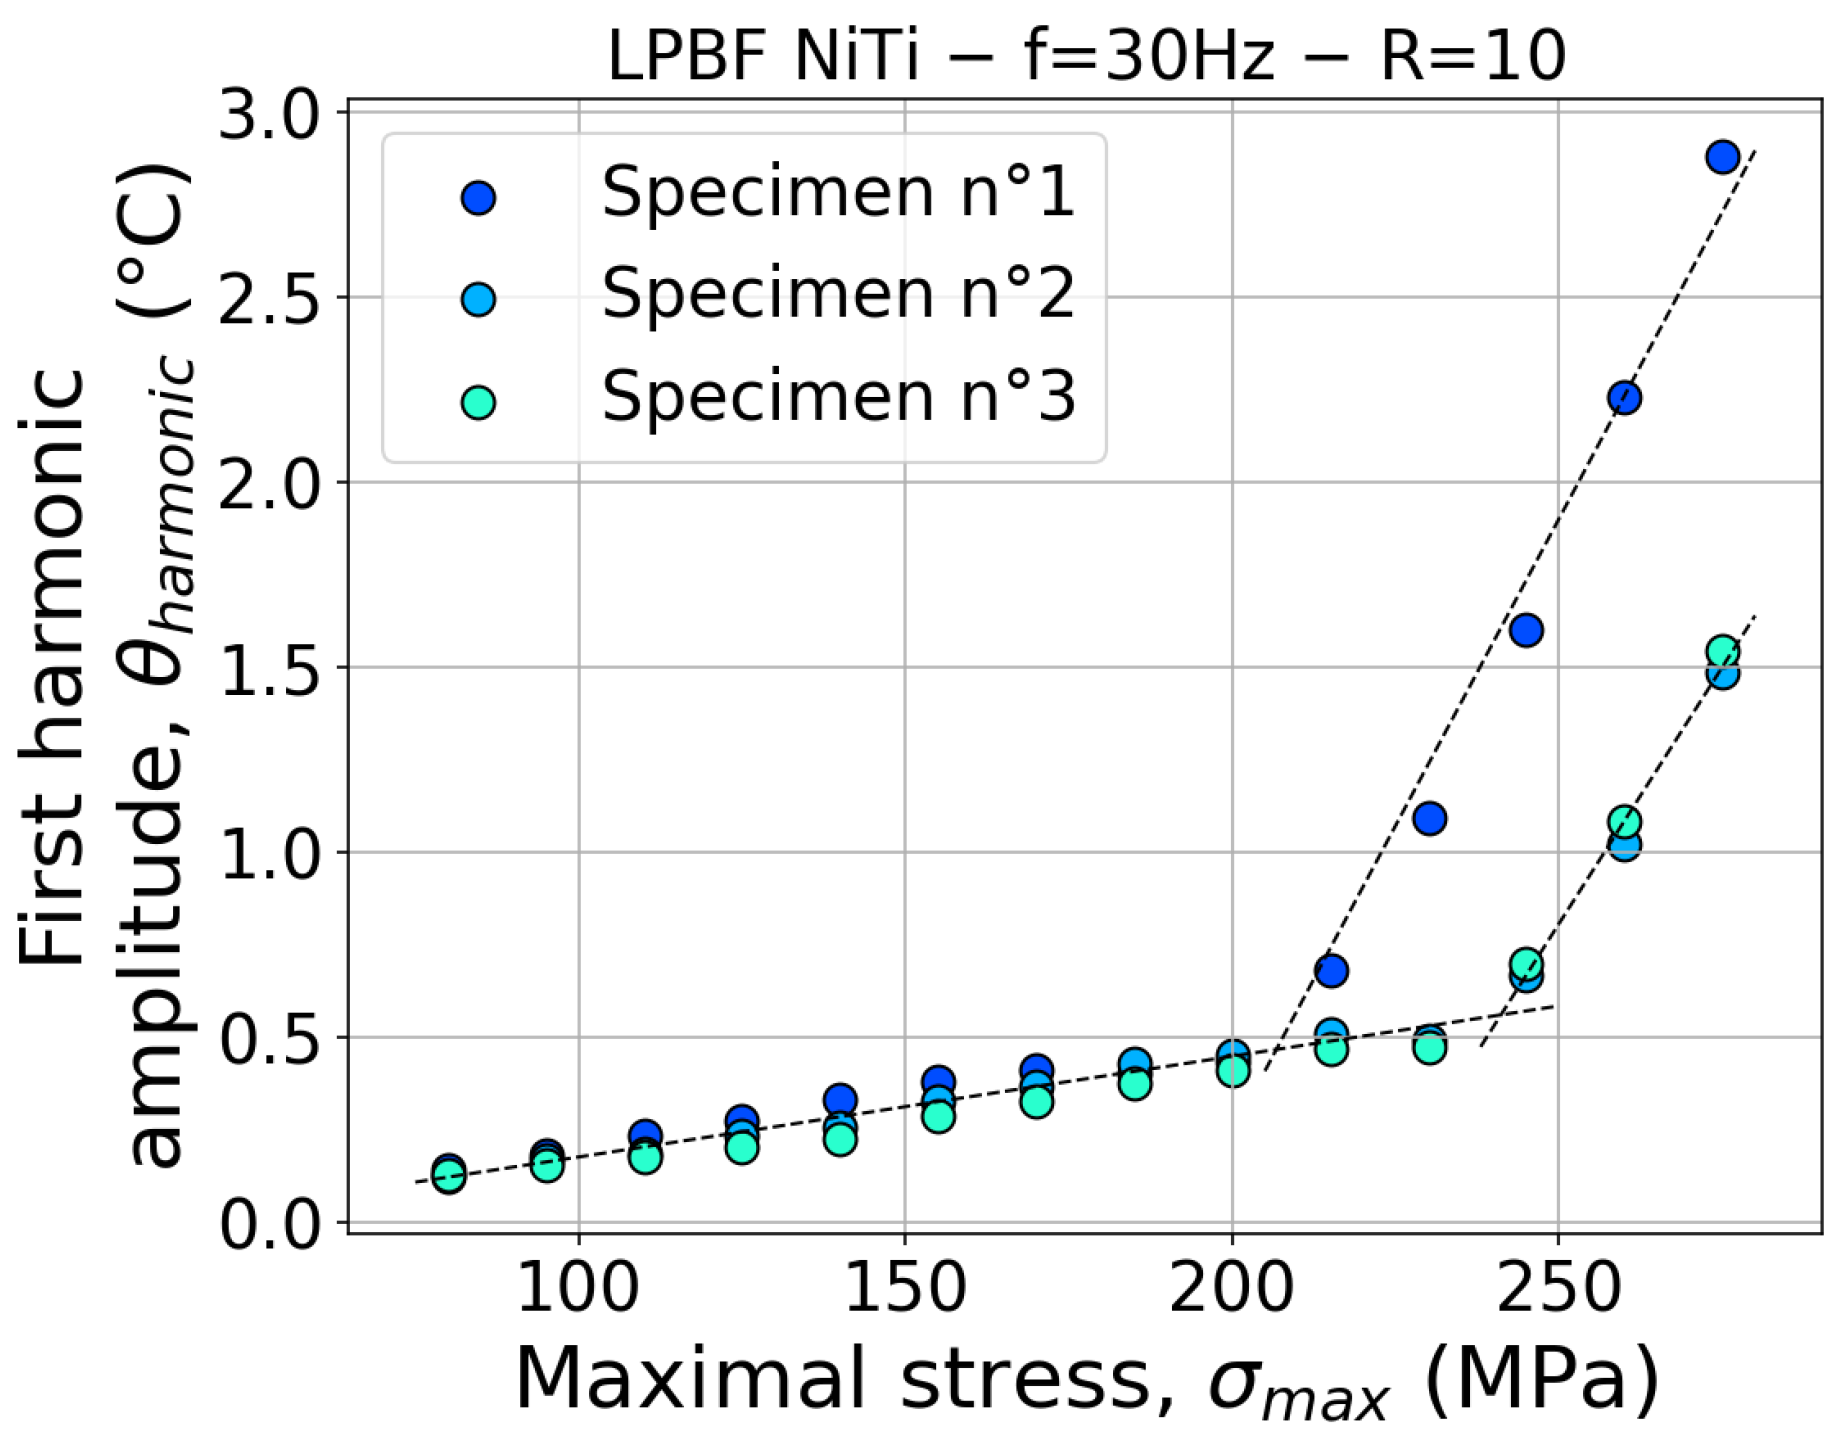
3.1. Cyclic Compression Loading
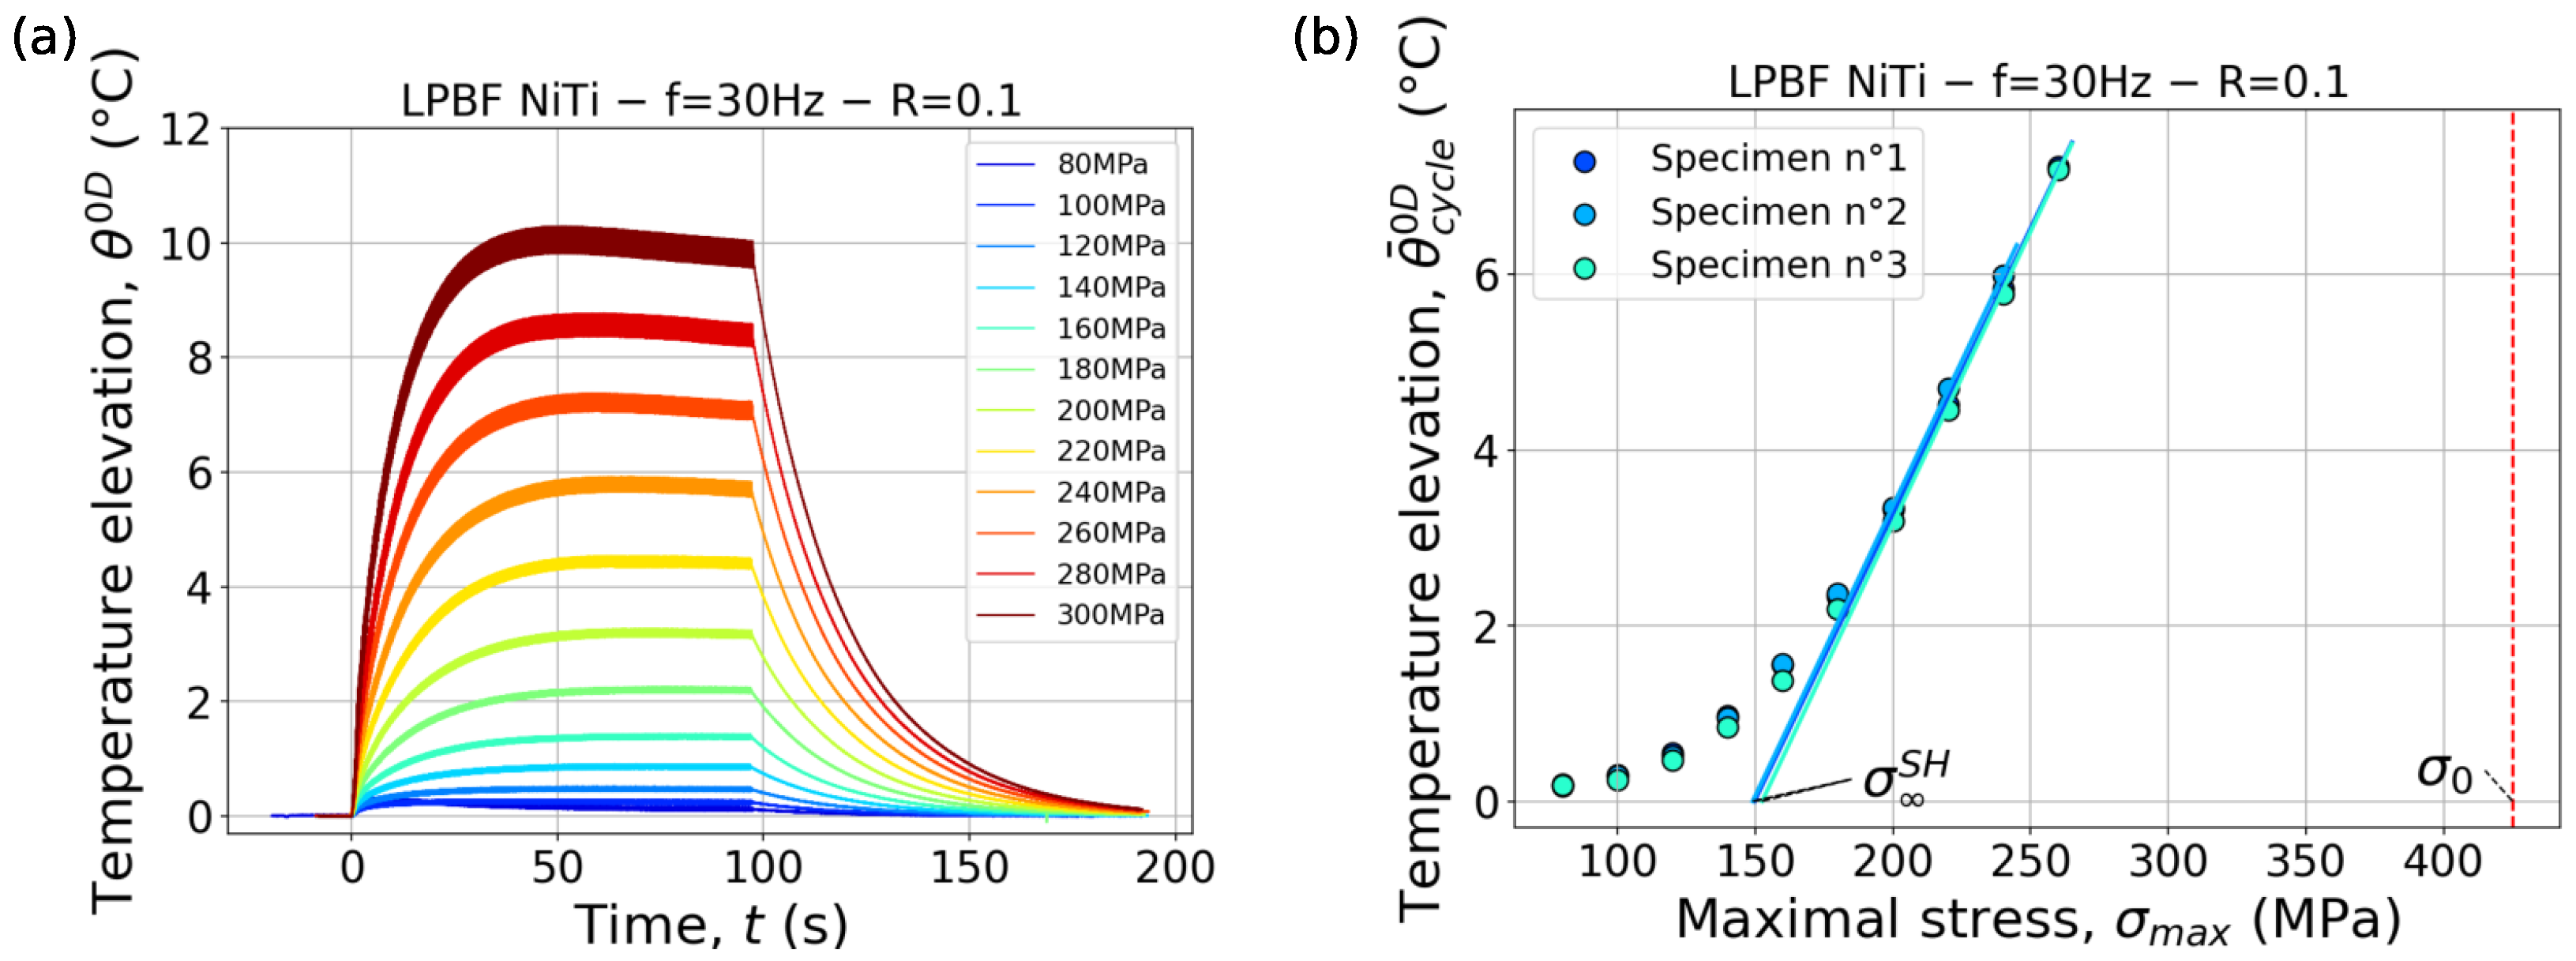
3.2. Cyclic Tensile Loading
4. Fatigue Assessment
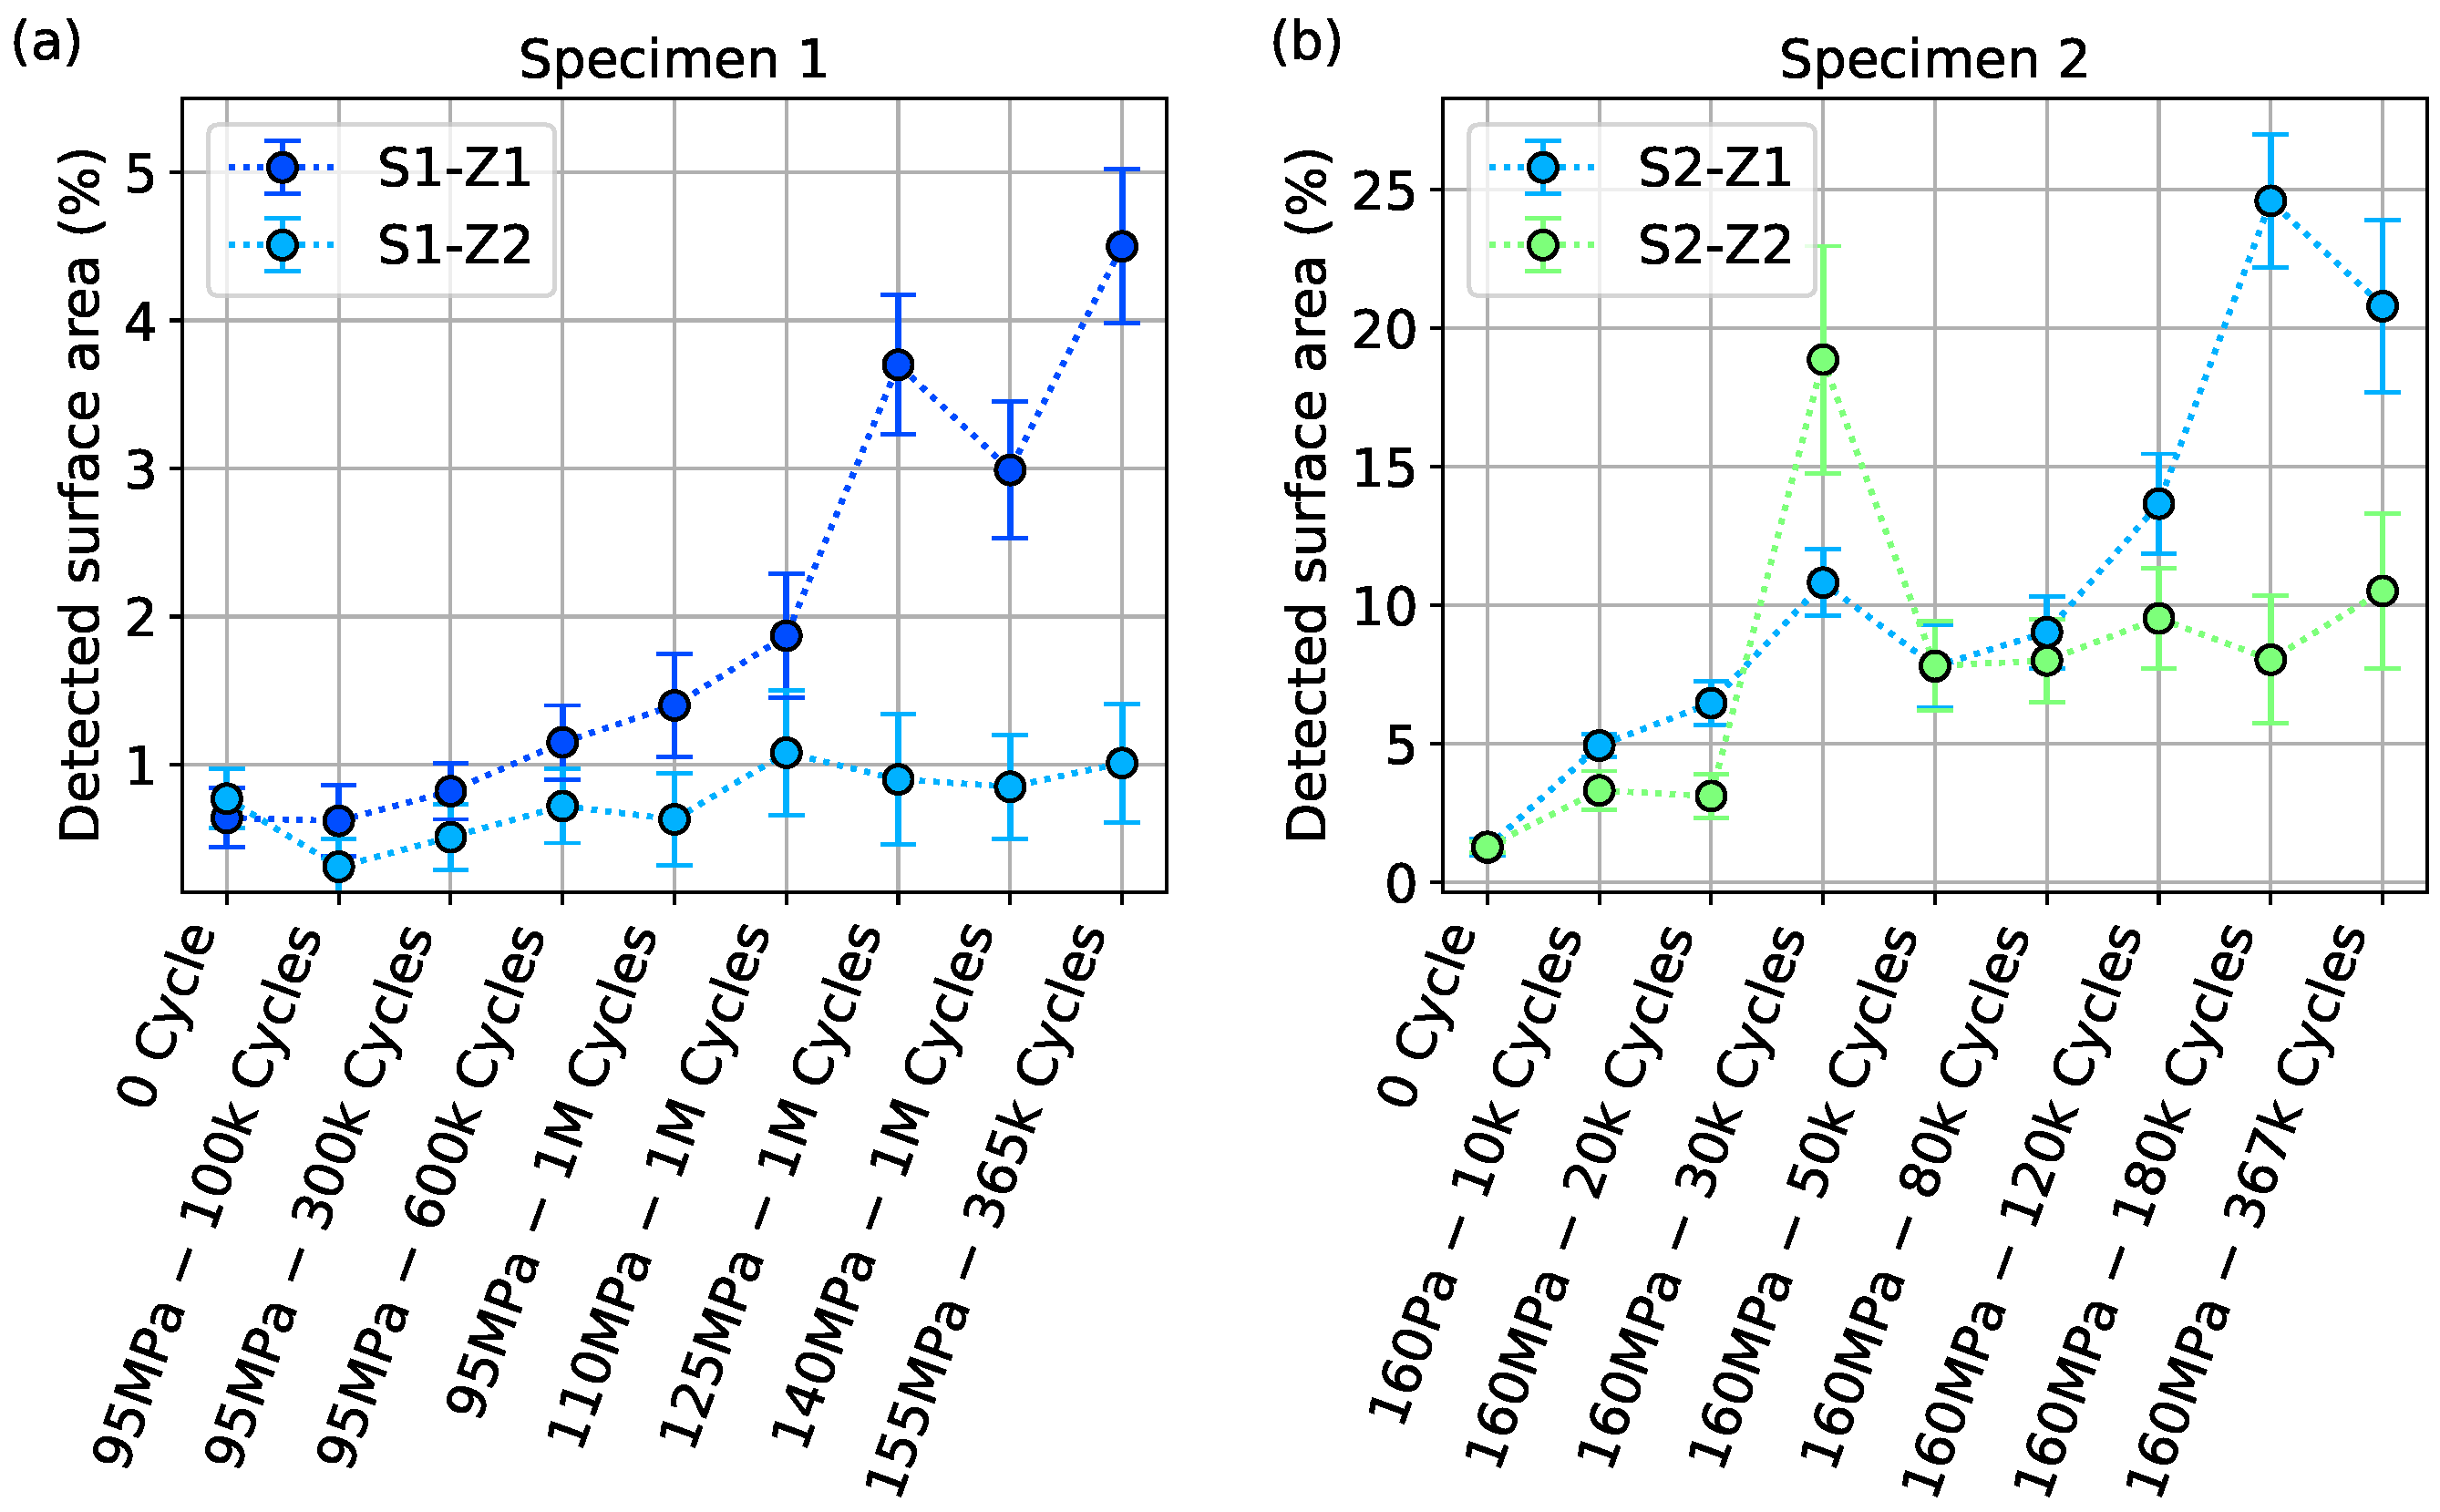
4.1. Fatigue Results
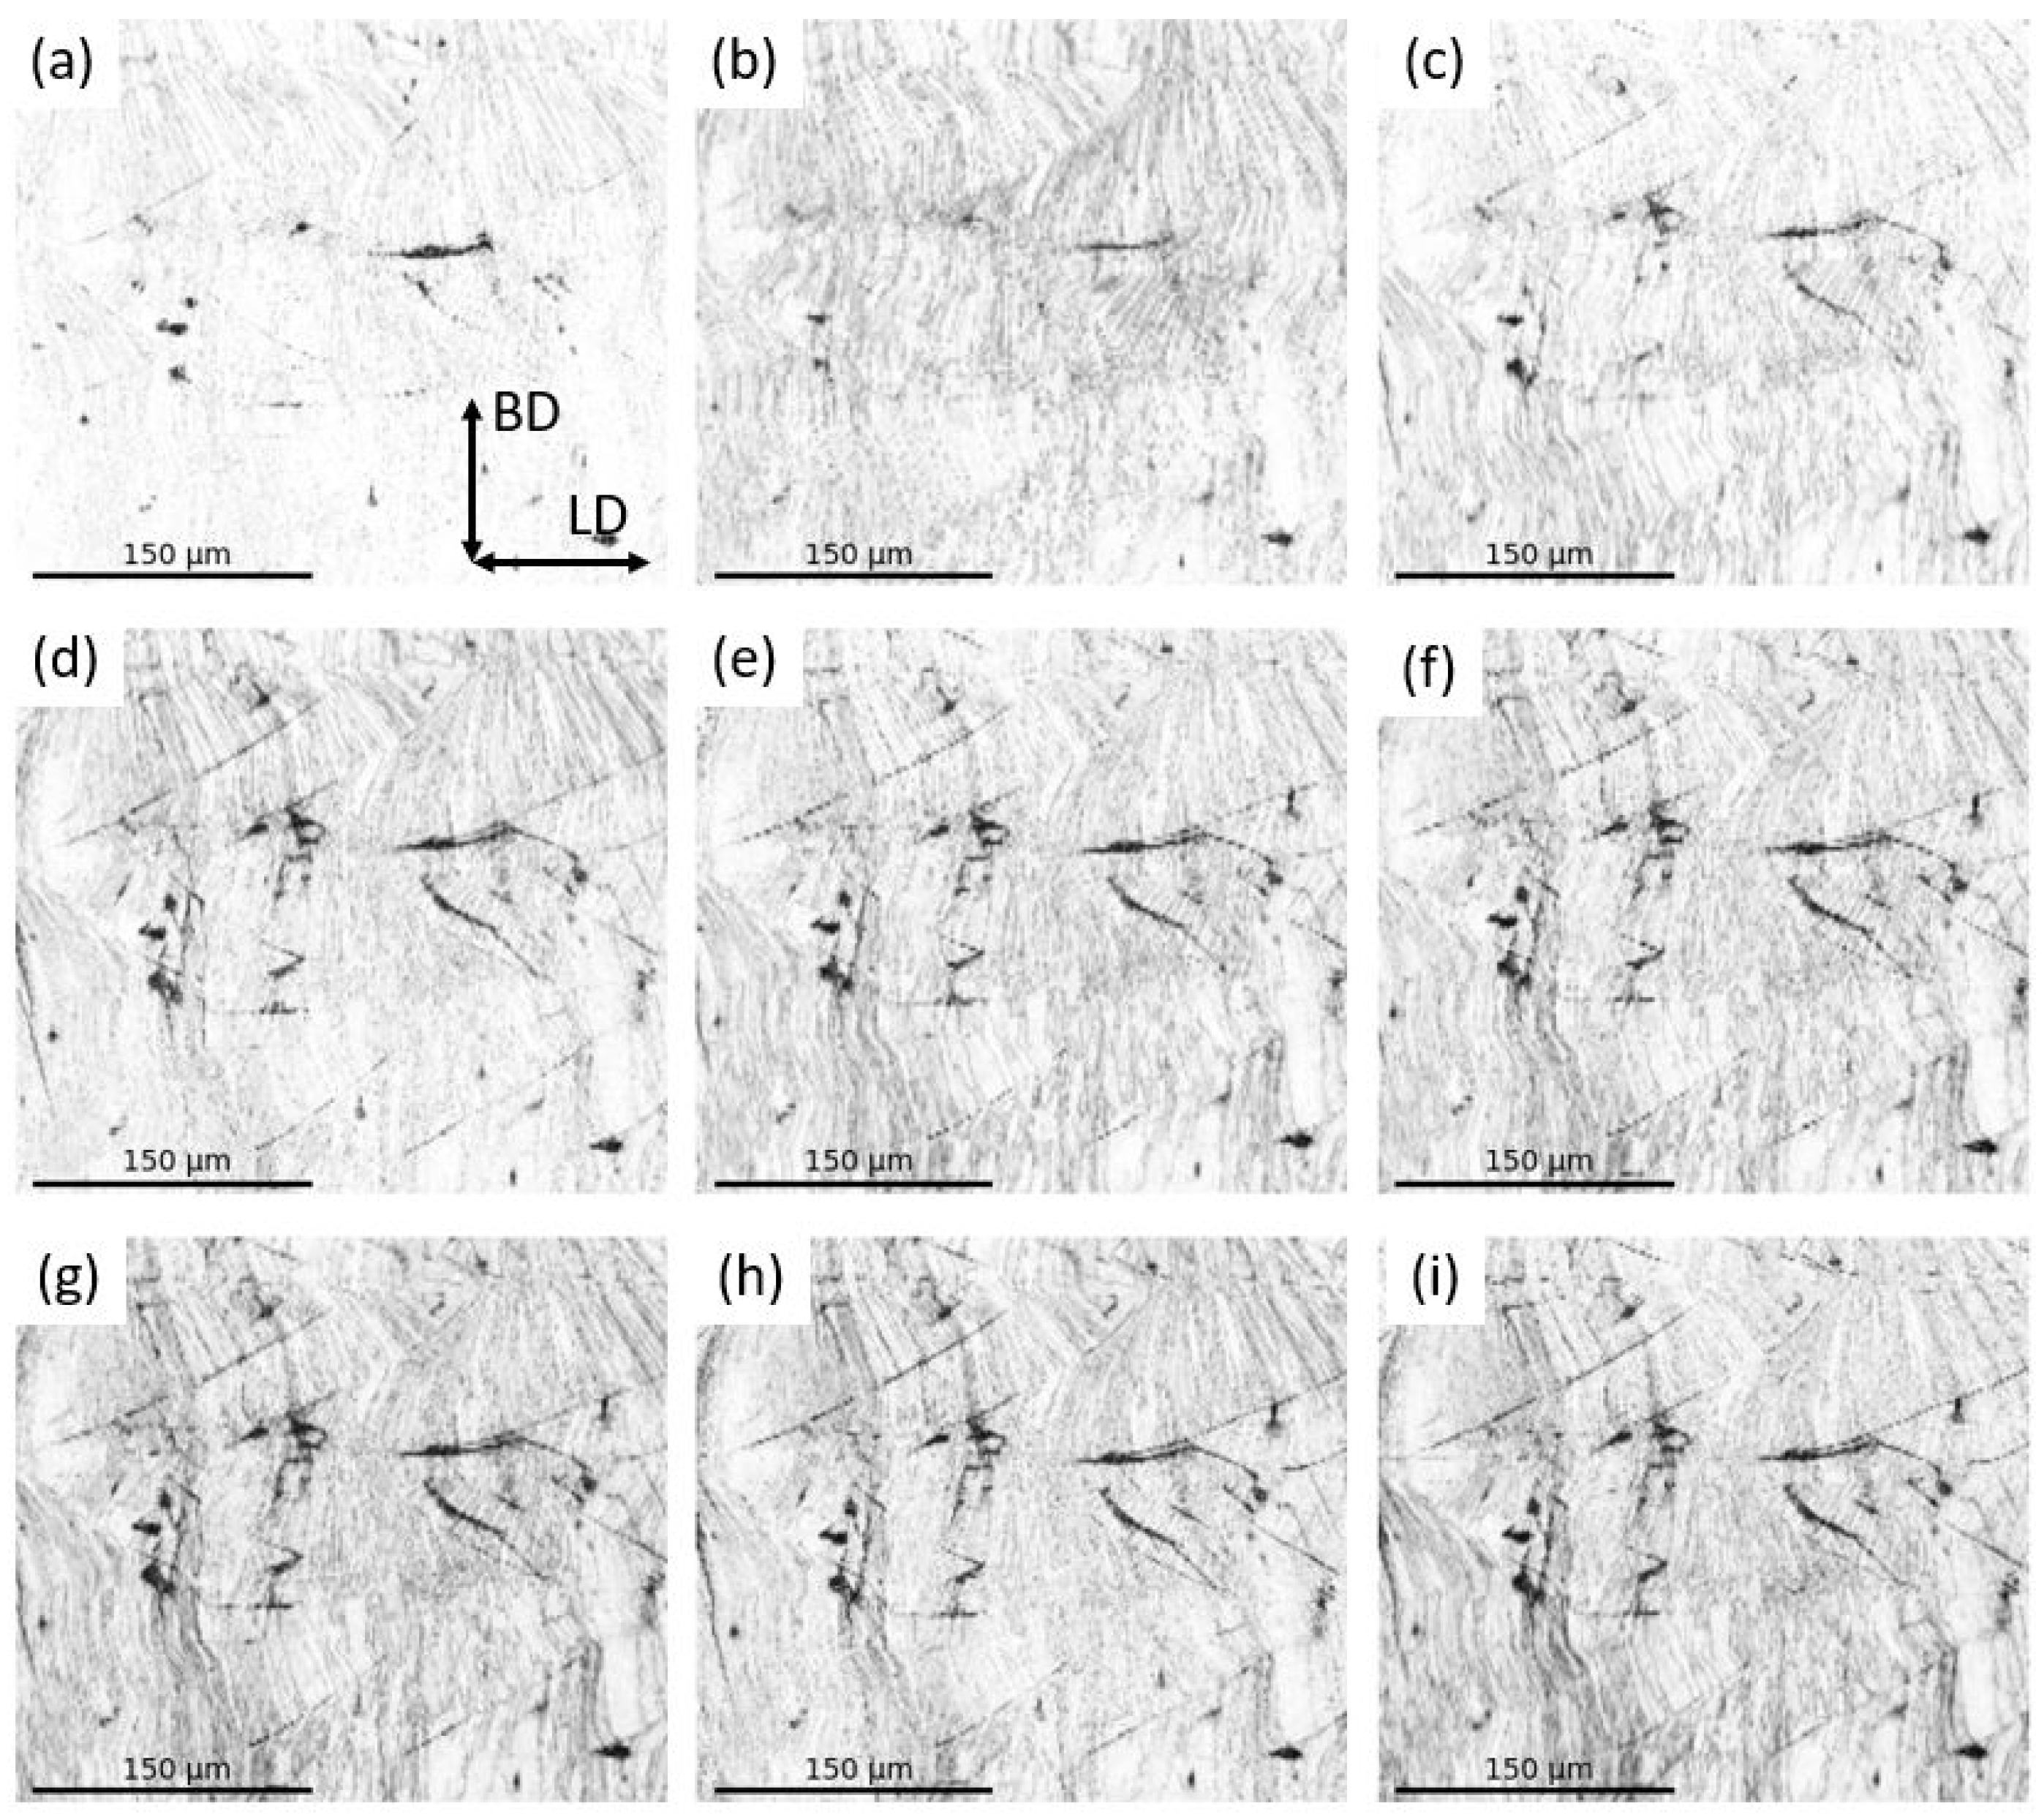
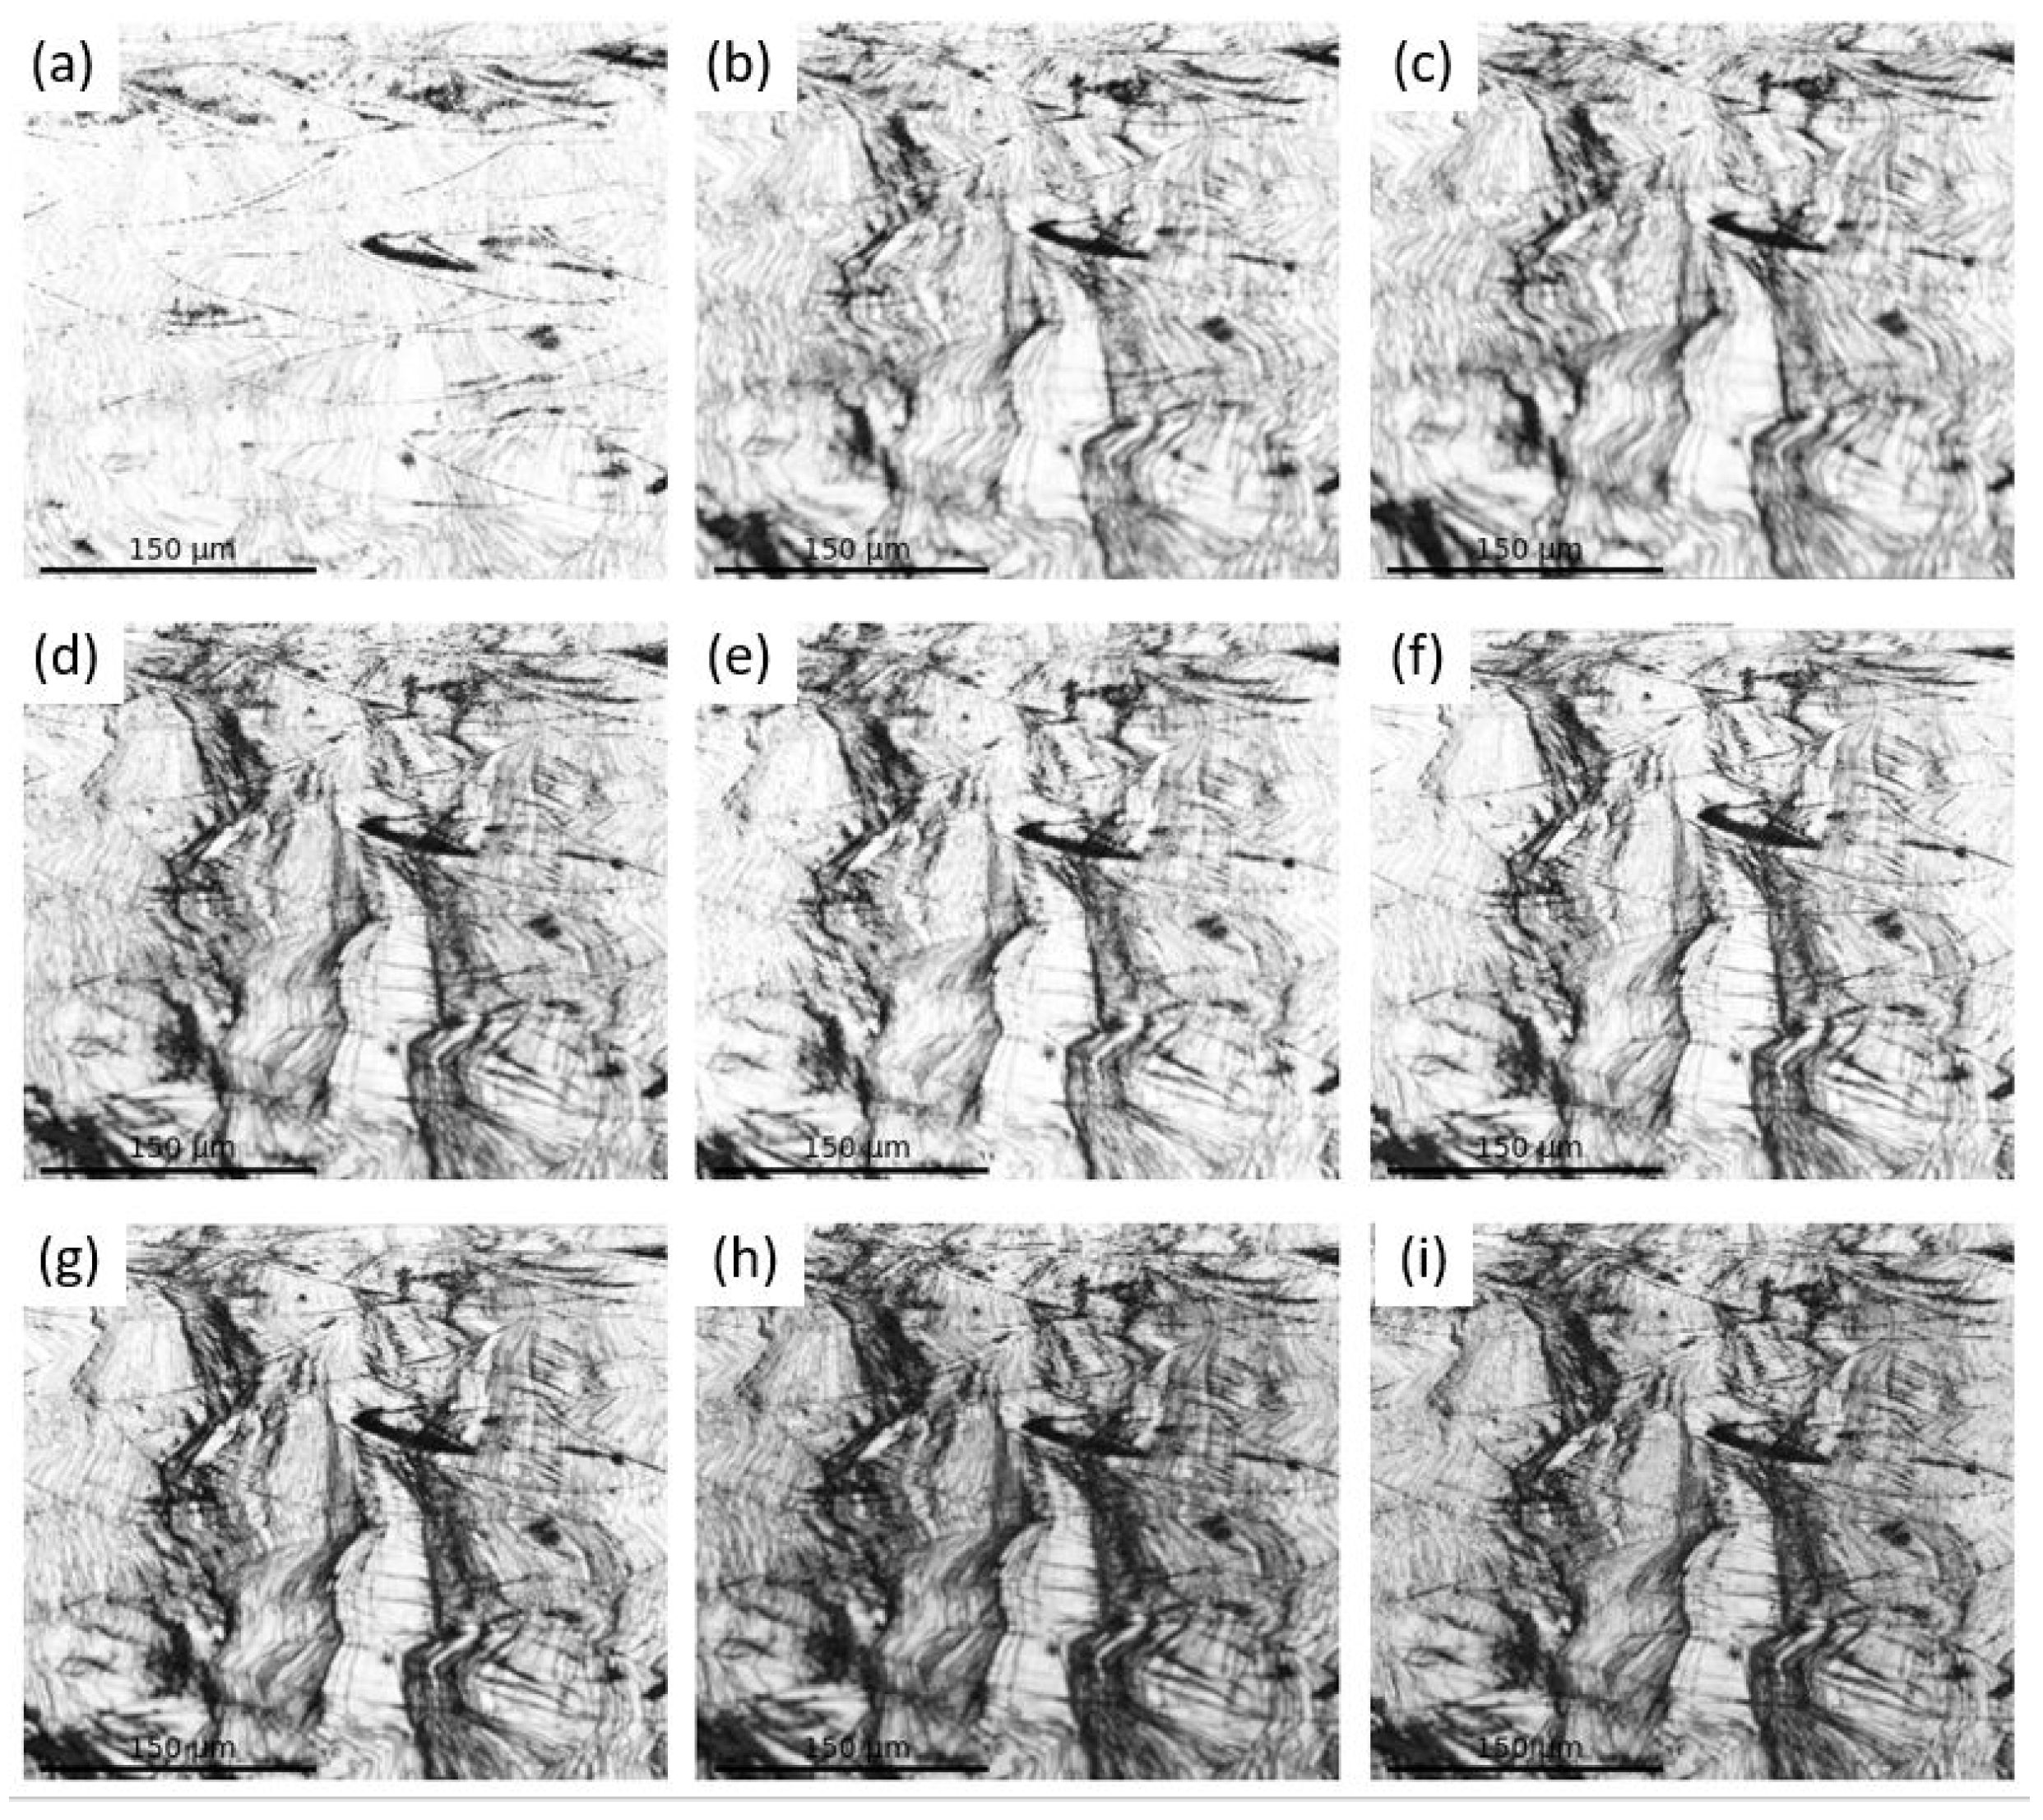
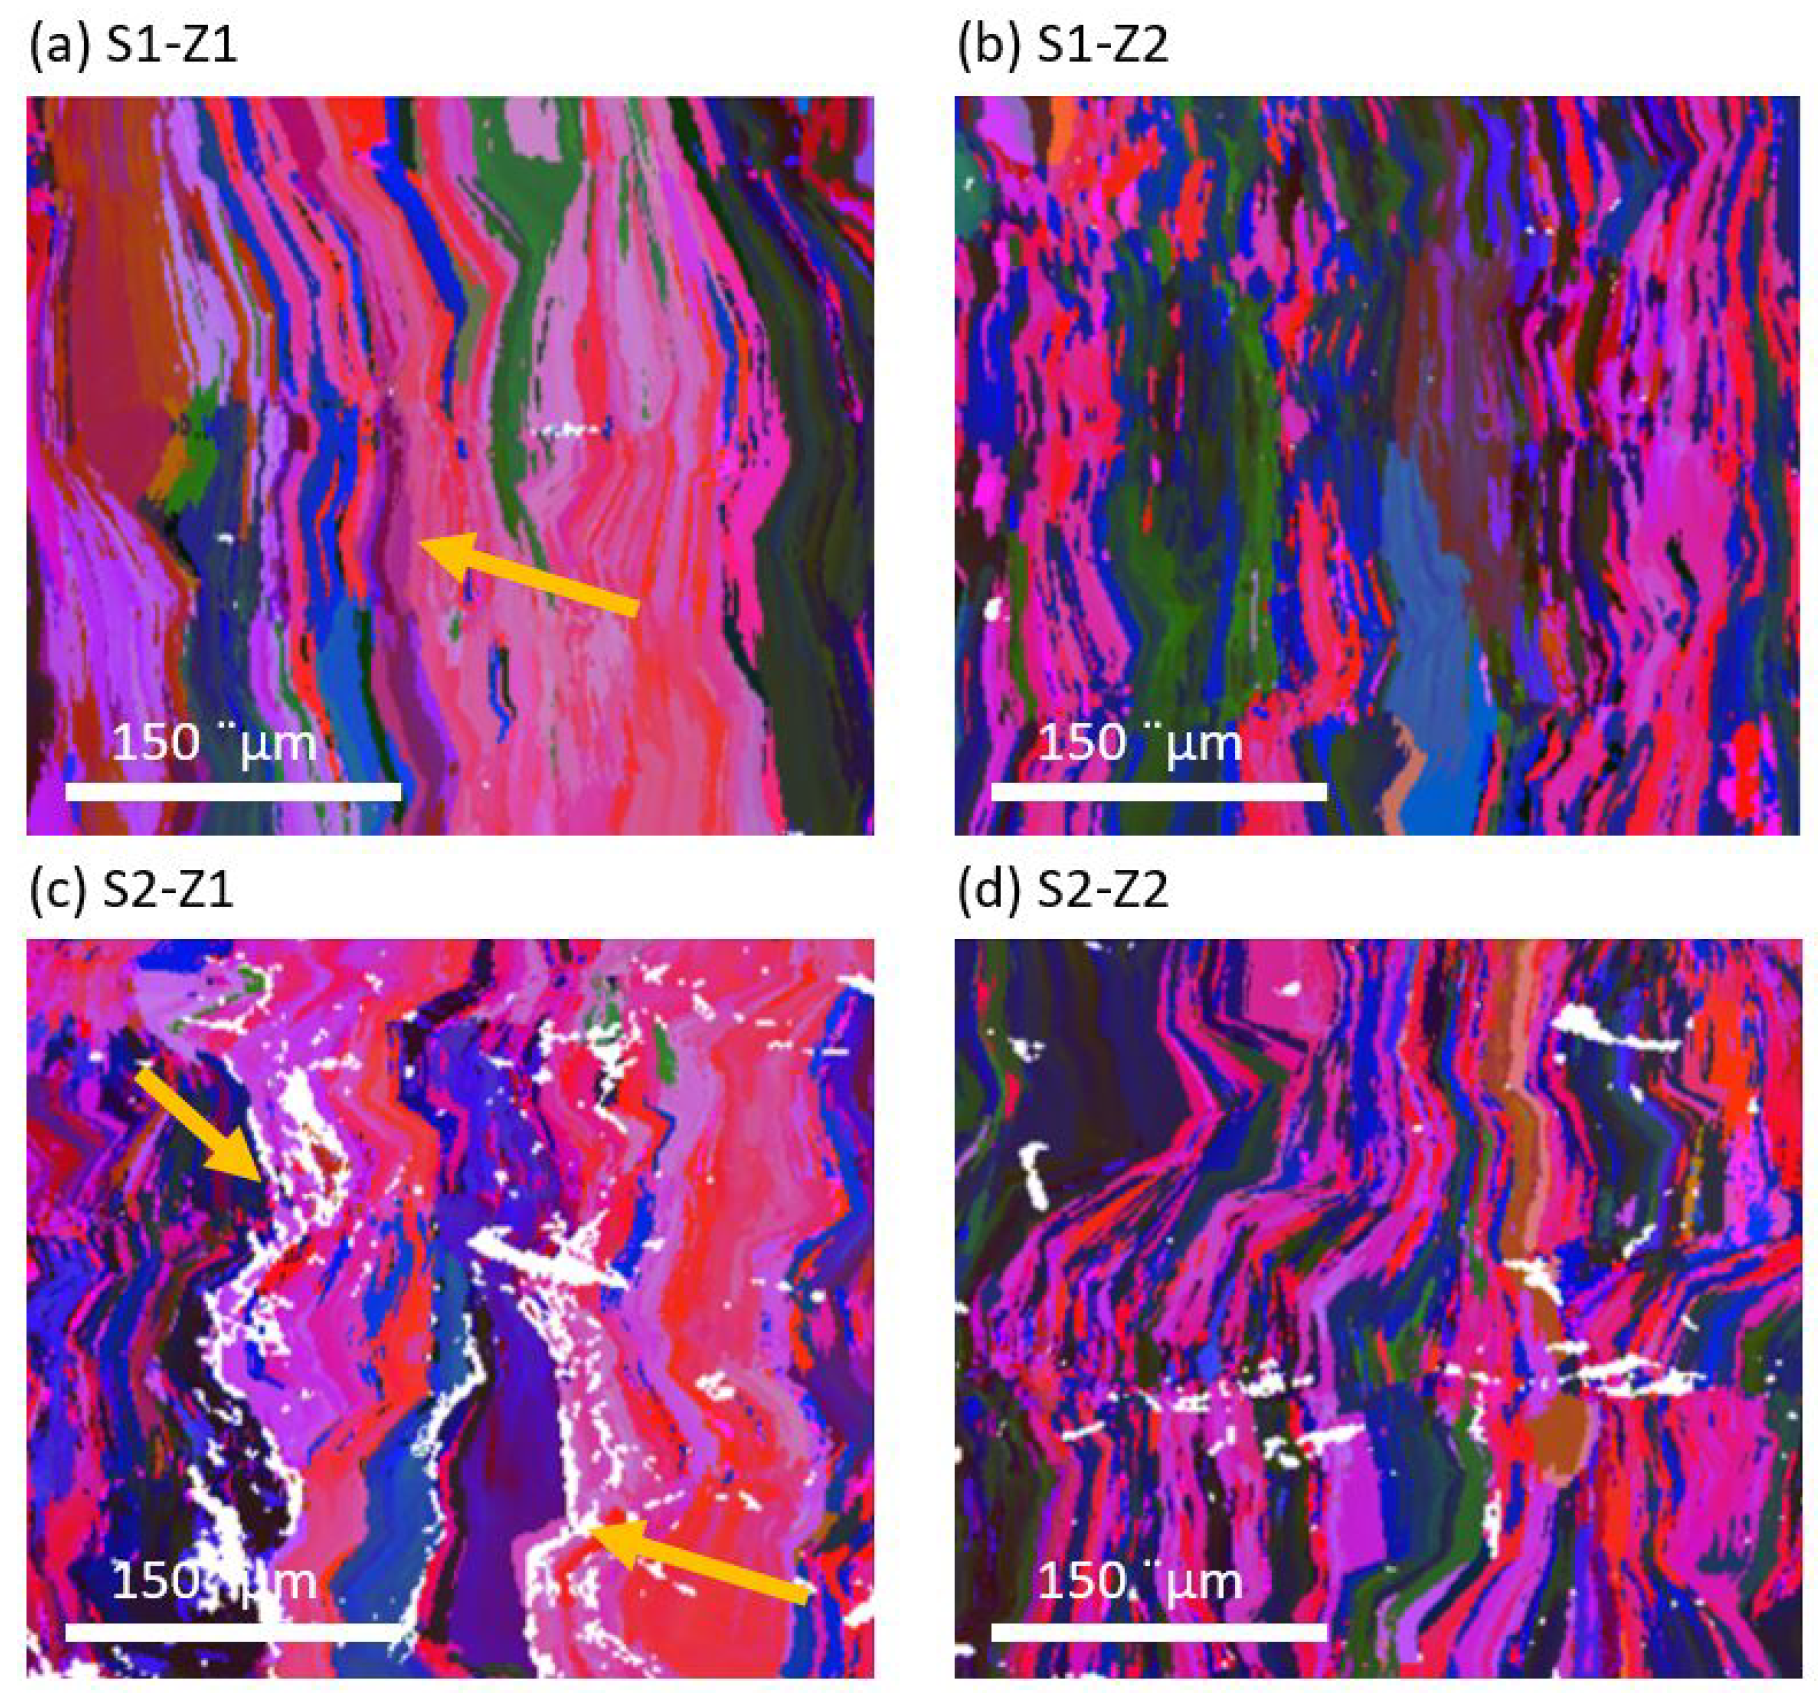
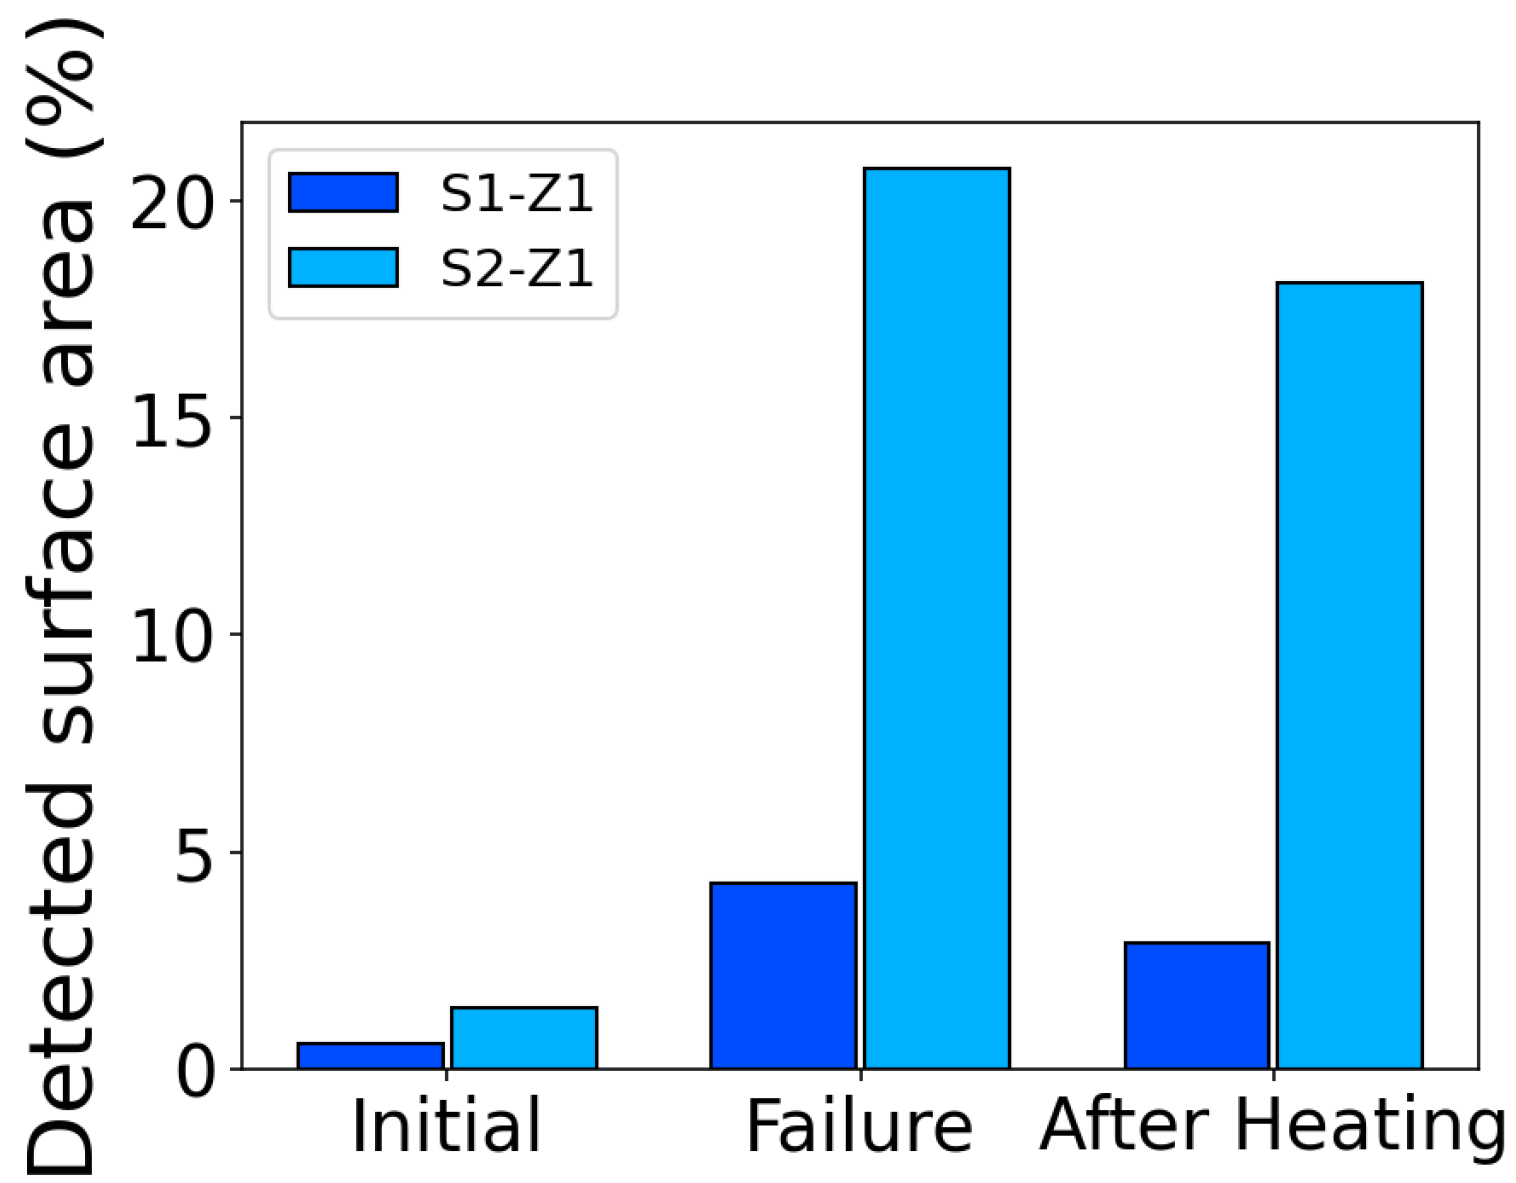
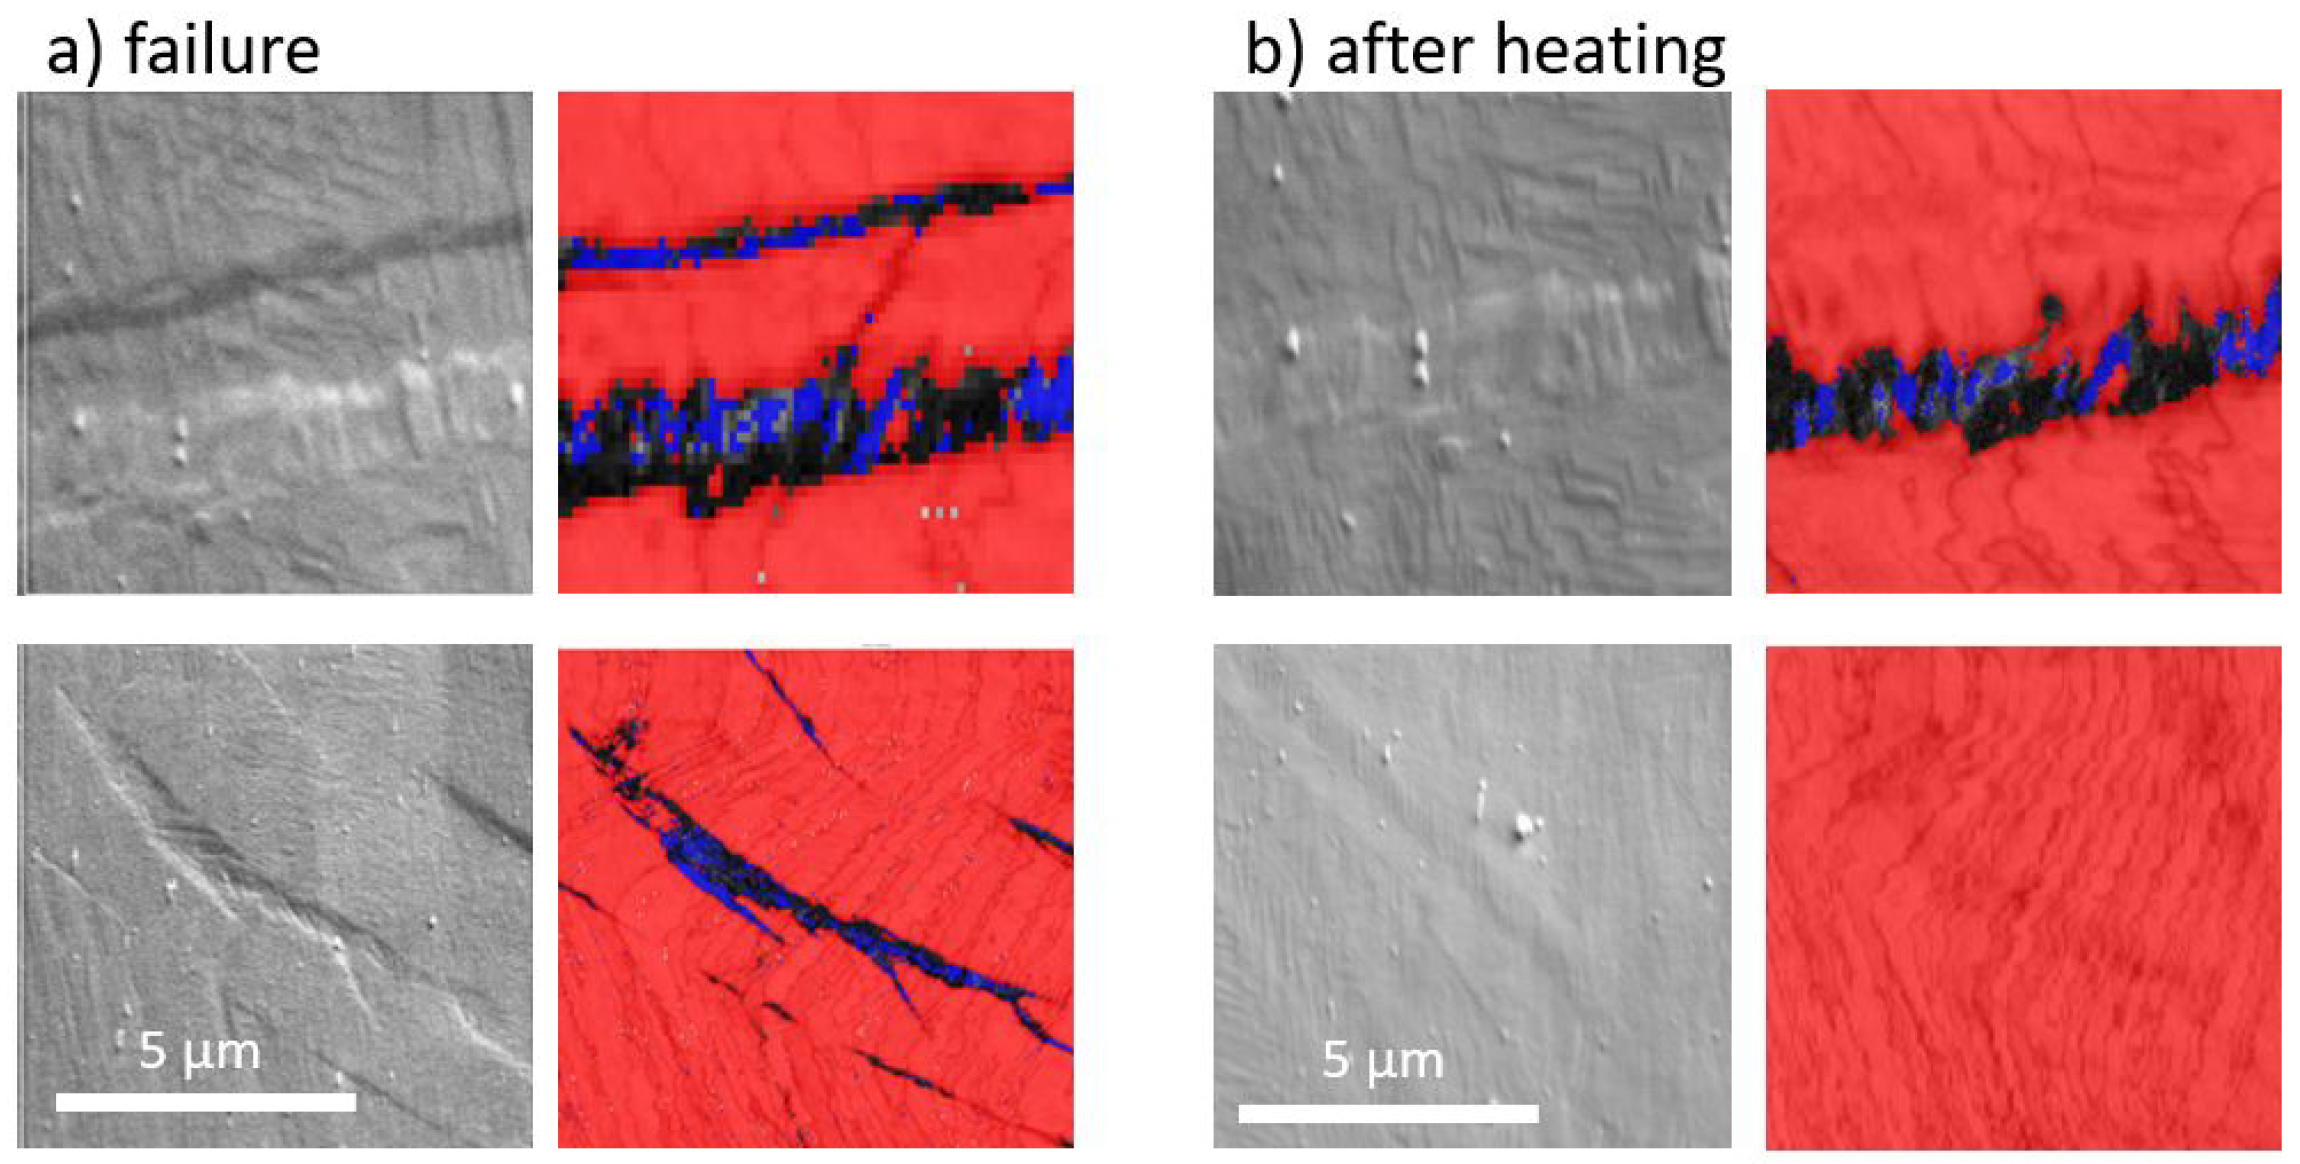
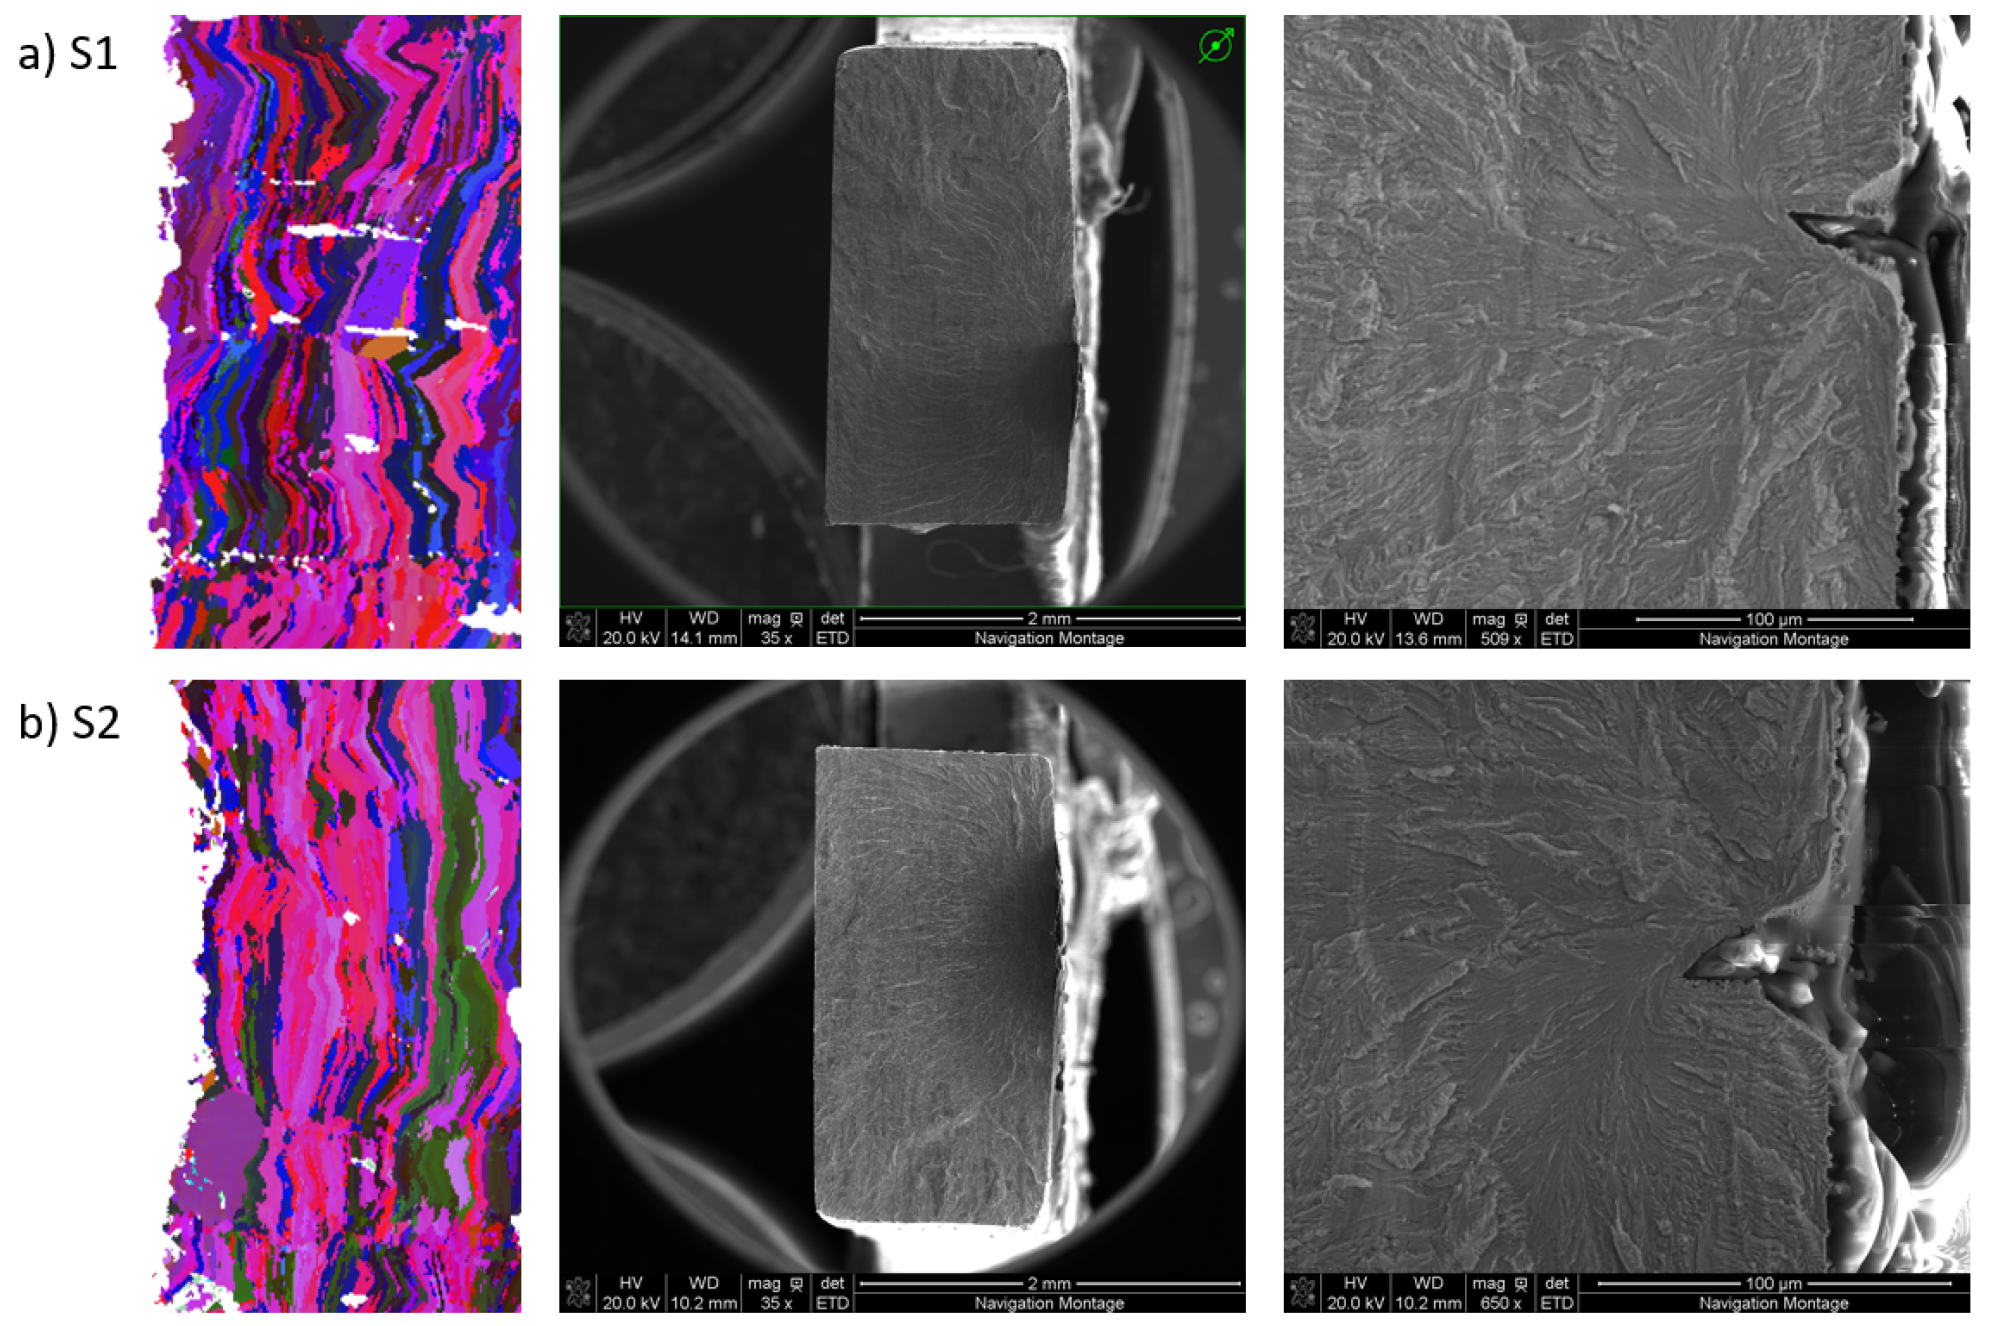
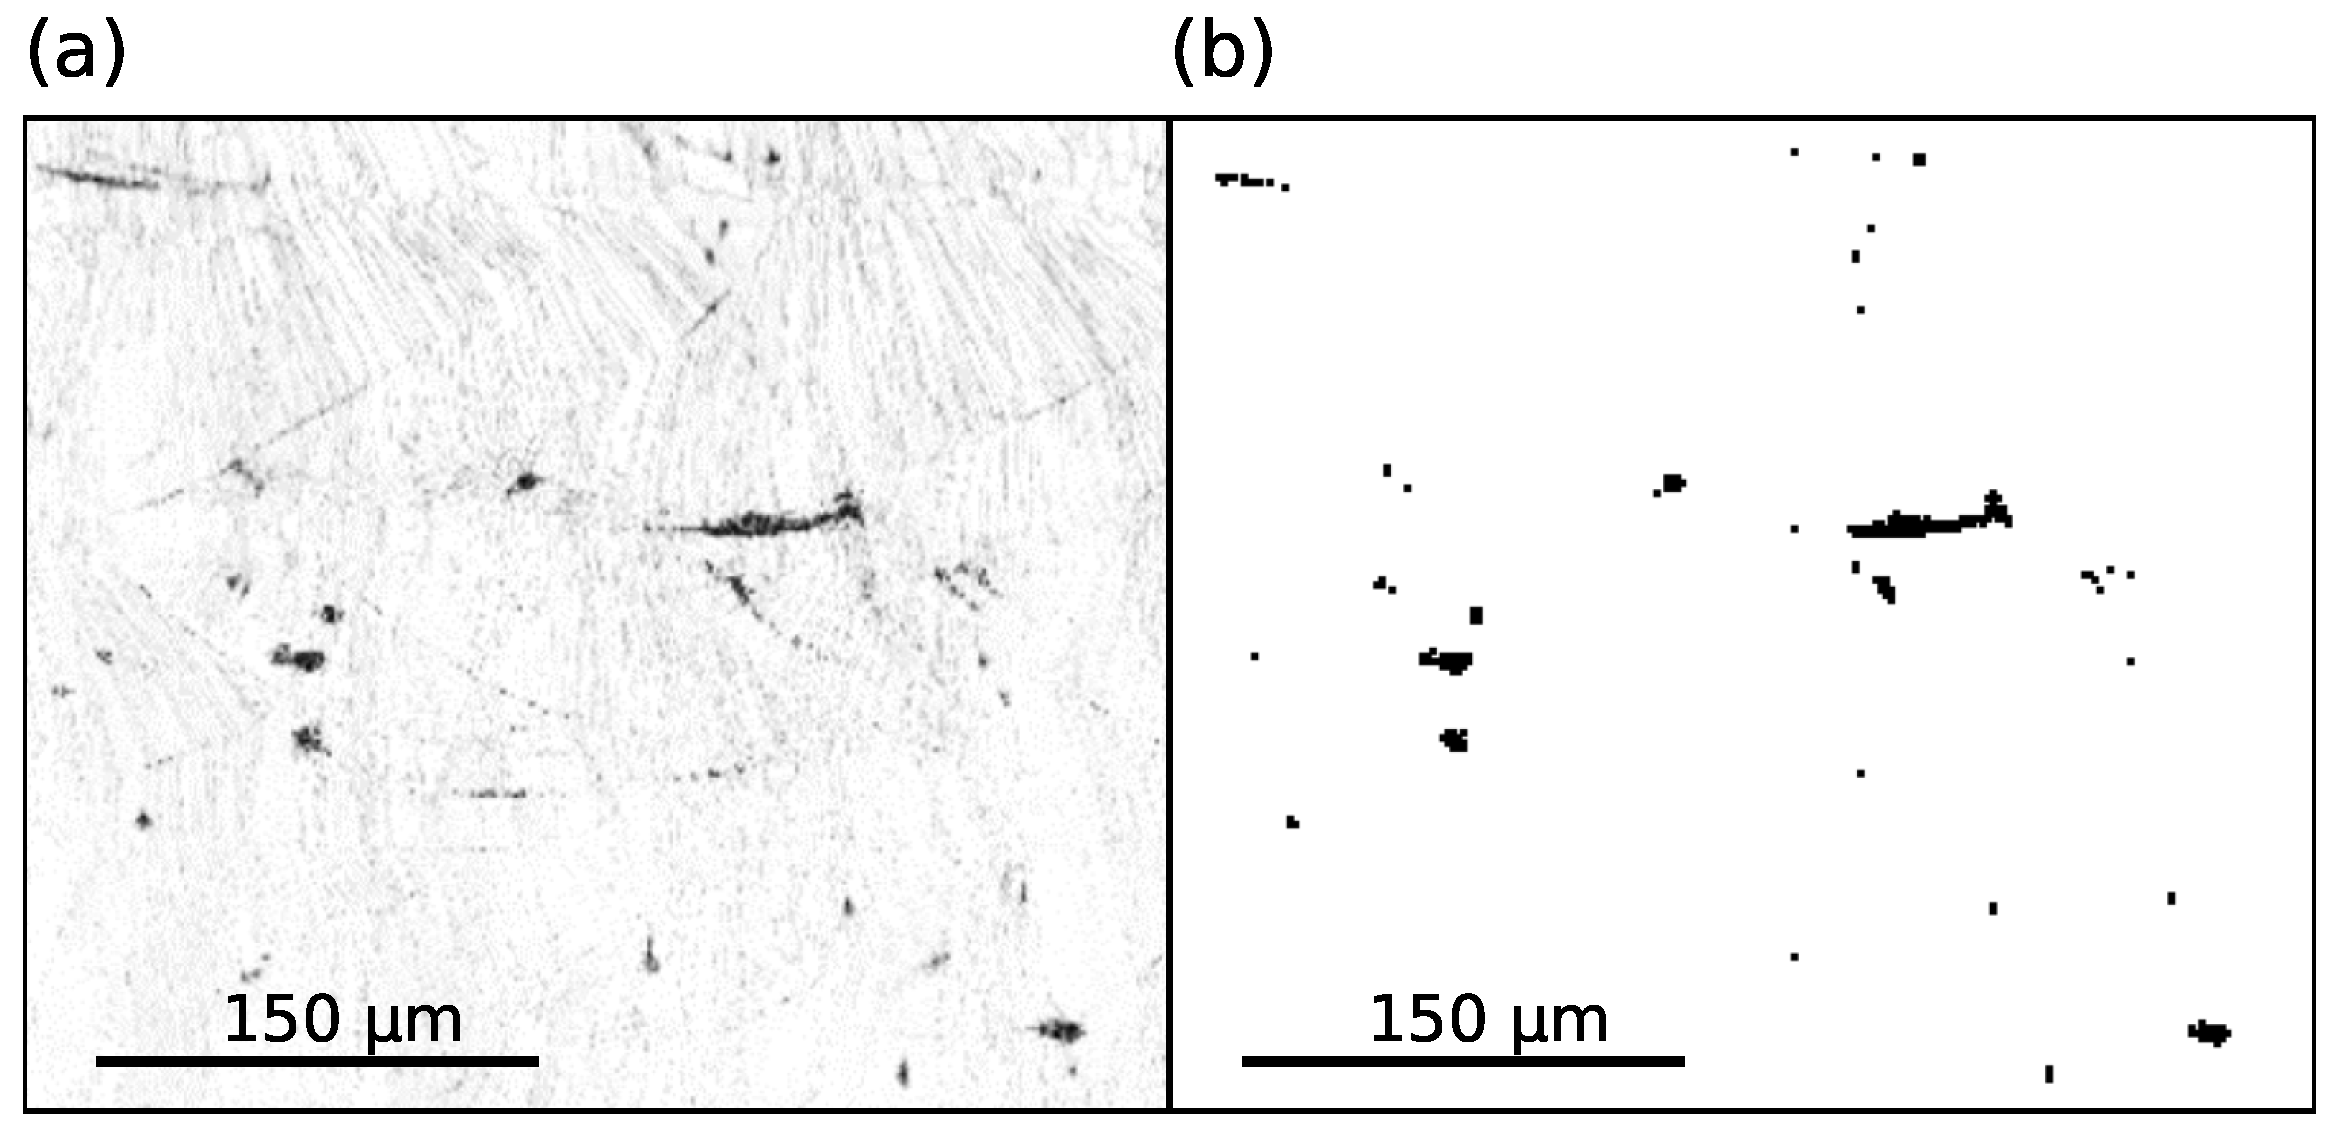
4.2. Microstructure Evolution
4.3. Mechanisms Identification
5. Conclusions and Perspectives
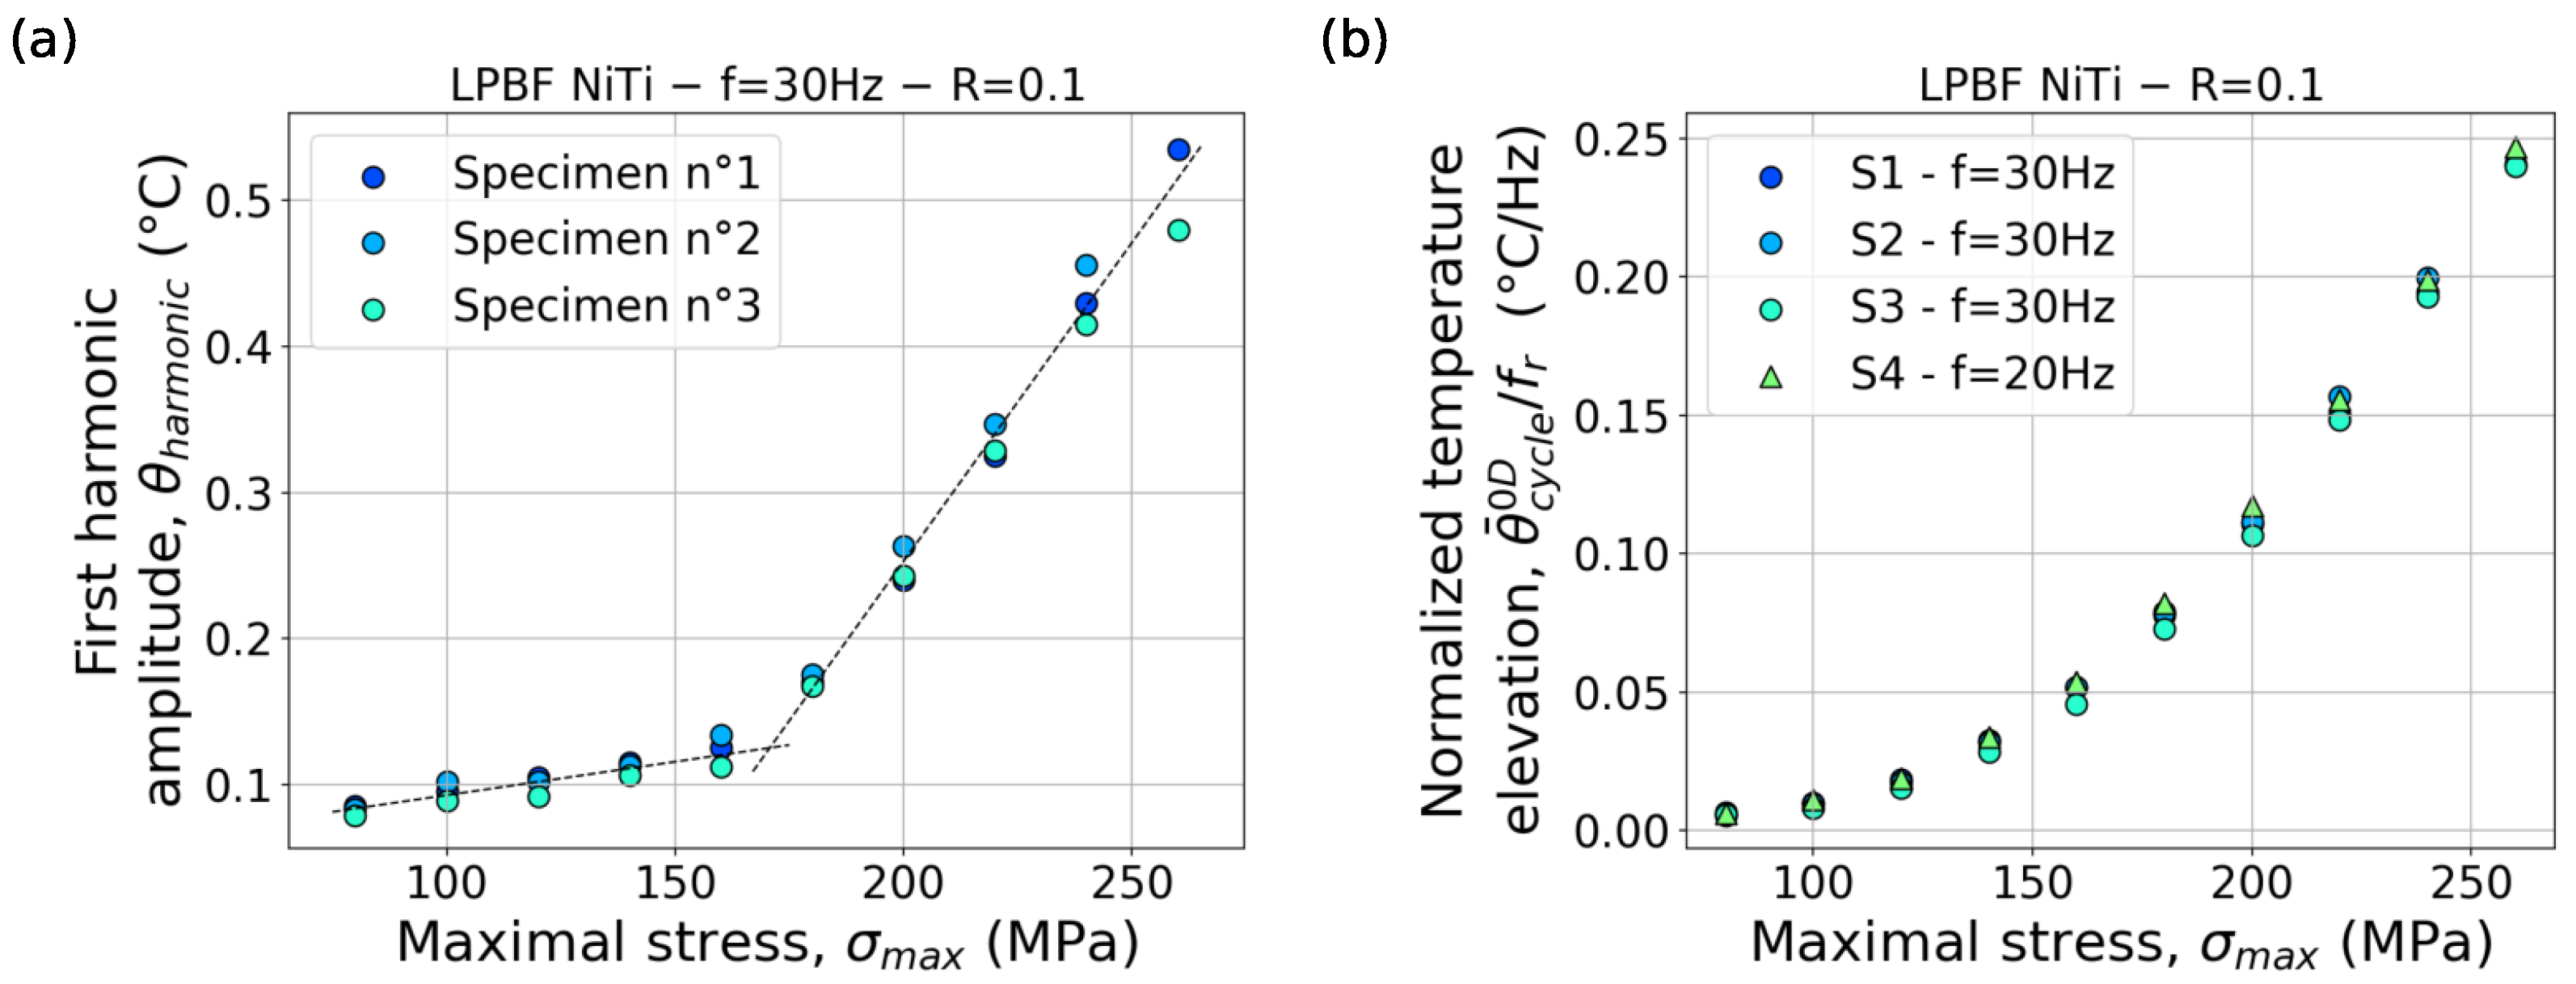
- The self-heating behavior of LPBF-NiTi was investigated for the first time, revealing relatively similar results regardless of the loading ratio. It was observed that, with the selected frequency and when the maximum stress remained lower than the phase transformation limit, micro-phase transformation at lower scale may occur at stress levels from 240 MPa in compression and 165 MPa in tension, inducing the increase in the amplitude of the first harmonic.
- The self-heating method demonstrated a consistency in repeated tests. The endurance limit at 1 million cycles was reported empirically at 150 MPa in tensile loading. This value was compared to the value obtained from classical fatigue results, revealing a significant discrepancy. Consequently, any conclusions drawn about the relationship between self-heating and HCF should be approached with caution.
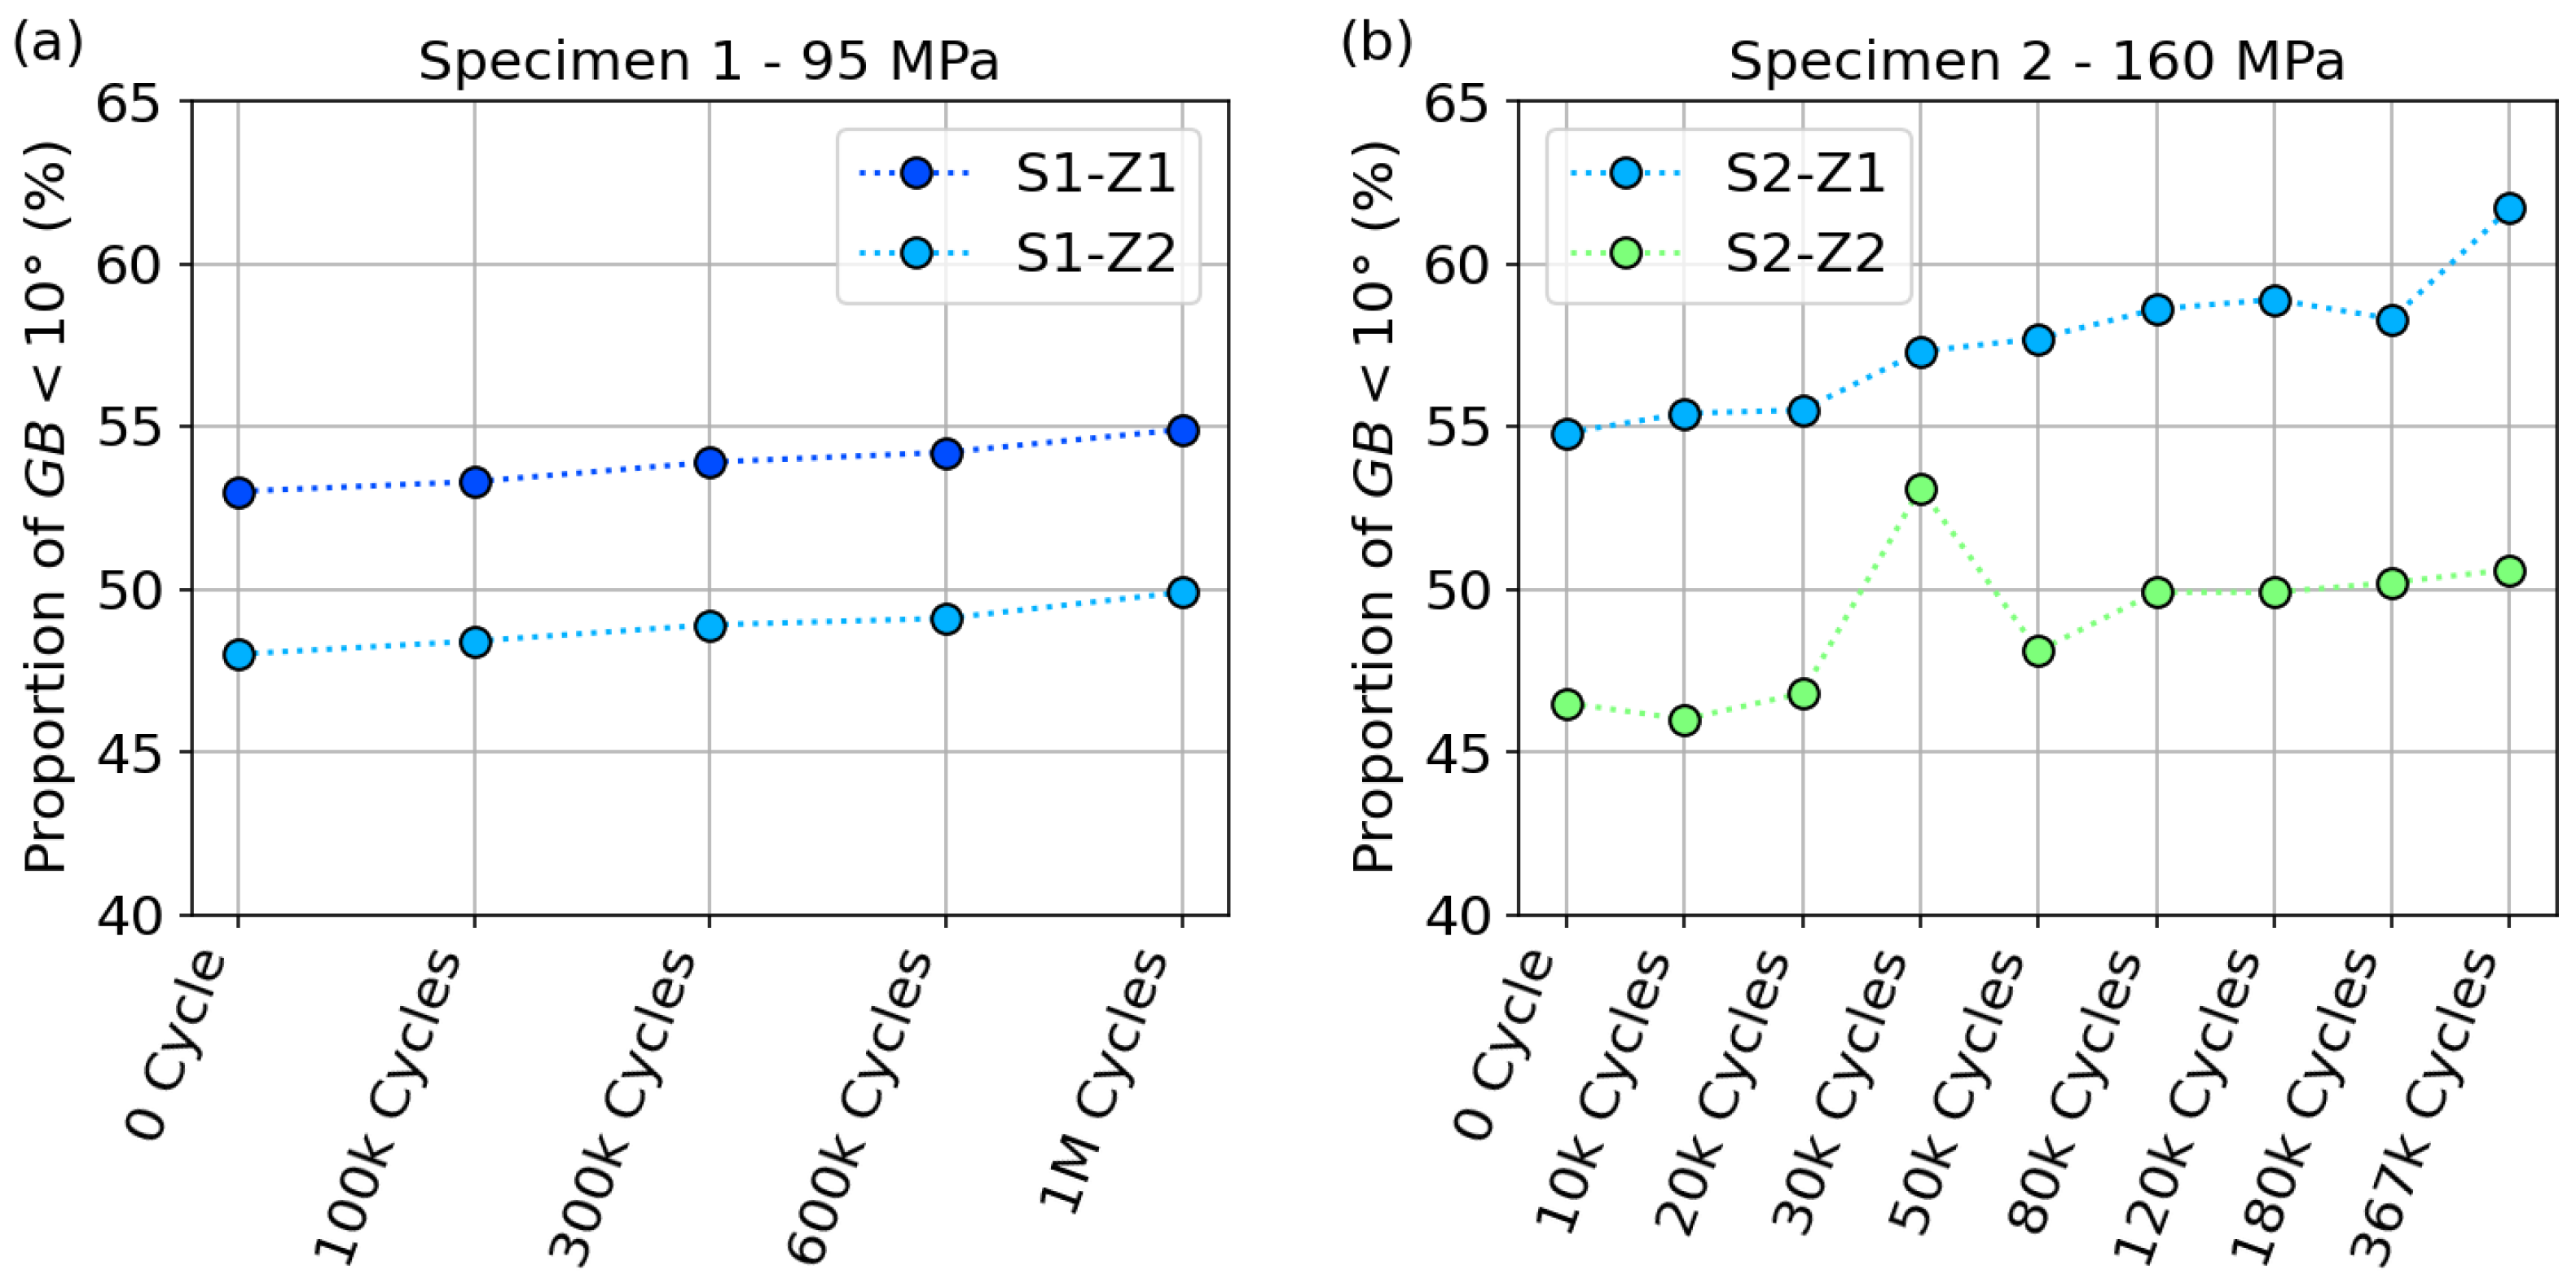
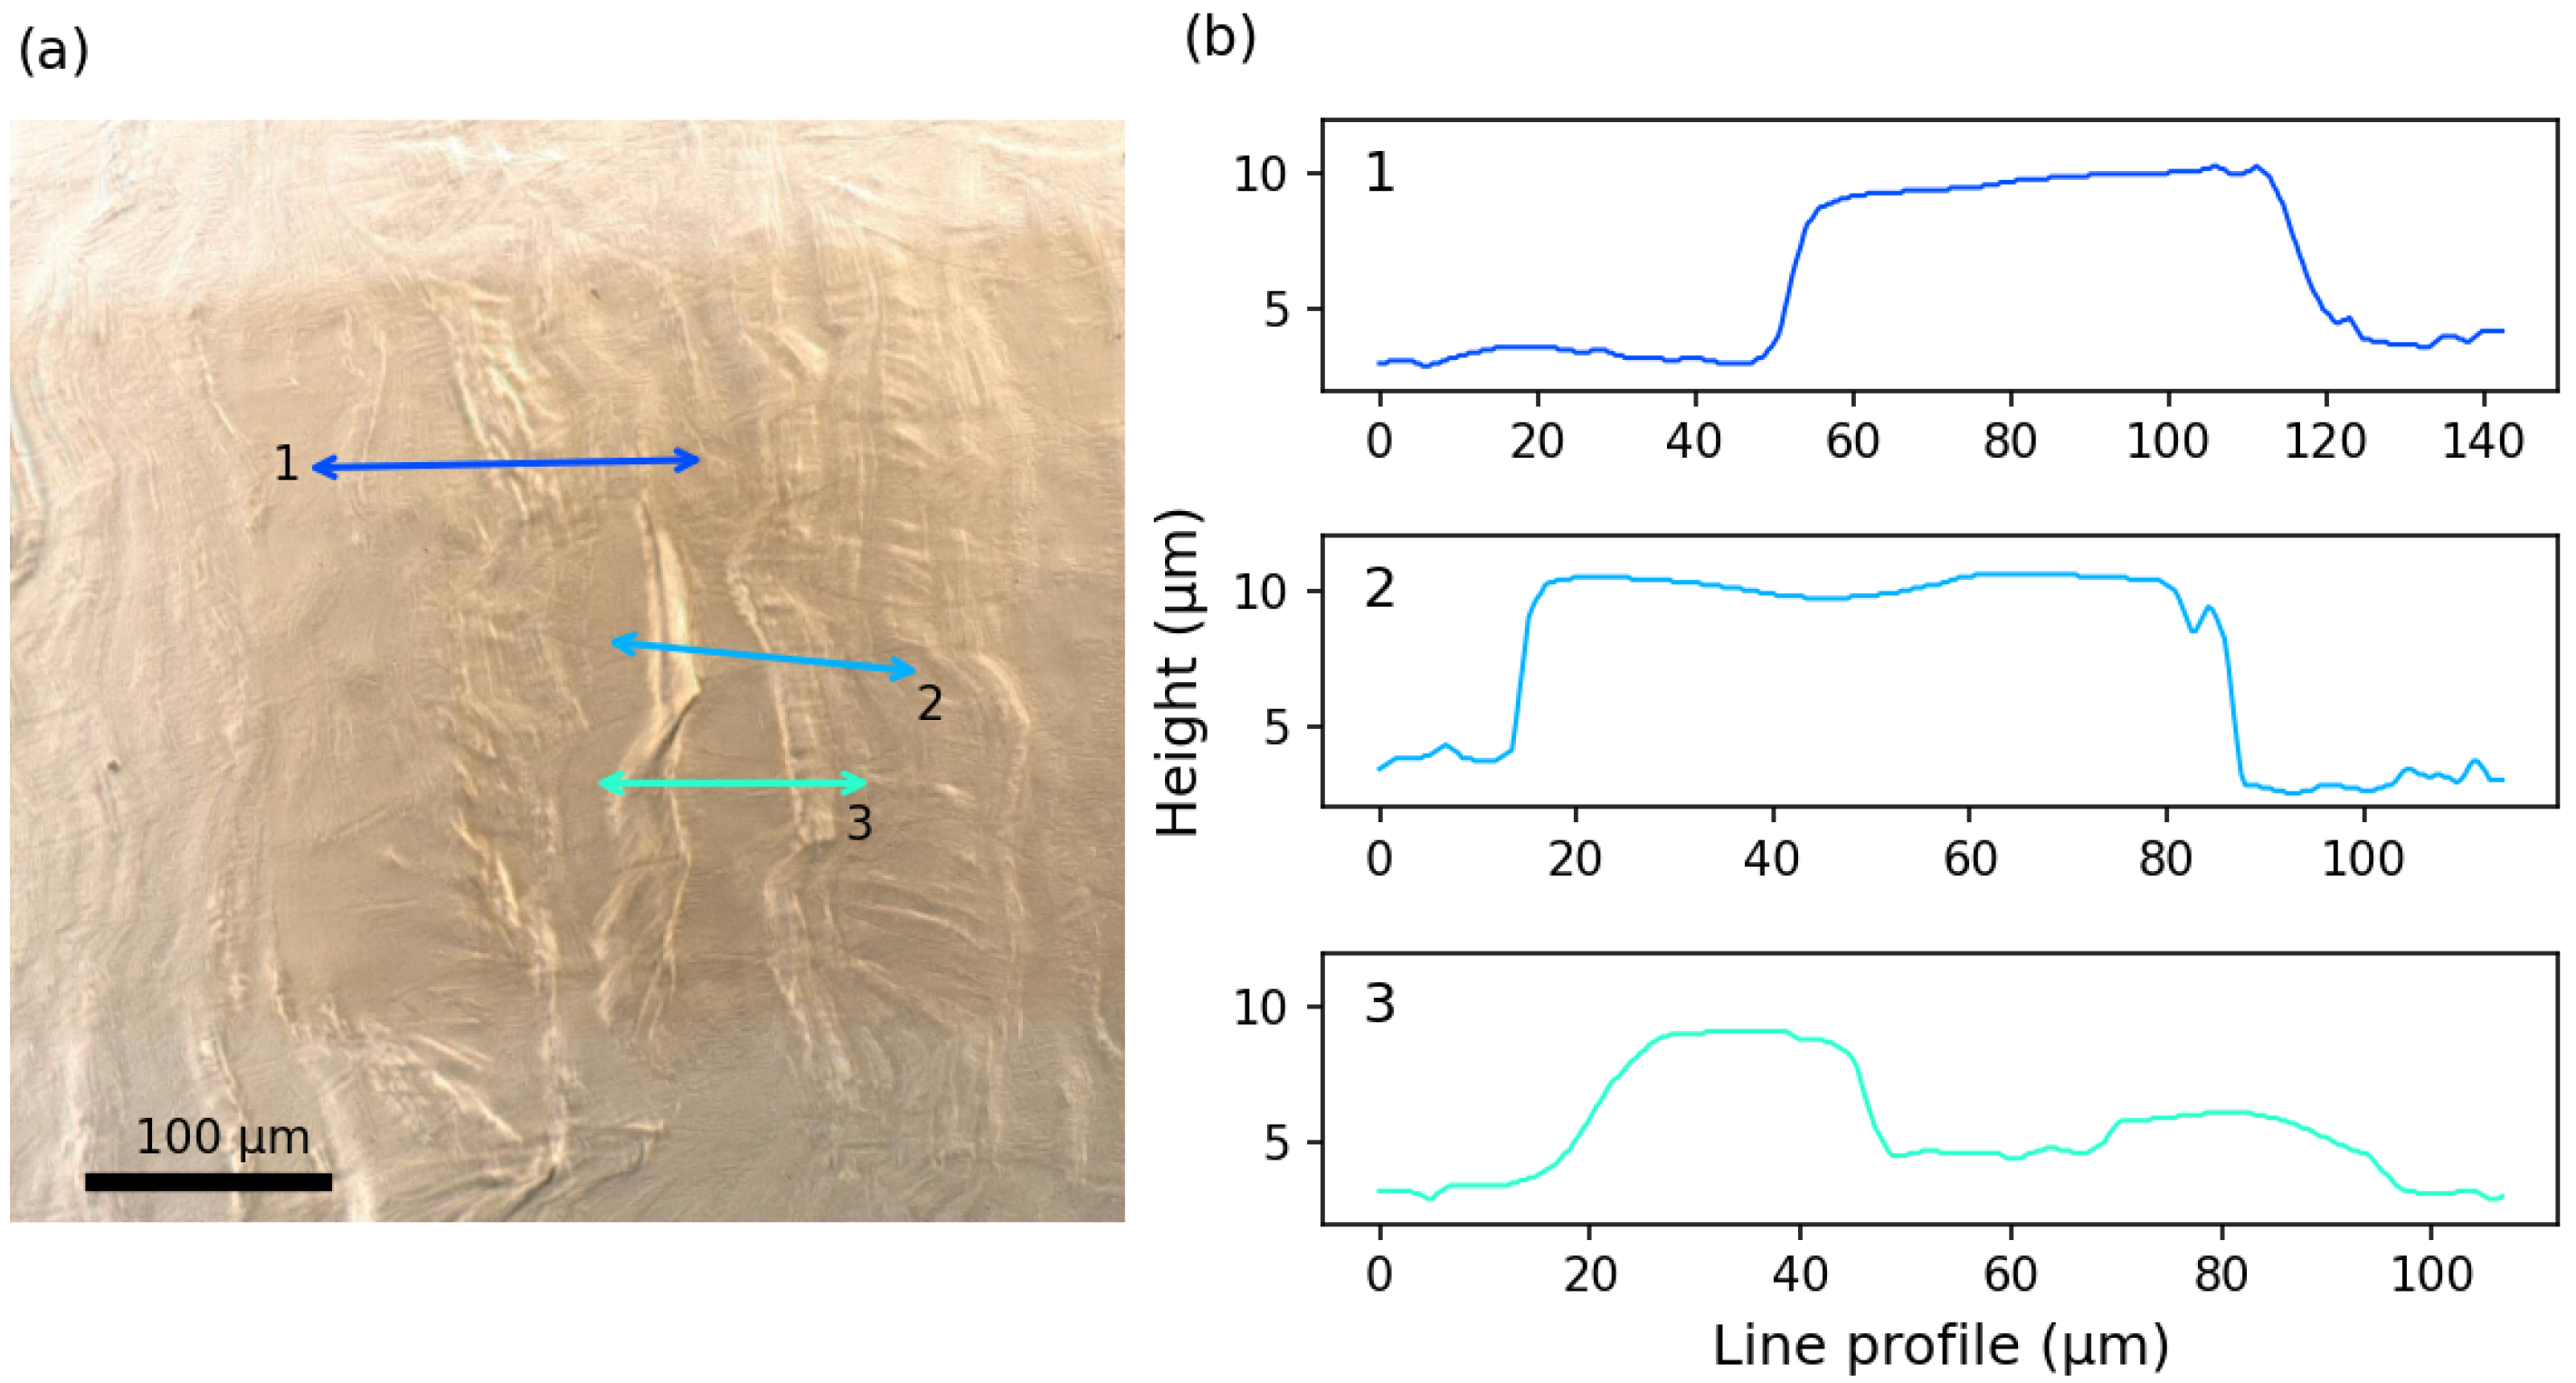
- Three mechanisms induced by HCF loading were identified. At lower stress levels, a microplasticity mechanism within the grains, associated with intra-grain misorientation, was observed. At higher stress levels, the predominant mechanism is surface extrusion, resulting from the accumulation of dislocations and persistent slip bands on the surface, which is also attributed to microplasticity. These two mechanisms, occurring at different stress levels, are similar to those observed in traditional materials. In the context of shape memory features, stress-induced martensite can be stabilized under HCF loading, albeit in smaller quantities. Although the study could not clearly quantify these mechanisms, further statistical analysis could provide meaningful insights.
- Both HCF and self-heating loading were carried out in the elastic regime of the material. These observations can be used to support the hypothesis toward the self-heating modeling.
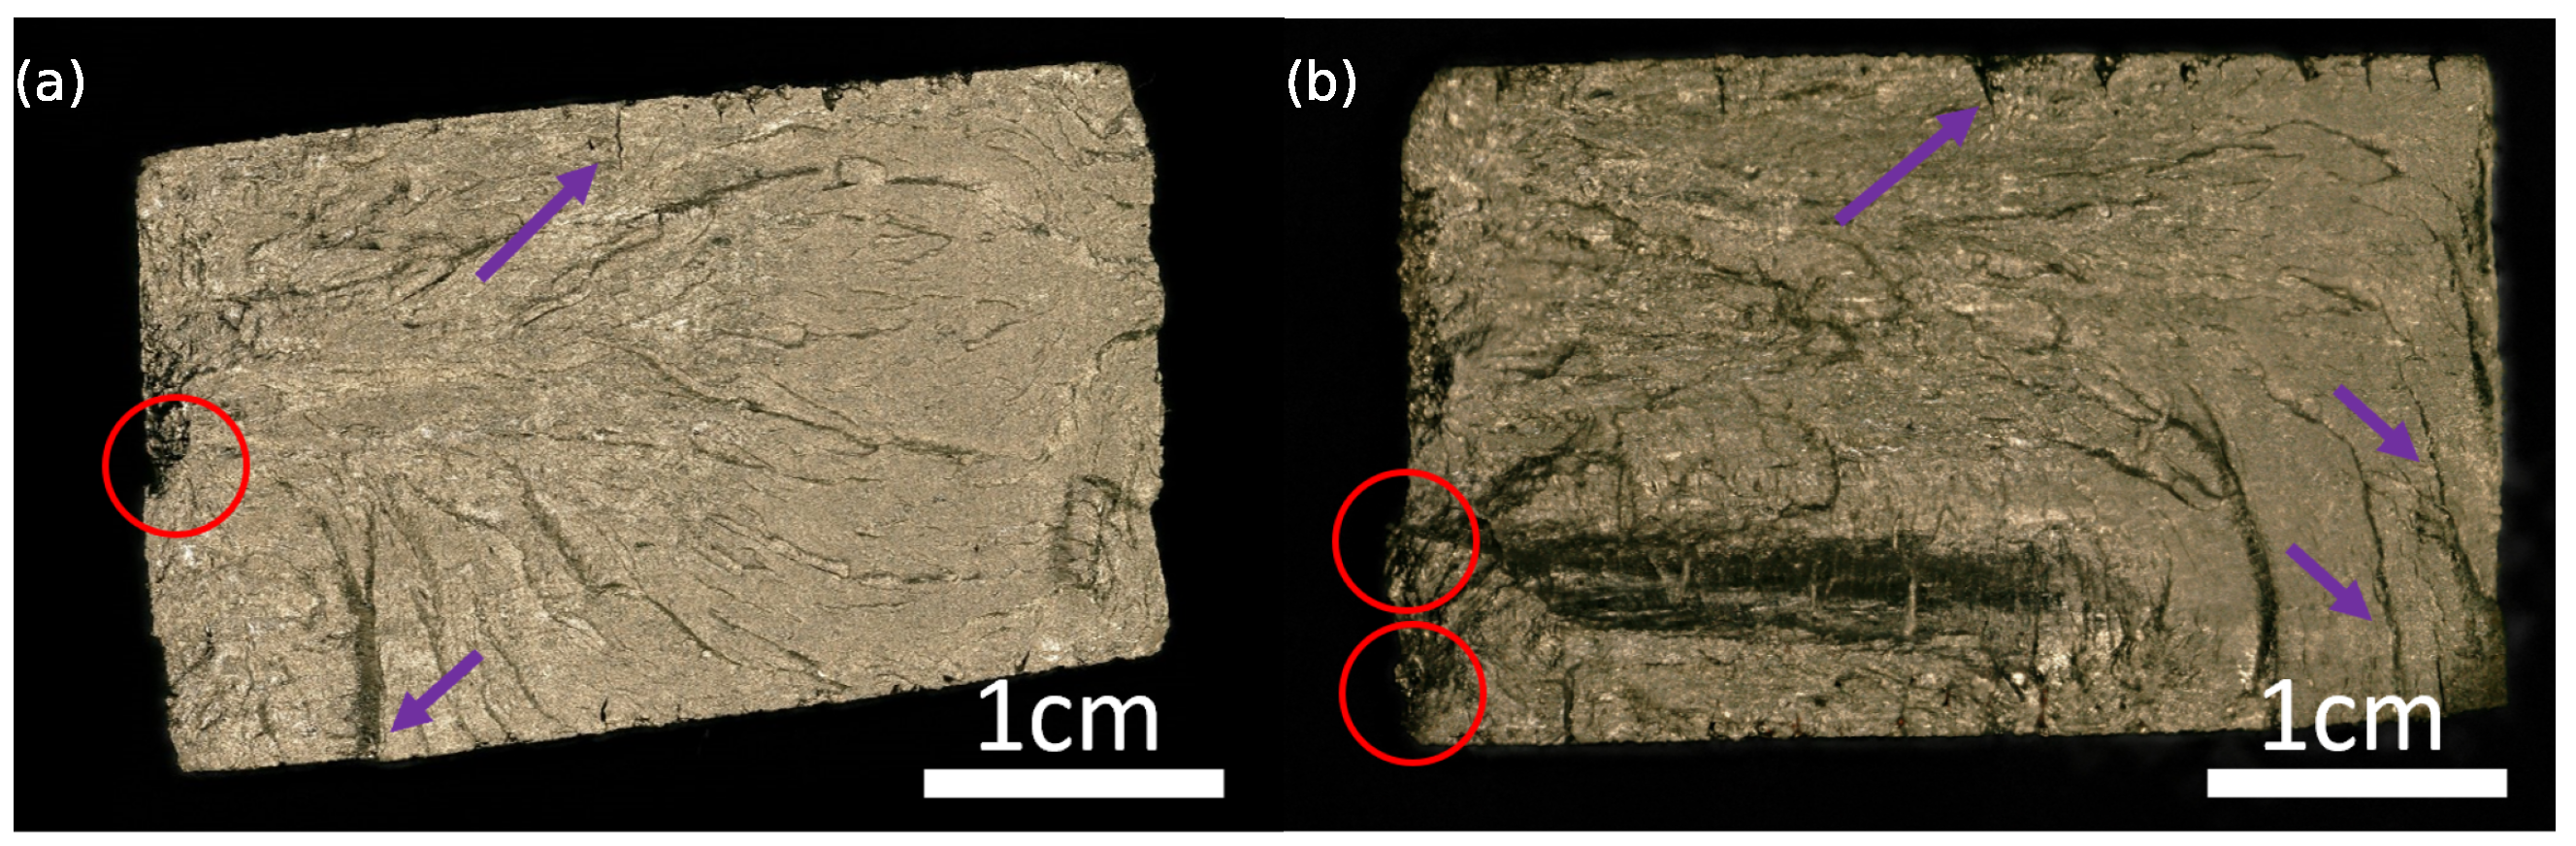
- The presence of defects near the surface in the material is more likely the origin of crack initiation. The crack propagation occurs along the grain boundaries and is facilitated by plastic mechanisms, leading to fatigue failure.
Author Contributions
Funding
Data Availability Statement
Acknowledgments
Conflicts of Interest
References
- Mohd Jani, J.; Leary, M.; Subic, A.; Gibson, M.A. A review of shape memory alloy research, applications and opportunities. Mater. Des. 2014, 56, 1078–1113. [Google Scholar] [CrossRef]
- Elahinia, M.; Shayesteh Moghaddam, N.; Taheri Andani, M.; Amerinatanzi, A.; Bimber, B.A.; Hamilton, R.F. Fabrication of NiTi through additive manufacturing: A review. Prog. Mater. Sci. 2016, 83, 630–663. [Google Scholar] [CrossRef]
- Ruth, D.J.S.; Sohn, J.W.; Dhanalakshmi, K.; Choi, S.B. Control Aspects of Shape Memory Alloys in Robotics Applications: A Review over the Last Decade. Sensors 2022, 22, 4860. [Google Scholar] [CrossRef]
- Chau, E.T.F.; Friend, C.M.; Allen, D.M.; Hora, J.; Webster, J.R. A technical and economic appraisal of shape memory alloys for aerospace applications. Mater. Sci. Eng. A 2006, 438–440, 589–592. [Google Scholar] [CrossRef]
- Stoeckel, D. Shape memory actuators for automotive applications. Mater. Des. 1990, 11, 302–307. [Google Scholar] [CrossRef]
- Mantovani, D. Shape memory alloys: Properties and biomedical applications. JOM 2000, 52, 36–44. [Google Scholar] [CrossRef]
- Gheorghita, V.; Gümpel, P.; Strittmatter, J.; Anghel, C.; Heitz, T.; Senn, M. Using Shape Memory Alloys in Automotive Safety Systems. In Proceedings of the FISITA 2012 World Automotive Congress (Beijing, China, November 2012); Lecture Notes in Electrical Engineering; Springer: Berlin/Heidelberg, Germany, 2013; pp. 909–917. [Google Scholar] [CrossRef]
- Elahinia, M.; Shayesteh Moghaddam, N.; Amerinatanzi, A.; Saedi, S.; Toker, G.P.; Karaca, H.; Bigelow, G.S.; Benafan, O. Additive manufacturing of NiTiHf high temperature shape memory alloy. Scr. Mater. 2018, 145, 90–94. [Google Scholar] [CrossRef]
- Sabahi, N.; Chen, W.; Wang, C.H.; Kruzic, J.J.; Li, X. A Review on Additive Manufacturing of Shape-Memory Materials for Biomedical Applications. JOM 2020, 72, 1229–1253. [Google Scholar] [CrossRef]
- Muntasir Billah, A.; Rahman, J.; Zhang, Q. Shape memory alloys (SMAs) for resilient bridges: A state-of-the-art review. Structures 2022, 37, 514–527. [Google Scholar] [CrossRef]
- Chen, J.; Lei, L.; Fang, G. Elastocaloric cooling of shape memory alloys: A review. Mater. Today Commun. 2021, 28, 102706. [Google Scholar] [CrossRef]
- Nair, V.S.; Nachimuthu, R. The role of NiTi shape memory alloys in quality of life improvement through medical advancements: A comprehensive review. Proc. Inst. Mech. Eng. Part H J. Eng. Med. 2022, 236, 923–950. [Google Scholar] [CrossRef] [PubMed]
- Buehler, W.J.; Gilfrich, J.V.; Wiley, R.C. Effect of Low-Temperature Phase Changes on the Mechanical Properties of Alloys near Composition TiNi. J. Appl. Phys. 1963, 34, 1475–1477. [Google Scholar] [CrossRef]
- Chowdhury, P.; Sehitoglu, H. Deformation physics of shape memory alloys—Fundamentals at atomistic frontier. Prog. Mater. Sci. 2017, 88, 49–88. [Google Scholar] [CrossRef]
- Kordizadeh, F.; Safaei, K.; Mohajerani, S.; Elahinia, M. Investigation of the elastocaloric effect in laser powder bed fusion NiTi porous structures. Addit. Manuf. Lett. 2023, 6, 100131. [Google Scholar] [CrossRef]
- Safaei, K.; Nematollahi, M.; Bayati, P.; Kordizadeh, F.; Andani, M.T.; Abedi, H.; Poorganji, B.; Elahinia, M. On the crystallographic texture and torsional behavior of NiTi shape memory alloy processed by laser powder bed fusion: Effect of build orientation. Addit. Manuf. 2022, 59, 103184. [Google Scholar] [CrossRef]
- Zhu, J.N.; Liu, K.; Riemslag, T.; Tichelaar, F.D.; Borisov, E.; Yao, X.; Popovich, A.; Huizenga, R.; Hermans, M.; Popovich, V. Achieving superelasticity in additively manufactured Ni-lean NiTi by crystallographic design. Mater. Des. 2023, 230, 111949. [Google Scholar] [CrossRef]
- Bassani, P.; Fiocchi, J.; Tuissi, A.; Biffi, C.A. Investigation of the Effect of Laser Fluence on Microstructure and Martensitic Transformation for Realizing Functionally Graded NiTi Shape Memory Alloy via Laser Powder Bed Fusion. Appl. Sci. 2023, 13, 882. [Google Scholar] [CrossRef]
- Nematollahi, M.; Safaei, K.; Bayati, P.; Elahinia, M. Functionally graded NiTi shape memory alloy: Selective laser melting fabrication and multi-scale characterization. Mater. Lett. 2021, 292, 129648. [Google Scholar] [CrossRef]
- Eggeler, G.; Hornbogen, E.; Yawny, A.; Heckmann, A.; Wagner, M. Structural and functional fatigue of NiTi shape memory alloys. Mater. Sci. Eng. A 2004, 378, 24–33. [Google Scholar] [CrossRef]
- Mahtabi, M.J.; Shamsaei, N.; Mitchell, M.R. Fatigue of Nitinol: The state-of-the-art and ongoing challenges. J. Mech. Behav. Biomed. Mater. 2015, 50, 228–254. [Google Scholar] [CrossRef]
- Speirs, M.; Van Hooreweder, B.; Van Humbeeck, J.; Kruth, J.P. Fatigue behaviour of NiTi shape memory alloy scaffolds produced by SLM, a unit cell design comparison. J. Mech. Behav. Biomed. Mater. 2017, 70, 53–59. [Google Scholar] [CrossRef]
- LePage, W.S.; Shaw, J.A.; Daly, S.H. Effects of texture on the functional and structural fatigue of a NiTi shape memory alloy. Int. J. Solids Struct. 2021, 221, 150–164. [Google Scholar] [CrossRef]
- Bagheri, A.; Mahtabi, M.J.; Shamsaei, N. Fatigue behavior and cyclic deformation of additive manufactured NiTi. J. Am. Acad. Dermatol. 2018, 252, 440–453. [Google Scholar] [CrossRef]
- Bayati, P.; Jahadakbar, A.; Barati, M.; Nematollahi, M.; Saint-Sulpice, L.; Haghshenas, M.; Chirani, S.A.; Mahtabi, M.J.; Elahinia, M. Toward low and high cycle fatigue behavior of SLM-fabricated NiTi: Considering the effect of build orientation and employing a self-heating approach. Int. J. Mech. Sci. 2020, 185, 105878. [Google Scholar] [CrossRef]
- Hartl, D.J.; Mabe, J.H.; Benafan, O.; Coda, A.; Conduit, B.; Padan, R.; Doren, B.V. Standardization of shape memory alloy test methods toward certification of aerospace applications. Smart Mater. Struct. 2015, 24, 082001. [Google Scholar] [CrossRef]
- Doudard, C.; Calloch, S.; Cugy, P.; Galtier, A.; Hild, F. A probabilistic two-scale model for high-cycle fatigue life predictions. Fatigue Fract. Eng. Mater. Struct. 2005, 28, 279–288. [Google Scholar] [CrossRef]
- Munier, R.; Doudard, C.; Calloch, S.; Weber, B. Determination of high cycle fatigue properties of a wide range of steel sheet grades from self-heating measurements. Int. J. Fatigue 2014, 63, 46–61. [Google Scholar] [CrossRef]
- Amini, B.; Demmouche, Y.; Barati, M.; Helbert, G.; Chirani, S.A.; Calloch, S. Self-heating of metastable 304L austenitic stainless steel under cyclic loading: Influence of initial martensite volume fraction, testing temperature and pre-strain. Mech. Mater. 2020, 151, 103596. [Google Scholar] [CrossRef]
- Bercelli, L. Étude des Propriétés en Fatigue Polycyclique des matéRiaux et des Structures Obtenus par le Procédé de Fabrication Additive Arc-Fil. Ph.D. Thesis, ENSTA Bretagne-École Nationale Supérieure de Techniques Avancées Bretagne, Brest, France, 2021. [Google Scholar]
- Munier, R.; Doudard, C.; Calloch, S.; Weber, B.; Facchinetti, M. Contribution of Kinematical and Thermal Full-field Measurements for Mechanical Properties Identification: Application to High Cycle Fatigue of Steels. Exp. Mech. 2011, 52, 743–756. [Google Scholar] [CrossRef]
- Ezanno, A.; Doudard, C.; Calloch, S.; Heuzé, J.L. A new approach to characterizing and modeling the high cycle fatigue properties of cast materials based on self-heating measurements under cyclic loadings. Int. J. Fatigue 2013, 47, 232–243. [Google Scholar] [CrossRef]
- Louge, J.; Munier, R.; Doudard, C.; Calloch, S.; Weber, B. Two new in-plane torsion tests for the investigation of self-heating under pure shear cyclic loading. Int. J. Fatigue 2021, 149, 106256. [Google Scholar] [CrossRef]
- Doudard, C.; Calloch, S. Influence of hardening type on self-heating of metallic materials under cyclic loadings at low amplitude. Eur. J. Mech. A/Solids 2009, 28, 233–240. [Google Scholar] [CrossRef]
- Jegou, L.; Marco, Y.; Le Saux, V.; Calloch, S. Fast prediction of the Wöhler curve from heat build-up measurements on Short Fiber Reinforced Plastic. Int. J. Fatigue 2013, 47, 259–267. [Google Scholar] [CrossRef]
- Peyrac, C.; Jollivet, T.; Leray, N.; Lefebvre, F.; Westphal, O.; Gornet, L. Self-heating Method for Fatigue Limit Determination on Thermoplastic Composites. Procedia Eng. 2015, 133, 129–135. [Google Scholar] [CrossRef]
- Le Saux, V.; Marco, Y.; Calloch, S.; Doudard, C.; Charrier, P. Fast evaluation of the fatigue lifetime of rubber-like materials based on a heat build-up protocol and micro-tomography measurements. Int. J. Fatigue 2010, 32, 1582–1590. [Google Scholar] [CrossRef]
- Mostofizadeh, P.; Kadkhodaei, M.; Arbab Chirani, S.; Saint-Sulpice, L.; Rokbani, M.; Bouraoui, T.; Calloch, S. Fatigue analysis of shape memory alloys by self-heating method. Int. J. Mech. Sci. 2019, 156, 329–341. [Google Scholar] [CrossRef]
- Saint-Sulpice, L.; Legrand, V.; Arbab-Chirani, S.; Calloch, S.; Doudard, C. Fatigue life study of superelastic NiTi Shape Memory Alloys using self-heating under cyclic loading method. Int. J. Fatigue 2022, 165, 107208. [Google Scholar] [CrossRef]
- Shayesteh Moghaddam, N.; Saedi, S.; Amerinatanzi, A.; Hinojos, A.; Ramazani, A.; Kundin, J.; Mills, M.J.; Karaca, H.; Elahinia, M. Achieving superelasticity in additively manufactured NiTi in compression without post-process heat treatment. Sci. Rep. 2019, 9, 41. [Google Scholar] [CrossRef]
- Saedi, S.; Shayesteh Moghaddam, N.; Amerinatanzi, A.; Elahinia, M.; Karaca, H.E. On the effects of selective laser melting process parameters on microstructure and thermomechanical response of Ni-rich NiTi. Acta Mater. 2018, 144, 552–560. [Google Scholar] [CrossRef]
- Sitzman, S.; Nolze, G.; Nowell, M. EBSD Pattern Quality and its Use in Evaluating Sample Surface Condition. Microsc. Microanal. 2010, 16, 698–699. [Google Scholar] [CrossRef]
- Bernard, S.; Krishna Balla, V.; Bose, S.; Bandyopadhyay, A. Compression fatigue behavior of laser processed porous NiTi alloy. J. Mech. Behav. Biomed. Mater. 2012, 13, 62–68. [Google Scholar] [CrossRef]
- Charkaluk, E.; Constantinescu, A. Dissipative aspects in high cycle fatigue. Mech. Mater. 2009, 41, 483–494. [Google Scholar] [CrossRef]
- Nematollahi, M.; Saghaian, S.E.; Safaei, K.; Bayati, P.; Bassani, P.; Biffi, C.; Tuissi, A.; Karaca, H.; Elahinia, M. Building orientation-structure-property in laser powder bed fusion of NiTi shape memory alloy. J. Alloys Compd. 2021, 873, 159791. [Google Scholar] [CrossRef]
- Masuo, H.; Tanaka, Y.; Morokoshi, S.; Yagura, H.; Uchida, T.; Yamamoto, Y.; Murakami, Y. Influence of defects, surface roughness and HIP on the fatigue strength of Ti-6Al-4V manufactured by additive manufacturing. Int. J. Fatigue 2018, 117, 163–179. [Google Scholar] [CrossRef]
- Snopiński, P. Effects of KoBo-Processing and Subsequent Annealing Treatment on Grain Boundary Network and Texture Development in Laser Powder Bed Fusion (LPBF) AlSi10Mg Alloy. Symmetry 2024, 16, 122. [Google Scholar] [CrossRef]
- Carlucci, G.; Patriarca, L.; Demir, A.G.; Lemke, J.N.; Coda, A.; Previtali, B.; Casati, R. Building Orientation and Heat Treatments Effect on the Pseudoelastic Properties of NiTi Produced by LPBF. Shape Mem. Superelasticity 2022, 8, 235–247. [Google Scholar] [CrossRef]
- Munier, R.; Doudard, C.; Calloch, S.; Weber, B. Identification of the micro-plasticity mechanisms at the origin of self-heating under cyclic loading with low stress amplitude. Int. J. Fatigue 2017, 103, 122–135. [Google Scholar] [CrossRef]
- Kudoh, Y.; Tokonami, M.; Miyazaki, S.; Otsuka, K. Crystal structure of the martensite in Ti-49.2 at.%Ni alloy analyzed by the single crystal X-ray diffraction method. Acta Met. 1985, 33, 2049–2056. [Google Scholar] [CrossRef]
- Otsuka, K.; Ren, X. Physical metallurgy of Ti–Ni-based shape memory alloys. Prog. Mater. Sci. 2005, 50, 511–678. [Google Scholar] [CrossRef]
- Teramoto, T.; Tahara, M.; Hosoda, H.; Inamura, T. Compatibility at Junction Planes between Habit Plane Variants with Internal Twin in Ti-Ni-Pd Shape Memory Alloy. Mater. Trans. 2016, 57, 233–240. [Google Scholar] [CrossRef]
- Liu, Y. The superelastic anisotropy in a NiTi shape memory alloy thin sheet. Acta Mater. 2015, 95, 411–427. [Google Scholar] [CrossRef]
- Mao, S.C.; Luo, J.F.; Zhang, Z.; Wu, M.H.; Liu, Y.; Han, X.D. EBSD studies of the stress-induced B2–B19’ martensitic transformation in NiTi tubes under uniaxial tension and compression. Acta Mater. 2010, 58, 3357–3366. [Google Scholar] [CrossRef]
- Pant, P.; Salvemini, F.; Proper, S.; Luzin, V.; Simonsson, K.; Sjöström, S.; Hosseini, S.; Peng, R.L.; Moverare, J. A study of the influence of novel scan strategies on residual stress and microstructure of L-shaped LPBF IN718 samples. Mater. Des. 2022, 214, 110386. [Google Scholar] [CrossRef]
- Andreau, O.; Koutiri, I.; Peyre, P.; Penot, J.D.; Saintier, N.; Pessard, E.; De Terris, T.; Dupuy, C.; Baudin, T. Texture control of 316L parts by modulation of the melt pool morphology in selective laser melting. J. Am. Acad. Dermatol. 2018, 264, 21–31. [Google Scholar] [CrossRef]
- Zhou, X.; Li, K.; Zhang, D.; Liu, X.; Ma, J.; Liu, W.; Shen, Z. Textures formed in a CoCrMo alloy by selective laser melting. J. Alloys Compd. 2015, 631, 153–164. [Google Scholar] [CrossRef]
- Polák, J. Role of Persistent Slip Bands and Persistent Slip Markings in Fatigue Crack Initiation in Polycrystals. Crystals 2023, 13, 220. [Google Scholar] [CrossRef]
- Suresh, S. Fatigue of Materials, 2nd ed.; Cambridge University Press: Cambridge, UK, 1998. [Google Scholar] [CrossRef]
- Differt, K.; Esmann, U.; Mughrabi, H. A model of extrusions and intrusions in fatigued metals II. Surface roughening by random irreversible slip. Philos. Mag. A 1986, 54, 237–258. [Google Scholar] [CrossRef]
- Polatidis, E.; Šmíd, M.; Kuběna, I.; Hsu, W.N.; Laplanche, G.; Van Swygenhoven, H. Deformation mechanisms in a superelastic NiTi alloy: An in-situ high resolution digital image correlation study. Mater. Des. 2020, 191, 108622. [Google Scholar] [CrossRef]
- Li, W.; Lee, S.; Zhang, T.; Jin, Y.; Pagan, D.; Casalena, L.; Mills, M.; Bucsek, A. 3D in-situ characterization of dislocation density in nickel-titanium shape memory alloys using high-energy diffraction microscopy. Acta Mater. 2024, 266, 119659. [Google Scholar] [CrossRef]
- Pelton, A.R. Nitinol Fatigue: A Review of Microstructures and Mechanisms. J. Mater. Eng. Perform. 2011, 20, 613–617. [Google Scholar] [CrossRef]
- Zheng, L.; He, Y.; Moumni, Z. Effects of Lüders-like bands on NiTi fatigue behaviors. Int. J. Solids Struct. 2016, 83, 28–44. [Google Scholar] [CrossRef]
- Zhang, Y.; You, Y.; Moumni, Z.; Anlas, G.; Zhu, J.; Zhang, W. Experimental and theoretical investigation of the frequency effect on low cycle fatigue of shape memory alloys. Int. J. Plast. 2017, 90, 1–30. [Google Scholar] [CrossRef]
- Kockar, B.; Karaman, I.; Kim, J.I.; Chumlyakov, Y.I.; Sharp, J.; Yu, C.J.M. Thermomechanical cyclic response of an ultrafine-grained NiTi shape memory alloy. Acta Mater. 2008, 56, 3630–3646. [Google Scholar] [CrossRef]
- Pelton, A.R.; Huang, G.H.; Moine, P.; Sinclair, R. Effects of thermal cycling on microstructure and properties in Nitinol. Mater. Sci. Eng. A 2012, 532, 130–138. [Google Scholar] [CrossRef]
- Sangid, M.D.; Maier, H.J.; Sehitoglu, H. The role of grain boundaries on fatigue crack initiation—An energy approach. Int. J. Plast. 2011, 27, 801–821. [Google Scholar] [CrossRef]
- Alarcon, E.; Heller, L.; Chirani, S.A.; Šittner, P.; Kopeček, J.; Saint-Sulpice, L.; Calloch, S. Fatigue performance of superelastic NiTi near stress-induced martensitic transformation. Int. J. Fatigue 2017, 95, 76–89. [Google Scholar] [CrossRef]


| Specimen | ||
|---|---|---|
| (°C) | (°C) | |
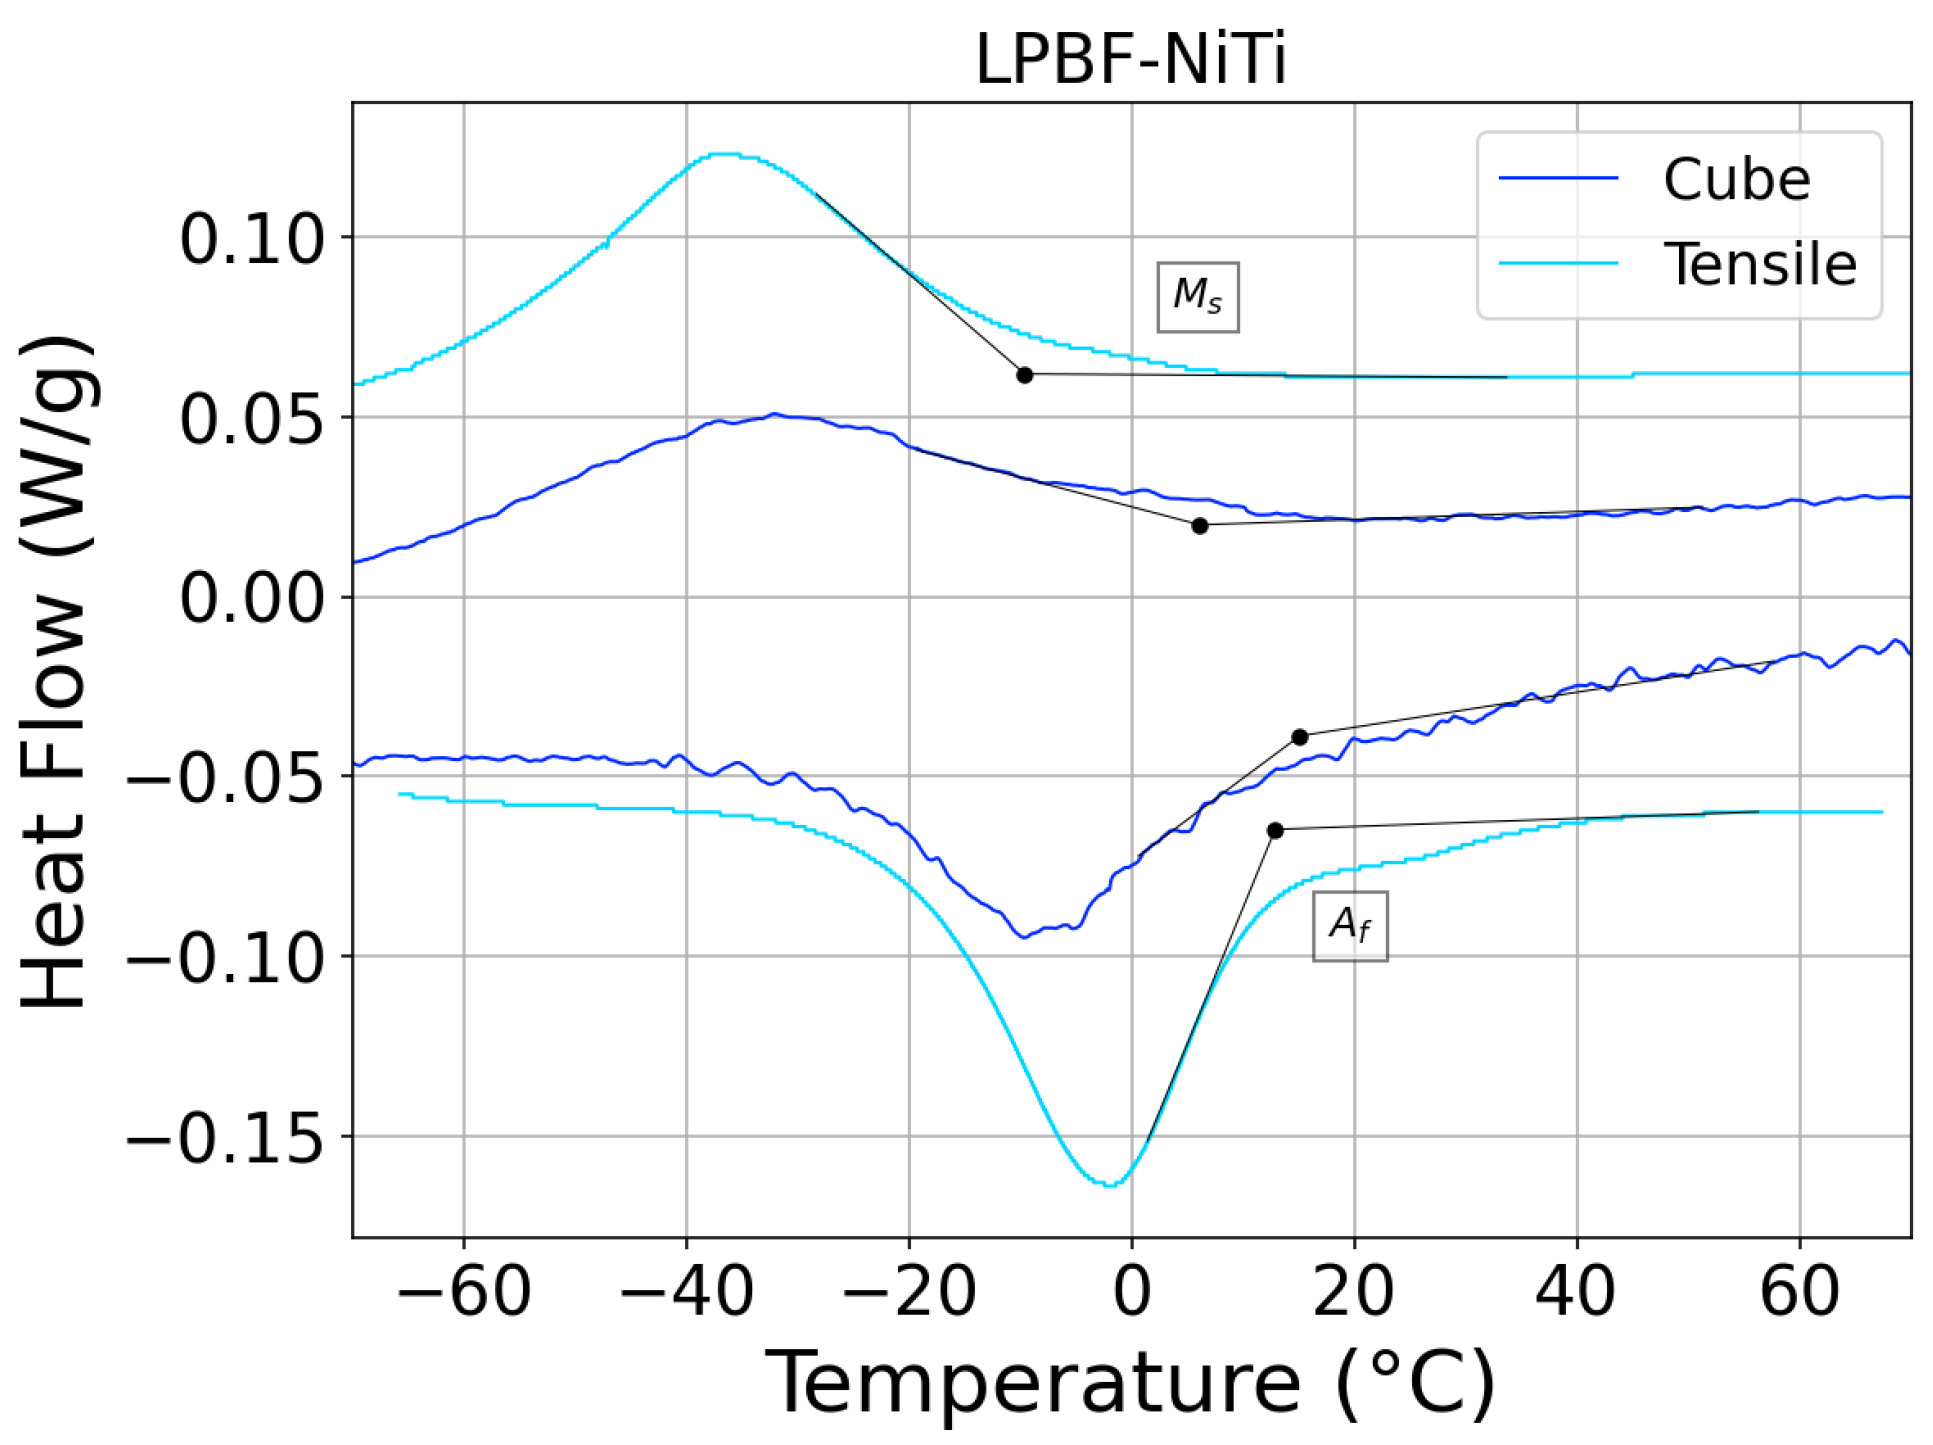
| Cube | 6 | 15 |
| Tensile | −9 | 13 |
| S1 | S2 | ||
|---|---|---|---|
| Stress | Cycles | Stress | Cycles |
| Initial stage | Initial stage | ||
| 95 MPa | 100 k; 300 k; 600 k; 1 M | 160 MPa | 10 k; 20 k; 30 k; |
| 110 MPa | 1 M | 50 k; 80 k; 120 k; | |
| 125 MPa | 1 M | 180 k; 367 k → Failure | |
| 140 MPa | 1 M | ||
| 155 MPa | 365 k → Failure | ||
Disclaimer/Publisher’s Note: The statements, opinions and data contained in all publications are solely those of the individual author(s) and contributor(s) and not of MDPI and/or the editor(s). MDPI and/or the editor(s) disclaim responsibility for any injury to people or property resulting from any ideas, methods, instructions or products referred to in the content. |
© 2024 by the authors. Licensee MDPI, Basel, Switzerland. This article is an open access article distributed under the terms and conditions of the Creative Commons Attribution (CC BY) license (https://creativecommons.org/licenses/by/4.0/).
Share and Cite
Cullaz, T.; Saint-Sulpice, L.; Elahinia, M.; Arbab Chirani, S. Self-Heating and Fatigue Assessment of Laser Powder Bed Fusion NiTi Alloy with High Cycle Fatigue Mechanisms Identification. Metals 2024, 14, 496. https://doi.org/10.3390/met14050496
Cullaz T, Saint-Sulpice L, Elahinia M, Arbab Chirani S. Self-Heating and Fatigue Assessment of Laser Powder Bed Fusion NiTi Alloy with High Cycle Fatigue Mechanisms Identification. Metals. 2024; 14(5):496. https://doi.org/10.3390/met14050496
Chicago/Turabian StyleCullaz, Timothee, Luc Saint-Sulpice, Mohammad Elahinia, and Shabnam Arbab Chirani. 2024. "Self-Heating and Fatigue Assessment of Laser Powder Bed Fusion NiTi Alloy with High Cycle Fatigue Mechanisms Identification" Metals 14, no. 5: 496. https://doi.org/10.3390/met14050496