Article

Effect of Yttrium Addition on Glass-Forming Ability and Magnetic Properties of Fe–Co–B–Si–Nb Bulk Metallic Glass

Department of Machine Intelligence and Systems Engineering, Faculty of Systems Science and Technology, Akita Prefectural University, Yurihonjo 015-0055, Japan
*
Author to whom correspondence should be addressed.
Metals 2015, 5(3), 1127-1135; https://doi.org/10.3390/met5031127
Submission received: 28 April 2015 / Revised: 20 June 2015 / Accepted: 23 June 2015 / Published: 29 June 2015
(This article belongs to the Special Issue Metallic Glasses)

Abstract

:
The glass-forming ability (GFA) and the magnetic properties of the [(Fe0.5Co0.5)0.75B0.20Si0.05]96Nb4−xYx bulk metallic glasses (BMGs) have been studied. The partial replacement of Nb by Y improves the thermal stability of the glass against crystallization. The saturation mass magnetization (σs) exhibits a maximum around 2 at. % Y, and the value of σs of the alloy with 2 at. % Y is 6.5% larger than that of the Y-free alloy. The coercivity shows a tendency to decrease with increasing Y content. These results indicate that the partial replacement of Nb by Y in the Fe–Co–B–Si–Nb BMGs is useful to simultaneous achievement of high GFA, high σs, and good soft magnetic properties.

1. Introduction

The Fe-based bulk metallic glasses (BMGs) are expected as a new class of soft magnetic materials with extremely low core losses [1]. The BMGs have large glass-forming ability (GFA) and, therefore, they can be used to prepare amorphous alloys with thicknesses of few millimeters by casting. Furthermore, the soft magnetic properties of the Fe-based BMGs are better than those of ordinary amorphous alloys which require extremely high cooling rate, typically 105–106 K/s, for amorphous formation due to their low GFA [2,3,4].
One of the disadvantages of the Fe-based soft magnetic BMGs is the smaller saturation magnetization (typically 1.2 T or less) compared with the ordinary Fe-based amorphous alloys. The demands on soft magnetic materials include higher combined magnetization and permeability. In order to achieve high magnetization, it is necessary to reduce the contents of solute elements such as B, C, Si and P. However, the reduction of the solute elements content leads to a decrease of GFA.
Recently, we reported that the effect of replacement of Nb by Y on GFA and the magnetic properties of the (Fe0.8Co0.2)96−xBySi1Nb3−xYx (y = 15, 17) alloys [5], which is close to the limit of the amorphous formation [6]. The results obtained in the study indicate that the partial replacement of Nb by Y in the Fe–Co–B–Si–Nb alloys is useful to simultaneous achievement of high GFA, high magnetization, and good soft magnetic properties. In the present study, we have investigated the effect of the replacement of Nb by Y on GFA and the magnetic properties of the [(Fe0.5Co0.5)0.75B0.20Si0.05]96Nb4 alloy. Although this alloy has the same Fe–Co–B–Si–Nb system as the previous ones, the GFA is quite different. The present alloy system has a large GFA which enables us to produce rod specimens with 5 mm in diameter by Cu-mold casting [7]. In addition, the alloy exhibits the rather high magnetization of 1.13 T as well as the good soft magnetic properties [8,9]. Therefore, this alloy has a possibility to be able to form magnetic cores into complicated shapes by casting or by superplastic deformation in supercooled liquid region.

2. Materials and Methods

The mother alloys with nominal composition of [(Fe0.5Co0.5)0.75B0.20Si0.05]96Nb4xYx were prepared as follows. First, the eutectic Fe-33.1 mass % Y alloy was prepared by arc-melting the mixture of pure Fe (99.99%) and Y (99.9%) metals in an Ar atmosphere. Subsequently, the mixtures of pure Fe, Co (99.9%), and Nb (99.9%) metals, pure B (99.5%) and Si (99.999%) crystals, and the eutectic Fe–Y alloy were melted by an arc furnace in an Ar atmosphere. The rapidly-solidified ribbons with approximately 1 mm in width and 30 μm in thickness were prepared by a single-roller melt-spinning apparatus with a Cu wheel in an Ar atmosphere.
The structure of the specimens was examined by X-ray diffractometry (XRD, PANalytical, Almelo, The Netherlands) with Cu Kα incident radiation. The thermal stability of the glass was investigated using a differential scanning calorimetry (DSC, NETZSCH-Gerätebau, Selb, Germany) during heating at various heating rates (β) between 0.167 and 0.667 K/s. The saturation mass magnetization (σs) was measured with a magnetic balance in an applied magnetic field (H) up to 800 kA/m at 296 ± 3 K. The hysteresis loops of the 70 mm long straight specimens were measured by a hysteresis loop tracer with a compensation coil under a maximum magnetic field of 10 kA/m at room temperature. The hysteresis loops and σs were measured for the five specimens cut from the same ribbons.

3. Results and Discussion
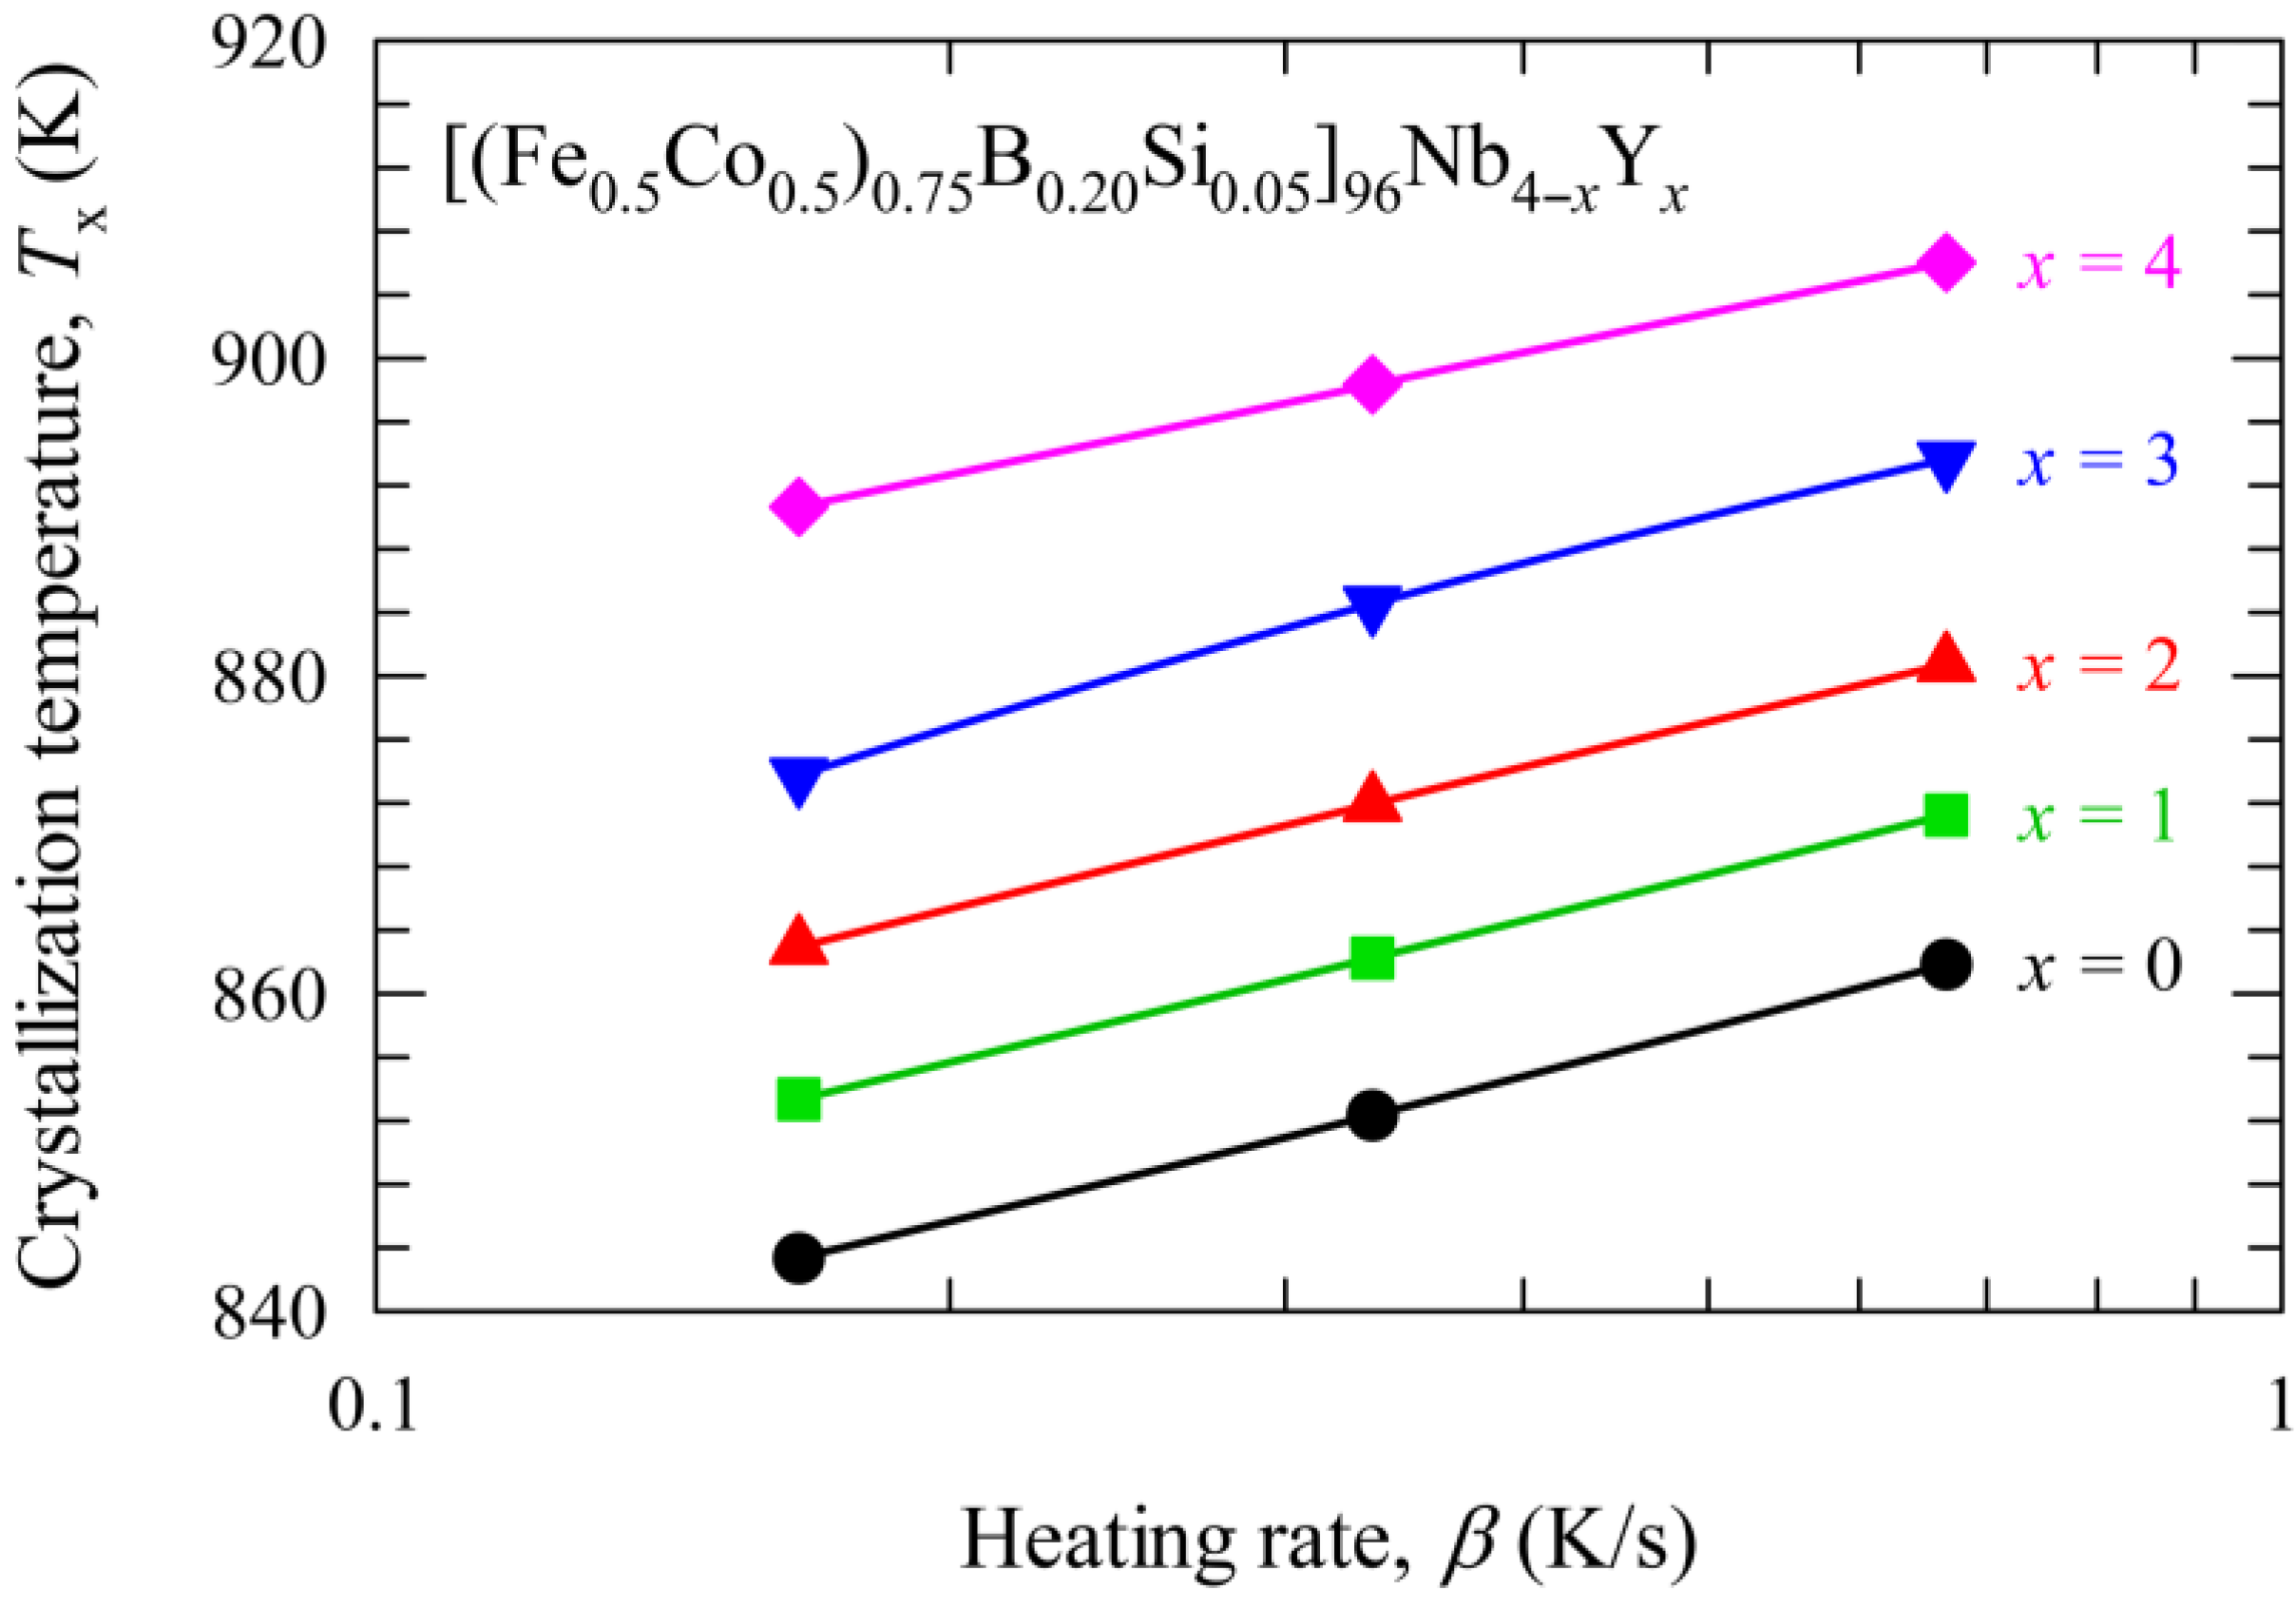
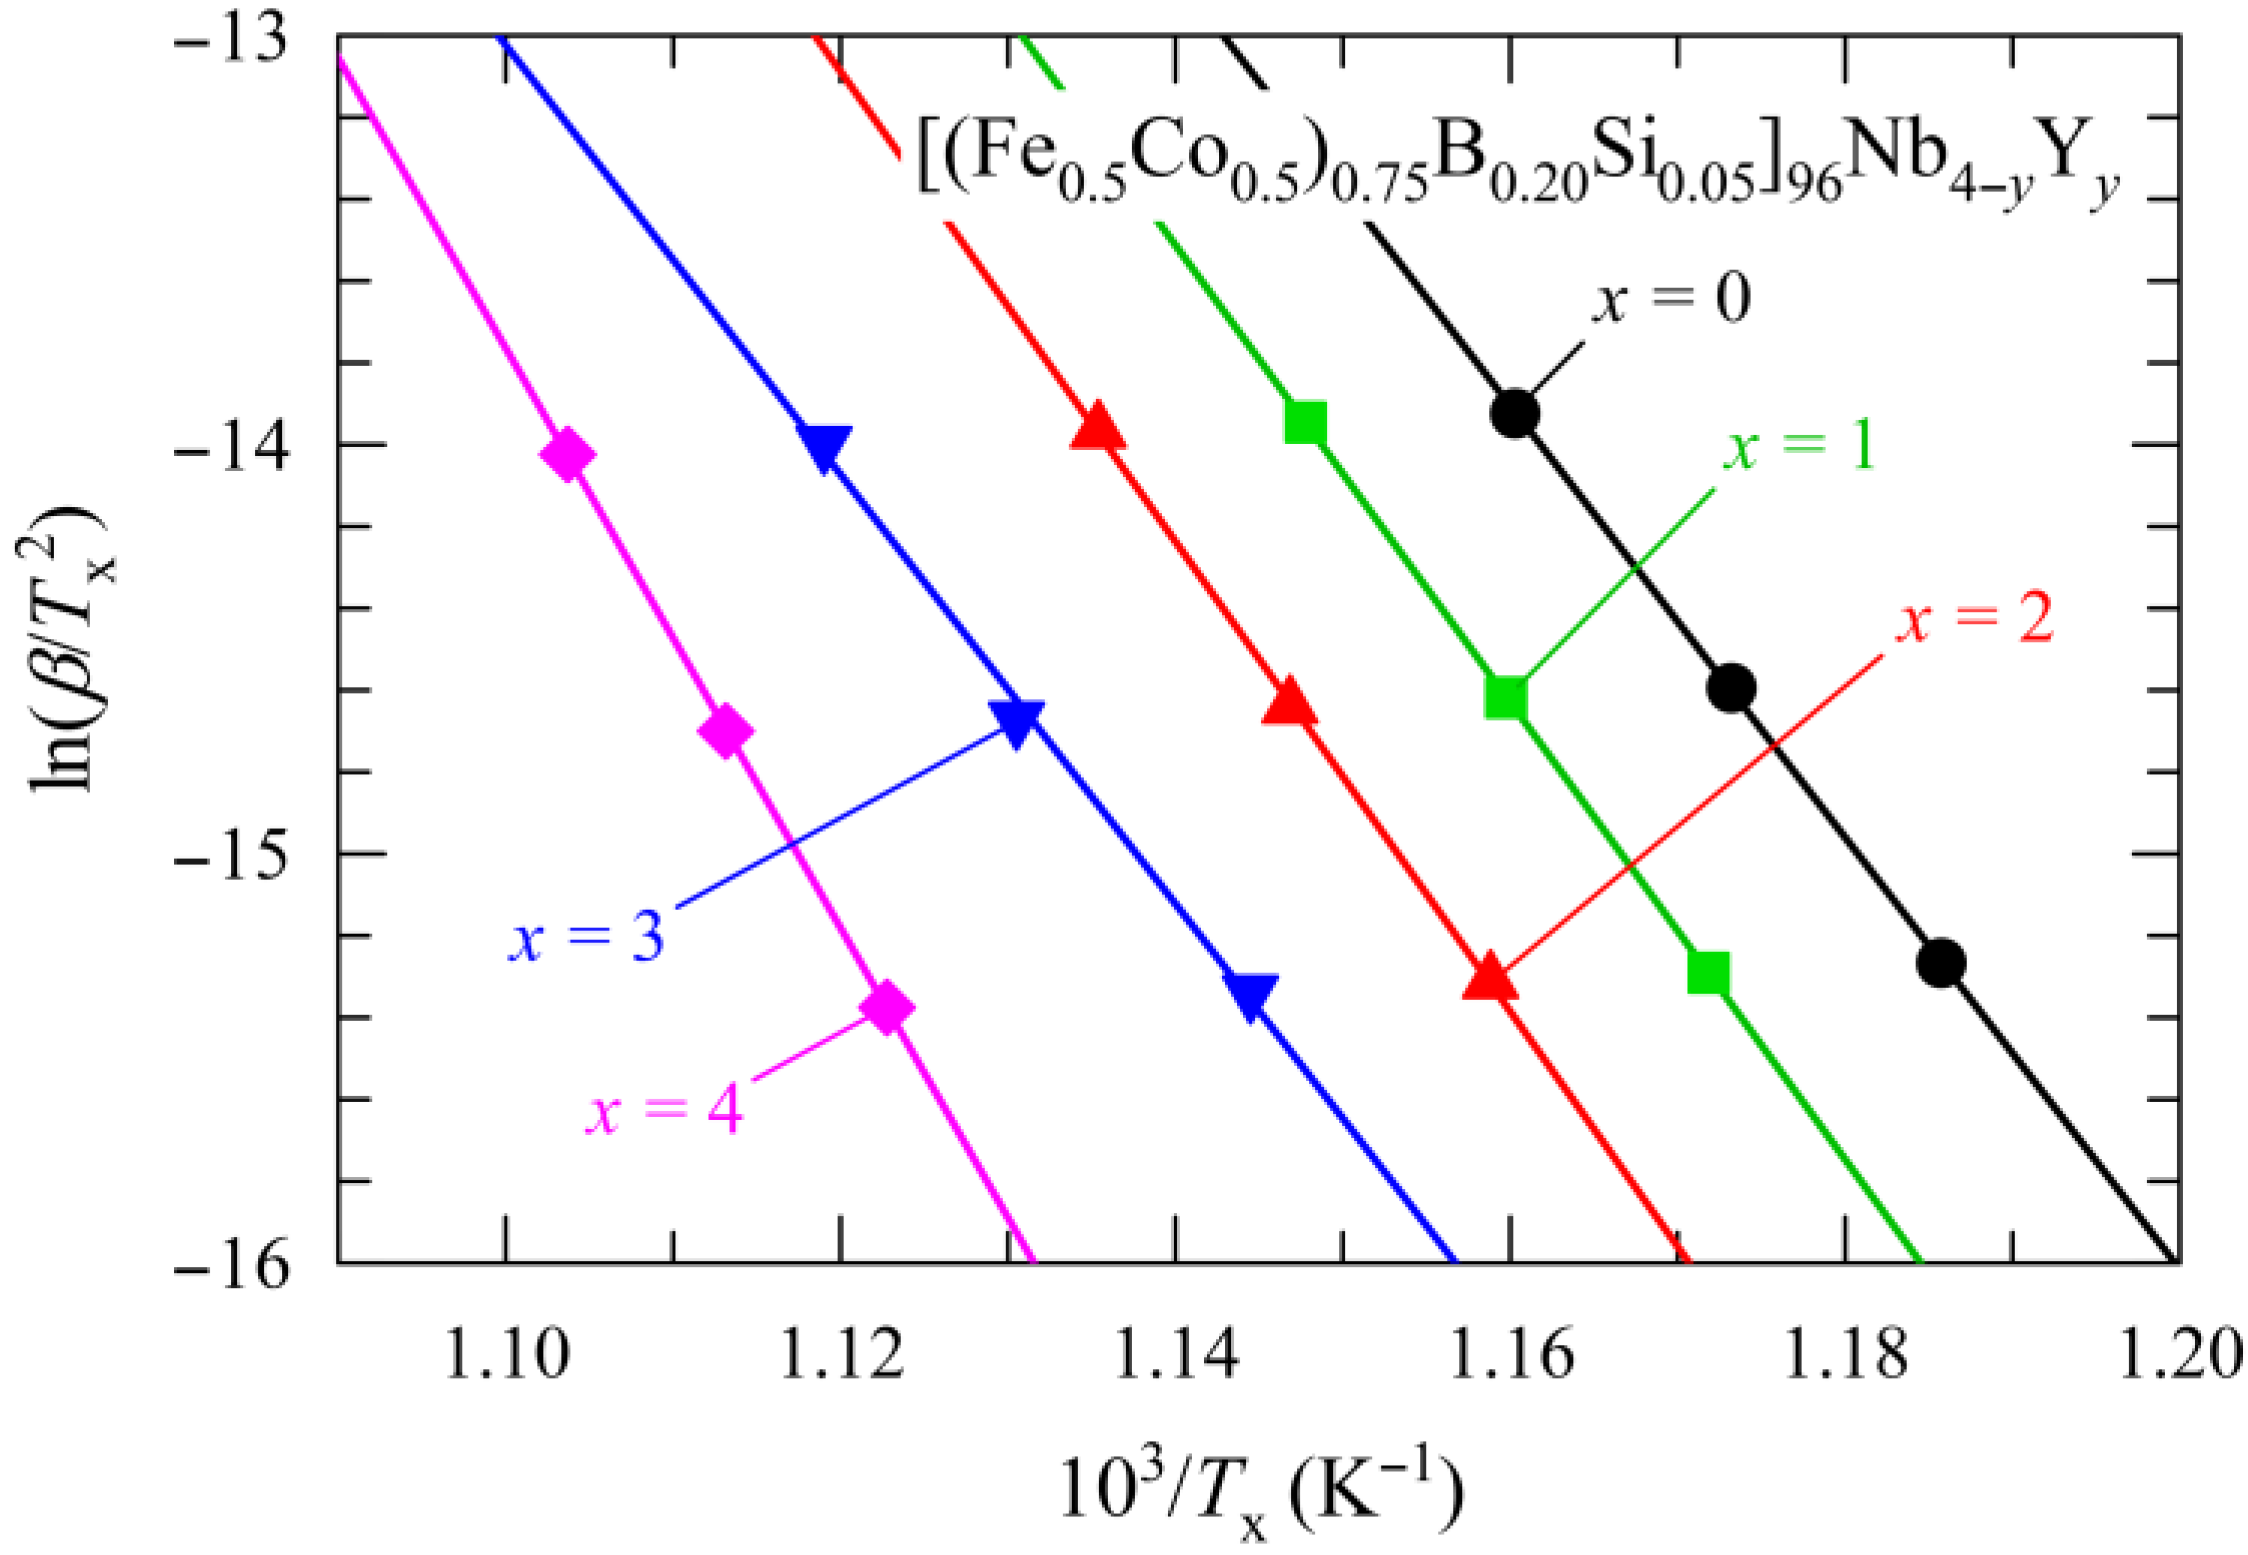
Figure 1 shows the XRD profiles of the as-quenched specimens (x = 0, 2, 4) taken from the free surface. All the profiles consist only of a halo which originates from an amorphous phase. The similar results were obtained by both the free and wheel-contacted surfaces of all the alloys. Figure 2 shows the glass-transition temperature (Tg) and the onset temperature of crystallization (Tx) together with the supercooled liquid region (ΔTx) that is defined as the temperature interval between Tg and Tx as a function of Y content. All the alloys exhibit the distinct glass transition before crystallization. Both Tg and Tx increase with increasing Y content. The super-cooled liquid region also increases with replacing Nb by Y. The maximum value of ΔTx is 47 K for x = 1, which is 6 K larger than that of the Y-free alloy. The alloys with x = 2–3 also show the larger ΔTx than that of the Y-free alloy. However, ΔTx remarkably decreased to 28 K when Nb is completely replaced by Y.
Figure 1. X-ray diffraction profiles of [(Fe0.5Co0.5)0.75B0.20Si0.05]96Nb4−xYx alloys taken from free surface in an as-quenched state.
Metals 05 01127 g001
Figure 2. Glass-transition temperature (Tg), crystallization temperature (Tx) and supercooled liquid (SCL) region (ΔTx = TxTg) of [(Fe0.5Co0.5)0.75B0.20Si0.05]96Nb4−xYx alloys as a function of Y content.
Metals 05 01127 g002
In order to evaluate GFA of the alloys, the continuous heating transformation (CHT) curves have been derived by the Kissinger analysis in which ln(β/Tp2) vs. 1/Tp plot shows a linear relationship as shown in the following equation [10,11,12]:
ln ( β T p 2 ) = E a R T p + ln ( E a K 0 R )
where β is the heating rate, Tp is the peak temperature of the DSC curve (at which the transformation rate reaches maximum), Ea is the activation energy for nucleation and growth, R is the gas constant, K0 is the frequency factor, respectively. The values of Ea and K0 can be obtained by the linear fit of the ln(β/Tp2) vs. 1/Tp plot. The CHT curves are derived by using the relationship between Tp and the heating time, th = (Tp − 298)/β, where
β = E a K 0 R T p 2 exp ( E a R T p )
In general, Tp is used in Kissinger analysis to investigate the maximum transformation rate during crystallization of glass. However, Tp can be replaced by Tx (the onset temperature of crystallization) to calculate a CHT curve for the crystallization of glass, which indicates as actual starting point for the transformation [11,12]. Figure 3 and Figure 4 show the heating rate dependence of Tx and ln(β/Tx2) vs. 1/Tx plot, respectively. The values of the kinetics parameters required for calculation of the CHT curves are listed in Table 1. All the coefficients of determination (R2) for the linear regression of Figure 4 are larger than 0.9998. Figure 5 shows the CHT curves that show the relationship between Tx and corresponding heating time, th. It should be noted that the boundary between the glass and the crystalline phases moves to the longer time side with increasing Y content. This means that the incubation time for crystallization is postponed, i.e., GFA is improved by the replacement of Nb by Y.
Figure 3. Heating rate (β) dependence of the crystallization temperature (Tx) of [(Fe0.5Co0.5)0.75B0.20Si0.05]96Nb4−xYx alloy.
Metals 05 01127 g003
Figure 4. ln(β/Tx2) vs. 1/Tx plot for [(Fe0.5Co0.5)0.75B0.20Si0.05]96Nb4−xYx alloys.
Metals 05 01127 g004
Table 1. Kinetics parameters for onset crystallization temperatures for [(Fe0.5Co0.5)0.75B0.20Si0.05]96Nb4−xYx alloys.
xTx * (K)Ea/R (103 K)ln(EaK0/R)Ea (kJ/mol)K0 (s−1)
086252.847.34396.6 × 1015
187155.950.24641.1 × 1017
288157.451.34783.1 × 1017
389458.851.94895.6 × 1017
490670.964.25891.0 × 1023
* Measured at a heating rate of 0.667 K/s.
Figure 5. Continuous heating transformation (CHT) diagram of [(Fe0.5Co0.5)0.75B0.20Si0.05]96Nb4−xYx alloys. The symbols represent the experimental values of the onset temperature of crystallization (Tx) obtained by the differential scanning calorimetry (DSC) in the continuous heating.
Metals 05 01127 g005
The stabilization of the amorphous phase can be achieved by increasing the atomic packing density in the amorphous phase. Yttrium has a large atomic radius of 181 pm, which is much larger than that of Nb (143 pm), Co (125 pm), Fe (124 pm), Si (117 pm), and B (83 pm) [13]. A large difference of the atomic radius between Y and Fe is favourable for increase the atomic packing density of the amorphous structure. It has been reported that Fe–TM–B (TM: transition metals) and Fe–Ln–B (Ln: lanthanides) type BMGs have unique network-like structure, in which triangular prisms consisting of Fe and B are connected to each other through glue atoms of TM or Ln [14,15]. If the atomic packing density increases, the atomic diffusion becomes more difficult. In addition, the much lower diffusivity of Y than Nb also contributes to the improvement of GFA. Therefore, it can be concluded that the improvement of GFA is brought by the replacement of Nb by Y with the larger radius than that of Nb.
Figure 6 shows the saturation mass magnetization (σs) in an as-quenched state as a function of the Y content. As previously reported [5], the changes of σs are interesting. The magnetization exhibits a maximum around 2 at. % Y. The cause of this phenomenon is unclear. However, we can point out a possibility of the influence of the nanoscale phase separation (NPS) or chemical short-range ordering (CSRO). It is known that the values of the magnetic moments depend on the local environment of Fe and Co atoms: the types of neighbors, the fluctuation of interatomic distance, and the average coordination number [16,17]. Therefore, the values of σs will change according to degree of NPS or CSOR even if the contents of Fe and Co are fixed. The heat of mixing of Y and Fe, Co, and Nb atomic pairs are −1, −22, and +30 kJ/mol, respectively [18,19]. Thus Fe–Y is nearly ideal solution. However, Y atoms attract Co ones and repulse Nb ones. These interatomic attractive/repulsive forces may promote the formation of NPS or CSRO.
Figure 6. Saturation mass magnetization (σs) of [(Fe0.5Co0.5)0.75B0.20Si0.05]96Nb4−xYx alloys in an as-quenched state as a function of Y content. The graph shows the mean value for the five specimens (closed circles). The error bars represent the 95% confidence limits (±2 × standard errors).
Metals 05 01127 g006
Figure 7 shows the examples of the hysteresis loops of the alloy with x = 0, 2 in an as-quenched state. The hysteresis loops indicate that the alloys exhibit the good soft magnetic properties, i.e., low coercivity (Hc) and high permeability. Figure 8 shows Hc in an as-quenched state as a function of the Y content. The coercivity gradually decreases with increasing the Y content. This result suggests that the soft magnetic properties are improved by replacing Nb with Y, which means the increase of GFA. This is considered to be due to the reduction of the free volume in an amorphous phase [2,3,4].
Figure 7. Hysteresis loops of [(Fe0.5Co0.5)0.75B0.20Si0.05]96Nb4−xYx (x = 0, 2) alloys in an as-quenched state. Inset shows enlarged view near the origin.
Metals 05 01127 g007
Figure 8. Coercivity (Hc) of [(Fe0.5Co0.5)0.75B0.20Si0.05]96Nb4−xYx alloys in an as-quenched state as a function of Y content. The graph shows the mean value for the five specimens (closed circles). The error bars represent the 95% confidence limits (±2 × standard errors).
Metals 05 01127 g008

4. Conclusions

It has been confirmed by the glass-forming ability (GFA) of the [(Fe0.5Co0.5)0.75B0.20Si0.05]96Nb4−xYx bulk metallic glasses (BMGs) is improved by replacing Nb with Y by the continuous heating transformation (CHT) diagram. The improvement of GFA is brought by the replacement of Nb by Y with the larger radius than that of Nb.
The saturation mass magnetization (σs) exhibits a maximum around 2 at. % Y. The value of σs of the alloy with x = 2 in an as-quenched state is 151 × 10−6 Wb m/kg, which is 6.5% larger than that of the Y-free alloy. The coercivity (Hc) of the present alloys in an as-quenched state show a tendency to decrease with increasing Y content, which means an increase of GFA.
The results obtained in the present study indicate that the partial replacement of Nb by Y in the Fe–Co–B–Si–Nb BMGs is useful to simultaneous achievement of high GFA, high magnetization, and good soft magnetic properties. The good magnetic properties of the (Fe, Co)–B–Si–(Nb, Y) BMGs bring greater efficiency and miniaturization to magnetic devices.

Acknowledgments

This work was partly supported by Japan Society for the Promotion of Science (JSPS), Grant-in-Aid for Scientific Research (C) (KAKENHI), No. 24560806.

Author Contributions

Teruo Bitoh conceived and designed the experiments, and wrote the paper. Dai Watanabe performed the experiments and analyzed the data.

Conflicts of Interest

The authors declare no conflict of interest.

References

  1. Inoue, A.; Takeuchi, A.; Shen, B. Formation and functional properties of Fe-based bulk glassy alloys. Mater. Trans. 2001, 42, 970–978. [Google Scholar] [CrossRef]
  2. Bitoh, T.; Makino, A.; Inoue, A. Origin of low coercivity of Fe–(Al, Ga)–(P, C, B, Si, Ge) bulk glassy alloys. Mater. Trans. 2003, 44, 2020–2024. [Google Scholar] [CrossRef]
  3. Bitoh, T.; Makino, A.; Inoue, A. Magnetization process and coercivity of Fe–(Al, Ga)–(P, C, B, Si) soft magnetic glassy alloys. Mater. Trans. 2004, 45, 1219–1227. [Google Scholar] [CrossRef]
  4. Bitoh, T.; Makino, A.; Inoue, A. Origin of low coercivity of (Fe0.75B0.15Si0.10)100−xNbx (x = 1–4) glassy alloys. J. Appl. Phys. 2006, 99, 08F102. [Google Scholar] [CrossRef]
  5. Bitoh, T.; Kikuchi, S. Glass-forming ability and magnetic properties of (Fe0.80Co0.20)96−xBxSi1Nb3−yYy (x = 15, 17) amorphous alloys. IEEE Trans. Magn. 2014, 50, 1–5. [Google Scholar] [CrossRef]
  6. Ishikawa, T.; Tsubota, T.; Bitoh, T. Soft magnetic properties of ring-shaped Fe–Co–B–Si–Nb bulk metallic glasses. J. Magn. 2001, 16, 431–434. [Google Scholar] [CrossRef]
  7. Inoue, A.; Shen, B.L.; Chang, C.T. Super-high strength of over 4000 MPa for Fe-based bulk glassy alloys in [(Fe1−xCox)0.75B0.2Si0.05]96Nb4 system. Acta Mater. 2004, 52, 4093–4099. [Google Scholar] [CrossRef]
  8. Bitoh, T.; Makino, A.; Inoue, A.; Greer, A.L. Large bulk soft magnetic [(Fe0.5Co0.5)0.75B0.20Si0.05]96Nb4 glassy alloy prepared by B2O3 flux melting and water quenching. Appl. Phys. Lett. 2006, 88, 182510. [Google Scholar] [CrossRef]
  9. Bitoh, T.; Shibata, D. Improvement of soft magnetic properties [(Fe0.5Co0.5)0.75B0.20Si0.05]96Nb4 bulk metallic glass by B2O3 flux melting. J. Appl. Phys. 2008, 103, 07E702. [Google Scholar] [CrossRef]
  10. Kissinger, H.E. Variation of peak temperature with heating rate in differential thermal analysis. J. Res. Natl. Bur. Stand. 1956, 57, 217–221. [Google Scholar] [CrossRef]
  11. Louzguine, D.V.; Inoue, A. Comparison of the long-term thermal stability of various metallic glasses under continuous heating. Scr. Mater. 2002, 47, 887–891. [Google Scholar] [CrossRef]
  12. Kim, J.H.; Park, J.S.; Fleury, E.; Kim, W.T.; Kim, D.H. Effect of yttrium addition on thermal stability and glass forming ability in Fe–TM (Mn, Mo, Ni)–B ternary alloys. Mater. Trans. 2004, 45, 2770–2775. [Google Scholar] [CrossRef]
  13. Emsley, J. The Elements, 3rd ed.; Oxford University Press: Oxford, UK, 1998. [Google Scholar]
  14. Nakamura, T.; Matsubara, E.; Imafuku, M.; Koshiba, H.; Inoue, A.; Waseda, Y. Structural study of amorphous Fe70M10B20 (M = Cr, W, Nb, Zr and Hf) alloys by X-ray diffraction. Mater. Trans. 2001, 42, 1530–1534. [Google Scholar] [CrossRef]
  15. Nakamura, T.; Koshiba, H.; Imafuku, M.; Inoue, A.; Matsubara, E. Determination of atomic sites of Nb dissolved in metastable Fe23B6 phase. Mater. Trans. 2002, 43, 1918–1920. [Google Scholar] [CrossRef]
  16. O’Handley, R.C. Modern Magnetic Materials: Principles and Applications; Wiley-Interscience: New York, NY, USA, 1999; pp. 391–431. [Google Scholar]
  17. Kakehashi, Y. Modern Theory of Magnetism in Metals and Alloys; Springer: Berlin, Germany, 2013; pp. 253–299. [Google Scholar]
  18. De Boer, F.R.; Boom, R.; Mattens, W.C.M.; Miedema, A.R.; Niessen, A.K. Cohesion in Metals; North-Holland: Amsterdam, The Netherlands, 1988. [Google Scholar]
  19. Takeuchi, A.; Inoue, A. Classification of bulk metallic glasses by atomic size difference, heat of mixing and period of constitute elements and its application to characterization of the main alloying element. Mater Trans. 2005, 46, 2817–2829. [Google Scholar] [CrossRef]

