Article

Weldability and Monitoring of Resistance Spot Welding of Q&P and TRIP Steels

by
Pasquale Russo Spena
1,*,
Manuela De Maddis
2,
Gianluca D’Antonio
2 and
Franco Lombardi
2
1
Faculty of Science and Technology, Free University of Bozen-Bolzano, 39100 Bolzano, Italy
2
Department of Management and Production Engineering, Politecnico di Torino, 10129 Torino, Italy
*
Author to whom correspondence should be addressed.
Metals 2016, 6(11), 270; https://doi.org/10.3390/met6110270
Submission received: 12 October 2016 / Revised: 4 November 2016 / Accepted: 4 November 2016 / Published: 8 November 2016

Abstract

:
This work aims at investigating the spot weldability of a new advanced Quenching and Partitioning (Q&P) steel and a Transformation Induced Plasticity (TRIP) steel for automotive applications by evaluating the effects of the main welding parameters on the mechanical performance of their dissimilar spot welds. The welding current, the electrode tip voltage and the electrical resistance of sheet stack were monitored in order to detect any metal expulsion and to evaluate its severity, as well as to clarify its effect on spot strength. The joint strength was assessed by means of shear and cross tension tests. The corresponding fracture modes were determined through optical microscopy. The welding current is the main process parameter that affects the weld strength, followed by the clamping force and welding time. Metal expulsion can occur through a single large expulsion or multiple expulsions, whose effects on the shear and cross tension strength have been assessed. Longer welding times can limit the negative effect of an expulsion if it occurs in the first part of the joining process. The spot welds exhibit different fracture modes according to their strengths. Overall, a proper weldability window for the selected process parameters has been determined to obtain sound joints.

1. Introduction

Advanced high strength steels (AHSSs) are used extensively in the automotive industry for the fabrication of more resistant and lighter components with the main aim of reducing fuel consumption and gas emissions, and of improving passenger safety. Dual Phase (DP), Transformation Induced Plasticity (TRIP), martensitic, complex phase and hot stamping boron steels are the most commonly used AHSS grades for such applications. New AHSSs are currently under research and development to achieve better combinations of ductility (e.g., crashworthiness and sheet formability) and mechanical strength (e.g., impact resistance). In this context, Quenching and Partitioning (Q&P) steels appear to be one of the most innovative and promising solutions. They are characterized by a microstructure that consists of retained austenite and martensite: the former phase provides ductility and toughness, the latter mechanical strength. On the basis of carbon content and volume fraction of austenite and martensite, tensile strength can usually vary from 700 to 1300 MPa, while elongation at fracture can vary from 10% to 25% [1,2]. At present, only car body prototypes are made of Q&P steels.
The AHSSs used in the automotive industry are often welded together in dissimilar (different steel grades joined together) configurations in order to assemble car body parts and body frames. Dissimilar welding usually requires more precautions than conventional similar welding since the steels to be joined may have different melting points, thermal conductivities, thicknesses, or need different filler metals or pre-heats. Therefore, optimal welding parameters are often a compromise based on the properties of steels. Generally, the reduction in heat input can limit some harmful effects that occur during a joining process, such as cracks, thermal distortions, chemical segregations in the fusion zone, wide heat affected zones, thereby promoting more sound dissimilar joints [3]. In other cases, hybrid welding technologies (i.e., different welding techniques used simultaneously) are helpful solutions to join steels that have very different chemical and physical properties [4]. Resistance spot welding (RSW) is known to be the leading joining technique in the automotive industry due to its suitability for automation and high operating speeds. Thousands of spot welds are usually performed to join doors, body-in-white and other components in a vehicle. The quality and the mechanical performances of RSW joints are crucial for the safety and durability design of a vehicle. In fact, many of these joints are used in structural assemblies that are involved in transferring loads through the body frame during a crash event, and may act as fold initiation sites to manage impact energy [5]. Moreover, the integrity and mechanical properties of spot welds also affect their fatigue and fracture resistance and, in turn, the overall performance of a car body frame in terms of vibrations, noise and harshness [6]. The main issues of an RSW process are ascribable to the complexity of the chemical (e.g., composition in the fusion zone) and physical phenomena (e.g., heat input) that are involved during sheet joining. AHSS spot welds generally exhibit lower mechanical performances than those of the base materials: the peculiar complex microstructures of AHSSs, which are obtained by means of strictly controlled industrial thermo-mechanical processes, are destroyed completely in the fusion zone and altered in the heat affected zone, where they are replaced by more brittle metallurgical constituents.
Therefore, the weldability of Q&P steels is one of the most important key factors in controlling the possible usage of this steel grade in the automotive industry. Only a few preliminary studies about the weldability of Q&P steels in similar and dissimilar configurations have been carried out so far. Wang et al. [7] found that the fatigue performances of RSW joints of Q&P980 steels are similar to those of DP steels with the same tensile strength during cross and shear tension tests. Russo Spena et al. studied dissimilar RSW between a Q&P980 steel, a Twinning Induced Plasticity (TWIP1000) [8] and a TRIP800 steel [9], and mainly assessed the welding parameters effects on the shear tension strength of spot welds. In both cases, the welding parameters had to be carefully controlled in order to obtain spot welds with an adequate shear tension strength for the automotive industry (with reference to American Welding Society (AWS) and International Organization for Standardization (ISO) standards), as well as to limit defects, such as metal expulsion and voids.
The spot welding of Q&P steels requires a rigorous control of the joining parameters in order to achieve a suitable mechanical strength, fatigue resistance and energy absorption capability for the automotive industry. For all of these reasons, the monitoring of RSW can be considered a useful tool to collect information about the joining process and to help in determining proper weldability windows. It is common practice to monitor the welding current and electrode tip voltage to detect metal expulsion. The loss of molten metal from the nugget normally induces the formation of cracks, voids and metal splashes. These defects reduce the mechanical performance of spot welds, in particular under dynamic loads [10]. Moreover, metal expulsion has a harmful effect on weld bonding (spot welding in conjunction with adhesive bonding) as it damages the adhesive layer [11]. As a result, it is necessary to limit metal expulsion as much as possible since it may lead to nonconforming spot welds, in terms of strength and defects, for the assembling of car body parts.
The aim of this study was to investigate the weldability of dissimilar Q&P/TRIP spot welds by evaluating the effects of the welding current, clamping force and welding time on their microstructure and mechanical strength. The current and electrode tip voltage were monitored during the welding process in order to detect any metal expulsion and to evaluate its severity and effect on the load-carrying and absorption capability of the Q&P/TRIP joints. A design of experiment was adopted to realize dissimilar welded lap- and cross-joint samples with different welding parameters. These specimens were then subjected to shear and cross tension tests, respectively, in order to measure the maximum load and the corresponding absorbed energy and displacement (an index of ductility) on the load-crosshead displacement curves. The fracture modes of the welded shear- and cross-joint samples were assessed from a macroscopic and microscopic standpoint. Optical and SEM microscopy, as well as Vickers measurements, were used to determine the microstructures and hardness throughout the dissimilar spot welds.

2. Materials and Methods

2.1. Q&P and TRIP Steels

A Q&P (grade Q&P980) sheet steel and a TRIP (ISO 1.0948) sheet steel were selected for the dissimilar spot welding tests. These sheets were fabricated by means of industrial thermo-mechanical rolling processes and provided in an annealed condition. The Q&P steel had a thickness of 1.1 ± 0.05 mm and was uncoated, while the TRIP steel was 1.5 ± 0.05 mm thick and was hot-dipped zinc coated. The Q&P steel microstructure consists of a mixture of retained austenite and martensite, whose volume fractions are about 60% and 40%, respectively (Figure 1a). TRIP steel exhibits a more complex microstructure that is made up of a mixture of ferrite, retained austenite and bainite (although the presence of a small amount of martensite cannot be excluded) (Figure 1b). In these steels, ferrite and austenite contribute to formability and toughness, whereas martensite and bainite ensure mechanical strength.
The chemical compositions and the main mechanical properties of Q&P and TRIP steels are listed in Table 1 and Table 2, respectively.

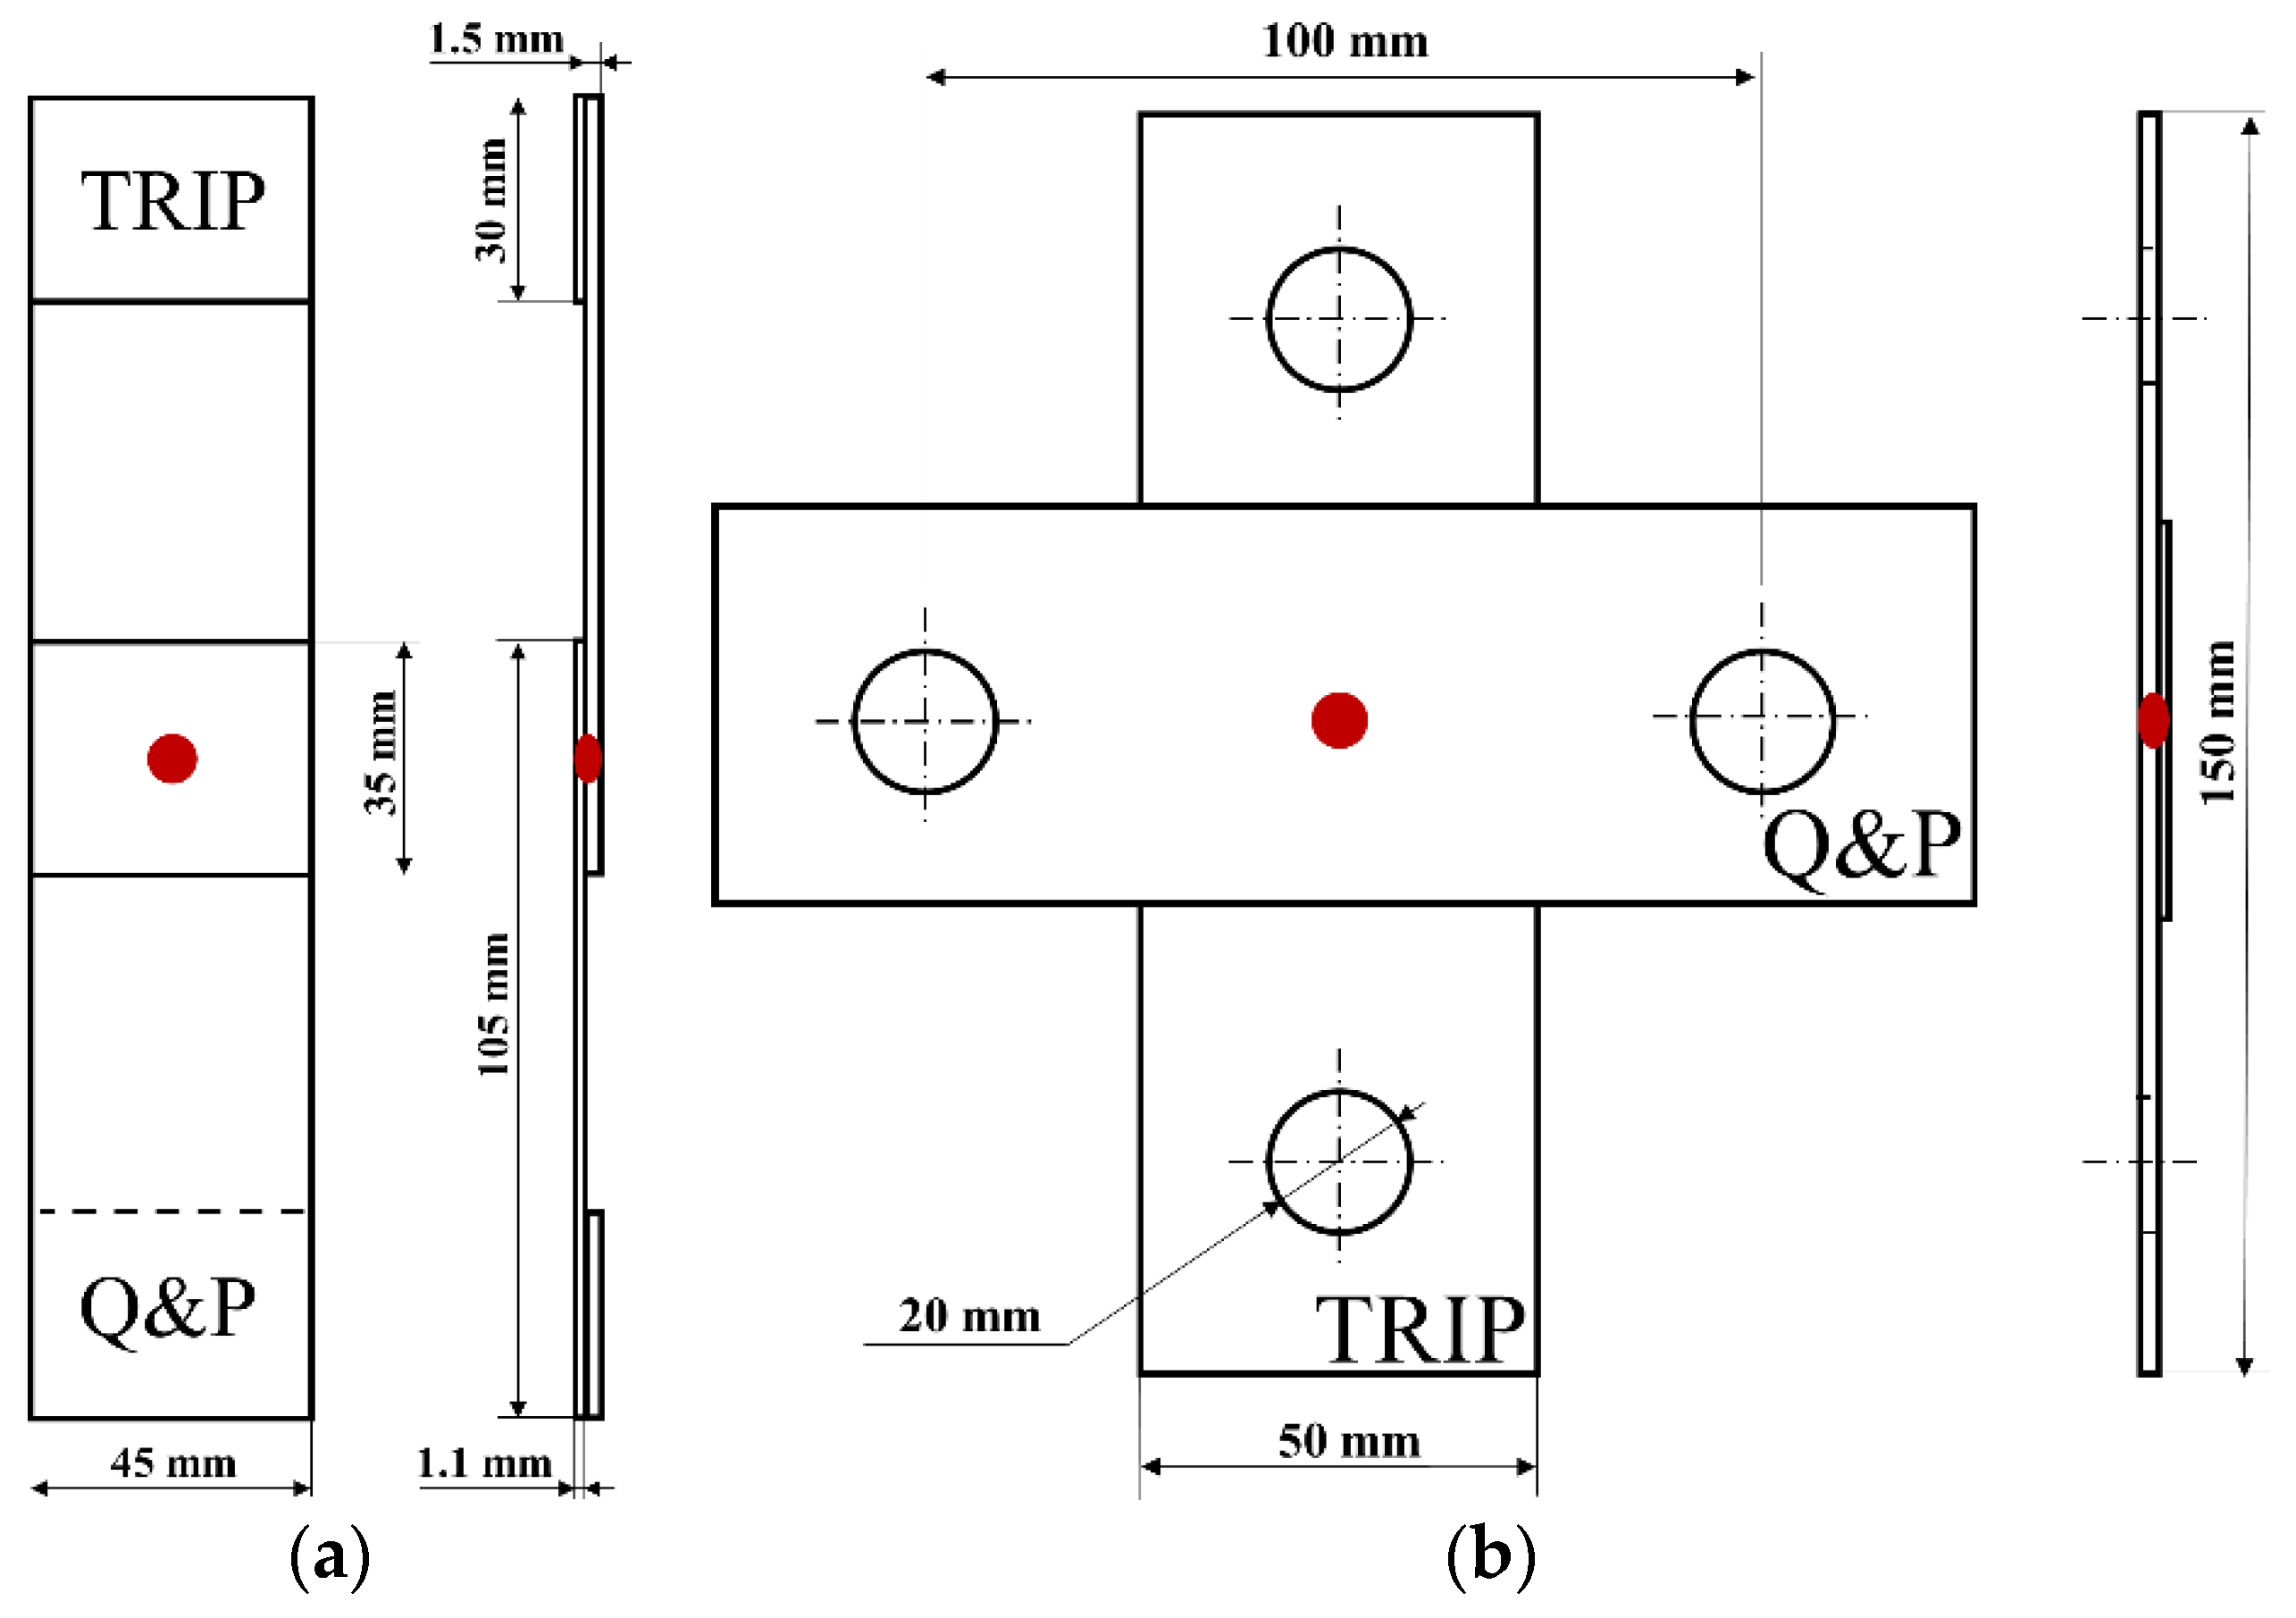
2.2. RSW Welding and Monitoring

Q&P and TRIP sheets were cut from large industrial sheets into coupons of 105 mm × 45 mm and 150 mm × 50 mm, which were then tested by means of shear and cross tension tests, as discussed hereafter. Both types of coupons were cut with the largest length along the rolling direction. Spot welding tests were performed using an industrial medium frequency direct current machine (MFDC) (Matuschek Messtechnik GmbH, Alsdorf, Germany) with an alternating current of 1 kHz. The smaller coupons were welded together in a lap-joint configuration, Figure 2a, whereas the larger coupons where welded in a cross configuration (Figure 2b). In both cases, spot welds were realized in the middle of the overlapped area by means of two copper-chromium electrodes, each with a face diameter of 6 mm, according to the AWS D8.9M standard [12].
The sheet coupons were welded at varying currents, clamping forces and welding times, based on the design of experiment, L-9(33) orthogonal array, shown in Table 3. The welding parameters range was defined after a preliminary pilot experimentation, following the recommendation of the ISO 18278-2 standard [13] and the industrial practice: the minimum current intensity was set to ensure the occurrence of a minimal nugget size that allowed the formation of a complete button pull fracture during a peel test (e.g., an incomplete pull out could be obtained for lower currents than 6 kA), whereas the maximum current intensity was determined as a significant metal expulsion occurred. In order to achieve consistent results, at least three samples were welded in a lap-joint configuration and two samples in a cross-joint configuration for each welding combination.
The electrode tip voltage was measured with two electrical wires directly clipped to the electrode tips. Twist pairs were used to reduce the induced voltage noise of the alternating welding current. The current was measured with an electrical transducer that consisted of a Rogowski coil and an integrator circuit (Figure 3). The transducer provided an output voltage that was proportional to the welding current, in mV/A. The Rogowski coil was looped around the bottom electrode arm as close as possible to the electrode tips to obtain signals related directly to the joining process.
The high alternating current (Iweld) through the electrode arms induced a variable magnetic field in the surrounding environment and, in turn, an induced voltage (Vcoil) in the Rogowski coil, as follows:
Vcoil = H (dIweld/dt)
where H is the coil sensitivity (in Vs/A), which is a characteristic feature of the coil itself. Vcoil had to be integrated to reproduce the welding current waveform, so that
V out = S V coil d t = S H I weld
where S is a characteristic factor of the integrator circuit and SH is the overall transducer sensitivity (in mV/A). As a result, it was possible to calculate the welding current by measuring the output voltage of the integrator and multiplying it by the transducer sensitivity (0.22 mV/A). The electrode tip voltage and welding current signals were collected simultaneously, each at a rate of 100,000 samples per second, by means of an NI USB-6216 acquisition system (National Instruments, Austin, TX, USA).

2.3. Microstructural and Mechanical Characterization of Spot Welds

The lap- and the cross-joint samples were tested by using an axial testing machine (Easydur Italiana, Induno Olona, Italy), according to the AWS D8.9M standard [12]. All the tests were conducted with a crosshead speed set at 10 mm/min. Based on the AWS standard, the maximum load reached during each test, the energy absorbed and the displacement up to the peak load were collected from each test. The fracture modes of all the welded samples, an index of the fracture resistance capability, were visually assessed and classified in accordance with the AWS D8.1M standard [15].
Some welded specimens were cut along the middle section, polished, etched with chemical solutions (2% nital and/or picral reagents) and then examined by means of optical (Optika srl, Ponteranica, Italy) and SEM (Phenom-World, Eindhoven, The Netherlands) microscopy to detect the microstructures of the parent metals, the heat affected zones (HAZs), and the weld nugget. The spot weld geometry was characterized for each welding condition by evaluating the nugget diameter and spot thickness. A metallographic examination was also performed on the fractured shear and cross tension specimens to determine the regions where cracks propagated.
Vickers microhardness measurements were performed to characterize the hardness of the microstructures throughout the spot welds from the Q&P side, through the fusion zone and HAZ, to the TRIP side. Hardness indentations were made using a 200 g load (HV0.2). The distance between two successive indentations was either 0.2 or 0.4 mm.

2.4. Statistical Analysis

A multifactor analysis of variance (ANOVA) of the shear and cross strength values was carried out to determine which welding parameters had a statistically significant effect on the spot weld strength and their contributions. A multiple range test was used to determine how each factor affected the mechanical strength of the Q&P/TRIP spot welds.

3. Results

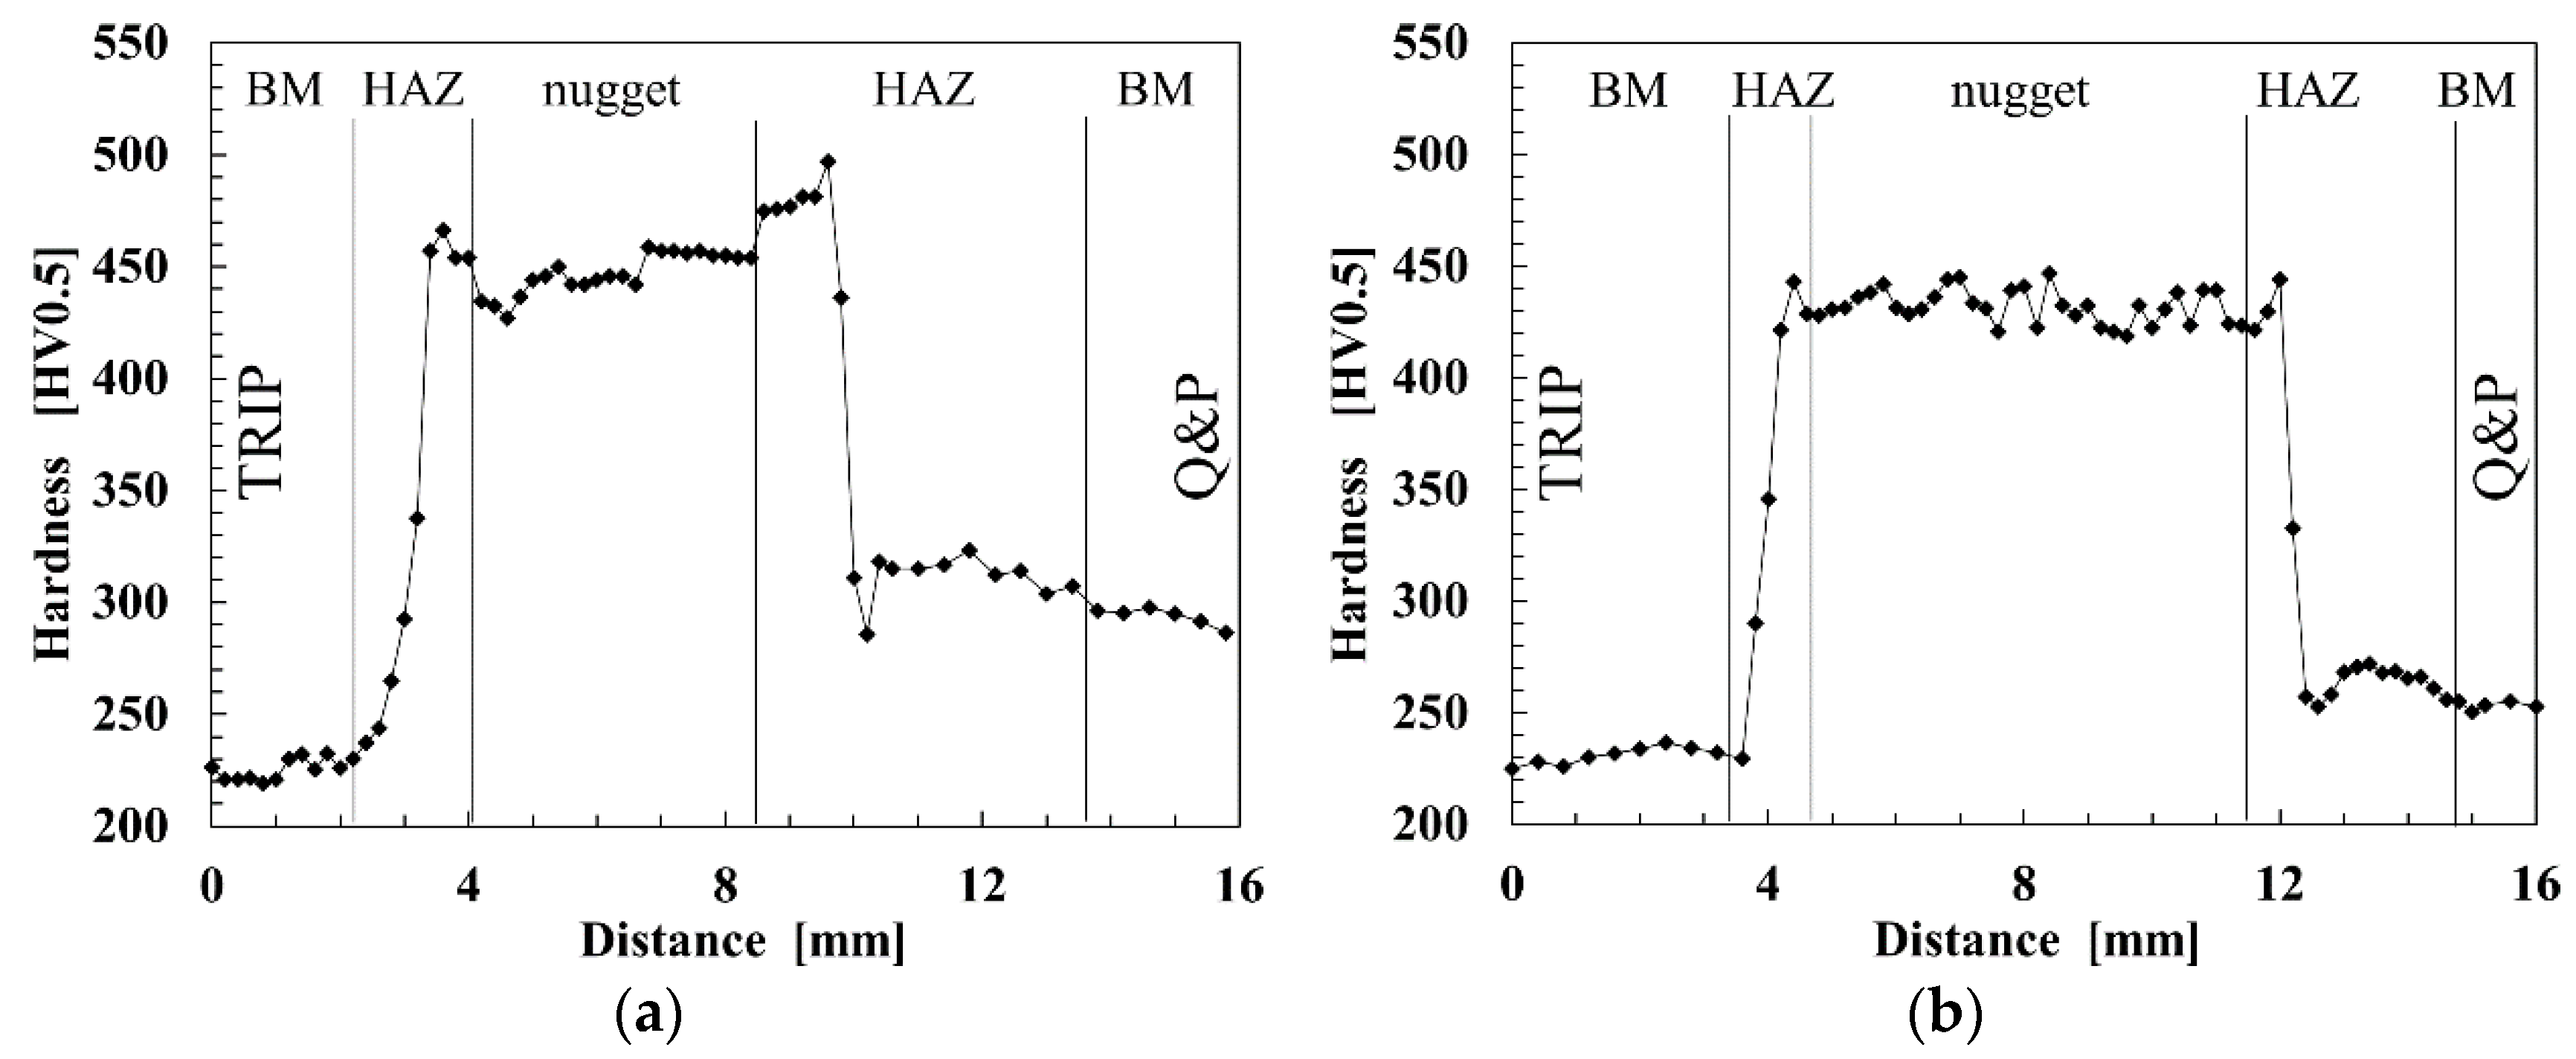
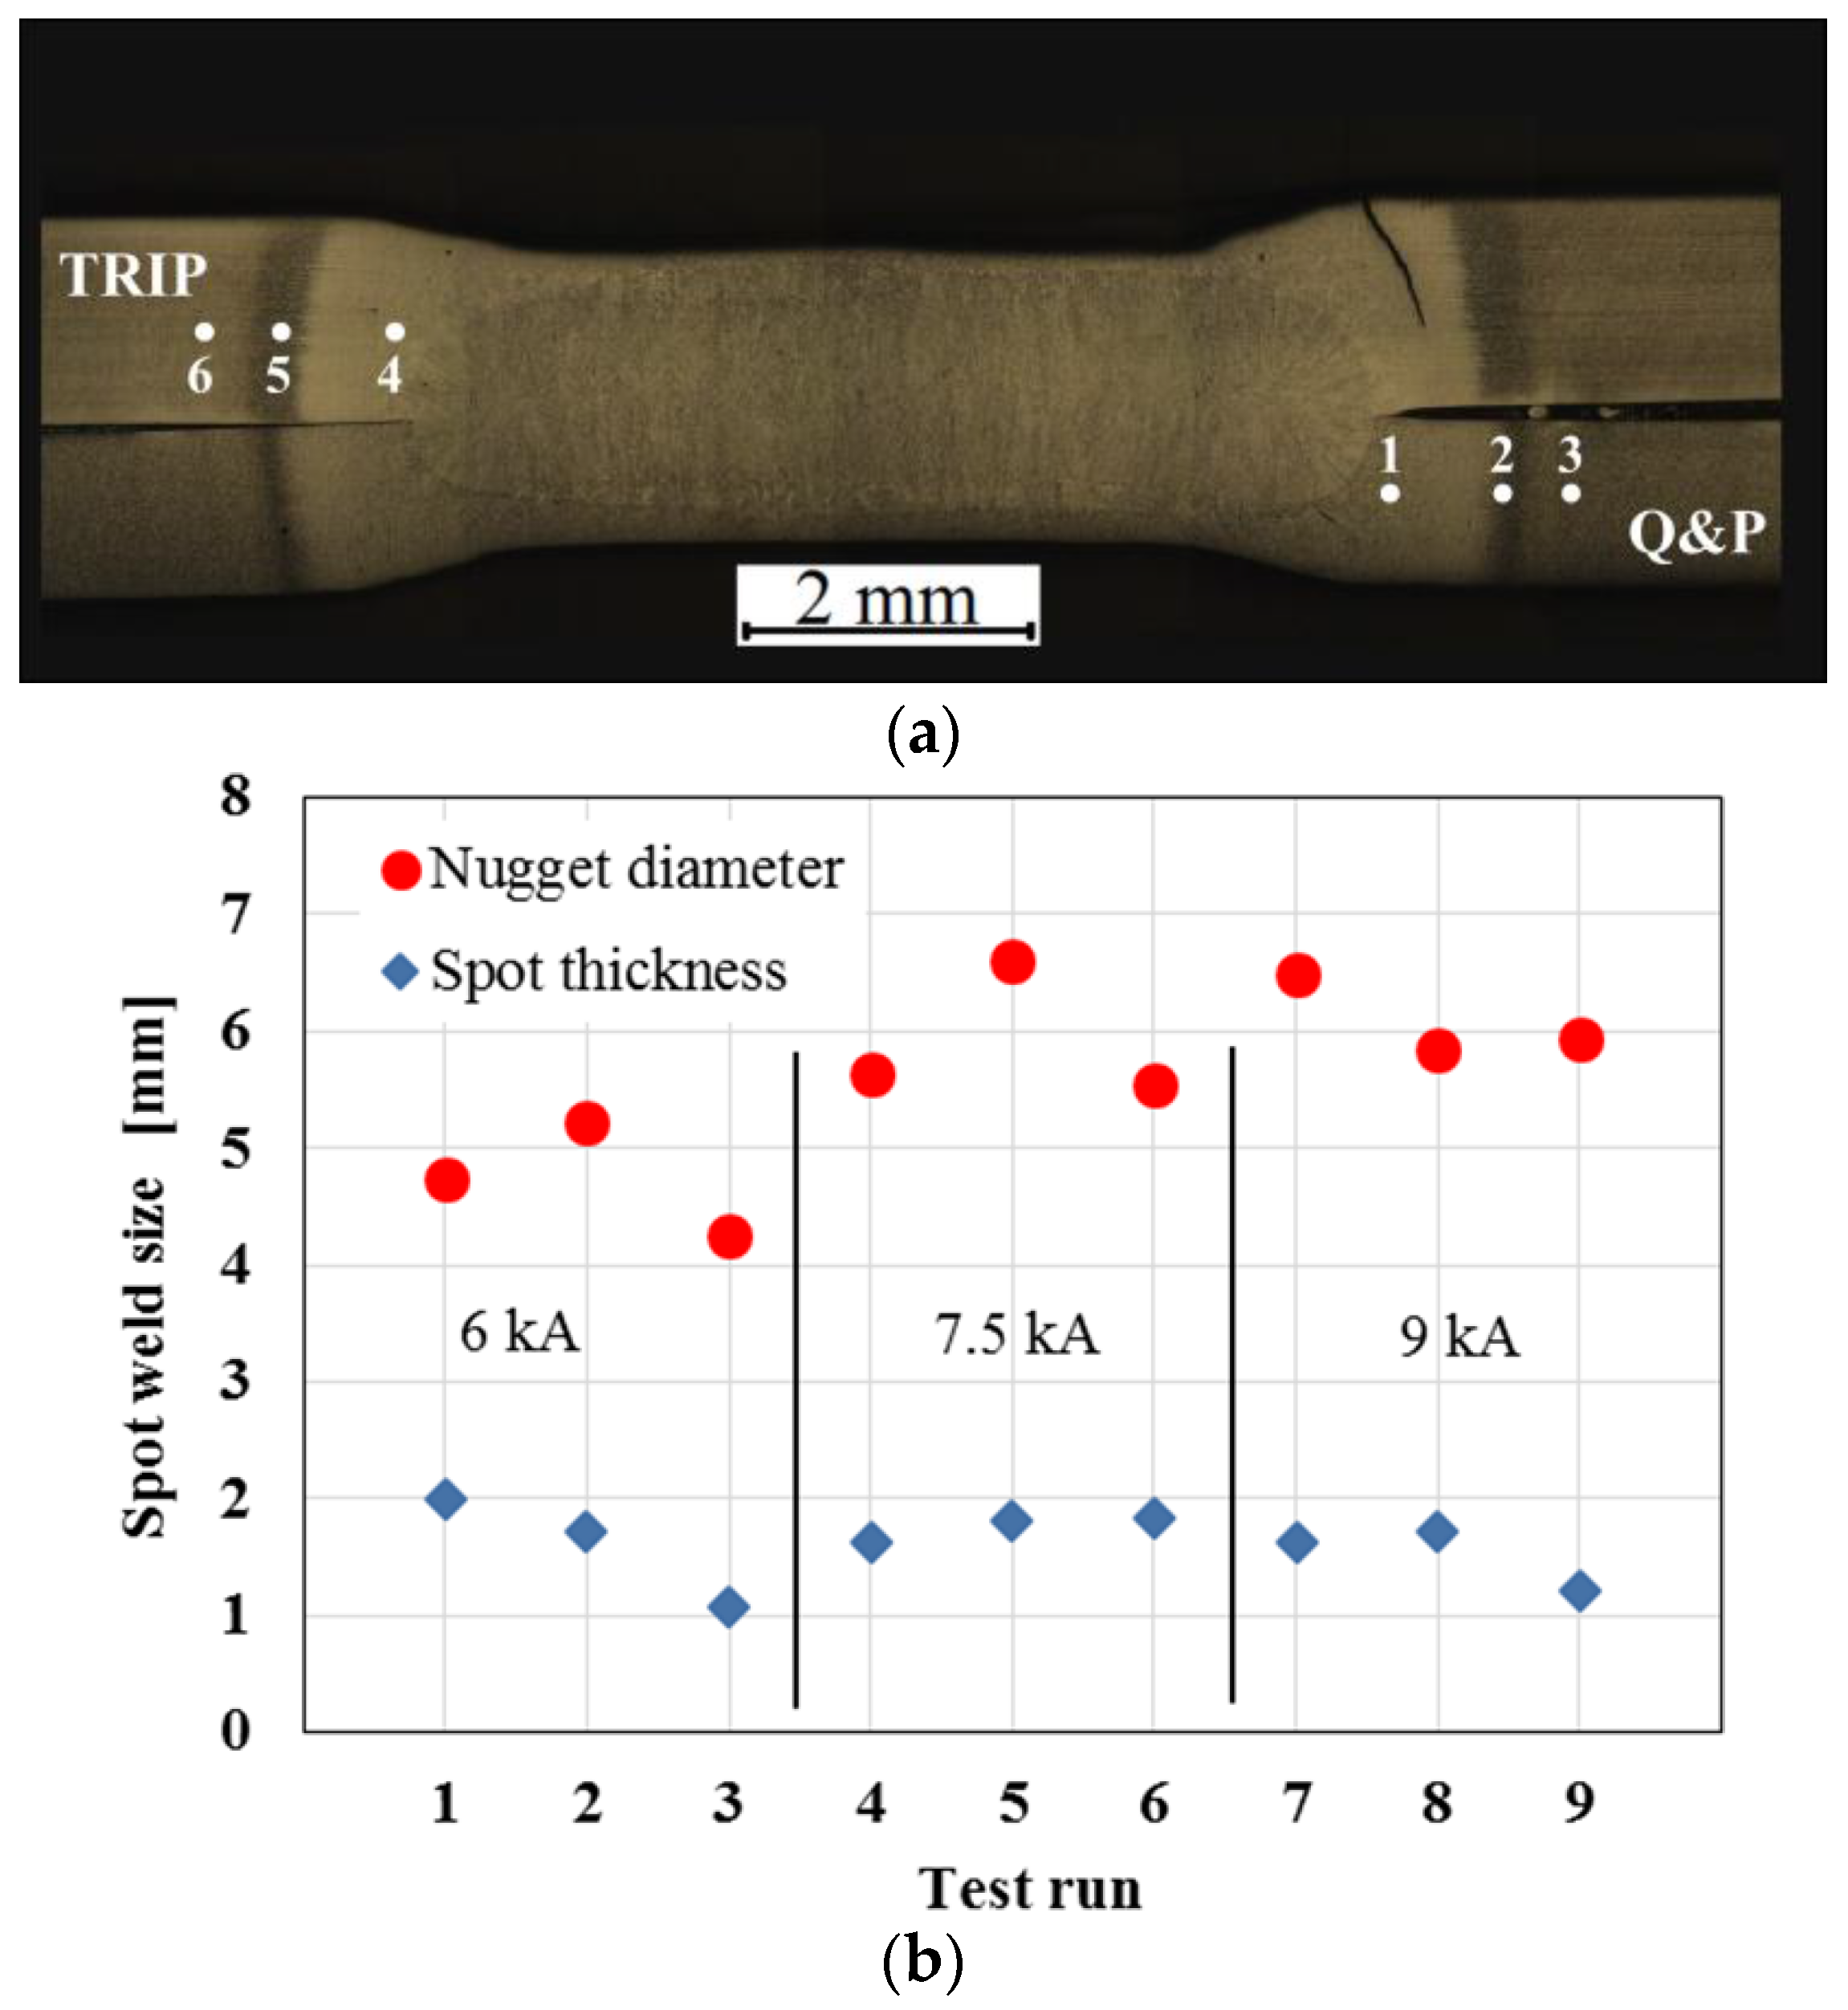
3.1. Spot Weld Microstructural and Hardness Characterization

Dissimilar spot welds are usually characterized by chemical heterogeneity in the fusion zone, due to the different chemical compositions of joined steels, and by nugget asymmetry, because of their different thicknesses, melting points, thermal and electrical conductivities [8]. Figure 4 displays a typical nugget obtained from the Q&P/TRIP welds, as well as the average nugget diameter and spot thickness for the different welding runs. It can be seen that the nugget is slightly asymmetric with respect to the faying surface (Figure 4a). This can mainly be attributed to the different thicknesses of the welded sheets. As already known from the literature, the Q&P/TRIP nuggets widen as the welding current is increased. The clamping force exhibits the opposite behavior instead: a larger force reduces the shear strength of spot welds. This is coherent with the effect of the clamping force on a microscopic scale: the area and the number of regions where the sheets and the electrode tips are in direct contact increase as the clamping force increases. As a result, the total electrical contact resistance and, hence, the current density decrease, and, in turn, the heat input also decreases. Therefore, the spot welds tend to exhibit the smallest nuggets for the same current level when the highest clamping force is used. The joint thickness is mainly reduced for increased clamping forces (Figure 4b).
Figure 5 shows the microstructural changes of the Q&P and TRIP steels in the HAZ regions (from near the fusion zone to near the base metal), whereas two representative spot weld microhardness profiles (welding configurations No. 3 and 7) are displayed in Figure 6. Overall, the microstructures of the fusion zone and the HAZ of the Q&P and TRIP steels are similar in all the welding configurations; however, their size changes at varying welding parameters. The heat input involved in the joining process has a notable effect on the microstructures and, in turn, on the hardness of the joints and steels. The high cooling rate in the fusion zone (between the two water-cooled electrode tips) induces the formation of a full martensite microstructure, as also pointed out by the corresponding high hardness values. The scattering in the hardness of the fusion zone can mainly be attributed to a local inhomogeneous chemical composition (e.g., segregations). The regions close to the fusion zone on both steel sides fully austenitized, thereby inducing the formation of a full martensitic structure. The hardness of the martensitic structures in the HAZs of the Q&P and TRIP steels is quite similar, with the former steel having a slightly higher hardness in some cases (consistently with the carbon content of the two steels) (Figure 6a). Moving toward the parent steels, the thermal cycle promoted intercritical transformations or tempering of the microstructures. On the Q&P side, martensite formed by cooling from the intercritical regions. Far away, the previous martensite tempered, showing a decrease in hardness with the presence of local minimum values, whereas the retained austenite transformed into bainite, with a corresponding increase in hardness close to the base metal. On the TRIP side, the previous bainite tempered, the retained austenite transformed into bainite, whereas the ferrite grains slightly enlarged. Overall, a continuous decrease in hardness occurred from the martensitic region, close to the nugget, to the base metal.

3.2. Monitoring of the Welding Parameters

Figure 7 shows the types of signals that were obtained from the monitoring of the welding current and electrode tip voltage. As metal expulsion did not occur, Figure 7a, the current increased at the beginning of the joining process until it reached the set value (root mean square, RMS). Then, the current was held constant by the electric inverter of the welding machine. Consequently, the electrode tip voltage and electrical resistance modified based on the changes in the growth of the nugget.
The presence of a metal expulsion abruptly reduced the electrical resistance of the sheet stack, inducing a local drop in the welding current and electrode tip voltage (Figure 7b–d). This drop in electrical resistance is amenable to the collapse around the nugget that reduces the sheet stack thickness through which any additional current must flow along with the widened effective contact area due to the expelled molten metal entrapped on the faying surface [16]. The resistance drop can be used to quantify the severity of a metal expulsion: the larger the loss of material in an expulsion event, the larger the reduction in dynamic resistance (in mΩ) [17]. Metal expulsion could happen through a single large expulsion, Figure 7d, or through multiple expulsions (Figure 7b,c). The former type occurred for run No. 9 and for some samples No. 8, whereas the latter occurred for runs No. 4 and 7 and for some samples No. 8. The appearance of a single expulsion is probably due to the largest clamping force that was used (4 kN) in the welding configuration No. 9. Metal expulsion occurred as soon as molten metal temporarily exceeded the compressive force of the surrounding solid, but the high clamping force was then able to prevent further metal losses. In all the samples of No. 9, the resistance drops occurred in the 140–170 ms range along with a reduction of 0.04–0.05 mΩ. The number of expulsions increased as the clamping force was reduced since the molten metal was able to reach a critical pressure several times during the joining process. Two or even fewer expulsions were observed in the samples No. 8 (3 kN), but they were more numerous in the samples No. 4 and 7, which were welded with the lowest clamping force (2 kN). It can be observed from Figure 7b,c that a larger metal expulsion occurred at the beginning of the joining process, in the 40–60 ms range, and this was then followed by other less severe expulsions. These expulsions took place over shorter times for the samples No. 7, whereas they were distributed over longer times for the samples No. 4. The largest expulsions were similar to those detected for the samples No. 9, which underwent a resistance drop of 0.04–0.05 mΩ. The successive expulsions, instead, exhibited a decrease in resistance of 0.01–0.015 mΩ.

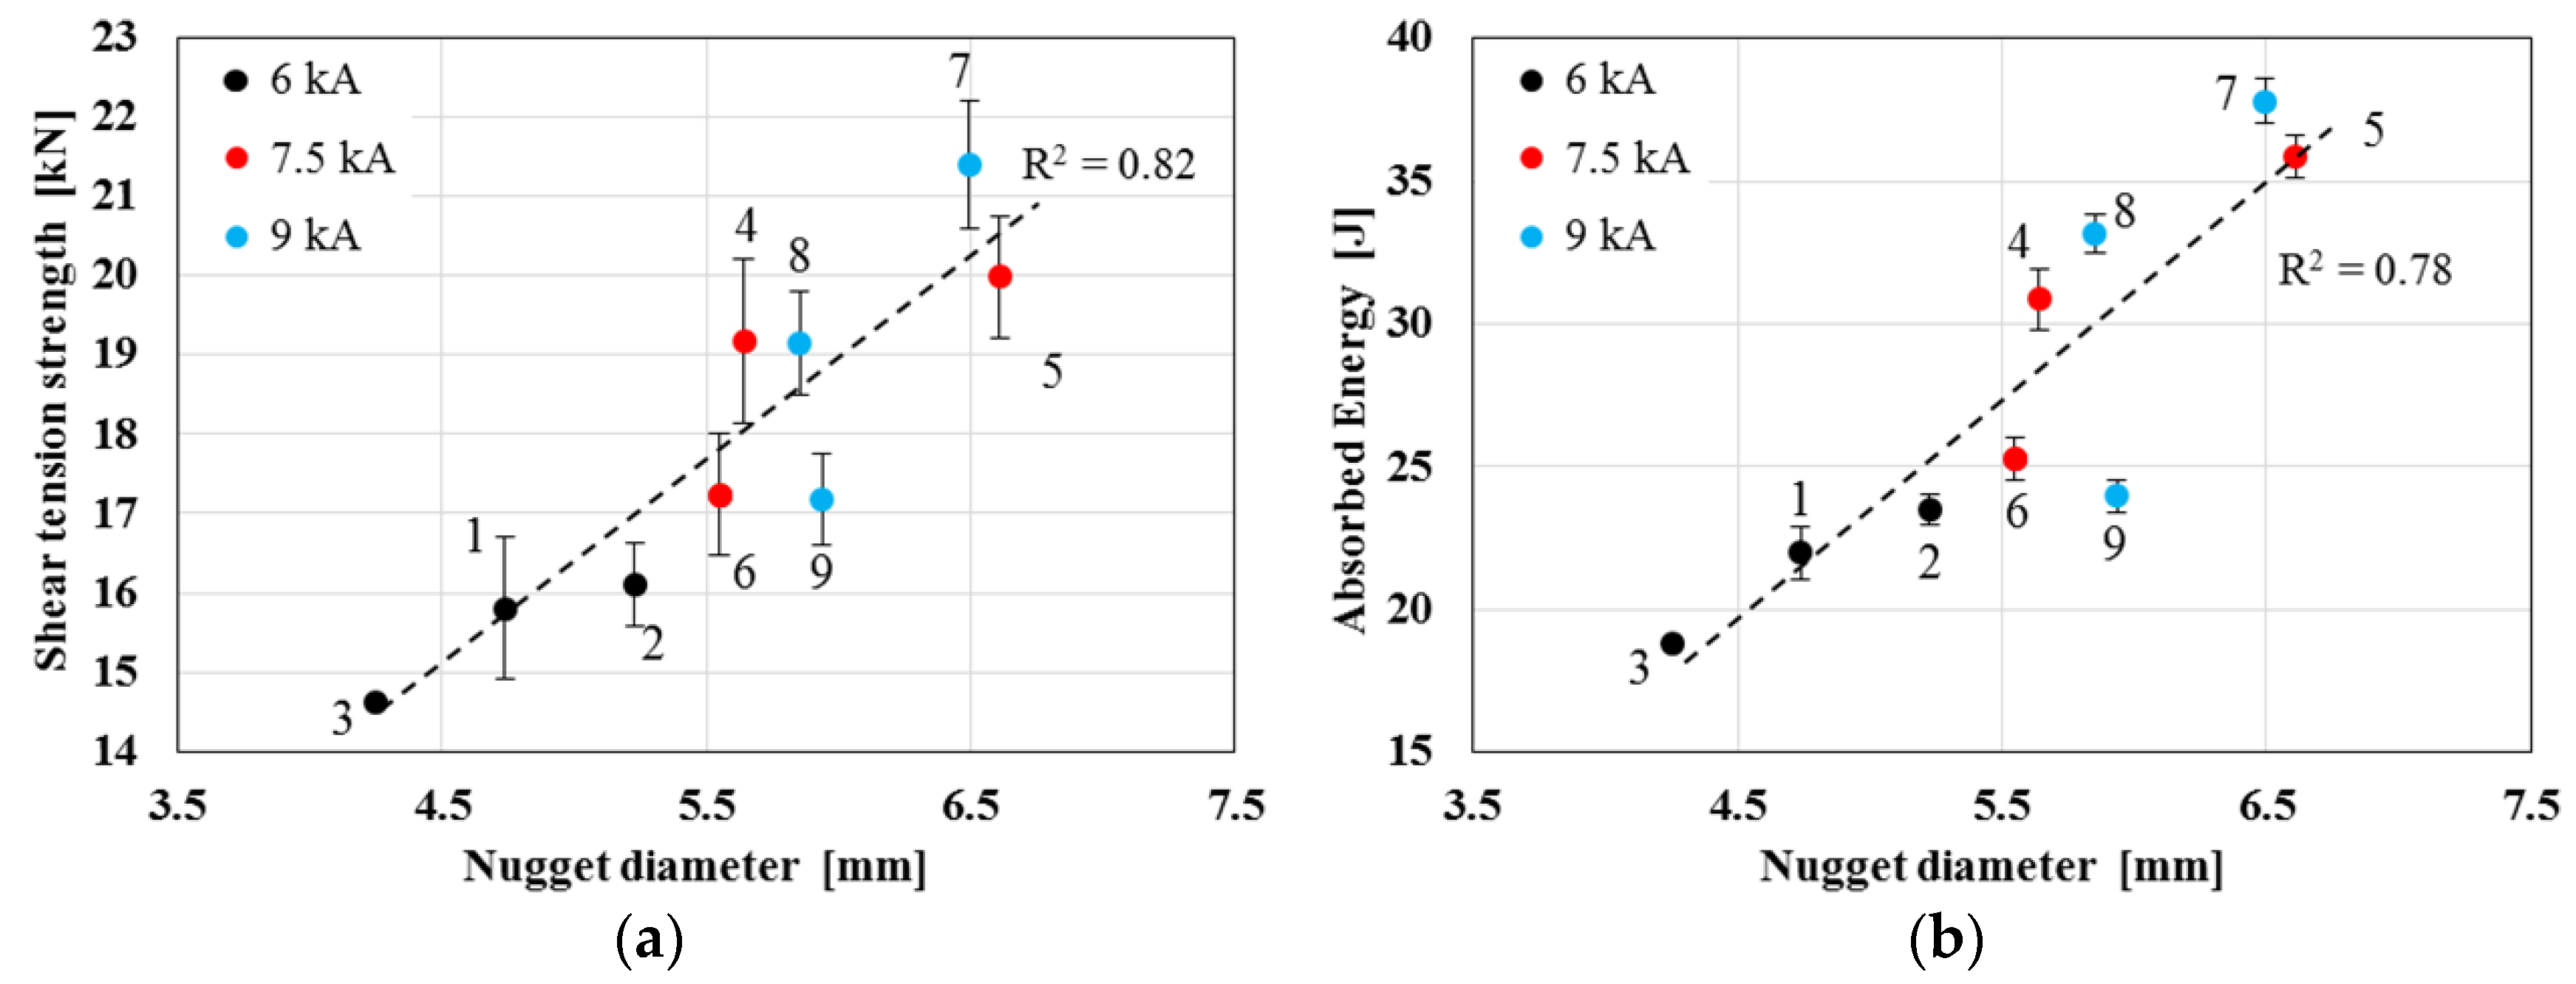
3.3. Shear and Cross Tension Tests

The results of the shear and cross tension tests for the nine welding configurations are listed in Table 4, whereas Table 5 shows the results obtained from the multifactor ANOVA carried out on the strength values. The ANOVA results point out that all the welding parameters are statistically significant, at the 95% confidence level, in affecting the shear strength of welded samples. The welding current is the most important parameter influencing strength (55.9%), followed by the clamping force (22.4%) and the welding time (5.6%). Owing to the lack of more experimental combinations, the possible interactions among the welding parameters cannot be calculated, although their contribution is below 16.1% (residual contribution). The ANOVA performed on the cross tension values shows that the welding parameters are not statistically significant at the 95% confidence level. This is due to the slight changes in the strength values at varying welding combinations. However, some considerations can be made if the cross strength is normalized to the spot weld size, as discussed hereafter.
The influences of the welding parameters on the shear strength are summarized in the interval plots of Figure 8. It can be seen that the welding current increases the shear strength of the spot welds from 6 to 9 kA. However, the increase in strength is limited when the current passes from 7.5 to 9 kA. This may be attributed to the occurrence of metal expulsions, which limit the improvement in strength that could be obtained with a higher welding current. The effect of the clamping force on the shear strength is similar at 2 and 3 kN, whereas it significantly reduces the shear strength at 4 kN. Two main factors are responsible for the reduction in the spot strength as the clamping force is increased: (i) higher clamping forces reduce the heat input and, in turn, the nugget size (as previously mentioned); (ii) the indentation of the electrode tips on the sheet surfaces induces high stress concentrations in the regions around the weld nugget [18,19]. The welding time has the same effect on the shear strength up to 325 ms, whereas it increases the strength for 450 ms. However, its contribution is not important, as can be deduced from the ANOVA table.
Figure 9 and Figure 10 display the shear and cross tension strength as functions of the nugget diameter. Since the displacement values have the same trend as the absorbed energy values, they have not been plotted so as to avoid redundant data. As expected, the shear tension strength and absorbed energy increase as the nugget size increases. Test run No. 7 (9 kA, 2 kN, 450 ms) gives the maximum strength and absorbed energy coherently with the maximum current and welding time used for this configuration. In this regard, even though metal expulsion occurred during run No. 7, due to the high current, it only happened at the beginning of the joining process and not for most of the time (for about 300 ms), as shown in Figure 7c. This promoted the formation of large nuggets and, in turn, the highest strengths. The metal expulsion had a more negative effect on the samples No. 8 and 9 for the same current level. In fact, these samples exhibited similar shear strengths to those of the samples No. 4 and 6, which were welded with a lower current. Since they were welded with a shorter time, and large expulsions occurred in the middle of the joining process, the capability of the nugget to growth was probably reduced.
As can be seen from Figure 9, although the samples No. 5 exhibit a slightly larger nugget and they did not experience any expulsion, they exhibit lower strength values than samples No. 7. Considering that the welding time has a low contribution to the shear strength (see the ANOVA table), this discrepancy may be attributed to the stronger electrode indentation caused by the higher clamping force. This would also justify the higher strength values of the samples No. 4 than those of the samples No. 6, which have a similar nugget but were subjected to a higher clamping force, as well as the lower strength values obtained for the samples (welded with the same current level) that were clamped with the highest force. Absorbed energy shows the same trend as the shear strength. Therefore, metal expulsion also reduces the energy absorbing attitude of the spot welds during mechanical loading, and also presumably their tendency to withstand impulsive loads in the case of vehicle accidents.
A common way of assessing the mechanical response of cross-welded samples is to make use of the α ratio normalized to the spot weld size, in kN/mm2, as follows [20]:
α = CTS/(dn × ths),
where CTS is the cross tension strength, dn is the nugget diameter and ths is the sheet thickness. Since the experimental welding tests involved steels with different thicknesses, α has been computed considering the minimum thickness, based on the ISO standard [13], where the thinnest sheet also guides welding parameters. On the basis of the α values, three different groups can be defined from Figure 10a, where the typical linearity between stress and nugget size is held. The first group includes runs No. 1 and 3, where α is about 1. The second group consists of samples welded with different welding currents, with the cross tension strength increasing as the current is increased, where α is about 0.8. In the third group, α is about 0.7. The graph shows roughly that the capability of spot welds to withstand cross tension stresses, in terms of strength per unit of area, reduces as the nugget increases and metal expulsion occurs. Samples with large nuggets that experienced metal expulsions at high currents (runs No. 7–9) exhibit similar cross tension strengths to those of the samples welded with lower currents. These results are coherent with those of a previous work by Huin et al. about the dissimilar welding of DP and hot stamping boron steels [21].

3.4. Spot Weld Fracture

During the shear tension tests, the Q&P/TRIP spot welds could fail either by interfacial fracture or by button pull (Figure 11). Interfacial fractures occurred in all of the samples welded during the run No. 1 and in some samples obtained with runs No. 2 and 3. This fracture mode is due to the small size of the nuggets, which were not able to sustain large shear stresses. It can be noted that the tendency of interfacial to button pull fracture from low to high current is coherent with the increase in the size of the nugget.
The button pull fractures could appear in two different modes, depending on the crack propagation path. In one case, a fracture grew along the lateral border of the nugget (with respect to the cross section in Figure 4a) and through the sheet in the samples with an intermediate shear tension strength, as occurred for the runs No. 6 and 9, and partially for runs No. 2–5. In other cases, cracks spread in the HAZ of the Q&P steels, particularly in the region where the original microstructures tempered due to the heat input, as occurred for runs No. 7 and 8 and partially for runs No. 4 and 5. In both of the button pull fractures, failure mainly occurred on the Q&P side, due to its reduced thickness compared to the TRIP steel. The transition from the two types of failures is induced by the bending moment caused by the rotation of the welded joint during the mechanical test. In fact, if the weld nugget is sufficiently large, it can rotate during the test. Therefore, the stress condition, which is initially shear, primarily becomes tensile along the sheets [19]. At this state of stress, the region with the lowest tensile strength breaks, thus leading to the final fracture. This explanation justifies the fracture in the HAZ of Q&P steels where the martensite tempered, this being the region with the minimum hardness (see Figure 6) and, in turn, the minimum strength.
The fracture modes that have been obtained from the cross tension tests are summarized in Figure 12. The spot welds exhibit two different modes of fracture: interfacial fracture with button pull and button pull by partial dome fracture. Coherently with the thinner thickness, the Q&P sheet deformed more than the TRIP sheet, and the fractures mainly propagated on the Q&P side. The former fracture only occurred for the samples welded during run No. 1, Figure 12a,b, due to the small size of the nuggets generated by the low heat input. The cracks nucleated at the notch tip of the faying surface, which is a site of stress concentration, and then propagated in an interfacial mode; at a given distance, the bending moment involved in the nugget changed the crack path from the faying surface to through the Q&P sheet, due to the cross load and the presence of the crack itself, up to the final failure. The partial dome fractures could be characterized either by a crack propagation along the border of the nugget and then through the Q&P sheet (Figure 12d) or by a fracture that could also involve the HAZ regions of the two steels (Figure 12f). The transition between the two types of button pull failures is attributable to the nugget size and to the angle between the faying surface and the border of the nugget close to the notch tip. The lower the angle, the greater the tendency of a fracture to spread along the nugget border [21]. Moreover, the presence of metal splashes at the notch tip, referring to the left-hand notch tip in Figure 7f, could promote crack propagation in the HAZ regions, but not along the nugget border. This fracture mode was in fact observed in almost all of the samples that underwent metal expulsion.

4. Conclusions

This work has investigated the spot weldability of a Q&P steel with a TRIP steel for assembly applications for the automotive industry and the severity and effect of metal expulsion on load-carrying capability of Q&P/TRIP joints. The main results are summarized as follows:
  • Based on the monitored signals, expulsion can appear as a single event or multiple events during the joining process, its severity being assessed by the extent of the dynamic resistance drop.
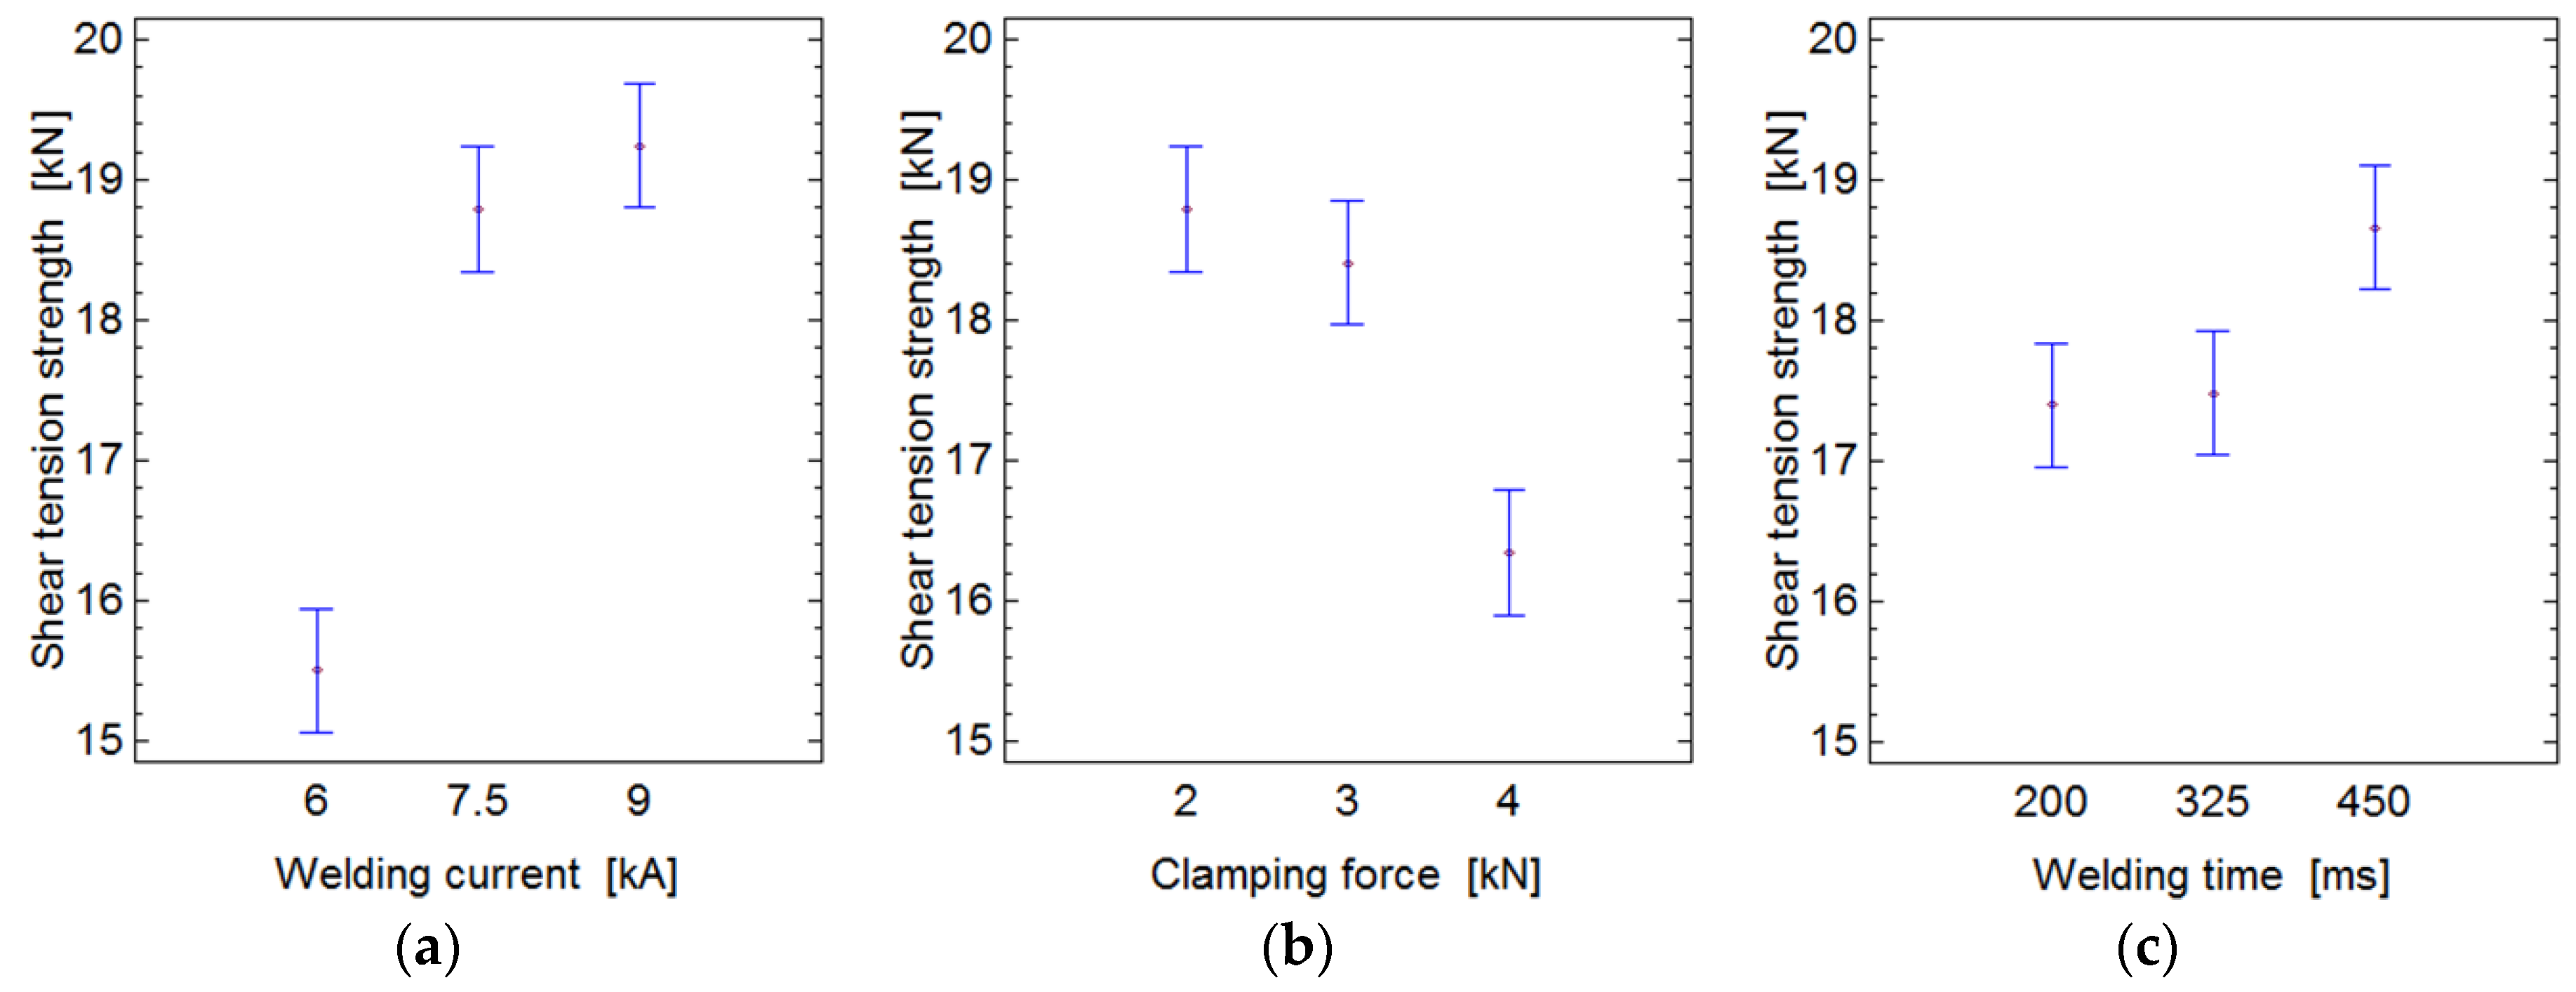
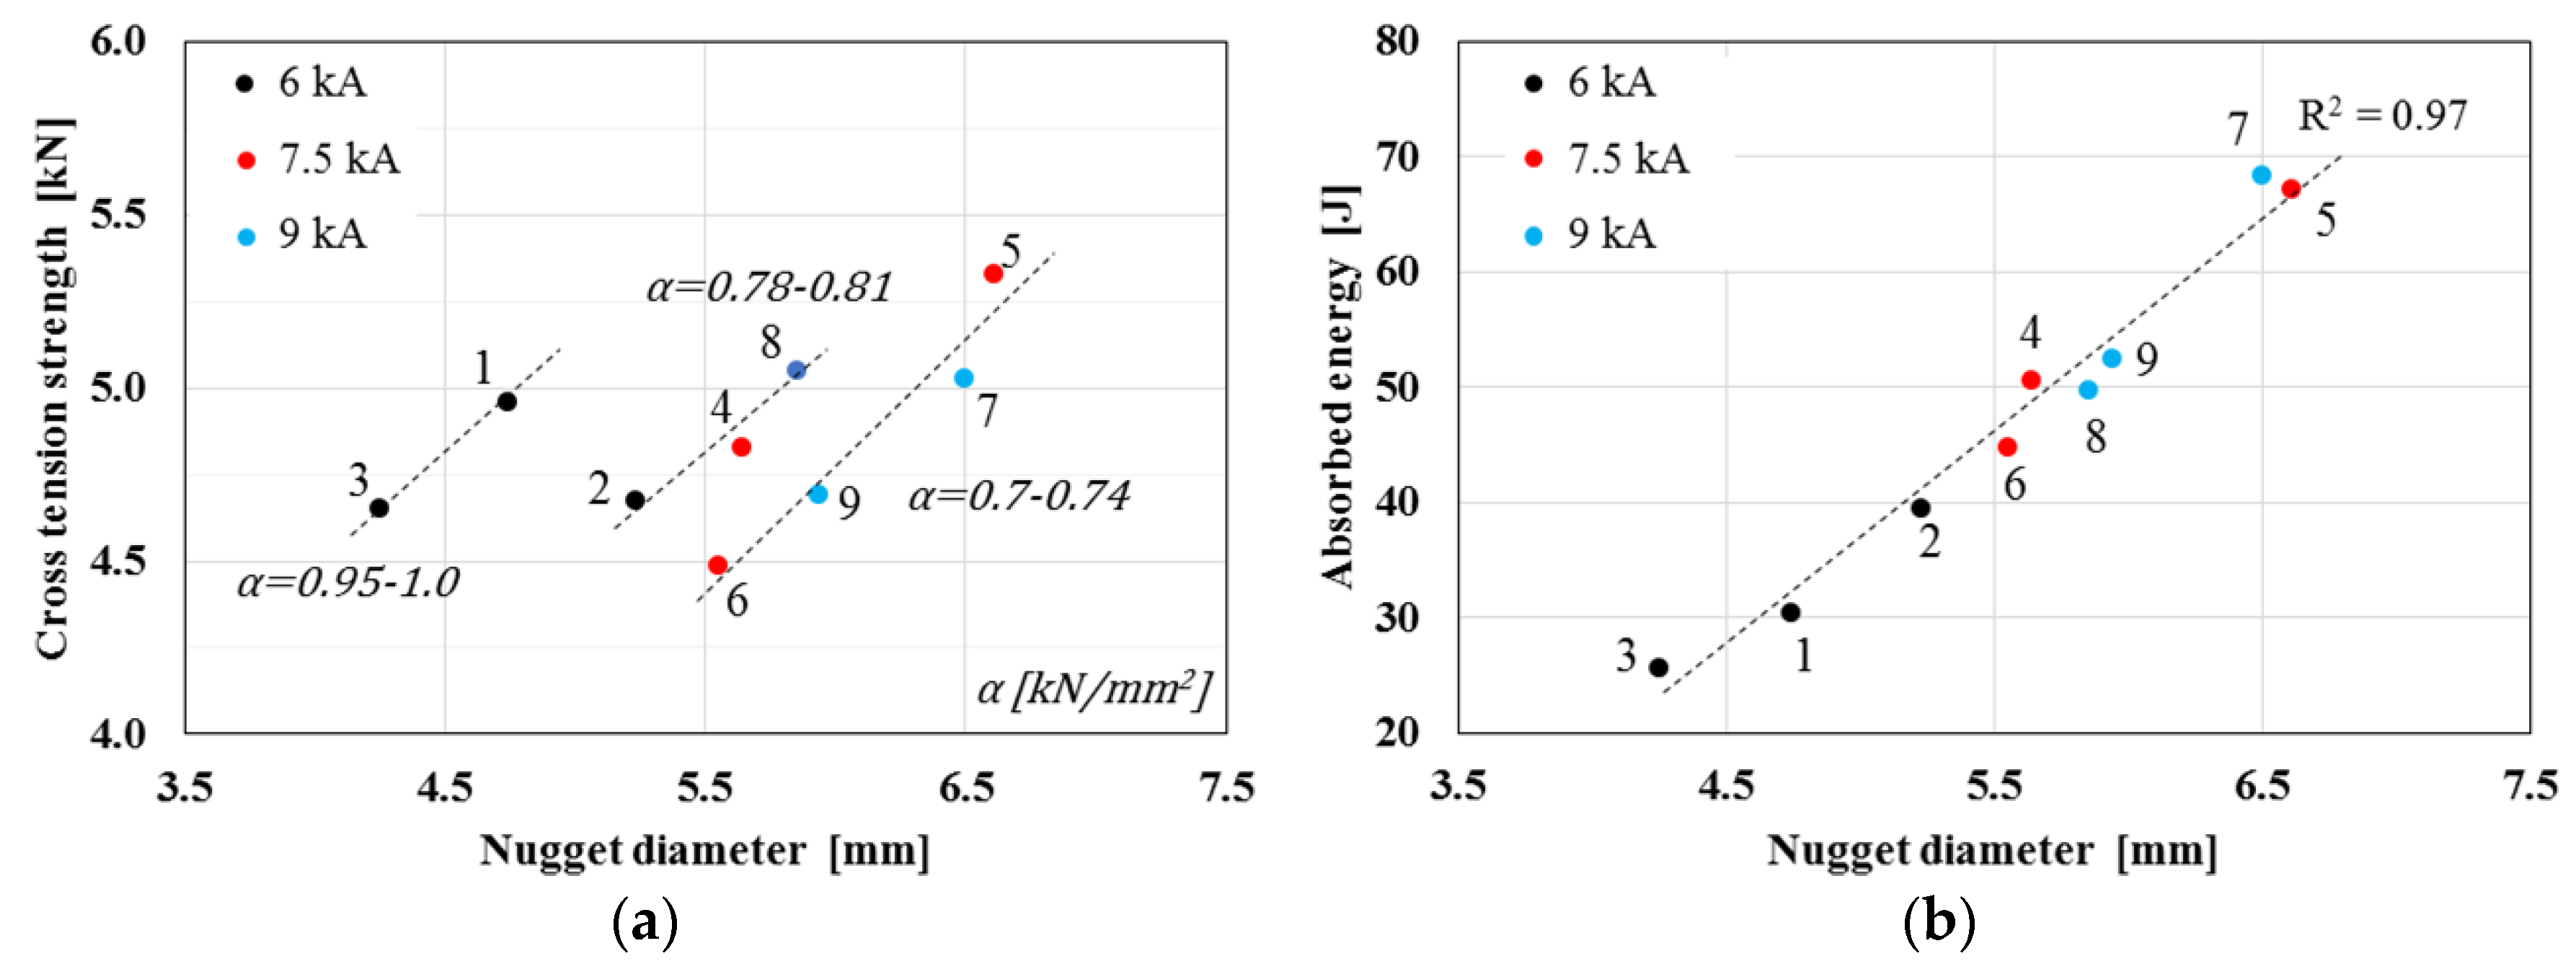
  • The welding current is the most important parameter that affects the shear strength, followed by the clamping force and welding time. No statistical significant parameters have been found for the cross tension strength; however, the cross tension strength normalized by to spot size (α) points out the detrimental effect of a metal expulsion.
  • If the expulsion occurs at the beginning of the joining process and for a short time, its harmful effect on shear strength is more limited for the longest welding time (sample No. 7, 450 ms).
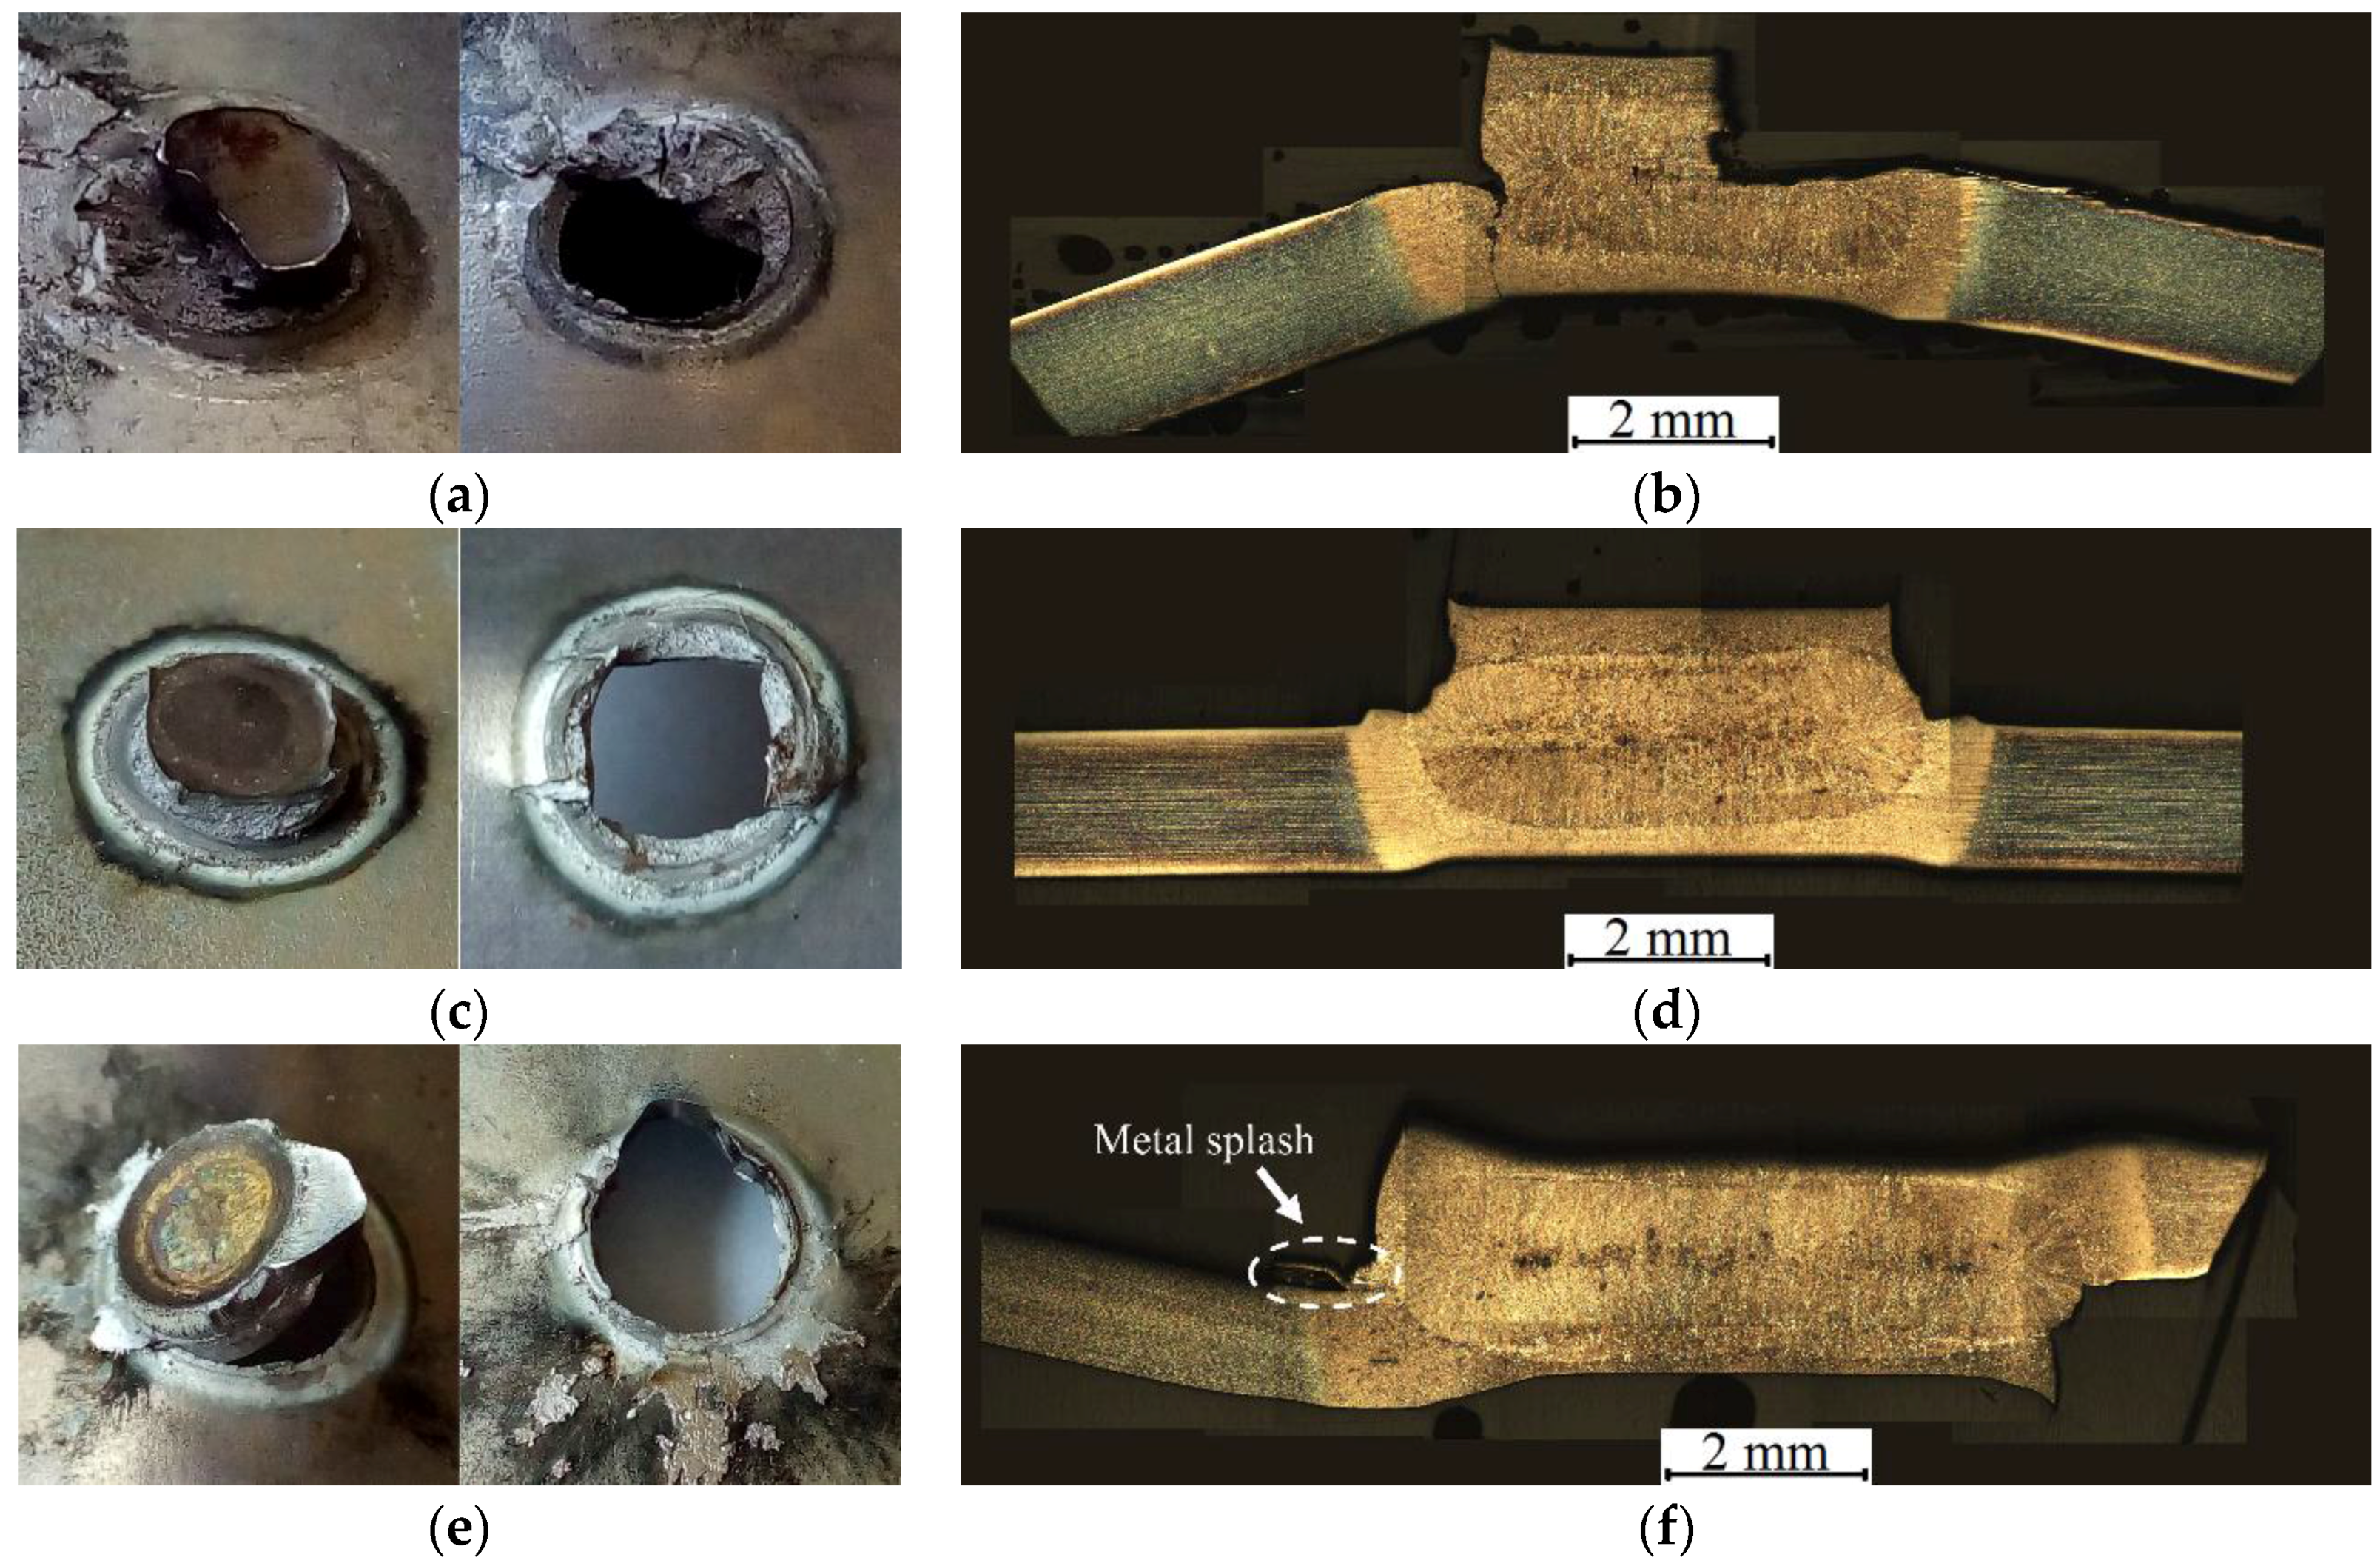
  • The shear-welded samples failed by interfacial and button pull fractures. Button pull fractures could occur by crack propagation along the nugget border or in the Q&P HAZ where previous martensite tempered.
  • Cross-welded samples failed by interfacial and button pull, and button pull by partial dome fracture. Metal splashes promoted the crack propagation through the HAZ regions in partial dome fractures.
  • Run No. 5 (7.5 kA, 3 kN, 450 ms) represents the best welding combination since it ensures spot welds with high shear and cross tension strengths and the absence of metal expulsion.

Acknowledgments

The authors are grateful to the Free University of Bozen–Bolzano that supported this research work (Grant No. TN2001, scientific coordinator: Pasquale Russo Spena). The authors would also like to thank Giovanni Marchiandi (Politecnico di Torino), which supported the cross tension tests.

Author Contributions

Pasquale Russo Spena, Manuela De Maddis and Franco Lombardi conceived and designed the experiments; Pasquale Russo Spena and Manuela De Maddis performed the welding tests; Pasquale Russo Spena carried out the metallographic analysis, shear tension tests and microhardness measurements; Manuela De Maddis and Franco Lombardi performed the cross tension tests; the authors with the contribution of Gianluca D’Antonio analyzed the data of welding monitoring; and Pasquale Russo Spena wrote the paper with the support of Manuela De Maddis and Franco Lombardi.

Conflicts of Interest

The authors declare no conflict of interest. The Free University of Bozen-Bolzano, which has founded this work, had no role in the design of the study; in the collection, analyses, or interpretation of data; in the writing of the manuscript, and in the decision to publish the results.

References

  1. De Moor, E.; Speer, J.G.; Matlock, D.K.; Kwak, J.H.; Lee, S.B. Effect of carbon and manganese on the quenching and partitioning response of CMnSi steels. ISIJ Int. 2011, 51, 137–144. [Google Scholar] [CrossRef]
  2. Sun, J.; Yu, H. Microstructure development and mechanical properties of quenching and partitioning (Q&P) steel and an incorporation of hot-dipping galvanization during Q&P process. Mater. Sci. Eng. A 2013, 586, 100–107. [Google Scholar] [CrossRef]
  3. Rossini, M.; Russo Spena, P.; Cortese, L.; Matteis, P.; Firrao, D. Investigation on dissimilar laser welding of advanced high strength steel sheets for the automotive industry. Mater. Sci. Eng. A 2015, 628, 288–296. [Google Scholar] [CrossRef]
  4. Casalino, G.; Campanelli, S.L.; Ludovico, A.D. Laser-arc hybrid welding of wrought to selective laser molten stainless steel. Int. J. Adv. Manuf. Tech. 2013, 68, 209–216. [Google Scholar] [CrossRef]
  5. Peterson, W.; Borchelt, J. Maximizing cross tension impact properties of spot welds in 1.5 mm low carbon, dual-phase, and martensitic steels. In SAE Technical Paper 2000-01-2680; SAE International: Warrendale, PA, USA, 2000. [Google Scholar]
  6. Donders, S.; Brughmans, M.; Hermans, L.; Tzannetakis, N.O. The effect of spot weld failure on dynamic vehicle performance. Sound Vibrat. 2005, 39, 16–25. [Google Scholar]
  7. Wang, B.; Duan, Q.Q.; Yao, G.; Pang, J.C.; Li, X.W.; Wang, L.; Zhan, Z.F. Investigation on fatigue fracture behaviors of spot welded Q&P980 steel. Int. J. Fract. 2014, 66, 20–28. [Google Scholar] [CrossRef]
  8. Russo Spena, P.; Maddis, M.D.; Lombardi, F.; Rossini, M. Dissimilar resistance spot welding of Q&P and TWIP steel sheets. Mater. Manuf. Process. 2016, 31, 291–299. [Google Scholar] [CrossRef]
  9. Russo Spena, P.; Cortese, L.; Maddis, M.D.; Lombardi, F. Effects of process parameters on spot welding of trip and quenching and partitioning steels. Steel Res. Int. 2016, in press. [Google Scholar] [CrossRef]
  10. Zhang, H. Expulsion and its influence on weld quality. Weld. J. 1999, 78, 373-s–380-s. [Google Scholar]
  11. Zhang, H.; Senkara, J. Resistance Welding: Fundamentals and Applications, 2nd ed.; CRC Press: London, UK, 2011. [Google Scholar]
  12. AWS D8.9M, Test Methods for Evaluating the Resistance Spot Welding Behavior of Automotive Sheet Steel Materials; American Welding Society (AWS): Miami, FL, USA, 2012.
  13. International Organization for Standardization. Resistance Welding-Weldability-Part 2: Alternative Procedures for the Assessment of Sheet Steels for Spot Welding; ISO Copyright Office: Geneva, Switzerland, 2004. [Google Scholar]
  14. CWT Specification, Power Electronic Measurement Ltd. Available online: www.pemuk.com (accessed on 7 November 2016).
  15. AWS D8.1M, Specification for Automotive Weld Quality—Resistance Spot Welding of Steel; American Welding Society (AWS): Miami, FL, USA, 2013.
  16. Dickinson, D.W.; Franklin, J.E.; Stanya, A. Characterization of spot welding behavior by dynamic electrical parameter monitoring. Weld. J. Weld. Res. Suppl. 1980, 59, 170–176. [Google Scholar]
  17. Garza, F.; Das, M. On real time monitoring and control of resistance spot welds using dynamic resistance signatures. In Proceedings of the 44th IEEE 2001 Midwest Symposium on Circuits and Systems MWSCAS, Dayton, OH, USA, 14–17 August 2001.
  18. Pouranvari, M.; Asgari, H.T.; Mosavizadch, S.M.; Marashi, P.H.; Goodarzi, M. Effect of weld nugget size on overload failure mode of resistance spot welds. Sci. Technol. Weld. Join. 2007, 12, 217–225. [Google Scholar] [CrossRef]
  19. Chao, Y.J. Failure modes of spot welds: Interfacial versus pullout. Sci. Technol. Weld. Join. 2003, 8, 133–137. [Google Scholar] [CrossRef]
  20. Biro, E.; Cretteur, L.; Dupuy, T. Higher than expected strengths from dissimilar Configuration advanced high strength steel spot welds. In Proceedings of the Sheet Metal Welding Conference XV, Livonia, MI, USA, 2–5 October 2012.
  21. Huin, T.; Dancette, S.; Fabrègue, D.; Dupuy, T. Investigation of the failure of advanced high strength steels heterogeneous spot welds. Metals 2016, 6, 111. [Google Scholar] [CrossRef]
Figure 1. SEM micrographs of the (a) Quenching and Partitioning (Q&P) and (b) Transformation Induced Plasticity (TRIP) steels in as-received conditions.
Metals 06 00270 g001
Figure 2. Geometrical size of the welded (a) shear tension and (b) cross tension specimens. Drawings not to scale.
Metals 06 00270 g002
Figure 3. The electrical transducer (Rogowski coil and integrator device) used in the welding tests [14].
Metals 06 00270 g003
Figure 4. Q&P/TRIP spot weld: (a) typical cross section appearance and (b) average nugget diameter and joint thickness obtained for the different welding conditions. The numbers from 1 to 6 define the locations of the microstructures displayed in Figure 5.
Metals 06 00270 g004
Figure 5. SEM micrographs of the microstructure in the heat affected zones (HAZs) on the (a) Q&P and (b) TRIP sides: from close to the fusion zone (left-hand images) to the base metals (right-hand images). The numbers from 1 to 6 refer to the locations pointed out in Figure 4.
Metals 06 00270 g005
Figure 6. Typical microhardness profiles of the Q&P/TRIP welds. Welding configurations: (a) run No. 3 (6 kA, 4 kN, 450 ms); and (b) run No. 7 (9 kA, 2 kN, 450 ms).
Metals 06 00270 g006
Figure 7. Typical results of the monitoring of the welding current and electrode tip voltage, as well as of the calculated electrical resistance: (a) run No. 2 without metal expulsion; (b) run No. 4; (c) No. 7; and (d) No. 9 with metal expulsion. I: welding current; R: electrical resistance; V: electrode tip voltage.
Metals 06 00270 g007
Figure 8. Mean shear tension strength and standard error (95% confidence intervals) for each level of the welding parameters: (a) welding current; (b) clamping force; and (c) welding time.
Metals 06 00270 g008
Figure 9. (a) Shear tension strength and (b) absorbed energy of the spot welds for the different welding conditions. The numbers in the graph refer to the experimental runs.
Metals 06 00270 g009
Figure 10. (a) cross tension strength and (b) absorbed energy of the spot welds for the different welding conditions. The numbers in the graph refer to the experimental runs.
Metals 06 00270 g010
Figure 11. Modes of fractures of the spot welds obtained after the shear tension tests: (a,b) interfacial fracture; (c,d) button pull with the fracture path mainly along the nugget border; and (e,f) button pull with the fracture path through the steel sheet.
Metals 06 00270 g011
Figure 12. Modes of fractures of spot welds obtained after the cross tension tests, macroscopic and microscopic views. Typical fracture: (a,b) interfacial fracture with button pull; (c,d) partial dome fracture; and (e,f) button pull along nugget border and through HAZ steel sheet.
Metals 06 00270 g012
Table 1. Chemical composition (wt. %) of the Quenching and Partitioning (Q&P) and Transformation Induced Plasticity (TRIP) steels as measured by means of optical emission spectroscopy.
SteelC (%)Si (%)Mn (%)P + S (%)Al (%)Nb (%)
Q&P0.221.411.88<0.020.04<0.001
TRIP0.200.312.23<0.021.050.022
Table 2. Main mechanical properties of the Q&P and TRIP steels. UTS: ultimate tensile strength; YS: yield strength; ef: elongation at fracture.
SteelYS (MPa)UTS (MPa)ef (%)Hardness (HV0.5)
Q&P655100022260
TRIP52589027225
Table 3. L-9(33) orthogonal array for the welding tests, both for the shear and cross tension configurations. Iweld: welding current; Fclamp: clamping force; tweld: welding time.
RunIweld (kA)Fclamp (kN)tweld (ms)
162200
263325
364450
47.52325
57.53450
67.54200
792450
893200
994325
Table 4. Results of the shear and cross tension tests for the different welding configurations. Displ.: displacement; α: cross tension strength normalized to the spot weld size.
RunShear TensionCross Tensionα (kN/mm2)
Strength (kN)Energy (J)Displ. (mm)Strength (kN)Energy (J)Displ. (mm)
115.8 ± 0.921.9 ± 3.12.7 ± 0.34.9630.410.90.95
216.1 ± 0.523.5 ± 1.33.0 ± 0.34.6839.412.30.81
314.6 ± 0.118.8 ± 2.02.5 ± 0.34.6525.69.31.00
4.19.1 ± 1.030.8 ± 3.83.0 ± 0.24.8350.714.50.78
519.9 ± 0.835.8 ± 2.93.5 ± 0.15.3367.317.00.71
617.2 ± 0.725.3 ± 2.62.8 ± 0.14.4944.814.20.74
721.4 ± 0.837.8 ± 5.83.4 ± 0.45.0368.416.90.70
819.1 ± 0.633.1 ± 1.83.3 ± 0.15.0549.814.00.78
917.2 ± 0.623.9 ± 2.72.7 ± 0.24.6952.515.60.72
Table 5. ANOVA analysis of the shear tension strength values of the spot welds. SS: sum of squares; DoF: degree of freedom; MS: mean square; Fischer (F)-ratio; probability (p)-value.
ParameterSSDoFMSF-Ratiop-ValueContribution (%)
Current75.06237.5346.1<10−555.9
Force31.12215.5619.1<10−522.4
Time9.0124.505.50.0125.6
Residual16.28200.8116.1
Total131.4626

