CO2 Laser Cutting of Hot Stamping Boron Steel Sheets


Faculty of Science and Technology, Free University of Bozen-Bolzano, 39100 Bolzano, Italy
Metals 2017, 7(11), 456; https://doi.org/10.3390/met7110456
Submission received: 2 October 2017
/
Revised: 19 October 2017
/
Accepted: 23 October 2017
/
Published: 27 October 2017
(This article belongs to the Special Issue Metals Machining – Recent Advances in Experimental and Modeling of the Cutting Process)
Abstract
:This study investigates the quality of CO2 laser cutting of hot stamping boron steel sheets that are employed in the fabrication of automotive body-in-white. For this purpose, experimental laser cutting tests were conducted on 1.2 mm sheets at varying levels of laser power, cutting speed, and oxygen pressure. The resulting quality of cut edges was evaluated in terms of perpendicularity tolerance, surface irregularity, kerf width, heat affected zone, and dross extension. Experimental tests were based on a L9(34) orthogonal array design, with the effects of the process parameters on the quality responses being determined by means of a statistical analysis of variance (ANOVA). Quadratic mathematical models were developed to determine the relationships between the cutting parameters and the quality responses. Finally, a routine based on an optimization criterion was employed to predict the optimal setting of cutting factors and its effect on the quality responses. A confirmation experiment was conducted to verify the appropriateness of the optimization routine. The results show that all of the examined process parameters have a key role in determining the cut quality of hot stamping boron steel sheets, with cutting speed and their interactions having the most influencing effects. Particularly, interactions can have an opposite behavior for different levels of the process parameters.
1. Introduction
Because of the increasing demand for vehicles with a reduced weight, low fuel consumption and gas emissions, as well as with an improved passenger safety (i.e., crashworthiness), hot stamping boron steels are more and more used in the fabrication of car body structural parts, such as bumpers, side impact beams, B-pillars and rocker panels, which require very high strengths. Hot stamping boron steels, such as 22MnB5, 8MnCrB3, 27MnCrB5, and 37MnB4 grades, are usually supplied with a ferritic-pearlitic microstructure and are subjected to hot stamping operations to produce vehicle components. During the forming process, the blank sheet is first austenitized at a high temperature in a furnace (normally at about 900–950 °C) and then stamped and quenched simultaneously in a closed mold [1]. Sheets are always coated with an aluminum-silicon (Al/Si) layer to protect the steel from oxidation during hot stamping and from environmental corrosion during the service. In particular, when the blank is at a high temperature, the Al/Si layer transforms into a Fe/Al/Si layer due to the diffusion of iron from the sheet to the coating. After the stamping process, the final component exhibits a fully martensitic microstructure with yield and tensile strengths that normally vary in the range of 750–1400 MPa and 850–2050 MPa [1], respectively. The notable increase in mechanical strength and hardness makes the trimming of the stamped parts into the final shapes quite difficult, because of the high forces required and the high wear rate of cutting tools.
To overcome these issues, CO2 laser processing can represent an important alternative in cutting high- or ultra-high strength steel sheets [2,3,4]. So far, most studies reviewed in the literature have considered more conventional steel grades than nontraditional materials such as high- and ultra-high strength steels. Since laser power and cutting speed are generally the main process parameters that influence cut quality, most of the studies concerning laser cutting have focused on them (about 86% according to Radovanovic [5]). This is not surprising because cutting speed also plays a key role in improving productivity, and the maximum usable cutting speed is normally dependent on laser power. As well known, an increase of laser power normally causes a widening of kerf and heat affected zone (HAZ) throughout the sheet thickness, whereas increasing cutting speed has an opposite effect. Since cut quality and maximization of productivity are also driven by a proper selection of other cutting parameters, studies have also assessed the effects of assist gas and its pressure, standoff distance, pulse frequency and duty cycle of laser source, cutting path, and so forth [6,7,8,9,10,11], sometimes with discordant results.
Overall, an optimal combination of laser parameters is needed to ensure a proper cut quality, limiting or eliminating the typical defects that can occur: extensive kerfs and HAZs, rough surfaces, out of flatness, and waviness of cut edges. Dross is another common defect that can occur during CO2 laser cutting of metal alloys. It is the re-solidified oxidized molten metal that is not completely blown out from kerf during cutting, and is usually located on bottom cut edges. The effects of laser cutting parameters can vary notably for different steel grades and thicknesses, and hence, they are usually unique for each steel grade/thickness combination. Accordingly, laser cutting parameters must be set and tuned properly (repeating experimental activities) whenever sheets are made of different steel grades, have different thicknesses and/or coating layers to guarantee the desired cut quality and reliability. In this regard, response surface methodology, Taguchi design of experiments, and statistical analysis are common methods that can be effectively used to evaluate the effects of laser parameters and their interactions on cut quality by employing a limited number of runs, as well as to define analytical models that are devoted to assessing optimal cutting conditions [2,6,7,11,12,13]. Hybrid computer-integrated systems, which combine experimental knowledge and numerical simulation, could also be employed to select optimal cutting strategies to improve process accuracy and productivity, as for [14].
Only a recent study conducted by Tahir et al. [3] has investigated CO2 laser cutting of hot stamping boron steels. This study assessed cut quality on a 22MnB5 steel sheet (thickness 1.7 mm) by varying peak power, cutting speed, and duty cycle of laser source. A response surface methodology with a three level Box-Behnken design was used to optimize kerf and HAZ width. Results mainly claim that duty cycle is the main key parameter in determining cut quality, followed by laser power and cutting speed. However, the study of Tahir et al. has some limitations concerning the assessment of cut quality. In fact, the EN ISO 9013 standard [15], which recommends how to evaluate quality of thermal cut sheets, considers perpendicularity (or angularity) tolerance and mean height of the surface profile as the main quality responses to be assessed; kerf and HAZ widths are instead reckoned as minor factors. This is because perpendicularity tolerance and mean height of the surface profile are a better indication of cut surface irregularity and flatness deviation, and hence, of laser cut precision. Dimensional accuracy of cut edges is crucial since it guarantees a correct fit-up and part tolerances, thereby limiting or eliminating secondary rework processing.
For these reasons, this work aims to be a comprehensive investigation on CO2 laser cutting of hot stamping boron steel sheets. The effects of the process parameters, namely laser power, cutting speed, and oxygen assist gas pressure, on cut quality, have been determined. The response factors used to evaluate cut quality were chosen according to the EN ISO 9013 standard [15] and literature, including perpendicularity tolerance, mean height of the surface profile, cut surface morphology, kerf width, extent of HAZ, and dross. The experimental activity was based on an orthogonal array L9(34) design. The statistical significance of all the cutting parameters and their interactions has been ascertained. Based on these results, some predictive mathematical models have been set to determine the relationships between the cutting parameters and the quality responses measured on cut surfaces. A routine based on an optimization criterion has been used to assess the optimal setting that would lead to the best cut quality, i.e., minimizing the quality responses values. Finally, a confirmation experiment was conducted with the optimal setting to compare the measured quality responses with those predicted by the optimization routine.
2. Materials and Methods
Industrial hot stamping boron steel sheets, 22MnB5 grade, were provided each with a length of 2 m, width of 1 m and thickness of 1.2 ± 0.05 mm. The sheets had a ferrite + pearlite microstructure in the as-fabricated condition. The thickness of the Al/Si coating was 10 ± 2 μm, as measured by a scanning electron microscope (SEM) mod. Phenom ProX (Phenom-World, Eindhoven, The Netherlands). The chemical composition of the steel sheets was evaluated by means of an optical emission spectrometer mod. ARL 3460 (Thermo Fisher Scientific, Waltham, MA, USA), as reported in Table 1.
Since in the industrial production, 22MnB5 hot stamped components have a fully martensitic microstructure, the as-received sheets with a ferrite + pearlite microstructure were heat treated before laser cutting. To do this, the sheets were subjected to a laboratory heat treatment like a real hot-stamping operation: austenitization at 900 °C for 3–4 min and then cooling to room temperature in a mold with flat faces. The SEM micrograph of Figure 1a illustrates the microstructure of the hot stamping boron steel sheets after the laboratory heat treatment and the appearance of the coating. The sheets exhibited a fully martensitic microstructure with a hardness of about 420 HV1, measured with a hardness tester mod. DM 2D (Affri, Induno Olona, Italy). A dispersive X-ray spectroscopy (EDS) analysis, performed with a spectrometer integrated in the SEM, pointed out the presence of Fe, Al, and Si in the coating, Figure 1b, whose approximate chemical composition is reported in Table 1.
Cut quality has been evaluated according to the EN ISO 9013 standard [15] and literature. The EN ISO 9013 standard claims that the surface quality of thermally cut materials is described by perpendicularity tolerance and mean height of the surface profile, calculated as RZ5, Figure 2. Perpendicularity tolerance is the distance between two parallel and vertical straight lines, between which the cut surface profile is inscribed, Figure 2a. Therefore, this factor is an indication of the flatness deviation of cut surfaces. Perpendicularity tolerance is measured in a limited area (Δth = 0.1th = 0.12 mm) to allow for the melting on the top and bottom edges. Mean height of the surface profile RZ5 is the arithmetic mean of the single profile elements of five bordering single measured distances, Figure 2b. Therefore, it is an indication of the maximum cut surface irregularity averaged on five peaks and valleys.
In addition to perpendicularity tolerance and mean height of the surface profile, the EN ISO 9013 standard and literature suggest that minor features can also be used to describe the quality of laser cut surfaces, such as kerf width, out of flatness, kerf tapering, waviness of cut edges, HAZ width, and dross. In this study, cut quality is based on perpendicularity tolerance and mean height of the surface profile RZ5, as well as on minor features as top kerf width, HAZ width, dross, as illustrated in Figure 3. HAZs have been detected as the colored bands, close to the cut edges, obtained after mechanical polishing and chemical etching (nital 3 vol %) of the sheet cross sections of the linear laser cuts.
A laser center mod. Mercury 609 (Seilaser, Curno, Italy) was used to conduct the cutting tests. A pulsed CO2 laser beam (1 kHz frequency) was generated from the source and then transferred to the cutting head, and hence to the sheets, through an optic fiber. The laser beam had a spot size of 0.2 mm. It was focused using a 95-mm focal length lens with a standoff distance of 1 mm. The focal point was located at about the center of the sheet thickness. Oxygen was used as assist gas. It flowed through the cutting head and ejected surrounding the laser beam along a coaxial direction.
Three cutting parameters were varied during the experimental tests: laser power, cutting speed, and oxygen pressure. All of the other process parameters such as standoff distance, focal length, and laser spot size were kept constant. Some preliminarily experiments were conducted to assess a range of process parameters that ensured a complete cutting. Table 2 reports the L9(34) orthogonal array that was used to perform the experimental tests. Each run has been repeated three times to have consistent results; therefore, a total of 27 runs were conducted. 1 m long linear cuts were realized on the sheets for each run. They were properly distant from one another and from the sheet edges to avoid any interference.
Perpendicularity tolerance, kerf and HAZ widths were measured through an optical microscope mod. IM-3MET (Optika, Ponteranica, Italy). Three measurements performed at different distances were taken for each of these features for all of the linear cuts. Mean height of the surface profile was assessed by means of a stylus profilometer, mod. Form Talysurf i60 (Taylor Hobson, Leicester, UK), at three different locations along the cut thickness for a sampling length of 50 mm. The morphology of the cut surfaces was reconstructed by using a three-dimensional (3D) image tool of the Phenom ProX SEM. The dross extent at the sheet bottom side was classified into three classes of cut: Class I, no or minimum dross deposition; Class II, medium dross deposition; Class III, heavy dross deposition.
3. Results and Discussion
The cut quality responses obtained from the laser cutting experiments are reported in Table 3. Their average values are included in the following ranges: perpendicularity tolerance 25–62 μm; mean height of the surface profile 15–60 μm, top kerf width 137–269 μm; HAZ width 79–168 μm. Samples No. 6 show the best perpendicularity tolerance, average value 25 μm; samples No. 1 exhibit the lowest roughness, average value 15 μm; the narrowest kerf is found in samples No. 2, average value 137 μm; the smallest HAZ occurs in samples No. 5, average value 79 μm. No or an insignificant dross was observed by a visual inspection on four categories of samples out of nine. Dross was mainly present in samples cut with a low cutting speed.
Overall, it can be pointed out that the best values of each quality response have been obtained for different cutting settings. As discussed thereafter, a mathematical routine based on an optimization criterion has been used to find the setting that minimizes simultaneously all of the quality responses (i.e., best cutting quality).
3.1. ANOVA
ANOVA identifies whether the cutting parameters (main factors) and their interactions have a significant influence on cut surface quality. All of the factors were considered statistically significant at a 95% confidence level, which is a probability value (p-value) < 0.05. The Fischer statistic (F-value), or in alternative the p-value, obtained from ANOVA analysis can be adopted to evaluate the influence of each main factor and interaction in determining the extent of the quality responses: the higher the F-value (or the lower the p-value), the stronger is the influence of the factor. A response surface methodology (RSM) has been employed to ascertain the relationships between the cutting parameters and the quality responses. RSM considers the quality responses that are obtained at varying process parameters as a surface to which the analytical model (response surface) is fitted. In this work, the response surface, y, is based on a quadratic (second-order polynomial) model, as follows:
This model allows for the influence of each process parameter (main effect), Xi, and their quadratic effects, , and two-factor interactions, XiXj. The consistency of the mathematical models that are used to describe the observed data has been assessed by the lack-of-fit test, and by the coefficient of determination (R-Squared) and the adjusted coefficient of determination (Adj R-Squared) statistics. The lack-of-fit test compares the variability of the model residuals to the variability between observations at replicate settings of the factors. As the p-value for lack-of-fit is greater to 0.05, the model is adequate for the observed data at the 95% confidence level. R-Squared and Adj R-Squared statistics basically indicate how much the model explains the variability of a quality response. They are defined by a number from 0 (the model is not able to describe the relationship between cutting parameters and a quality response) to 1 (the model fully describes the relationship), which is the ideal value. Finally, a mathematical routine based on RSM and on an optimization criterion has been employed to identify the optimal setting of the cutting parameters that leads to the desired cut quality.
Table 4, Table 5, Table 6 and Table 7 show the results of the ANOVA after pooling the not statistically significant factors. Anyway, the not significant main effects have been maintained as involved in a significant interaction. Table 4 shows that the interactions between cutting speed and laser power (AB) and oxygen pressure (BC) are the factors with the most important influence on perpendicularity tolerance of cut surfaces. The main effects have a more limited influence, with the cutting speed being the less important factor. The interaction between laser power and cutting speed also influences most mean height of the surface profile, as shown in Table 5. For this quality response, oxygen pressure is not statistically significant at the 95% confidence level (p-value > 0.05); however, its quadratic effect (BB) is statistically significant. Table 6 points out that cutting speed and laser power have the strongest influence on kerf width. The interactions have instead a more limited effect. Cutting speed has also the most important influence on HAZ width, followed by oxygen pressure.
Overall, cutting speed is always involved, as either main effect or interaction, as the most significant factor in influencing CO2 laser cut quality of hot stamping boron steel sheets.
From the ANOVA tables, lack-of-fit is over 0.05 in all of the investigated quality responses. Moreover, the R-Squared and the Adj R-Squared values are around 0.9, except for HAZ width. These are an indication of the good quality of the quadratic models in fitting the results.
3.2. Perpendicularity Tolerance
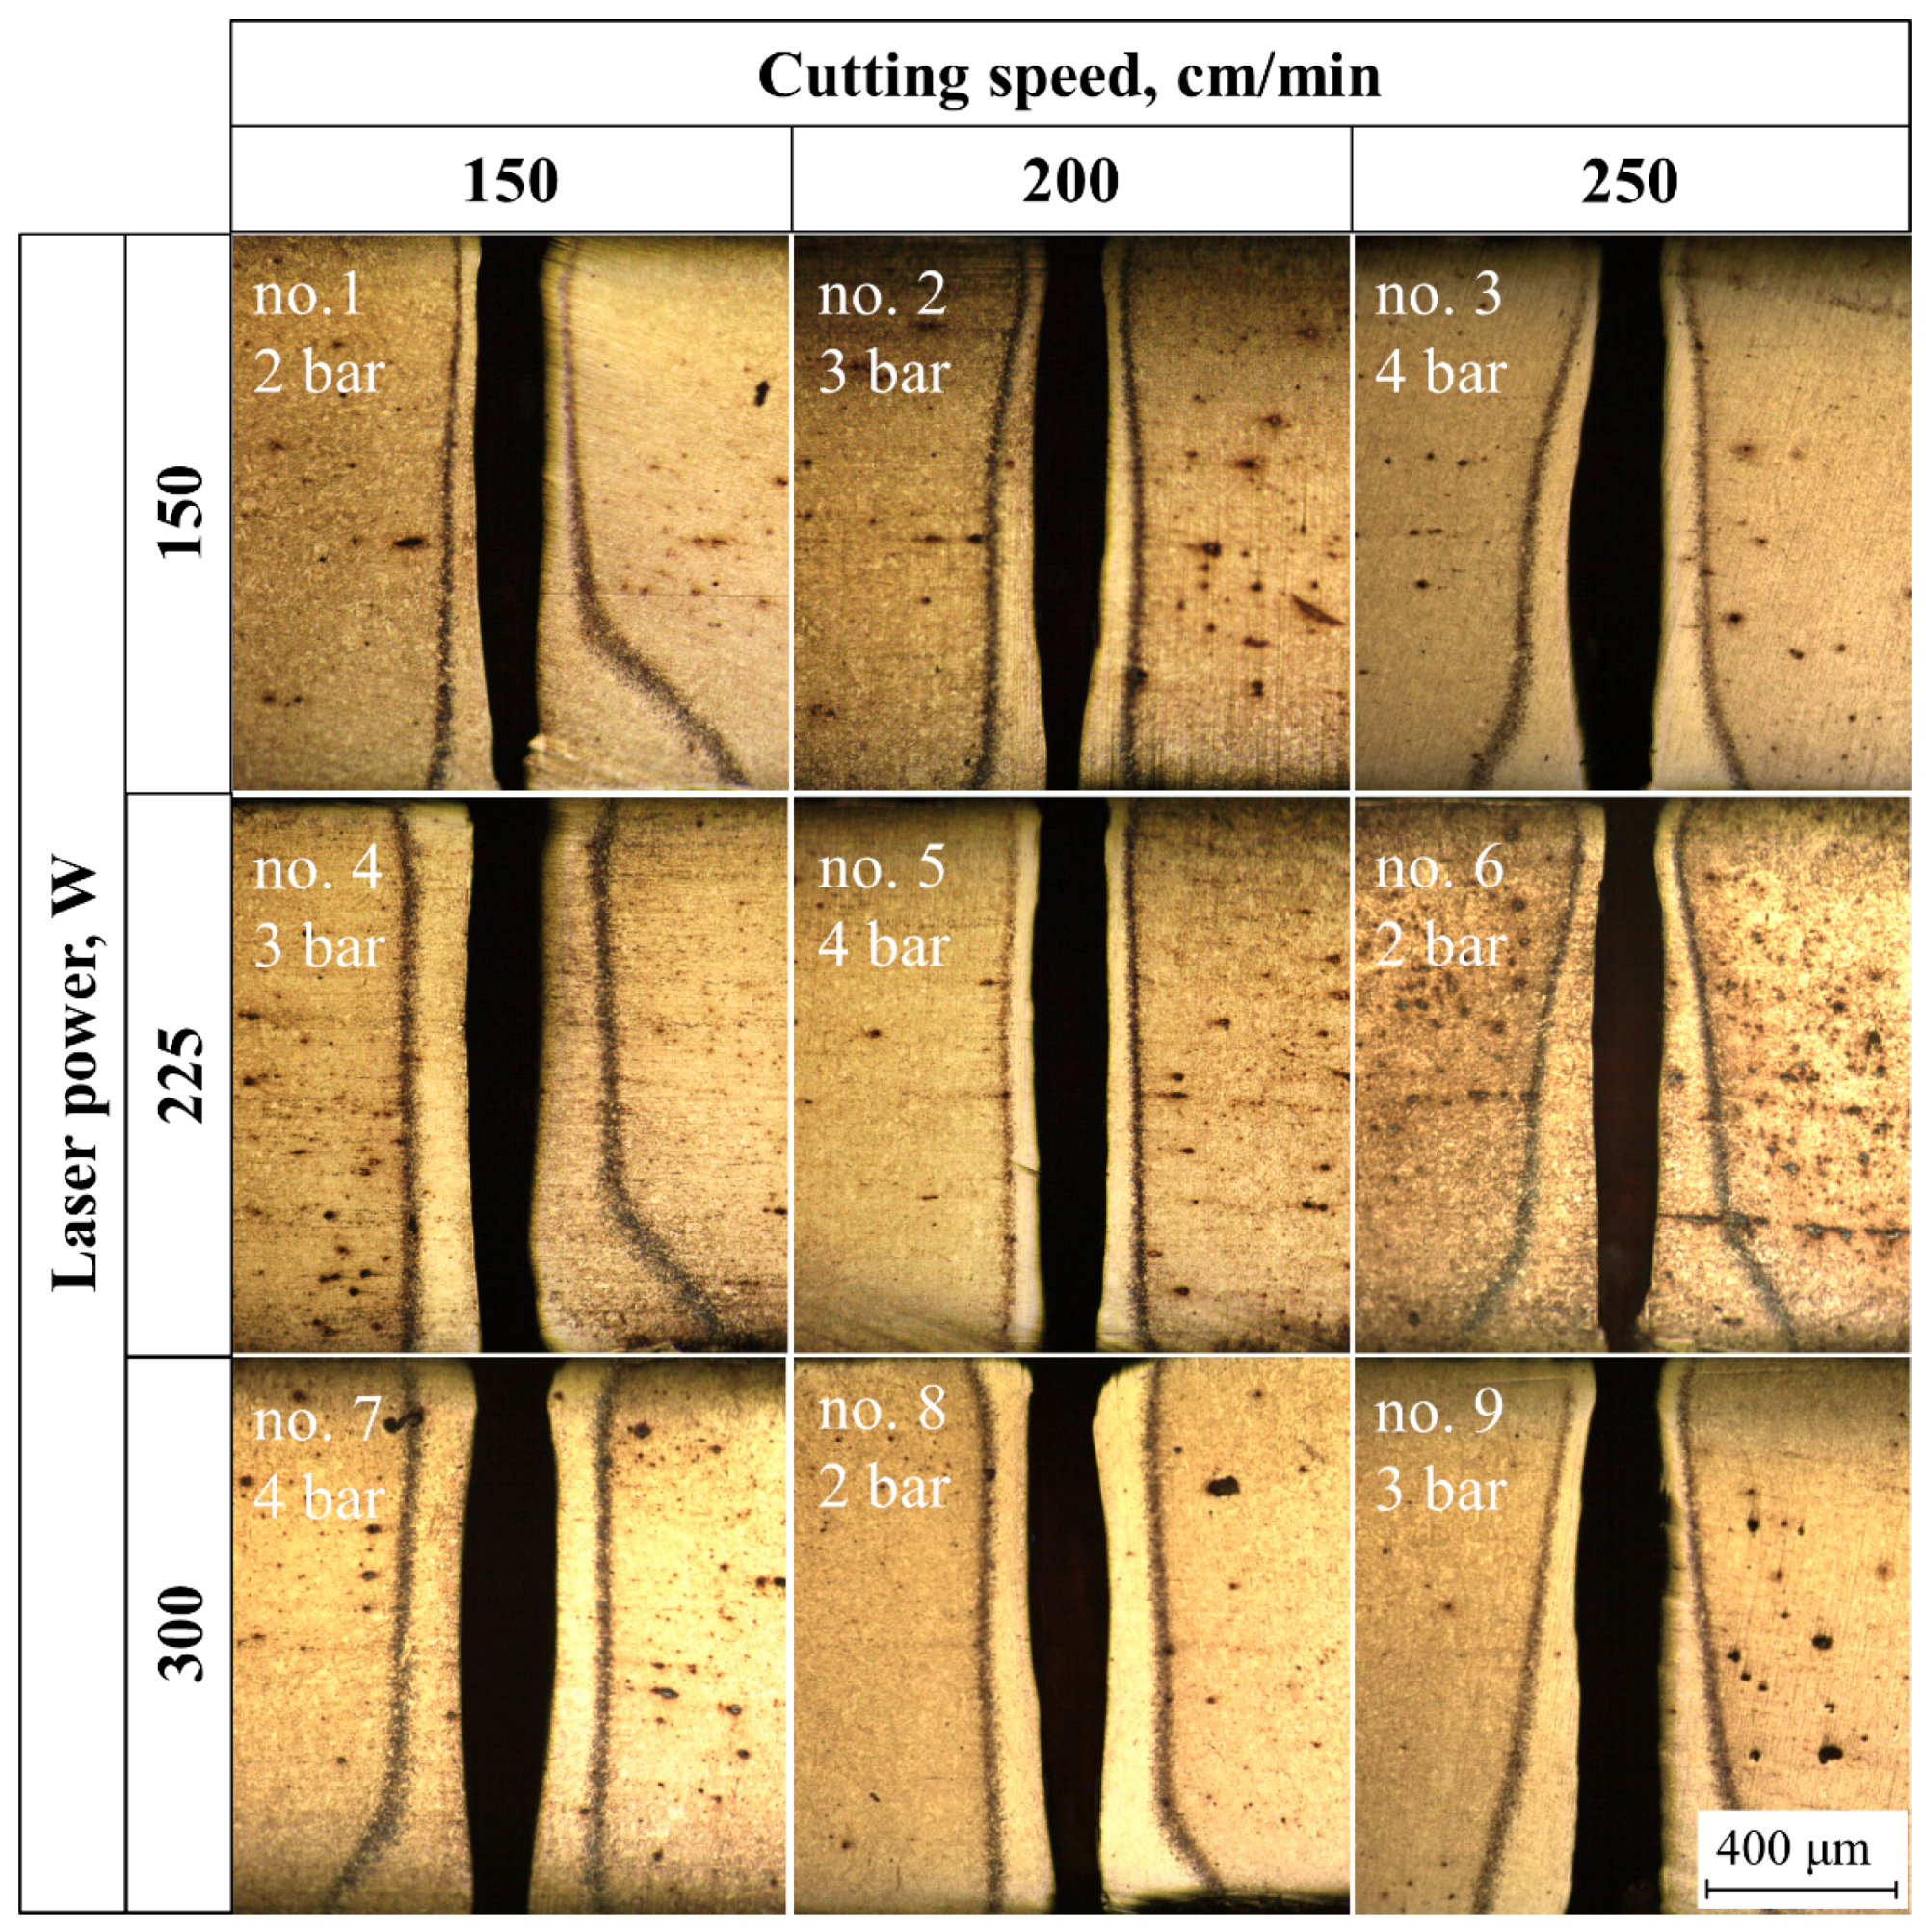
Figure 4 shows the typical cross sections of the cut sheets obtained with different parameter settings. Notice that perpendicularity tolerance is significantly affected by the cutting conditions: for instance, runs No. 5 and 9 promote the formation of quite flat and vertical cut edges than other settings (e.g., runs No. 3 and 7).
Kerf exhibits a tapering cut channel that is wider in the middle of the sheet thickness and narrower at the top and bottom edges. Narrow top kerfs are mainly related to the strong cooling effect of the assist gas that invests directly this sheet side, whereas the cooling effect reduces towards the sheet bottom side. The restriction of the cut channel at the bottom side can mainly be ascribed to the difficulty of the molten material to be ejected out of the sheet (restrain effect). It is also believed that the formation of oxides from the melting of Fe/Al/Si coating contributes to impede oxygen flow in depth. A similar effect is often evident in laser cutting of stainless steels due to the presence of impermeable and high viscous chromium-based oxides [16].
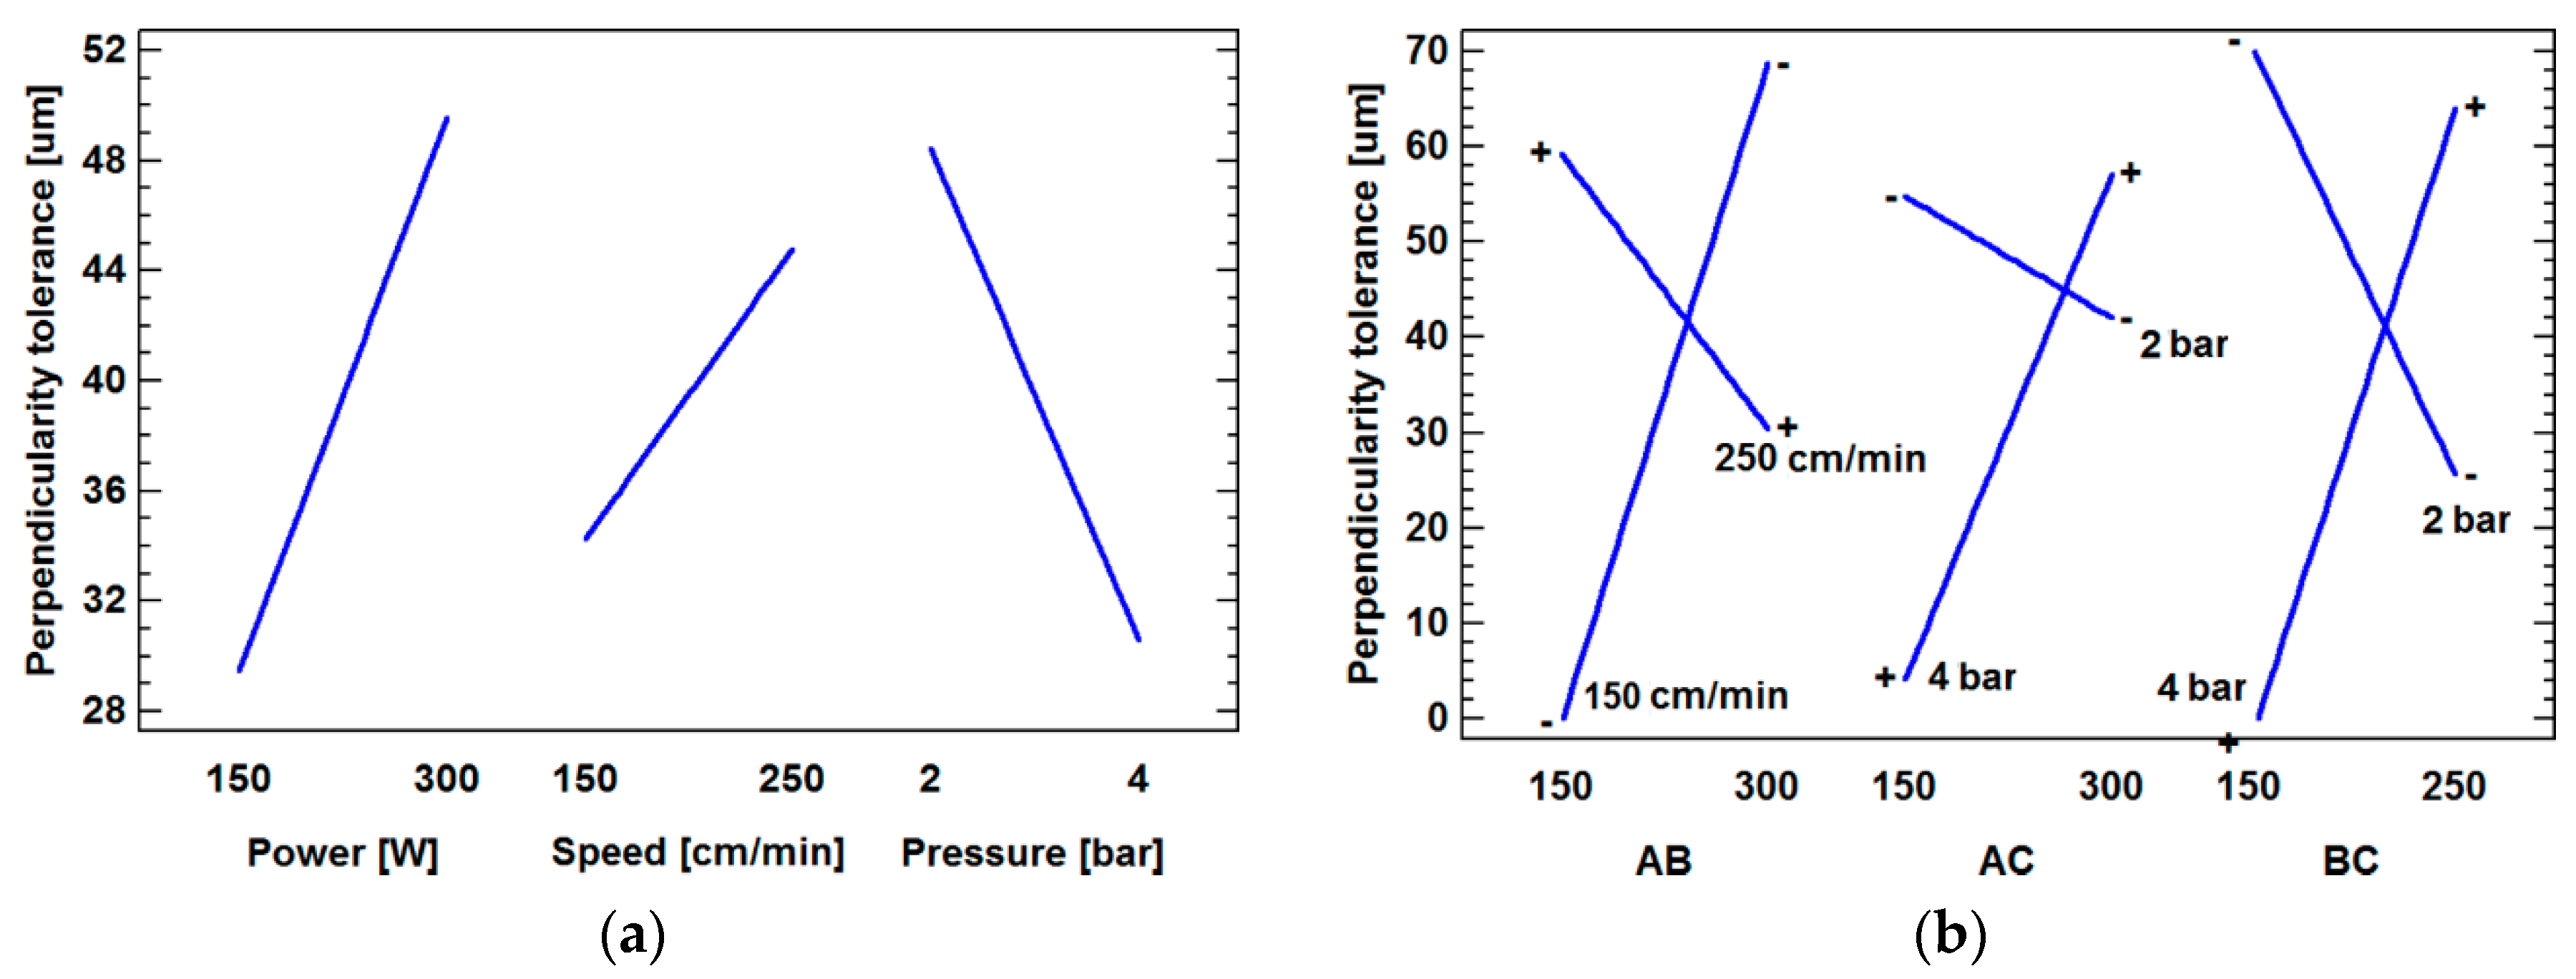
Kerf tapering, and hence, perpendicularity tolerance, are strongly affected by the cutting parameters and their interactions, Figure 5. An increase of laser power melts larger amounts of steel, thereby promoting the formation of wider kerfs, Figure 5a. High cutting speeds reduce the capability of assist gas to blow out the molten material, thus enhancing the restrain effect and its negative influence on perpendicularity tolerance. Conversely, a high assist gas pressure promotes the ejection of molten material from the cut channel, thereby limiting the unevenness of cut surfaces.
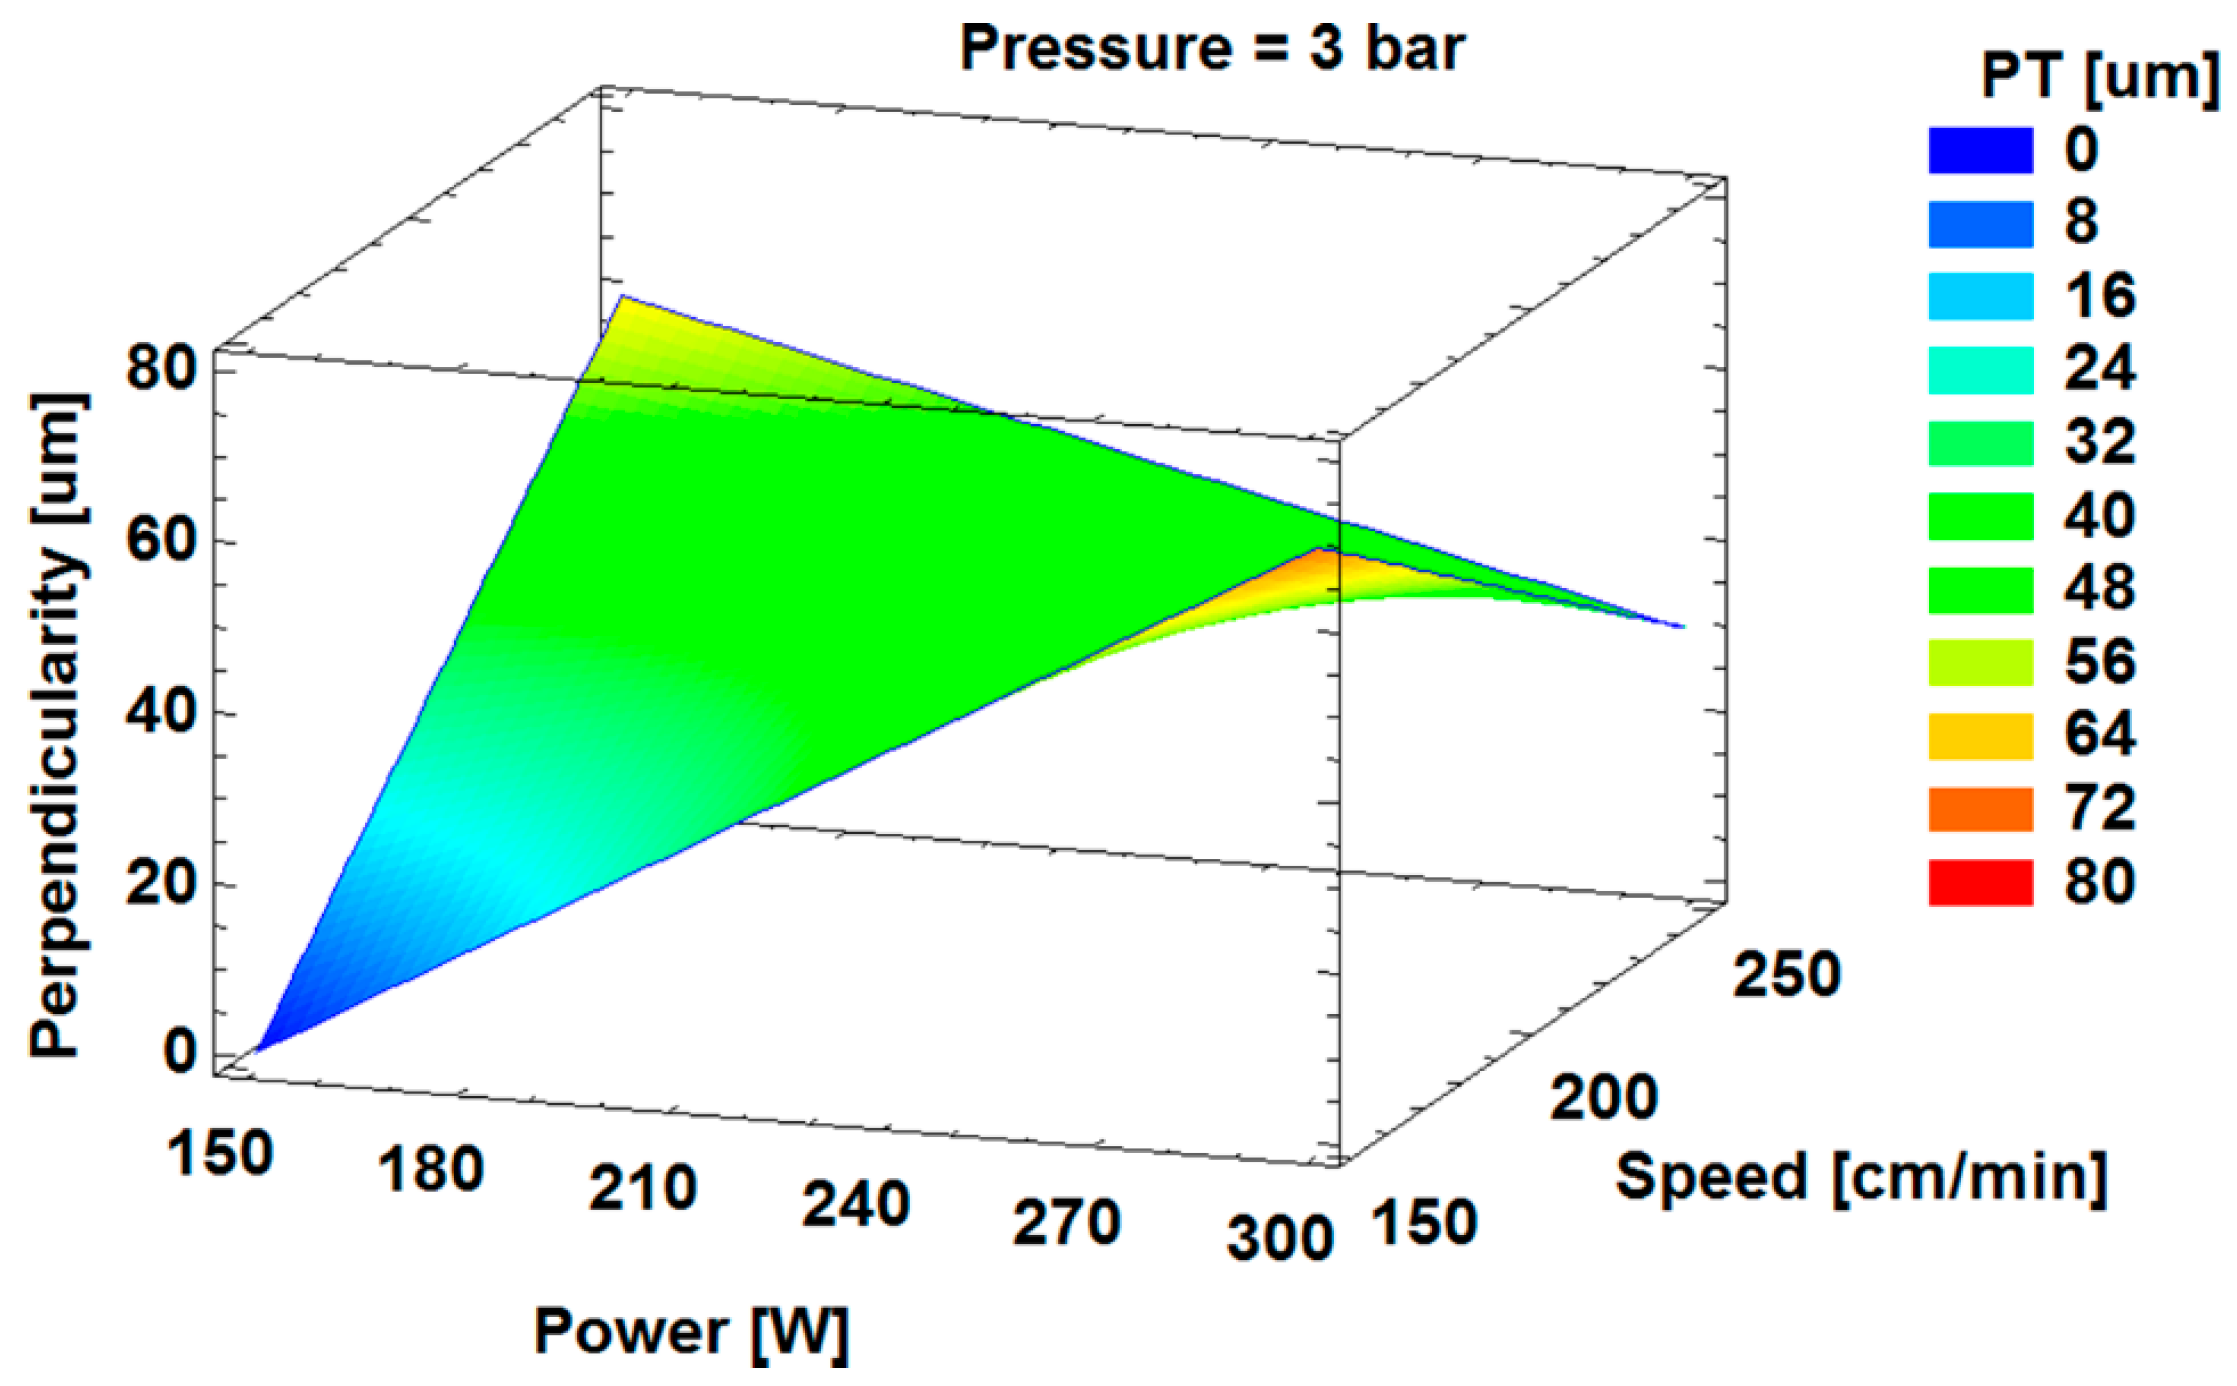
As reported in Table 4, the interactions have a stronger influence on perpendicularity tolerance than the main effects. This is in agreement with previous studies conducted on kerf tapering in several steel grades [8,17,18,19,20]. Figure 5b shows that the interactions have an opposite effect from a low to a high level of factors, as displayed by the X-shaped lines. At low cutting speed, an increase of laser power involves larger amounts of molten material. As a result, the restrain effect at the bottom side becomes more important, with a worsening of perpendicularity tolerance. At a high cutting speed, the restrain effect is much more limited. In this case, the main effect of laser power is to widen kerf and, consequently, to enhance the ability of assist gas to blow out the molten material. In this condition, flatness of cut edges improves. Regarding the AC interaction, a high oxygen pressure activates a more intense exothermic reaction, which increases the amount of molten material, and hence, the tendency towards a stronger restrain effect. At low oxygen pressure, the weaker restrain effect is overcome by the tendency of laser power to enlarge the cut channel, which favors melt blowing. Similar considerations concerning the contrasting effect of melt restrain and kerf widening would also explain the influence of the BC interaction on perpendicularity tolerance. The quadratic model that relates the cutting parameters and perpendicularity tolerance is
Perpendicularity tolerance, μm = 206.3 + 0.78 × (Laser power, W) − 0.11 × (Cutting speed, cm/min) − 170.6 × (Oxygen pressure, bar) − 0.0065 × (Laser power, W) × (Cutting speed, cm/min) + 0.219 × (Laser power, W) × (Oxygen pressure, bar) + 0.563 × (Cutting speed, cm/min) × (Oxygen pressure, bar).
A 3D representation of this equation is displayed by the surface response plot of Figure 6, in the case oxygen pressure is 3 bar.
3.3. Mean Height of the Surface Profile (RZ5)
Literature emphasizes that irregularity and roughness of laser cut surfaces depend strongly on several variables, such as steel grade, sheet thickness, range of process parameter, and their interactions, kind of assist gas, and so forth. This is because different physical, mechanical and chemical phenomena can be involved and/or have different effects at varying cutting conditions. In this context, some studies carried out on steel grades [8,21] and nickel-based alloys [22] have pointed out that surface roughness decreases as laser power increases. Other authors [2,23] have found opposite results. Literature also shows that there is not a univocal relationship between cutting speed and roughness. The study of Eltawahni et al. [8] on AISI304 stainless steel has highlighted that an increase of cutting speed can initially reduce roughness, but then it notably worsens as cutting speed increases. Similar results have been found in [2,24]. Differently, other researches have stated that roughness reduces with cutting speed [19,23]. In other cases, roughness can increase at low pulse frequency or decrease at high pulsed frequency for a given range of laser power and assist gas pressure [25]. No significant changes of roughness at varying process parameters have been observed in [26,27].
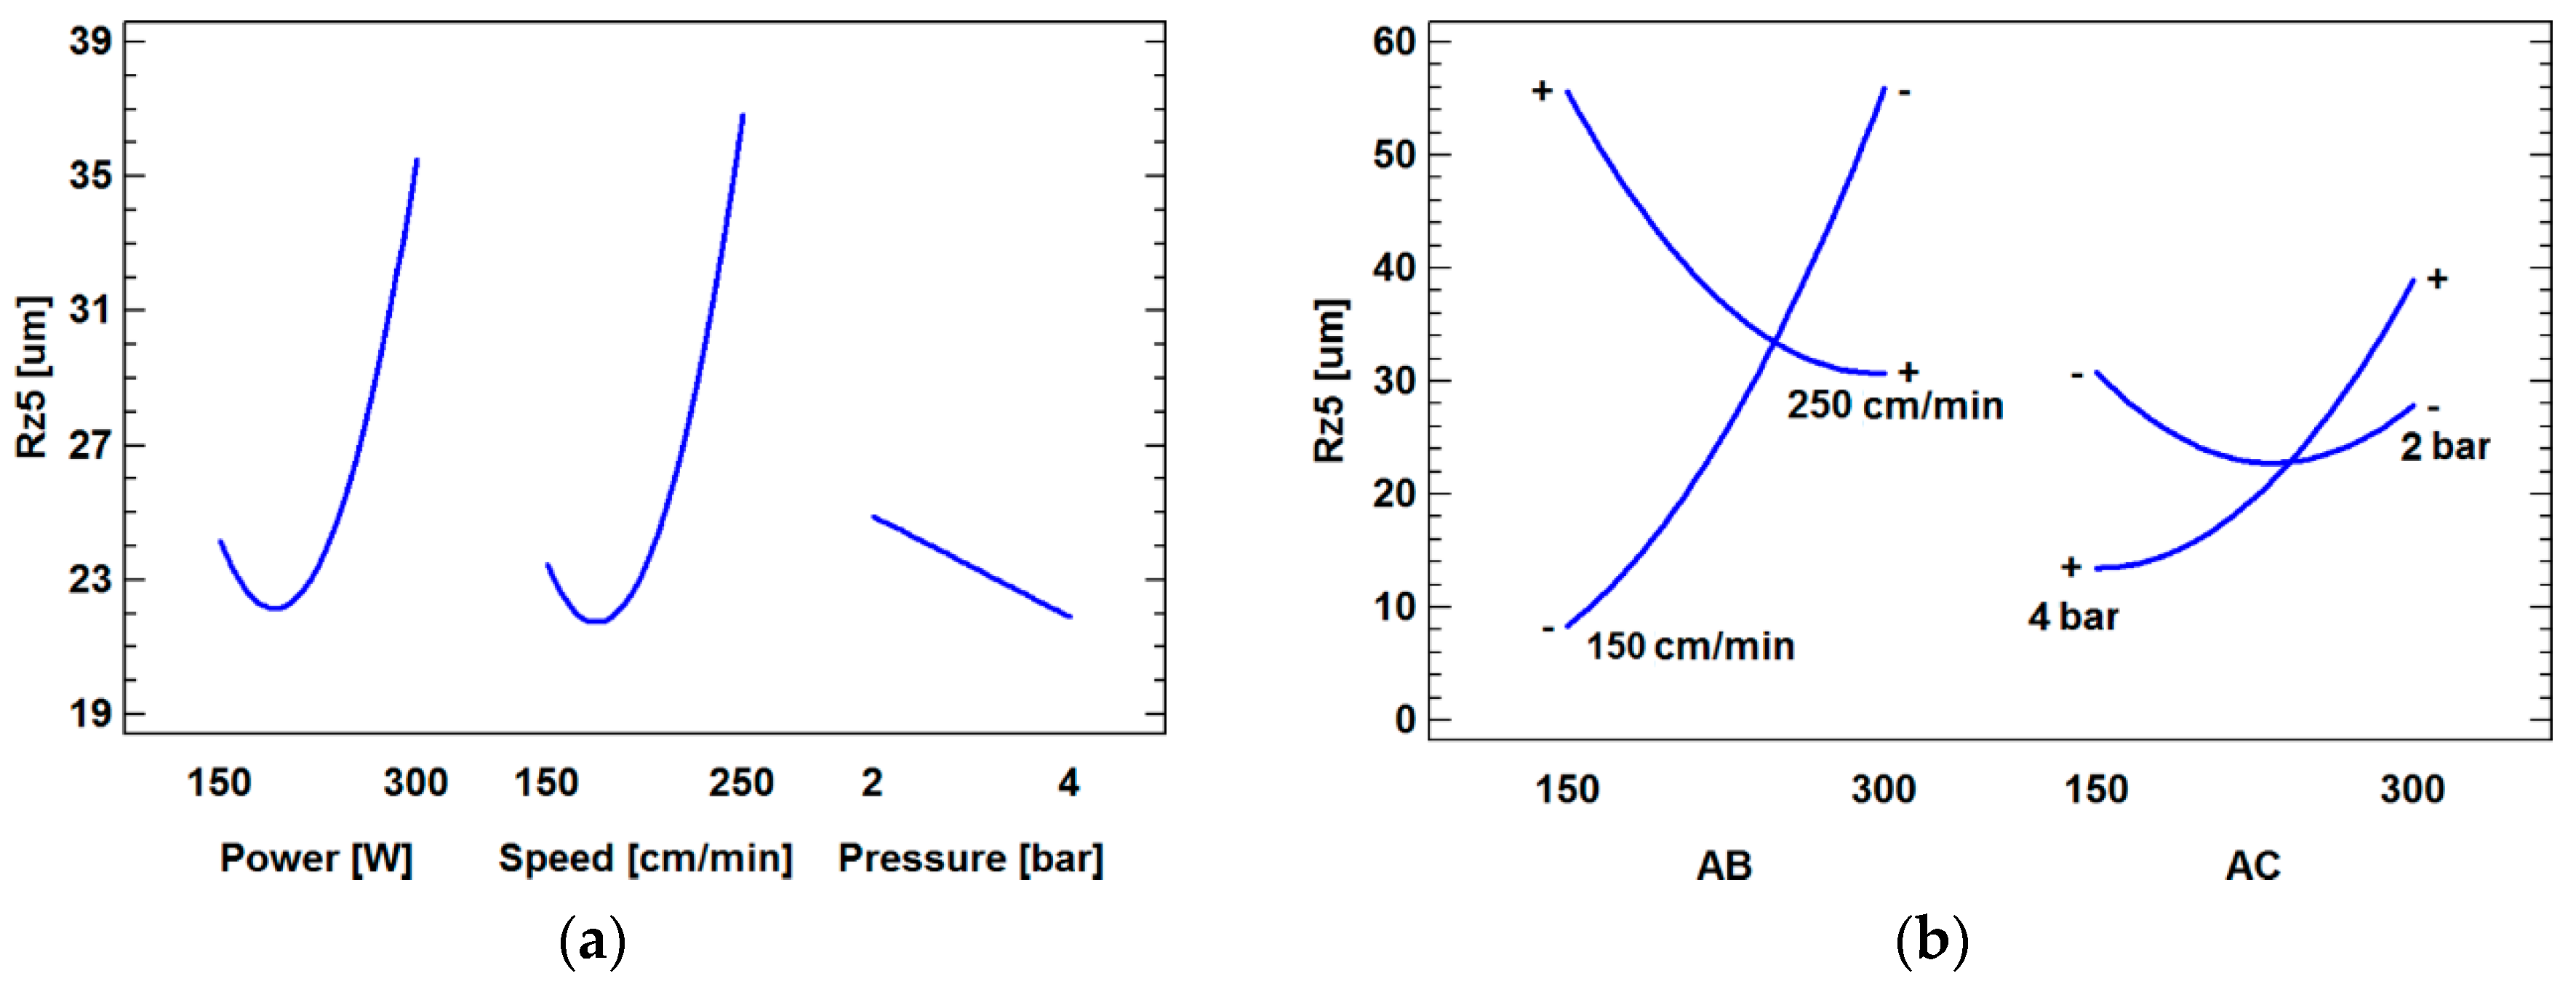
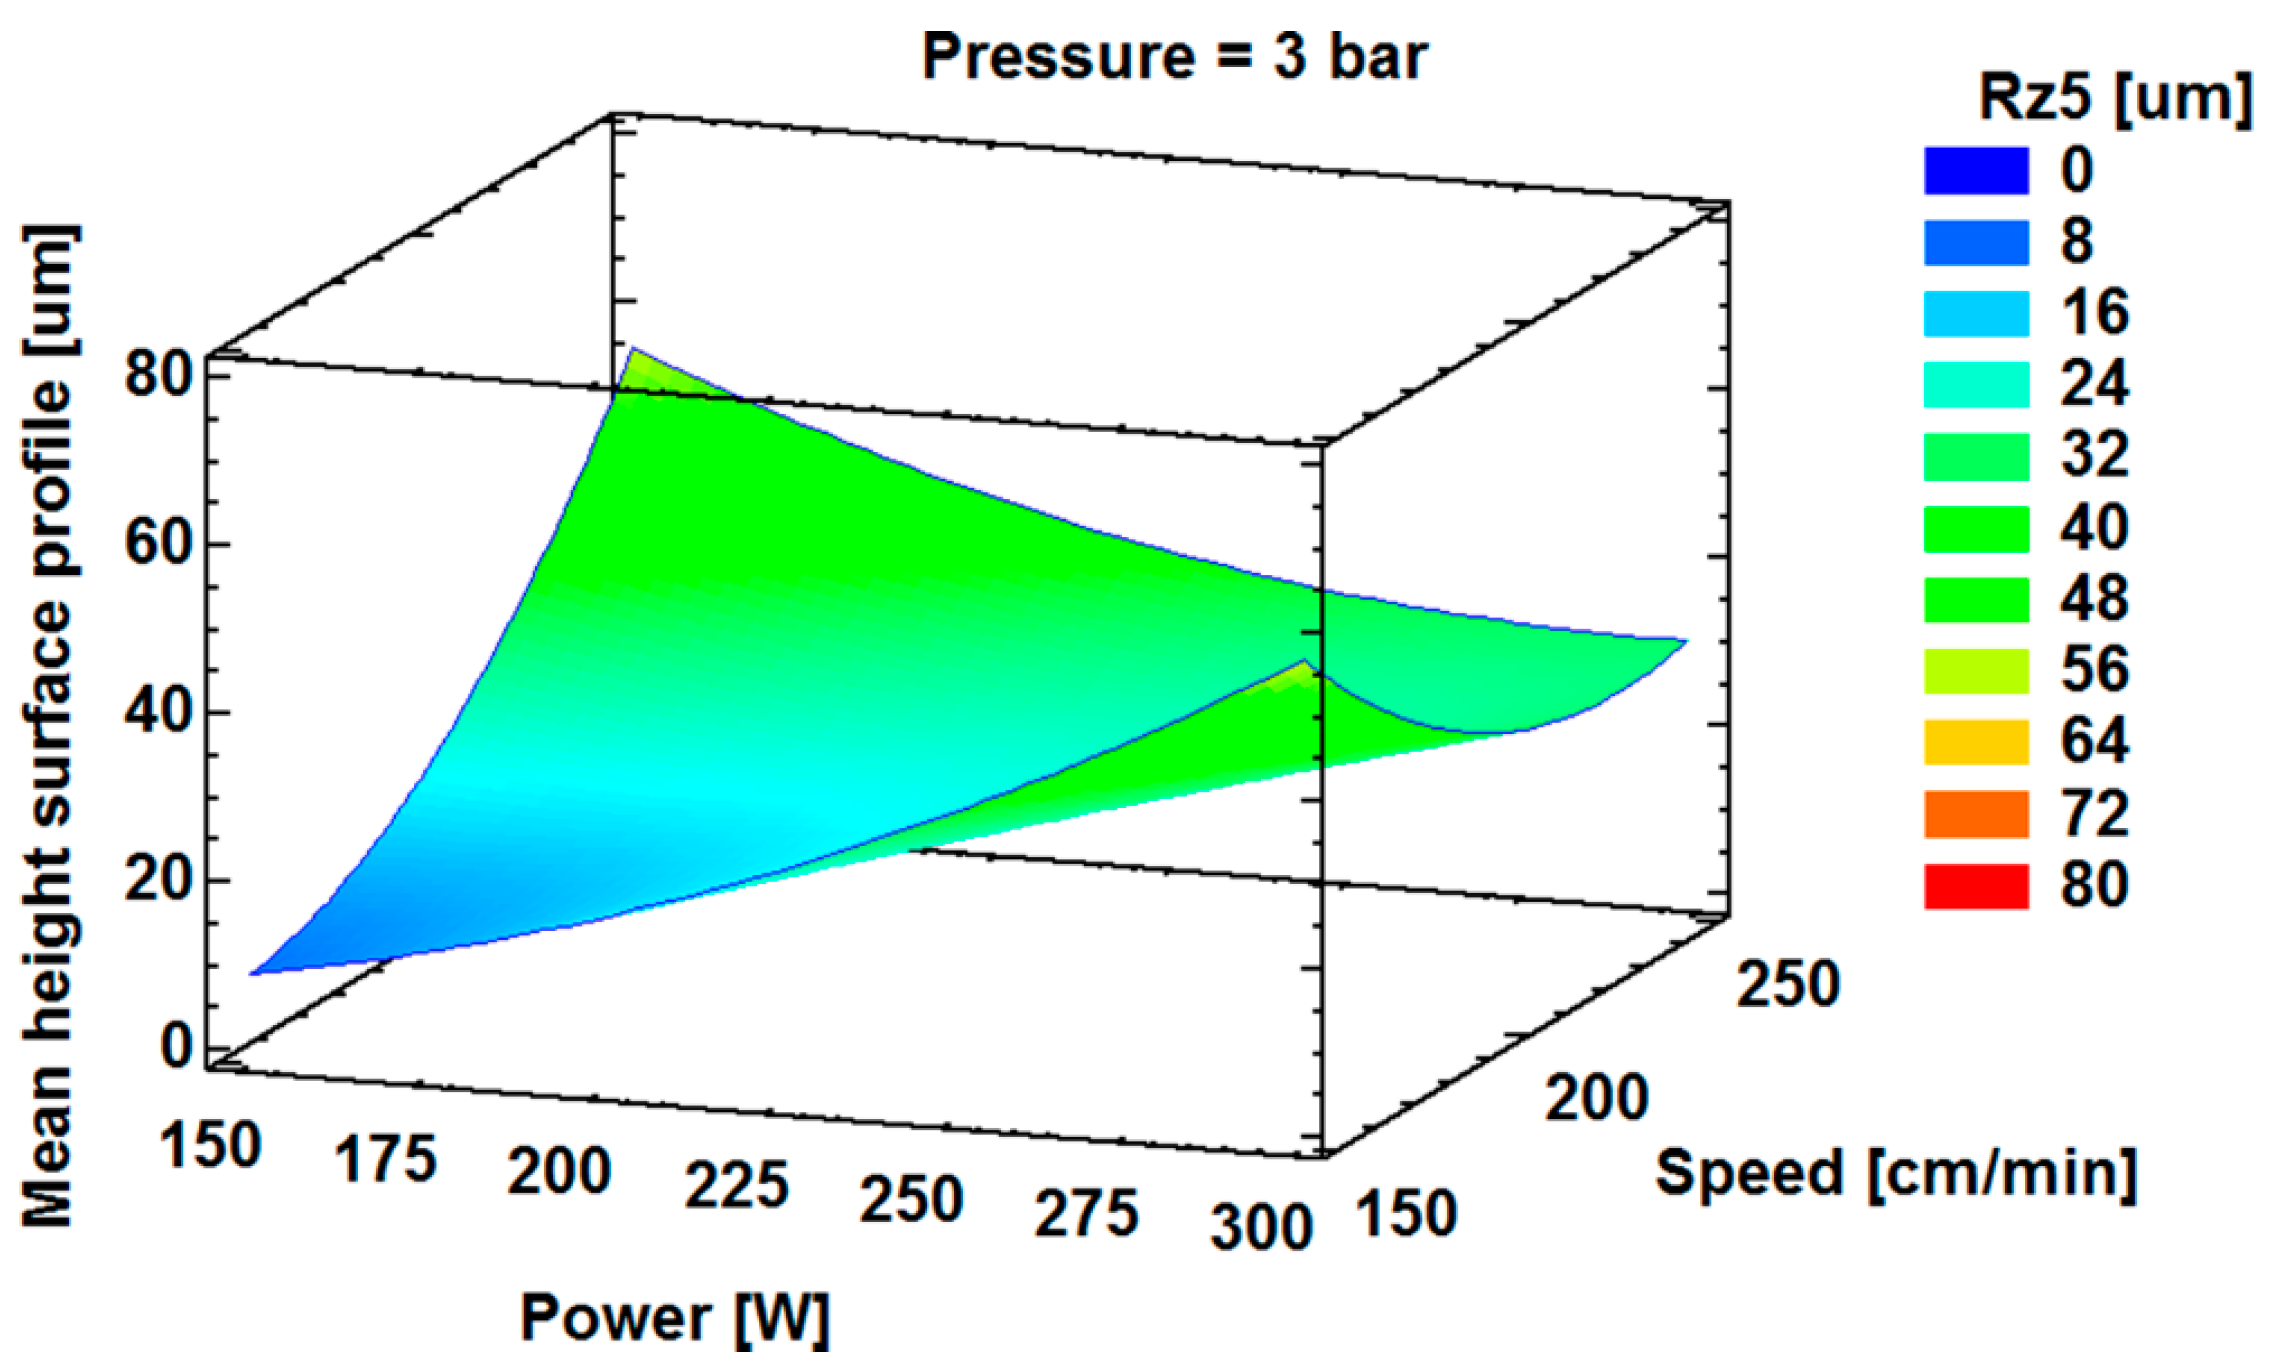
In this study, laser power and cutting speed are responsible for rougher cut surfaces, Figure 7a. The effect of oxygen pressure is not statistically significant, as computed by ANOVA (refer to Table 5); however, its interaction with laser power is statistically significant.
Low and medium levels of laser power and cutting speed favor the formation of good cut surfaces, with similar mean heights of the surface profile. They generate striation patterns with short peak-to-valley distances, as those shown in Figure 8a. Contrarily, high power laser levels supply an intense thermal energy to the sheet. Thus, more intense sideways burnings can promote the occurrence of striations with larger peak-to-valley distances [2,9], as illustrated in Figure 8b.
The increase of mean height of the surface profile with cutting speed is attributable to melt turbulence. Melt turbulence can be primarily due to two different phenomena. In one case, a high cutting speed favors an increase of the melt flow throughout the sheet thickness, and hence of the turbulence in the cut channel. In the other case, the cut front profile becomes more kinked and curved. This generates a significant directional variation of the molten material, thus causing a strong turbulence [28]. The interaction AB has a more important effect on mean height of the surface profile than the interaction AC. Laser power has different consequences at low and high cutting speeds, Figure 7b. In the first case, sideways burnings have the time to form and widespread along the sheet thickness, and their adverse effect on surface roughness is stronger the more laser power is. Conversely, sideways burnings are more limited at high cutting speeds. At low laser power, the high turbulence is believed the main responsible for rougher cut surfaces. However, the increase of molten material amount with the laser power seems to reduce melt turbulence and its detrimental effect of cut surface roughness.
The quadratic model that relates the cutting parameters and mean height of the surface profile is
Mean height of the surface profile, μm = −2.055 + 0.236 × (Laser power, W) + 0.147 × (Cutting speed, cm/min) − 23.67 × (Oxygen pressure, bar) + 0.001 × (Laser power, W)2 − 0.005 × (Laser power, W) × (Cutting speed, cm/min) + 0.0985185 × (Laser power, W) × (Oxygen pressure, bar) + 0.0027 × (Cutting speed, cm/min)2.
A 3D representation of this equation is displayed by the surface response plot of Figure 9, in the case oxygen pressure is 3 bar.
3.4. Top Kerf Width
According to Table 6, laser power and cutting speed have the strongest influence on top kerf width.
Figure 10a illustrates that an increase of laser power leads to a widening of top kerf. This is because more thermal energy per unit of time is supplied to the sheet blank, thus larger regions are melted and, consequently, wider kerfs form. Cutting speed exhibits a contrary effect: faster cutting speeds limit the heating of the blank sheet, thereby reducing the amount of molten material. The interaction plot of Figure 10b shows that laser power has a stronger effect on top kerf width at low cutting speed and oxygen pressure. This is because low cutting speeds favor a larger overlapping of laser pulses (i.e., increase of the thermal energy input per unit of time), which is more sensitive to laser power changes. A similar effect has also been claimed by other studies [2,11,12,25,29,30,31]. At low oxygen pressure, the stronger influence of laser power is directly related to the cooling effect of the assist gas: a low O2 pressure is less able to cool the sheet, thus kerf width is more sensitive to heat power changes.
The quadratic model that relates the cutting parameters and top kerf width is
Top kerf width, μm = 210.7 + 1.68 × (Laser power, W) − 2.99 × (Cutting speed, cm/min) + 56.89 × (Oxygen pressure, bar) − 0.004 × (Laser power, W) × (Cutting speed, cm/min) − 0.189 × (Laser power, W) × (Oxygen pressure, bar) + 0.008 × (Cutting speed, cm/min)2.
A 3D representation of this equation is displayed by the surface response plot of Figure 11, in the case oxygen pressure is 3 bar.
3.5. HAZ Width
HAZ extent was computed as the average width of the colored band, which was measured at five equi-spatial locations throughout the sheet thickness, as reported in Figure 4. The HAZ regions show a typical tapering appearance, with the larger width at the sheet bottom edges. This shape is mainly related to the assist gas flow: gas invests directly the sheet top surface, thus it can cool this region more than that at the bottom side, where heat has instead more time to diffuse. The presence of dross at the bottom side (runs No. 1, 4, 6, 7, 8) contributes to widen HAZ because of the larger heat involved. The resulting main and interaction effects of the cutting parameters are displayed in the plots of Figure 12.
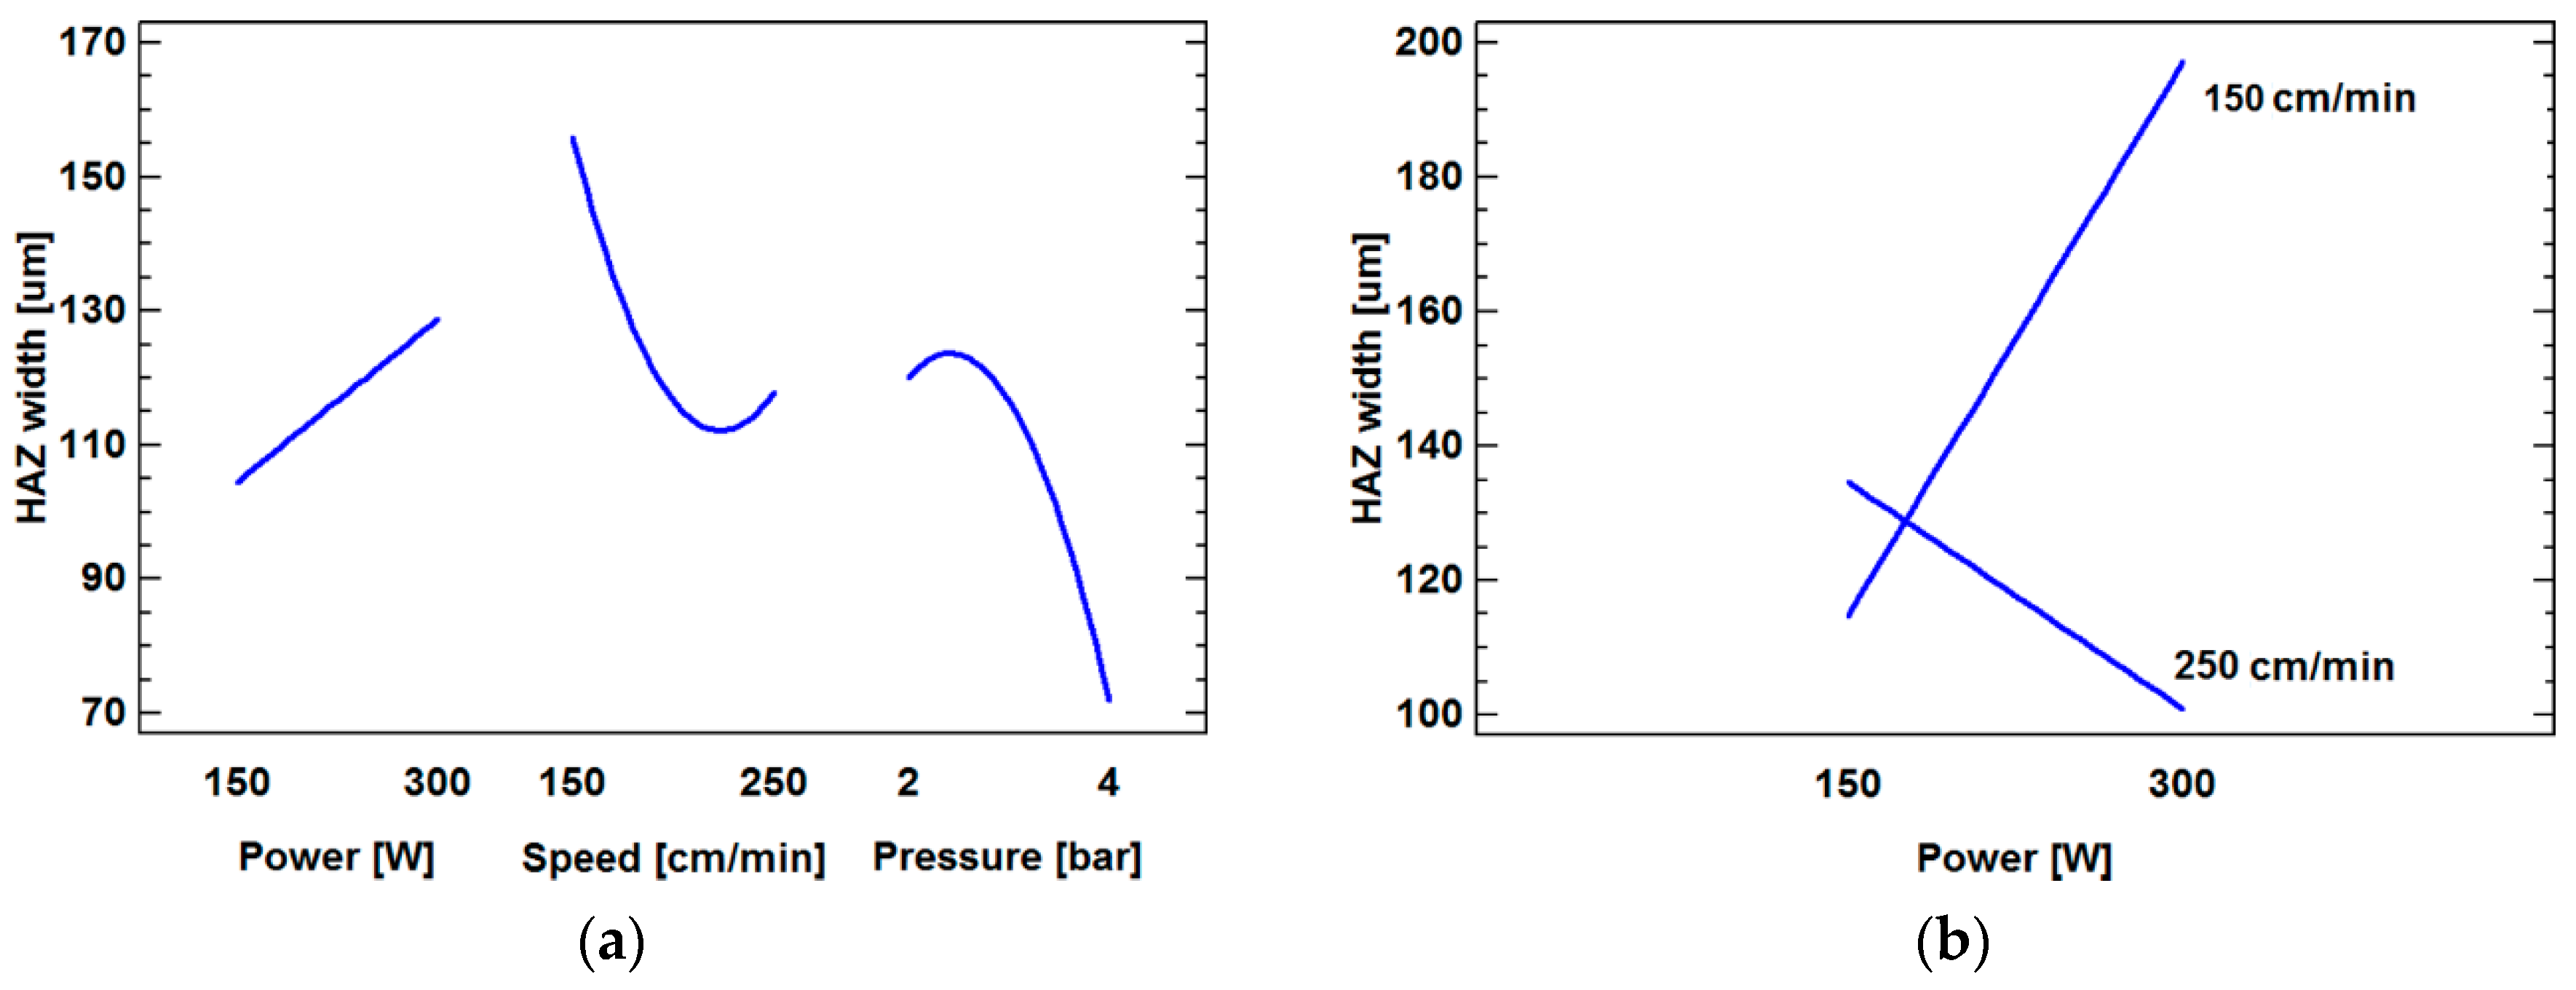
As determined by ANOVA, cutting speed, oxygen pressure, and the interaction between cutting speed and laser power have a predominant influence on HAZ width. Figure 12a highlights that laser power and cutting speed have an opposite influence on HAZ width: laser power increases the heat power supplied during the cutting process, whereas cutting speed reduces the time exposure to the laser torch (and hence heat input). HAZ width reduces with oxygen pressure due to the more powerful effect of the assist gas in cooling the cut area. Figure 12b shows that larger HAZ variations are obtained while varying laser power at a low cutting speed. In this case, an increase of laser power supplies more heat energy, which causes a widening of HAZ. At high cutting speed, a reduction of HAZ width with laser power occurs. In this regard, Tahir et al. [3] have claimed that this behavior could be due to the formation of a gap within each laser pulse. In this case, heat remains trapped within the sheet, thereby increasing the heat applied from the burst of energy to the sheet.
The quadratic model that relates the cutting parameters and top kerf width is
HAZ width, μm = 17.98 + 1.71 × (Laser power, W) − 1.87 × (Cutting speed, cm/min) + 99.75 × (Oxygen pressure, bar) − 0.008 × (Laser power, W) × (Cutting speed, cm/min) + 0.008 × (Cutting speed, cm/min)2 − 20.64 × (Oxygen pressure, bar)2.
A 3D representation of the above equation is displayed by the surface response plot of Figure 13, in the case oxygen pressure is 3 bar.
3.6. Desirability Approach in Optimizing Cut Surface Quality and Confirmation Experiment
A concurrent study of various quality responses firstly needs a proper RSM for each output and then to devise an optimized setting of cutting parameters. In this context, desirability function is one of the main approaches employed in industry to optimize multiple quality responses. This method is based on finding the optimum operating condition X that allows either to maintain quality responses within a desired range or to try to maximize or minimize them. For each quality response Qi(x), a dimensionless performance desirability function Di(Qi) attributes a number between 0 and 1 to the possible values of Qi. Di(Qi) = 1 is an ideal response value, whereas Di(Qi) = 0 is an inacceptable response value. The overall desirability D is computed as the geometric average of each individual desirability Di(Qi), as follows
where n is the number of quality responses. If at least one of Di(Qi) is zero, the overall desirability is undesirable (D = 0). Different desirability functions Di(Qi) are generally employed based on the chosen optimization target (minimum, maximum, or target value).
D = [D1(Q1) ∙ D2(Q2) ∙ … ∙ Dn(Qn)]1/n,
In this study, the optimization criterion aims at minimizing the quality responses to obtain the best cut quality, while keeping the cutting parameters in the investigated ranges. The quality responses do not have a desired range since the goal is to minimize their value as much as possible. The impact values in Table 8 define the importance of each quality response on a scale of 1 (low) to 5 (high). Based on the EN ISO 9013 standard, perpendicularity tolerance and mean height of the surface profile are considered as the most important factors in determining cut quality. Therefore, these factors have been set to the maximum value (5). Instead, the secondary quality responses have been considered with a lower importance; thus, their impact value has been set to 3.
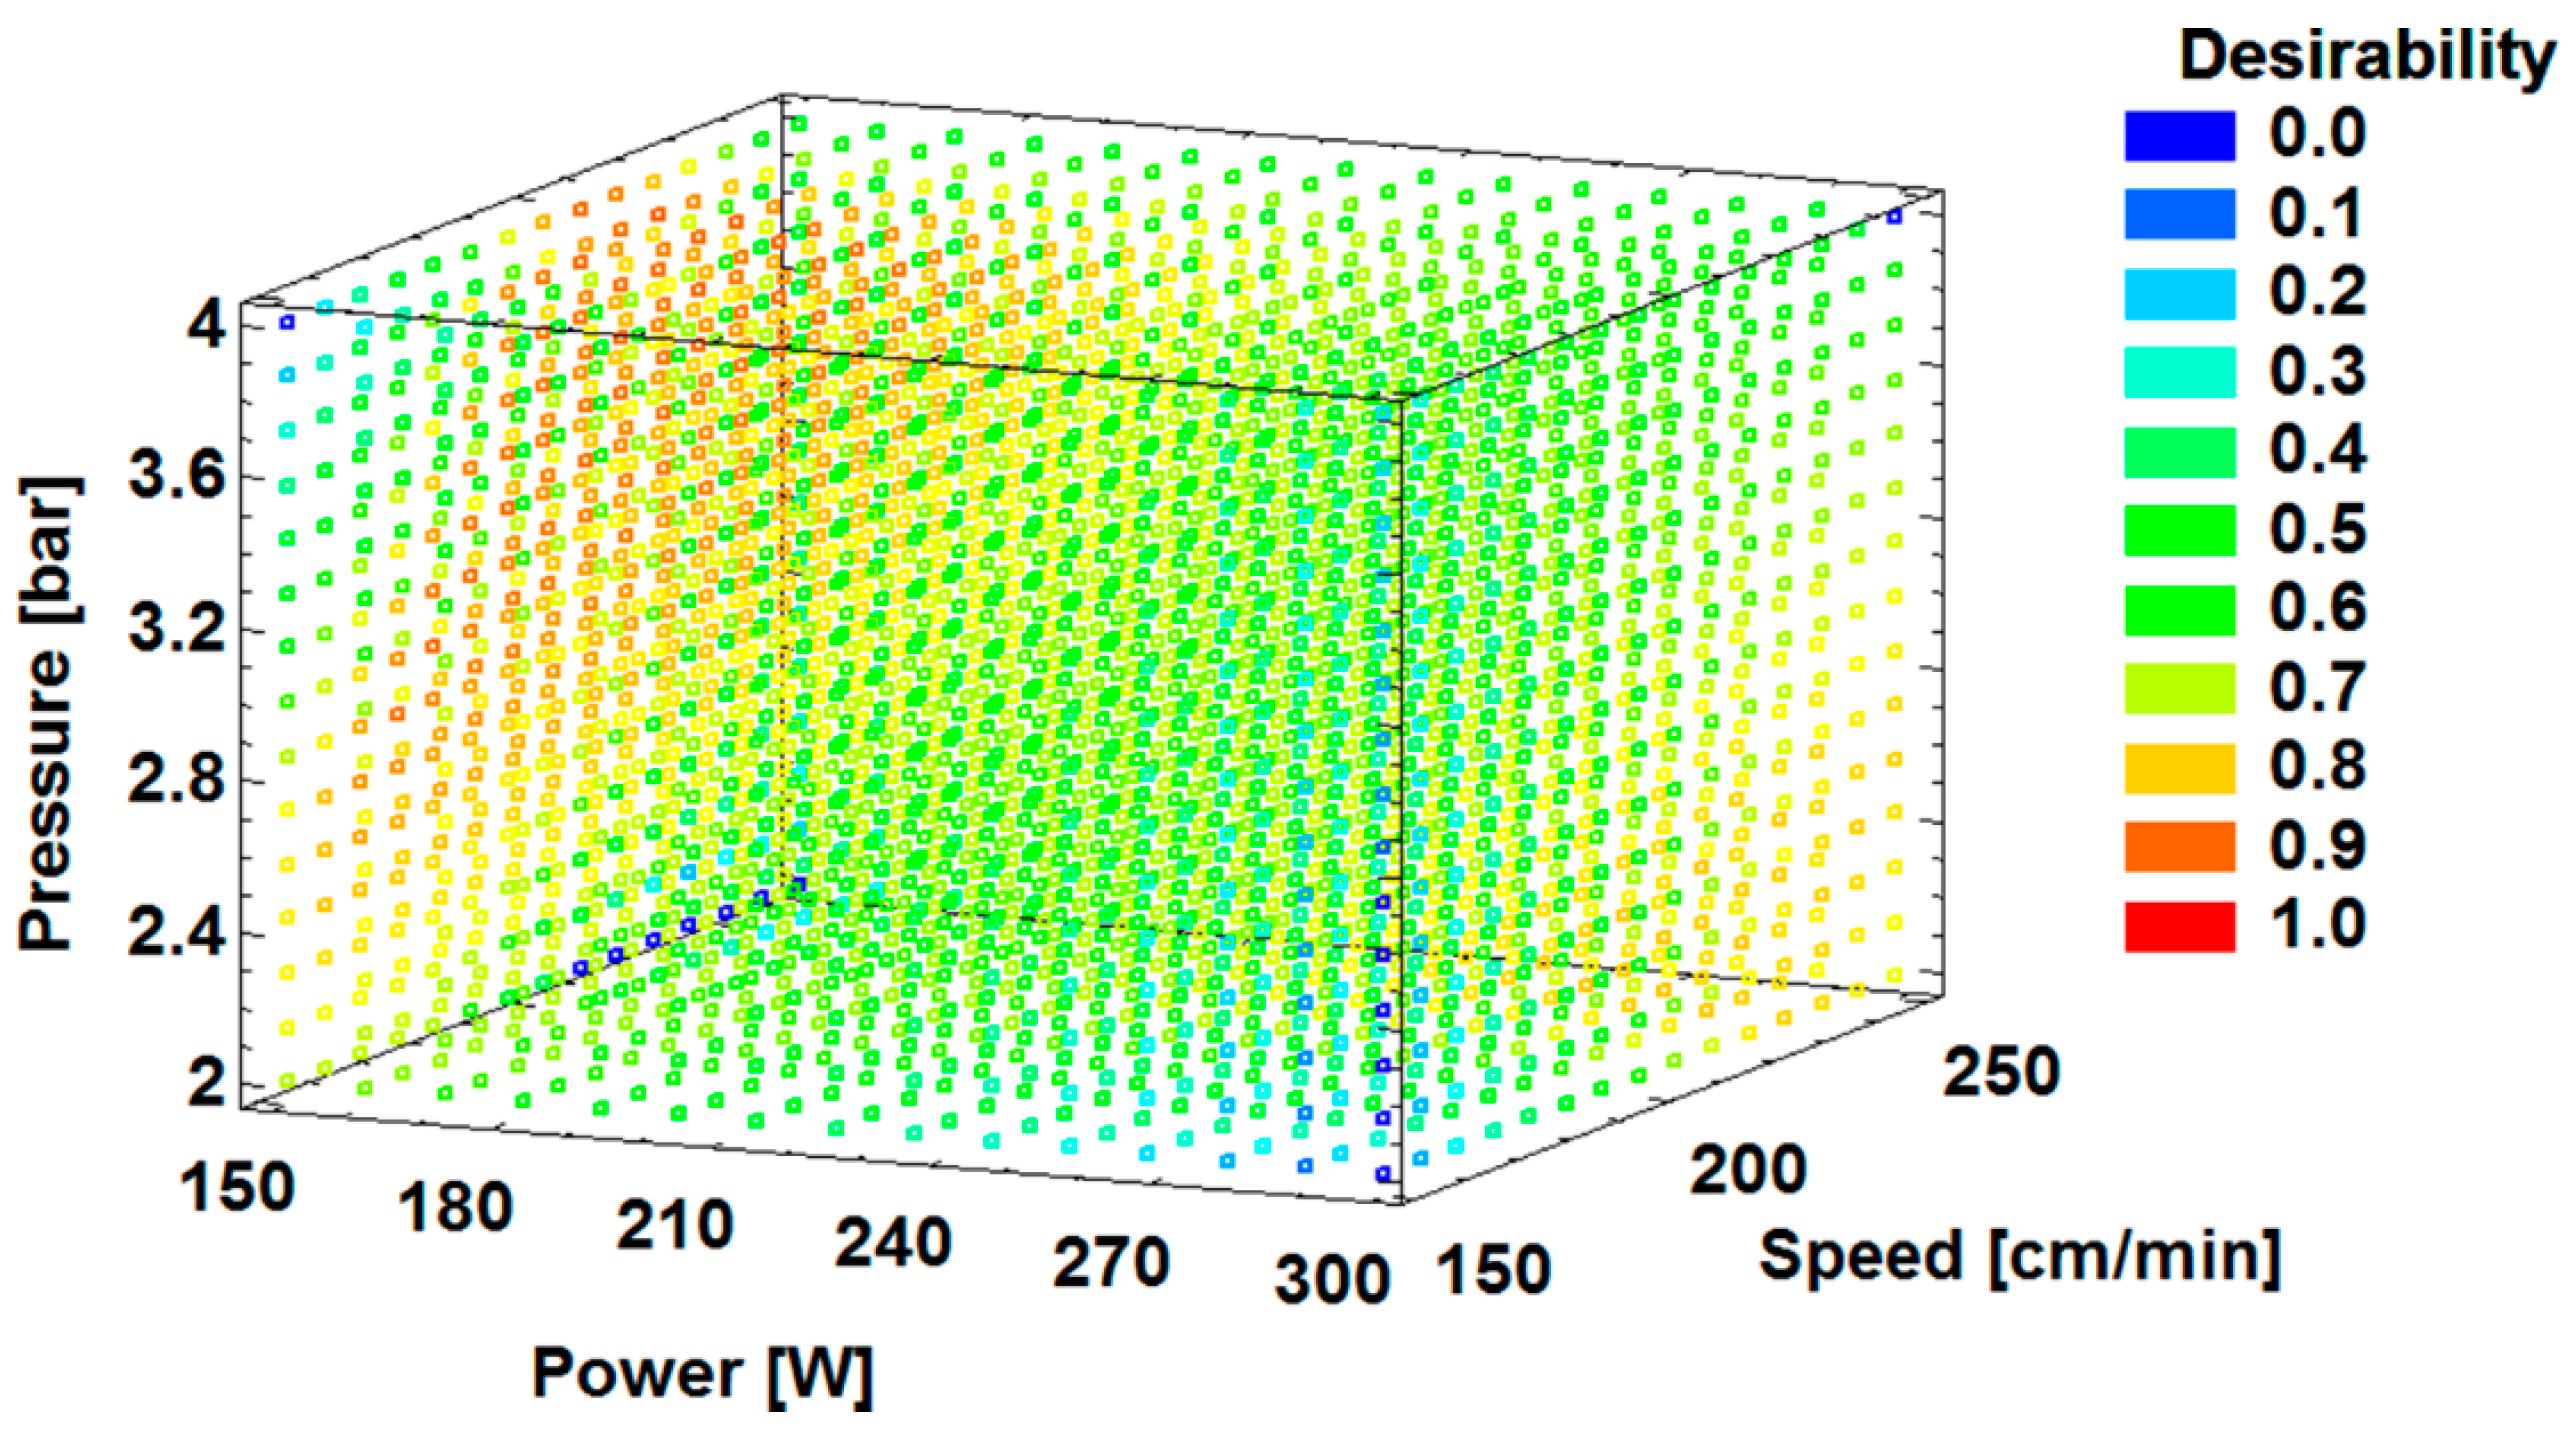
Based on the optimization criterion reported in Table 8, the resulting desirability versus laser cutting parameters is displayed in Figure 14. This plot enables an easy visual evaluation of the relative importance of a cutting setting versus the others in ensuring proper quality response values.
The responses that are represented by the red points define the combinations of the cutting parameters that lead to the better quality responses. Other settings induce a medium (e.g., green colored points) or a poor (e.g., blue points) cut quality.
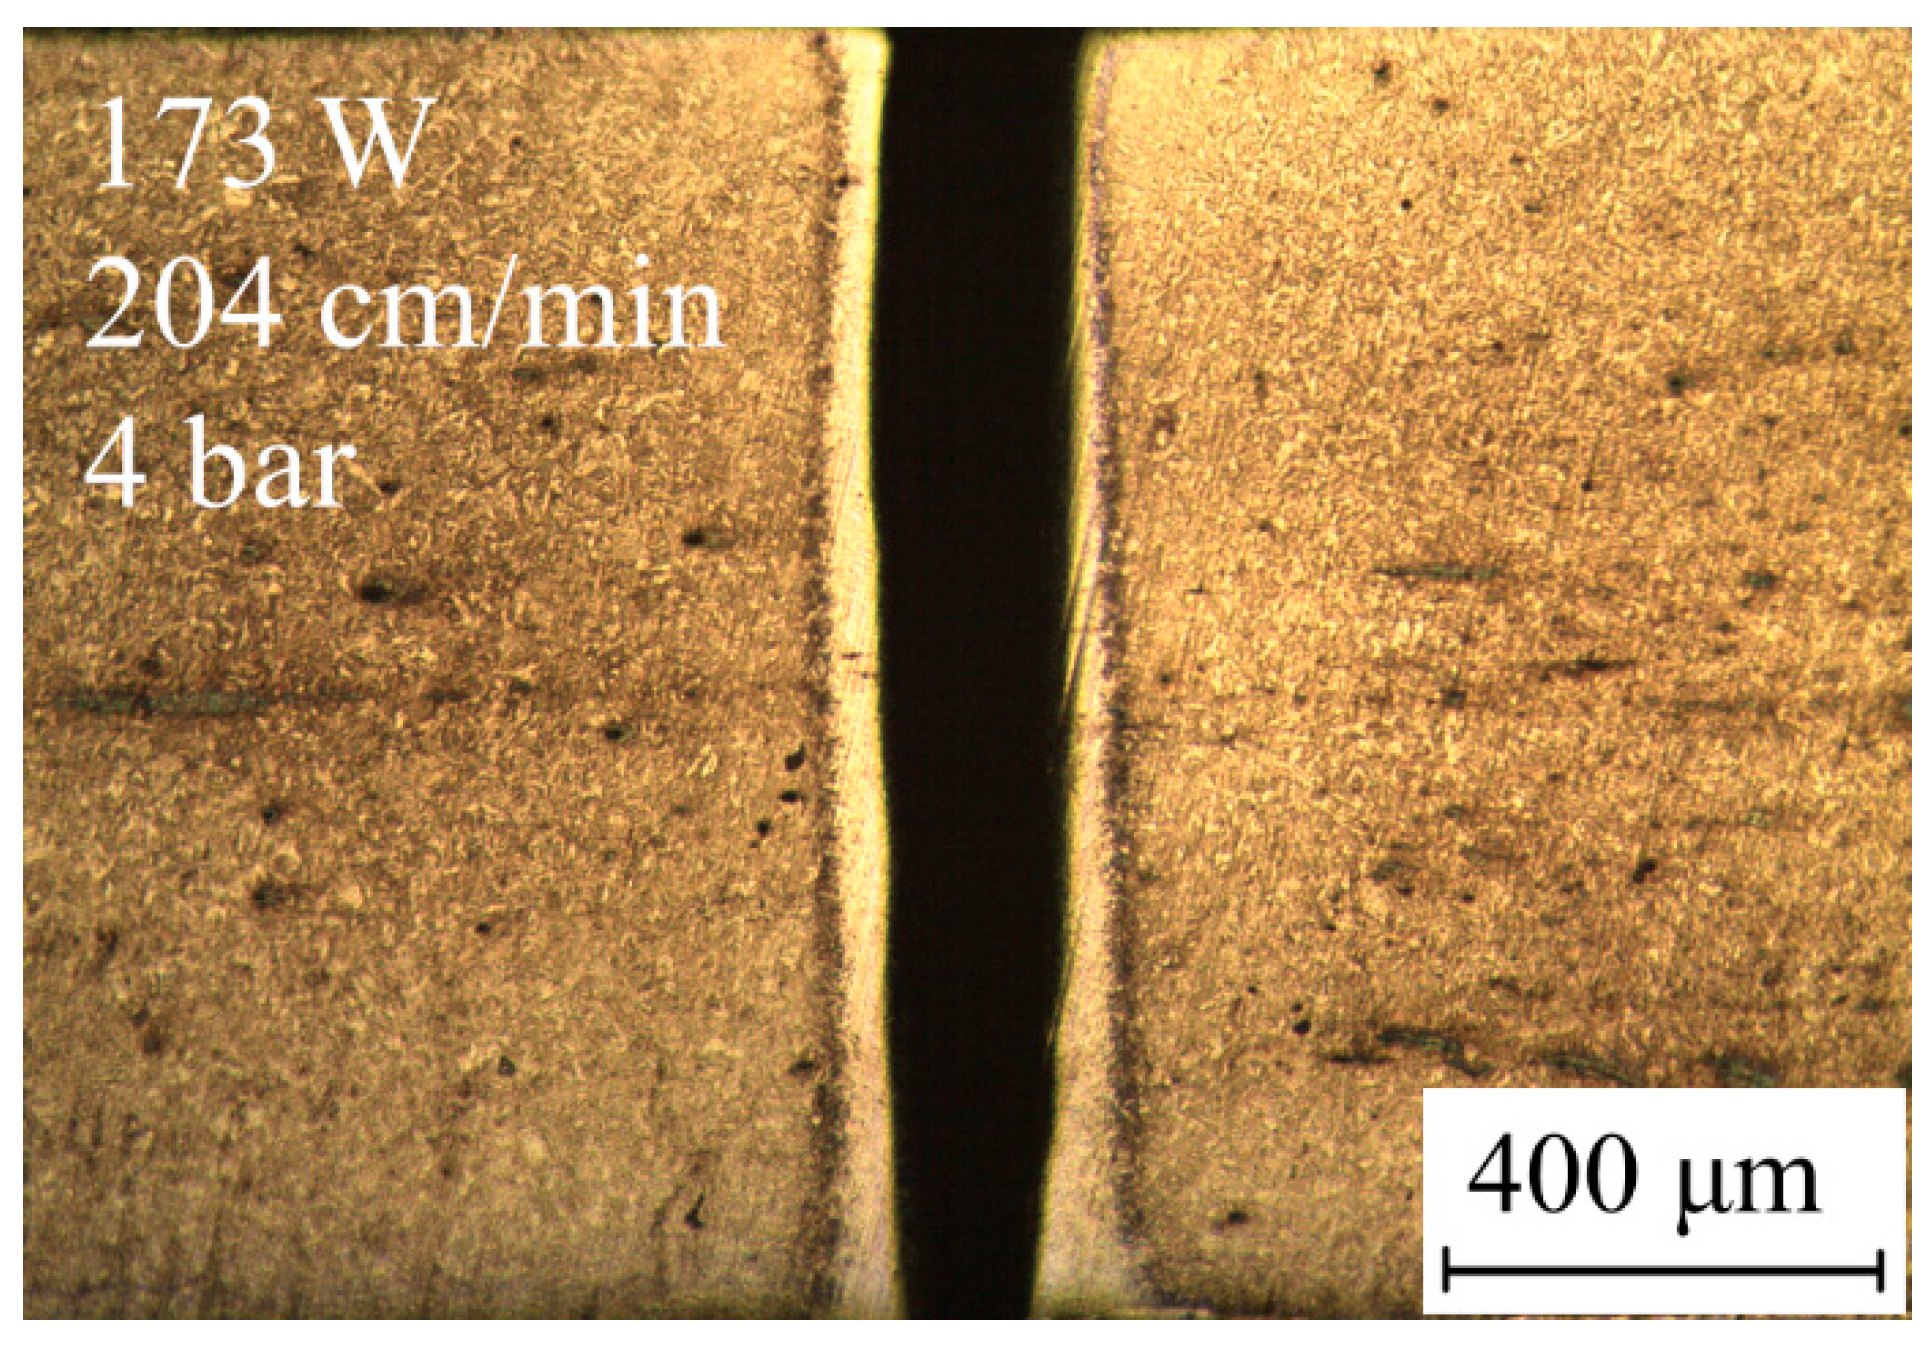
Overall, the optimal computed operating condition is 173 W, 204 cm/min, 4 bar. With these factor levels, the RSM model predicts the quality responses reported in Table 9. A confirmation experiment was conducted to validate these predicted quality responses. For this purpose, a 1 m long linear cut was realized using 173 W, 204 cm/min, 4 bar setting on one of the sheets used for the previous activity. The resulting cut surface is shown in Figure 15, whereas the quality responses measured are reported in Table 9. When comparing the predicted and the actual values, the results point out that the predictive model is able to foresee with a proper accuracy the examined quality responses, with a little underestimation of the predicted values. This demonstrates the appropriateness of the criterion used in the cut quality optimization.
4. Conclusions
This work has investigated the effects of CO2 laser cutting on surface quality of 22MnB5 hot stamping boron steel sheets that are employed in the automotive industry. The main effects of laser power, cutting speed, and O2 assist gas pressure and their interactions on perpendicularity tolerance, mean height of the surface profile, kerf, and HAZ width have been determined and modeled by quadratic models. Finally, an optimization tool based on desirability functions has been used to assess the optimal setting of cutting parameters, which has then been validated by a confirmation experiment.
Overall, the main important results can be summarized as follows:
- ANOVA highlights that some examined process parameters and interactions have a key role in affecting cut quality. Particularly, cutting speed has the most important influence on top kerf and HAZ width, whereas its interactions with laser power and assist gas pressure primarily affect mean height of the surface profile and perpendicularity tolerance, respectively;
- Under the examined ranges of process parameters, the difficulty to blow out the molten material, also probably due to the presence of oxides from the melting of the Fe/Al/Si layer, is considered the main factor responsible for a widening of kerf in the middle of the sheet thickness, which badly affects perpendicularity tolerance;
- Laser power and cutting speed have the strongest influence on mean height of the surface profile. They drive the formation of sideways burnings and turbulence within the molten metal, which increase the peak-to-valley distance of striations on cut surfaces;
- Kerf width is predominantly affected by cutting speed and laser power, the interaction factors instead have a much more limited influence. This outcome confirms the utmost importance of these parameters regardless the nature of sheets, as already claimed by previous studies on different metal alloys;
- HAZ width is mainly affected by cutting speed and oxygen pressure, and its size is directly related to the thermal heat and cooling occurring during the cutting process. Other minor mechanisms ascribable to the pulsed nature of the laser source might be involved in HAZ widening;
- Small amounts of resolidified material (dross) are always present on sheet surfaces cut with the lowest cutting speed (150 cm/min). In the other cases, a low oxygen pressure can favor dross formation;
- A laser power of 173 W, a cutting speed of 204 cm/min and an assist gas pressure of 4 bar is the optimal combination with a desirability over 90%. A confirmation experiment has demonstrated the appropriateness of the quadratic models and optimization criterion used to predict quality responses, with a little underestimation of the actual values.
- CO2 laser processing can be a suitable alternative to the mechanical cutting of automotive stamped part made of 22MnB5 steel grades. However, proper attention must be paid because cut quality depends strongly on laser settings. Particularly, interactions among cutting parameters can have opposite effects for different factor levels. This is because different physical, mechanical, and chemical phenomena, also due to the presence of a Fe/Al/Si coating, can be involved and/or have different effects at varying cutting conditions.
Although fiber lasers are usually preferable for cutting metal sheets with a thickness lower than 4 mm (because of the reduced power consumption and high brightness of laser beam), CO2 lasers still remain as a valid alternative in sheet metal cutting. In fact, CO2 lasers can guarantee good cutting quality also for thick steel sheets and plates. In most applications below 1 kW, CO2 and fiber lasers are complementary technologies rather than competing.
Acknowledgments
The author thank the Department of Innovation, Research and University of the Autonomous Province of Bozen/Bolzano for covering the Open Access publication costs.
Conflicts of Interest
The author declares no conflict of interest.
References
- Karbasian, H.; Tekkaya, A.E. A review on hot stamping. J. Mater. Process. Technol. 2010, 210, 2103–2118. [Google Scholar] [CrossRef]
- Russo Spena, P.; De Maddis, M.; Lombardi, F. Cut quality assessment of CO2 laser cutting of twinning-induced plasticity steel sheets. J. Eng. Manuf. 2015, 229, 3–19. [Google Scholar] [CrossRef]
- Tahir, A.F.M.; Aqida, S. An investigation of laser cut quality of 22MnB5 ultra high strength steel using response surface methodology. Opt. Laser Technol. 2017, 92, 142–149. [Google Scholar] [CrossRef]
- Nagasaka, A.; Kubota, Y.; Sugimoto, K.; Mio, A.; Hojo, T.; Makii, K.; Kawajiri, M.; Kitayama, M. Effect of YAG laser cutting on stretch-flangeability of ultra high strength TRIP sheet steel with bainitic ferrite matrix. ISIJ Int. 2010, 50, 1441–1446. [Google Scholar] [CrossRef]
- Radovanovic, M. Experimental investigations of CO2 laser cut quality: A review. Nonconv. Technol. Rev. 2011, 4, 35–42. [Google Scholar]
- Sharma, A.; Yadava, V. Modelling and optimization of cut quality during pulsed Nd:YAG laser cutting of thin Al-alloy sheet for curved profile. Opt. Lasers Eng. 2013, 51, 77–88. [Google Scholar] [CrossRef]
- Pandey, A.K.; Dubey, A.K. Taguchi based fuzzy logic optimization of multiple quality characteristics in laser cutting of Duralumin sheet. Opt. Lasers Eng. 2012, 50, 328–335. [Google Scholar] [CrossRef]
- Eltawahni, H.A.; Hagino, M.; Benyounis, K.Y.; Inoue, T.; Olabi, A.G. Effect of CO2 laser cutting process parameters on edge quality and operating cost of AISI316L. Opt. Laser Technol. 2012, 44, 1068–1082. [Google Scholar] [CrossRef] [Green Version]
- Yilbas, B. Experimental investigation into laser cutting parameters. J. Mater. Process. Technol. 1996, 58, 323–330. [Google Scholar] [CrossRef]
- Yilbas, B.; Karatas, C.; Uslan, I.; Keles, O.; Usta, Y.; Yilbas, Z.; Ahsan, M. Wedge cutting of mild steel by CO2 laser and cut-quality assessment in relation to normal cutting. Opt. Lasers Eng. 2008, 46, 777–784. [Google Scholar] [CrossRef]
- Hao, H.J.; Xu, J.Y.; Li, J. Prediction of laser cut quality based on an improved Pareto genetic algorithm. Lasers Eng. 2014, 27, 43–56. [Google Scholar]
- Dubey, A.K.; Yadava, V. Multi-objective optimization of Nd:YAG laser cutting of nickel-based superalloy sheet using orthogonal array with principal component analysis. Opt. Lasers Eng. 2008, 46, 124–132. [Google Scholar] [CrossRef]
- Mullick, S.; Madhukar, Y.K.; Roy, S.; Nath, A.K. Performance optimization of water-jet assisted underwater laser cutting of AISI 304 stainless steel sheet. Opt. Lasers Eng. 2016, 83, 32–47. [Google Scholar] [CrossRef]
- Sanchez, J.A.; López de Lacalle, L.N.; Lamikiz, A. A computer-aided system for the optimization of the accuracy of the wire electro-discharge machining process. Int. J. Comp. Integr. Manuf. 2004, 17, 413–420. [Google Scholar] [CrossRef]
- EN ISO 9013 Standard. Thermal Cutting—Classification of Thermal Cuts—Geometrical Product Specification and Quality Tolerances; ISO Copyright Office: Geneva, Switzerland, 2017. [Google Scholar]
- Powell, J. Laser cutting steels. In CO2 Laser Cutting, 1st ed.; Powell, J., Ed.; Springer: London, UK, 1993; pp. 23–70. ISBN 978-1-4471-3386-5. [Google Scholar]
- Ghany, K.A.; Newishy, M. Cutting of 1.2 mm thick austenitic stainless steel sheet using pulsed and CW Nd:YAG laser. J. Mater. Proc. Technol. 2005, 168, 438–447. [Google Scholar] [CrossRef]
- Yilbas, B.S. Effect of process parameters on the kerf width during the laser cutting process. J. Eng. Manuf. 2001, 215, 1357–1365. [Google Scholar] [CrossRef]
- Yilbas, B.S. Laser cut quality and thermal efficiency analysis. J. Mater. Proc. Technol. 2004, 155–156, 2106–2115. [Google Scholar] [CrossRef]
- Dilthey, U.; Faerber, M.; Weick, J. Laser cutting of steel-cut quality depending on cutting parameters. Weld. World 1992, 30, 275–278. [Google Scholar]
- Radovanovic, M.; Dasic, P. Research on surface roughness by laser cut. In The Annals of University “Dunarea De Jos” of Galati; Fascicle VII Tribology; Dunarea De Jos of Galati: Galati, Romania, 2006; pp. 84–88. [Google Scholar]
- Yilbas, B.S.; Rashid, M. CO2 laser cutting of Incoloy 800 HT alloy and its quality assessment. J. Laser Eng. 2002, 12, 135–145. [Google Scholar] [CrossRef]
- Neimeyer, R.; Smith, R.N.; Kaminski, D.A. Effects of operating parameters on surface quality for laser cutting of mild steel. J. Eng. Ind. 1993, 115, 359–362. [Google Scholar] [CrossRef]
- Jarosz, K.; Löschner, P.; Niesłony, P. Effect of cutting speed on surface quality and heat-affected zone in laser cutting of 316L stainless steel. Procedia Eng. 2016, 149, 155–162. [Google Scholar] [CrossRef]
- Sharma, A.; Yadava, V. Modelling and optimization of cut quality during pulsed Nd:YAG laser cutting of thin Al-alloy sheet for straight profile. Opt. Laser Technol. 2012, 44, 159–168. [Google Scholar] [CrossRef]
- Lamikiz, A.; López de Lacalle, L.N.; Sanchez, J.A.; Del Pozo, D.; Etayo, J.M.; Lopez, J.M. CO2 laser cutting of advanced high strength steels (AHSS). Appl. Surf. Sci. 2005, 242, 362–368. [Google Scholar] [CrossRef]
- Rajaram, N.; Sheikh-Ahmad, J.; Cheraghi, H. CO2 laser cut quality of 4130 steel. Int. J. Mach. Tools Manuf. 2003, 43, 351–358. [Google Scholar] [CrossRef]
- Powell, J.; Al-Mashikhi, S.O.; Kaplan, A.F.H.; Voisey, K.T. Fibre laser cutting of thin section mild steel: An explanation of the “striation free” effect. Opt. Laser Eng. 2011, 49, 1069–1075. [Google Scholar] [CrossRef]
- Wandera, C.; Kujanpää, V.; Salminen, A. Laser power requirement for cutting thick-section steel and effects of processing parameters on mild steel cut quality. J. Eng. Manuf. 2011, 225, 651–661. [Google Scholar] [CrossRef]
- Riveiro, A.; Quintero, F.; Lusquiños, F.; Comesaña, R.; Pou, J. Influence of assist gas nature on the surfaces obtained by laser cutting of Al-Cu alloys. Surf. Coat. Technol. 2010, 5, 1878–1885. [Google Scholar] [CrossRef]
- Ali, H.M.; Iqbal, A.; Hashemipour, M. Cut quality and strength evaluation of hole making in glass fibre reinforced polymer (GFRP) composite using laser beam cutting technology. Lasers Eng. 2015, 31, 71–95. [Google Scholar]
Figure 1.
(a) SEM micrograph of the hot stamping boron steel sheets after the laboratory heat treatment and (b) EDS spectrum of the Fe/Al/Si coating.
Figure 1.
(a) SEM micrograph of the hot stamping boron steel sheets after the laboratory heat treatment and (b) EDS spectrum of the Fe/Al/Si coating.
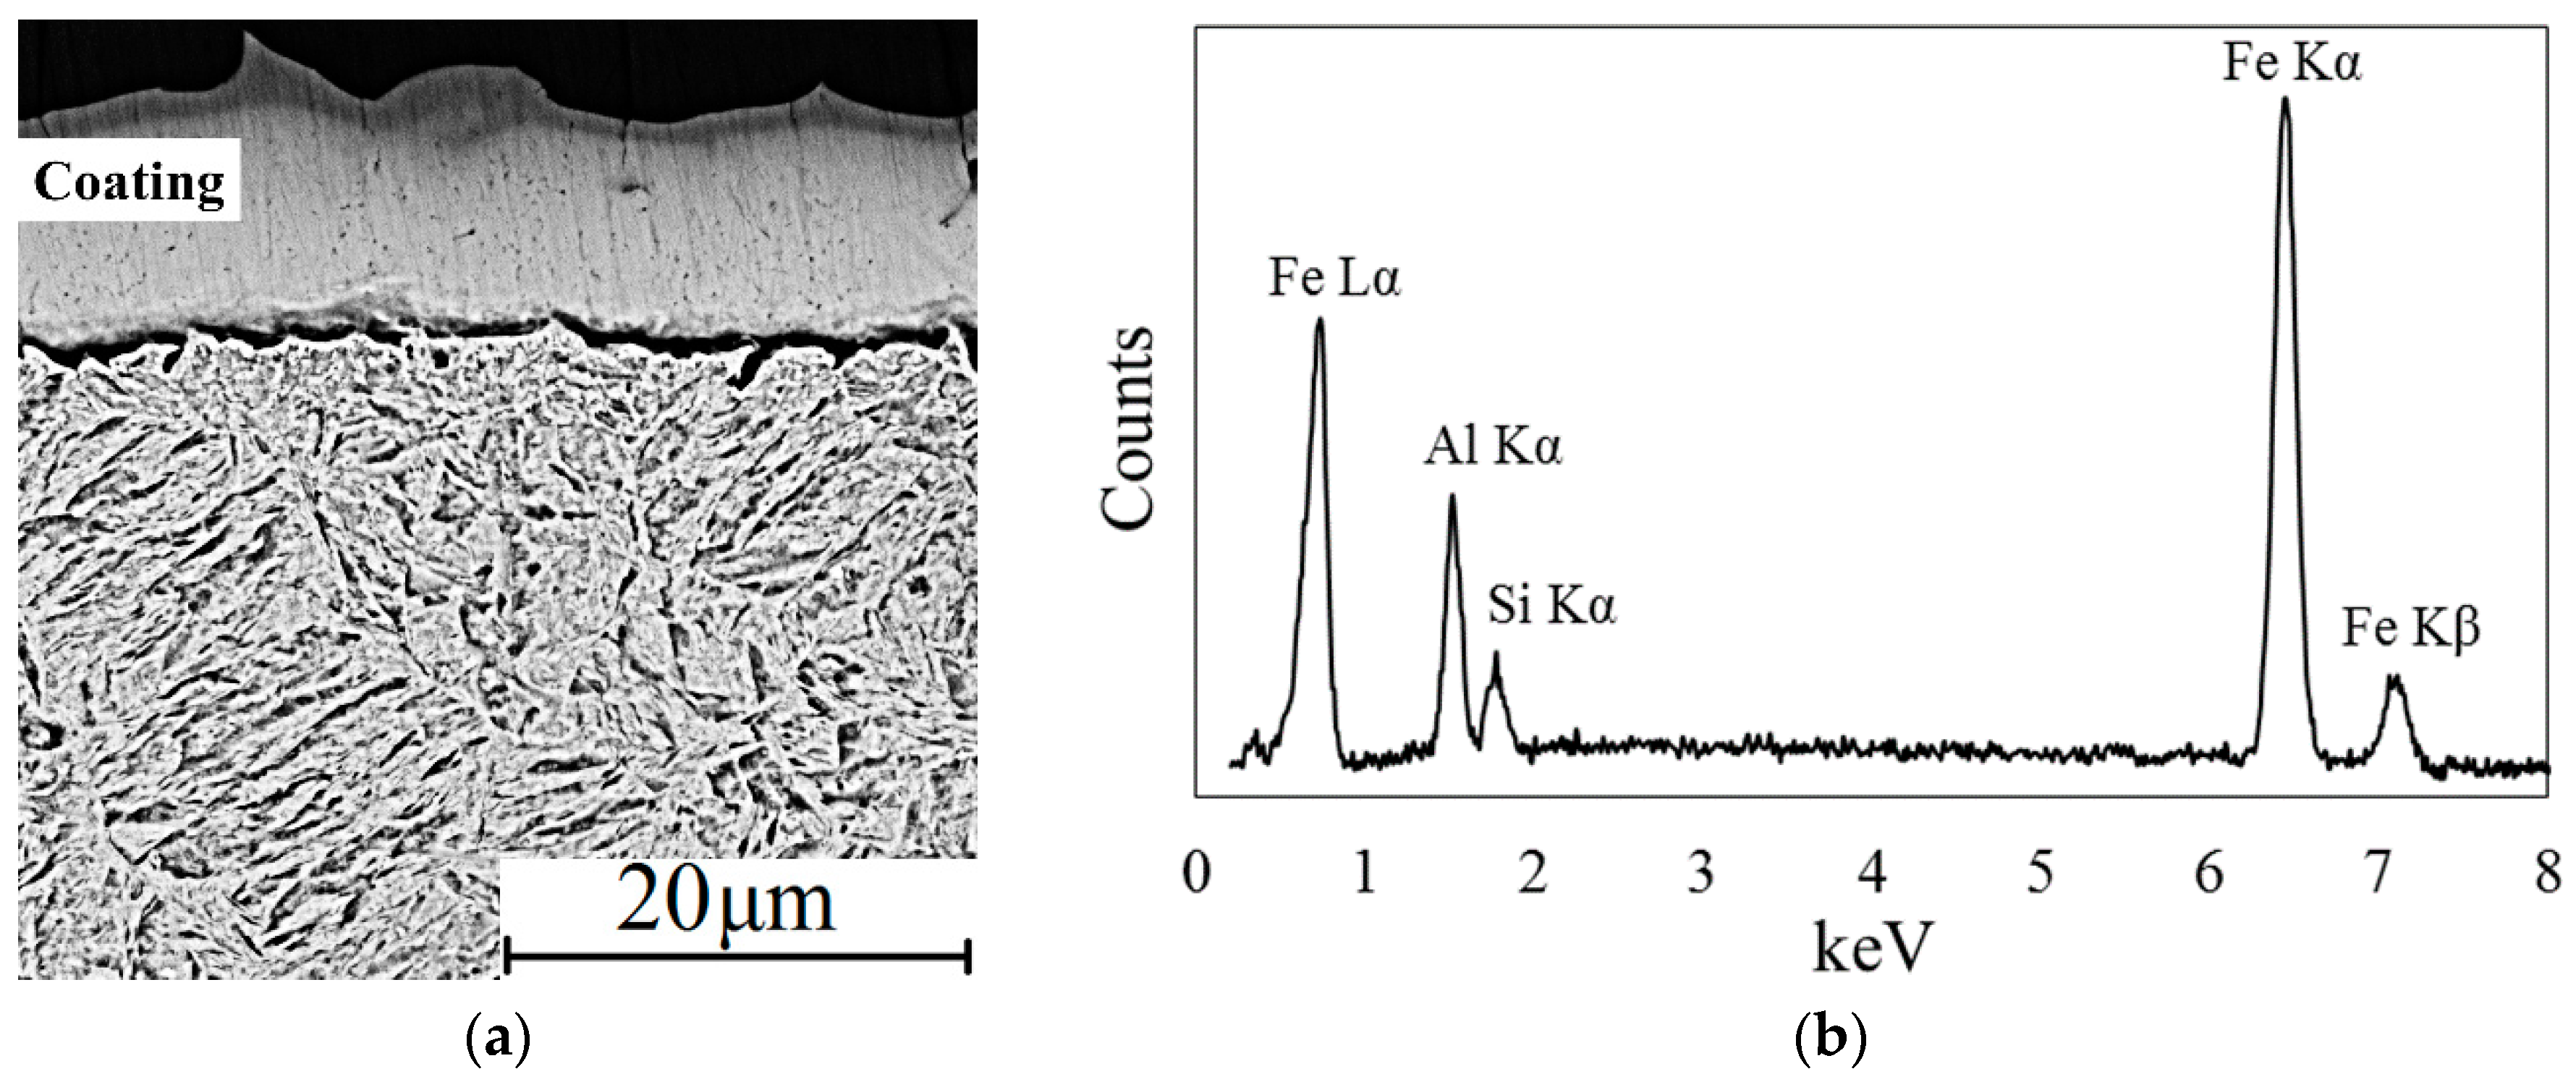
Figure 2.
(a) Example of a through-thickness cross section of a cut sheet used to measure perpendicularity tolerance; (b) mean height of the surface profile, as evaluated on a cut surface: Z1, …, Z5, single profile element; el, evaluation length; es, single sampling length.
Figure 2.
(a) Example of a through-thickness cross section of a cut sheet used to measure perpendicularity tolerance; (b) mean height of the surface profile, as evaluated on a cut surface: Z1, …, Z5, single profile element; el, evaluation length; es, single sampling length.
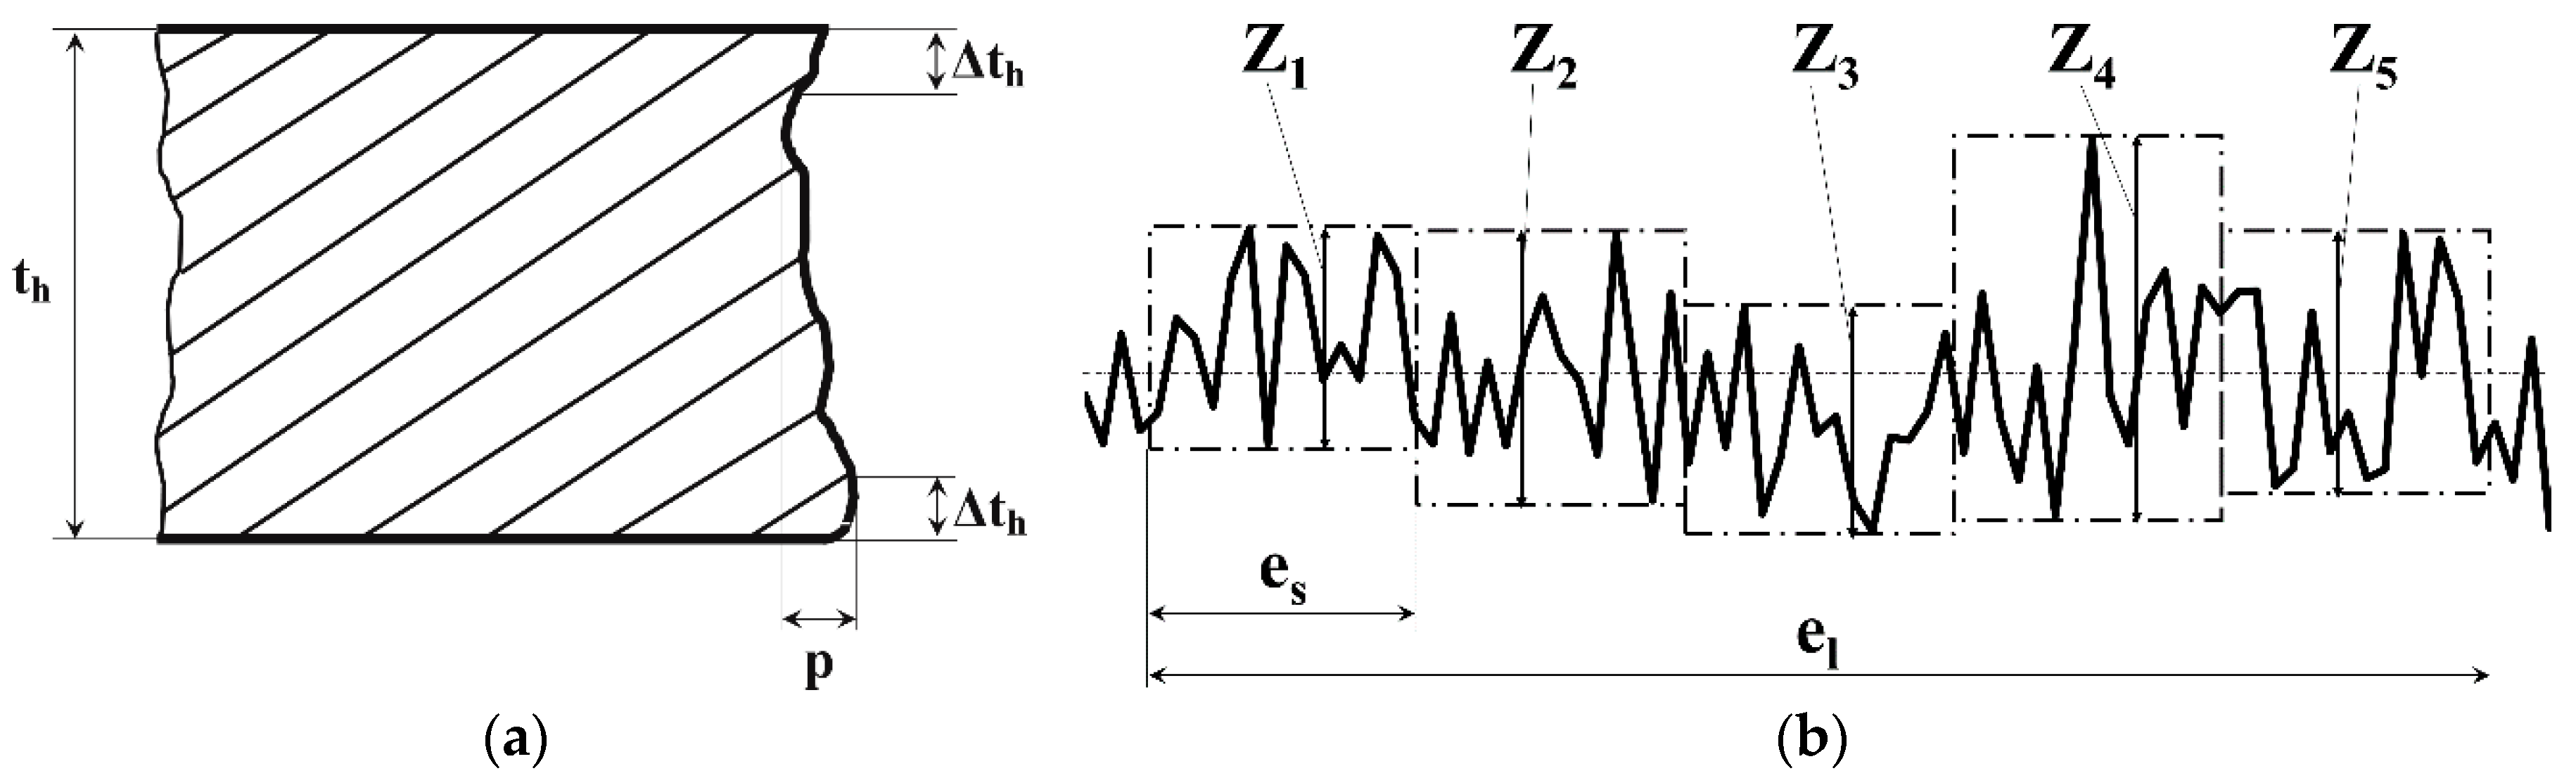
Figure 3.
Schematic view and optical cross section of a linear laser cut. Five different positions (refer to the black arrows on the right-hand image) have been measured to compute HAZ width. Drawing not to scale.
Figure 3.
Schematic view and optical cross section of a linear laser cut. Five different positions (refer to the black arrows on the right-hand image) have been measured to compute HAZ width. Drawing not to scale.
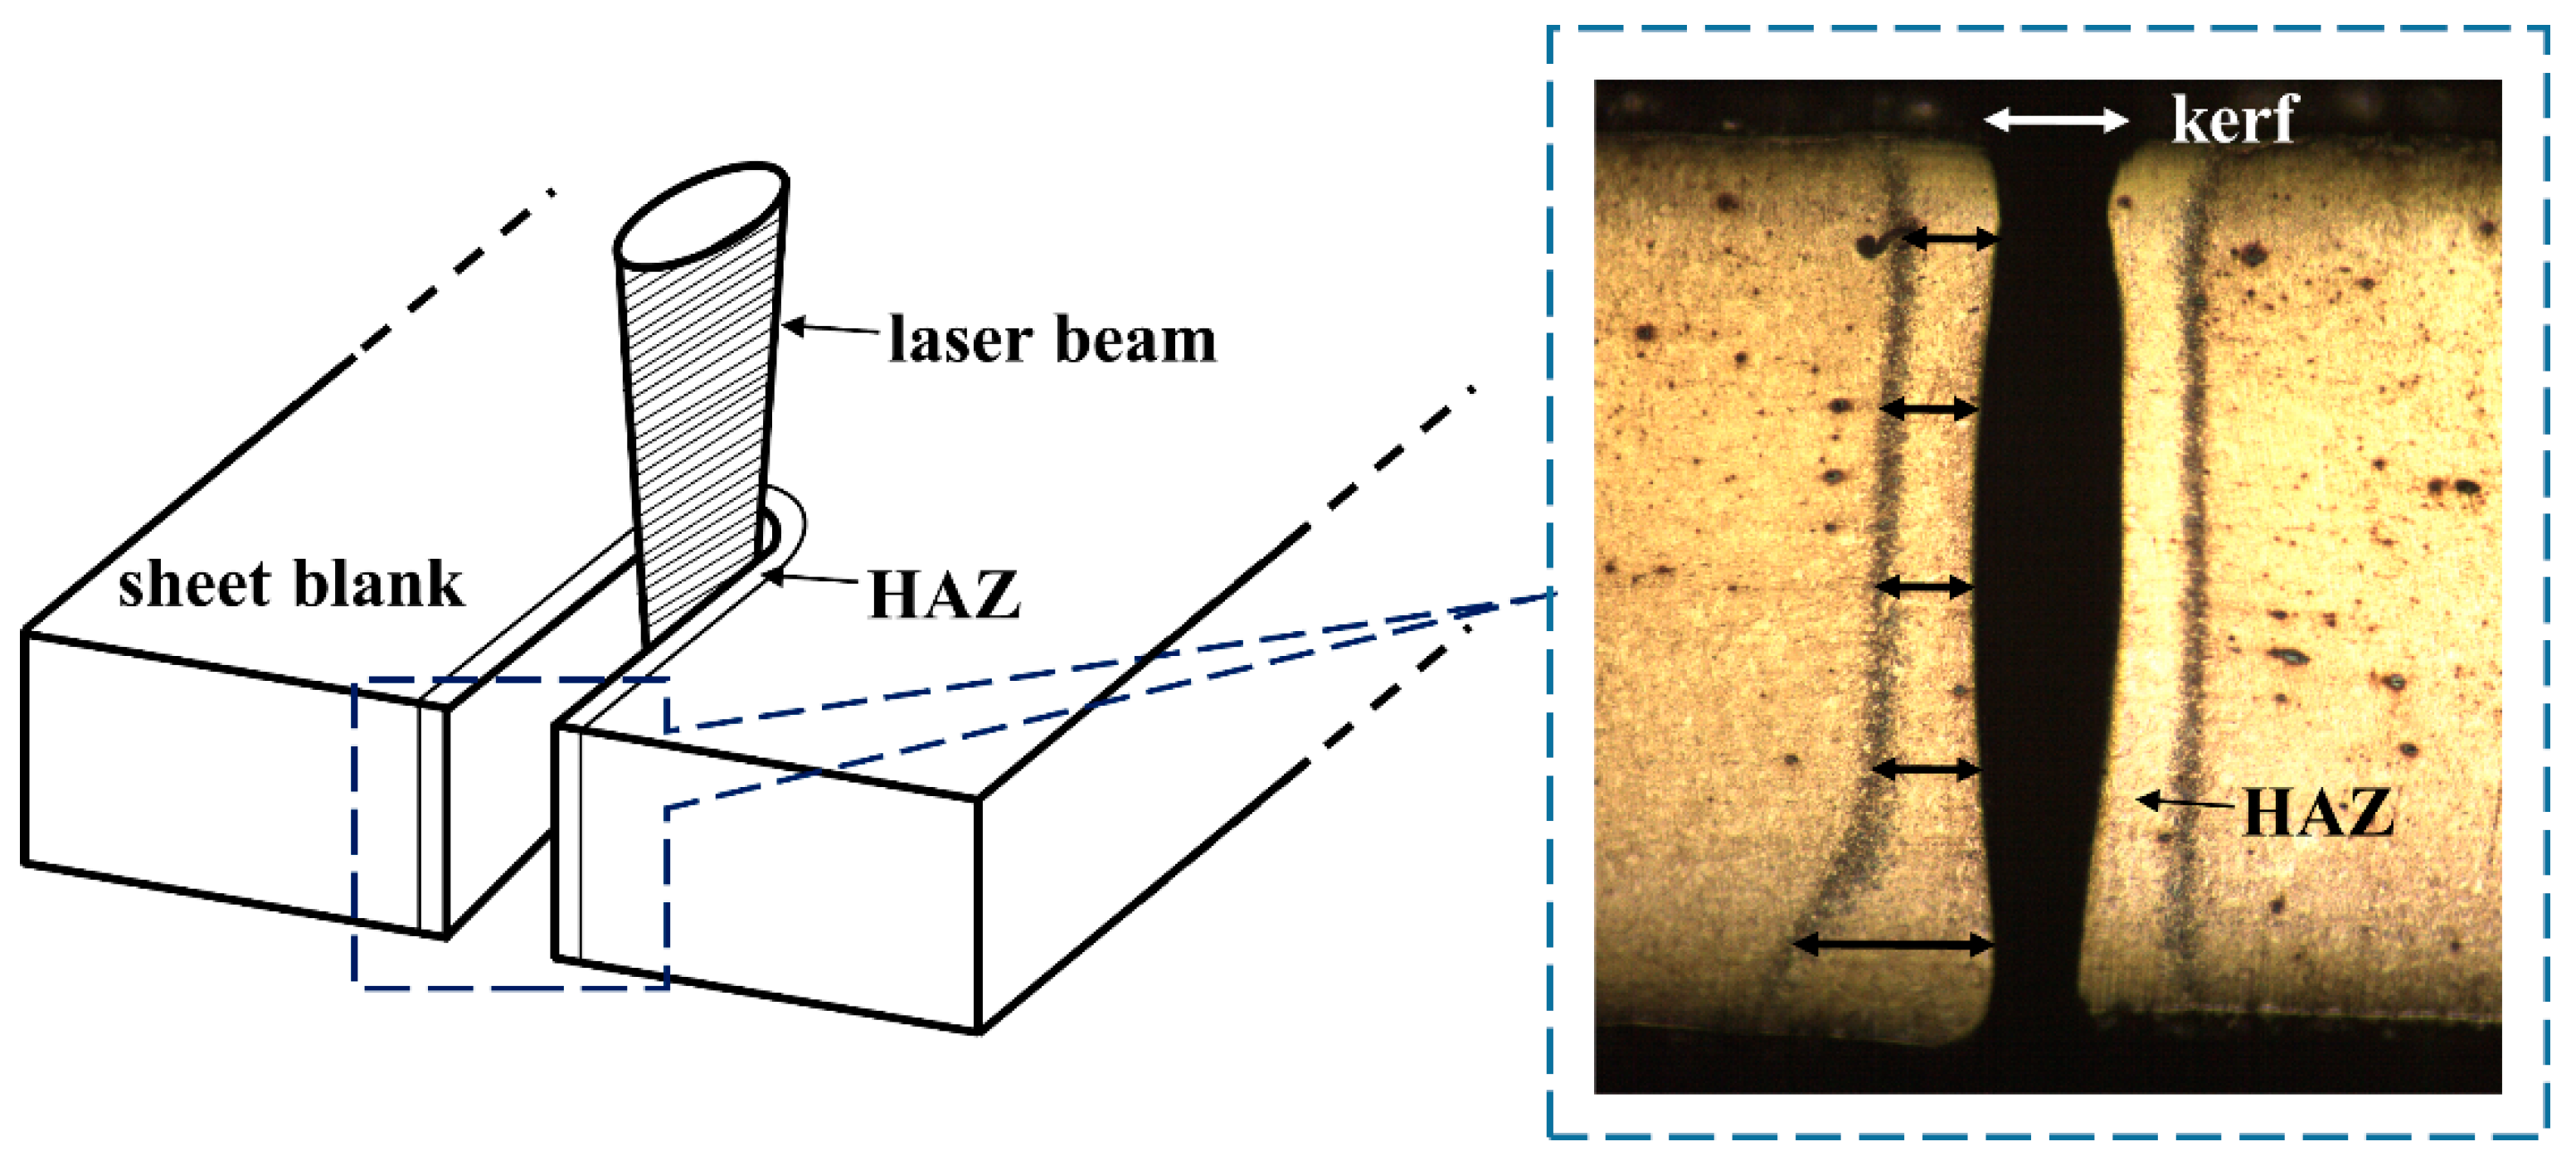
Figure 4.
Cross sectional area of the cut surfaces for the different cutting conditions.

Figure 5.
(a) Main effects and (b) interaction plots of perpendicularity tolerance. A: laser power; B: cutting speed; C: oxygen pressure. Polynomial trendlines have been used to fit perpendicularity tolerance data.
Figure 5.
(a) Main effects and (b) interaction plots of perpendicularity tolerance. A: laser power; B: cutting speed; C: oxygen pressure. Polynomial trendlines have been used to fit perpendicularity tolerance data.

Figure 6.
Response surface plot for the effects of the cutting parameters on perpendicularity tolerance (PT). Oxygen pressure 3 bar.
Figure 6.
Response surface plot for the effects of the cutting parameters on perpendicularity tolerance (PT). Oxygen pressure 3 bar.

Figure 7.
(a) Main effects and (b) interaction plots of mean height of the surface profile. A: laser power; B: cutting speed; C: oxygen pressure. Polynomial trendlines have been used to fit perpendicularity tolerance data.
Figure 7.
(a) Main effects and (b) interaction plots of mean height of the surface profile. A: laser power; B: cutting speed; C: oxygen pressure. Polynomial trendlines have been used to fit perpendicularity tolerance data.

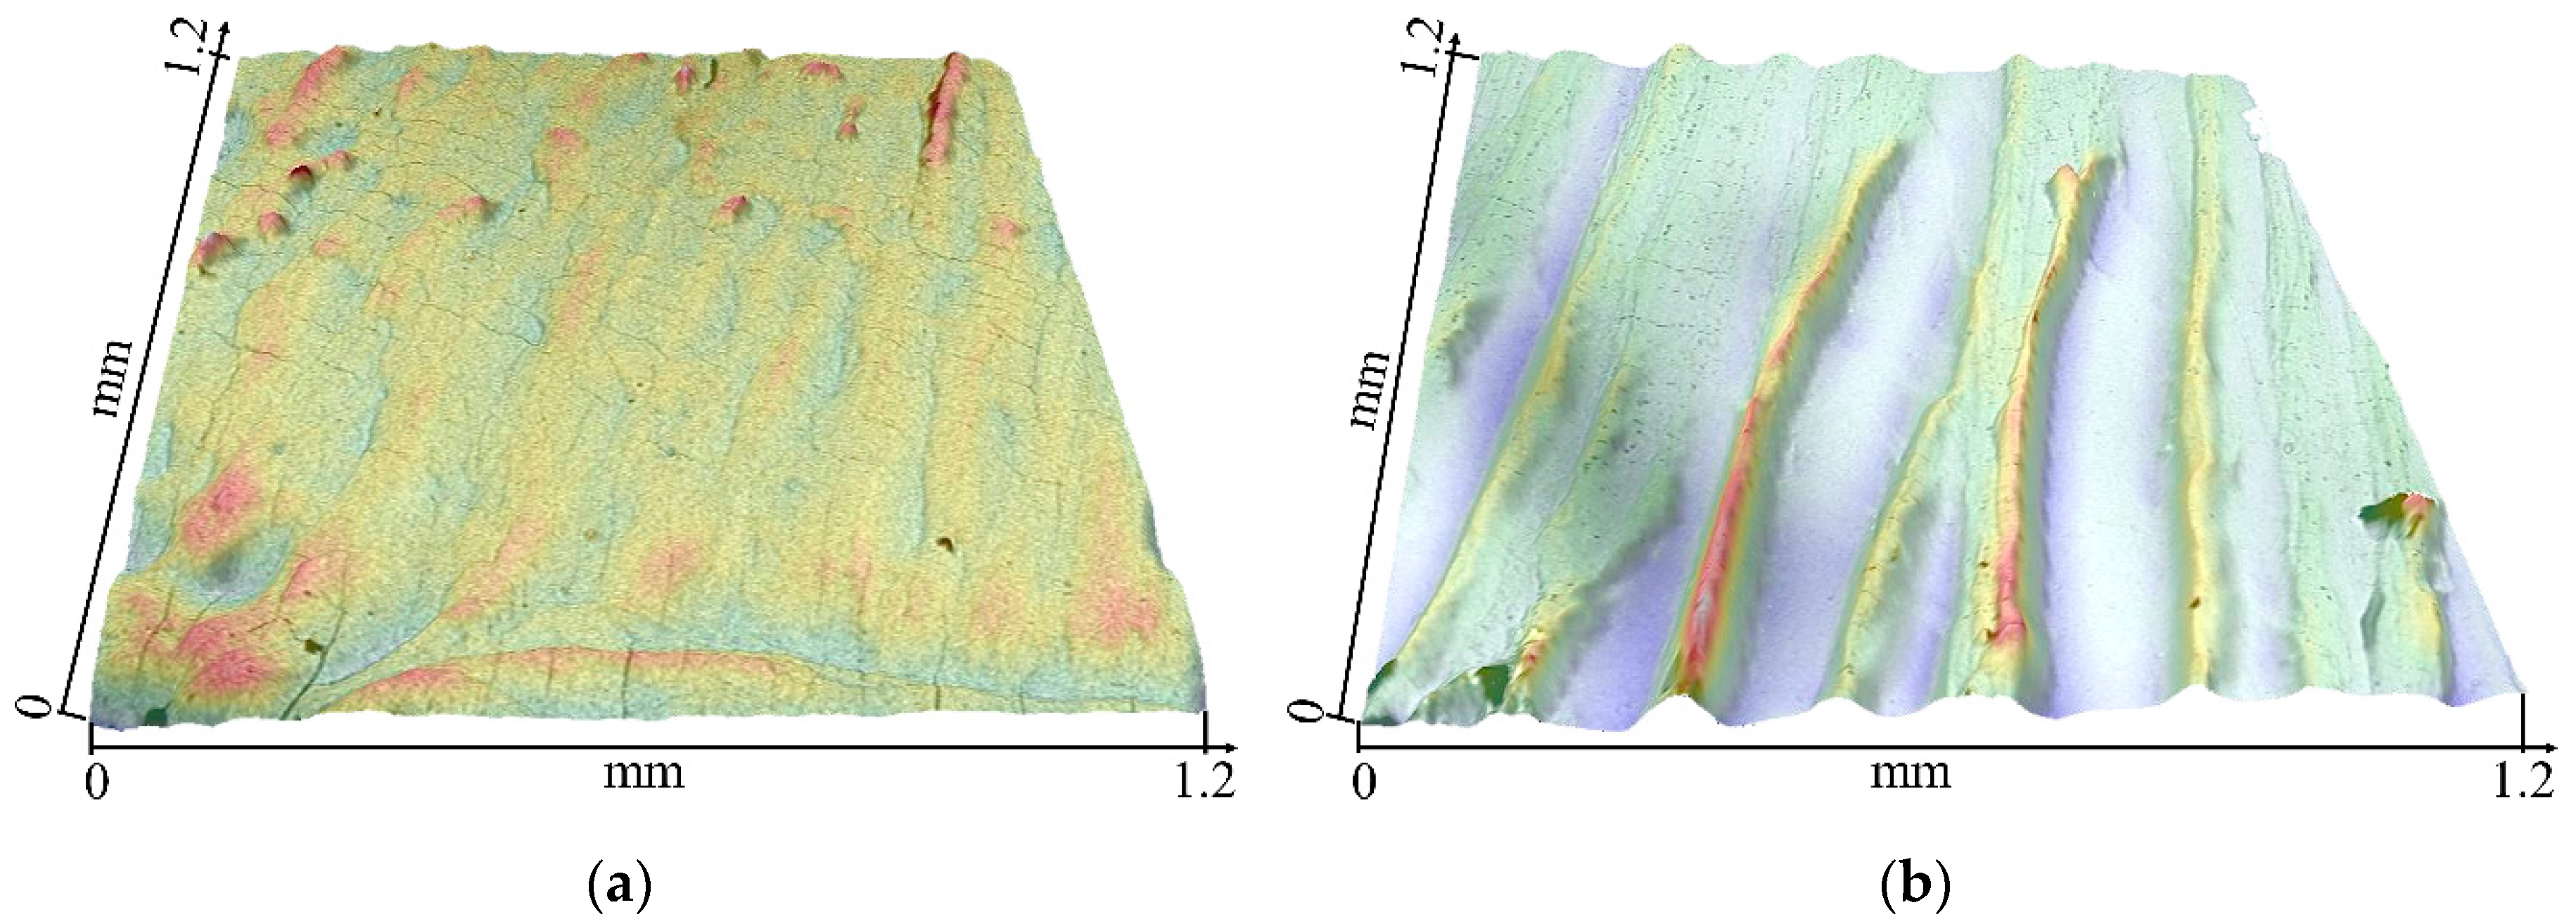
Figure 8.
Topography of the cut surfaces obtained with run (a) No. 1 (150 W, 150 cm/min, 2 bar) and (b) No. 7 (300 W, 150 cm/min, 4 bar).
Figure 8.
Topography of the cut surfaces obtained with run (a) No. 1 (150 W, 150 cm/min, 2 bar) and (b) No. 7 (300 W, 150 cm/min, 4 bar).

Figure 9.
Response surface plot for the effects of the cutting parameters on mean height of the surface profile (RZ5). Oxygen pressure 3 bar.
Figure 9.
Response surface plot for the effects of the cutting parameters on mean height of the surface profile (RZ5). Oxygen pressure 3 bar.

Figure 10.
(a) Main effects and (b) interaction plots of top kerf width. A: laser power; B: cutting speed; C: oxygen pressure. Polynomial trendlines have been used to fit perpendicularity tolerance data.
Figure 10.
(a) Main effects and (b) interaction plots of top kerf width. A: laser power; B: cutting speed; C: oxygen pressure. Polynomial trendlines have been used to fit perpendicularity tolerance data.
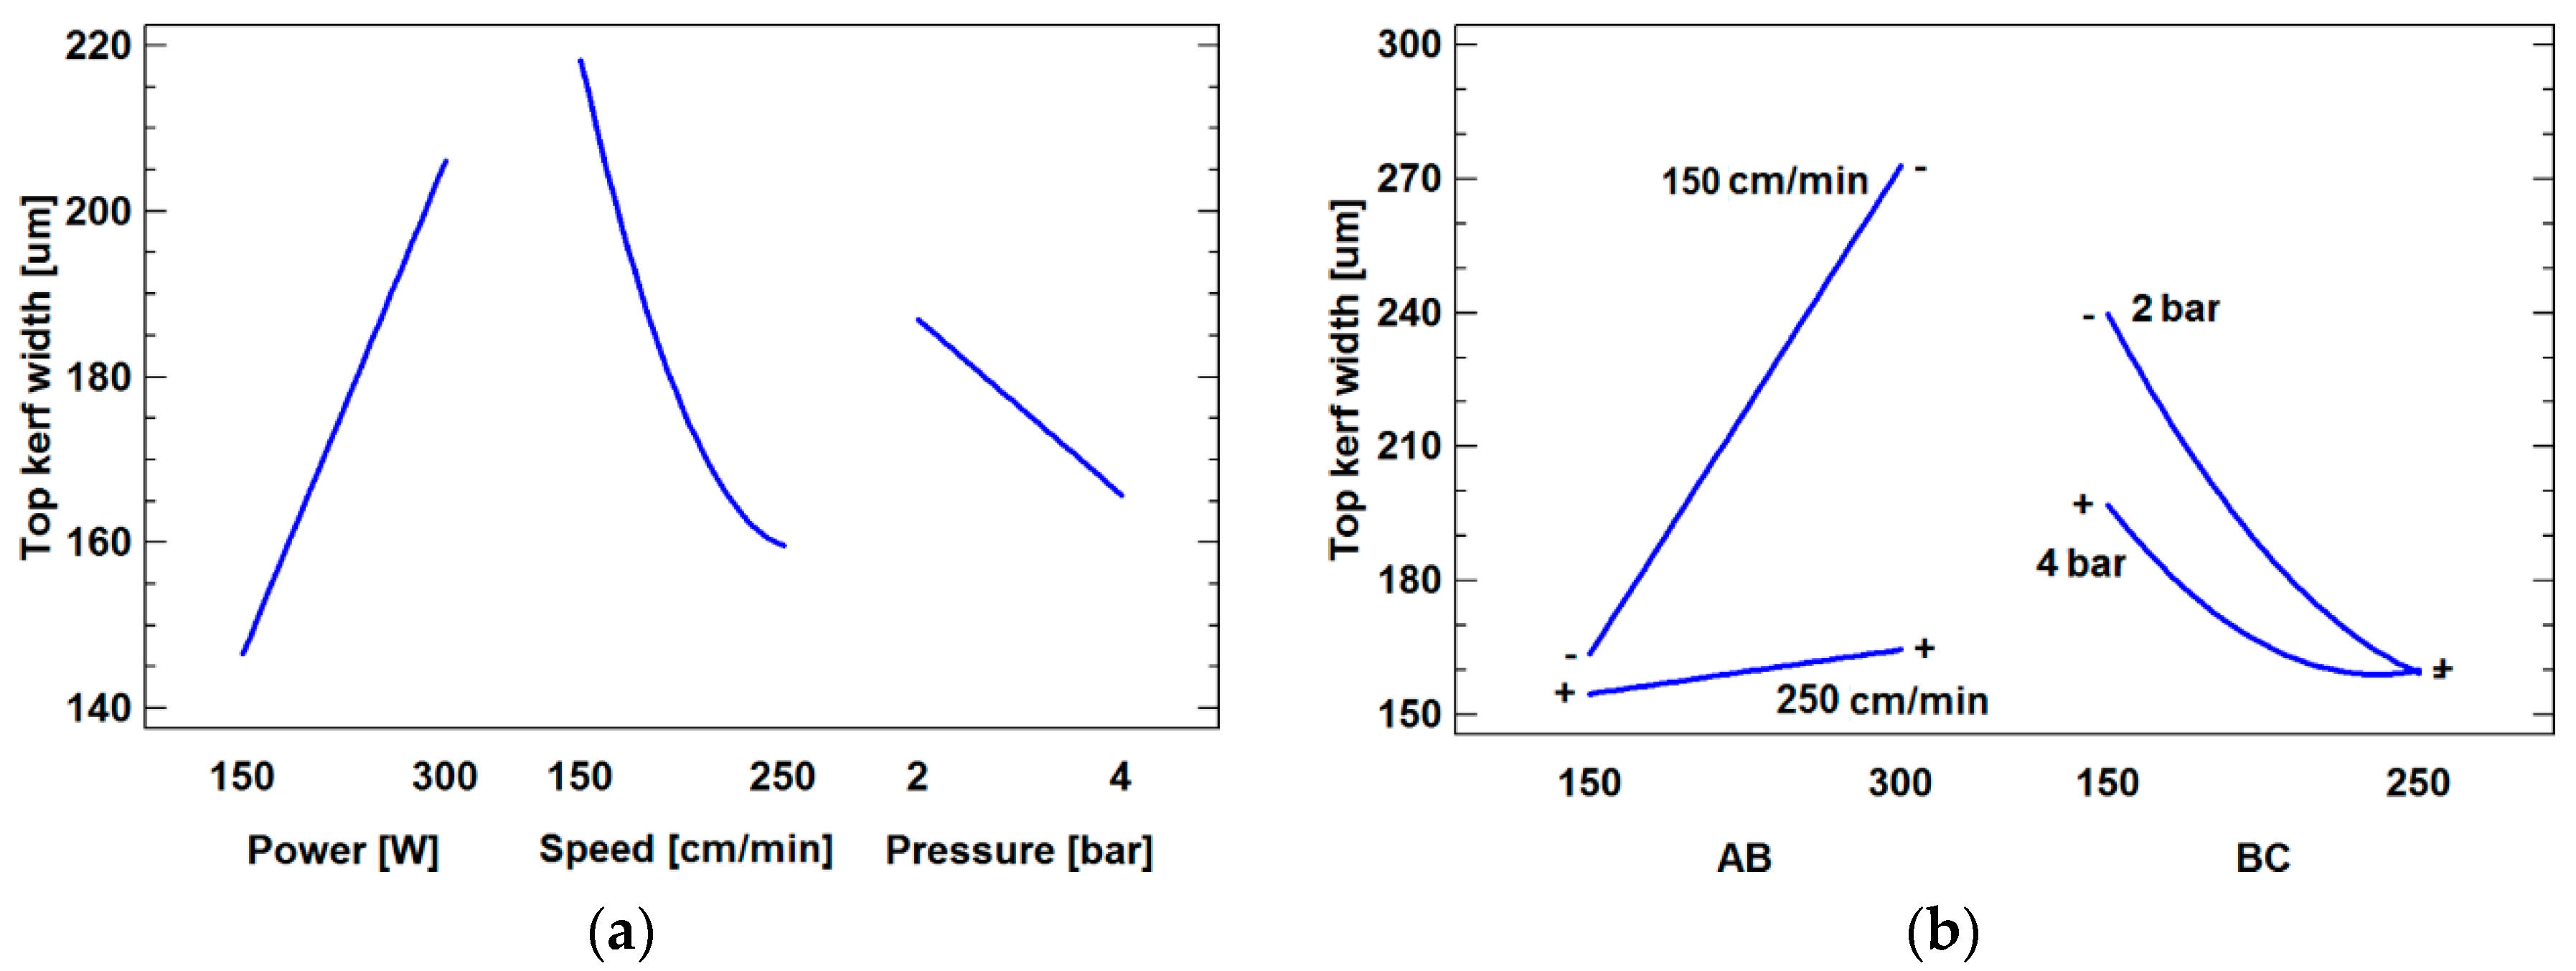
Figure 11.
Response surface plot for the effects of the cutting parameters on top kerf width (kw). Oxygen pressure 3 bar.
Figure 11.
Response surface plot for the effects of the cutting parameters on top kerf width (kw). Oxygen pressure 3 bar.
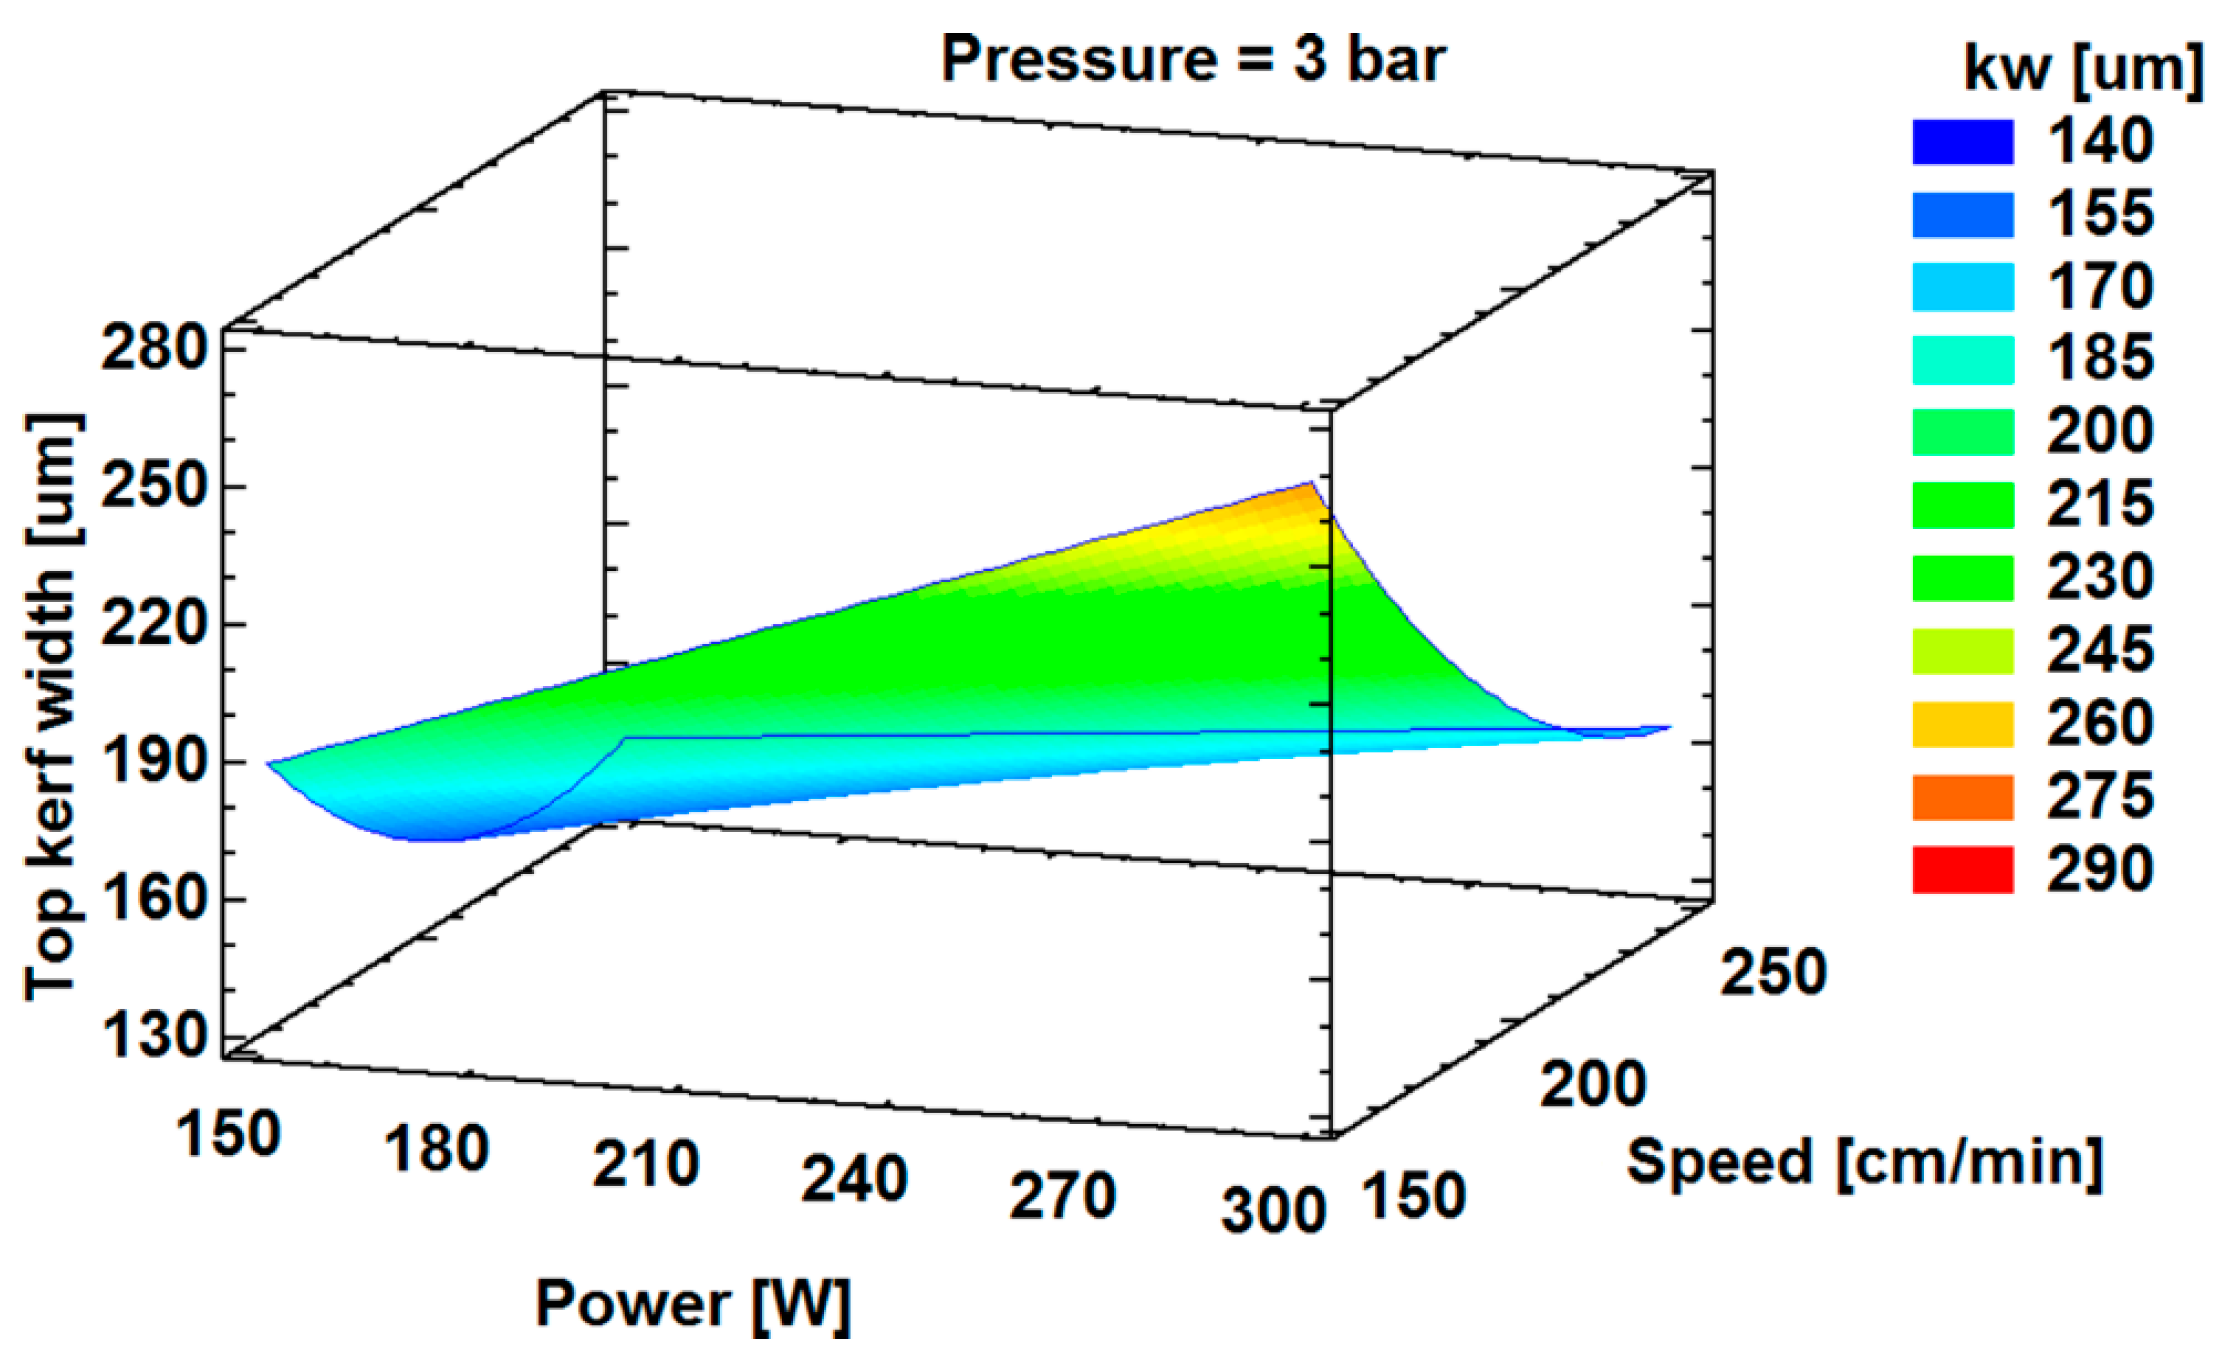
Figure 12.
(a) Main effects and (b) interaction plots of HAZ width. Polynomial trendlines have been used to fit perpendicularity tolerance data.
Figure 12.
(a) Main effects and (b) interaction plots of HAZ width. Polynomial trendlines have been used to fit perpendicularity tolerance data.

Figure 13.
Response surface plot for the effects of the cutting parameters on HAZ width. Oxygen pressure 3 bar.
Figure 13.
Response surface plot for the effects of the cutting parameters on HAZ width. Oxygen pressure 3 bar.
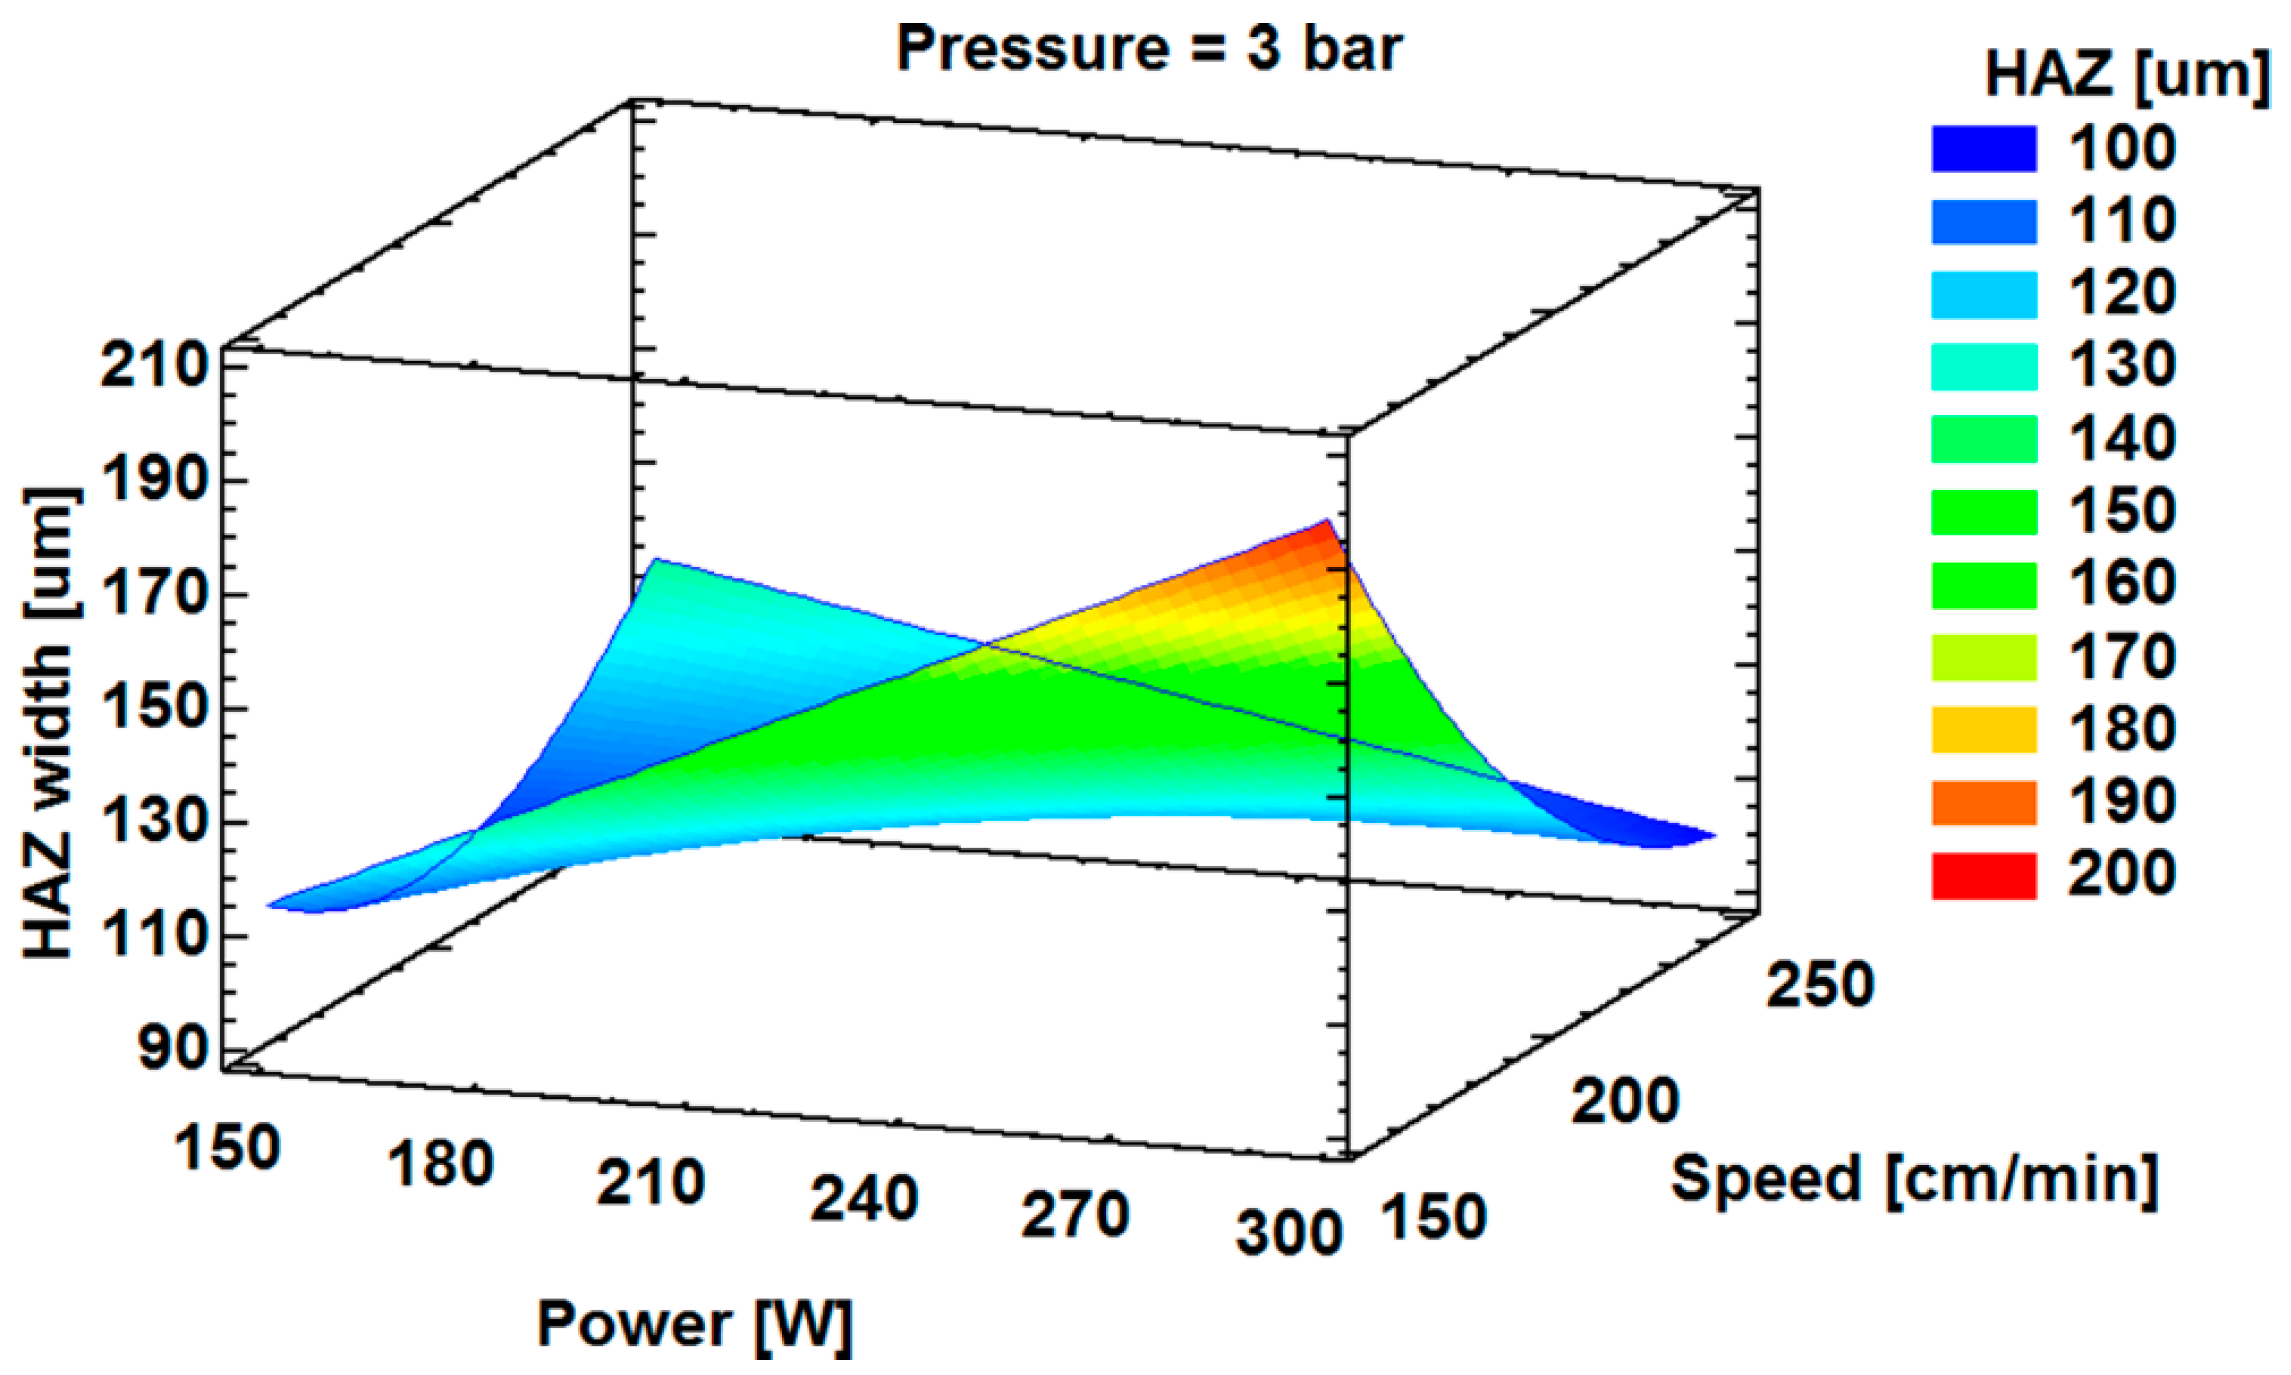
Figure 14.
Desirability plot versus laser cutting parameters.

Figure 15.
Cross sectional area of the cut surface obtained using the optimal computed operating condition (173 W, 204 cm/min, 4 bar).
Figure 15.
Cross sectional area of the cut surface obtained using the optimal computed operating condition (173 W, 204 cm/min, 4 bar).

Table 1.
Chemical composition of the hot stamping boron steel sheets (optical emission spectroscopy) and of the Fe/Al/Si coating (energy dispersive X-ray spectroscopy).
Table 1.
Chemical composition of the hot stamping boron steel sheets (optical emission spectroscopy) and of the Fe/Al/Si coating (energy dispersive X-ray spectroscopy).
| Element | Fe | C | Si | Mn | Cr | Al | Ti | B | P + S |
|---|---|---|---|---|---|---|---|---|---|
| 22MnB5 | bal. | 0.25 | 0.23 | 1.30 | 0.13 | 0.036 | 0.039 | 0.047 | <0.03 |
| Coating | 87.9 | - | 3.5 | - | - | 8.6 | - | - | - |
Table 2.
L9(34) orthogonal array defining the cutting conditions used during the experimental tests.
Table 2.
L9(34) orthogonal array defining the cutting conditions used during the experimental tests.
| Run No. | 1 | 2 | 3 | 4 | 5 | 6 | 7 | 8 | 9 |
|---|---|---|---|---|---|---|---|---|---|
| Laser power [W] | 150 | 150 | 150 | 225 | 225 | 225 | 300 | 300 | 300 |
| Cutting speed [cm/min] | 150 | 200 | 250 | 150 | 200 | 250 | 150 | 200 | 250 |
| Oxygen pressure [bar] | 2.0 | 3.0 | 4.0 | 3.0 | 4.0 | 2.0 | 4.0 | 2.0 | 3.0 |
Table 3.
Cut quality responses: average values and standard deviation. PT: perpendicularity tolerance; RZ5: mean height of the surface profile; kw: top kerf width. Asterisks (*) highlight the best performances for each quality response.
Table 3.
Cut quality responses: average values and standard deviation. PT: perpendicularity tolerance; RZ5: mean height of the surface profile; kw: top kerf width. Asterisks (*) highlight the best performances for each quality response.
| Run | Process Parameters | Quality Responses | ||||||
|---|---|---|---|---|---|---|---|---|
| No. | Laser Power [W] | Cutting Speed [cm/min] | Oxygen Pressure [bar] | PT [μm] | RZ5 [μm] | kw [μm] | HAZ [μm] | Class of Cut |
| 1 | 150 | 150 | 2 | 53 ± 2 | 15 ± 3 * | 160 ± 9 | 115 ± 38 | II |
| 2 | 150 | 200 | 3 | 31 ± 3 | 24 ± 2 | 151 ± 5 | 96 ± 11 | I * |
| 3 | 150 | 250 | 4 | 62 ± 3 | 47 ± 12 | 175 ± 8 | 91 ± 5 | I * |
| 4 | 225 | 150 | 3 | 34 ± 4 | 23 ± 2 | 226 ± 13 | 168 ± 26 | II |
| 5 | 225 | 200 | 4 | 29 ± 10 | 22 ± 2 | 182 ± 10 | 79 ± 1 * | I * |
| 6 | 225 | 250 | 2 | 25 ± 2 * | 38 ± 5 | 137 ± 5 * | 123 ± 5 | II |
| 7 | 300 | 150 | 4 | 49 ± 2 | 60 ± 9 | 269 ± 9 | 144 ± 21 | II |
| 8 | 300 | 200 | 2 | 42 ± 3 | 30 ± 2 | 197 ± 20 | 134 ± 16 | II |
| 9 | 300 | 250 | 3 | 31 ± 7 | 31 ± 3 | 167 ± 10 | 97 ± 4 | I * |
Table 4.
Analysis of variance (ANOVA) table for perpendicularity tolerance. Asterisk (*) points out the factor with the strongest influence on perpendicularity tolerance.
Table 4.
Analysis of variance (ANOVA) table for perpendicularity tolerance. Asterisk (*) points out the factor with the strongest influence on perpendicularity tolerance.
| Factor | Sum of Squares | df | Mean Square | F | p-Value |
|---|---|---|---|---|---|
| A: Laser power | 795.018 | 1 | 795.018 | 38.82 | 0.0000 |
| B: Cutting speed | 218.698 | 1 | 218.698 | 10.68 | 0.0043 |
| C: Oxygen pressure | 624.446 | 1 | 624.446 | 30.49 | 0.0000 |
| AB | 2096.79 | 1 | 2096.79 | 102.38 | 0.0000 |
| AC | 944.643 | 1 | 944.643 | 46.12 | 0.0000 |
| BC | 2762.7 | 1 | 2762.7 | 134.89 * | 0.0000 |
| Lack-of-fit | 28.6138 | 2 | 14.3069 | 0.70 | 0.5103 |
| Pure error | 368.667 | 18 | 20.4815 | - | - |
| Total (corr.) | 4170.74 | 26 | - | - | - |
R-Squared 0.90, Adj R-Squared 0.88.
Table 5.
ANOVA table for mean height of the surface profile (RZ5). Asterisk (*) points out the factor with the strongest influence on mean height of the surface profile.
Table 5.
ANOVA table for mean height of the surface profile (RZ5). Asterisk (*) points out the factor with the strongest influence on mean height of the surface profile.
| Factor | Sum of Squares | df | Mean Square | F | p-Value |
|---|---|---|---|---|---|
| A: Laser power | 578.0 | 1 | 578.0 | 18.40 | 0.0004 |
| B: Cutting speed | 416.351 | 1 | 416.351 | 13.26 | 0.0019 |
| C: Oxygen pressure | 23.1429 | 1 | 23.1429 | 0.74 | 0.4020 |
| AA | 249.185 | 1 | 249.185 | 7.93 | 0.0114 |
| AB | 1992.3 | 1 | 1992.3 | 63.43 * | 0.0000 |
| AC | 262.059 | 1 | 262.059 | 8.34 | 0.0098 |
| BB | 208.286 | 1 | 208.286 | 6.63 | 0.0191 |
| Lack-of-fit | 0.222222 | 1 | 0.222222 | 0.01 | 0.9339 |
| Pure error | 565.333 | 18 | 31.4074 | - | - |
| Total (corr.) | 5262.07 | 26 | - | - | - |
R-Squared 0.89, Adj R-Squared 0.85.
Table 6.
ANOVA table for top kerf width. Asterisk (*) points out the factor with the strongest influence on top kerf width.
Table 6.
ANOVA table for top kerf width. Asterisk (*) points out the factor with the strongest influence on top kerf width.
| Factor | Sum of Squares | df | Mean Square | F | p-Value |
|---|---|---|---|---|---|
| A: Laser power | 10,658.0 | 1 | 10,658.0 | 95.57 | 0.0000 |
| B: Cutting speed | 12,278.3 | 1 | 12,278.3 | 110.10 * | 0.0000 |
| C: Oxygen pressure | 2141.91 | 1 | 2141.91 | 19.21 | 0.0004 |
| AB | 1315.23 | 1 | 1315.23 | 11.79 | 0.0030 |
| AC | 961.445 | 1 | 961.445 | 8.62 | 0.0088 |
| BB | 1771.87 | 1 | 1771.87 | 15.89 | 0.0009 |
| Lack-of-fit | 162.644 | 2 | 81.3218 | 0.73 | 0.4960 |
| Pure error | 2007.33 | 18 | 111.519 | - | - |
| Total (corr.) | 41,895.2 | 26 | - | - | - |
R-Squared 0.95, Adj R-Squared 0.93.
Table 7.
ANOVA table for HAZ width. Asterisk (*) points out the factor with the strongest influence on HAZ width.
Table 7.
ANOVA table for HAZ width. Asterisk (*) points out the factor with the strongest influence on HAZ width.
| Factor | Sum of Squares | df | Mean Square | F | p-Value |
|---|---|---|---|---|---|
| A:Laser power | 2664.5 | 1 | 2664.5 | 8.16 | 0.0105 |
| B:Cutting speed | 6574.22 | 1 | 6574.22 | 20.13 * | 0.0003 |
| C:Oxygen pressure | 5965.79 | 1 | 5965.79 | 18.27 | 0.0005 |
| AB | 5065.35 | 1 | 5065.35 | 15.51 | 0.0010 |
| BB | 2453.63 | 1 | 2453.63 | 7.51 | 0.0134 |
| CC | 2044.63 | 1 | 2044.63 | 6.26 | 0.0222 |
| Lack-of-fit | 1115.63 | 2 | 557.815 | 1.71 | 0.2093 |
| Pure error | 5877.33 | 18 | 326.519 | - | - |
| Total (corr.) | 25618.3 | 26 | - | - | - |
R-Squared 0.73, Adj R-Squared 0.65.
Table 8.
Criterion used in the optimization of cut surface quality.
| Factor | Objective | Impact |
|---|---|---|
| Laser power | in the range (150–300 W) | - |
| Cutting speed | in the range (150–250 cm/min) | - |
| Oxygen pressure | in the range (2–4 bar) | - |
| Perpendicularity tolerance | minimize | 5 |
| Mean height of the surface profile | minimize | 5 |
| Kerf width | minimize | 3 |
| HAZ width | minimize | 3 |
Table 9.
Optimal condition minimizing the quality responses for laser cut hot stamping boron steel sheets: predicted and (average) actual values.
Table 9.
Optimal condition minimizing the quality responses for laser cut hot stamping boron steel sheets: predicted and (average) actual values.
| Setting at Optimum: 173 W, 204 cm/min, 4 bar | |||
|---|---|---|---|
| Quality responses | Prediction | Desirability | Actual |
| Perpendicularity tolerance | 17.0 μm | 0.99 | 18.7 μm |
| Mean height of the surface profile | 17.8 μm | 0.91 | 20.8 μm |
| Top kerf width | 165 μm | 0.69 | 179 μm |
| HAZ width | 63.8 μm | 0.98 | 69.2 μm |
© 2017 by the author. Licensee MDPI, Basel, Switzerland. This article is an open access article distributed under the terms and conditions of the Creative Commons Attribution (CC BY) license (http://creativecommons.org/licenses/by/4.0/).
Share and Cite
MDPI and ACS Style
Russo Spena, P. CO2 Laser Cutting of Hot Stamping Boron Steel Sheets. Metals 2017, 7, 456. https://doi.org/10.3390/met7110456
AMA Style
Russo Spena P. CO2 Laser Cutting of Hot Stamping Boron Steel Sheets. Metals. 2017; 7(11):456. https://doi.org/10.3390/met7110456
Chicago/Turabian StyleRusso Spena, Pasquale. 2017. "CO2 Laser Cutting of Hot Stamping Boron Steel Sheets" Metals 7, no. 11: 456. https://doi.org/10.3390/met7110456
Note that from the first issue of 2016, this journal uses article numbers instead of page numbers. See further details here.