Article

Investigation on Friction and Wear of Cold Rolled High Strength Steel against an AISI52100 Counterpart

School of Aerospace and Mechanical Engineering, Korea Aerospace University, 76 Hanggongdaehang-ro, Deogyang-gu, Goyang-si, Gyeonggi-do 412-791, Korea
*
Author to whom correspondence should be addressed.
Metals 2017, 7(3), 90; https://doi.org/10.3390/met7030090
Submission received: 2 February 2017 / Revised: 25 February 2017 / Accepted: 6 March 2017 / Published: 10 March 2017

Abstract

:
This article investigates the friction and wear of cold rolled high strength steel at various displacement amplitudes. Reciprocal sliding tests are carried out using a ball-on-flat testing apparatus. The tangential force occurring at the contact surface between a high strength steel specimen and an AISI52100 ball is measured during the tests. After each test, the worn surface profile on the steel specimen is determined. Experimental results show that the ratio of the maximum tangential to the normal force remains at 0.7 after an initial rapid increase, and the ratio does not greatly change according to the imposed displacement amplitudes (in the range of 0.05 mm and 0.3 mm). The wear volume loss on the steel specimen increases according to the number of cycles. It is determined that the wear rate of the specimen changes with respect to the imposed displacement amplitude. That is, the wear rate rapidly increases within the displacement amplitude range of 0.05 mm to 0.09 mm, while the wear rate gradually increases when the displacement amplitude is greater than 0.2 mm. The obtained results provide the friction and wear behaviors of cold rolled high strength steel in fretting and reciprocal sliding regimes.

Graphical Abstract

1. Introduction

Use of cold rolled high strength steel sheets is widespread in the automotive industry due to their outstanding mechanical properties [1,2]. The steel is used for automobile body panels, bumpers, and door panels. In addition, these steel sheets are often used for tribo-components such as automotive seat sliding tracks. A typical automotive seat sliding track consists of two rails and metallic balls (or cylindrical rollers). The metallic balls enable the movement of the upper rail on the lower rail. The rails are usually coated using an electro-deposition method. The anti-friction property of an electro-deposited coating has been studied by determining the coefficient of kinetic friction [3]. The coefficient was determined to be approximately 0.3 under fretting and reciprocal sliding regimes. The coating lifetime was much shorter than those of other automotive seat components because the purpose of the electro-deposition on the surfaces of the rails is focused on anti-corrosion. For this reason, semi-solid lubricants such as grease are applied onto the coating surface. The deterioration of semi-solid lubricants brings about the frictional contact between cold rolled high strength steel and AISI52100 steel. Thus, this frictional contact without coatings and lubricants needs to be studied. That is, studies on the frictional behavior of the contact between the substrate (i.e., cold rolled high strength steel) and an AISI52100 counterpart are needed under reciprocal sliding conditions. When an AISI52100 steel counterpart slides on a high strength steel plate, wear volume loss mostly occurs on the surface of the steel sheet because the hardness of AISI52100 steel is higher than that of the cold rolled high strength steel. Considering that the wear on the high strength steel sheet significantly affects the entire performance of the seat sliding track, the wear and friction behaviors of the steel sheet are of practical interest. However, little is found in the literature related to the wear rate of cold rolled high strength steel and the friction between the steel and AISI52100 steel.
Reciprocal sliding motions and fretting (small amplitude oscillatory motions) between two solid surfaces lead to wear and friction. The relative displacement between two contacting bodies is taken into account as an important parameter resulting in material volume loss and cracking. If the relative displacement leads to a partial slip at contact, cracks occur in the vicinity of the contact edges (known as fretting fatigue) [4]. If the relative displacement results in a gross slip at the entire contact zone between two bodies, wear occurs in the contact zone (fretting wear) [5,6,7,8]. In a gross slip regime, the wear rate per unit sliding has been found to increase with the relative displacement amplitude [6,7,8]. Meanwhile, within a reciprocal sliding regime, the wear rate per unit sliding has been shown to be almost constant without regard to the relative displacement. The transition from a gross slip to a reciprocal sliding regime has been observed in hundreds of displacement amplitudes. For example, the critical displacement amplitude for the transition was found to be 0.1 mm for self-mating mild steel [7], and 0.3 mm for structural steel [8]. Difficulties remain regarding a stringent definition of the relative displacement at the transition because of the complexity of the fretting process including the effects of the contact conditions (e.g., contact geometry, normal force, and frequency) [8]. Thus, in order to determine the transition between two regimes, reciprocal sliding tests are typically employed with various displacement amplitudes. The wear rate is then measured using a series of worn specimens. Several studies have investigated the effects of the relative displacement on a fretting wear volume and a friction coefficient evolution [9,10,11]. In one study, the evolution of the friction coefficient of a thermally-sprayed coating was evaluated at various imposed displacements [9]. It was observed that the friction coefficient did not change according to displacement amplitude. Another study investigated the effect of displacement amplitude on electro-deposited steel plates [10]. It was found that the steady friction coefficient value was almost constant regardless to the imposed displacement amplitude within the range of 0.05–0.3 mm. However, the duration of the coating failure varied according to the displacement amplitude. This indicated that the wear rate of the coating layer changed with the displacement amplitude. Meanwhile, in a third study, the ratio of the maximum tangential force to normal force changed according to the imposed displacement amplitude at the contact surface between Inconel 600 alloys and AISI52100 steels [11]. The fretting wear volume gradually increased as the displacement amplitude increased, which was attributed from the transformation of a fretting mode (from adhesion to full sliding).
In this study, friction and wear behaviors between cold rolled high strength steel and AISI 52100 steel were investigated for the use on automotive seat slide tracks. Frictional forces were measured at various imposed displacement amplitudes. Then, the effect of the displacement amplitude on the frictional force was identified. The wear rates in a gross slip fretting regime and a reciprocal sliding regime were determined at the loading condition similar to those of actual seat tracks. Finally, the change of the wear rate in a gross slip regime was identified.

2. Materials and Methods

Figure 1 shows a reciprocal linear sliding test apparatus using ball-on-flat contact geometry. For each test, a ball and a flat specimen were used. The specimen was fixed on a moving table in a linear stage. The linear stage made the specimen move at a pre-described displacement amplitude. The ball was inserted in a ball holder and gripped by a screw to prevent rotation in the ball holder. The ball holder was then placed in a rigid arm. In the rigid arm, the ball holder was allowed to move vertically. Deadweights were placed onto the ball holder to apply normal force at the contact surface between the flat specimen and the ball. The rigid arm was attached to a fixed support via a load cell (Interface, Inc. Atlanta, GA, USA). The load cell continuously measured the tangential force occurring at contact during reciprocal sliding. For the purpose of measuring the relative displacement between the flat specimen and the ball holder, a laser displacement sensor (Model LK-081 (resolution: 3 µm, linearity = ±0.1%), Keyence Corp., Itasca, IL, USA) was attached to the carriage of a linear stage. The measured tangential force was recorded according to the relative displacement during each test, and the ratio of the maximum tangential force to normal force was subsequently computed.
A cold rolled high strength steel (material designation: SPFC 440, provided by POSCO P & S Co. Ltd., Seoul, Korea) plate was prepared as the specimen. Its surface roughness was controlled with No. 2000 emery paper. The arithmetic average of roughness (Ra) of the flat specimen after polishing with the emery paper was found to be 0.4 µm. A commercial AISI52100 steel ball (Φ5 mm) was used as the flat specimen’s counterpart. The initial roughness (Ra) of the ball was approximately 0.025 µm (provided by KOPECO Co. Ltd., Incheon, Korea). The chemical compositions and mechanical properties of the flat specimen and the ball are shown in Table 1 and Table 2, respectively. Elastic modulus and Poisson’s ratio of the cold rolled high strength steel were similar to those of AISI52100 steel. Meanwhile, the hardness of the steel was lower than that of the AISI52100 steel.
In this study, displacement amplitudes of 0.05 mm, 0.07 mm, 0.09 mm, 0.2 mm, and 0.3 mm were selected. In actual automotive seat slide rails, the displacement amplitude between the rail and the ball is found to vary. For example, while seat position is being adjusted, reciprocal sliding or rolling of a ball occurs. If the seat position remains fixed, fretting could be induced by external force or vibration. Thus, different displacement amplitudes from 0.05 mm to 0.3 mm were selected.
A normal force of 50 N and a fixed frequency of 1 Hz were induced at contact. A normal force of 50 N was selected under the assumption that a loaded seat of 800 N maintained two sliding rails with 16 balls (each rail came in contact with 8 balls). All tests were conducted at room temperature of 25 °C and relative humidity of 60%.

3. Results and Discussion

Reciprocal sliding tests with a cold rolled high strength steel specimen were conducted in dry conditions. The imposed displacement amplitudes were 0.05 mm, 0.07 mm, 0.09 mm, 0.2 mm and 0.3 mm; the displacement amplitude of 0.09 mm was similar to the Hertz contact radius calculated between a Φ5 mm ball and a cold rolled high strength steel plate. Note that the Hertz contact radius is 0.094 mm at a given contact condition (as described in Appendix A). It has been suggested that fretting is defined as occurring when the displacement amplitude is lower than the Hertz contact radius [12]. Thus, the selected imposed displacement amplitudes produce fretting and reciprocal sliding, respectively.
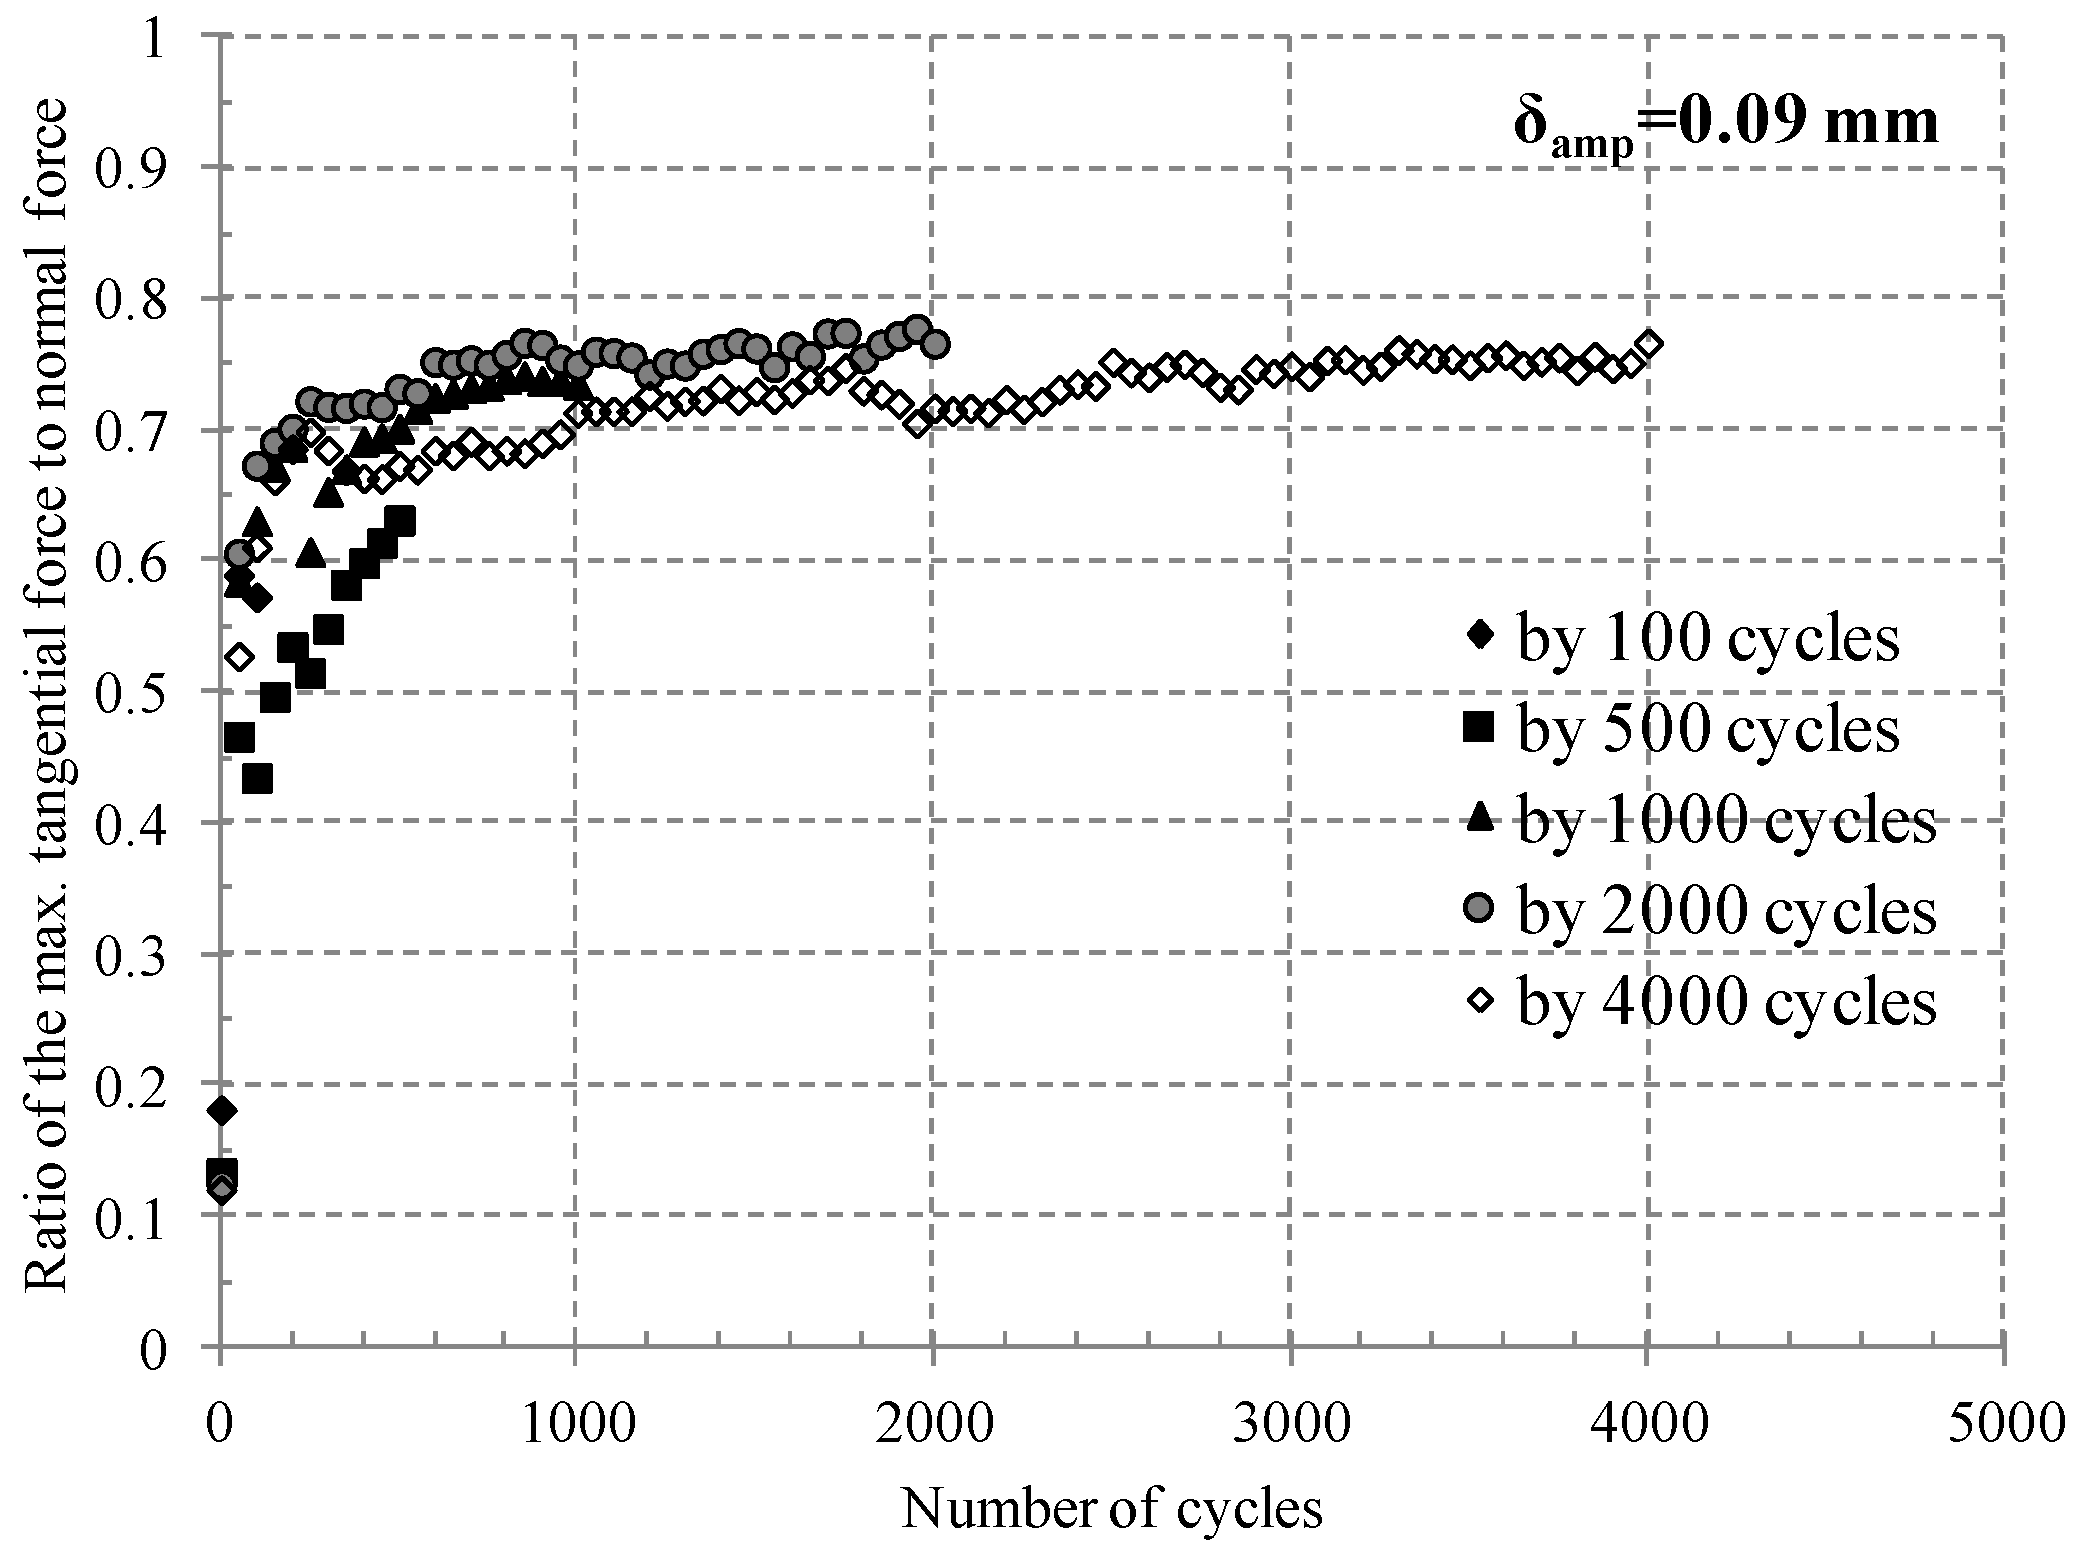
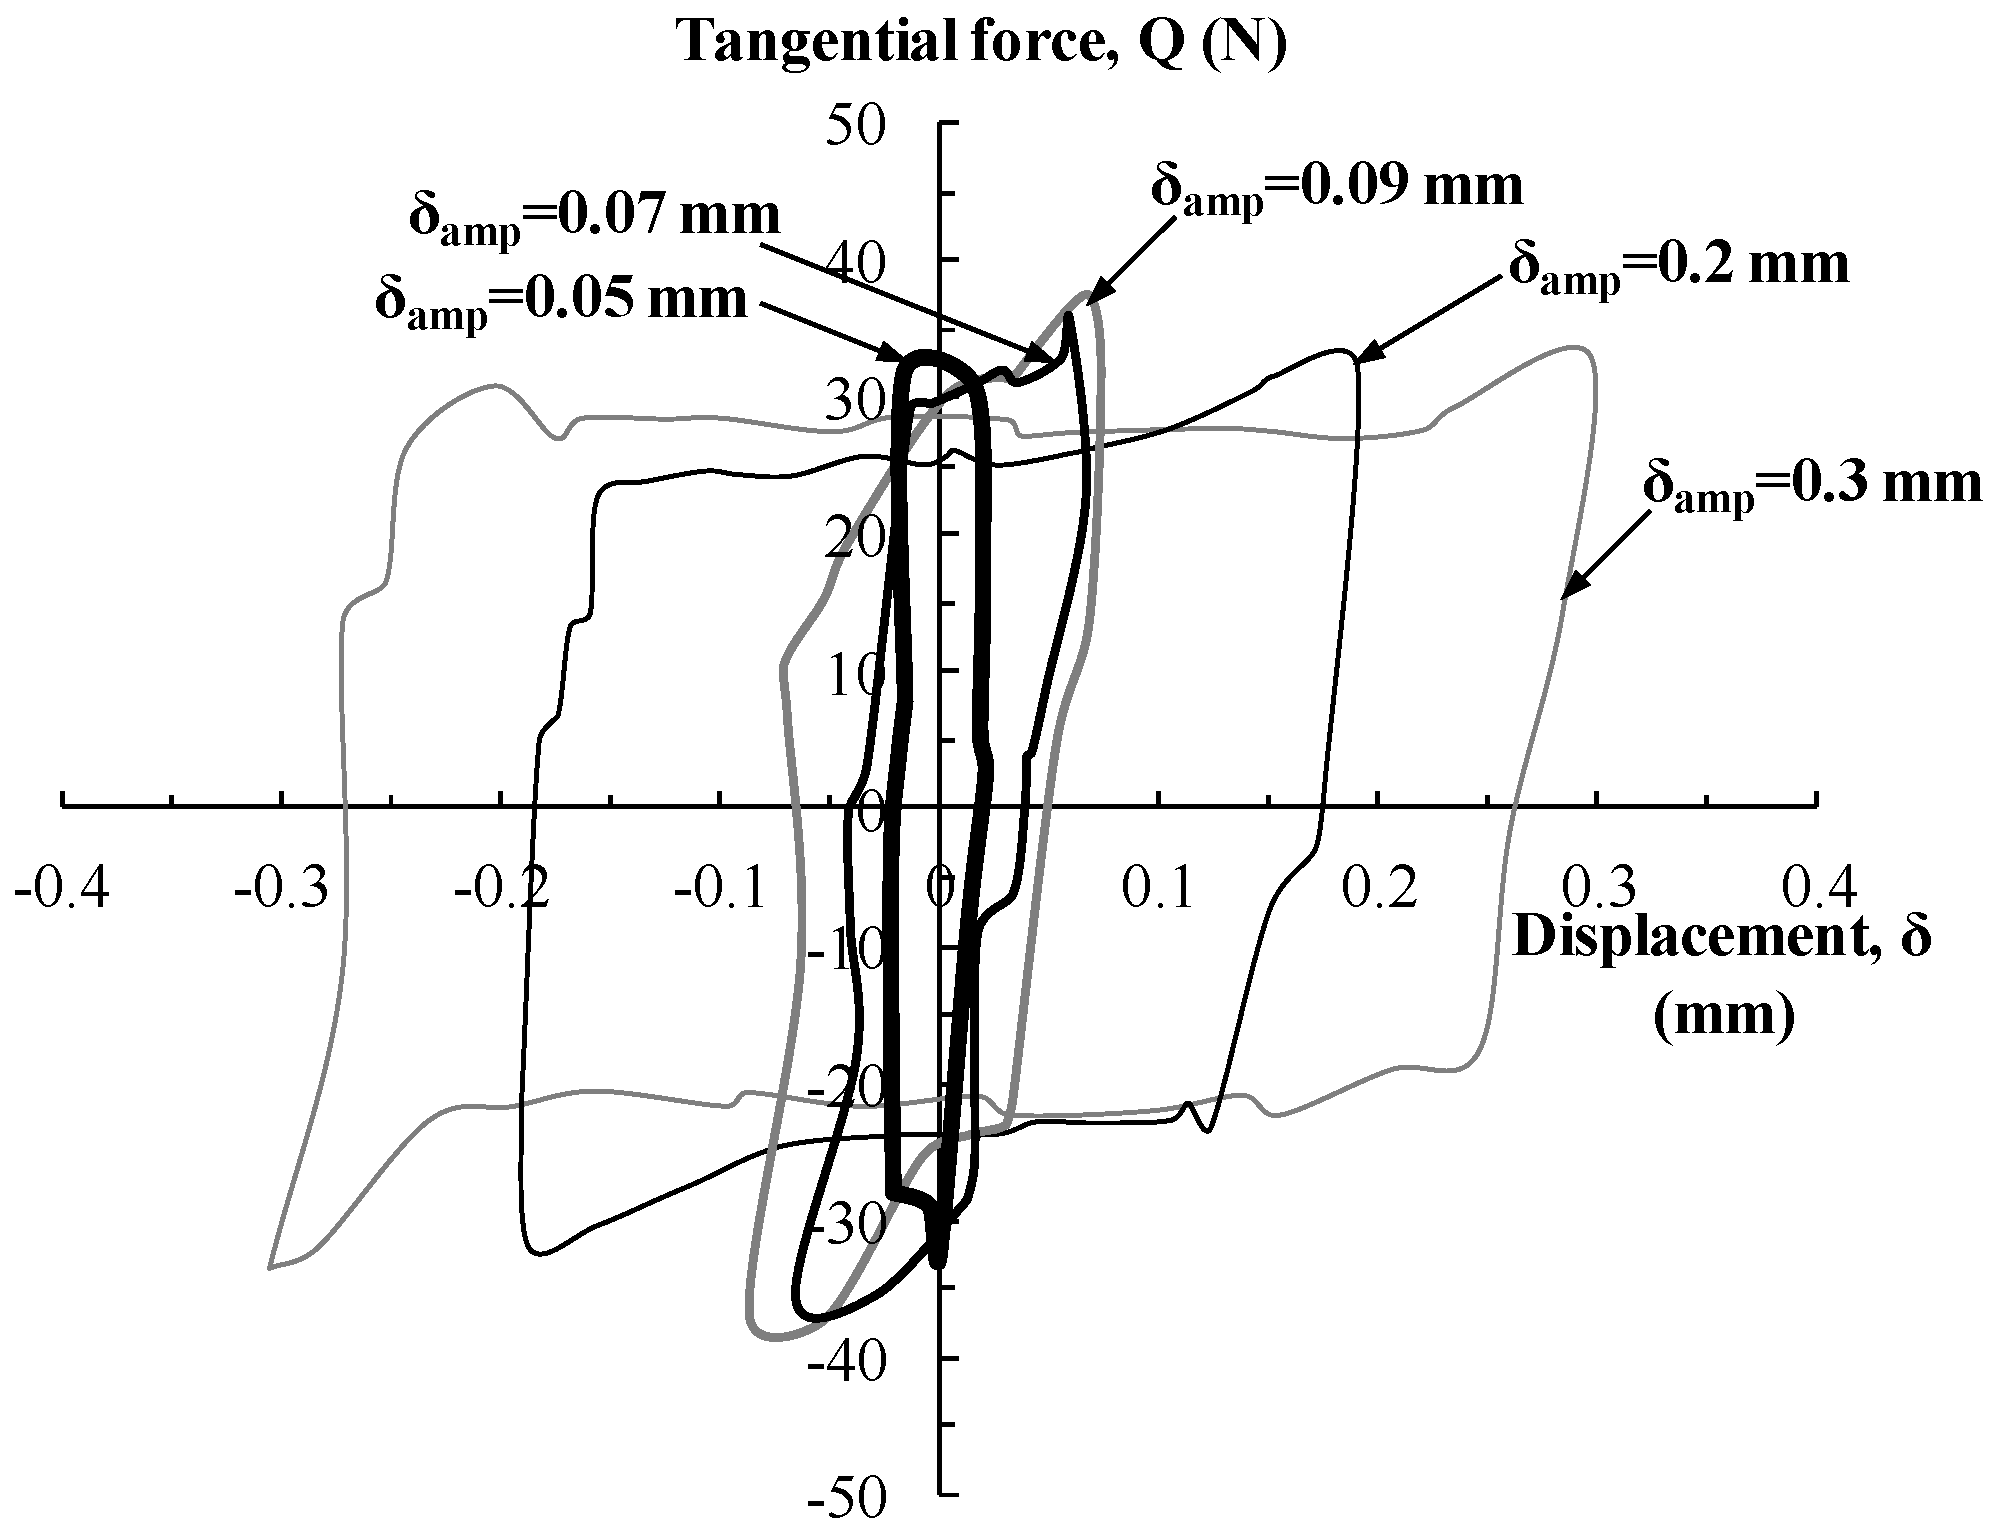
Figure 2 shows the ratio of the maximum tangential force to induced normal force at the displacement amplitude of 0.09 mm. The maximum tangential force was selected on a measured force-displacement loop, as presented in Figure 3. Figure 3 shows the tangential force versus displacement loops found at the 4000th cycle. Force peaks were found near contact edges due to the ploughing effect. In order to obtain worn surfaces interrupted at various numbers of cycles, sliding tests were terminated at different numbers of cycles, as shown in Figure 2. In the figure, it was observed that the ratio increased rapidly up to 500 cycles, followed by a steady-state sliding stage. The initial increase on the ratio was called the initial running-in period. From 500 cycles to 4000 cycles, the ratio was almost stable in the range of 0.7 and 0.78.
Figure 4 shows the ratio of the maximum tangential force to normal force at the displacement amplitudes of 0.05 mm, 0.07 mm, 0.2 mm, and 0.3 mm. At each given displacement amplitude, three tests were interrupted after 500, 2000, and 4000 cycles, respectively. The three evolutions of the ratio measured at the same displacement amplitude were found to be similar to each other.
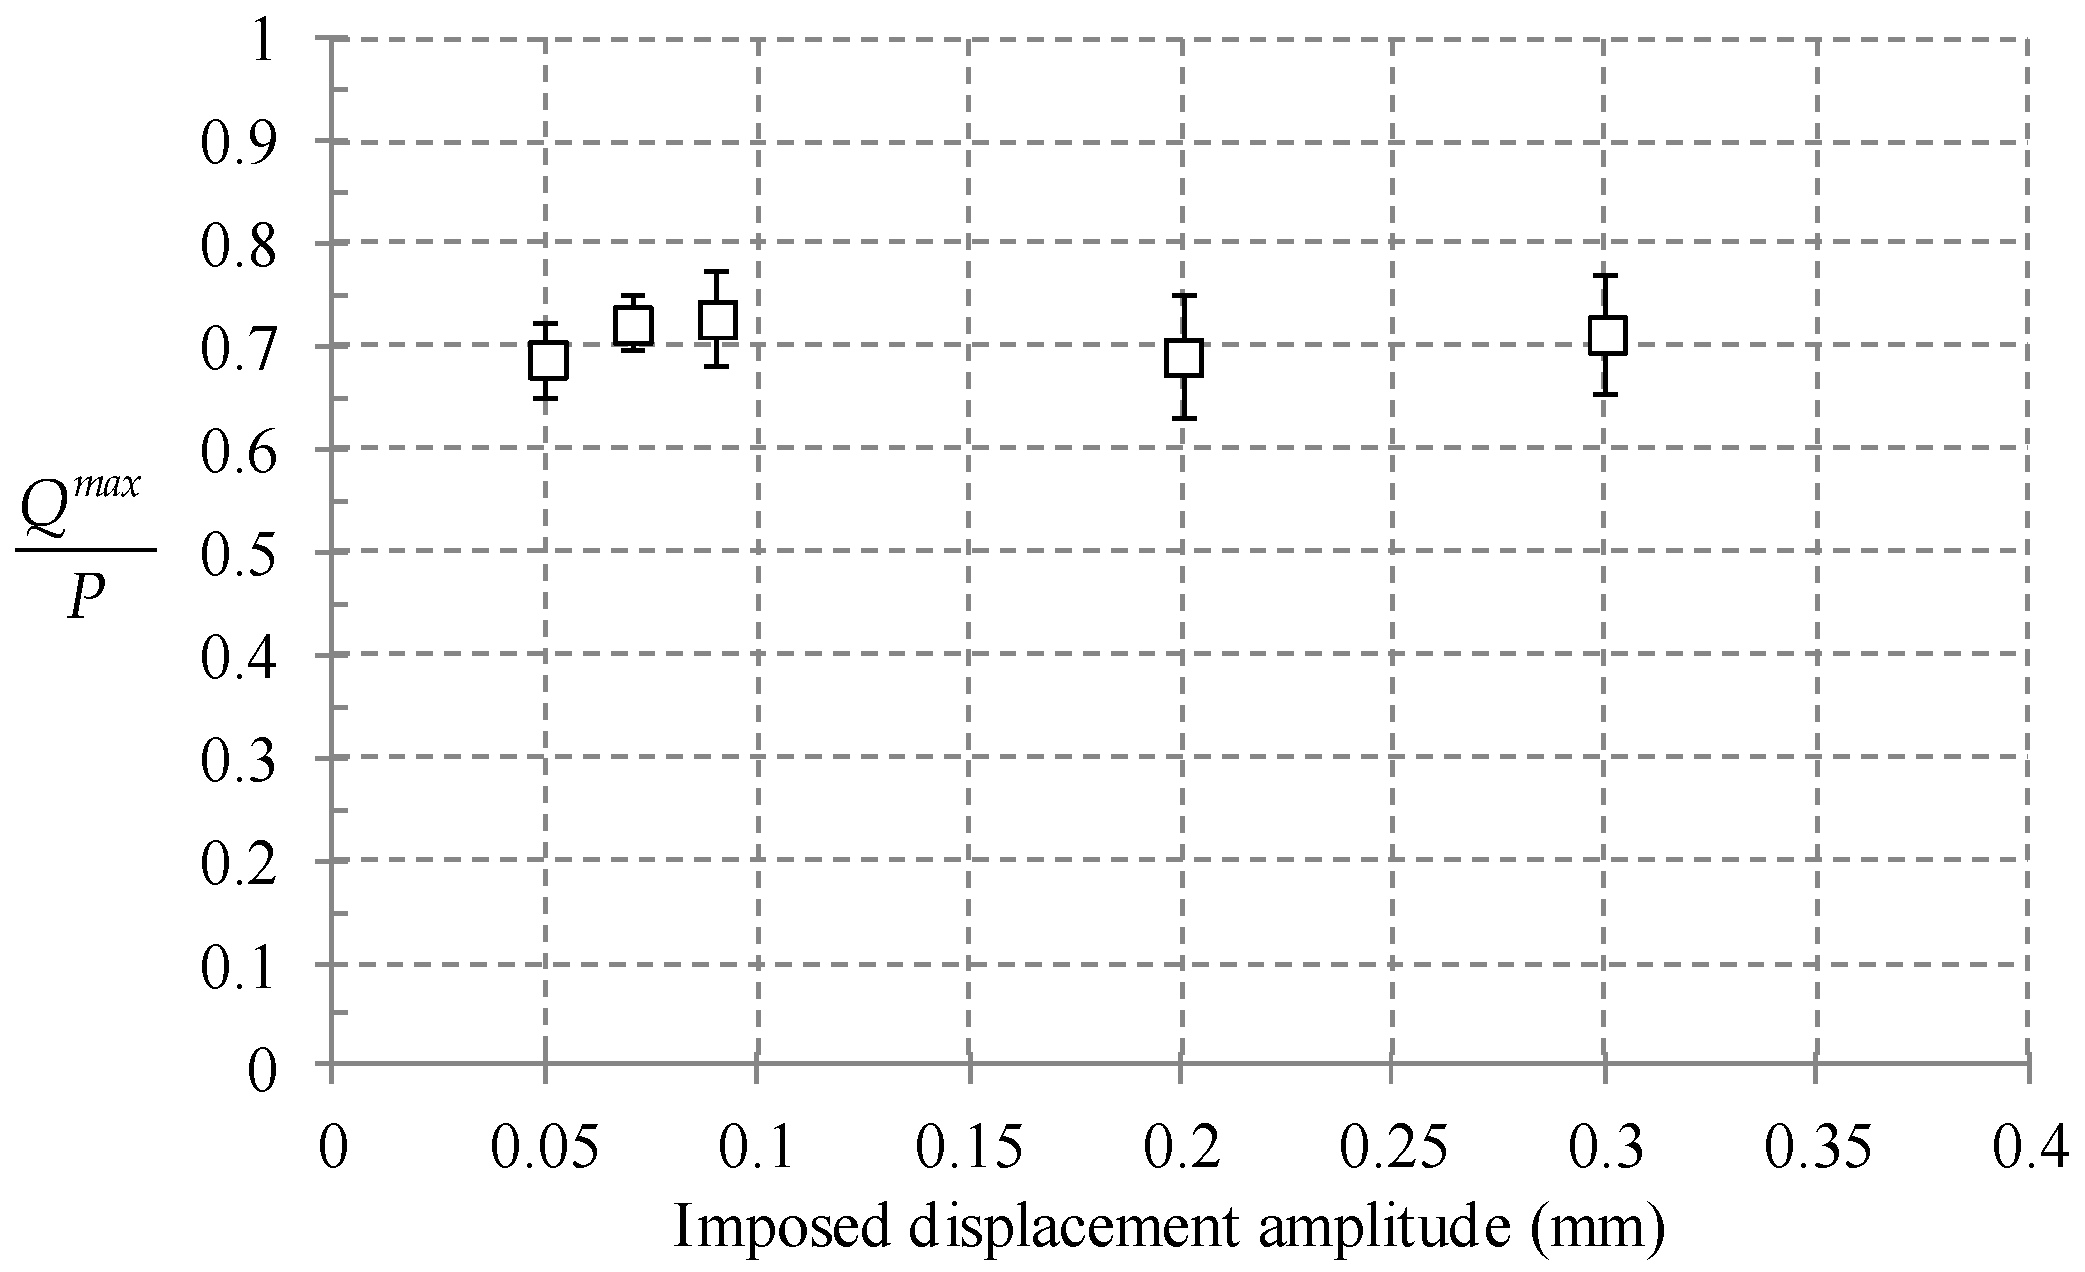
Figure 5 shows the average ratio of the maximum tangential force to normal force measured at the tests terminated after 4000 cycles. The ratios between 500 and 4000 cycles were averaged. The error bars in the plot showed a 95% confidence interval. The average ratio varied from 0.68 to 0.72. It was determined that the average ratio did not significantly change according to the imposed displacement amplitude.
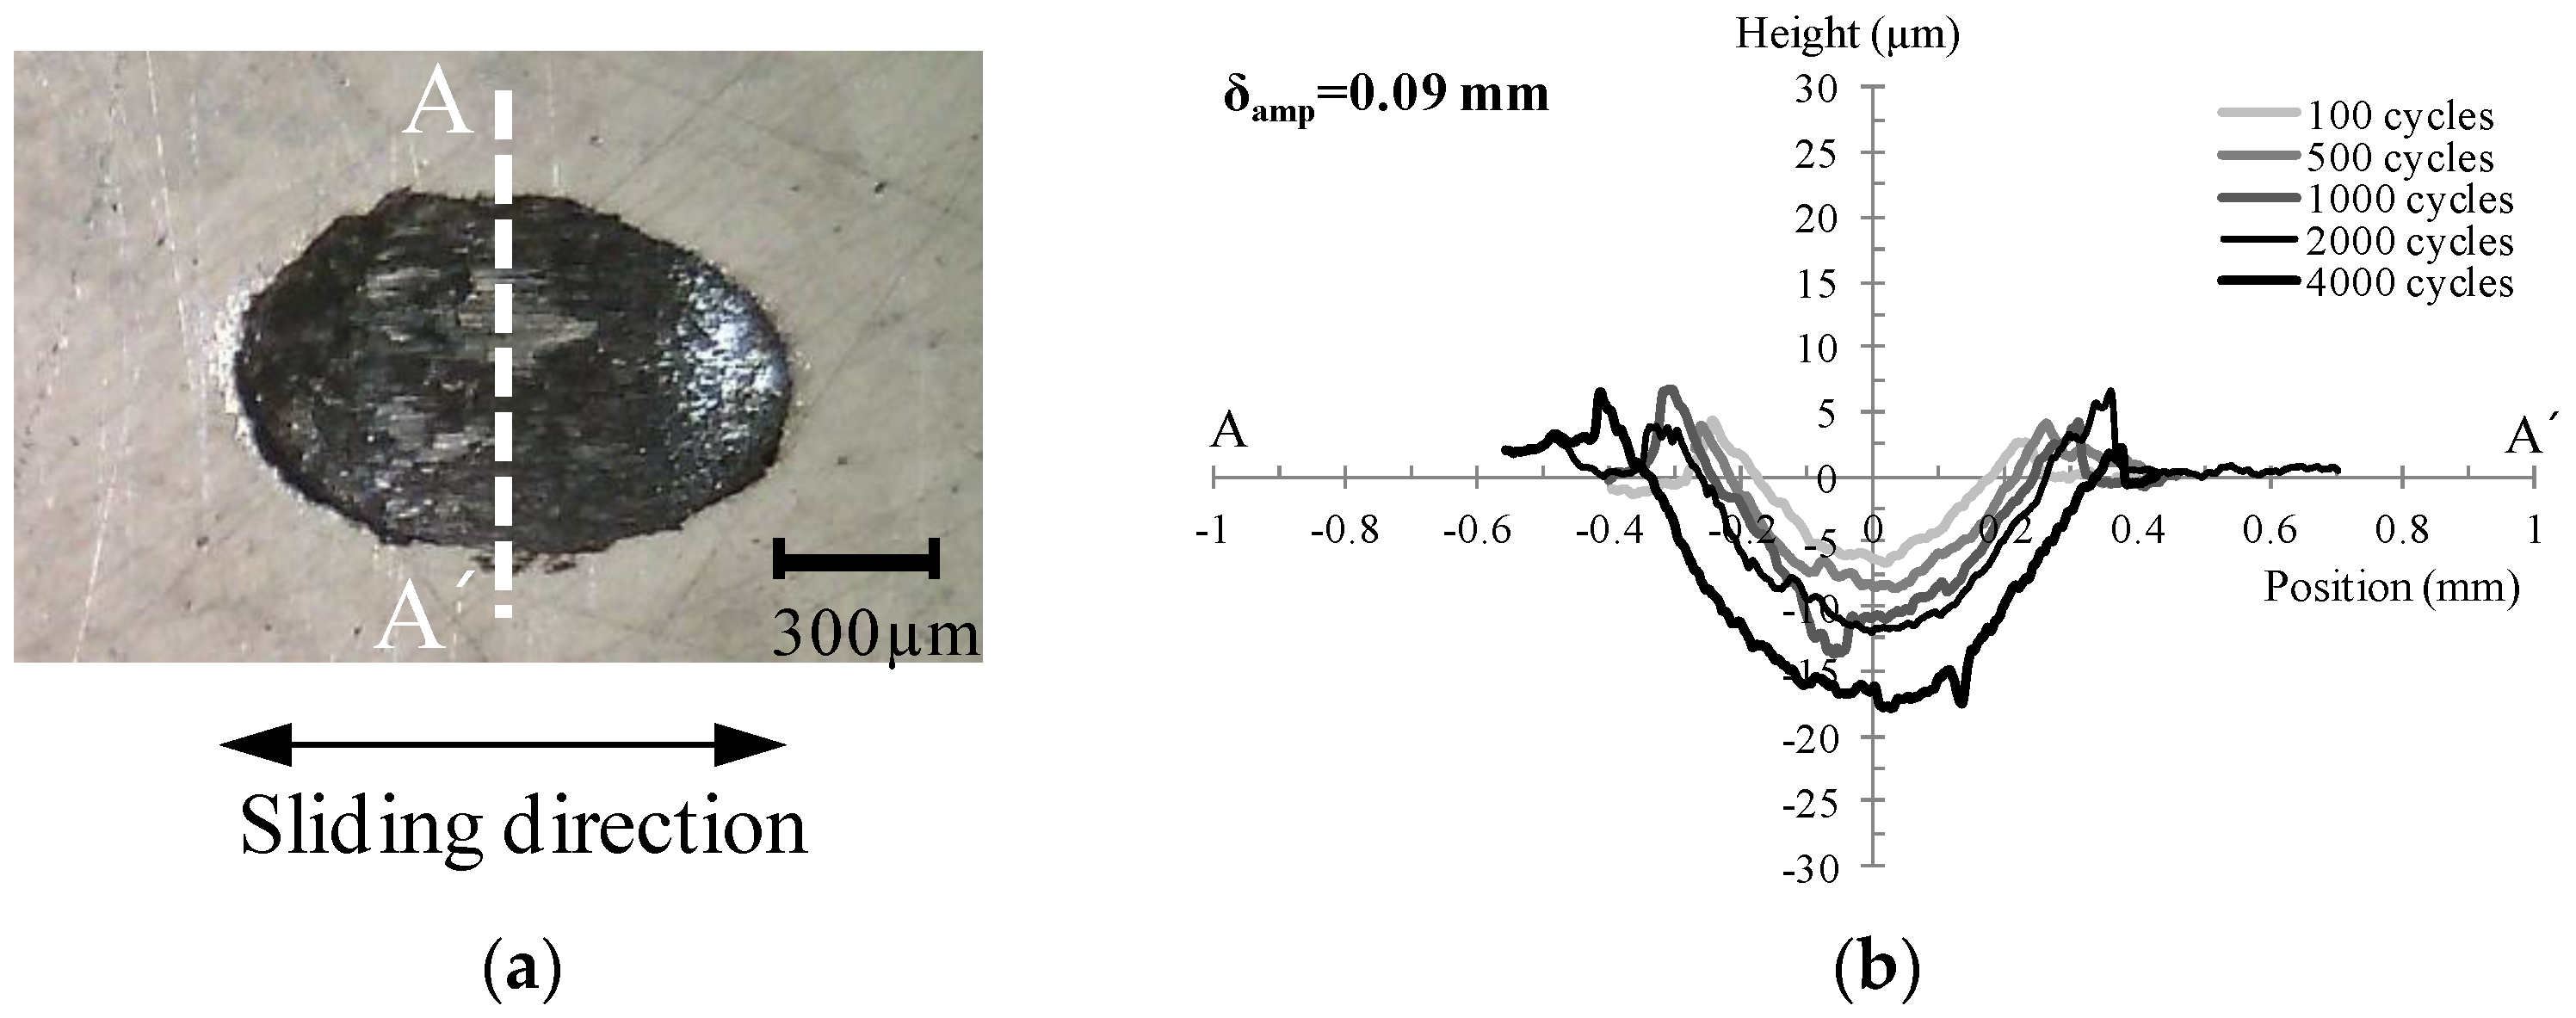
Figure 6a shows the worn surface image of a cold rolled high strength steel plate at the displacement amplitude of 0.09 mm. The surface image was captured after 4000 cycles. Severe damage was observed at the contact surface (dark area in the image). A cross-sectional profile on the A-A’ axis was measured with a 2D surface profiler (SJ-210, Mitutoyo Corp., Takatsuku, Kawasaki, Japan). Figure 6b shows the worn surface profiles after different numbers of cycles. The area below zero on the vertical axis is associated with wear volume loss. It was identified that the wear depth and width on the steel plate increased as the number of cycles increased.
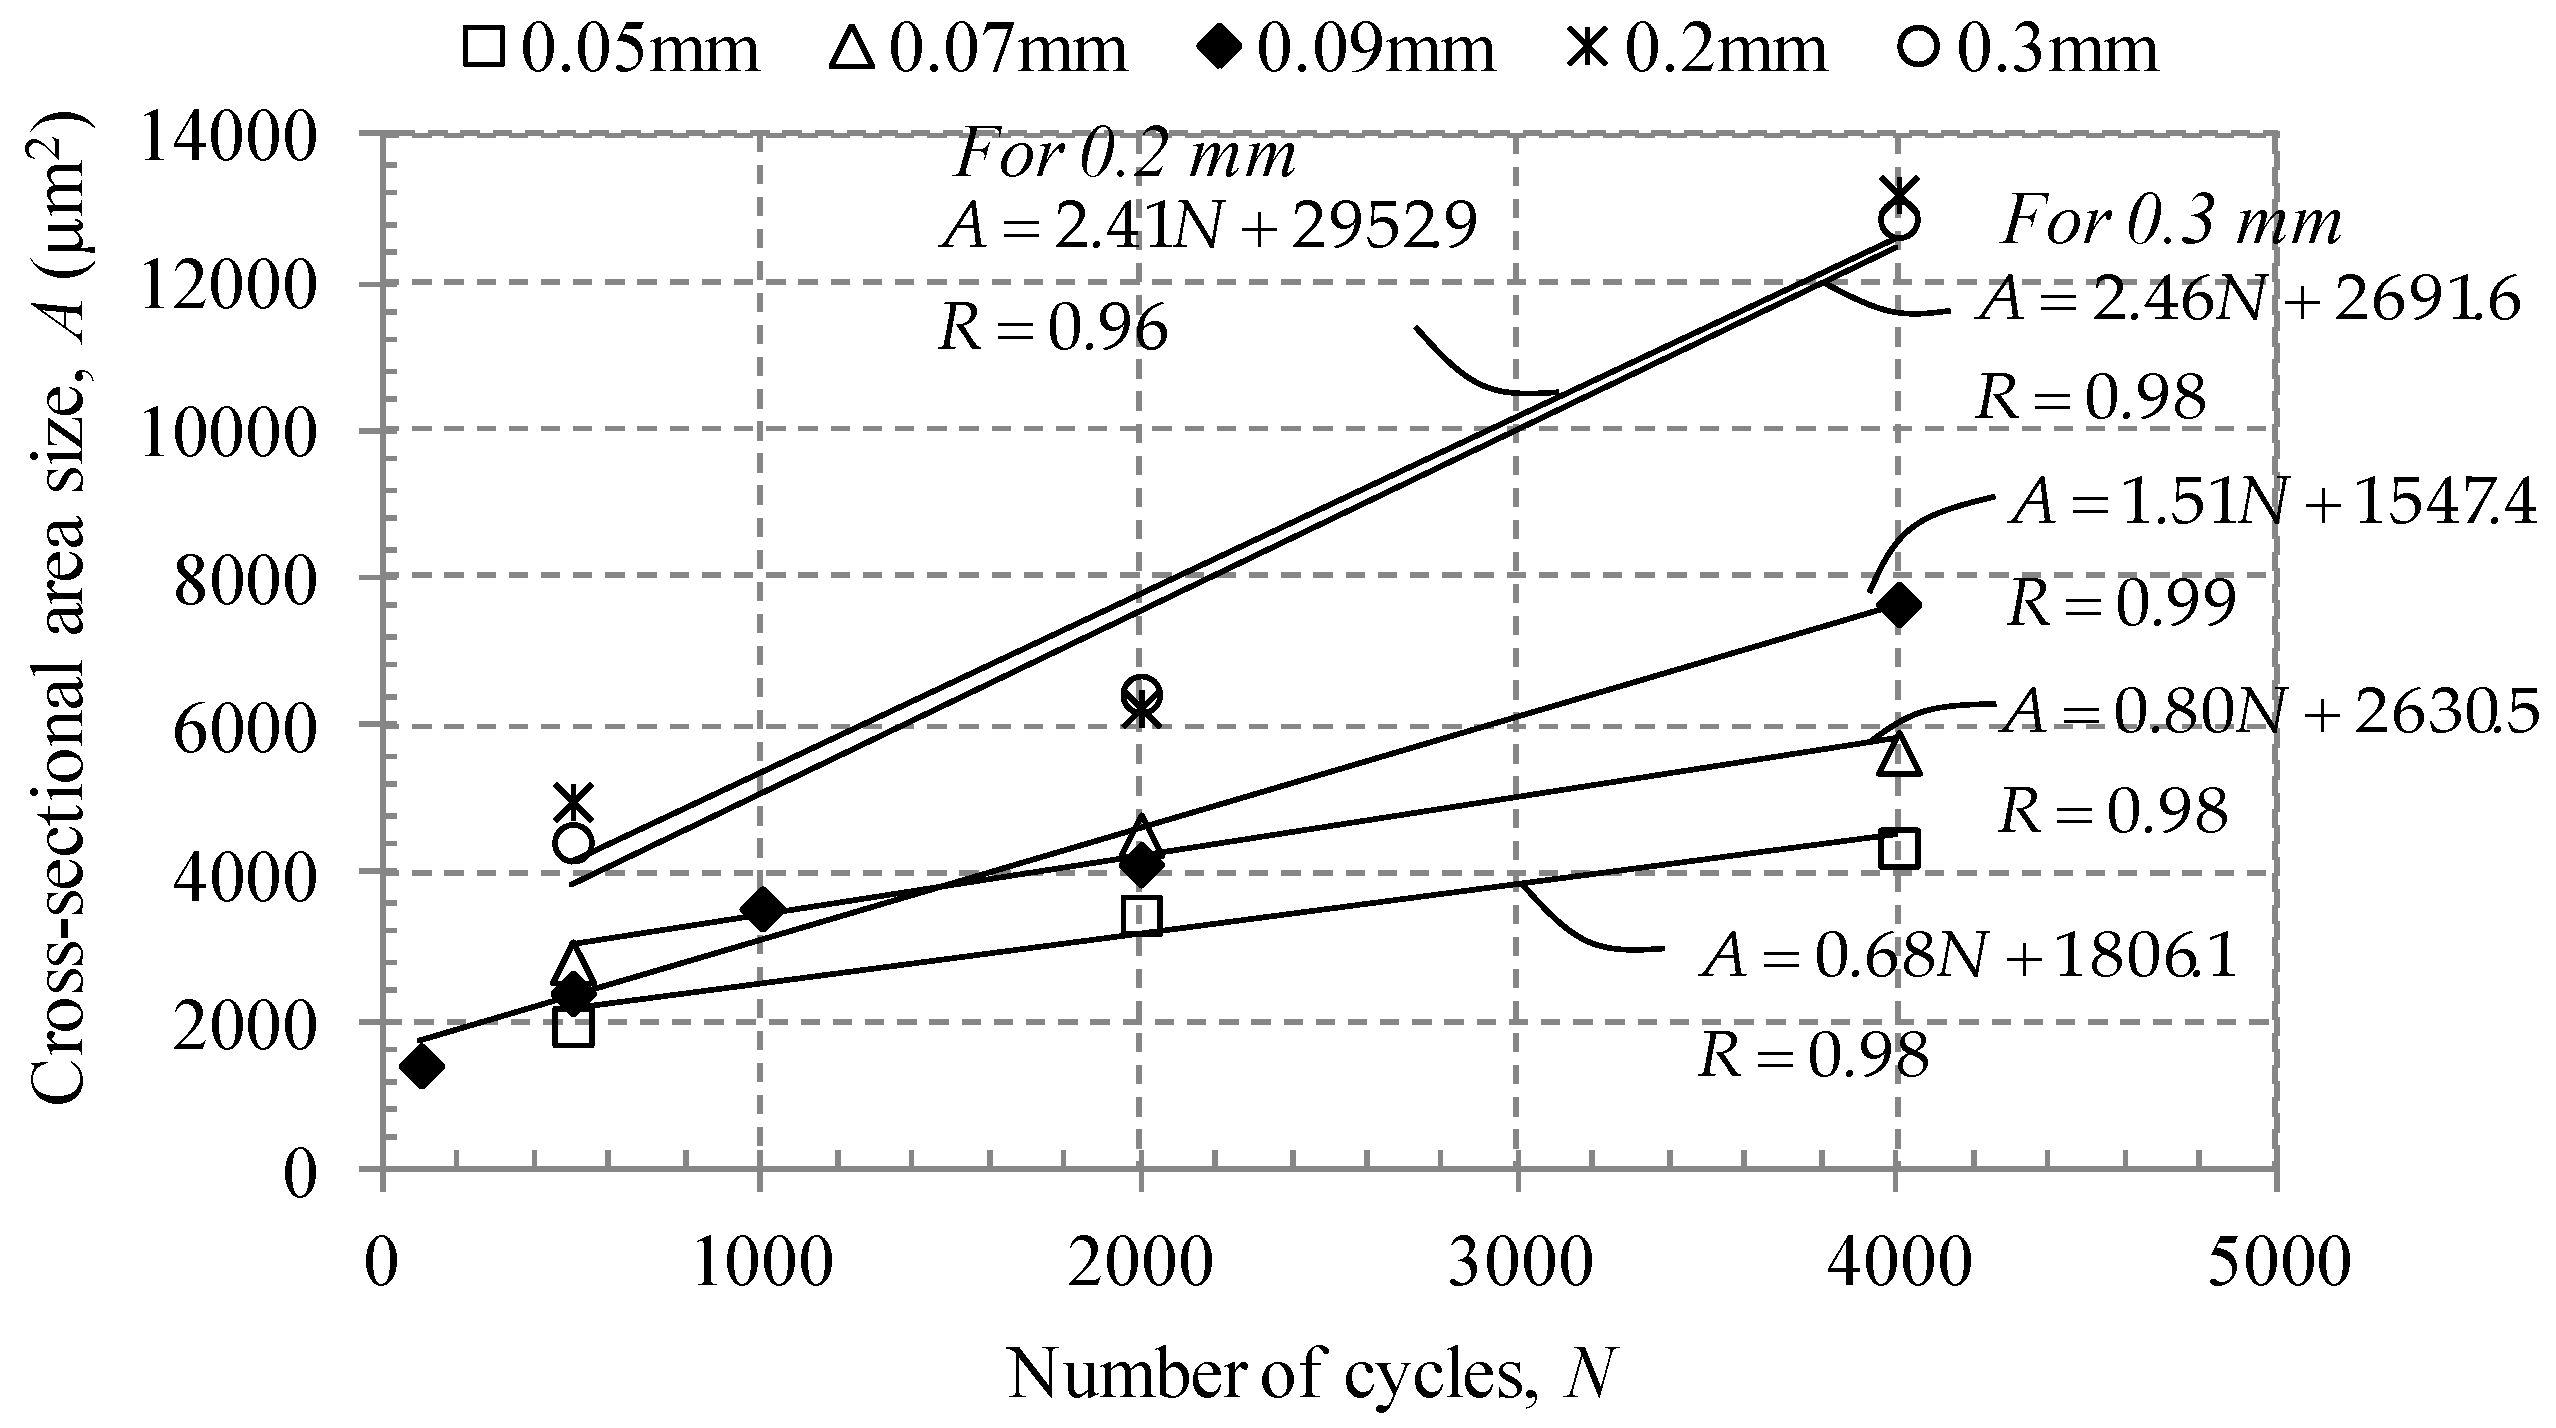
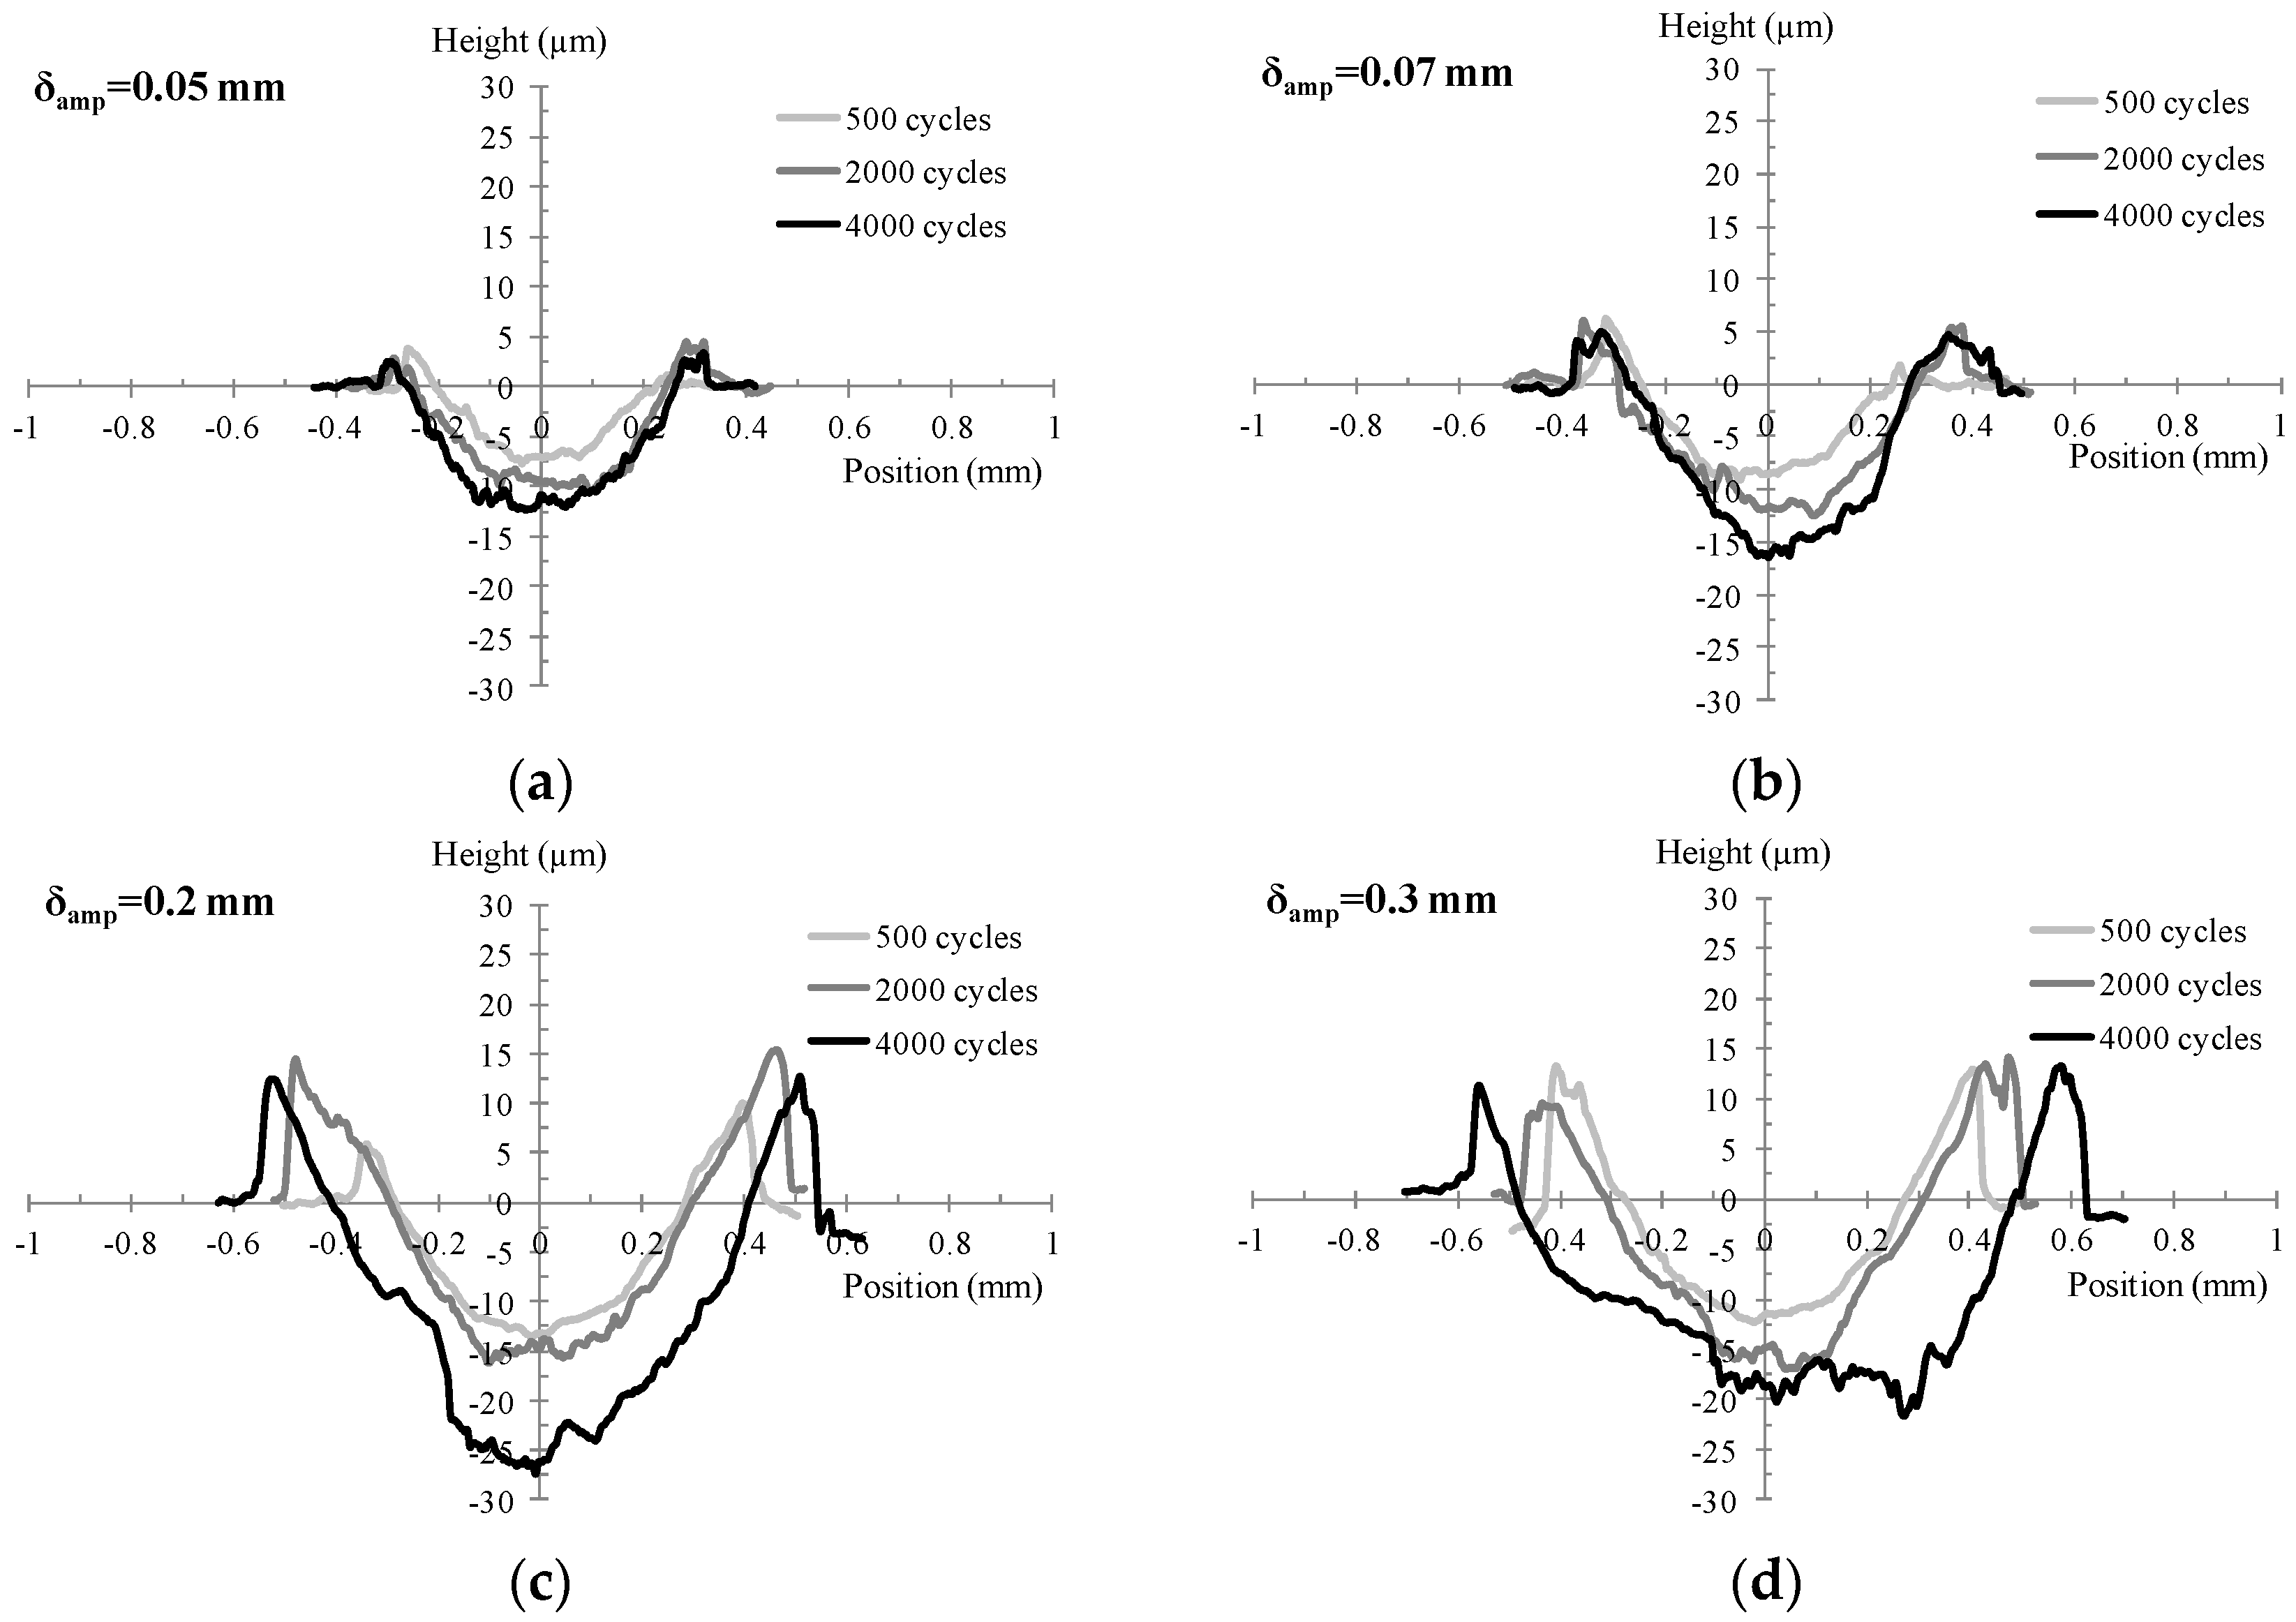
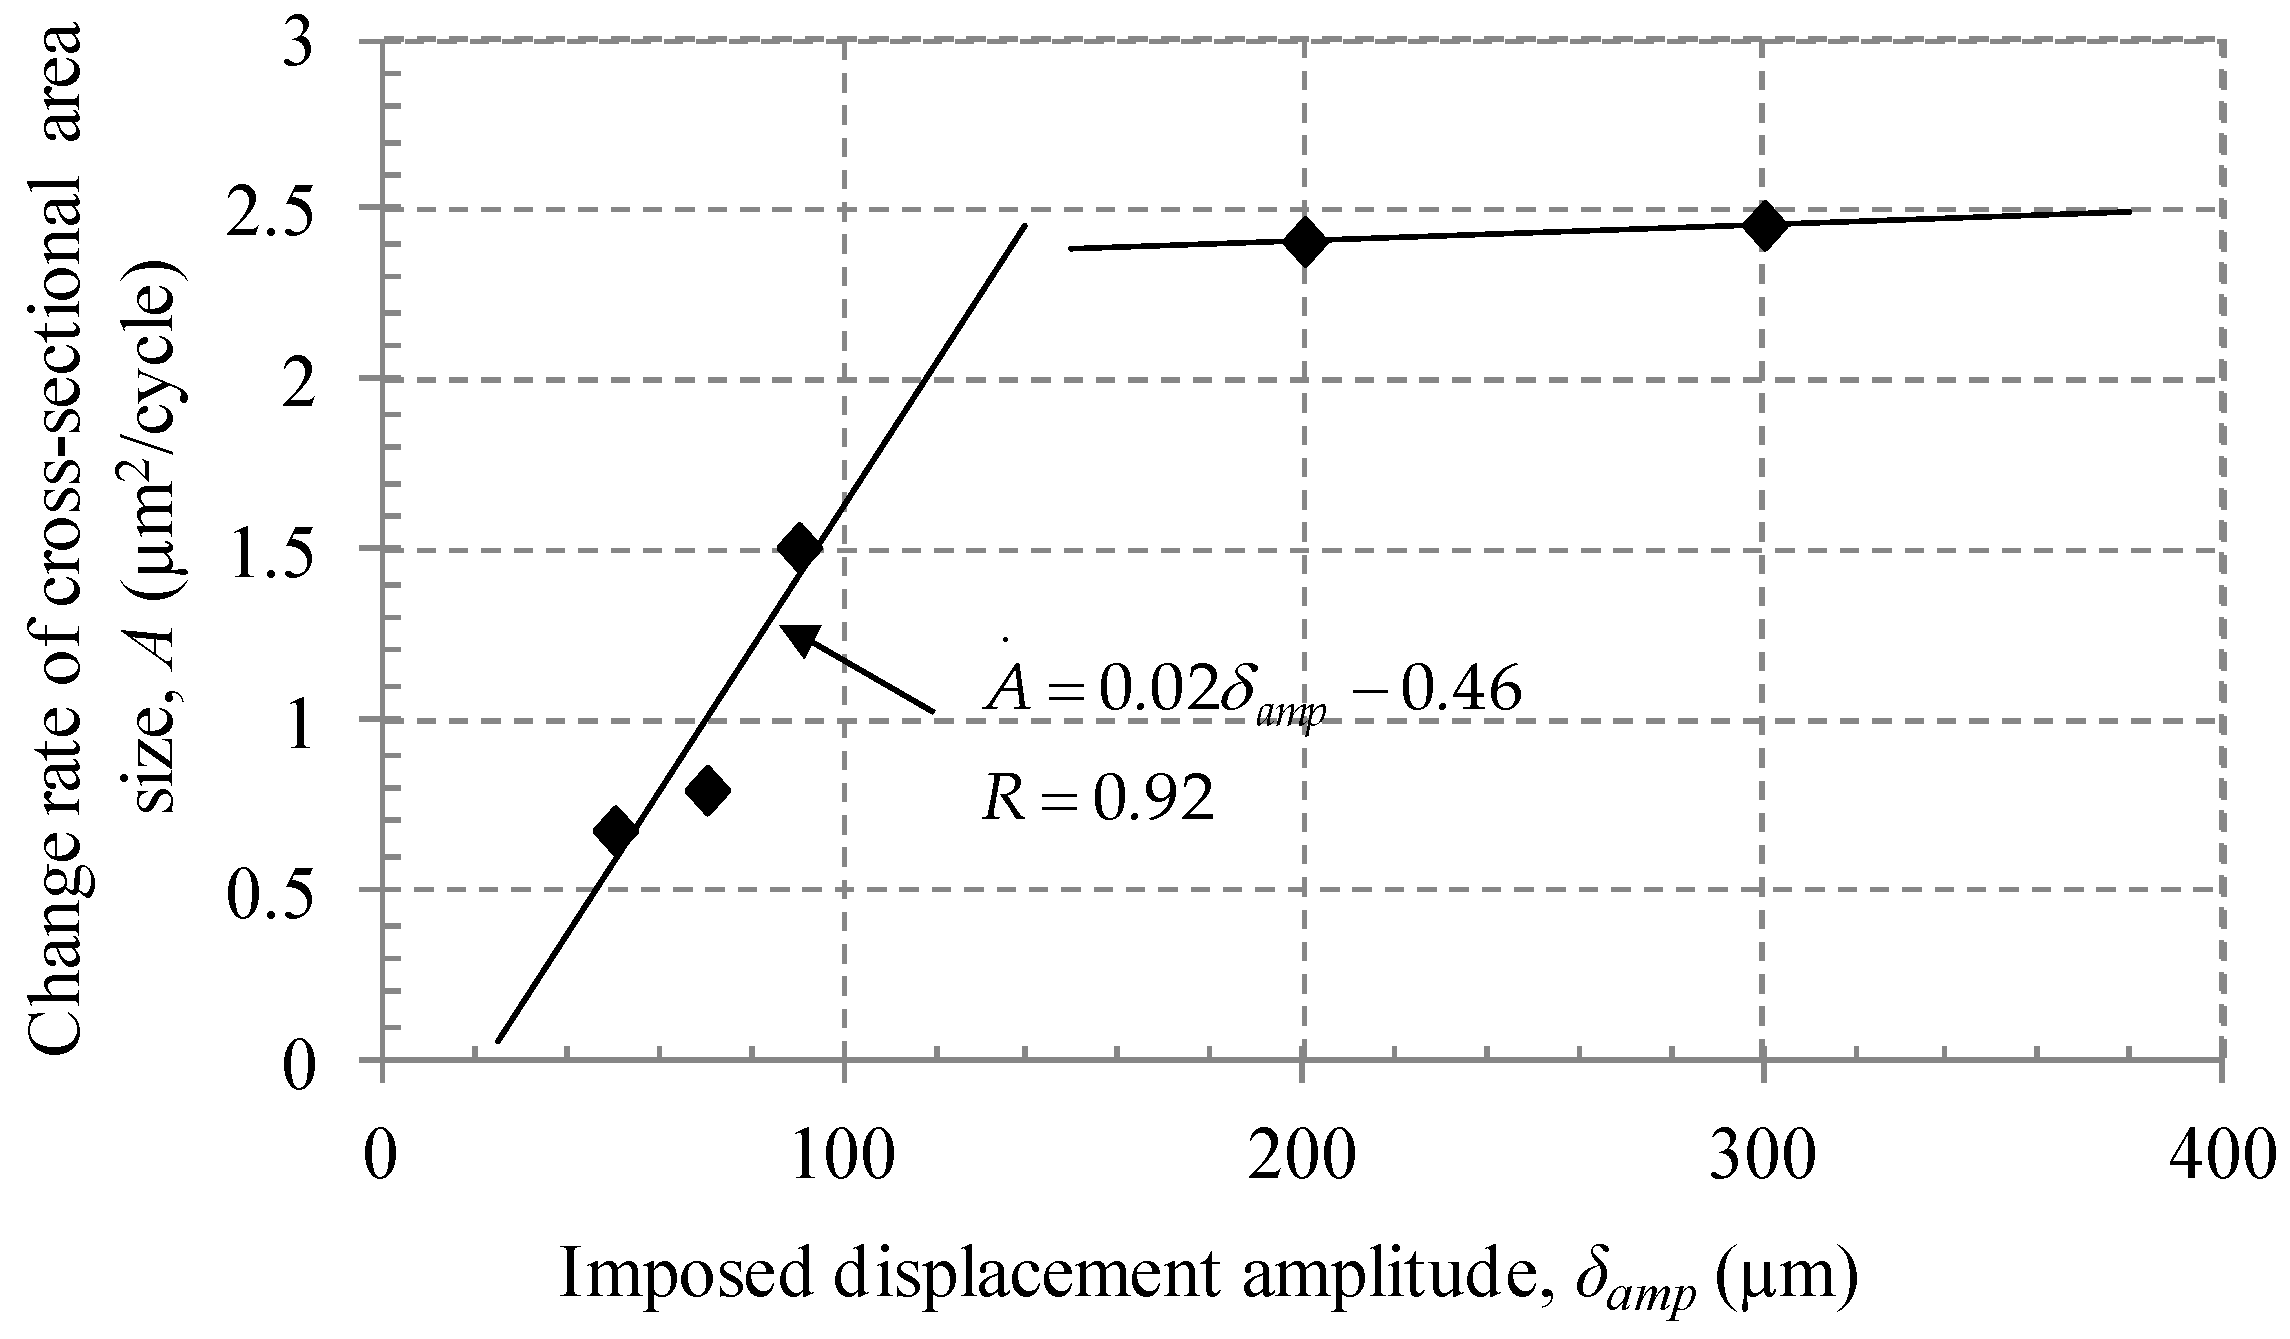
Figure 7 shows the cross-sectional profile of a wear scar on a cold rolled high strength steel plate at the displacement amplitudes of 0.05 mm, 0.07 mm, 0.2 mm, and 0.3 mm. The size of the area below zero on the vertical axis was calculated. The cross-sectional area size according to the number of cycles was presented in Appendix B (Figure A1). Figure 8 shows the growth rate of the cross-sectional area. The growth rate of the cross-sectional area was determined to increase with the imposed displacement amplitude up to 0.09 mm. After the imposed displacement amplitude of 0.2 mm, the growth rate was almost steady.
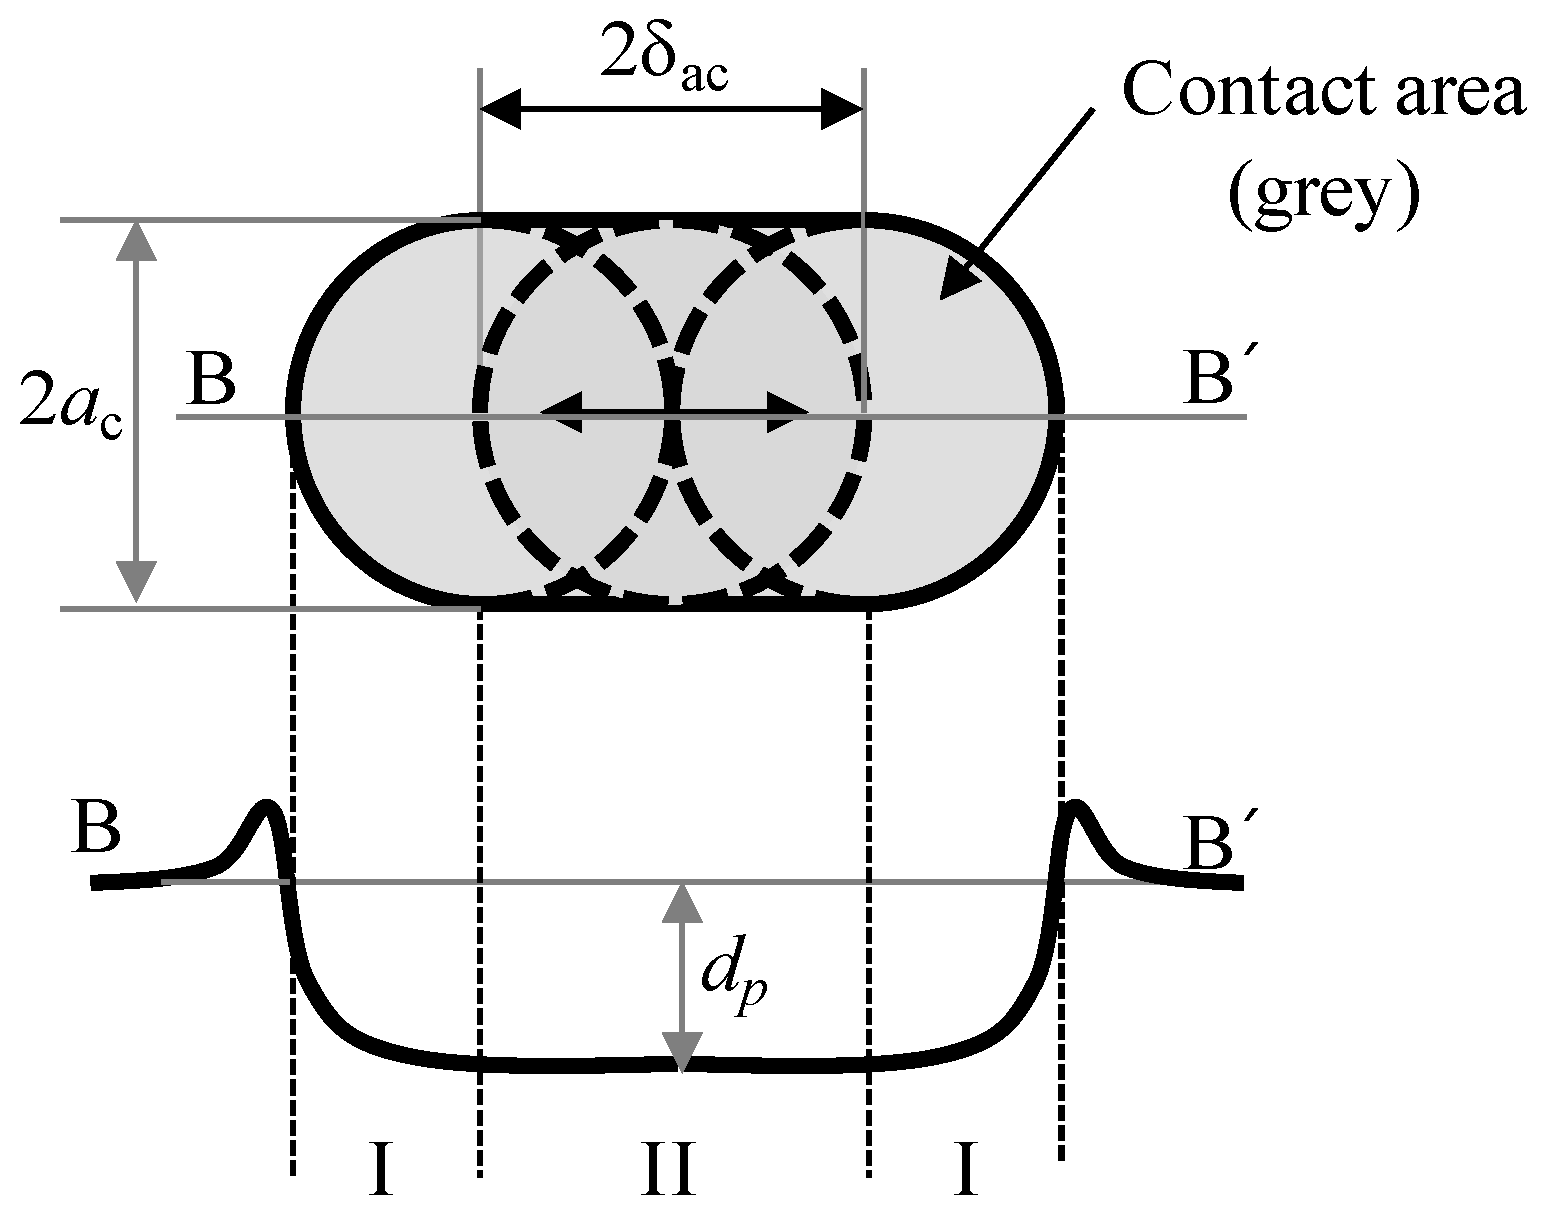
In this study, the wear volume was calculated with the measured cross-sectional profiles. Figure 9 shows the schematic diagram of a worn surface and a profile, where 2ac denotes the actual contact width and dp is the average wear depth. The total wear volume corresponds to the sum of Parts I and II in Figure 9. The wear volume for Part I can be assumed as semi-ellipsoid. Thus, the total wear volume (Vw) is given as
V w = 2 δ a c A + 2 3 π a c 2 d p
where A is the measured cross-sectional area and δac denotes the actual sliding amplitude. The actual sliding amplitude could be determined on a tangential force versus displacement loop; the actual sliding amplitude was defined as the displacement in which a tangential force comes to zero.
Figure 10 shows the calculated wear volume according to the number of cycles. Markers show the calculated data and the solid lines denote fitted curves with a linear form. As shown in the figure, the wear volume increased according to the number of cycles. Table 3 shows the results of the curve fitting. The slope of the linear fit equals to the wear rate. The wear rate of the steel at the displacement amplitude of 0.3 mm was found to be ten times greater than the calculated one at 0.05 mm.
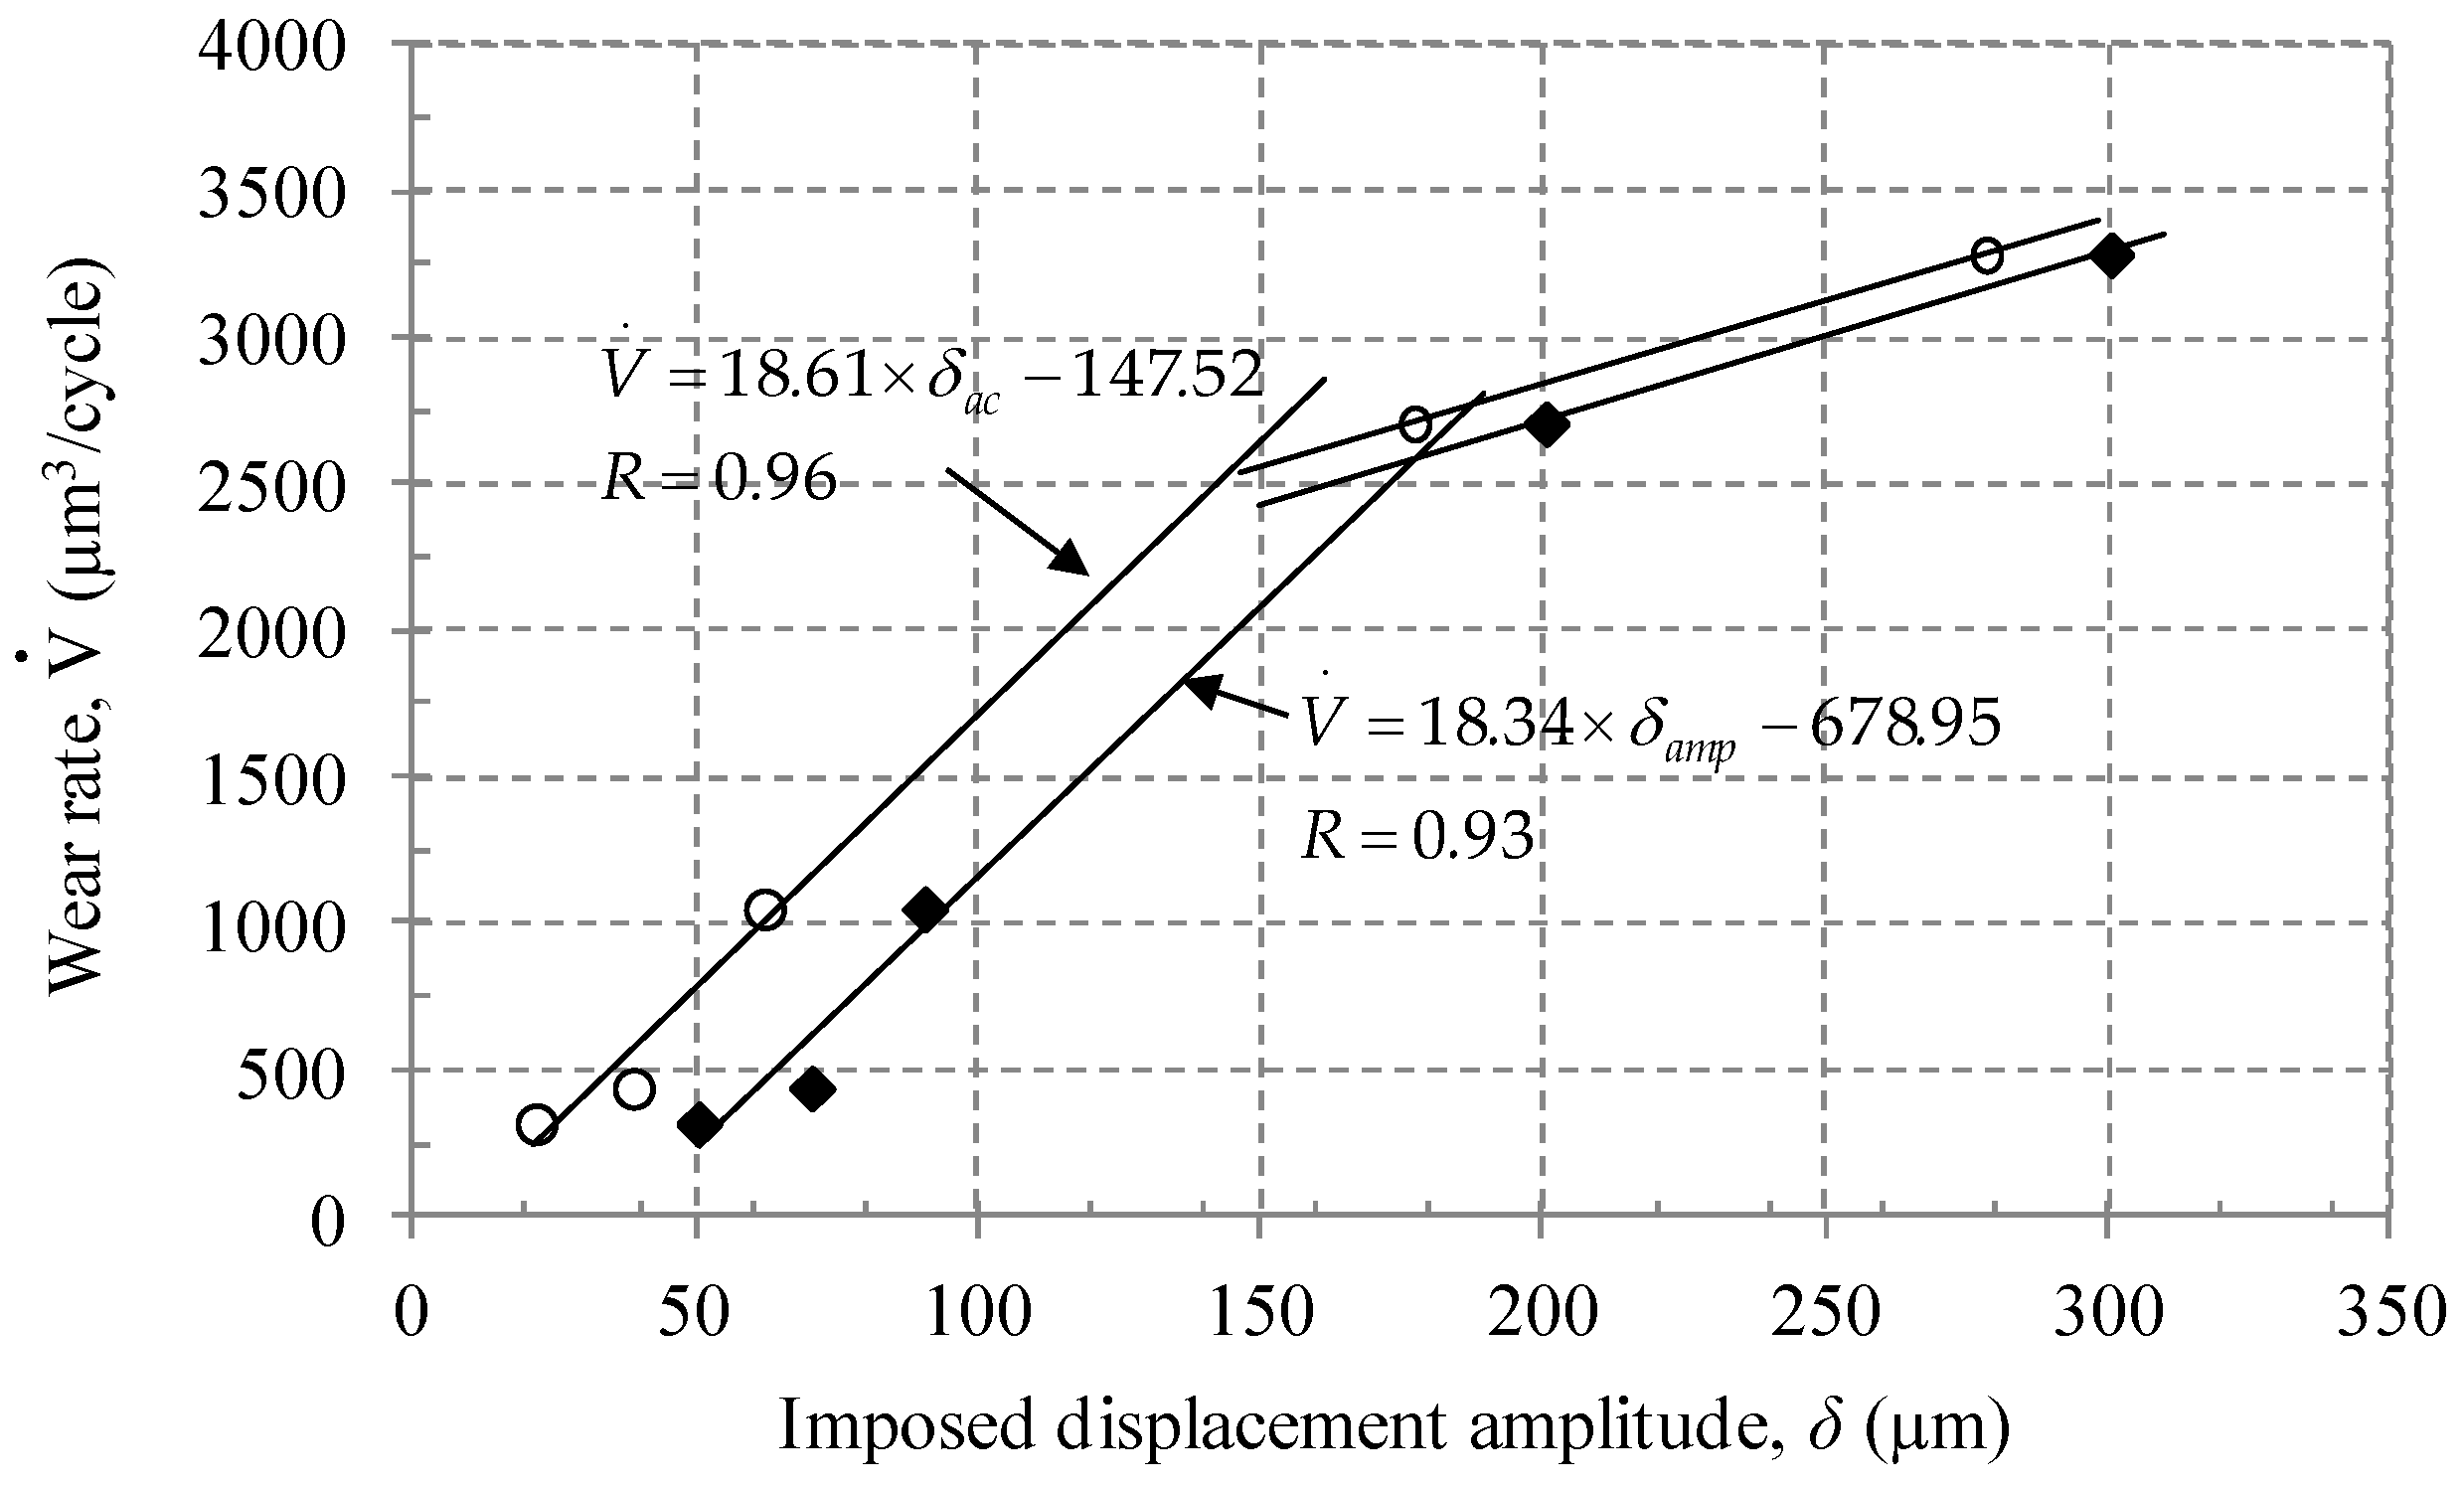
Figure 11 shows the wear rate of a cold rolled high strength steel plate. When the imposed displacement amplitude was lower than 0.09 mm (or when the actual sliding amplitude was lower than 0.062 mm), the calculated wear rate of the high strength steel specimen rapidly increased as the displacement amplitude increased; the increase rate was 18.34 µm3/cycle per unit displacement amplitude. This wear rate could be used for indicating the wear behavior of the steel in a gross slip regime. The transition on the increase of the wear rate was found between 0.09 mm and 0.2 mm in displacement amplitude. From Figure 8 and Figure 11, it could be suggested that sliding at an imposed displacement amplitude of lower than 0.09 mm should be considered fretting. Given that the imposed displacement amplitude of 0.09 mm was similar to the Hertz contact radius, it can be identified that the fretting occurred when the imposed displacement was lower than the Hertz contact radius during the sliding between cold rolled high strength steel and AISI52100. In order to identify the apparent transition from fretting to reciprocal sliding regimes, additional sliding tests are needed in the displacement amplitude range of 0.09 mm and 0.2 mm. In addition, direct measurements of the wear volume on a cold rolled high strength steel specimen would be useful in determining the accurate wear rate.

4. Conclusions

The following conclusions have been drawn.
  • The ratio of the maximum tangential to normal force was independent of the imposed displacement amplitude (between 0.05 mm and 0.3 mm). The ratio between the cold rolled high strength steel and AISI52100 steel was determined to be about 0.72 in dry conditions.
  • The cross-sectional area size of the wear scar increased as the number of cycles increased. The growth rate of the cross-sectional area size increased according to imposed displacement amplitude up to 0.09 mm.
  • The approximate wear volume on the cold rolled high strength steel specimen increased according to the number of cycles. A rapid increase in the wear rate occurred at imposed displacement amplitudes lower than 0.09 mm. The increase in the wear rate was found to transition from rapid to gradual between displacement amplitudes of 0.09 mm and 0.2 mm. In other words, the transition from fretting to reciprocal sliding regimes was identified between 0.09 mm and 0.2 mm.
The obtained values of the friction and the wear rate could be used for indicating tribological properties of cold rolled high strength steel. In addition, the wear rate can be used to predict the lifetime of an automotive seat slide track. Further work needs to include the measurement of accurate wear volume after a series of tests with additional displacement amplitudes (between 0.09 mm and 0.2 mm). In this study, only AISI52100 steel counterparts were considered. Thus, other counterparts such as ceramics and stainless steel balls need to be used to determine the wear rate of the cold rolled high strength steel.

Acknowledgments

This work was supported by the National Research Foundation of Korea (NRF) grant funded by the Korea government (MSIP) (No. 2016R1C1B1008483).

Author Contributions

J.H. and K.K. conceived and designed the experiments; J.H. performed the experiments; J.H. and K.K. analyzed the data; J.H. and K.K. contributed reagents/materials/analysis tools; K.K. wrote the paper.

Conflicts of Interest

The authors declare no conflict of interest.

Appendix A

The maximum contact pressure ( p 0 ) between a sphere and a plate is calculated from Hertz contact theory [13]
p 0 = ( 6 P E * 2 π 3 R 2 ) 1 3
1 E * = 1 ν 1 2 E 1 + 1 ν 2 2 E 2
where P denotes normal force, R is the radius of a sphere, E 1 and E 2 are elastic moduli of the sphere and of the plate, respectively, and ν 1 and ν 2 denote Poisson’s ratios of the sphere and the plate. The values for the parameters were presented in Table 2.

Appendix B

Cross-sectional area size of a wear scar on a cold rolled high strength steel plate according to the number of cycles. R indicates the quality of curve fitting with linear regression.
Figure A1. Cross-sectional area size versus Number of cycles.
Metals 07 00090 g012

References

  1. Hofmann, H.; Mattissen, D.; Schaumann, T.H. Advanced cold rolled steels for automotive applications. Steel. Res. Int. 2009, 80, 22–28. [Google Scholar] [CrossRef]
  2. Kuziak, R.; Kawalla, R.; Waengler, S. Advanced high strength steels for automotive industry. Arch. Civ. Mech. Eng. 2008, 8, 103–117. [Google Scholar] [CrossRef]
  3. Kim, K. A study of the frictional characteristics of metal and ceramic counterfaces against electro-deposited coatings for use on automotive seat rails. Wear 2014, 320, 62–67. [Google Scholar] [CrossRef]
  4. He, X.; Deng, C.; Zhang, X. Fretting behavior of SPR joining dissimilar sheets of titanium and copper alloys. Metals 2016, 6, 312. [Google Scholar] [CrossRef]
  5. Lavella, M. Contact properties and wear behavior of nickel based superalloy Rene 80. Metals 2016, 6, 159. [Google Scholar] [CrossRef]
  6. Waterhouse, R.B. ASM Handbook, Friction, Lubrication and Wear Technology, 1st ed.; ASM International: Materials Park, OH, USA, 1992; Volume 18, pp. 242–256. [Google Scholar]
  7. Bhushan, B. Introduction to Tribology, 1st ed.; John Wiley & Sons, Inc.: New York, NY, USA, 2002. [Google Scholar]
  8. Vingsbo, O.; Soderberg, S. On fretting maps. Wear 1988, 126, 131–147. [Google Scholar] [CrossRef]
  9. Kim, K.; Korsunsky, A.M. Effect of imposed displacement and initial coating thickness on fretting behavior of a thermally sprayed coating. Wear 2011, 271, 1080–1085. [Google Scholar] [CrossRef]
  10. Hur, J.W.; Baek, S.Y.; Kim, K. Effect of displacement on kinetic frictional behavior between electro-deposited coating and AISI 52100 steel under fretting conditions. Proc. Inst. Mech. Eng. J J. Eng. Tribol. 2016, 230, 1172–1179. [Google Scholar] [CrossRef]
  11. Li, J.; Lu, Y.H. Effects of displacement amplitude on fretting wear behaviors and mechanism of Inconel 600 alloy. Wear 2013, 304, 223–230. [Google Scholar] [CrossRef]
  12. Landolt, D.; Mischler, S. Tribocorrosion of Passive Metals and Coatings, 1st ed.; Woodhead Publishing Limited: Cambridge, UK, 2011; pp. 406–407. [Google Scholar]
  13. Sackfield, A.; Hills, D.A.; Nowell, D. Mechanics of Elastic Contacts, 1st ed.; Butterworth-Heinemann: Oxford, UK, 1993. [Google Scholar]
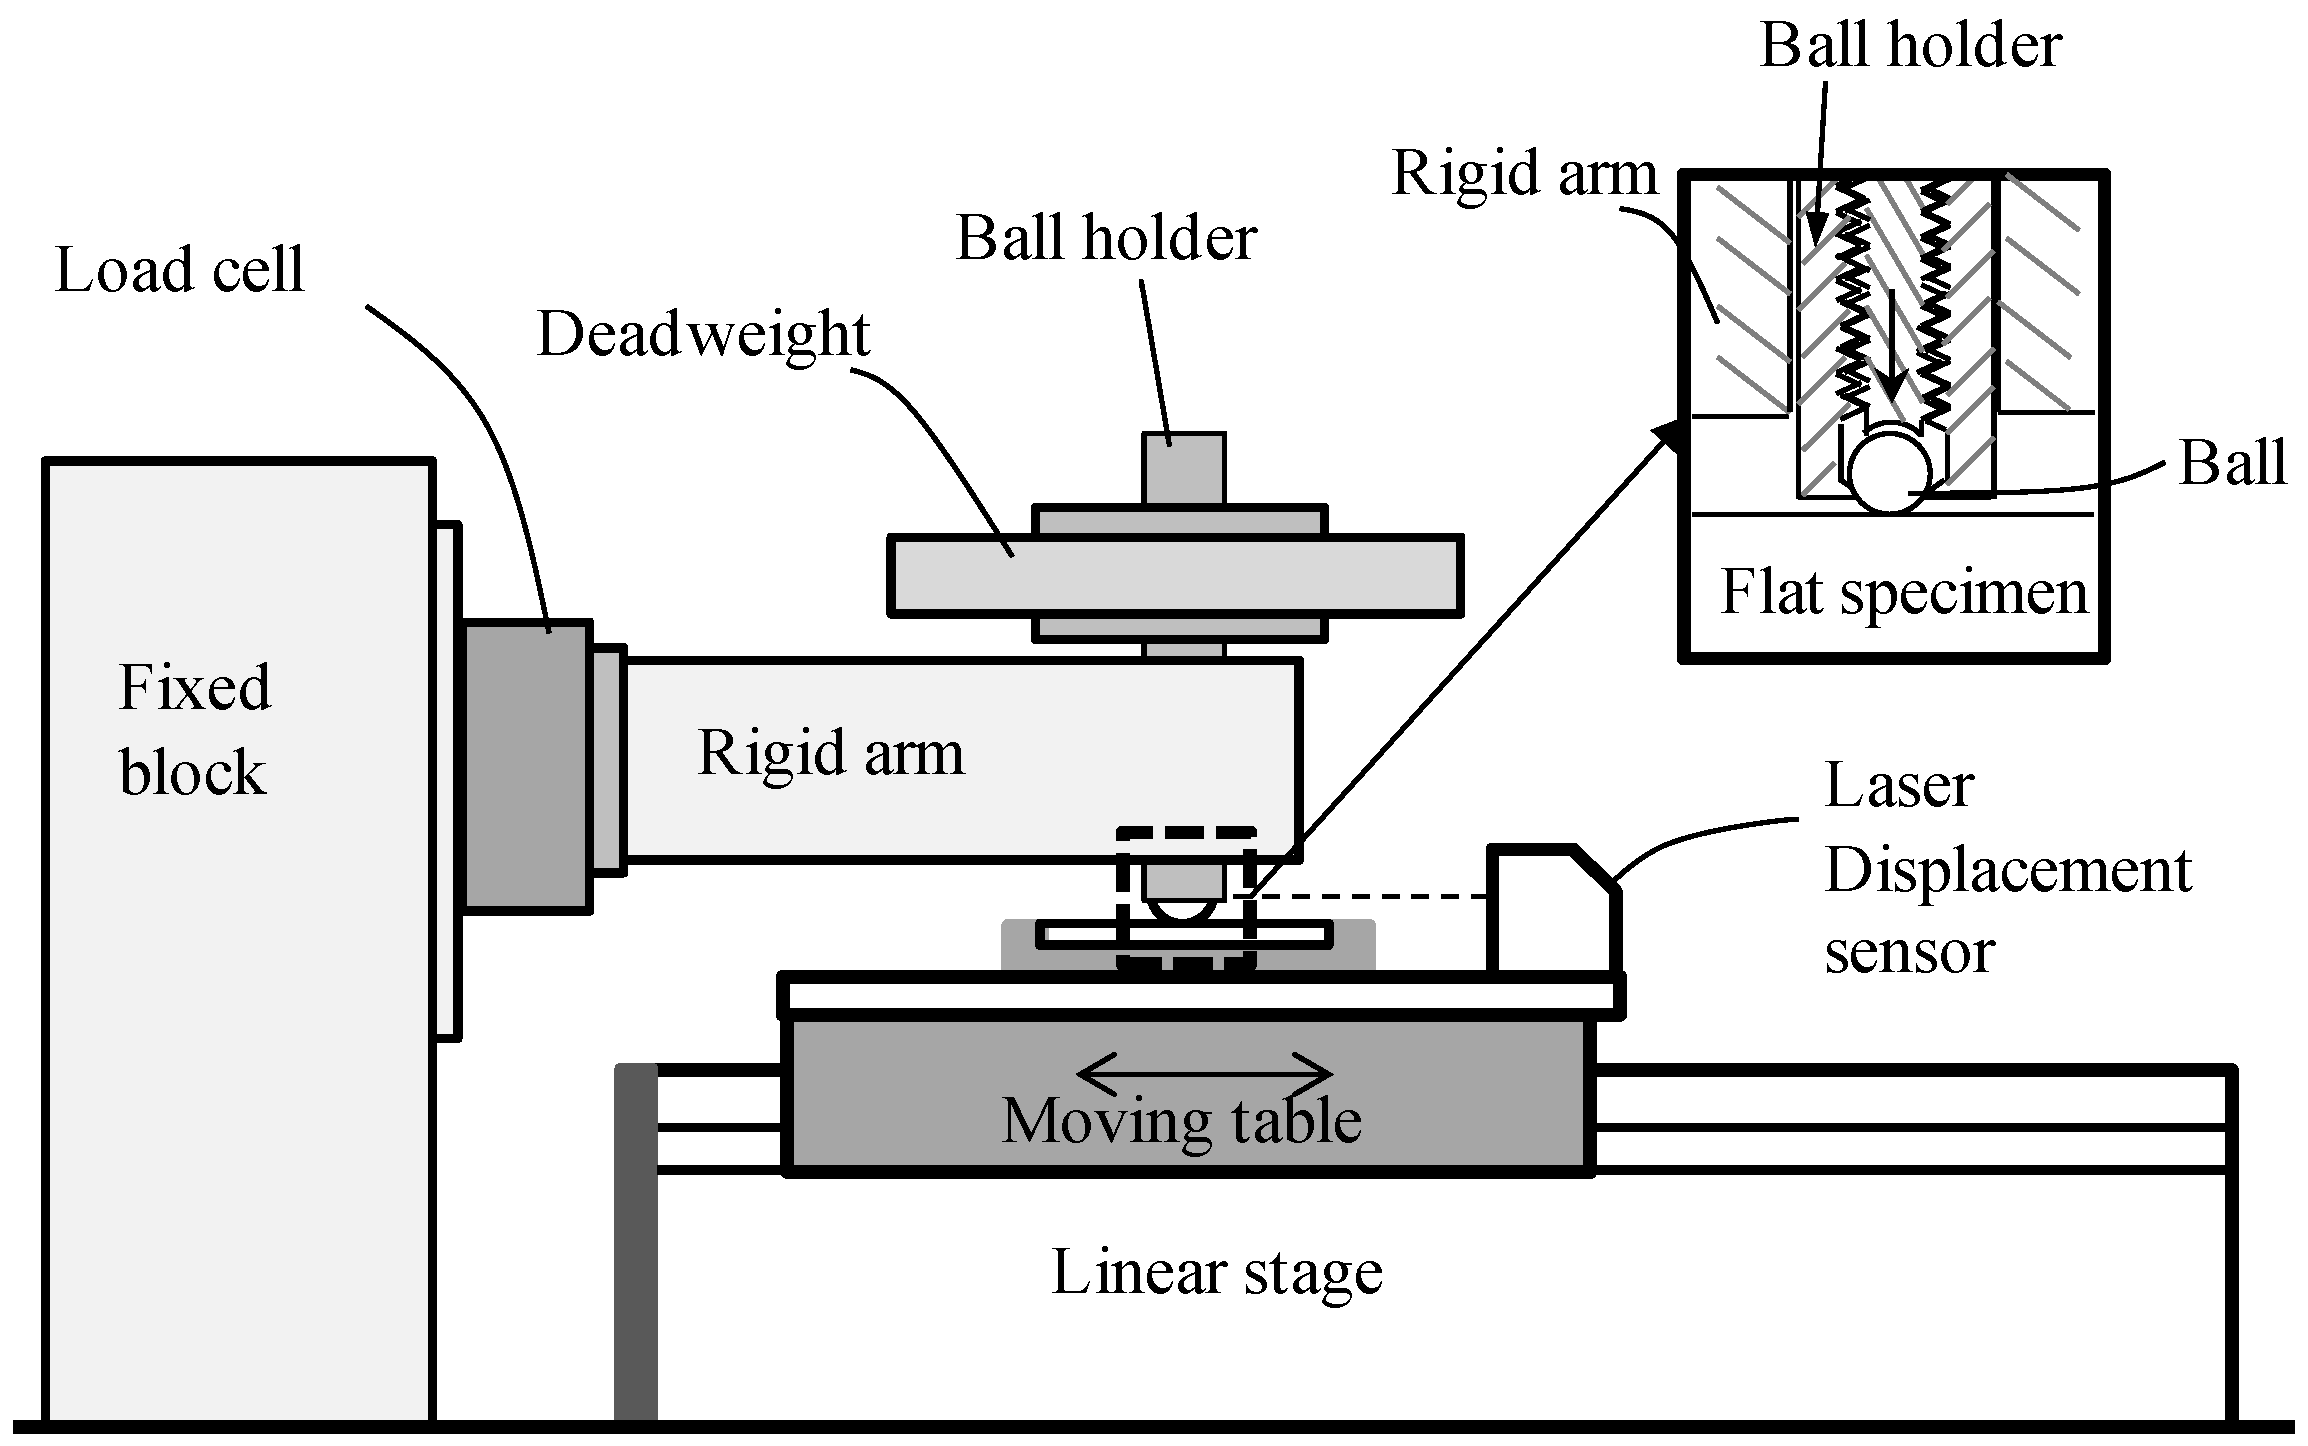
Figure 1. Illustration of a reciprocal linear sliding test apparatus using ball-on-flat contact geometry.
Metals 07 00090 g001
Figure 2. The ratio of the maximum tangential force (Qmax) to normal force (50 N) according to number of cycles at the displacement amplitude of 0.09 mm.
Metals 07 00090 g002
Figure 3. Tangential force versus displacement loops found at the 4000th cycle for various initial displacement amplitudes (δamp).
Metals 07 00090 g003
Figure 4. The ratio of the maximum tangential force to normal force at various displacement amplitudes: (a) 0.05 mm; (b) 0.07 mm; (c) 0.2 mm; (d) 0.3 mm.
Metals 07 00090 g004
Figure 5. The average ratio of the maximum tangential force (Qmax) to normal force (P) at different displacement amplitudes. Error bars show a 95% confidence interval.
Metals 07 00090 g005
Figure 6. Worn surface and profile of a cold rolled high strength steel plate at the displacement amplitude of 0.09 mm: (a) Wear scar after 4000 cycles; (b) The cross-sectional profile of a scar.
Metals 07 00090 g006
Figure 7. The cross-sectional profile of a wear scar on a cold rolled high strength steel plate at various displacement amplitudes: (a) 0.05 mm; (b) 0.07 mm; (c) 0.2 mm; (d) 0.3 mm.
Metals 07 00090 g007
Figure 8. Growth rate of the cross-sectional area of a wear scar on a cold rolled high strength steel specimen according to the imposed displacement amplitude. R indicates the quality of curve fitting with linear regression.
Metals 07 00090 g008
Figure 9. Schematic diagram of a worn surface and a profile to calculate the wear volume. dp denotes the average wear depth, ac is the actual contact radius, and δac is the actual sliding amplitude.
Metals 07 00090 g009
Figure 10. Calculated wear volume on a cold rolled high strength steel plate according to the number of cycles.
Metals 07 00090 g010
Figure 11. Wear rate on a cold rolled high strength steel plate with the imposed displacement amplitude. δac denotes the average value of the actual sliding amplitude during a test, and δamp is the imposed displacement amplitude. R indicates the quality of curve fitting with linear regression.
Metals 07 00090 g011
Table 1. Chemical compositions (wt %) of cold rolled high strength steel and AISI 52100 steel provided by the manufacturers.
MaterialCMnPSSiAlCr
Cold rolled high strength steel0.181.50.080.030.30.02-
AISI521000.95–1.100.050.0250.0250.15–0.35-1.3–1.6
Table 2. Mechanical properties of cold rolled high strength steel and AISI 52100 steel provided by the manufacturers.
MaterialElastic Modulus, GPaPoisson’s RatioVickers Hardness, HV
Cold rolled high strength steel2050.28~153 1
AISI52100~2000.27–0.3789
1 The hardness was measured in this study.
Table 3. Curve fitting results of calculated wear volume (Vw) on a cold rolled high strength steel plate. R indicates the quality of curve fitting with linear regression.
Displacement Amplitude (mm) V w ( N ) = V ˙ w × N + C
V ˙ w : wear rate, N: number of cycles, C: constant
V ˙ w (µm3/cycle)C (µm3)R
0.05320.056.08 × 1050.99
0.07441.071.19 × 1060.96
0.091053.705.04 × 1050.98
0.22711.001.11 × 1060.95
0.33287.201.03 × 1060.96