Laser Welding Dissimilar High-Strength Steel Alloys with Complex Geometries

Gkn Aerospace, Global Technologies, Golf Course Lane, Filton BS34 9AU, UK
*
Author to whom correspondence should be addressed.
Metals 2018, 8(10), 792; https://doi.org/10.3390/met8100792
Submission received: 29 August 2018
/
Revised: 27 September 2018
/
Accepted: 1 October 2018
/
Published: 3 October 2018
(This article belongs to the Special Issue Laser Welding of Industrial Metal Alloys)
Abstract
:Laser welding of dissimilar high-strength steels was performed in this study for two different geometries, flat and circular samples with material thicknesses of 5 and 8 mm. The material combinations were a low carbon to a medium or high carbon steel. Three different welding systems were employed: a Nd:YAG, a CO2 and a fiber laser. The process stability was evaluated for all the experiments. The resulting full penetration welds were inspected for their surface quality at the top and bottom of the specimens. Cross sections were taken to investigate the resulting microstructures and the metallurgical defects of the welds, such as cracks and pores. Significant hardening occurred in the weld region and the highest hardness values occurred in the Heat Affected Zone (HAZ) of the high carbon steel. The occurrence of weld defects depends strongly on the component geometry. The resulting microstructures within the weld were also predicted using neural network-simulated Continuous Cooling Transformation (CCT) diagrams and predicted the occurrence of a mixture of microstructures, such as bainite, martensite and pearlite, depending on the material chemistry. The thermal fields were measured with thermocouples and revealed the strong influence of component geometry on the cooling rate which in term defines the microstructures forming in the weld and the occurring hardness.
1. Introduction
Current research on laser welding is quite broad; even when only encountering the case of laser welding high carbon steels, there still exists a large variety of journal papers, covering various research aspects such as microstructural analysis, laser processing, computer modelling, residual stress measurements and mechanical testing of the resulting welds [1].
Published work on laser processing discusses mainly the effects of welding parameters, such as welding speed and laser power on welding defects, such as pores and cracks and the mechanical properties of the weld [1,2,3,4,5,6,7,8]. Investigations into the occurring microstructures in the welds can be found in various papers where the influence of the processing parameters with respect to the resulting and occurring phase transformations are presented [1,9,10]. The mechanical properties of the laser welds have already been evaluated in terms of fracture resistance, fatigue, ultimate tensile and shear strength, and toughness [1,9,11]. Considerable understanding and optimizations for the laser welding process have been possible via using multiphysics simulations, multivariable optimizations and artificial neural network concepts [7,12,13,14,15,16,17,18,19,20,21,22,23].
However, there are still several research areas unexplored, such as the influence of the mixing that occurs in a dissimilar joint, the influence of the laser system and more importantly the effect of the component geometry. In most papers related to the laser processing part, either Nd:YAG, CO2 or fiber laser welding is employed or in some cases two laser systems are studied (Nd:YAG and CO2 laser systems) [5,6,24,25,26]. In this work, Nd:YAG, CO2 and fiber laser welding were studied together and the resulting welds were analyzed in detail to signify the differences between the three different laser processes.
In the literature, usually laser welding of thin-sectioned samples is considered, and most experimental work has been performed on thin sectioned samples with thicknesses of 1 to 2 mm [1,4,5,6]. In one study, Xie et al. evaluated the welding performance of a dual beam CO2 laser on thick sectioned (6.25 mm thick) materials and revealed that the resulting weldments outperform those obtained by a single beam CO2 laser for a AISI 1045 steel sample [8].
In recent years, the industrial interest for welding dissimilar metals has been ever increasing [1,27,28,29,30,31,32], mainly due to the fact that for every application the most efficient material is selected regardless of the corresponding joinability problems [27,33]. Mujica et al. studied microstructurally and mechanically the resulting laser welds of a TRIP-TWIP material combination; again their work deals with thin section (1–2 mm) materials [34].
Casalino et al. studied the weldability, microstructure and mechanical performance of dissimilar welding AISI304 and AISI410 stainless steel alloys [29]. Welding was done with a hybrid fiber laser/Tungsten Inert Gas (TIG) welding process on samples with 6 mm thickness.
In this work, different types of steel with much broader chemical compositions, ranging from low carbon up to high carbon steel have been laser welded, with two different thicknesses of 5 and 8 mm and different component geometries as well. Dissimilar steel laser welding was evaluated between a low-carbon to a harder medium- or high-carbon steel that had been welded on a harder steel specimen (with much higher carbon content). The resulting microstructures were studied experimentally and by a computer simulation.
The differences in the two HAZs and the mixing within the weld pool were analysed by hardness, SEM imaging and CCT diagrams. The effect of the component geometry on the joinability was revealed. In many industrial process, more complex geometries have to be welded; therefore, the effect of the sample geometry on the resulting weldability should be taken into account. In this study, the weldability of a Hub Bearing Unit (HBU) was investigated with a focus on minimising the component’s weight. Figure 1a,b shows a typical HBU, which is the component that connects the vehicle wheel with the suspension. Laser welding of the circular specimens was pursued in order to evaluate the weldability of a geometry similar to the geometry of the bolt highlighted in Figure 1b. So the purpose of this study was to replace the bolt that keeps all HBU components together, with a laser weld.
The CCT diagrams were calculated using an Artificial Neural Network (ANN) based on Reference [35,36]. ANNs have been readily used in a range of applications for metals, from predicting the fatigue lifetime of a component [37], to designing new alloys [12] and optimizing in this case the welding process [13,38]. Yet in this work we use ANN to predict the microstructures in the weld. This is particularly useful since certain microstructures present higher potency to cracking.
2. Materials, Sample Geometries and Experimental Procedures
2.1. Material Types
Various steel grades have been used for the laser welding trials. The different material codes and their respective chemical composition can be seen in Table 1. The alloys spread over quite a large range of carbon content; from low up to high carbon. The various material combinations and the corresponding sample thicknesses that were laser welded are shown in Table 2. Except for the first case, for all the other material combinations, dissimilar steel welding was performed. All materials had a high Carbon Equivalent (CE > 0.4), suggesting that such materials are non-weldable.
Figure 2 shows micrographs obtained prior to welding for the base plates, 16MnCr5, 41Cr4, 42CrMo4 and SAE1055 consist of a matrix of ferrite and pearlite. However, for 16MnCr5 the amount of ferrite is much higher with respect to the other steel series. Finally, SAE1070 is a fully pearlitic microstructure as shown in Figure 2e.
2.2. Experimental Geometries for Laser Welding, Welding Systems and Thermocouple Measurements
Laser welding of flat sheets was performed for the material combinations and sample thicknesses outlined in Table 2. The samples were rectangular with dimensions: 200 mm × 50 mm × (5 or 8) mm. The circular specimens were made up of a shaft with 50 mm × 30 mm length and diameter and a ring with 5, 30 and 44 mm thickness, inner and outer diameter, respectively. The specimen geometry and experimental set-up is shown in Figure 3a,b. In all cases, the specimens were also clamped from the top.
The samples were cleaned with ethanol to remove the grease and other undesirable substances from the surface prior to welding. During welding, grease evaporates and may lead to gas pores inside the weld pool.
Three different laser welding systems were used to perform these experiments: a 4 kW Nd:YAG laser for the 5 mm thick samples and a 6 kW CO2 and 8 kW fiber laser for the 8 mm thick samples. Further details on the process parameters and the laser set-up during the experiments can be found in Reference [2]. Typical welding defects found in the welds were cold lapping, undercut, spatter, porosity and cracking (the last only for the 16MnCr5-1070 material combination).
The circular samples also had a modified geometry in order to improve the resulting weld. The modified samples had different dimensions compared to the conventional samples where the outer diameter of the shaft was exactly the same as for the inner diameter of the ring. In the modified configuration, the ring had a smaller inner diameter in order to induce compressive stresses at the gap. The purpose was to minimize the opening of the gap during laser welding of the ring-shaft configuration. The inner diameter of the ring was either 29.910 or 29.920 mm and the diameter of the shaft was 29.950 or 29.970 mm respectively. A Carver Laboratory Press (Carver Inc., Wabash, IN, US) was used to put the ring on the shaft, using a hydraulic system to apply a force on samples.
Thermocouple measurements were made in some cases in order to gain an insight into the thermal field during laser welding and to make a comparison between the microstructural phases present in the weld and the simulation predicted from CCT diagrams. Thermocouples were placed at specific distances from the weld line as shown in Figure 3c,d. The weld size on the top surface was measured and it was decided to put thermocouples at distances of 2, 2.5 and 3 mm from the weld centreline. The thermocouples were K type, 0.13 mm diameter, and were placed on the top surface. A ceramic compound was placed on top of the wires in order to protect them from the laser irradiation. The ceramic compound was produced at the laboratory, by mixing colloidal silica (Ludox, liquid form) with Aluminium oxide (Al2O3, powder form) [2]. The thermocouples were connected to a Yokogawa DL716 machine (Yokogawa, Tokyo, Japan) to measure the temperature fields. Tensile testing was performed via an Instron 4507 model (Instron, Norwood, MA, US). The samples had a gauge width and length of 12 mm × 40 mm.
3. Experimental Results
3.1. Experimental Flow Diagram
In order to gain a more consistent overview of the research work performed, the following flow diagram was pursued: Initially the process was evaluated in terms of stability to relate the resulting welds to the process influence, the welds were then inspected for their surface profile and the existence of undercut or spatter. Twelve cross sections were taken to assess for the presence of pores and cracks. SEM analysis was carried out and the resulting microstructures were coupled with the hardness profiles. The existence of the specified microstructures was verified from the neural-network calculated CCT diagrams [35]. Tensile testing was performed to evaluate the corresponding mechanical properties. The circular samples were laser welded based on the optimized processing parameters from the flat samples. The thermal fields were evaluated both for the flat and circular specimens to evaluate the weldability of the alloys and components.
In the next three sections, the results are shown separately for the flat samples, the circular geometries and the comparison between the two (geometries).
3.2. Flat Samples
In this section, the results from laser welding flat samples are presented.
3.2.1. Process Stability and Weld Profiles
Initially, the stability of the process was inspected; this was evaluated by the fluctuations in the laser plume. In principle, instabilities in the laser plume resulted in increased spatter, porosity and increased surface roughness at the top weld surface. The keyhole stability for all the laser systems was found to be independent of the material composition (for all the different steel samples). The CO2 welding process was found to be the most stable process for all the material combinations (no plume fluctuation), and moving through the Nd:YAG, however the fiber laser stability of the corresponding process decreased. For all the cases the stability was found to be optimum at medium welding speeds (around 20 mm/s for the CO2 and Nd:YAG laser and 35 mm/s for the fiber laser [2]).
The weld appearance on the top and bottom of the weld bead was also inspected. Depending on the welding conditions, surface defects (i.e., weld undercuts and spatter) occurred. By varying the welding speed and power intensity and also other parameters such as the spot size and position of the beam (Zf affect the surface profile of the welds), the existence of these defects could be minimized. Here the results for the Nd:YAG laser are presented for the 5 mm thick samples, as similar observations were made for the CO2 and fiber laser systems
At very low speeds (~10 mm/s), much undercut occurred along the sides of the weld pool and too much spatter related to the overheating. While at very high speeds (32.5 mm/s) too much spatter was observed due to the instabilities of the keyhole plume (increasing the welding speed, the keyhole moves quite fast striking even colder material leading to more unstable conditions for the keyhole [2]). So, for medium welding speeds (17.5–22.5 mm/s) the stability for all processes was optimized. Consequently, the weld profile on top was optimized, the amount of spatter minimised and the undercut was diminished. Furthermore, at medium welding speeds the weld root size was adequately large (>1.5 mm) to ensure adequate strength for the weld throughout its whole thickness [2]. The weld-surface profile for the case of Nd:YAG laser welding may be seen in Figure 4a. Figure 4b shows the relevant weld sizes for the root pass, fusion zone and HAZ. For the optimized welding conditions of 4 kW and 20 mm/s welding speed, the root pass, fusion zone and HAZ were 2, 3 and 8.5 mm in width respectively.
3.2.2. Weld Cross Sections, Metallurgical Investigations & Mechanical Properties
Cross sections were taken from each weld to observe microstructurally the obtained welds. In Figure 5, weld cross sections for all the welding processes (Nd:YAG, CO2 and fiber laser) are shown. The smoother weld profile corresponds to the CO2 welded samples—which was the most stable process. For the fiber laser processing case, the weld profile is quite irregular, which can be due to the high power densities along the weld depth which lead to the exiting of the keyhole through the bottom of the sample; this in turn leads to highly unstable conditions for the keyhole plume [2]. In the case of fiber laser welding, the characteristic weld sizes (fusion zone and HAZ) were about 1/3 compared to the respective sizes obtained from the other process; which in turn leads to low residual, thermal stresses and low distortion.
Porosity was observed for all the welding experiments. The amount of porosity was decreased by increasing the stability of the process and using high welding speeds for the stable welding conditions [8]. So within the welding speed range between 17.5 and 22.5 mm/s, the lowest amount of porosity was found at 22.5 mm/s, as less heat input is input into the material. The CO2 welded samples showed less porosity as the process was more stable for a larger welding speed range. The highest porosity was found for the fiber welded specimens; this was related to the stability of the process.
The weld microstructure was investigated by means of optical microscopy and SEM. Bainitic microstructures at the center of the welds were revealed for the following material combinations: 16MnCr5-16MnCr5, 16MnCr5-42CrMo4 and 16MnCr5-SAE1055, which is beneficial in terms of toughness and ductility compared to the martensitic microstructures [39]. Figure 5 shows the SEM micrograph of the least weldable material combinations; i.e., 16MnCr5-SAE1055 and 16MnCr5-SAE1070.
The presence of bainite was verified by performing SEM analysis as well as by plotting the CCT diagrams for the various material compositions. The CCT diagrams were computer plotted by means of neural network analysis, based on Reference [35]. In Figure 5a, bainite laths are shown in the 16MnCr5 HAZ and inside the 16MnCr5-SAE1055 weld pool, suggesting the occurrence of mixing between the two materials in the weld. The white-coloured carbides may be recognized, which are carbon-rich and show increased hardness being the hard precipitates inside the bainite laths. In SAE1055 HAZ, bainitic-pearlitic microstructures were obtained, with the pearlite being the main microstructural constituent [2]. Inside the weld pool of the 16MnCr5-SAE1070 material combination, fully-martensitic microstructures were found (Figure 6b). For the latter case, the existence of high carbon content at the side of the SAE 1070 material specimen led to carbon diffusion inside the weld pool, increasing the occurring carbon content. In 16MnCr5 HAZ, the matrix was mostly martensitic with some bainitic regions identified as well. While in SAE1070 HAZ, a fully pearlitic microstructure was revealed.
At the respective HAZs, grain growth occurred; at the high carbon side, pearlitic grain growth occurred; at the low carbon side, martensitic grain growth occurred. The HAZ of the higher carbon side was found to be the most crack-sensitive area of the weld.
All the 16MnCr5-SAE1070 welds fractured 20 to 40 minutes after welding with the CO2 and Nd:YAG systems, due to the presence of hard structures in combination with the high tensile thermal stresses. Fracture occurred at the HAZ of the SAE1070 metal, where the microstructure was fully pearlitic (the most brittle region). Fracture occurred along the HAZ without any deflection in direction, for all the samples [2] except for the fiber laser welded samples which did not undergo fracture, but contained cracks in the HAZ, due to the low heat input of the process. During fiber laser welding, high processing speeds together with the minimum affected regions may be realized, reducing the resulting thermal tensile stresses.
Hardness measurements were obtained at the top and bottom of the weld, 1.5 mm from the respective surfaces. For the case of similar welding (16MnCr5-16MnCr5), an increase of more than double compared to the base metal was observed (Figure 7a). For the case of dissimilar welding, the hardness profiles signified the occurrence of mixing inside the weld pool. In Figure 7b, the hardness at the base metal of the 16MnCr5 and 42CrMo4 was approximately 270 and 370 Hv1, respectively. Starting from the 16MnCr5 side, the hardness increased abruptly from 270 to 450 Hv1 (average numbers) in the HAZ region of the 16MnCr5. Moving to the weld region (mixing between the two materials occurred), hardness further increased to 580 Hv1. Moving to the HAZ of the 42CrMo4 side, the hardness reached a maximum of 740 Hv1; with an average of 720 Hv1. Further to the 42CrMo4 base metal, the hardness dropped abruptly to about 370 Hv1, i.e., by more than a factor of 2.5. Similar results were found for the 16MnCr5-41Cr4, 16MnCr5-SAE1055 and 16MnCr5-SAE1070 material combinations as shown in Figure 7c–e. Again, mixing occurred in the weld pool and the most brittle zone appeared to be the HAZ of the high carbon side (SAE 1055, SAE 1070). The average and maximum values at the high carbon side for the HAZ of 41Cr4, SAE1055 and SAE1070 were 636–654, 756–763 and 801–807, respectively. A hardness value above 800 Hv1 was measured in the HAZ of the SAE1070 which resulted in micro-cracking within the HAZ (as shown by the micrograph in Figure 7e) or complete fracture of the weld.
The hardness profiles were similar for all the laser processes indicating that the hardness profile is independent of the welding process, and is mainly dependent on the material combination. This is due to the fact that the hardness values in the corresponding region depends strongly on the phases present. The hardness values increase, moving through the different phases: ferrite, bainite, martensite and pearlite. Therefore, a fully pearlitic HAZ would be harder from a bainitic HAZ independent of the welding conditions. There was also an effect of the sample thickness on the resulting hardness profiles. The 8 mm thick welds showed reduced hardness compared to the 5 mm thick welds. This may be due to the fact the thermal gradients are higher and therefore the material stays at high temperature for smaller time intervals, leading to reduced thermal stresses.
Upon tensile testing, all specimens fractured in the base metal away from the weld (more than 5 mm away from the welded region), except for the 16MnCr5-SAE1070 combination which had pre-existing cracks at the borderline between the weld pool and HAZ. Fracture always occurred on the 16MnCr5 side which is the lower strength material. There was no evidence of macroscopic elongation and cross sectional reduction either on the 42CrMo4 side or in the welded region (measurements taken with a caliper). The mechanical properties, such as Yield Point, Ultimate Tensile Strength and Total Elongation were measured to be 620 MPa, 910 MPa and 9% respectively, both for the base metal and for the welded sample. The presence of the weld was insignificant to the overall macroscopic stress-strain behavior upon tensile testing. This can be easily seen in Figure 8 where the tensile curves for the base metal (16MnCr5) and the dissimilar weld (16MnCr5-41Cr4) are shown for comparison. This is due to the fact that the welded region is more than two times harder with respect to the base metal which in turn moves the necking region quite far from the weld. Also, the presence of such small pores in the weld is considered to be negligible, as the weld is much harder and much less deformable with respect to the base metal. Even though such pores are not expected to influence the macroscopic behavior upon tensile testing, their effect on the fatigue properties is expected to be detrimental.
3.2.3. CCT-Phase Transformation Study
In the literature, the cooling time Δt800–500 is mainly used for estimating the structural changes when welding low-alloyed steels [1]. Matsuda et al. proposed a different cooling time parameter, the Δt800–300 [11]. Matsuda et al. suggests that it is better to use the cooling time Δt800–300 for the case of medium and high carbon steel. In this study, the CCT diagrams were computer plotted using neural network analysis. Further details on this analysis can be found in Reference [35]. By plotting the corresponding CCT diagrams it was found that for each material type and component geometry a particular cooling time parameter should be addressed. For the general cooling time parameter a broad temperature range should be used [2,11,35]. Moreover, for the case of laser welding, the fast cooling rates in the phase transformation region (of the order of 50 °C/s between 700 °C and 300 °C) lead to phase transformations at lower temperatures compared with conventional welding (MIG (metal inert gas), TIG, manual welding etc.). As shown in Figure 9b, for the case of the medium carbon steel, phase transformations may occur also at 300 °C. Furthermore, even for the case of low carbon steel, phase transformations occur also below 500 °C, suggesting that the use of Δt800–500 parameter is misleading.
In this work, a similar approach to Matsuda et al [11] is followed although a smaller cooling time range is calculated: The cooling time 700–300 °C, Δt700–300. The cooling rate for the case of laser welding is high and in the phase transformation range is of the order of 50 °C/s, and the phase transformations occur at relatively low temperatures, as shown in Figure 9b. Equilibrium and non-equilibrium phases form, such as ferrite, pearlite, bainite and martensite which nucleate and grow at temperatures ranging between 700 °C and 300 °C.
As shown in the CCT diagram in Figure 9, the cooling time Δt700–300 is of importance for the case of laser welding, suggesting that an alternative approach for the cooling time should be followed for the case of laser welding compared to the conventional type of welding (where the cooling rates are lower).
It needs to be clarified that the higher the amount of alloying elements in the steel series, the higher the error in calculating the correct CCT diagram, based on Reference [35]. However, the CCT diagrams in Figure 9 predict well the suppression of the pearlite nose to much slower cooling rates and the formation of ferritic-bainitic microstructures in the HAZ of 16MnCr5, in agreement with observations made by SEM analysis as shown in Figure 5a. Similarly, the formation of (high percentage of) pearlite and bainite are predicted well for the SAE 1055 in Figure 9b. Finally, the cooling rate line crosses only the pearlite nose in Figure 9c and, therefore, only pearlitic microstructures are expected to form in the HAZ of SAE1070. The bainite nose is considerably suppressed in SAE1070. However, there is no indication of the exact percentages of the phases formed.
3.3. Circular Geometries
The results on laser welding circular geometries are presented in this section. The following three sections present the effect of component geometry on weldability and the need to modify the experimental set-up and processing conditions to achieve sound welds.
3.3.1. Effect of Component Geometry on Weldability
Usually in the literature, welding of flat samples is performed [3,4,5,6,7,8,9,10,11,13,27,29,34,37,38,40,41,42,43,44], and in most cases the samples have large enough dimensions to dissipate heat. However, in many industrial processes and engineering components, the welding geometry is much more complex with respect to the flat-linear welds usually studied in literature [2]. In many cases, the transferability of the experimental results to the industrial processes is not possible [40].
In this case study, circular welding was performed, a ring was welded to a shaft. The welded samples represented the components of a HBU [2] and as shown below, the circularity effects became very important, restricting significantly the weldability of the alloys. Initially, weldable alloys may become non-weldable for circular welding and, therefore, complex experimental configurations should be addressed [2]. This is due to the different thermal cycle that circular geometries undergo with respect to flat samples and the crucial importance of thermal expansion when welding circular samples compared to flat ones. This is because upon welding circular coupons, components’ expansion accumulates throughout the process and is adding up/increasing through the process. When welding flat samples, the gap between the workpieces was kept at zero, which was not the case when circular welds were made (and a lot of compressive stresses between the two workpieces were necessary in order to keep the gap to zero).
The same material combinations (see Table 2) were welded as for the flat samples; however, this time a shaft and a ring component were used as samples. The samples and the welding fixtures were shown in Figure 3a,b. The shaft had a high carbon composition (such as 41Cr4 or SAE1055) and the ring had a low carbon composition (16MnCr5).
3.3.2. Conventional Laser Welding Trials
The welding results showed significant differences compared to the flat samples. The low mass of the ring led to over-expansion situations; and at a certain location from the starting point (225–360 °C) there was significant material losses at the top due to the deformation of the ring during the process [8], as shown Figure 10a,c. As shown in Figure 10b, for the case of similar welding (16MnCr5-16MnCr5), the welding cross section does not show any defects except for the material loss at the top, which was related to the over-expansion of the ring and gap introduction between the workpieces. Measurements of material loss were not taken as these welds were considered not to be acceptable in terms of quality. In Figure 10c,d, the weld profiles of 41Cr4-16MnCr5 material combination are shown.
For all the dissimilar steel types, large cracks and pores were identified, due to the high thermal stresses and high thermal expansion (coefficient) of the ring with respect to the shaft during the welding process. As the material types welded in the circular configuration were the same as in the linear welding case, the defects cannot be attributed to the interference of the laser process with the material types or to the weldability of the respective alloys, but are mainly due to the welding geometry. It is clarified, however, that in the case of linear welding the effect of the different thermal expansion coefficients of the respective alloys was not so pronounced and did not affect the welding results. For the case of the circular geometry, the weldability of the samples reduced significantly when welding dissimilar alloys in comparison to the 16MnCr5-16MnCr5 configuration. The higher thermal expansion of the ring with respect to the shaft led to the formation of shrinkage pores and solidification cracks in the weld. These defects are attributed to the different thermal expansion coefficients between the rather harder 41Cr4 steel (ring component) compared to the softer 16MnCr5 (shaft component) and the low thermal mass of the ring. Due to the small volume of the ring, the cooling cycle is expected to be slower; which is also discussed in more detail in the next section.
3.3.3. Modified Laser Welding Trials
The components, with a press fit configuration, had eight tack welds to maintain position. Specifically, the inner diameter of the ring was a little smaller (approximately 0.035 mm difference) and a press was used in order to fit the ring outside the shaft. Compressive stresses were induced in the gap between the ring and the shaft, preventing the opening of the gap during welding. Two material combinations were laser welded: 16MnCr5-41Cr4 and 41Cr4-41Cr4.
All the defects mentioned above, when welding dissimilar steel types (except for the presence of crater), were minimized by using the press fit configuration and eight tack strategy every 45° angle, prior to the laser weld.
An optimised ‘downslope’ strategy was applied to minimize the presence of the crater at the end of the weld. An overlap region which begins at the original end of the weld and covers a region of 55° was considered where the laser power and focus position were variable. In the overlap region, the power level decreased from 4 to 0kW and the focus position moved gradually 4 mm above the top surface. The crater and weld profile at the crater area were improved considerably as shown in Figure 11a,b. The weld profile was significantly improved, the material loss at the top was minimized and the presence of cracks was substantially decreased. The density of cracks and pores was considerably decreased in the modified experiments in comparison to Figure 10. Only some micro-cracks and pores were observed, which, with further optimisations, could be eliminated.
Welding of similar types of materials, a high carbon 41Cr4 to a high carbon 41Cr4, was performed for the press fit configuration, and it revealed significant differences with respect to the dissimilar welds, in terms of microstructural defects. No cracks and a much smaller amount of porosity were found in the resulting similar welds, suggesting that the differences in the thermal expansion coefficient between the two material types to be welded together led to over-expanding situations for the ring, resulting in overstressing situations after joining and subsequent cracking.
Dissimilar laser welding of 16MnCr5 to SAE1055 and SAE1070 always resulted in large macroscopic cracks. So only the dissimilar joints between 41CrMn5 to 41Cr4 were considered successful.
3.4. Comparison between Flat and Circular Geometries: The Effect of Component Geometry on Cooling Rate
The effect of the specimen’s thickness on the cooling time is shown in Figure 12. There is an increase from 6.5 to 8.5 s between the thick and thin samples. As the samples are thicker, more material is at the neighbourhood of the weld, increasing the corresponding cooling rate. In Figure 13a, the effect of the preheating on the cooling rate may be seen. By applying a preheating of 110–120° C, the cooling rate decreased: The cooling time Δt700–300 in both cases (16MnCr5 & SAE1070) increased from an average of 8.5 to 11 s. Moreover, another effect is also shown: For the non-preheated samples the higher the peak temperature the higher the cooling time Δt700–300; while for the preheated samples, the higher the peak temperature, the lower the cooling time Δt700–300. This may be due to the fact that by applying preheating, the temperatures upon welding are normalized and the thermal gradients in the weld region become less steep. Figure 13b shows the effect of the material type on the cooling time Δt700–300. Both the preheated samples and non-preheated Δt700–300 were smaller at the 16MnCr5 side. Specifically, for the non-preheated situations, Δt700–300 for the 16MnCr5 side had an average of 8.7 s and for the SAE1070 7.9 s, while for the preheated situations, Δt700–300 for the 16MnCr5 side had an average of 11.5 s and 9.8 s for the 1070.
Figure 14a shows the overheating that occurs in the ring during laser welding. It can be seen in Figure 14b that the ring and the shaft have totally different thermal profiles during the process which restricts their weldability. While in the case of the shaft, the closer the thermocouple was attached to the weld pool, the lower the cooling rate, which is in agreement with previous results; for the case of the ring, the location of the ring did not play any role in its thermal profile. Most thermocouples exhibited the same cooling curve-this was verified in more than five experiments [8]. It seems that the small sample dimensions lead to a uniform cooling rate throughout the geometry of the whole sample.
4. Discussion
4.1. Process Stability & Metallurgical Investigation for the Flat Samples
The stability of the process was found to be independent of the material type for the materials considered. The visual quality of the welds at the top and bottom was found to be the best when welding with full power (4 kW) and a speed of 17.5–22.5 mm/s for the thin samples. Similar results were found for the thick samples welded with a 6 kW CO2 laser, while with the fiber laser the welds were irregular for all the conditions, with a lot of material loss at the top.
Porosity was observed for all the welding experiments. The amount of porosity was decreased by increasing the stability of the process and using high welding speeds for the stable welding conditions. Pores become dangerous when they are close together and a network is built, while cracks are always unacceptable, independent of their size, as they act as stress concentrators and are susceptible to growth upon cyclic loading [2].
The hardness profile was independent of the process parameters within the range investigated and was mainly dependent on material type and combination. There was also an effect of the sample thickness on the resulting hardness profiles. The 8 mm thick welds showed reduced hardness compared to the 5 mm thick welds. This may be due to the fact that the thermal stresses were somewhat smaller (smaller weld size), leading to the formation of less hard microstructures. The hardness in the weld region was found to be increased by a factor of two or even more compared to the base material. For the similar welds, the hardness showed a plateau type of profile, while for the dissimilar welds, the hardness increased monotonically from the low carbon side to the high carbon side, reaching the highest value in the HAZ region of the ‘harder’ material side. The hardness profile was also related to the microstructures observed using an SEM. In the HAZ of the high carbon side, pearlitic microstructures were revealed. This region was indicated to be the most brittle part in the weld. SEM investigation revealed the presence of bainite or martensite in the fusion zone depending on the carbon content (mainly). Increasing the carbon content from 0.59 to 0.69 led to the formation of martensite (instead of bainite) in the fusion zone. The formation and growth of carbides in the fusion zone was prevented by the high cooling rates during laser processing, minimizing their presence. In the HAZ of the lower carbon side, bainitic and martensitic microstructures were observed in all cases.
The SAE1070 series showed decreased weldability. Even when using an 8 kW fiber laser and comparatively high welding speeds to decrease the amount of thermal stresses, cracks were still observed. For all the other materials, no cracks were found.
4.2. Laser Welding Circular Geometries
A press fit configuration and an eight tack strategy was employed. Specifically, the inner diameter of the ring was a little smaller (approximately 0.035 mm difference). Compressive stresses were induced in the gap between the ring and the shaft, preventing the opening of the gap during welding. Eight tack welds were made prior to the laser weld to prevent the over-expansion of the ring and the creation of large macroscopic cracks.
All the defects mentioned above when welding dissimilar steel types (except for the presence of crater) were minimized by using the press fit configuration and the eight tack strategy. The weld profile was significantly improved, the material loss at the top was minimized and the presence of cracks was substantially decreased. Furthermore, the density of cracks and pores was considerably decreased as shown in Figure 11.
A ‘downslope’ strategy was applied to minimize the presence of the crater at the end of the weld, with a 55° angle, decreasing the power level from 4 to 0 kW and moving the focus position from 0 to 4 mm above the surface of the ring-shaft surface. The resulting weld top profile and cross section were improved significantly. As shown in Figure 11, the effect of the downslope strategy on the crater profile is prominent.
4.3. Temperature Distributions and CCT Diagrams upon Laser Welding
The cooling rate was found to be dependent on the material type. This may be due to two reasons. On the high carbon side, the cooling rate was found to be slower probably due to the differences in the physical properties as well as in the phase transformations that occur in the respective regions.
The values for the physical properties depend both on the chemical composition and temperature [45]. The differences in the thermal conductivity in the different alloys may lead to differences in the cooling rates during laser welding.
In the HAZ of the high carbon side, pearlite formed which generates a certain amount of heat (heat that needs to be extracted in order for the phase transformation to take place; reducing the overall cooling rate). While at the HAZ of the low carbon side, bainitic and martensitic microstructures were observed which generate less heat compared to pearlite, as non-equilibrium phases produce less heat upon their formation [41,42,43]. For pearlite formation, the latent heat is of the order of 50.000 J/kg and 14.000 J/kg for martensite formation [45]. In some cases, overheating effects due to the phase transformations (pearlite formation on the high carbon side) were observed—such a sudden increase in temperature due to the release of latent heat transformation (recalescence effect, proportional to the Gibbs free energy difference between the two phases) [41,42,43].
The most pronounced dependence on the cooling parameter Δt700–300 was found to be of the component geometry. Specifically, the cooling parameter Δt700–300 varied from 3.9 to 10.2, with the resulting cooling rate varying between 102.5 to 39.2 °C/s, which is of great importance in terms of resulting stress and distortion. In Figure 14, it was shown that the ring and the shaft have totally different thermal profiles during the process, which restricts their weldability. While in the case of the shaft, the closer the thermocouple was attached to the weld pool, the lower the cooling rate, which is in agreement with previous results; for the case of the ring, the location of the thermocouple did not play any role in its thermal profile. Most thermocouples exhibited the same cooling curve—this was verified in more than five experiments [2]. It seems that the low sample dimensions led to a uniform cooling rate throughout the geometry of the whole sample.
5. Conclusions
The following conclusions were drawn from this work:
- ▪
- In all welds mixing occurred, as shown from the hardness profiles.
- ▪
- The hardness profile had a step-like profile, increasing through the HAZ of the low carbon side to a moderate hardness inside the weld pool, while the highest hardness occurred in the HAZ of the higher carbon side.
- ▪
- Bainitic and martensitic microstructures were revealed in the weld region depending on the material combination.
- ▪
- In the HAZ of the medium or high carbon side pearlitic microstructures were obtained, whilst in the HAZ of the low carbon side martensitic microstructures were revealed.
- ▪
- Cracks formed only for the 16MnCr5-1070 material combination due to the high carbon content. Fracture occurred in all of the samples in the HAZ of the 1070 side when welded with the Nd:YAG laser, 20–40 mins after welding. Smaller cracks were found for the same material combination welded with the fiber laser due to the minimization of the thermal stresses, and several cracks were also found inside the weld region.
- ▪
- For all the welding systems, Nd:YAG, CO2 and fiber laser, an increase in the welding speed within the stable conditions resulted in a decrease in the number of pores found inside the weld.
- ▪
- The welds for the circular geometry showed quite different results compared to the flat samples. For the same material combinations, the quality of the welds was much worse compared to the welds made on the flat samples under nominally identical conditions. Increased porosity was obtained and the amount of cracking was remarkable, while at the top, significant material loss occurred.
- ▪
- Thermocouple measurements were obtained both for the flat samples and circular geometry.
- ▪
- The existence of specific microstructures was verified by neural network-simulated CCT diagrams.
Author Contributions
P.E. conceived and designed the experiments and modeling concepts. P.E. performed the testing. PE and K.N. analysed the data. P.E. and K.N. wrote the paper.
Funding
This research received no external funding.
Acknowledgments
P.E. would like to thank Ian Richardson, Jeroen Olde Benneker and John Van de Sanden for all the guidance and support given throughout this research work.
Conflicts of Interest
The authors declare no conflict of interest.
References
- Efthymiadis, P. Laser Welding of high Carbon Steels. Literature Review; Delft University of Technology: Delft, The Netherlands, 2006. [Google Scholar]
- Efthymiadis, P. Laser Welding High Carbon Steels. Master’s Thesis, Delft University of Technology, Delft, The Netherlands, 26 October 2007. [Google Scholar]
- Fotovvati, B.; Wayne, S.F.; Lewis, G.; Asadi, E. A review on melt-pool characteristics in laser welding of metals. Adv. Mater. Sci. Eng. 2018, 2018, 1–18. [Google Scholar] [CrossRef]
- Ng, E.S.; Watson, I. Post-Heat Treatment of Nd:YAG Laser Welded High Carbon Steels. In Proceedings of the International Conference on Applications of Lasers and Electro-Optics (ICALEO ’97), San Diego, CA, USA; 1997; pp. 238–247. [Google Scholar]
- Ng, E.S.; Watson, I.A. Characteristics of CO2 laser welded high carbon steel gauge plate. J. Laser Appl. 1997, 9, 15–21. [Google Scholar] [CrossRef]
- Ng, E.S.; Watson, I.A. Characterization of CO2 and diode laser welding of high carbon steels. Laser Appl. 1999, 11, 273–278. [Google Scholar] [CrossRef]
- Svenungsson, J.; Choquet, I.; Kaplan, A.F.H. Laser welding process-a review of keyhole welding modelling. Phys. Procedia 2015, 78, 182–191. [Google Scholar] [CrossRef]
- Xie, J. Dual beam laser welding. Weld. J. 2002, 81, 223–230. [Google Scholar]
- Elmer, J.; Palmer, T.; DebRoy, T. In-situ observations of phase transformations during welding of 1045 steel using spatially resolved and time resolved X-ray diffraction. In Modelling of Casting, Welding and Advanced Solidification Processes XI; Lawrence Livermore National Lab. (LLNL): Livermore, CA, USA, 2005. [Google Scholar]
- Paleocrassas, A.G. Feasibility Investigation of Laser Welding Aluminum Alloy 7075-T6 Through the Use of a 300 W, Single-Mode, Ytterbium Fiber Optic Laser. Master’s Thesis, NC State University, Raleigh, NC, USA, 7 August 2005. [Google Scholar]
- Matsuda, F.; Wu Shyuan, L. Cooling time parameter and hardenability estimation of HAZ in welding of medium, high carbon machine structural steels: Toughness improvement of the HAZ for machine structural carbon and low alloy steels. Trans. JWRI 1990, 19, 207–214. [Google Scholar]
- Bhadeshia, H.K.D.H. Neural networks in materials science. ISIJ Int. 1999, 39, 966–979. [Google Scholar] [CrossRef]
- Casalino, G.; Minutolo, F.M.C. A model for evaluation of laser welding efficiency and quality using an artificial neural network and fuzzy logic. Proc. Inst. Mech. Eng. B: J. Eng. Manuf. 2004, 218, 641–646. [Google Scholar] [CrossRef]
- De, A.; DebRoy, T. Improving reliability of heat and fluid flow calculation during conduction mode laser spot welding by multivariable optimisation. Sci. Technol. Weld. Join. 2006, 11, 143–153. [Google Scholar] [CrossRef]
- Ki, H.; Mazumder, J.; Mohanty, P.S. Modeling of laser keyhole welding: Part I. mathematical modeling, numerical methodology, role of recoil pressure, multiple reflections, and free surface evolution. Metall. Mater. Trans. A 2002, 33, 1817–1830. [Google Scholar] [CrossRef]
- Ki, H.; Mazumder, J.; Mohanty, P.S. Modeling of laser keyhole welding: Part II. simulation of keyhole evolution, velocity, temperature profile, and experimental verification. Metall. Mater. Trans. A 2002, 33, 1831–1842. [Google Scholar] [CrossRef]
- Otto, A.; Koch, H.; Vazquez, R.G. Multiphysical simulation of laser material processing. Physics Procedia 2012, 39, 843–852. [Google Scholar] [CrossRef]
- Rai, R.; Elmer, J.W.; Palmer, T.A.; DebRoy, T. Heat transfer and fluid flow during keyhole mode laser welding of tantalum, Ti-6Al-4V, 304L stainless steel and vanadium. J. Phys. D Appl. Phys. 2007, 40, 5753. [Google Scholar] [CrossRef]
- Rai, R.; Roy, G.G.; DebRoy, T. A computationally efficient model of convective heat transfer and solidification characteristics during keyhole mode laser welding. J. Appl. Phys. 2007, 101, 054909. [Google Scholar] [CrossRef]
- Ribic, B.; Palmer, T.A.; DebRoy, T. Problems and issues in laser-arc hybrid welding. Int. Mater. Rev. 2009, 54, 223–244. [Google Scholar] [CrossRef]
- Wenda, T.; Neil, S.B.; Yung, C.S. Investigation of keyhole plume and molten pool based on a three-dimensional dynamic model with sharp interface formulation. J. Phys. D Appl. Phys. 2013, 46, 055501. [Google Scholar]
- Xu, G.X.; Wu, C.S.; Qin, G.L.; Wang, X.Y.; Lin, S.Y. Adaptive volumetric heat source models for laser beam and laser + pulsed GMAW hybrid welding processes. Int. J. Adv. Manuf. Technol. 2011, 57, 245–255. [Google Scholar] [CrossRef]
- Zhou, J.; Tsai, H.L. Modeling of transport phenomena in hybrid laser-MIG keyhole welding. Int. J. Heat Mass Transf. 2008, 51, 4353–4366. [Google Scholar] [CrossRef]
- Hafez, K.M.; Katayama, S. Fiber laser welding of AISI 304 stainless steel plates. Q. J. Jpn. Weld. Soc. 2009, 27, 69s–73s. [Google Scholar] [CrossRef]
- Hussain, A.; Hamdani, A.H.; Akhter, R. CO2 laser welding of AISI 321stainless steel. IOP Conf. Ser. Mater. Sci. Eng. 2014, 60, 012042. [Google Scholar] [CrossRef]
- Rémy, F.; Frédéric, C.; Dominique, G.; Mathieu, K. Study of CW Nd-Yag laser welding of Zn-coated steel sheets. J. Phys. D Appl. Phys. 2006, 39, 401. [Google Scholar]
- Vision for Welding Industry, American Welding Society. Available online: https://www.aws.org/resources/detail/vision-for-welding-industry (accessed on 29 August 2018).
- Besnea, D.; Dontu, O.; Avram, M.; Spânu, A.; Rizescu, C.; Pascu, T. Study on laser welding of stainless steel/copper dissimilar materials. IOP Conf. Ser. Mater. Sci. Eng. 2016, 147, 012047. [Google Scholar] [CrossRef] [Green Version]
- Casalino, G.; Angelastro, A.; Perulli, P.; Casavola, C.; Moramarco, V. Study on the fiber laser/TIG weldability of AISI 304 and AISI 410 dissimilar weld. J. Manuf. Process. 2018, 35, 216–225. [Google Scholar] [CrossRef]
- Lahdo, R.; Springer, A.; Meier, O.; Kaierle, S.; Overmeyer, L. Investigations on laser welding of dissimilar joints of steel and aluminum using a high-power diode laser. J. Laser Appl. 2018, 30, 032422. [Google Scholar] [CrossRef]
- Meco, S.; Pardal, G.; Ganguly, S.; Williams, S.; McPherson, N. Application of laser in seam welding of dissimilar steel to aluminium joints for thick structural components. Opt. Lasers Eng. 2015, 67, 22–30. [Google Scholar] [CrossRef] [Green Version]
- Zeng, Z.; Panton, B.; Oliveira, J.P.; Han, A.; Zhou, Y.N. Dissimilar laser welding of NiTi shape memory alloy and copper. Smart Mater. Struct. 2015, 24, 125036. [Google Scholar] [CrossRef]
- Ashby, M.F. Materials selection in mechanical design. MRS Bull. 2005, 30, 995. [Google Scholar] [CrossRef]
- Mujica, L.; Weber, S.; Pinto, H.; Thomy, C.; Vollertsen, F. Microstructure and mechanical properties of laser-welded joints of TWIP and TRIP steels. Mater. Sci. Eng. A 2010, 527, 2071–2078. [Google Scholar] [CrossRef]
- Van der Wolk, P.J. Modelling CCT-Diagrams for Engineering Steels under Neural Networks; Delft University Press: Delft, The Netherlands, 2001. [Google Scholar]
- Wolk, P.W.; Wang, J.; Sietsma, J.; Zwaag, S.Z. Modelling the continuous cooling transformation diagram of engineering steels using neural networks. Z. Metall. 2002, 93, 1199–1207. [Google Scholar] [CrossRef]
- Dimitriu, R.C.; Bhadeshia, H.K.D.H. Fatigue crack growth rate model for metallic alloys. Mater. Des. 2010, 31, 2134–2139. [Google Scholar] [CrossRef] [Green Version]
- Casalino, G.; Hu, S.J.; Hou, W. Deformation prediction and quality evaluation of the gas metal arc welding butt weld. Proc. Inst. Mech. Eng. B J. Eng. Manuf. 2003, 217, 1615–1622. [Google Scholar] [CrossRef]
- Bhadeshia, H.K.D.D. Bainite in Steels, 5th ed.; IOM Communications: London, UK, 1992. [Google Scholar]
- Bayraktar, E.; Hugele, D.; Jansen, J.P.; Kaplan, D. Evaluation of pipeline laser girth weld properties by Charpy (V) toughness and impact tensile tests. J. Mater. Process. Technol. 2004, 147, 155–162. [Google Scholar] [CrossRef]
- Han, H.N.; Lee, J.K.; Kim, H.J.; Jin, Y.-S. A model for deformation, temperature and phase transformation behavior of steels on run-out table in hot strip mill. J. Mater. Process. Technol. 2002, 128, 216–225. [Google Scholar] [CrossRef]
- Lee, K.J.; Han, H.N. Analysis of heat transfer during cooling of plain carbon steels. Scr. Mater. 1999, 40, 683–689. [Google Scholar] [CrossRef]
- Lee, K.J. Characteristics of heat generation during transformation in carbon steels. Scr. Mater. 1999, 40, 735–742. [Google Scholar] [CrossRef]
- Lee, W.H.; Shiue, R.K.; Chen, C. Mechanical properties of modified 9Cr-1Mo steel welds with notches. Mater. Sci. Eng. A 2003, 356, 153–161. [Google Scholar] [CrossRef]
- ASM International. Properties and Selection: Iron, Steels, and High Performance Alloys; ASM International: Geauga County, OH, USA, 1990. [Google Scholar]
Figure 1.
Hub Bearing Units (HBU) in the automotive industry; (a) the location of a HBU with respect to the vehicle wheel and suspension; (b) a cross section of the HBU showing the bearing component and the rivet holding all units together.
Figure 1.
Hub Bearing Units (HBU) in the automotive industry; (a) the location of a HBU with respect to the vehicle wheel and suspension; (b) a cross section of the HBU showing the bearing component and the rivet holding all units together.
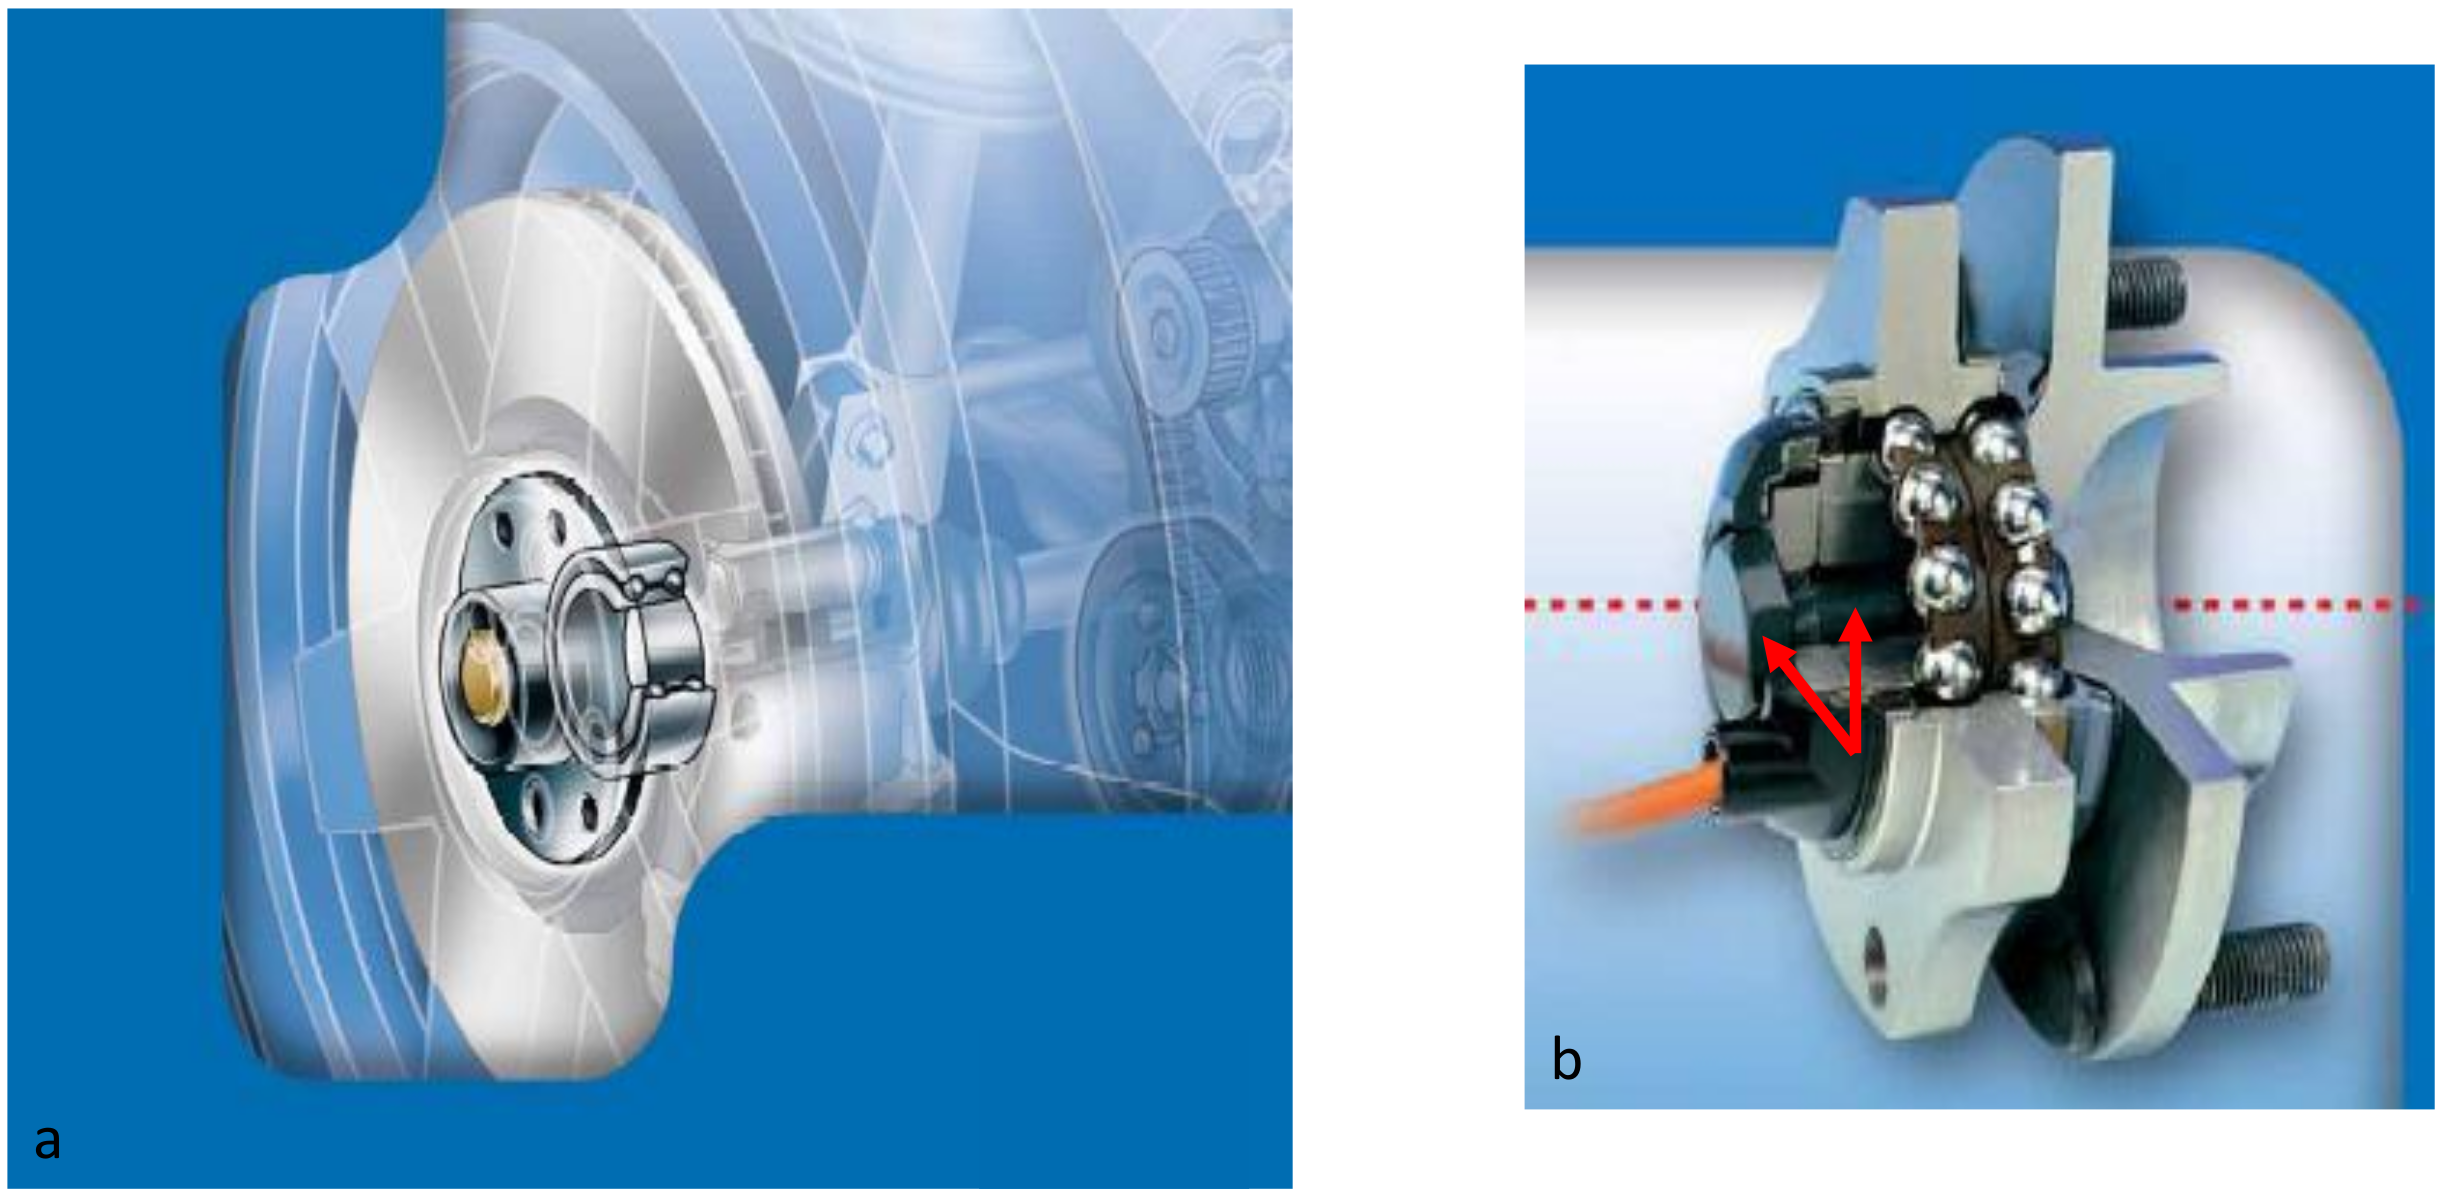
Figure 2.
Optical microscopy images for the following alloys: (a) 16MnCr5, (b) 41Cr4, (c) 42CrMo4, (d) SAE1055 and (e) SAE1070.
Figure 2.
Optical microscopy images for the following alloys: (a) 16MnCr5, (b) 41Cr4, (c) 42CrMo4, (d) SAE1055 and (e) SAE1070.
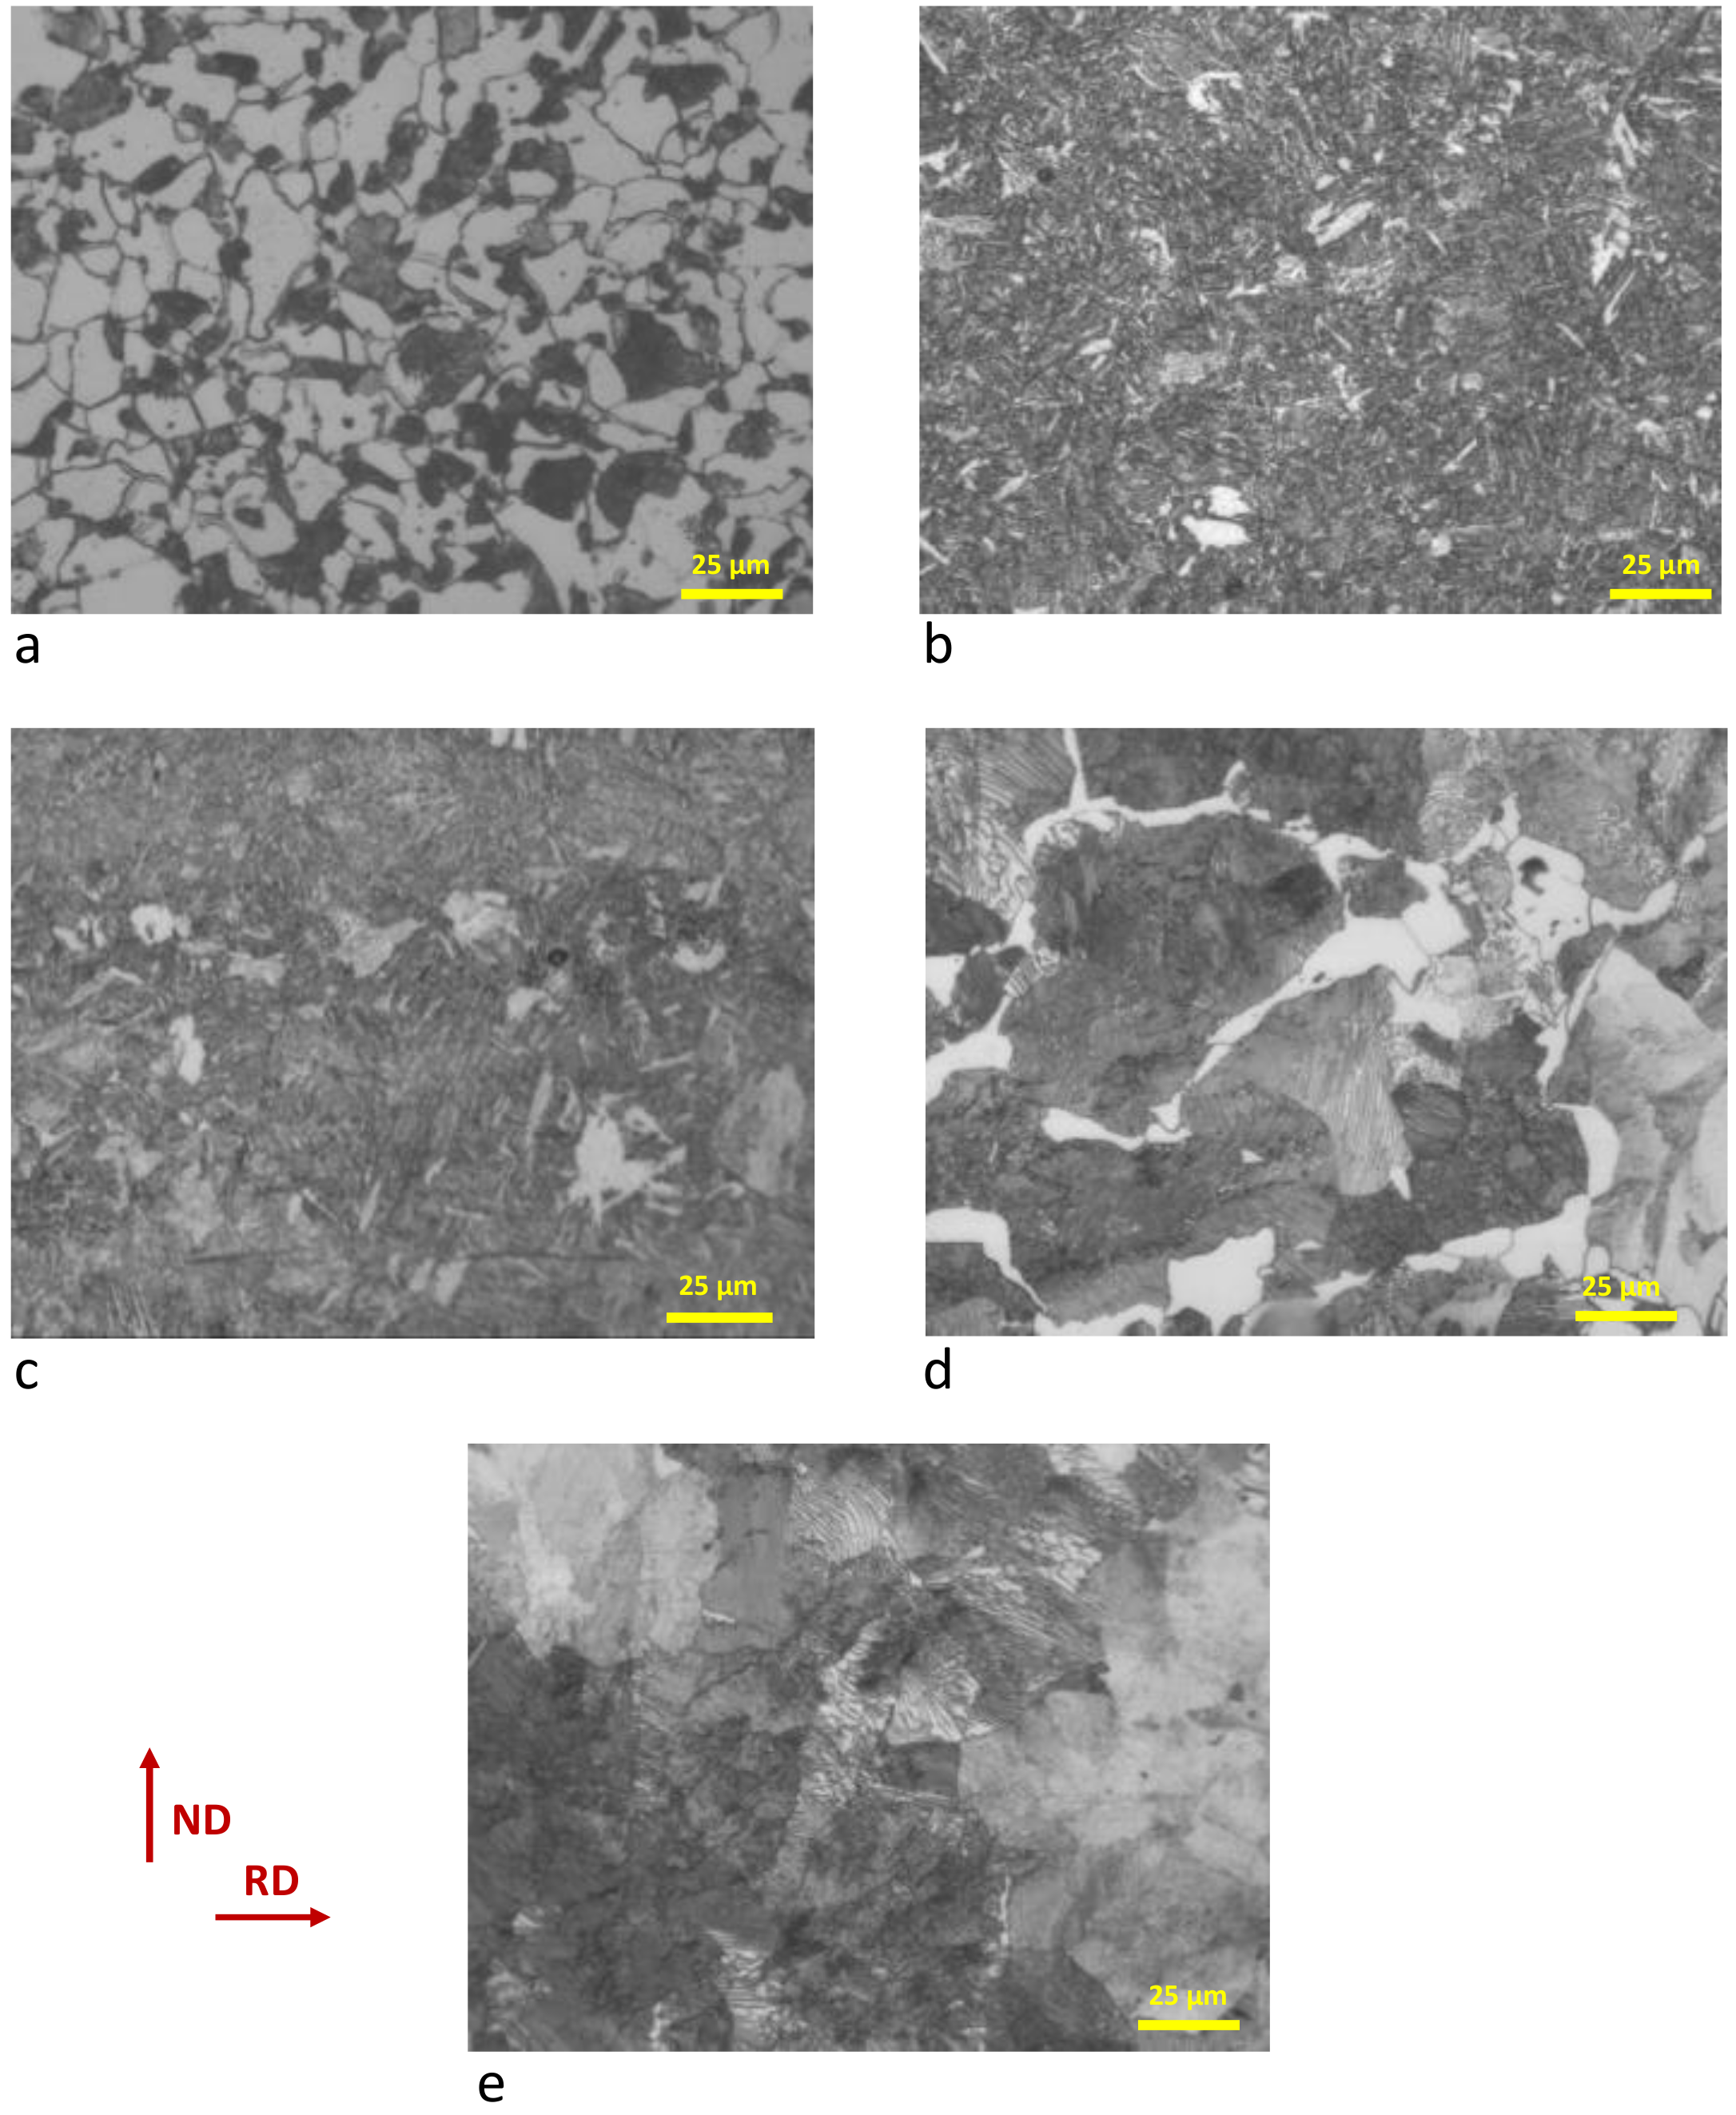
Figure 3.
(a)–(b) Experimental set-up for the laser welding trials for the flat and circular samples, (c)–(d) position of the thermocouples was 2, 2.5 and 3 mm with an in-between spacing between measurements of 15 mm.
Figure 3.
(a)–(b) Experimental set-up for the laser welding trials for the flat and circular samples, (c)–(d) position of the thermocouples was 2, 2.5 and 3 mm with an in-between spacing between measurements of 15 mm.
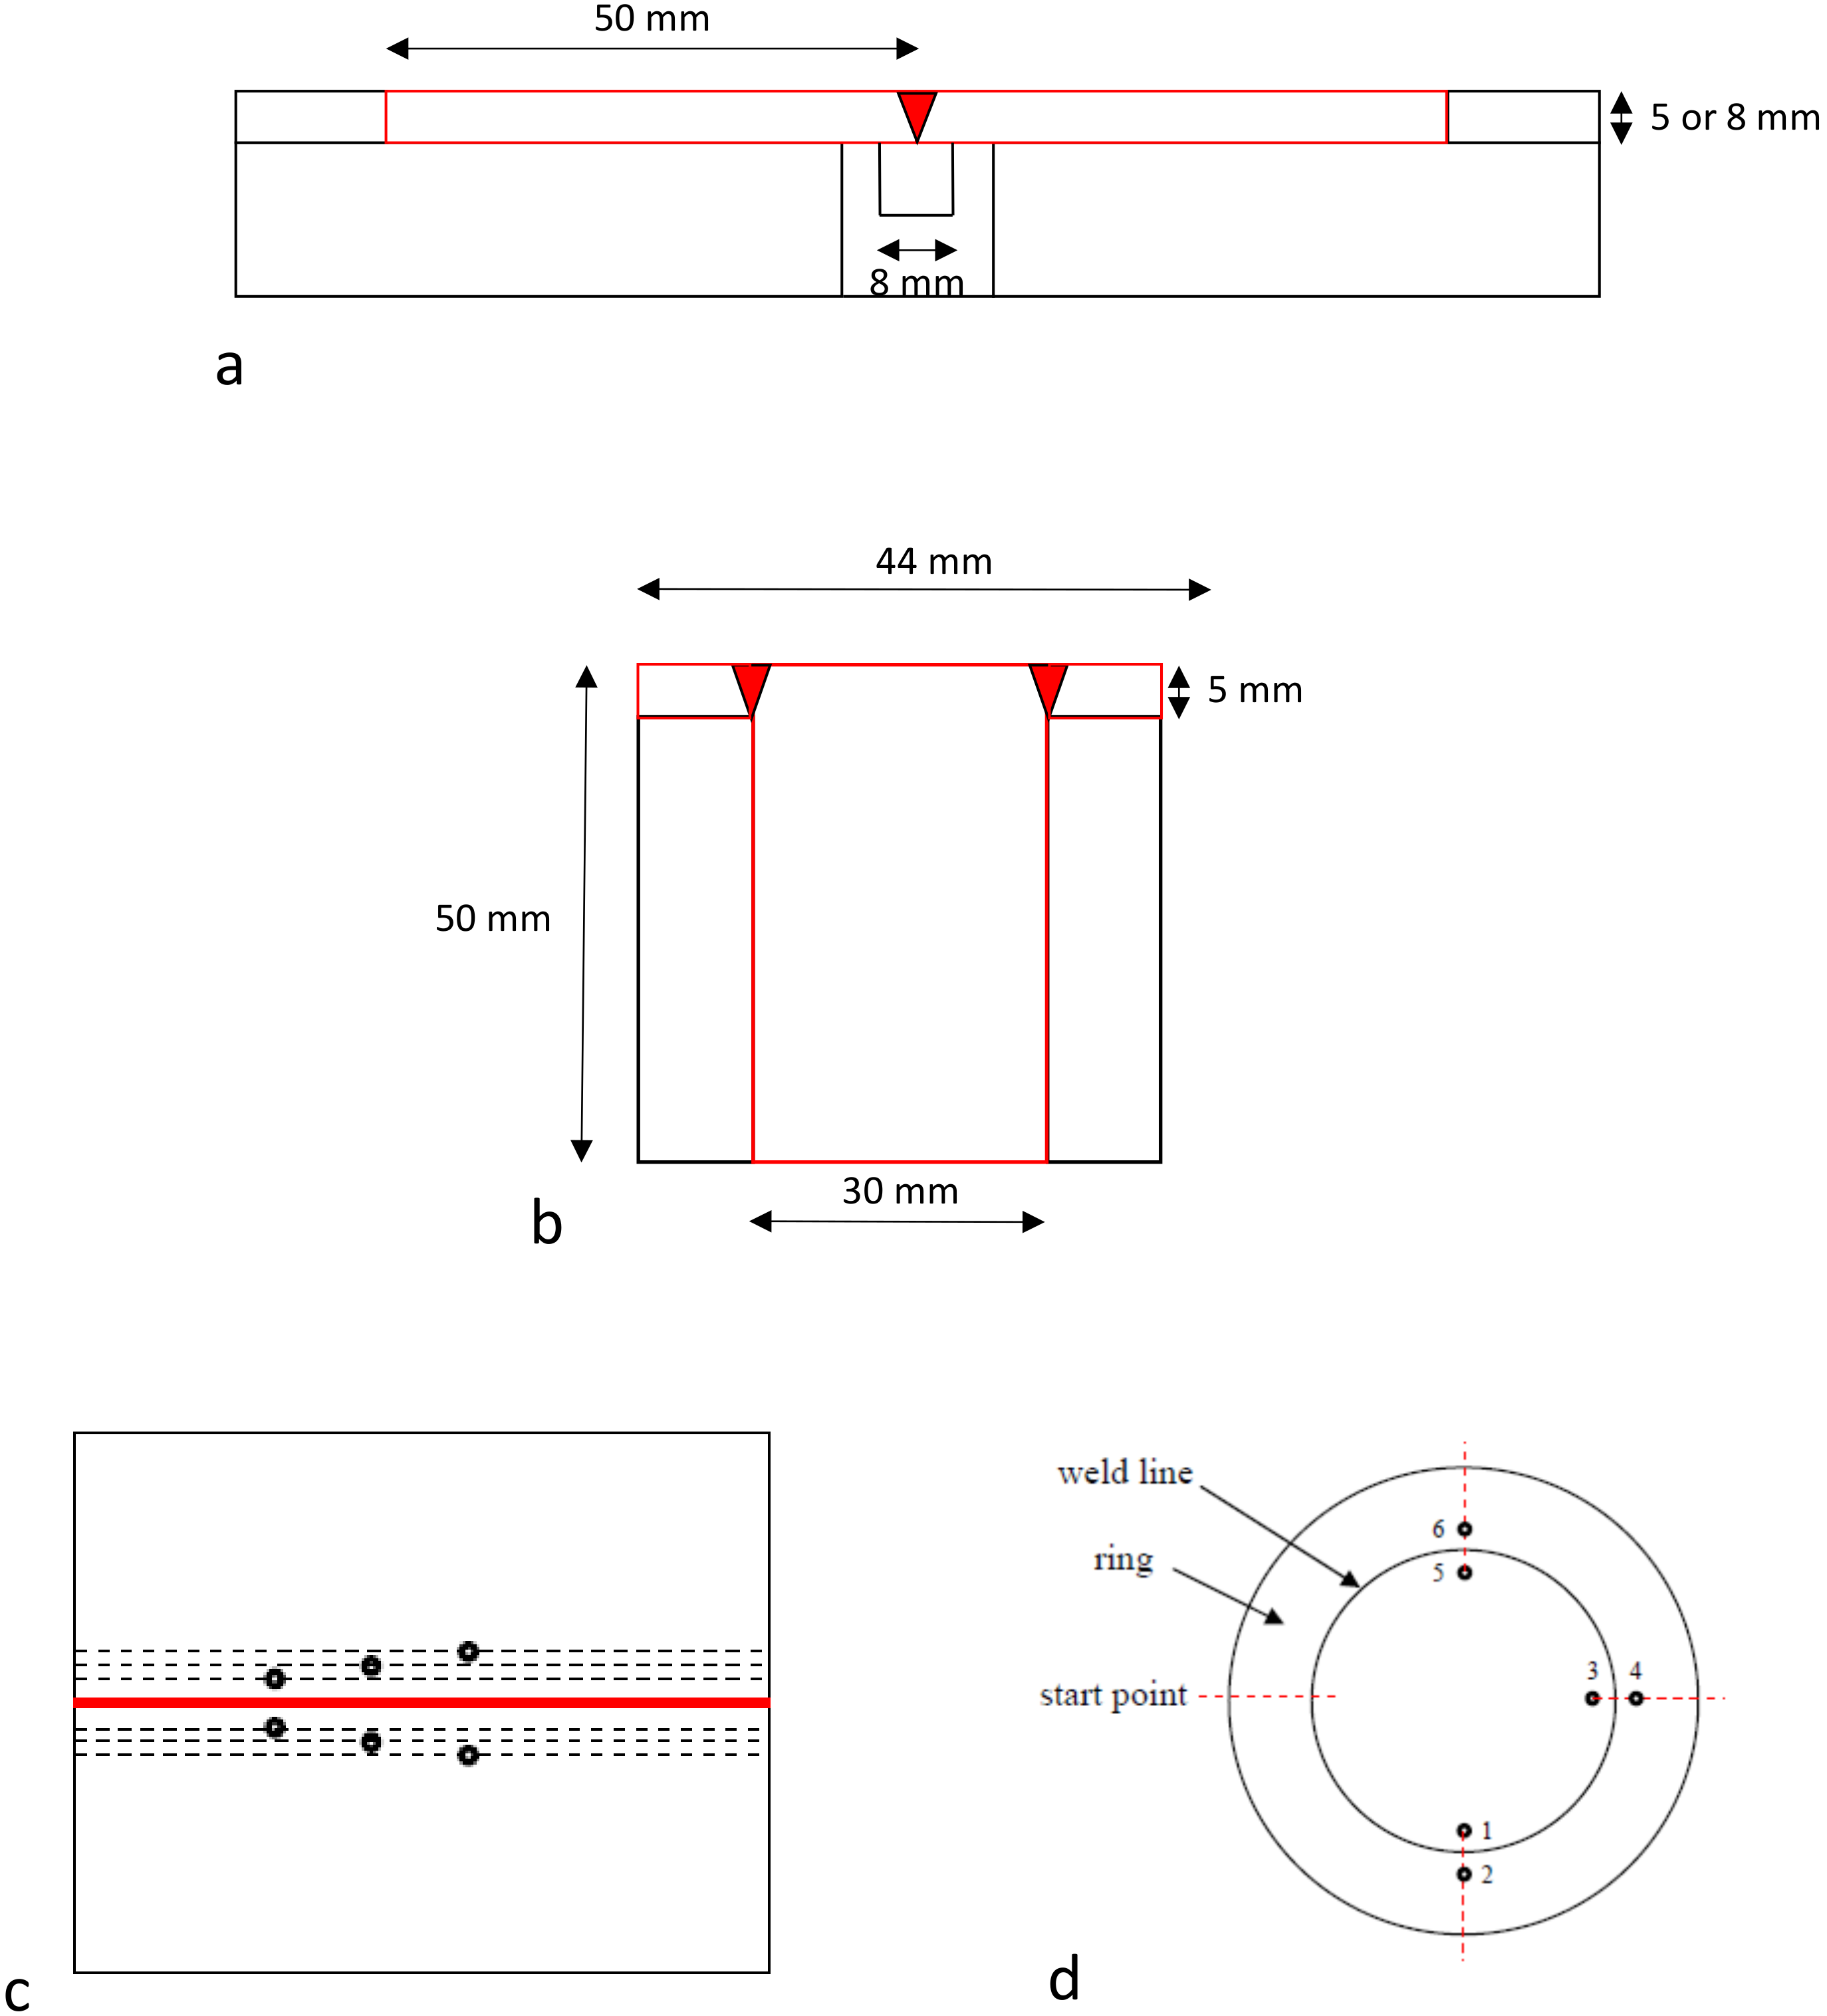
Figure 4.
(a) Schematic representation of the weld profiles for similar welding 16CrMn4 for the following conditions: (a) low, (b) average and high laser welding speed; (b) influence of welding speed on the size of the three characteristic weld zones: fusion zone, HAZ and root pass length.
Figure 4.
(a) Schematic representation of the weld profiles for similar welding 16CrMn4 for the following conditions: (a) low, (b) average and high laser welding speed; (b) influence of welding speed on the size of the three characteristic weld zones: fusion zone, HAZ and root pass length.
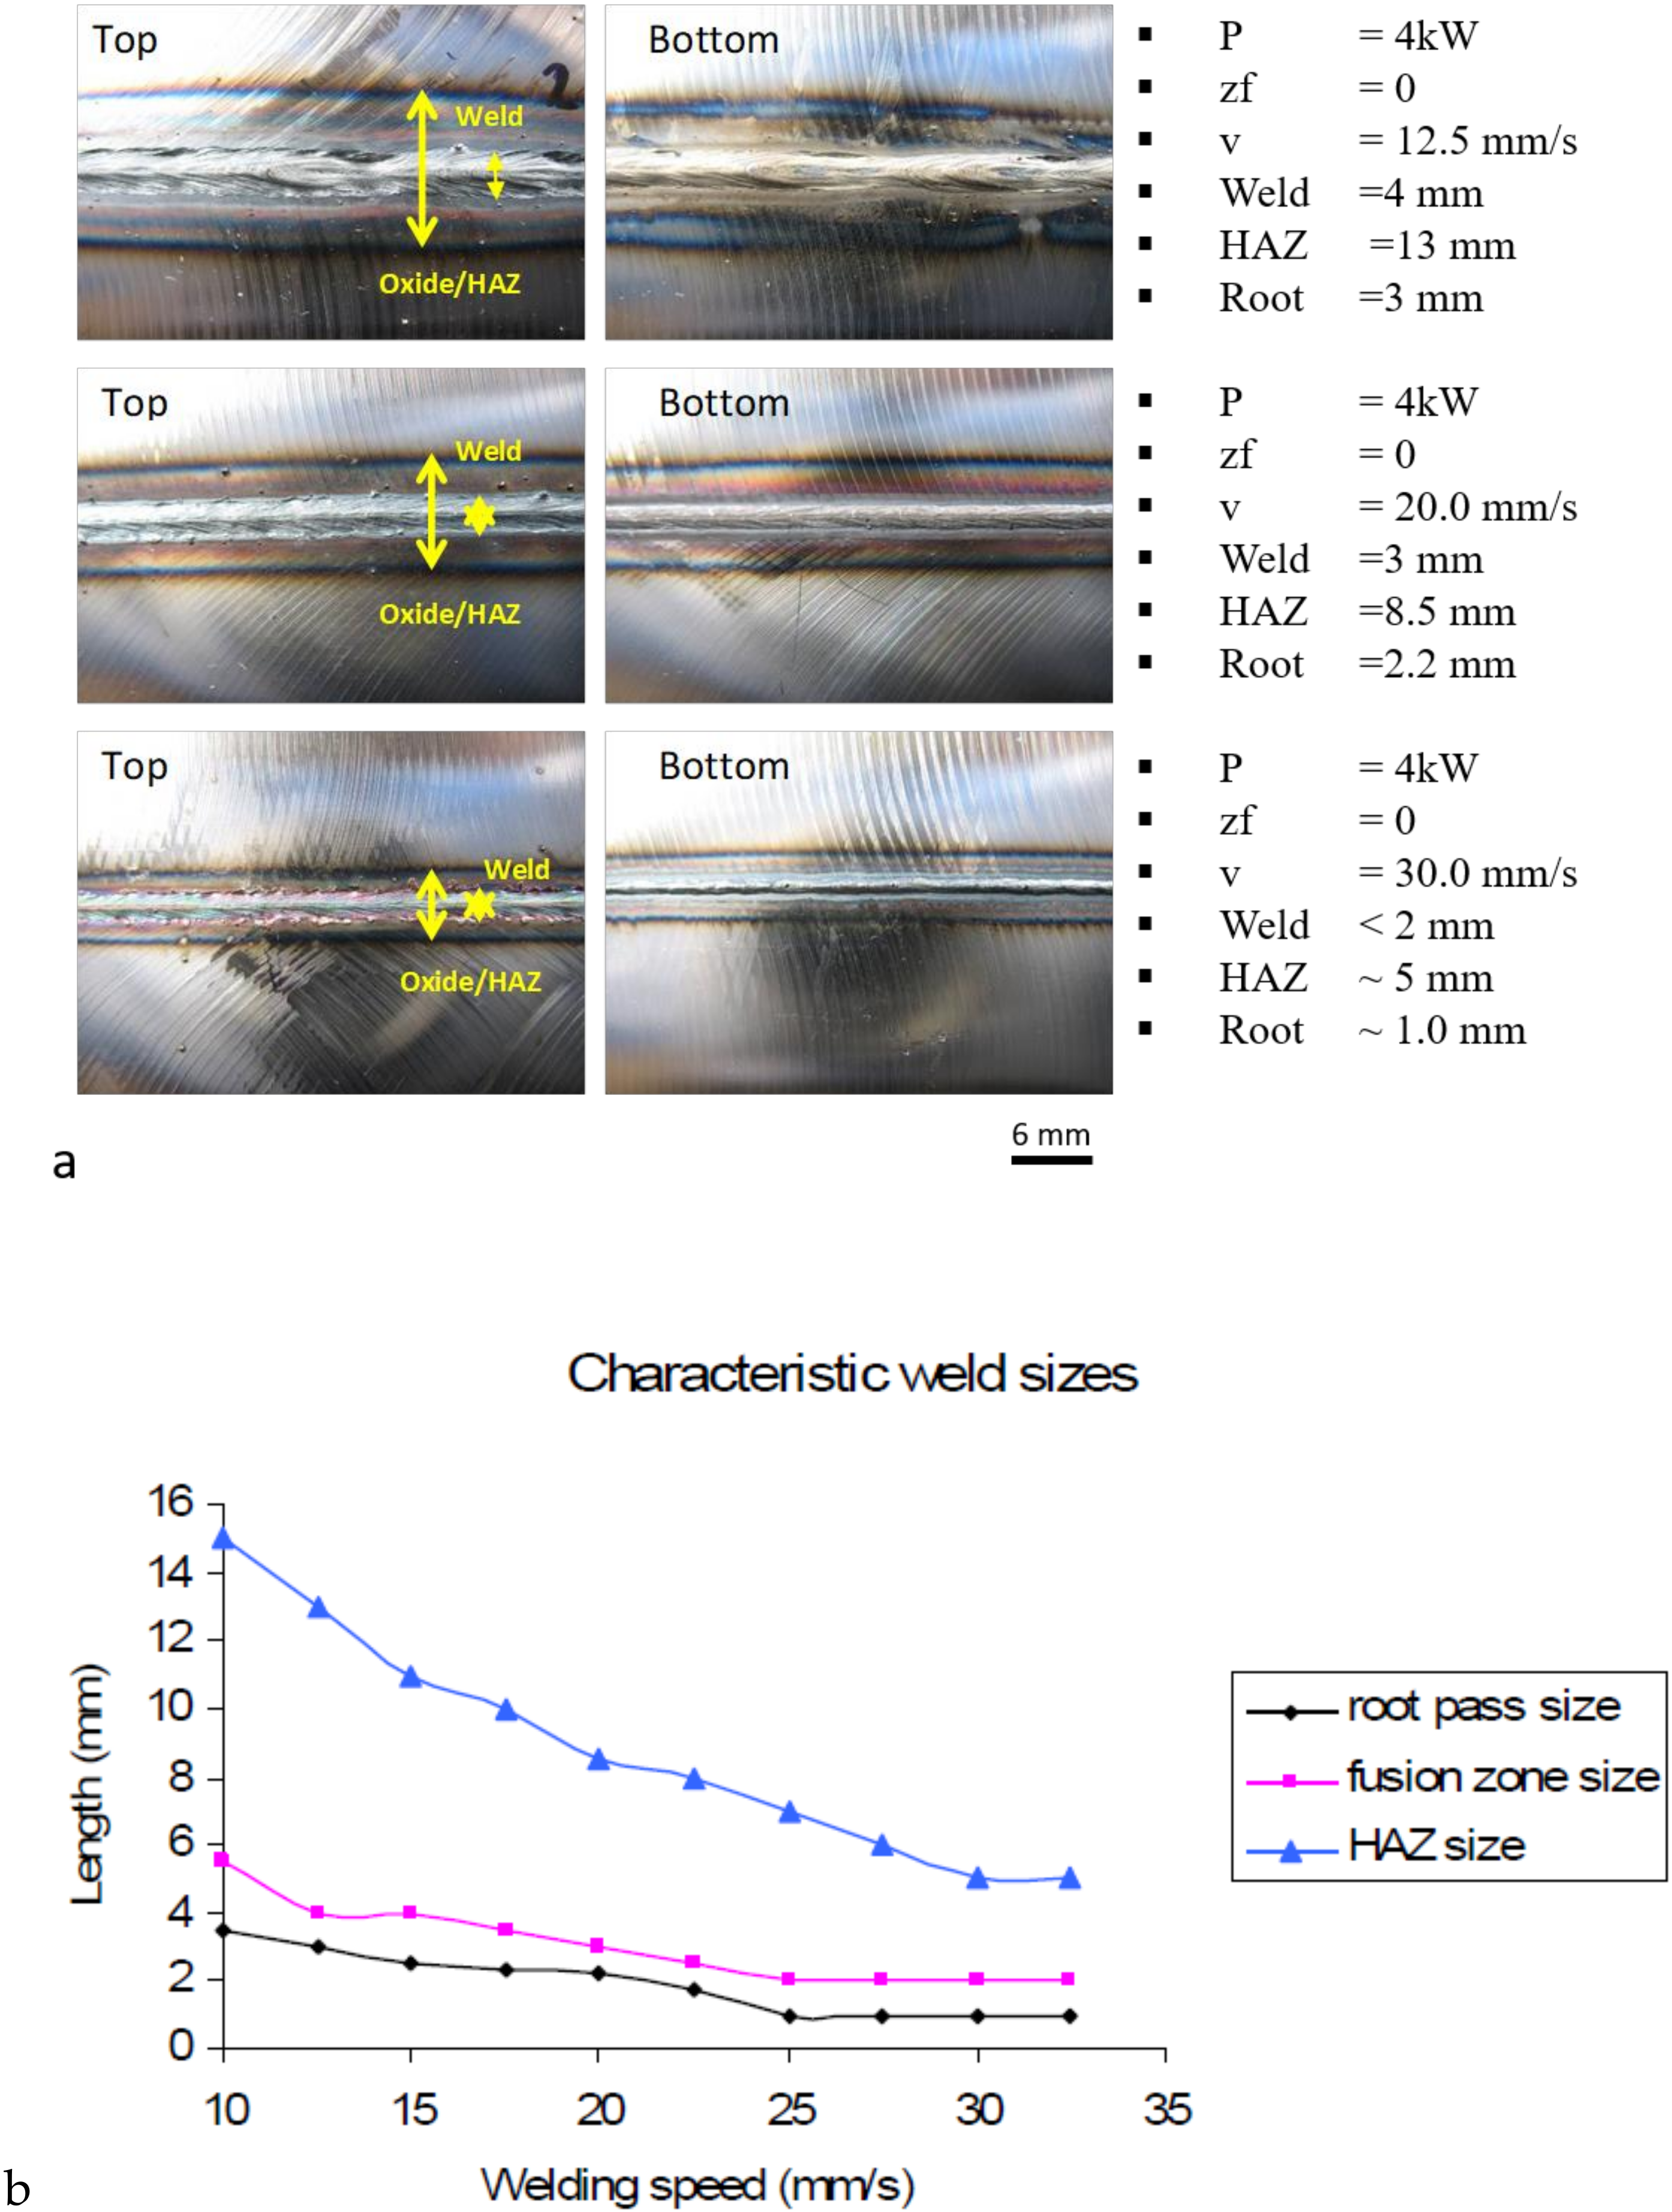
Figure 5.
Cross section of laser welded samples for the indicated material combinations and the following laser systems and sample thicknesses: (a–b) 4 kW Nd:YAG laser and 5 mm sample thickness, (c–d) 6 kW CO2 laser and 8 kW fiber laser system with 8 mm sample thickness. The presence of pores is highlighted in the arrowed regions within the welds.

Figure 6.
SEM micrographs within the HAZ and centerline of the welded regions for the following material combinations: (a) 16MnCr5-1055 and (b) 16MnCr5-1070.
Figure 6.
SEM micrographs within the HAZ and centerline of the welded regions for the following material combinations: (a) 16MnCr5-1055 and (b) 16MnCr5-1070.
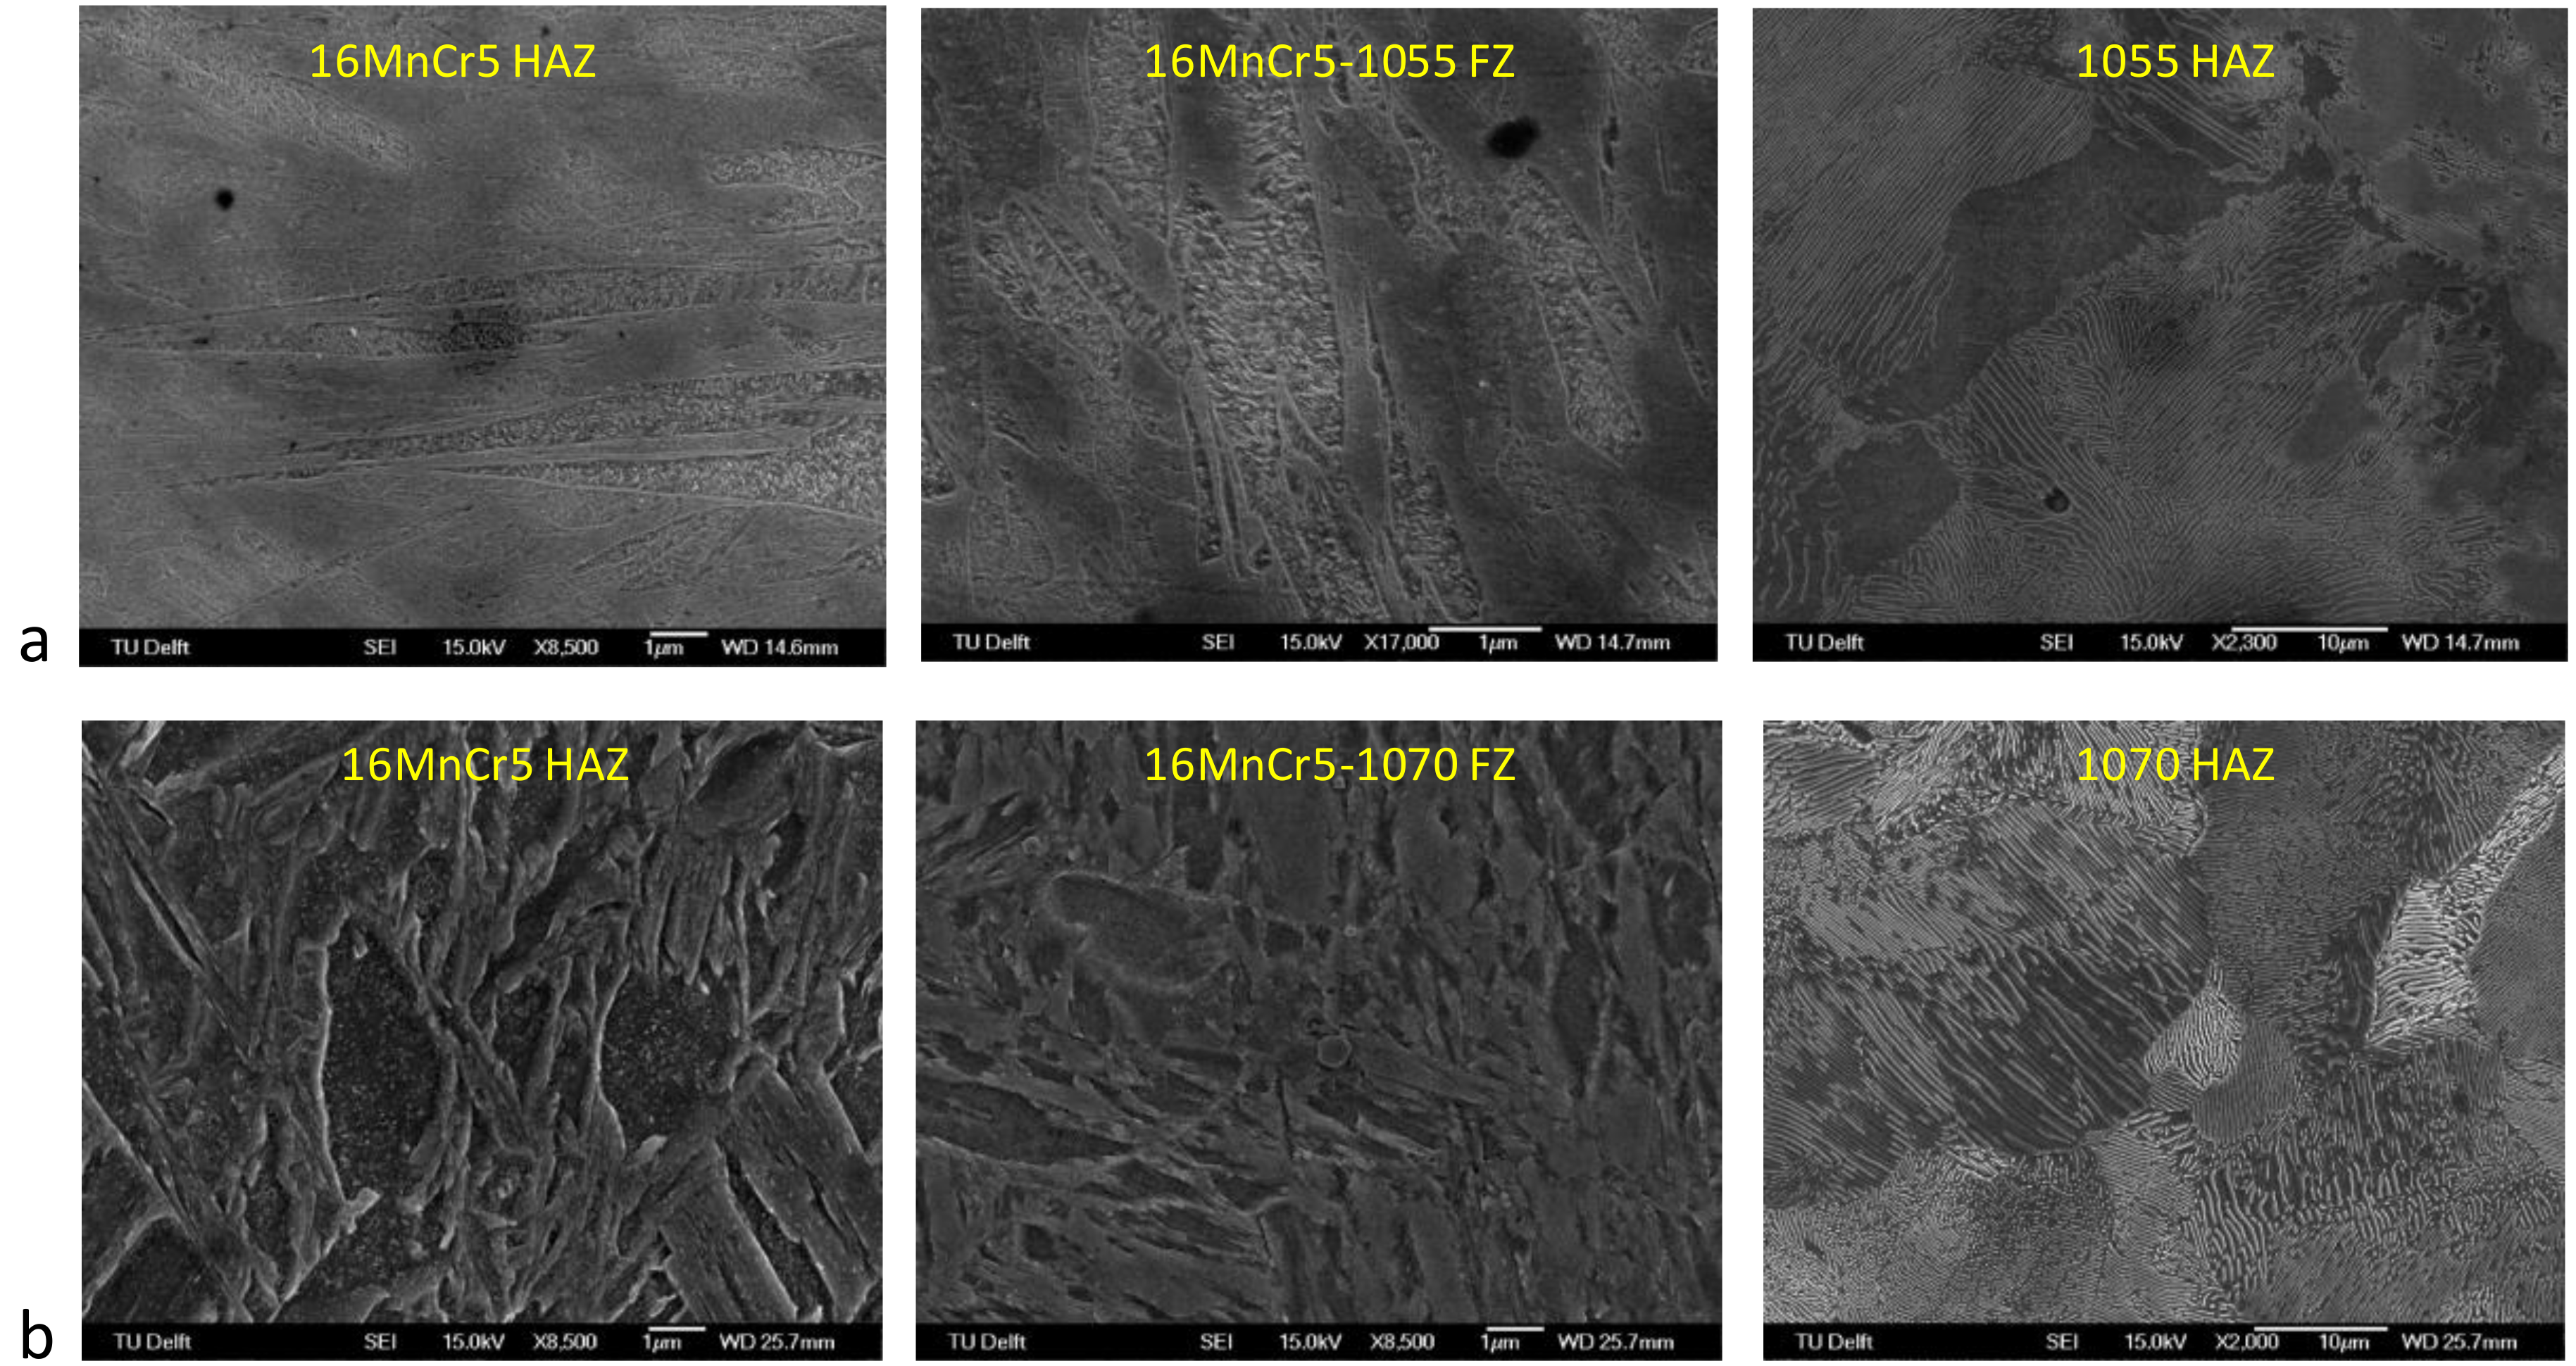
Figure 7.
Hardness profiles for the following material combinations: (a) 16MnCr5-16MnCr5, (b) 16MnCr5-42CrMo4, (c) 16MnCr5-41Cr4, (d) 16MnCr5-SAE1055 and (e) 16MnCr5-SAE1070 with a micrograph showing the occurrence of cracking in the SAE1070 HAZ.
Figure 7.
Hardness profiles for the following material combinations: (a) 16MnCr5-16MnCr5, (b) 16MnCr5-42CrMo4, (c) 16MnCr5-41Cr4, (d) 16MnCr5-SAE1055 and (e) 16MnCr5-SAE1070 with a micrograph showing the occurrence of cracking in the SAE1070 HAZ.
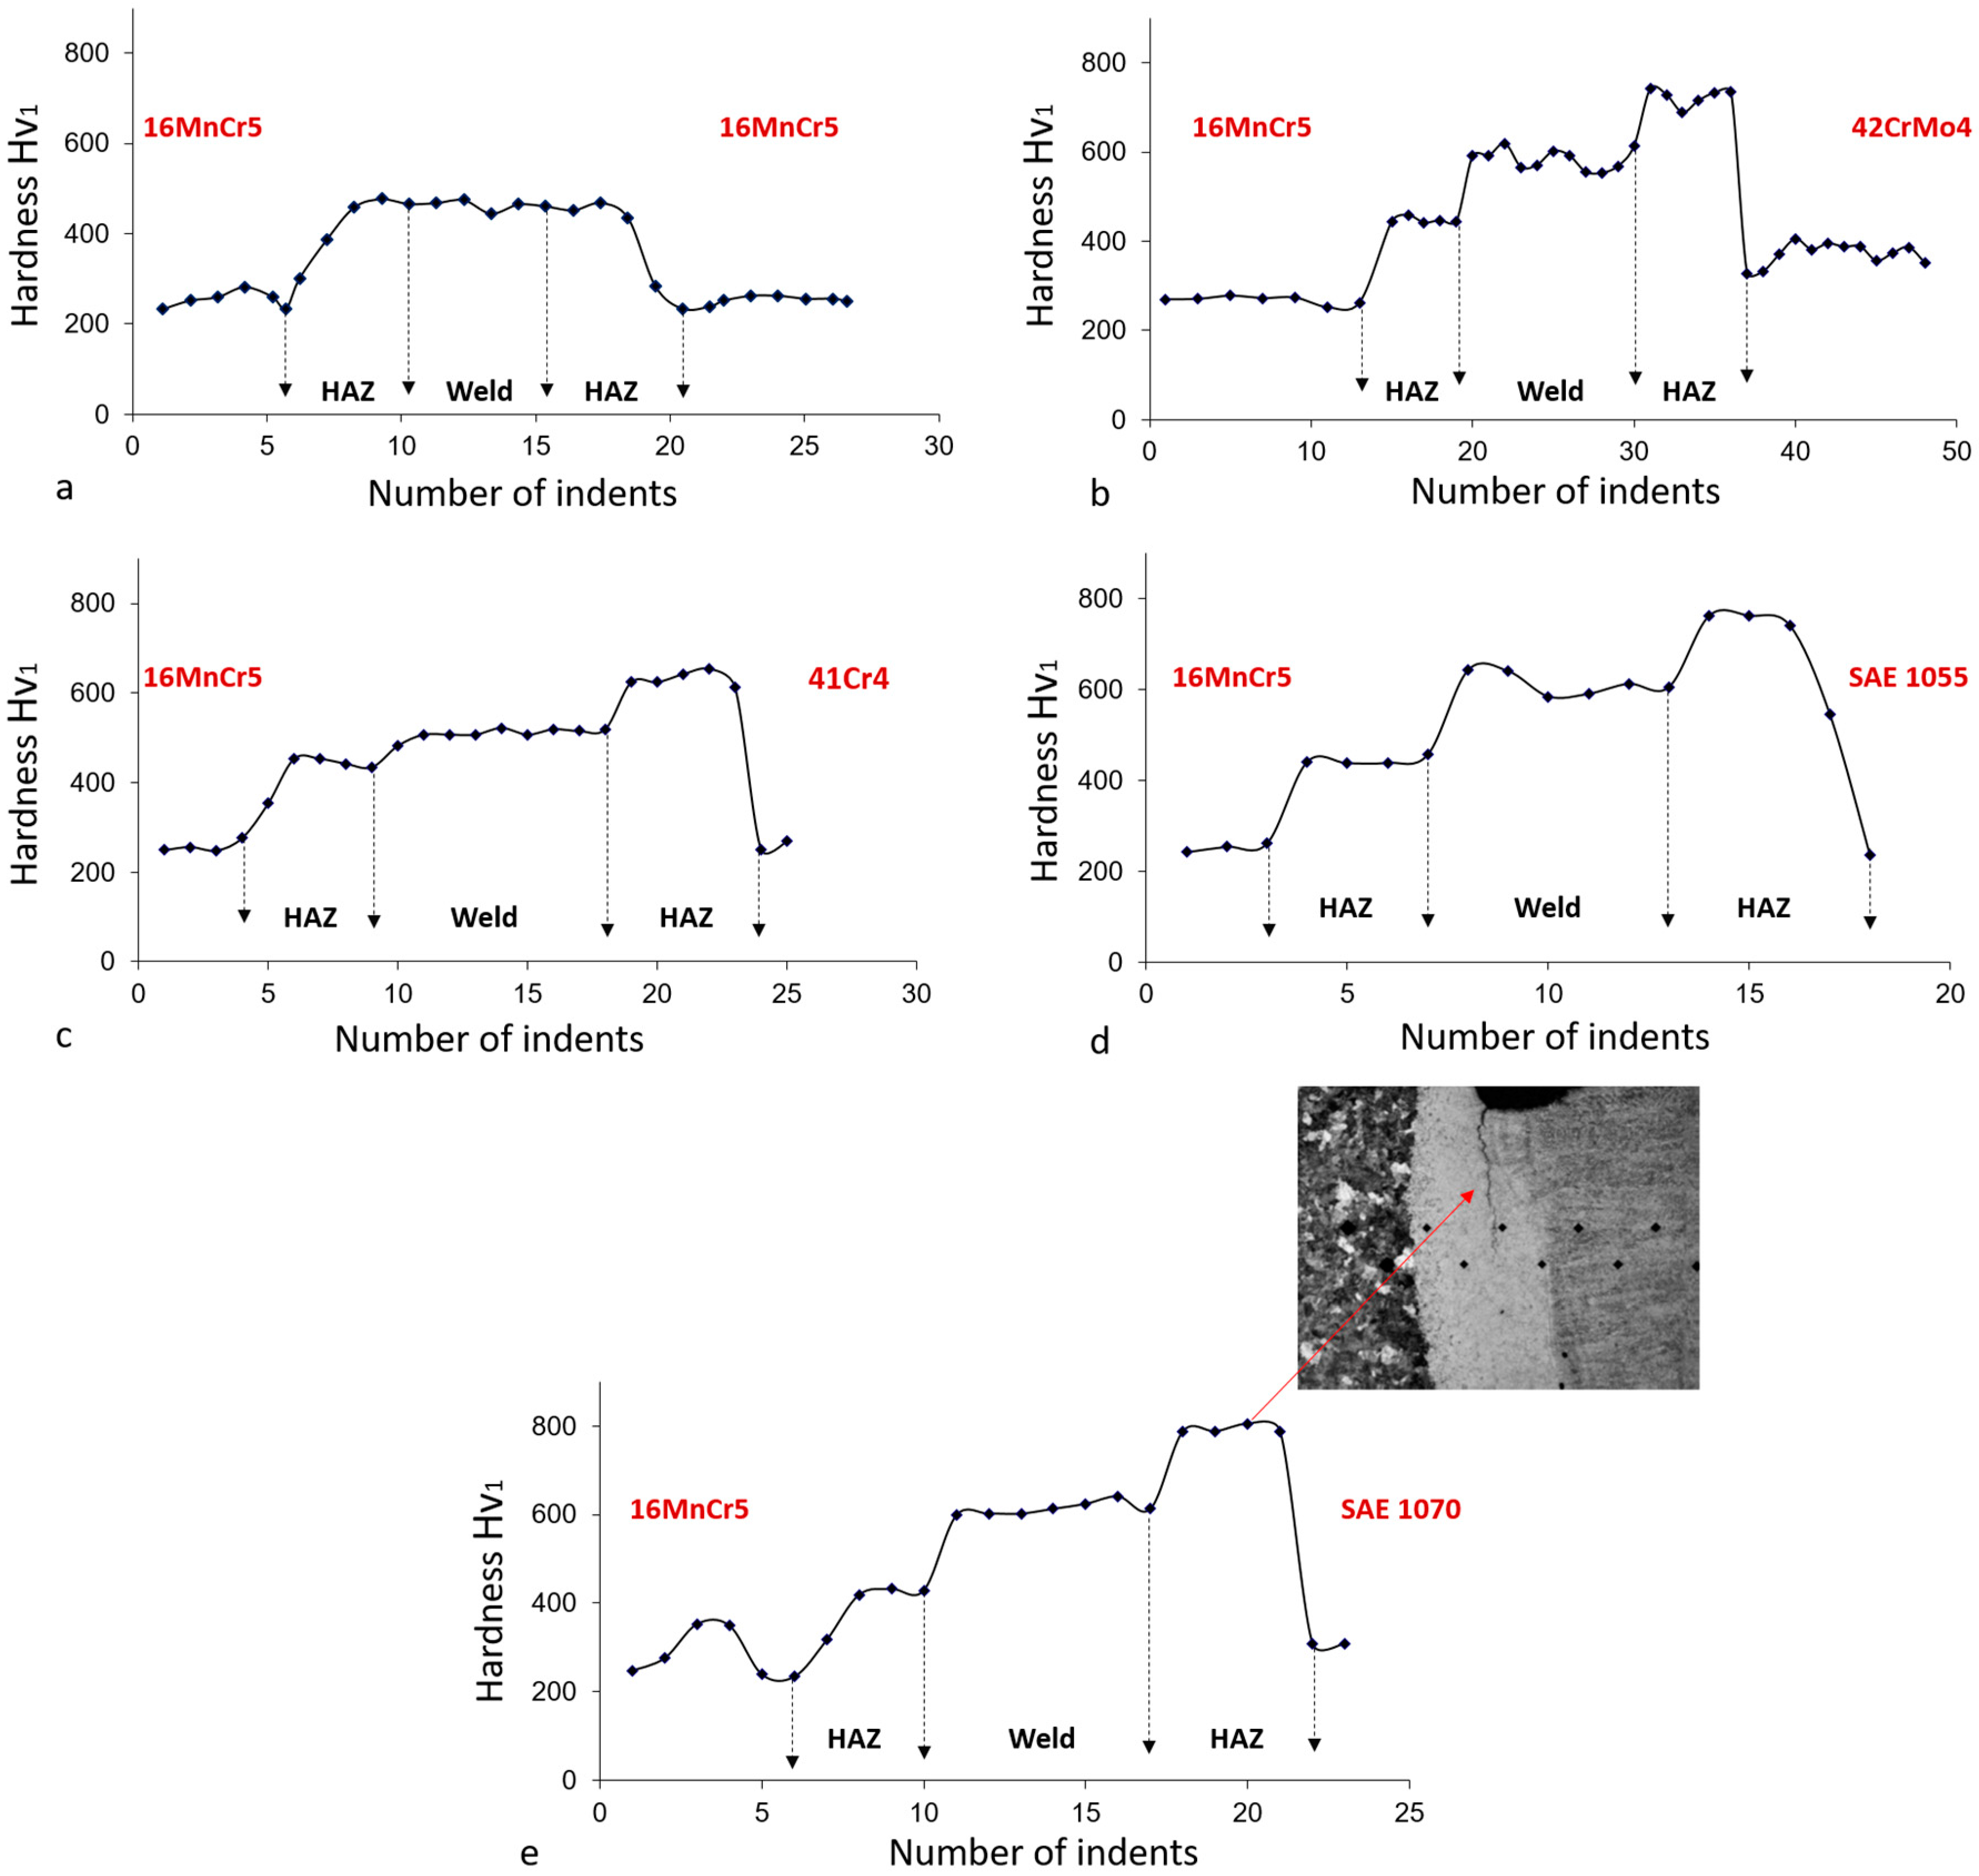
Figure 8.
Stress-strain curves upon tensile testing: for the base 16MnCr5 material and for the welded 16MnCr5-41Cr4 configuration.
Figure 8.
Stress-strain curves upon tensile testing: for the base 16MnCr5 material and for the welded 16MnCr5-41Cr4 configuration.
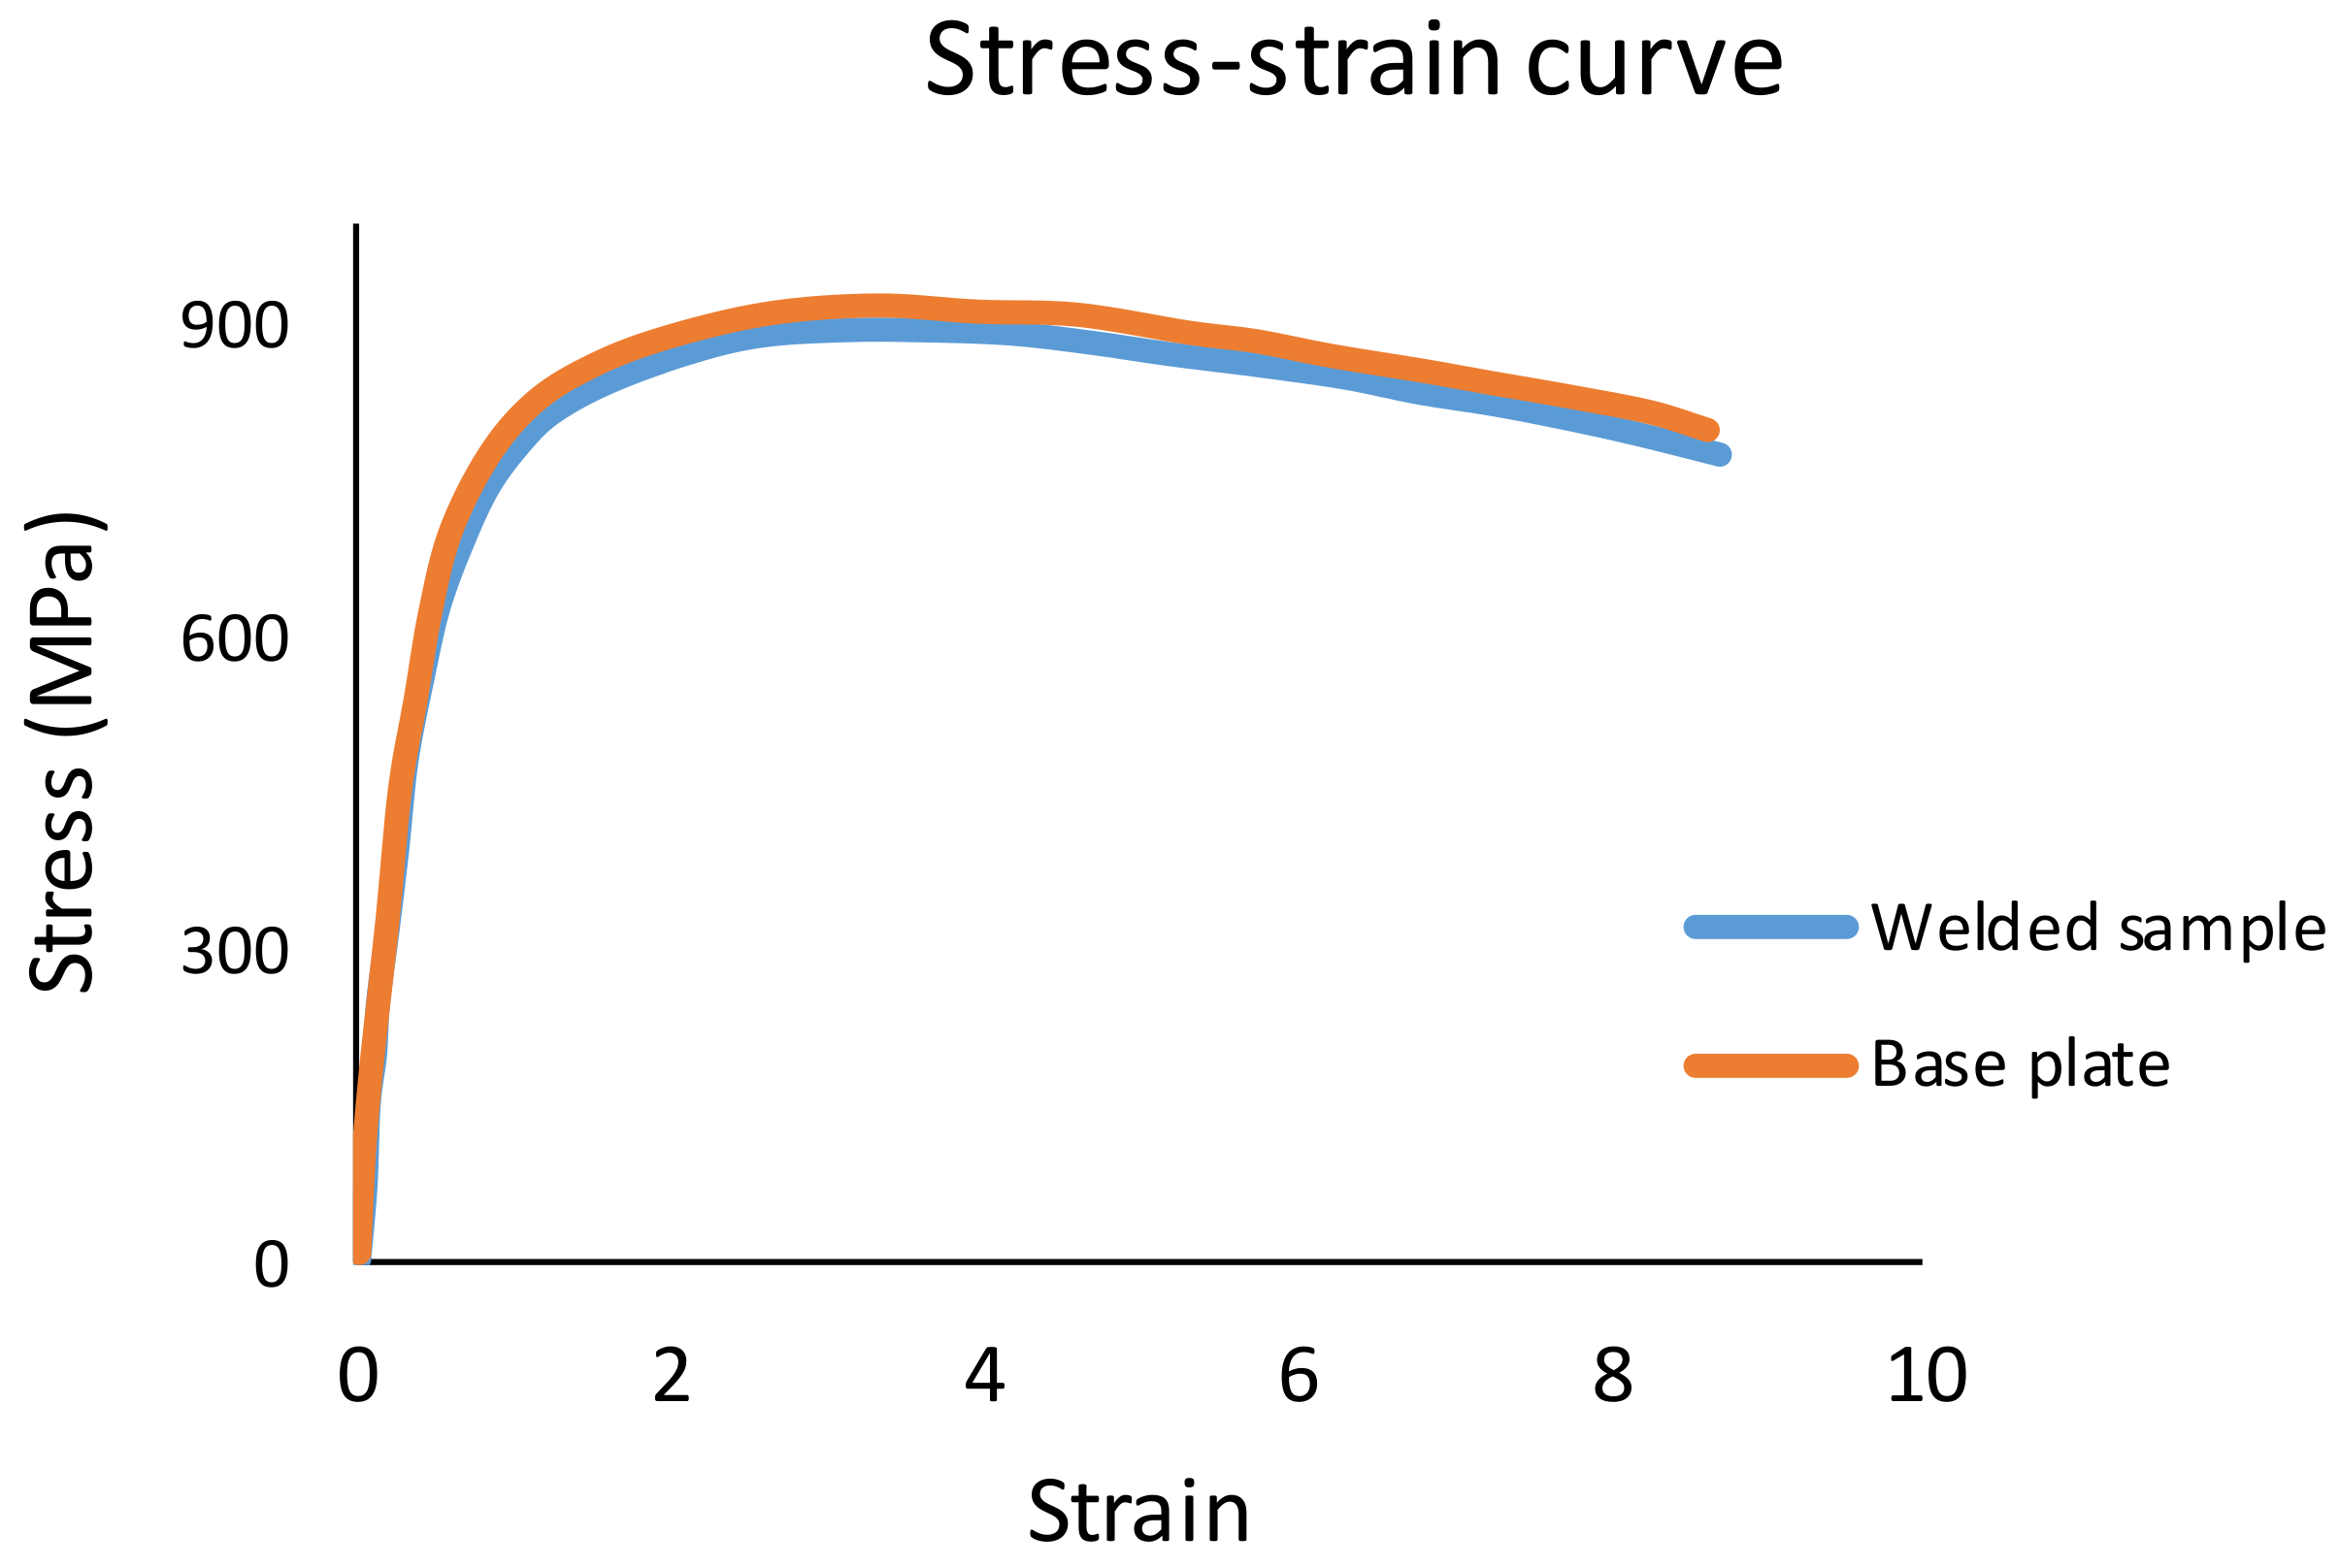
Figure 9.
Neural network calculated CCT diagrams for: (a) 16MnCr5, (b) SAE 1055 and (c) SAE 1070 material types; the orange line is the measured cooling rate during laser welding in this study. The ferrite, pearlite, bainite and martensite phases form in the CCT diagram when the (yellow) cooling curve/line crosses the red, blue, brown and black curves and regions respectively.
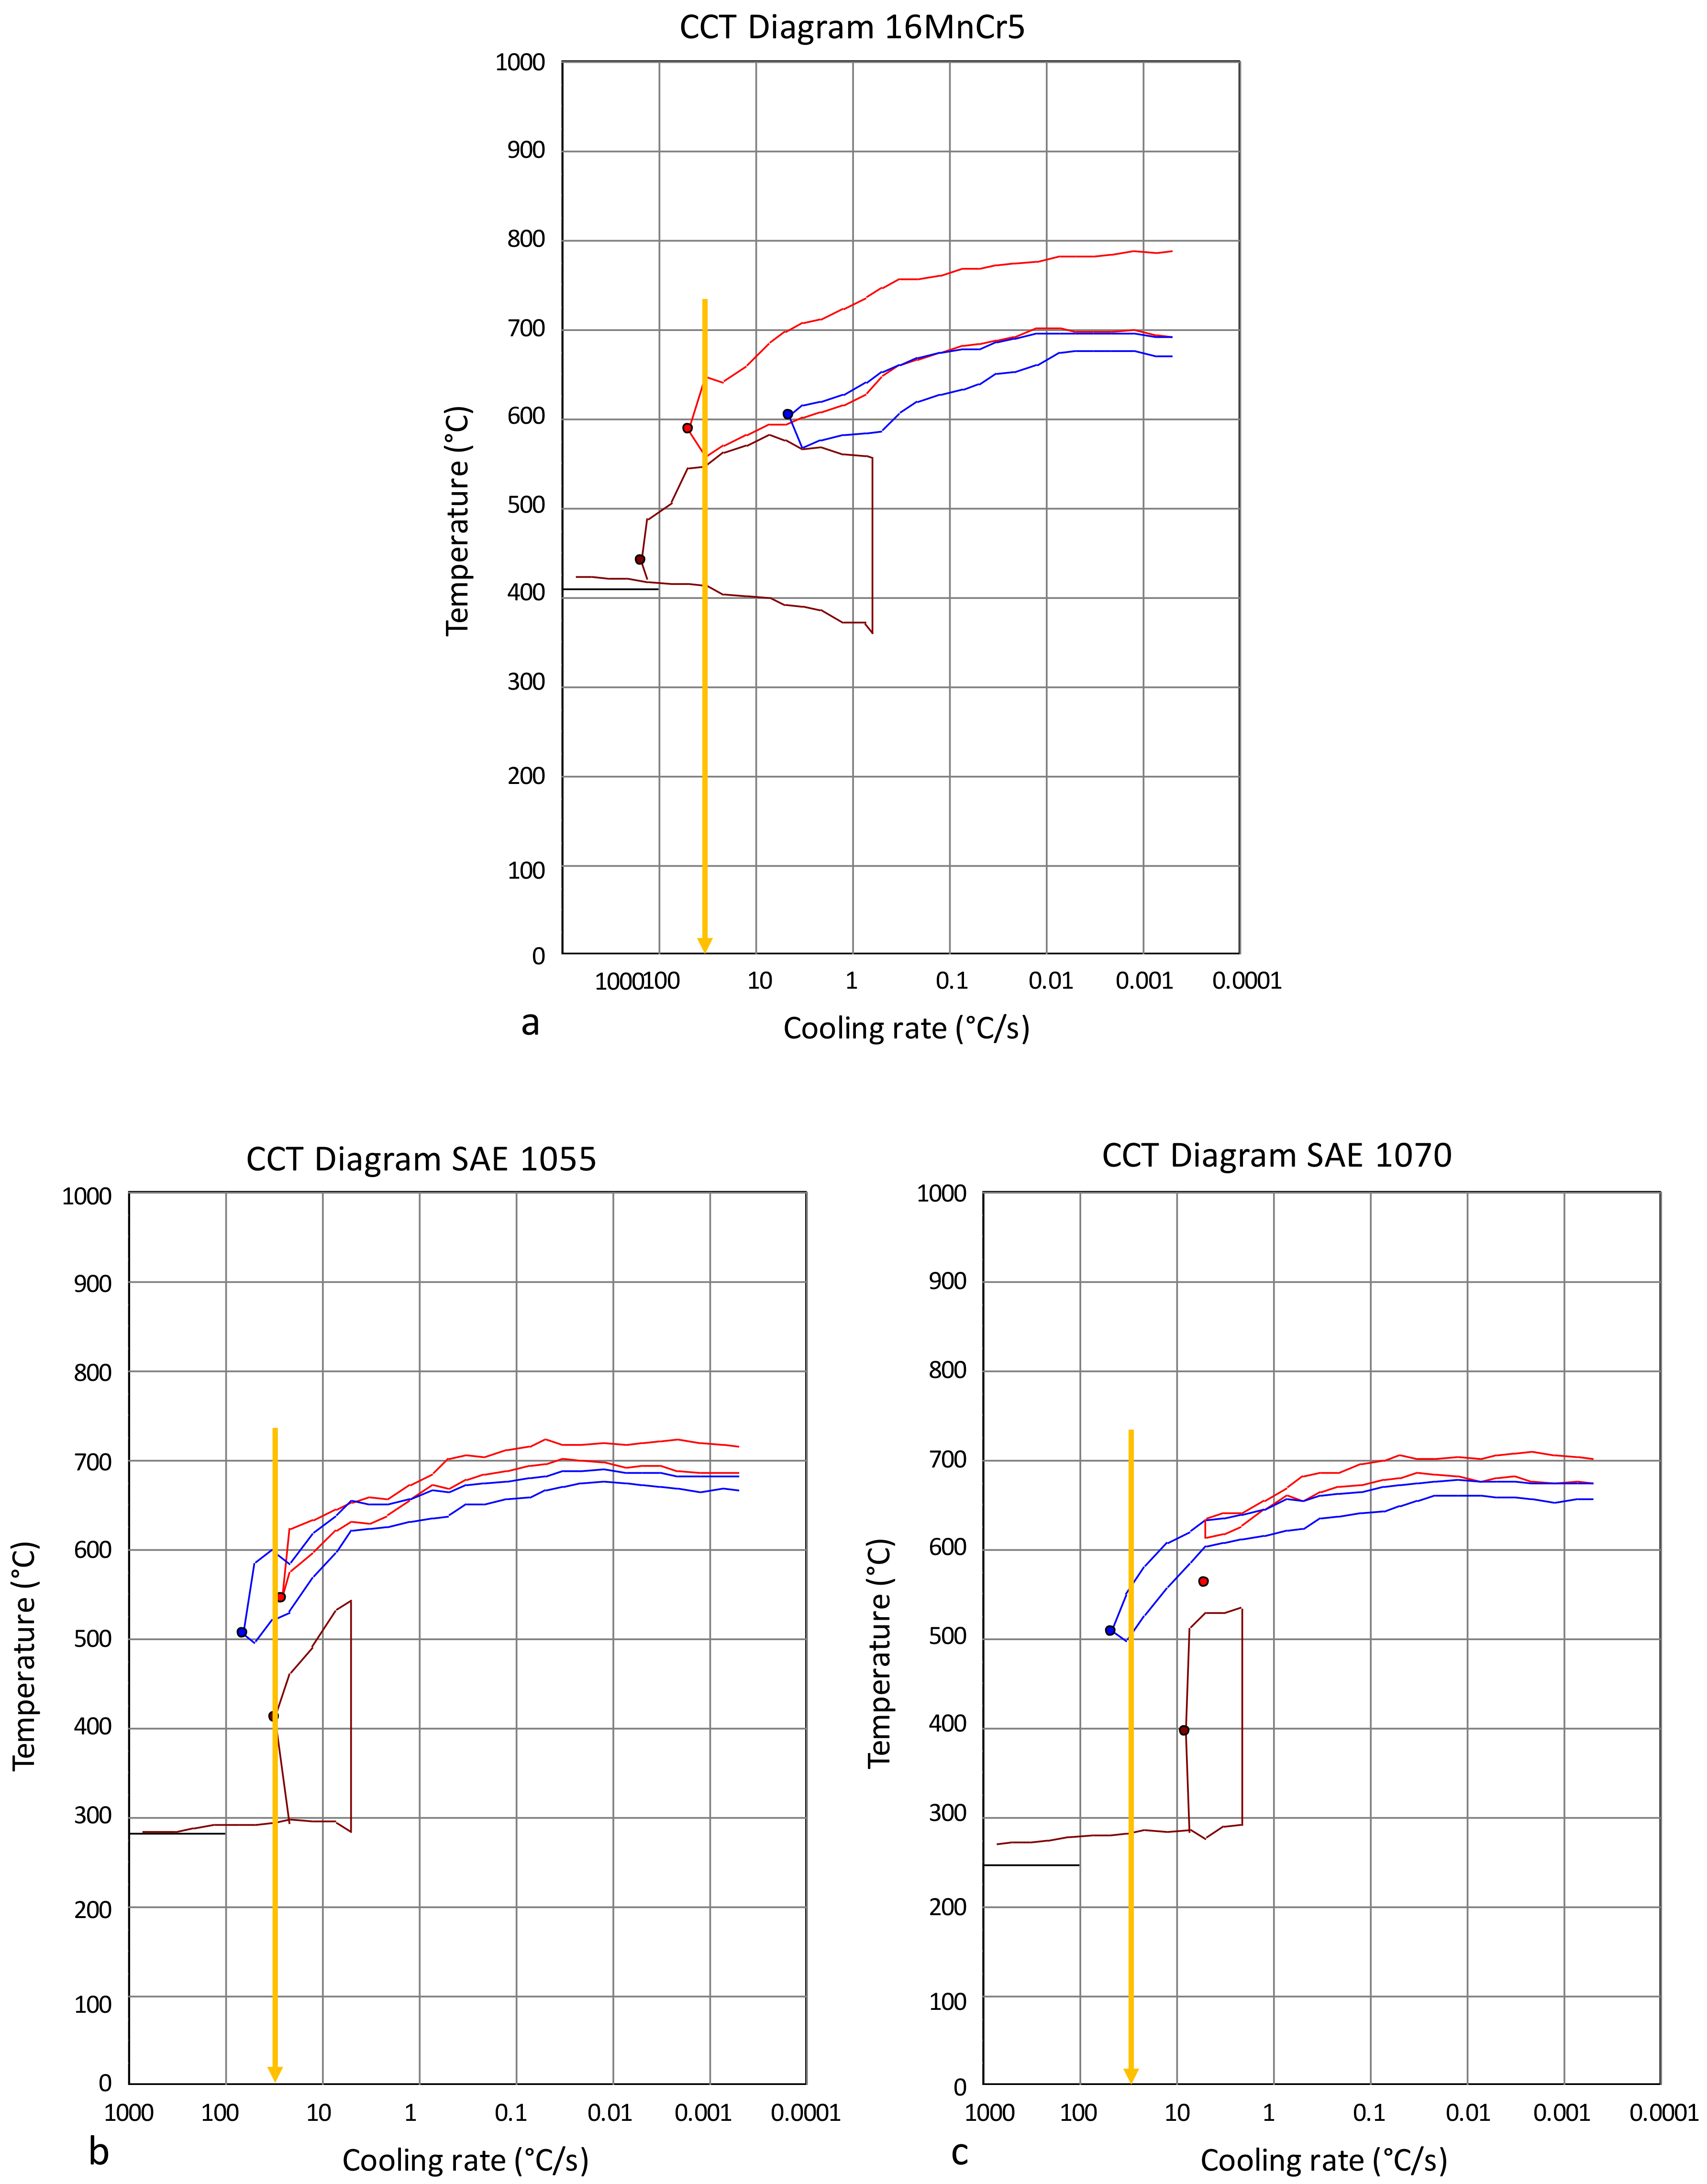
Figure 10.
Effect of material type and component geometry on the quality of the weld. (a–b) Picture of the weld top profile and micrograph of the weld cross section for the 16MnCr5-16MnCr5 material combination; (c–d) picture of the weld top profile and micrograph of the weld cross section for the 16MnCr5-41Cr4 material combination.

Figure 11.
Modified laser welding set-up resulting in improved weld profile. (a) Shows the top weld profile at end of the weld, with eight tack welds, but no downslope strategy for the welding power; (b) the top weld profile at the end of the weld with a ‘downslope’ strategy with 55° overlap, gradually reducing the welding power from 4–0 kW and moving the reference point from Zf: 0–4 mm. (c) micrograph of the weld cross section for the 16MnCr5-41Cr4 material combination.
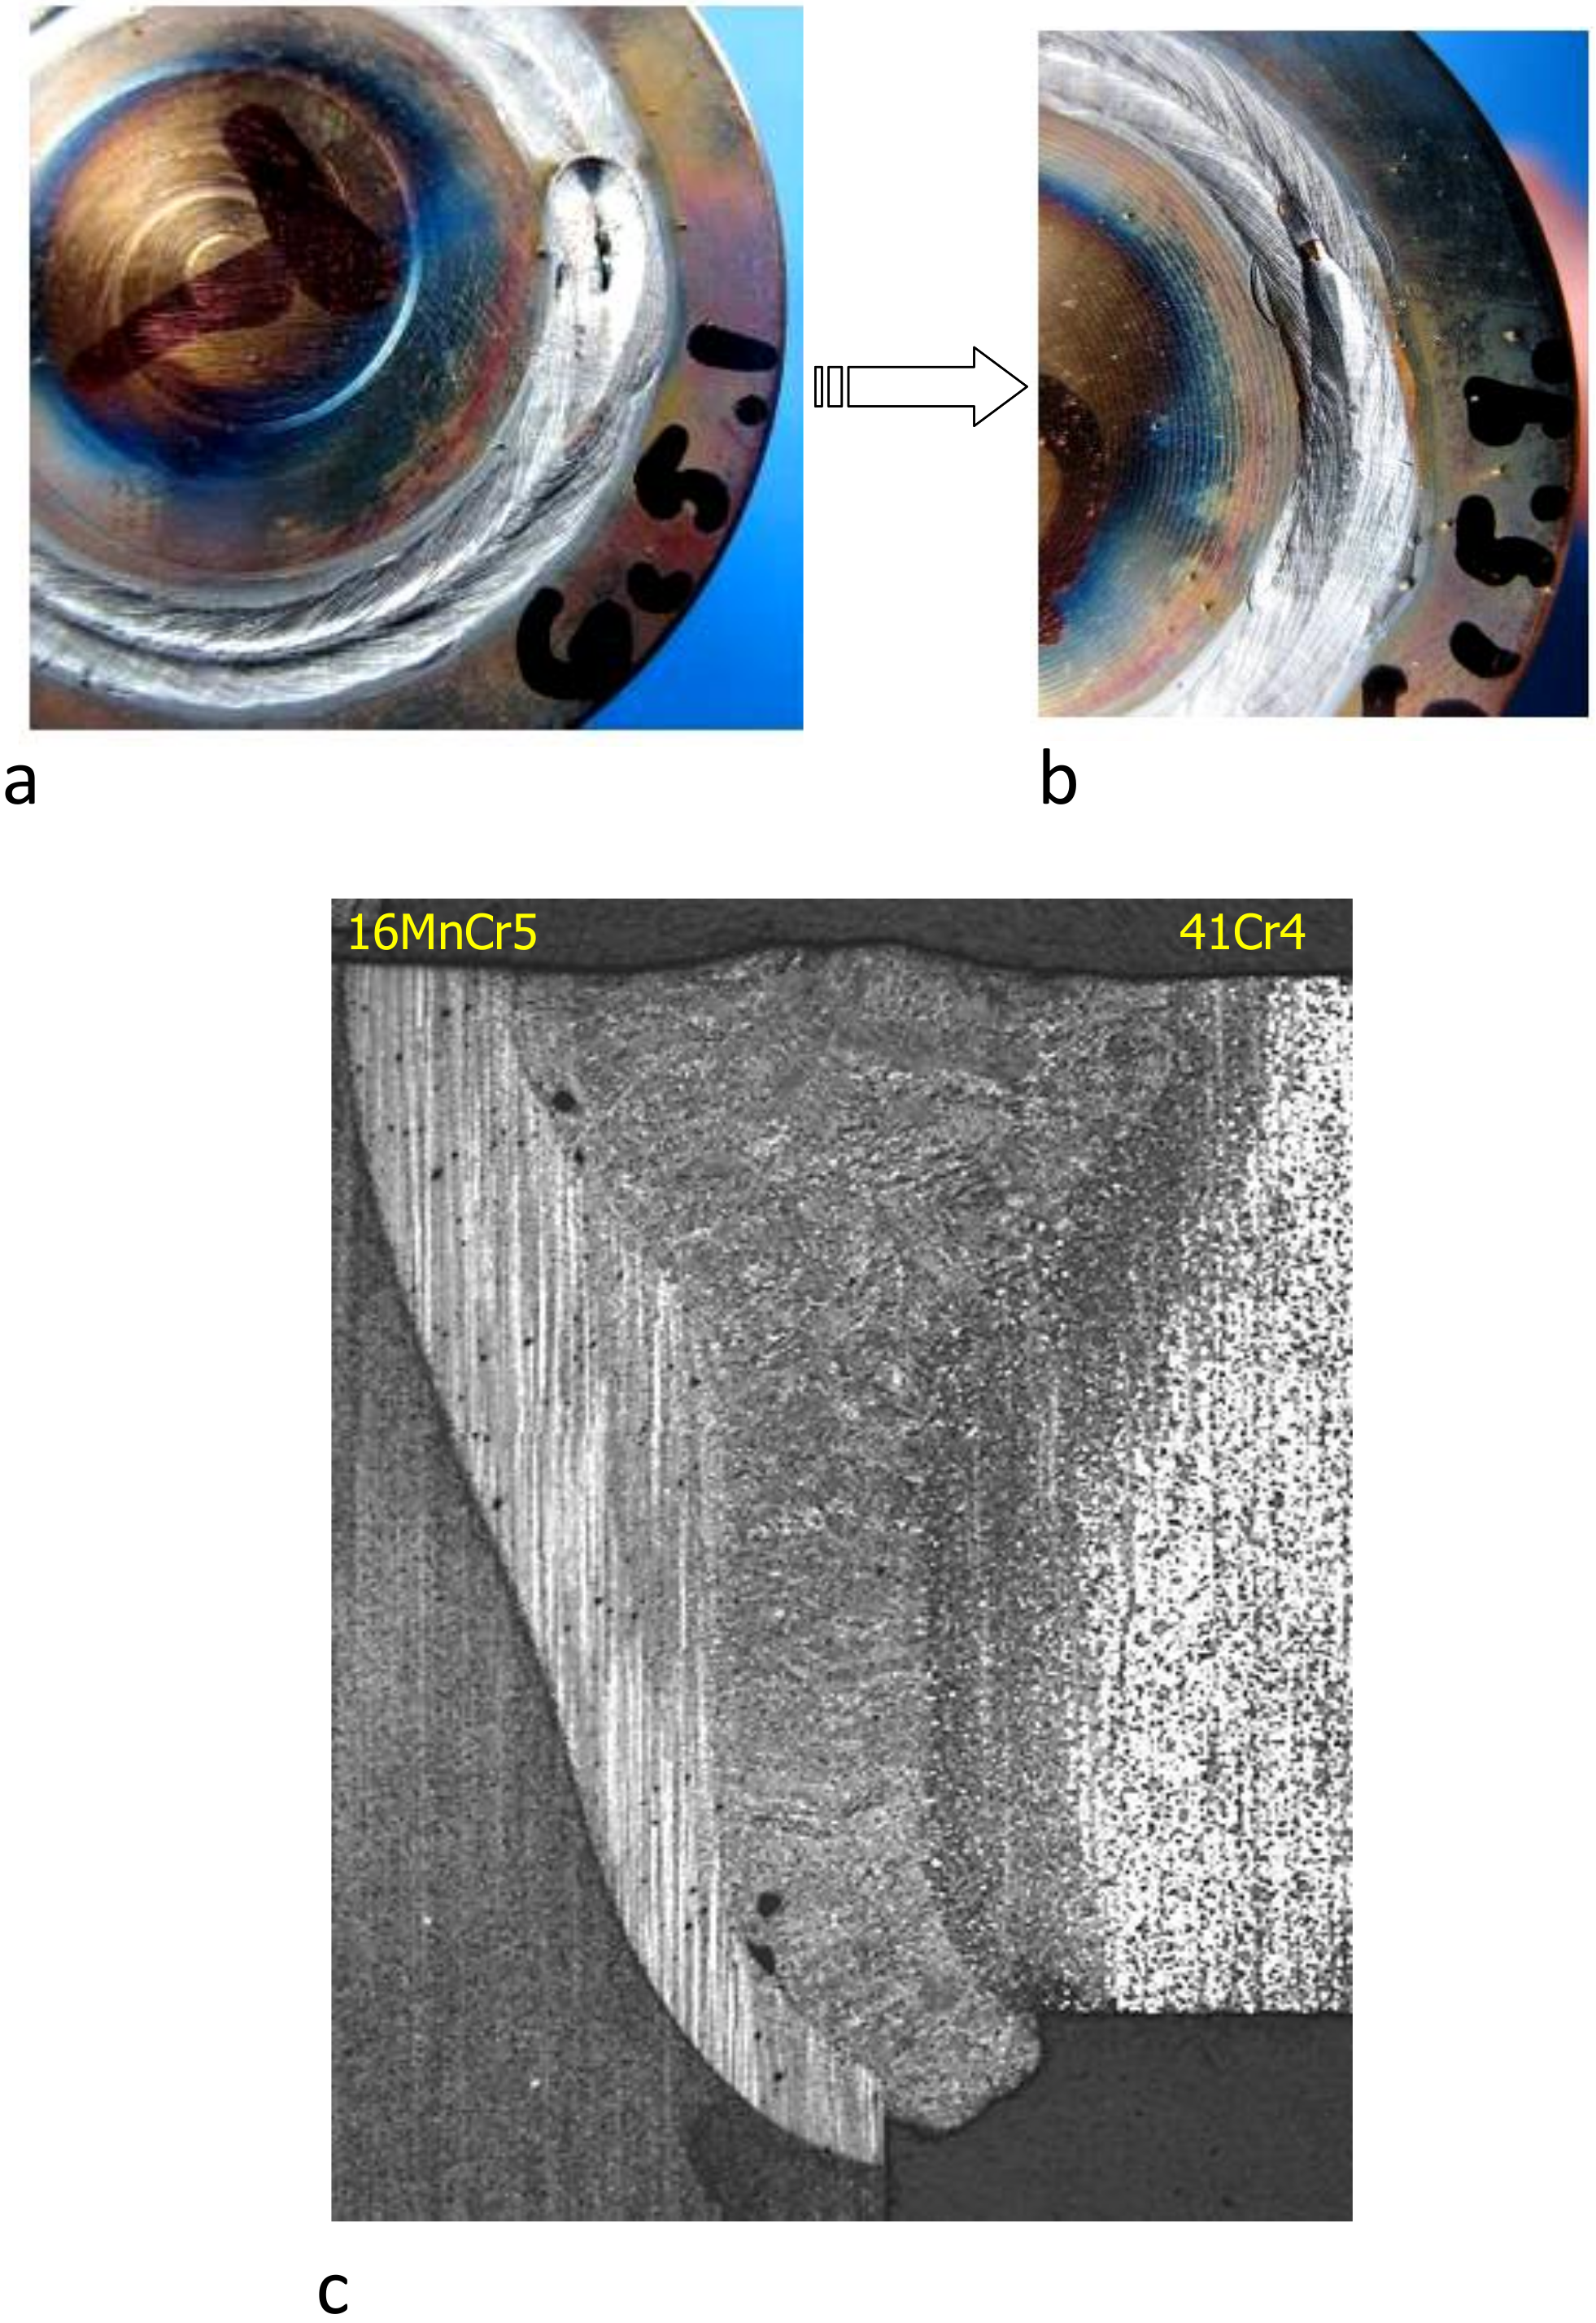
Figure 12.
The effect of the thickness of the samples on the cooling rate.
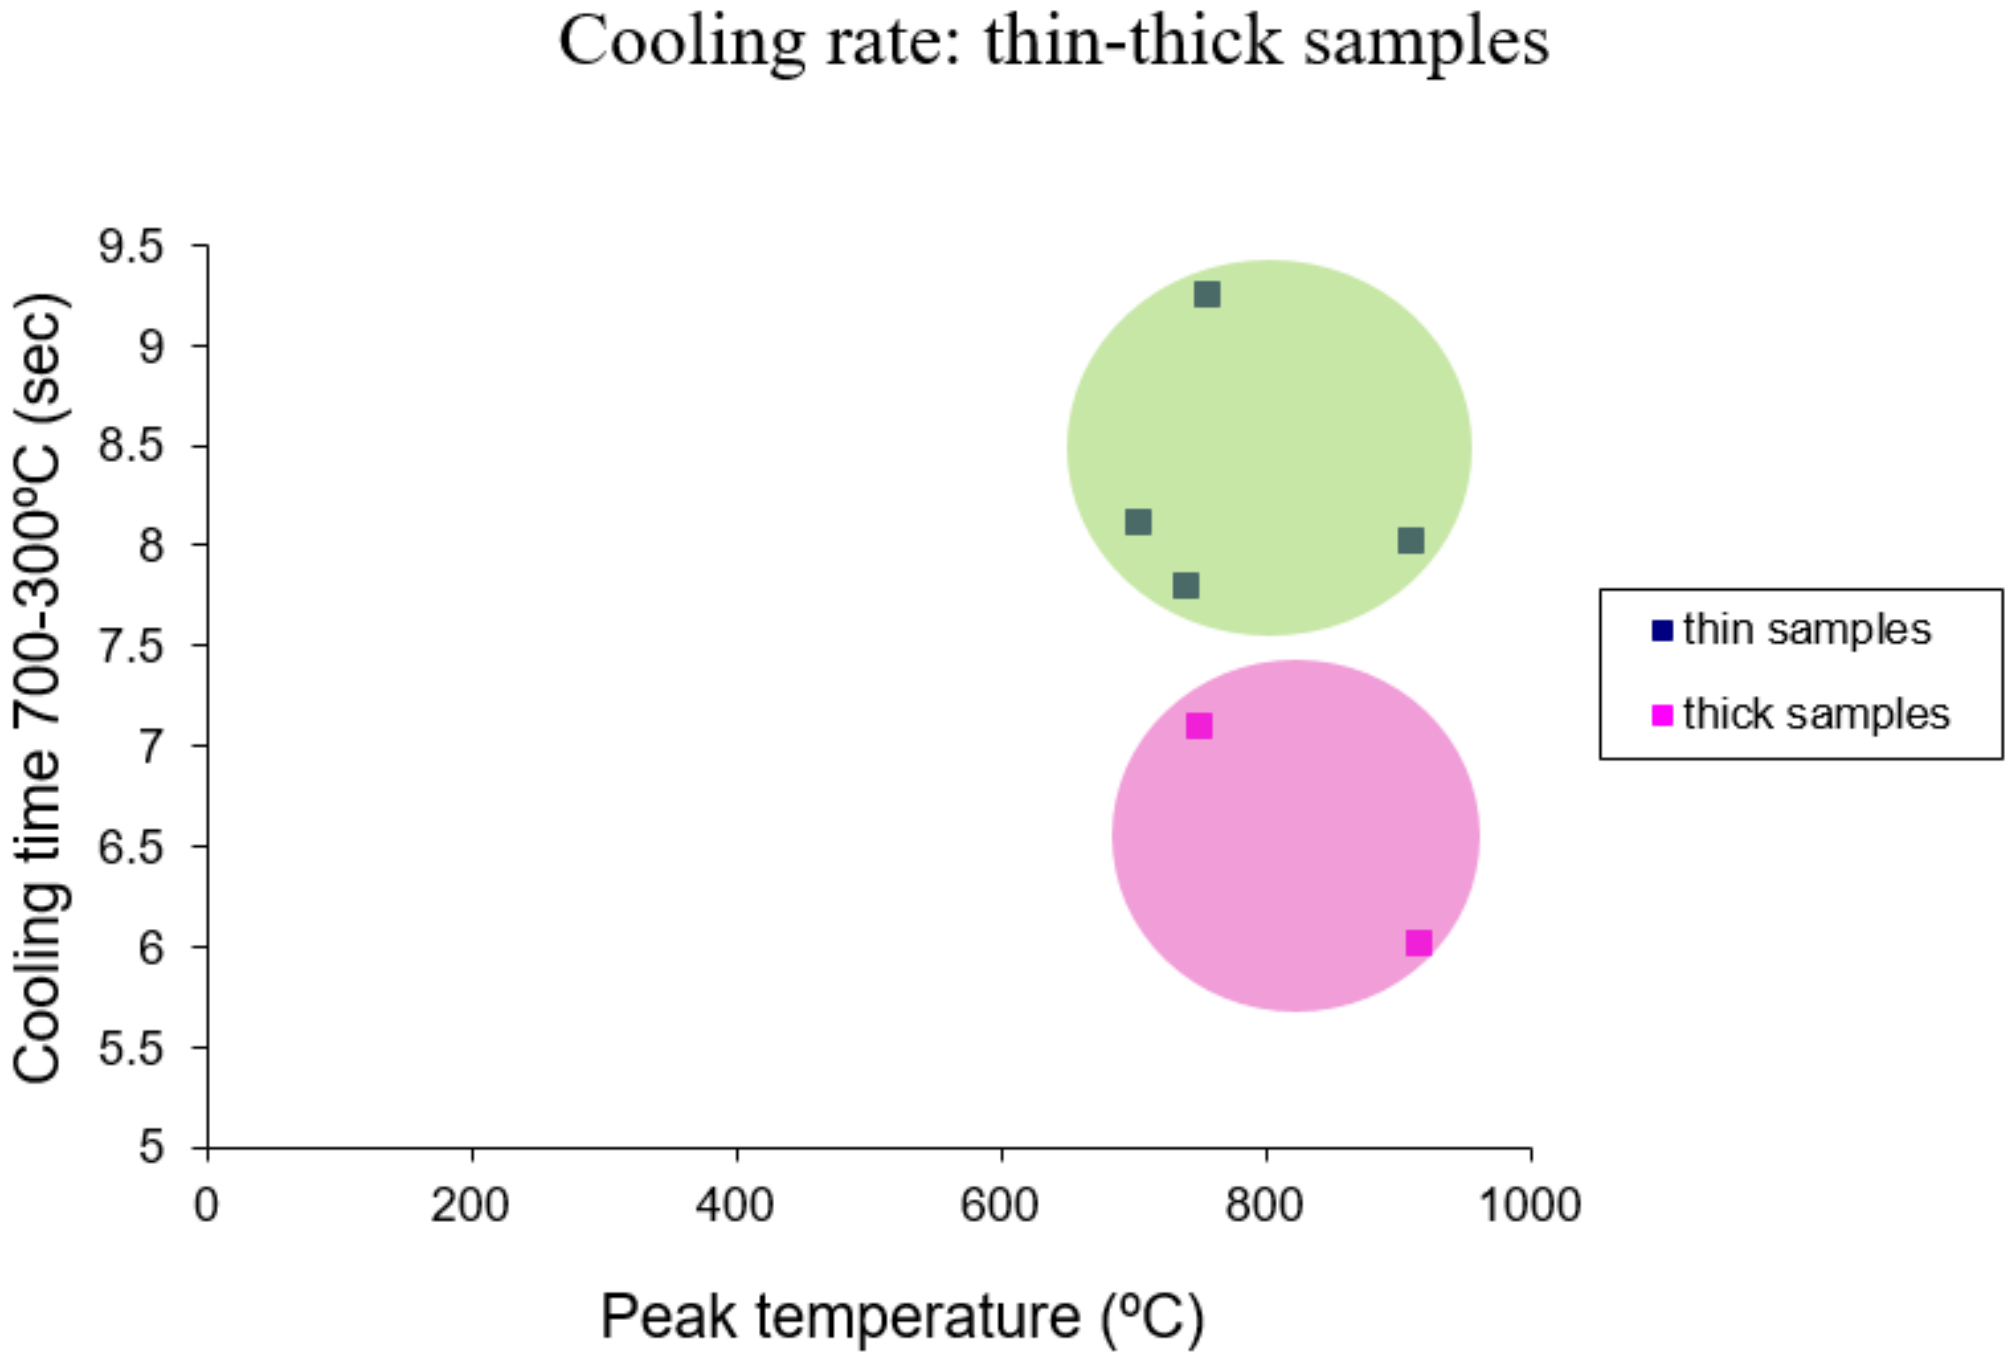
Figure 13.
Effect of (a) the preheating and (b) material type on cooling rate.
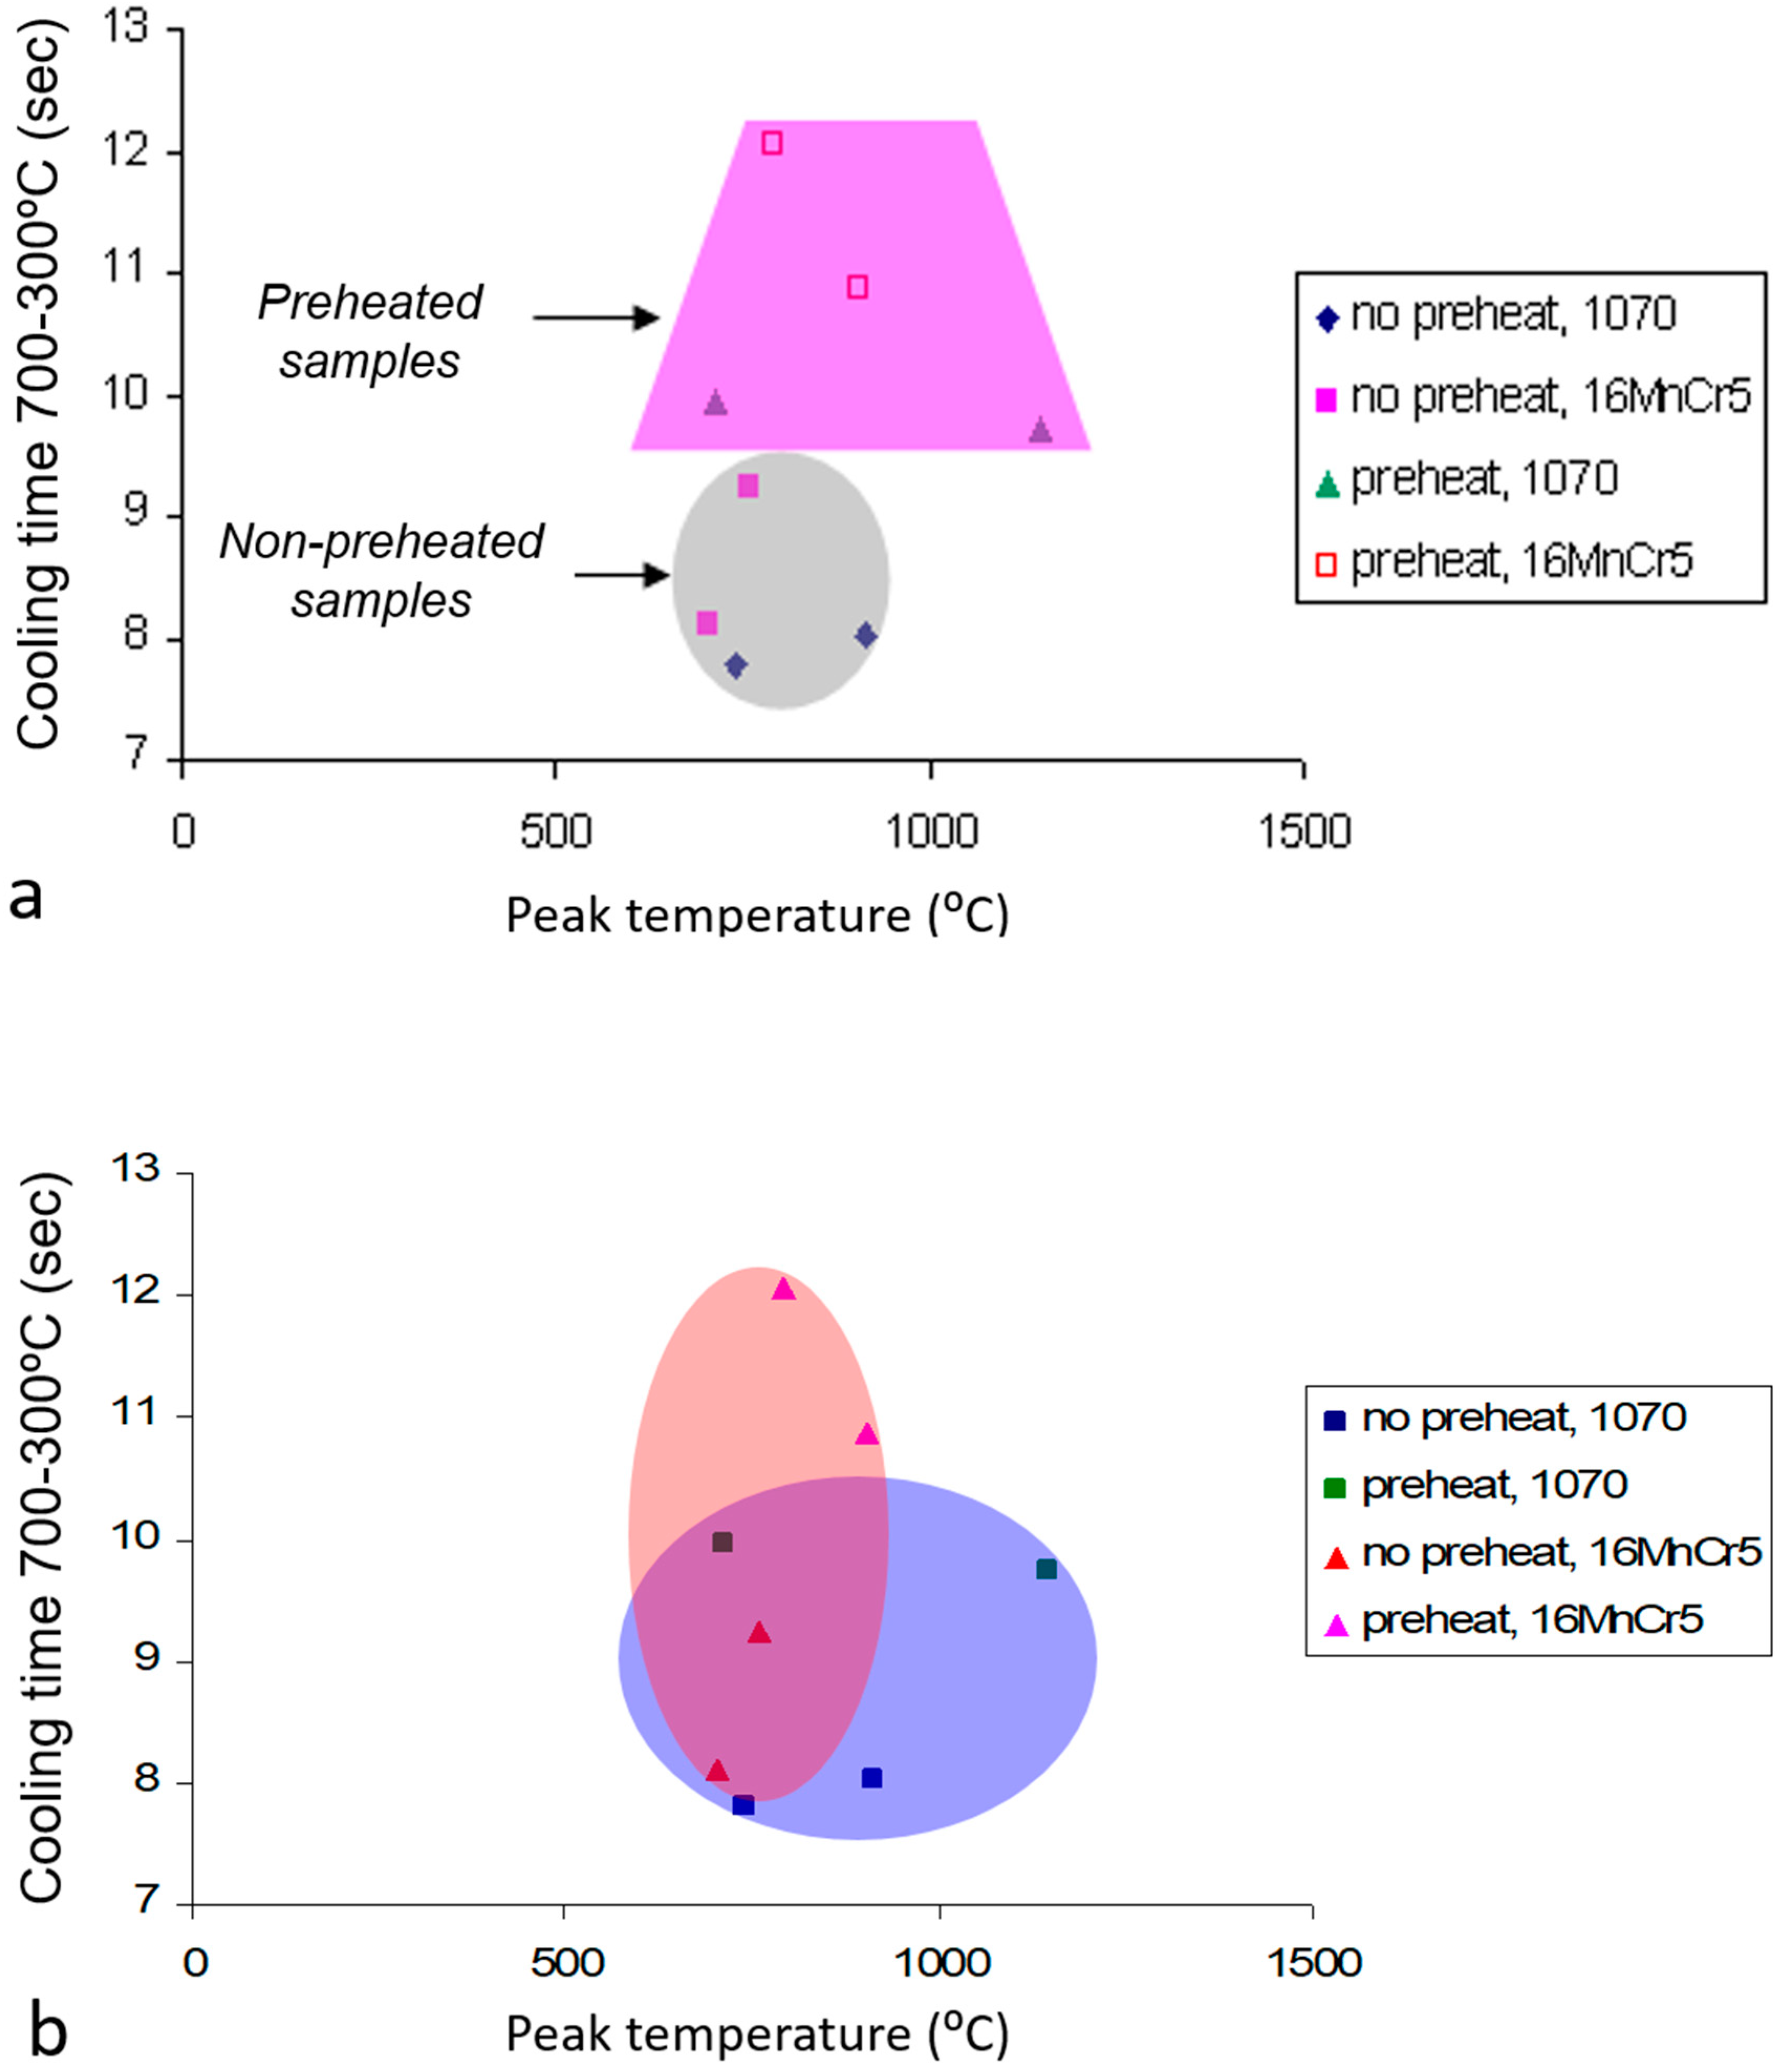
Figure 14.
Effect of component geometry on cooling rate, (a) thermocouple measurements at the shaft and ring; (b) cooling time 700–300 °C for the flat samples, the ring and shaft components.
Figure 14.
Effect of component geometry on cooling rate, (a) thermocouple measurements at the shaft and ring; (b) cooling time 700–300 °C for the flat samples, the ring and shaft components.


Table 1.
The corresponding chemical composition of the different material codes.
| Material Code | Composition (wt.%) | |||||||
|---|---|---|---|---|---|---|---|---|
| C | Si | Mn | P | S | Cr | Mo | Ni | |
| 16MnCr5 | 0.183 | 0.29 | 1.09 | 0.021 | 0.035 | 0.92 | 0.02 | 0.16 |
| 41Cr4 | 0.455 | 0.27 | 0.76 | 0.012 | 0.022 | 1.12 | 0.03 | 0.1 |
| 42CrMo4 | 0.363 | 0.27 | 0.69 | 0.012 | 0.030 | 1.04 | 0.19 | 0.09 |
| SAE 1055 | 0.594 | 0.20 | 0.69 | 0.013 | 0.024 | 0.14 | 0.0 | 0.12 |
| SAE 1070 | 0.69 | 0.19 | 0.99 | 0.019 | 0.026 | 0.12 | 0.0 | 0.11 |
Table 2.
The different material combinations and thicknesses that were laser welded together with the corresponding carbon equivalent.
Table 2.
The different material combinations and thicknesses that were laser welded together with the corresponding carbon equivalent.
| Materials Investigated | Carbon Equivalent (wt.%) | Sample Thickness (mm) |
|---|---|---|
| 16MnCr5/16MnCr5 | 0.56/0.56 | 5 + 8 |
| 16MnCr5/42CrMo4 | 0.56/0.73 | 8 |
| 16MnCr5/41Cr4 | 0.56/0.82 | 8 |
| 16MnCr5/1055 | 0.56/0.75 | 5 + 8 |
| 16MnCr5/1070 | 0.56/0.89 | 5 + 8 |
© 2018 by the authors. Licensee MDPI, Basel, Switzerland. This article is an open access article distributed under the terms and conditions of the Creative Commons Attribution (CC BY) license (http://creativecommons.org/licenses/by/4.0/).
Share and Cite
MDPI and ACS Style
Efthymiadis, P.; Nor, K. Laser Welding Dissimilar High-Strength Steel Alloys with Complex Geometries. Metals 2018, 8, 792. https://doi.org/10.3390/met8100792
AMA Style
Efthymiadis P, Nor K. Laser Welding Dissimilar High-Strength Steel Alloys with Complex Geometries. Metals. 2018; 8(10):792. https://doi.org/10.3390/met8100792
Chicago/Turabian StyleEfthymiadis, Panos, and Khalid Nor. 2018. "Laser Welding Dissimilar High-Strength Steel Alloys with Complex Geometries" Metals 8, no. 10: 792. https://doi.org/10.3390/met8100792
Note that from the first issue of 2016, this journal uses article numbers instead of page numbers. See further details here.