Study of Solidification Cracking Susceptibility during Laser Welding in an Advanced High Strength Automotive Steel


1
Department of Materials Science and Engineering, Faculty of 3mE, Delft University of Technology, Mekelweg 2, 2628 CD Delft, The Netherlands
2
Department of Metallurgical and Materials Engineering, Indian Institute of Technology Madras, Chennai 600036, India
*
Author to whom correspondence should be addressed.
†
Current address: Tata Steel, P.O. Box 10000, 1970 CA IJmuiden, The Netherlands.
Metals 2018, 8(9), 673; https://doi.org/10.3390/met8090673
Submission received: 10 August 2018
/
Revised: 22 August 2018
/
Accepted: 24 August 2018
/
Published: 28 August 2018
(This article belongs to the Special Issue Laser Welding of Industrial Metal Alloys)
Abstract
:Susceptibility to weld solidification cracking in transformation-induced plasticity steel sheets was studied using a modified standard hot cracking test used in the automotive industry. To vary the amount of self-restraint, bead-on-plate laser welding was carried out on a single-sided clamped specimen at increasing distances from the free edge. Solidification cracking was observed when welding was carried out close to the free edge. With increasing amount of restraint, the crack length showed a decreasing trend, and at a certain distance, no cracking was observed. With the aid of a finite element-based model, dynamic thermal and mechanical conditions that prevail along the transverse direction of the mushy zone are used to explain the cracking susceptibility obtained experimentally. The results indicate that the transverse strain close to the fusion boundary can be used as a criterion to predict the cracking behavior. The outcome of the study shows that optimum processing parameters can be used to weld steels closer to the free edge without solidification cracking.
1. Introduction
Solidification cracking, known as hot tearing in casting, is one of the prominent defects in welding, casting and/or additive manufacturing. Mitigating the occurrence of solidification cracking is important to achieve good weldability. For more than five decades, solidification cracking in welding/casting of various alloys has been studied extensively [1,2,3,4].
Recently, increasing environmental concern has motivated the automotive industry to develop thinner gauge steels with high strength, ductility and toughness. The use of lightweight steel in the automotive body reduces the average fuel consumption. Reduced fuel consumption leads to lower CO2 emission, thereby making the vehicle environmentally greener. For this purpose, a class of steels, called Advanced High Strength Steels (AHSS), is being continuously put into use. AHSS differs from mild steels in terms of chemical composition and microstructure. The higher alloying content in AHSS renders it susceptible to solidification cracking during welding. During weld metal solidification, grains grow perpendicular to the fusion boundary since the temperature gradient is steepest, and accordingly, the heat extraction is maximized. The solidifying dendrites meet at the weld centerline. Upon solidification, the solidifying weld metal shrinks due to solidification shrinkage and thermal contraction. As solidification progresses, the solid in the mushy zone begins to form a rigid continuous network, i.e., tensile strain is induced by the surrounding material. If the deformation exceeds a certain threshold, separation of the dendrites at the grain boundary can occur. At the terminal stage of solidification, such an opening cannot be compensated by the remaining liquid due to both low permeability and a high solid fraction [5,6]. As a result, solidification cracking occurs. Solidification temperature range, segregation of impurity elements, morphology of solidifying grains, interdendritic liquid feeding and dendrite coherency are some of the important metallurgical aspects affecting the solidification cracking tendency [7]. In a recent study [8], it was reported that impurity elements like phosphorus lead to narrow liquid channels that are difficult to fill with the remaining liquid at the last stage of solidification. The shrinkage-brittleness theory proposed by Pumphrey et al. [1] is based on the concept of coherency temperature. At the coherency temperature, the solid in the mushy region begins to form a rigid continuous network. The theory says that cracking occurs when there is some extent of coherency in the mushy region, i.e., below the coherency temperature. Pellini [2] proposed a strain-based theory for hot cracking in castings. This theory has been extended to weld solidification cracking and states that cracking occurs due to the rupture of liquid films that persist until the last stage of solidification. Building upon the work of Pellini, Prokhorov [3] considered the mushy zone as a single entity and defined the ductility of a material as solidification occurs. Later on, Zacharia [9] used the stress-based approach to describe the thermo-mechanical behavior in the weld pool vicinity. Eskin et al. [10] in their review paper elaborated existing hot tearing theories and models. These models are based on the existence of a critical stress, critical strain or critical strain rate criterion, which leads to cracking. Recent physical models from Rappaz et al. [11] and Kou [12] indicate that in the presence of local deformation, insufficient liquid feeding in the interdendritic or intergranular region results in cracking. Matsuda et al. [13] and Coniglio et al. [4], based on the experiments, concluded that the presence of a critical strain rate is responsible for cracking. However, Katgerman [14] in his mathematical model considered stresses and insufficient feeding in the vulnerable temperature range to be the cause of hot cracking. Experiments focusing on determining the physical mechanism that leads to the separation of grains at the microscopic level under welding conditions are still lacking.
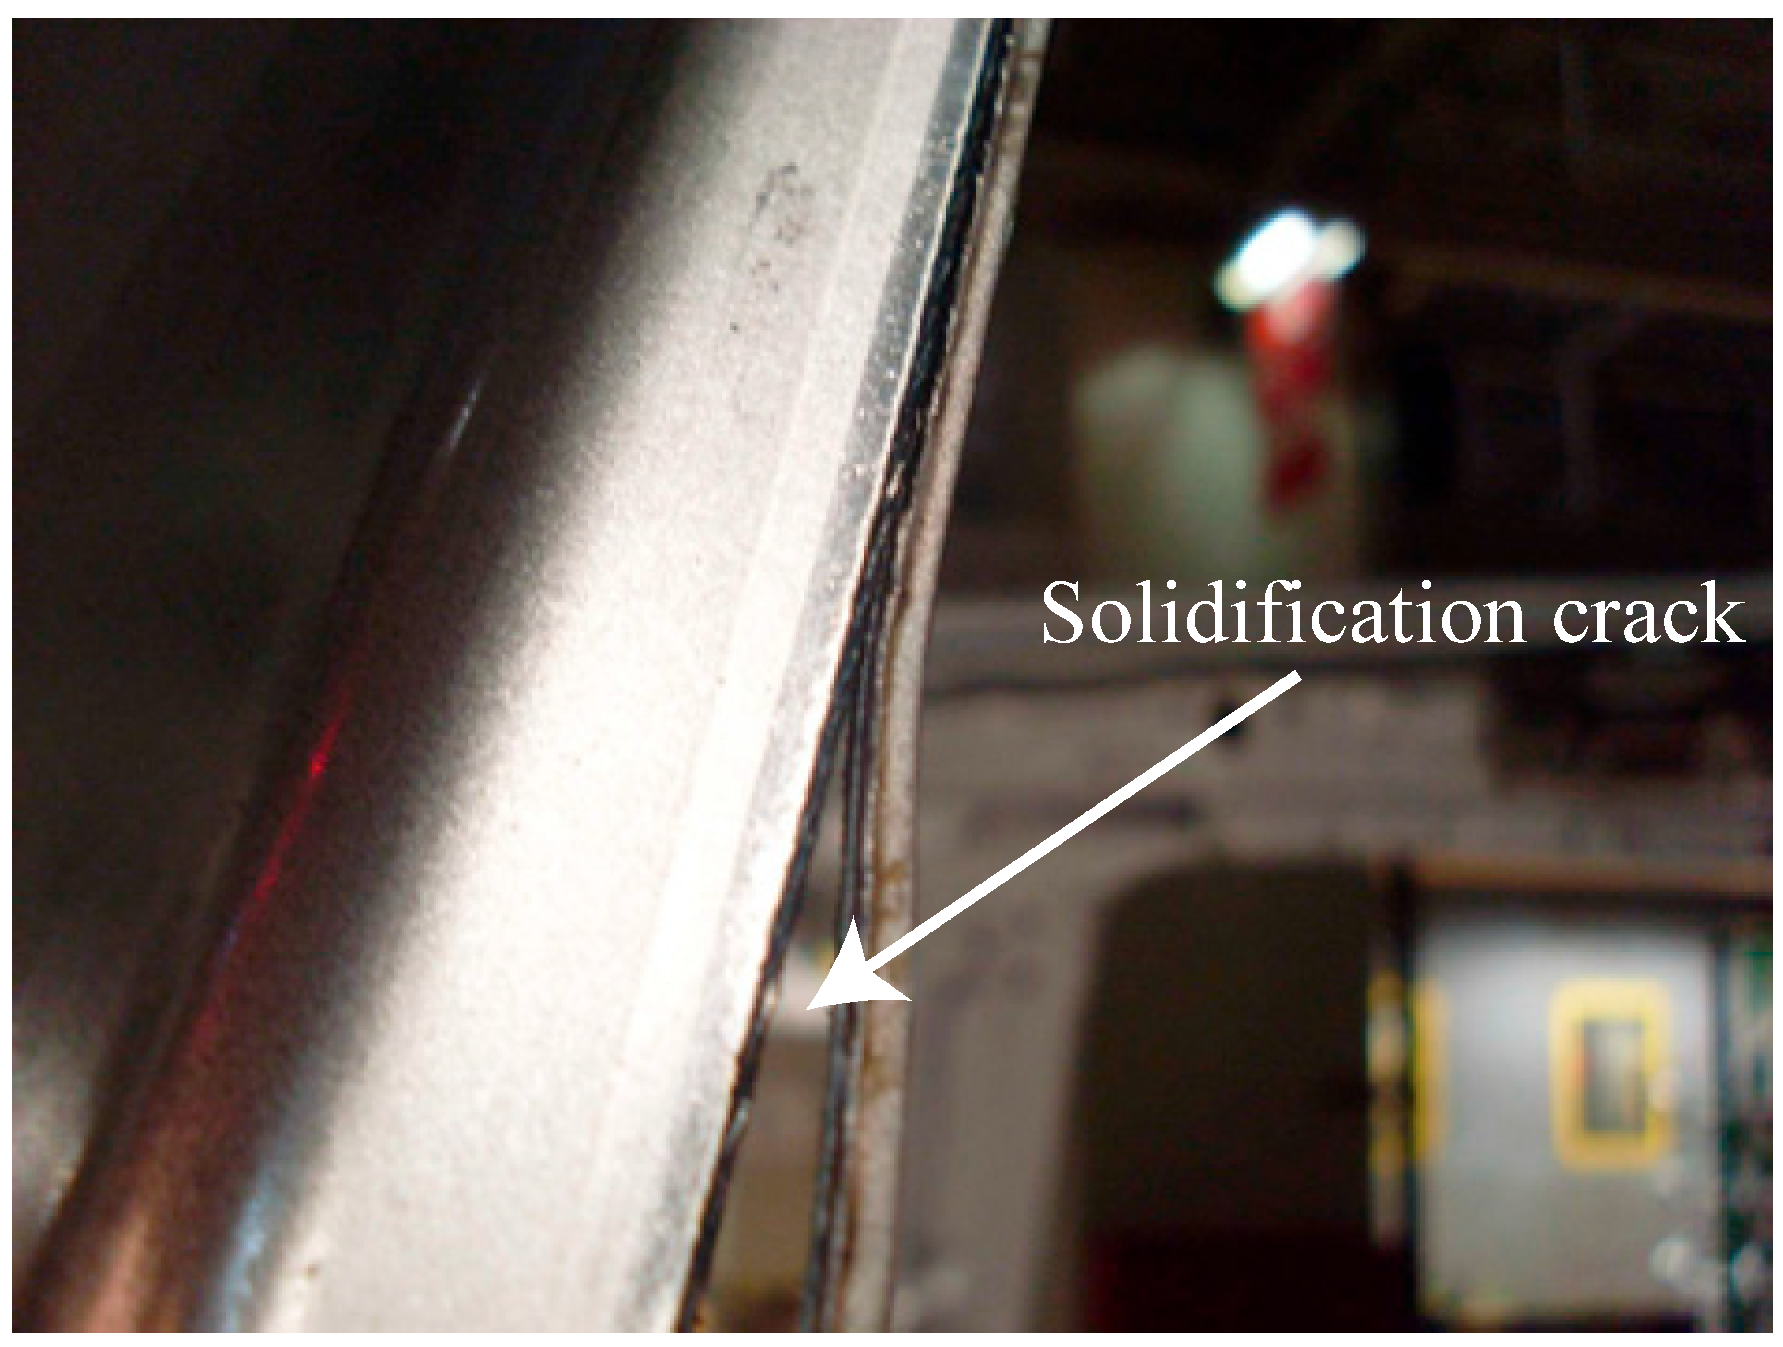
Some automotive industries have reported solidification cracking in certain AHSS grades during laser welding [15]. For instance, Larsson [16] reported that solidification cracking can occur during laser welding of B-pillar made of Ultra High Strength Steels (UHSS) used in the Volvo XC60 car body (Figure 1). In order to test the resistance to solidification cracking in thin sheets, VDEh(German Steel Institute) has developed a self-restraint hot cracking test [17]. In this test, bead-on-plate laser welding is conducted on single-sided clamped rectangular steel sheets with dimensions of 90 × 45 mm2. The starting position is set at a distance of 3 from the free edge with the welding direction inclined 7° to the edge. Crack length is used to assess the hot cracking susceptibility of various alloys. The test is of practical importance for overlap and flange welding geometries in order to minimize the flange width. A typical car body has 40 of weld flanges that are welded using resistance spot welding [18]. Resistance spot welding requires 16 of the flange width to fit the electrode system on either side [19]. The flange width can be minimized by using laser welding (Figure 2) and can lead to an overall weight reduction of up to 30–40 kg [18]. The distance from the free edge at which the welding is carried out is considered important for cracking behavior in terms of the response of the material to the amount of restraint. In this work, a different approach was adopted compared to the standard hot cracking test. Different laser welding experiments were conducted at various starting positions from the free edge at an inclination of zero degrees, i.e., parallel to the free edge. This approach was followed,
- to maintain a constant restraint with respect to distance from the free edge during welding,
- to understand the effect of self-restraint on susceptibility to cracking,
- to identify the critical condition as a function of welding distance from the free edge in which no crack occurs,
- to develop an FE-based model to understand the process and delineate the critical factor(s) that may be responsible for the cracking behavior.
2. Materials and Methods
In the present work, the weld solidification cracking susceptibility of a Transformation-Induced Plasticity (TRIP) steel was studied using the aforementioned test arrangement. Crack length was measured for each case, and the fracture surface was observed by scanning electron microscopy. A Finite Element (FE)-based thermal elasto-plastic model of the welding was constructed to substantiate the results obtained from experiments. The occurrence of a crack was not simulated explicitly. Rather, the accumulated transverse strain along the direction perpendicular to the weld was used to assess the solidification cracking susceptibility. Based on the developed understanding, optimum processing conditions can be defined to weld steels that are otherwise susceptible to solidification cracking.
2.1. Experimental Section
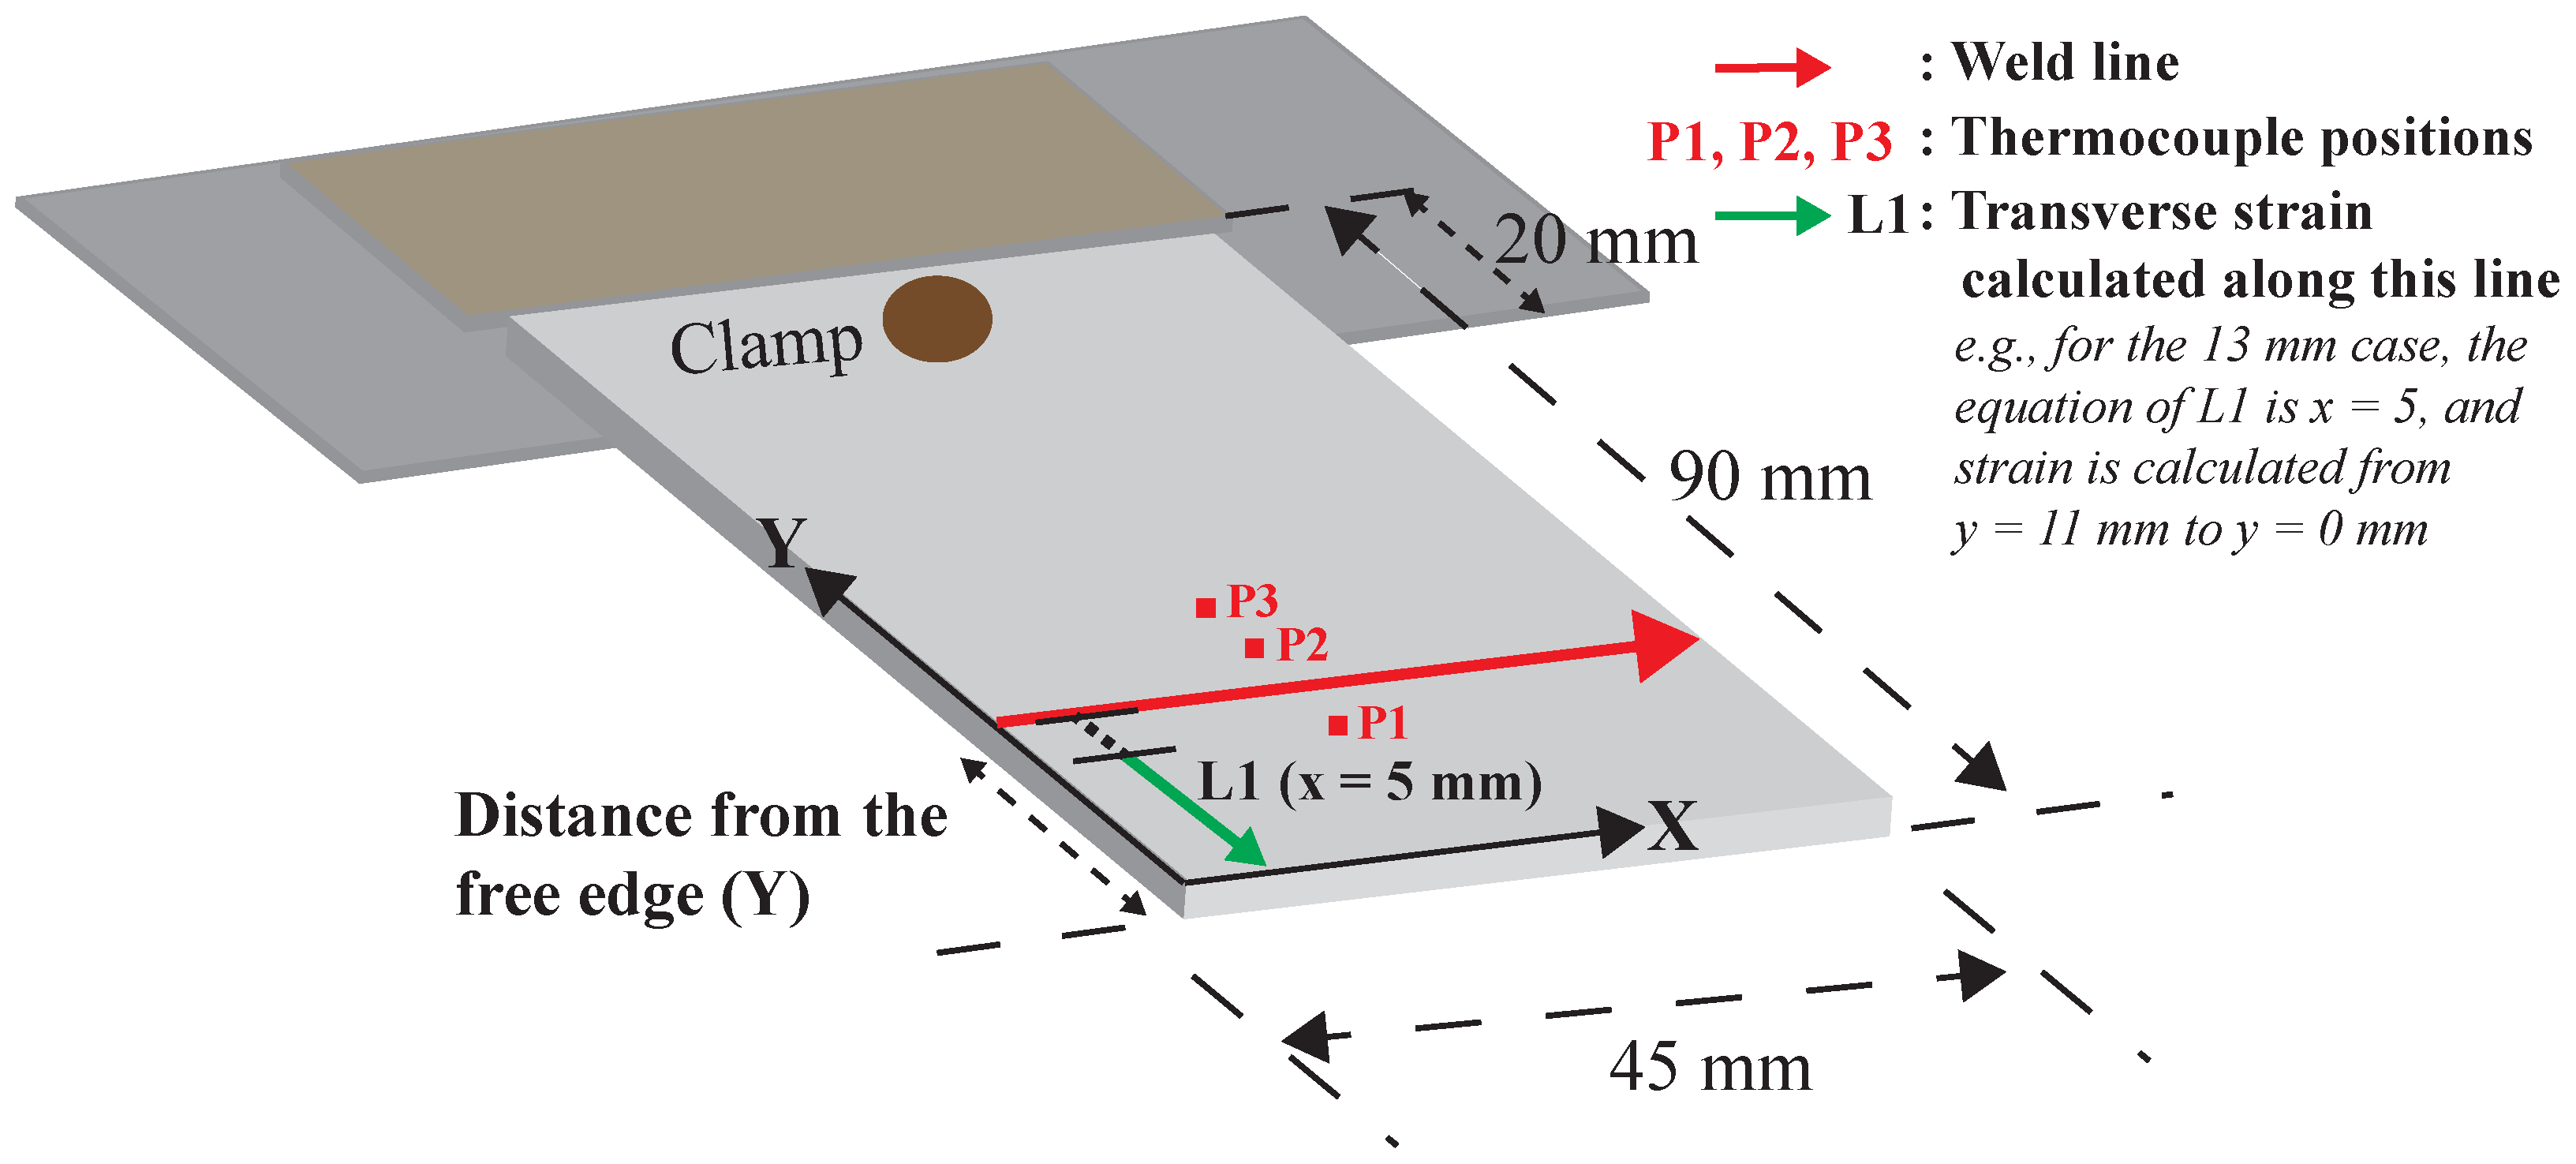
A 3 Nd:YAG laser was used as the heat source. The bead-on-plate laser welding experiments were conducted in keyhole mode using a power of 1100 and a welding speed of 10 −1. Specimens were kept at the focal point of the optical system, and the laser spot size was 0.6mm. The experimental arrangement is shown schematically in Figure 3. The coordinate system used in the FE model is also included. The dimensions of the rectangular steel sheets were 90 × 45 mm2 and 1.25 mm thick. Table 1 shows the elemental composition of the TRIP steel used in this work. For all the experiments, the starting beam position was at , and welding was carried out along the x direction. The starting y ordinate for different experiments was varied from 3 to 13 with each increment being 2 . Each experiment was repeated with a fresh plate at least three times. The experiment at 5 was repeated ten times. Hereafter, each experiment at a certain distance from the free edge is referred to as a case. Images during welding were captured using a high speed camera. For the 13 case, the temperature cycle was measured at three Positions (P1, P2 and P3) near the fusion boundary, by using spot welded K-type thermocouples. Furthermore, the evolving transverse strain near the weld fusion boundary was measured in situ using the digital image correlation method [20]. The width of the weld bead was approximately . The length of the weld centerline crack was measured for each case. The fracture surface of the crack was observed with a JEOL 6500F scanning electron microscope (JEOL, Tokyo, Japan). Additional experiments were conducted with different heat input for the 13 , 11 , 9 and 7 cases. Heat input was varied by changing the welding speed to 11 −1, i.e., 10% decrease in heat input, 12 −1, i.e., 20% decrease in heat input, and 9 −1, i.e., 10% increase in heat input. The overall experimental scheme is listed in Table 2.
2.2. Modeling Approach
A sequentially-coupled 3D Finite Element (FE) thermal mechanical model with isotropic hardening was utilized for laser bead-on-plate welding. Initially, a transient heat transfer analysis was carried out to obtain the time-dependent thermal history. In this study, a frequently-used [21,22,23] 3D conical Gaussian heat source was adopted to describe the laser beam heat input (see Figure 4). The power density distribution at any plane perpendicular to the z-axis is expressed as:
where is the net volumetric heat flux in W m−3, is the maximum heat source intensity in W m−3 and r is the radial distance from the center of the heat source and expressed as:
The radius of the heat source () is assumed to decrease linearly through the thickness of the cone and can be expressed as:
where and are the radii of the top and bottom surfaces of the conical heat source, respectively. The z coordinates of the top and bottom surfaces are and , respectively. can be determined via the energy conservation principle:
using and further leads to,
Here, is the process efficiency of the laser welding and P is the laser power. The height of the heat source, i.e., H was considered to be equal to the sheet thickness, and , were chosen to achieve the dimensions of the weld observed in the experiments.
The thermal history, i.e., temperatures (T) at (), was obtained by solving the following Fourier heat transfer equation using the temperature-dependent thermal properties of the material,
Here, is the temperature-dependent thermal conductivity in −1 −1, is the temperature-dependent density in kg m−3 and is the temperature-dependent specific heat in −1 −1.
Subsequently, the obtained thermal history was imported into the mechanical model. Hibbitt et al. [24] used the sequential thermal-mechanical modeling approach and based on the comparison with welding experiments concluded that the effect of mechanical behavior on thermal load was negligible. Since then, the sequential coupling approach was frequently applied in welding research [25,26,27]. A commercial software, COMSOLTM (version 5.2, COMSOL, Stockholm, Sweden) was used for the present analysis. Quadratic elements with a minimum mesh size of 0.3 × 0.3 mm2 and a thickness of 1 were used. The process efficiency of laser welding, i.e., was assumed to be 40% based on previous work [28] on the similar experimental arrangement. In this way, heat losses due to convection and radiation in the keyhole were taken into account. To implement the clamping conditions in the mechanical model, the displacements of the nodes between the clamp in the three directions were fixed.
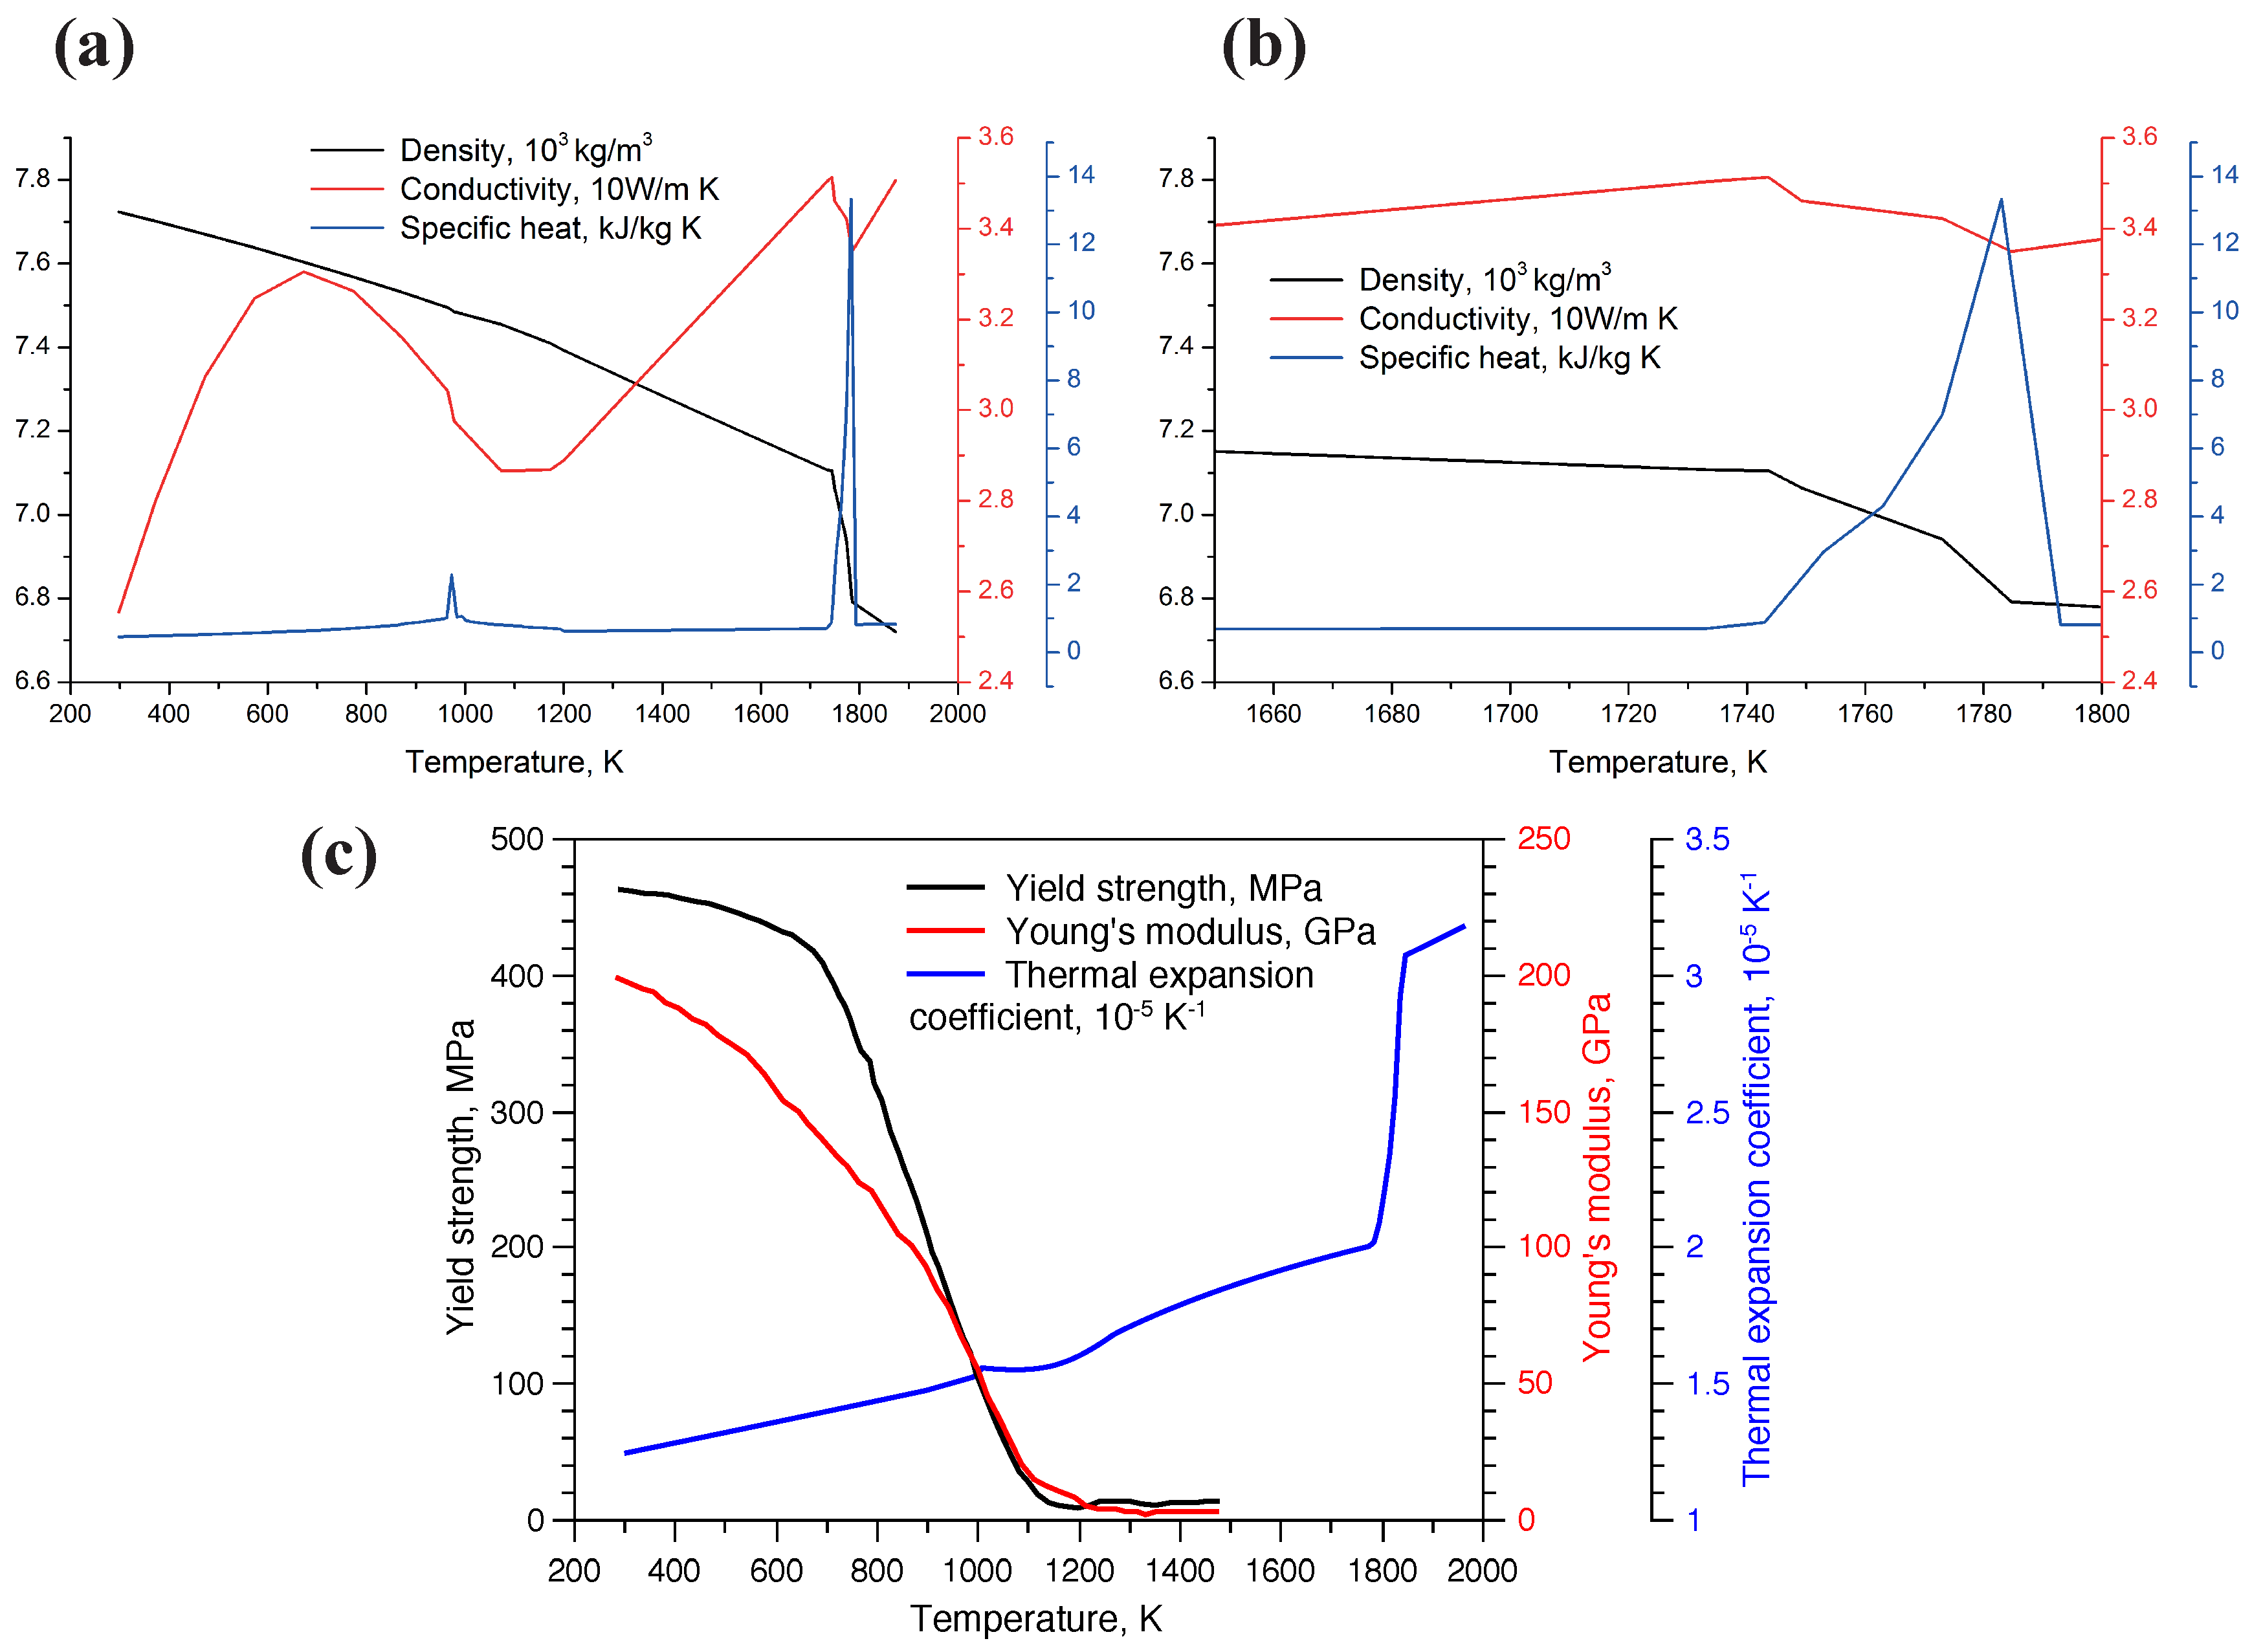
The temperature-dependent thermal and mechanical properties of the steel (Figure 5) used in the present work were taken from [29]. Note that the chemical composition of the TRIP steel used in [29] was similar to the one used in this work. Latent heat, absorbed or released during melting (or solidification), was incorporated in the temperature-dependent specific heat capacity. The latent heat absorbed during melting was related to the temperature-phase fraction data, obtained using the Scheil–Gulliver solidification approximation. The thermal expansion coefficient () during solidification was considered to be dependent on the amount of solid and liquid phases. The solidification temperature range, solid and liquid phase fraction data of the steel composition were obtained from a commercial thermodynamic software, Thermo-CalcTM (database TCFE7, Thermo-Calc, Stockholm, Sweden).
3. Results
Figure 6 shows the experimental and simulated thermal cycle at points P1, P2 and P3, when welding was carried out a distance of 13 . The position of the points P1, P2 and P3 with respect to the weld centerline is also indicated in the figure. P1 is at a distance of 3 (towards the free edge), while P2 and P3 are at and 4 (towards the fixed edge). The maximum difference between the experimental and simulated temperature is 4.9%, and the standard deviation is 2%. The simulated weld bead size was also found to be in good agreement with the experimental obtained size. Therefore, the thermal history from the heat transfer model was applied in the mechanical analysis. The thermomechanical model was validated using the transverse strain measured by the digital image correlation method [20].
3.1. Observation of Solidification Cracking
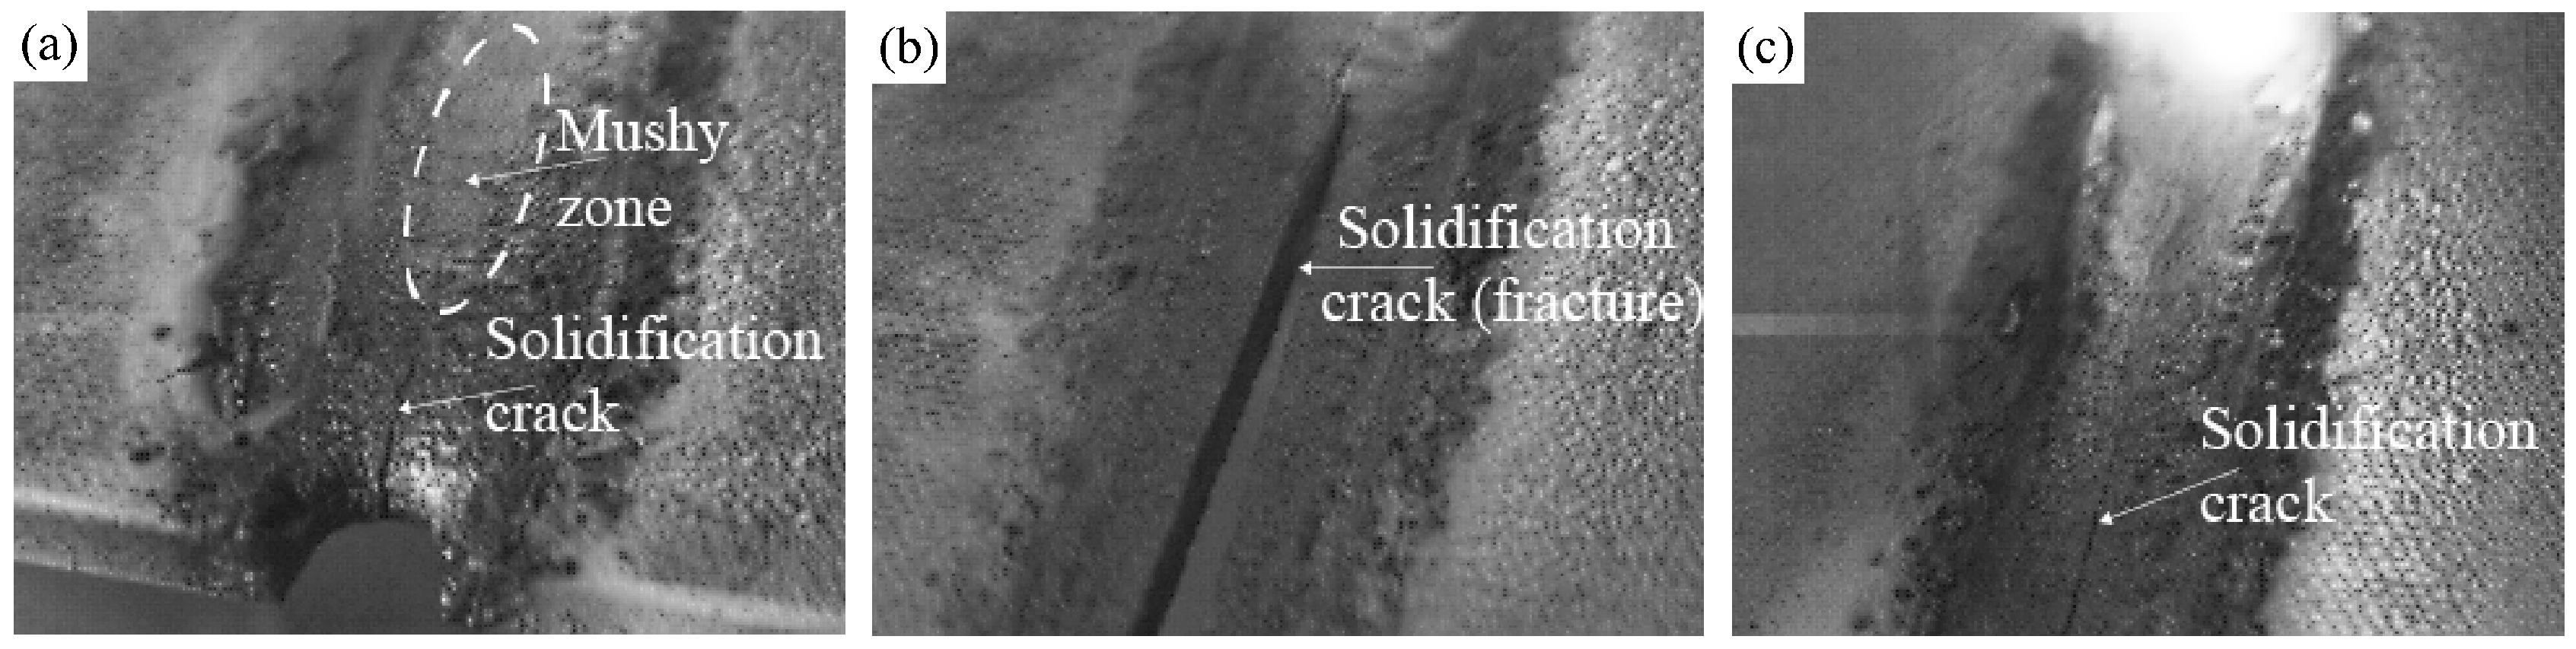
Figure 7a,b shows high speed camera images captured while welding was carried out for the 5 case. It is clear from these images that crack formation occurs during welding, and the crack follows the trailing edge of the mushy zone. Figure 7c shows the image when welding was carried out at a distance of 7 from the free edge. After a certain distance, the crack ceased to propagate. The videos are available as Supplementary Data in the online version of this manuscript. The measured average crack length and the standard deviation for different cases and heat inputs are shown in Figure 8. For the case of 5 , fracture was observed along the entire weld in all experiments. On further increase of the distance from the free edge, the crack length decreased, and for the case of 13 (and onwards), no solidification cracks were observed. With a 10% decrease in heat input, the crack length reduced for the 7 and 9 cases, while no crack was observed for the 11 case. With a 20% reduction in heat input, the crack length reduced further for the 7 case, and no crack was observed for the 9 case. When the heat input was increased by 10%, a crack was also observed in the case of 13 . The run-on plate was not used in the experiments, the use of which may effect the crack initiation. The standard hot cracking test does not mention the use of run-on and run-off plates. The extent of edge effect on crack initiation was also material dependent. In our earlier work [8], identical hot cracking tests were performed on Dual Phase (DP) steel sheets, and solidification cracking was not observed in any of the cases.
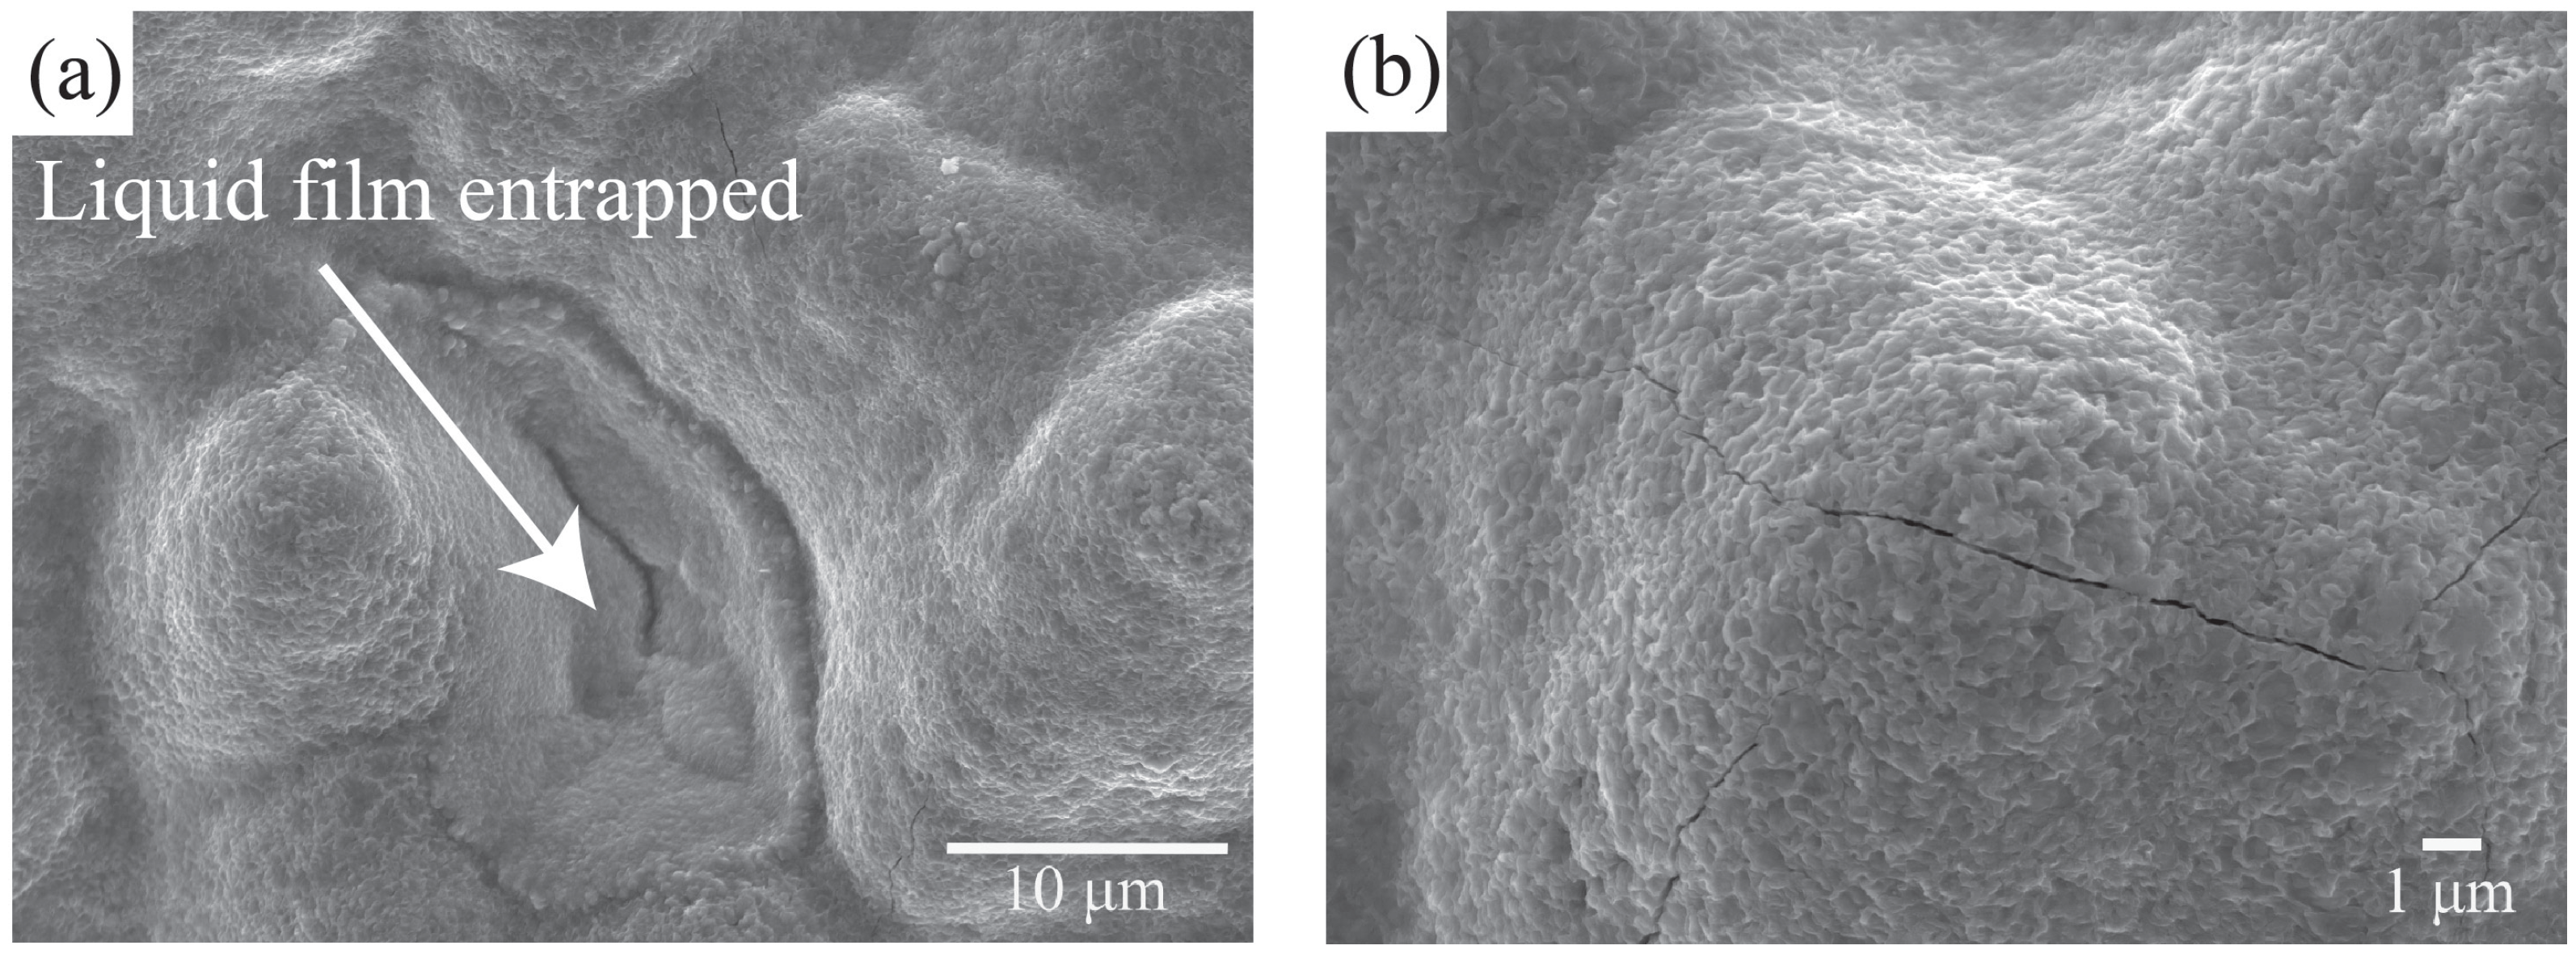
The fracture surface of welded TRIP steel sheet was further studied by means of scanning electron microscopy. Figure 9a indicates that a liquid film entrapped between the dendrites led to cracking. This is an important observation as it helps to conclude that the cracks are indeed formed during the terminal stage of solidification. Figure 9b shows microcracks, which occur at the last stage of solidification on the dendrite tips.
3.2. Thermomechanical Analysis of the Process
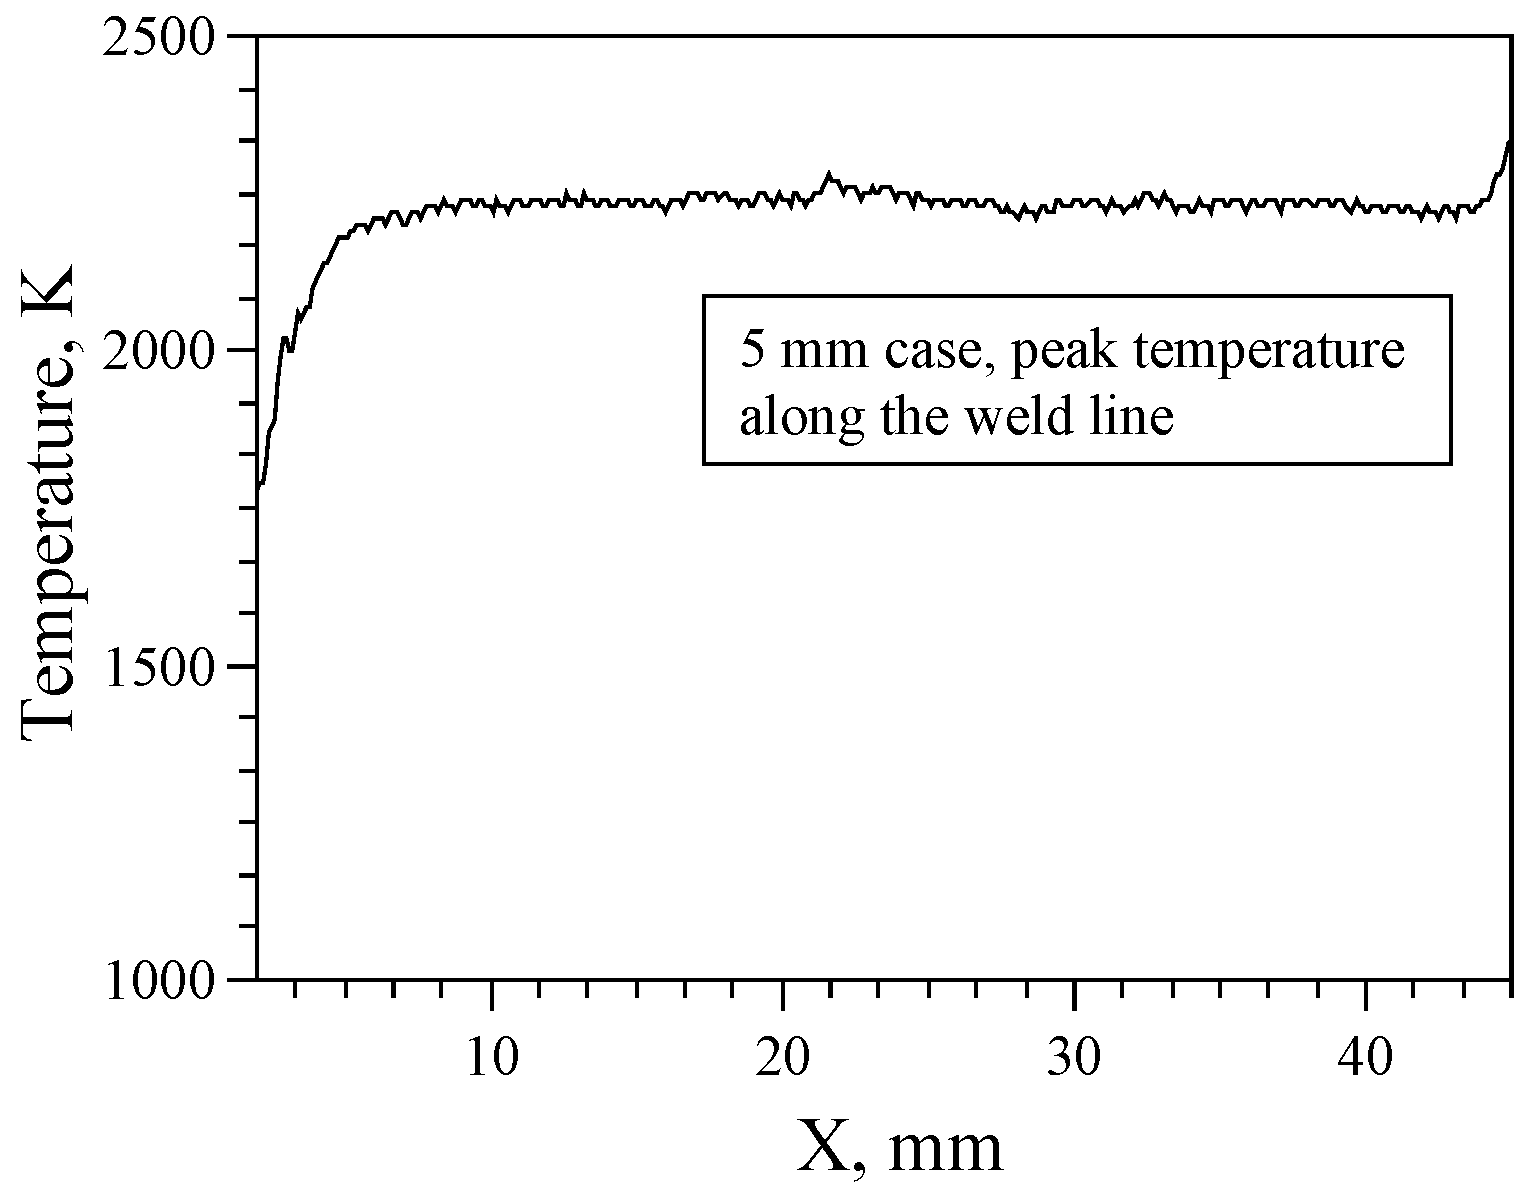
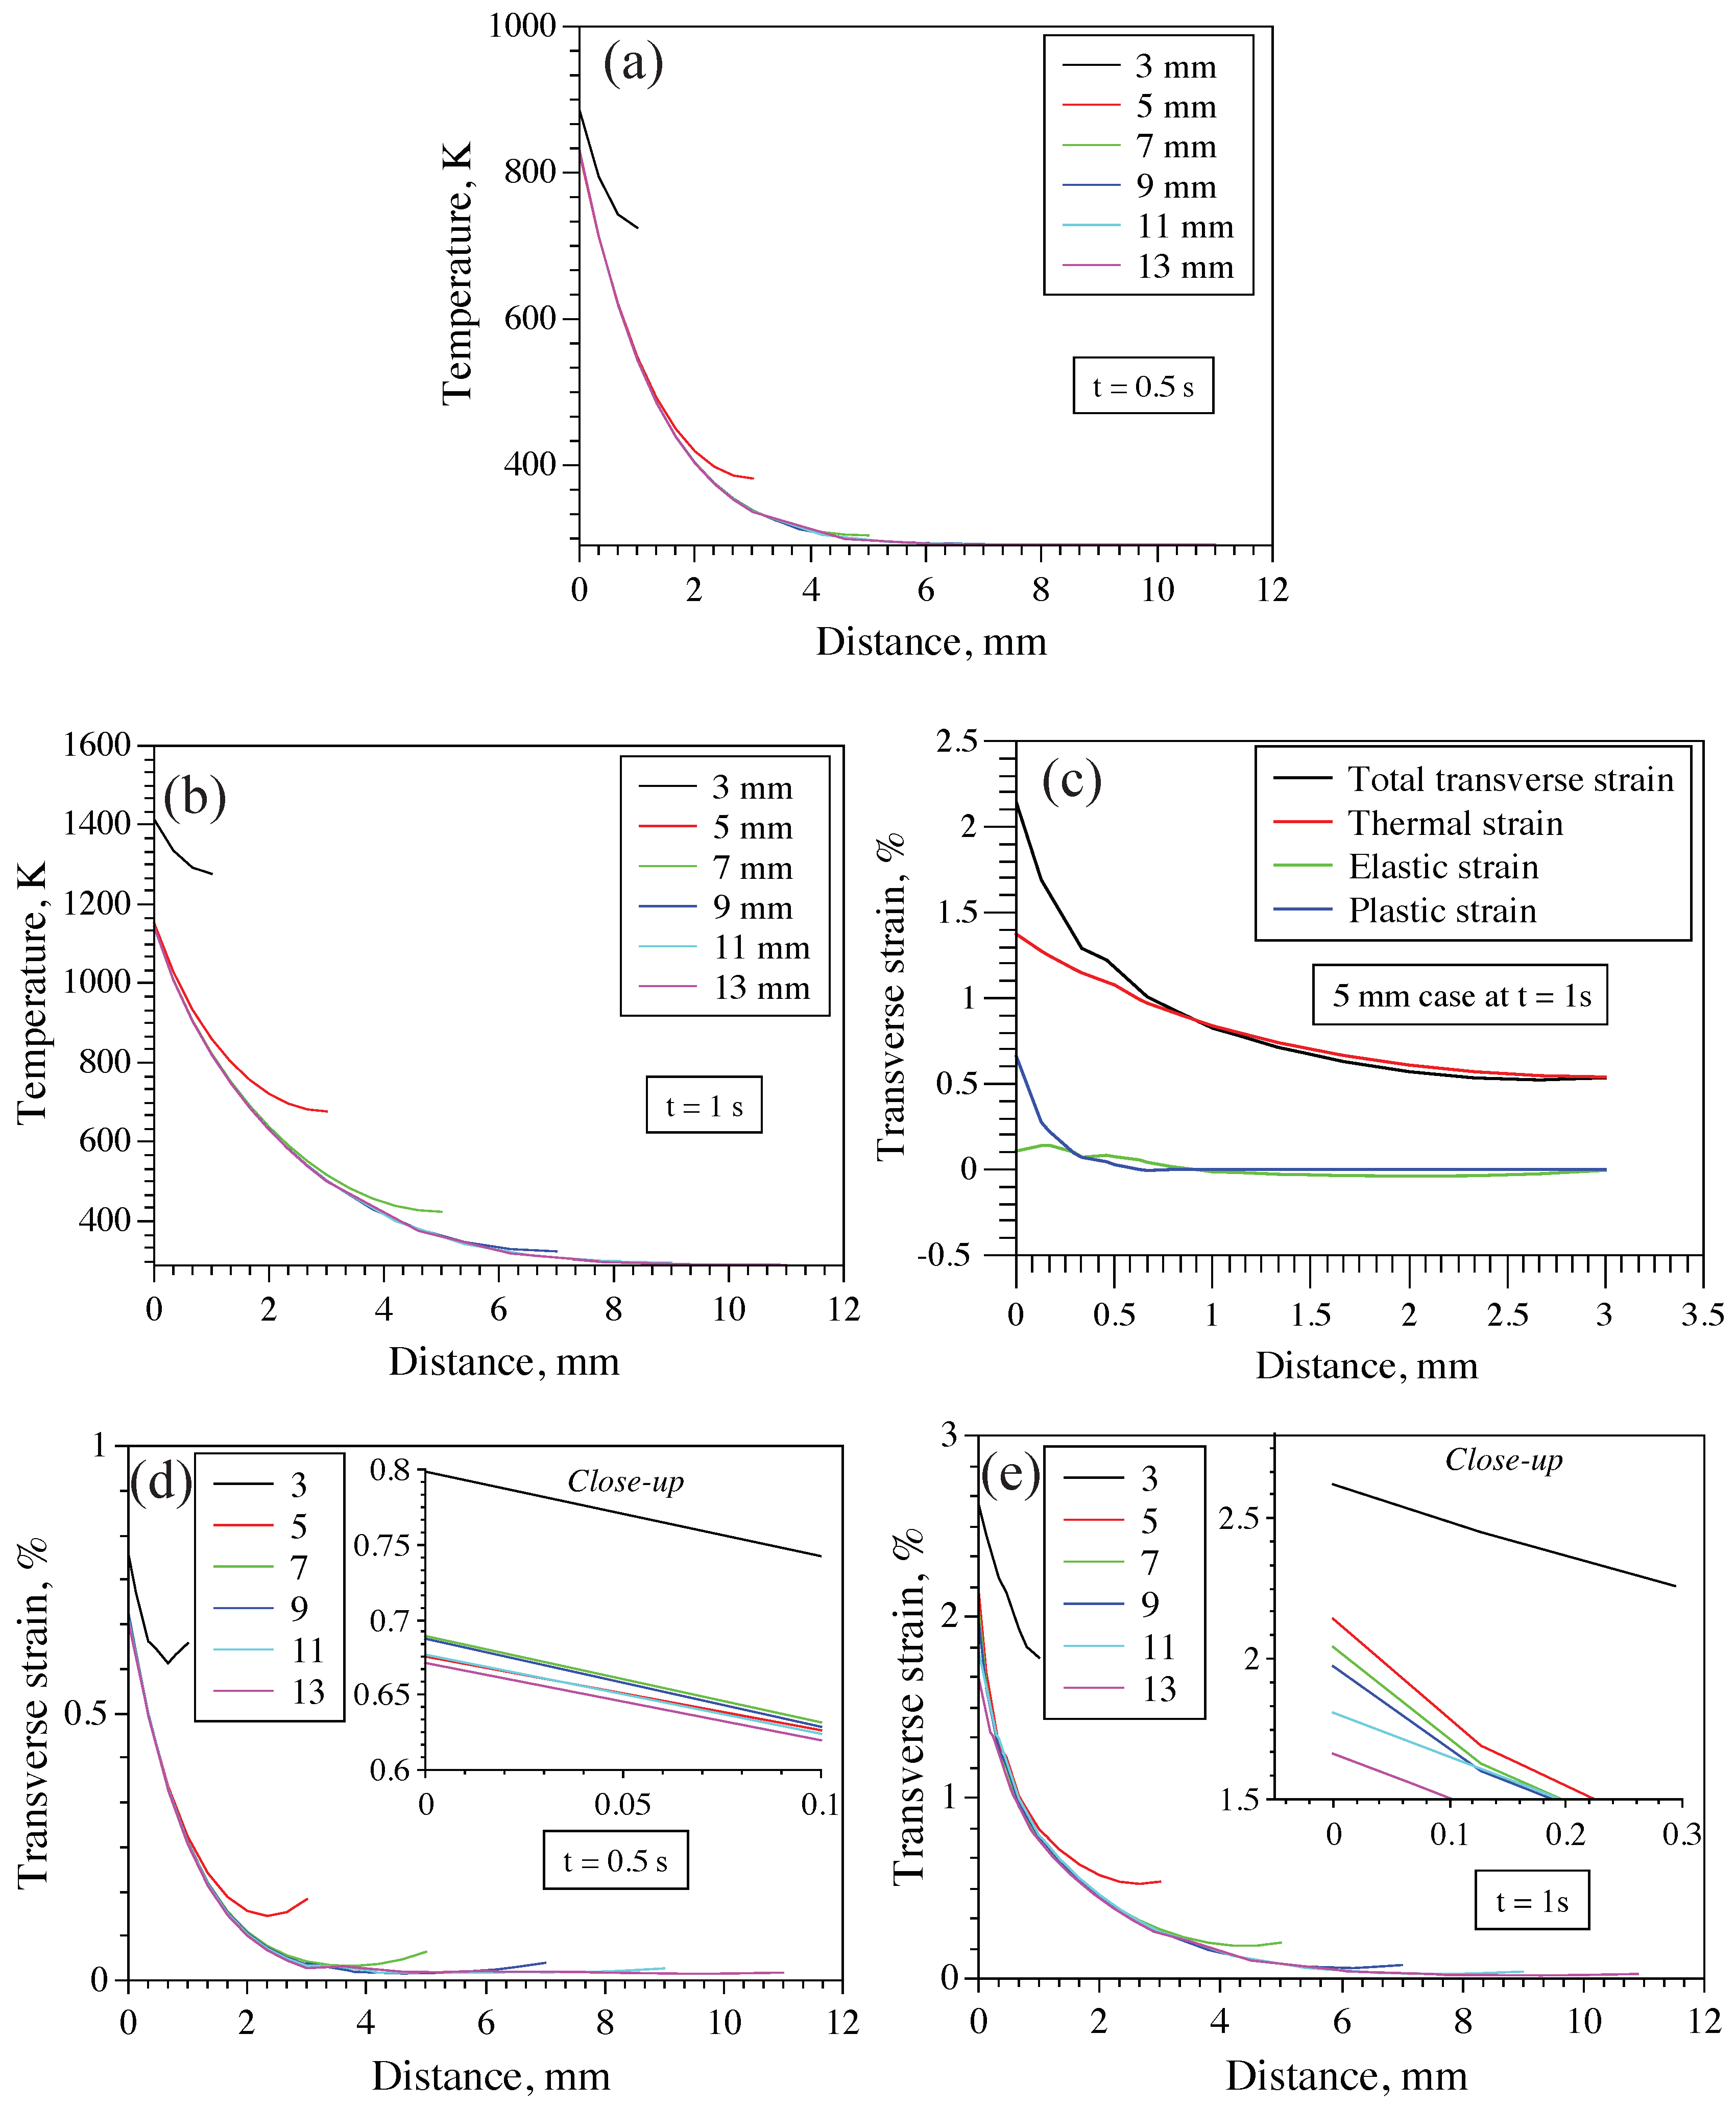
Figure 10 shows the simulated results of peak temperature at the weld centerline as a function of distance for the 5 case. Due to the introduction of the heat source, the peak temperature is low at the beginning. The peak temperature reaches the steady state after approximately 5 (). However, due to accumulation of heat, a higher peak temperature is reached towards the last 2–3 . Thermal and transverse strain analysis was conducted under the steady state regime at along the y direction. Transverse strain data along a line L1 with starting point 2 mm from the weld centerline were extracted from the simulation results. The region in the mushy zone and the prevailing conditions where the analysis was performed are shown schematically in Figure 11 at . At and , the fraction of solid () approaches one at the weld centerline. Temperature and transverse strain along the line L1 were extracted at various times. Using the constitutive behavior, the total transverse strain can be decomposed as:
Here, is the total transverse strain and terms on the right hand side are the elastic, plastic and thermal transverse strains, respectively. Note that the volumetric strain due to phase transformation is included in the linear coefficient of thermal expansion.
Figure 12a,b shows the temperature as a function of distance along L1 at and for different experimental cases. Figure 12c shows the simulated elastic, plastic, thermal and total transverse strain for the 5 case. Here, the thermal strain includes the contribution from solidification shrinkage, thermal contraction and phase transformation. From this figure, it can be inferred that the elastic and plastic strains are small compared to the thermal strain. It is thus the thermal strain that forms the significant portion of the total strain. Note that the viscoplastic effect of the material at high temperature is not considered in this work. Safari et al. [31] found the effect of viscoplasticity on the total transverse strain to be negligible. Figure 12d,e shows the transverse strain (in %) as a function of distance along L1 at and for different experimental cases. At , the transverse strain is a maximum at the starting point of line L1 for the 3 case and decreases as the welding distance from the free edge is increased. For the 13 case; in which no crack was observed, the threshold transverse strain is ≈.
3.3. Effect of Heat Input on Transverse Strain and Crack Susceptibility
To study the effect of heat input on the transverse strain, travel speed was varied in the FE model. The maximum transverse strain for the 11 mm case (Figure 13a) with 10% less heat input was ≈1.6%, i.e., lower than the threshold strain of the 13 case in which no cracking was observed. With 20% less heat input, the maximum transverse strain for the 9 case was ≈1.5%, i.e., below the threshold strain, while with 10% less heat input, the maximum transverse strain was ≈1.8%, i.e., above the threshold strain (Figure 13b). For the 7 case, the maximum transverse strain was higher than the threshold strain for both 10% and 20% reduced heat input. For the 13 case, with 10% higher heat input, the maximum transverse strain increased to 2.1%, as shown in Figure 13c.
In order to vary heat input, welding experiments were conducted with different travel speeds. A reversal in cracking tendency was observed; no crack was observed in the 11 case with 10% less heat input, and no crack was observed in the 9 case with 20% less heat input. With 10% higher heat input, a crack was observed even in the 13 case. The average crack length as a function of distance from the free edge and heat input is shown in Figure 8.
4. Discussion
The measured temperature cycles at the thermocouple positions and the simulated results show good agreement (Figure 6). Furthermore, the slow heat dissipation (or heat accumulation) due to a reduced amount of material towards the free edge is captured well in the simulated thermal cycles. The experimental fusion zone dimensions were also found to be in agreement with the simulated ones.
The maximum transverse strain along line L1 decreases from the 3 case to the 13 case. This result agrees well with the cracking susceptibility observed experimentally. It is observed that as the degree of self-restraint increases, the susceptibility to solidification cracking decreases, which is consistent with earlier studies [32,33]. For the 13 case, no solidification cracks were observed, and the maximum transverse strain along L1 is ≈1.7%. This value can be used as a safety factor to avoid solidification cracking in the steel tested in this work, i.e., a threshold value. A lower heat input reduces the thermal strain along line L1. Since thermal strain contributes significantly towards the total transverse strain (refer to Figure 12c), the overall transverse strain decreases. This leads to a reduction in the critical distance from the free edge at which no solidification cracking occurs. Reduction of heat input by 10% decreases the critical distance by 2 mm, while a 20% reduction decreases it by 4 mm. An increase in travel speed could be beneficial in reducing the flange width and obtaining good welds in materials that are otherwise susceptible to solidification cracking.
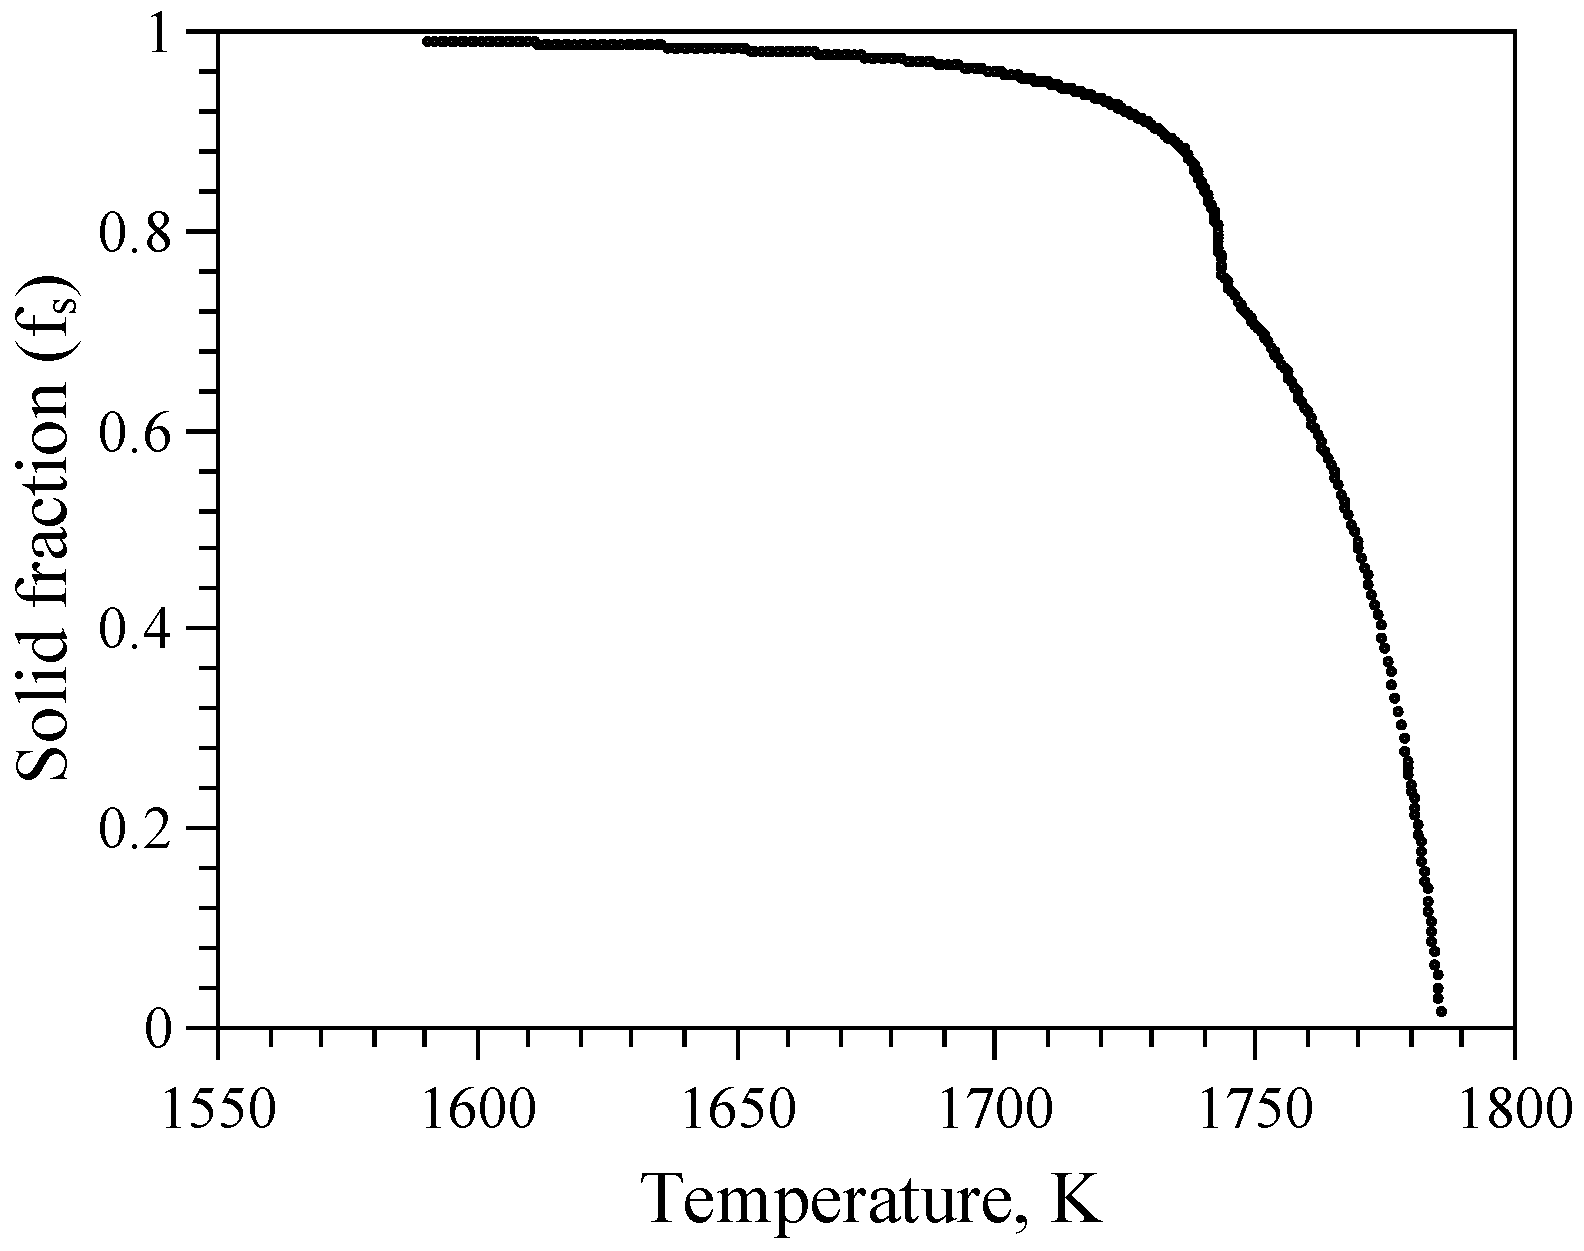
Tensile strains are built up behind a moving weld pool due to both solidification shrinkage and thermal contraction [9,34]. Solidification cracking occurs when the resistance of a material to cracking is overridden by the mechanical driving force for cracking. Generally, the Brittle Temperature Range (BTR) of an alloy, the temperature range over which cracking is found to occur, is used as a measure of susceptibility to solidification cracking. Sometimes, BTR is also defined as the difference between liquidus and solidus temperatures [35]. Senda et al. [36] and later on Nakagawa et al. [37], using the transvarestraint test, measured temperatures at the tail of the weld pool by plunging thermocouples. The BTR was assumed to be proportional to the maximum crack length and was defined as the temperature difference between the two extremities of the crack. However, large disparities exist in the BTR of the same material [38], raising issues with the accuracy of the method. BTR, being a material-dependent parameter, is essentially constant for the steel investigated in this study. Therefore, BTR alone cannot explain the different cracking behaviors. Clyne et al. [39] reported that the cracking susceptibility index of an alloy is directly related to the freezing time. Freezing time at the weld center was extracted from the simulated thermal histories of two cases, first the 9 case with normal heat input, i.e., in which a crack was observed, and second, the 9 case with a 20% reduction in heat input, i.e., in which no crack was observed. Liquidus and solidus temperatures were taken from the Scheil-Gulliver non-equilibrium solidification model (Figure 14). The freezing time for the first case is , while for the second case, it is . Reduction in heat input leads to higher cooling rates, and thus, the freezing time decreases. In the second case, the material spends less time in the vulnerable cracking regime and therefore is less susceptible to cracking. To compare, freezing time was also extracted for the 13 case with normal heat input and was found to be . No crack was observed in this case. It can be inferred that freezing time can only be used as a cracking susceptibility index when the mechanical restraint conditions do not change, and therefore, only relative tendencies can be compared.
Although implicit, the calculation of macroscopic strain using the FE method is based on continuum mechanics. Thus, the cracking process that occurs at the microscopic level is directly related to the local macroscopic stress/strain development in the crack vulnerable regime [40]. This approach accounts for both the thermal histories and the related mechanical response of the material.
5. Conclusions
- With the use of the presented hot cracking test, in general, any given material is most susceptible to solidification cracking when welding is carried out close to the free edge. As the distance from the free edge increases, i.e., the degree of self-restraint increases, the susceptibility to cracking decreases.
- The FE simulation study shows that macroscopic transverse strain near the mushy zone can be used as an indicator to explain the experimentally-observed cracking susceptibility with regards to crack length.
- A threshold transverse strain at a point close to the fusion boundary is determined for which no cracking was observed. It is further validated by varying the heat input both in the model and the experiments.
- Reducing the heat input decreases the susceptibility to solidification cracking or, in other words, it decreases the critical distance from the free edge at which cracking does not occur.
Supplementary Materials
The following are available online at https://www.mdpi.com/2075-4701/8/9/673/s1, Video S1: Welding at a distance of 5 mm from the free edge, Video S2: Welding at a distance of 7 mm from the free edge.
Author Contributions
G.A. designed and conducted the study. H.G. provided support in numerical modeling. G.A. wrote the manuscript. M.A. and M.H. supervised the study and reviewed the manuscript.
Funding
This research was carried out under Project Numbers F22.8.13485a and F22.8.13485b in the framework of the Partnership Program of the Materials innovation institute (M2i) (www.m2i.nl) and the Foundation for Fundamental Research on Matter (FOM) (www.fom.nl), which is part of the Netherlands Organisation for Scientific Research (www.nwo.nl).
Acknowledgments
The authors would like to thank the industrial partner in this project Tata Steel Nederland B.V. for its financial support. Professor Ian Richardson (TU Delft) is acknowledged for useful discussion.
Conflicts of Interest
The authors declare no conflict of interest.
References
- Pumphrey, W.I.; Jennings, P.H. A consideration of the nature of brittleness and temperature above the solidus in castings and welds in aluminum alloys. J. Inst. Met. 1948, 75, 235–256. [Google Scholar]
- Pellini, W.S. Strain Theory of Hot-tearing. Foundry 1952, 80, 124–133. [Google Scholar]
- Prokhorov, N.N. The problem of the strength of metals while solidifying during welding. Svar. Proiz. 1956, 6, 5–11. [Google Scholar]
- Coniglio, N.; Cross, C.E. Mechanisms for Solidification Crack Initiation and Growth in Aluminum Welding. Metall. Mater. Trans. A 2009, 40, 2718–2728. [Google Scholar] [CrossRef]
- Agarwal, G.; Amirthalingam, M.; Moon, S.C.; Dippenaar, R.J.; Richardson, I.M.; Hermans, M.J.M. Experimental evidence of liquid feeding during solidification of a steel. Scr. Mater. 2018, 146, 105–109. [Google Scholar] [CrossRef]
- Rappaz, M.; Dantzig, J. Solidification, 1st ed.; EFPL Press: Lausanne, Switzerland, 2009; pp. 519–563. [Google Scholar]
- Kou, S. Welding Metallurgy, 2nd ed.; John Wiley & Sons, Inc.: Hoboken, NJ, USA, 2003; pp. 263–296. [Google Scholar]
- Agarwal, G.; Kumar, A.; Gao, H.; Amirthalingam, M.; Moon, S.C.; Dippenaar, R.J.; Richardson, I.M.; Hermans, M.J.M. Study of Solidification Cracking in a Transformation-Induced Plasticity-Aided Steel. Metall. Mater. Trans. A 2018, 49, 1015–1020. [Google Scholar] [CrossRef] [Green Version]
- Zacharia, T. Dynamic stresses in weld metal hot cracking. Weld. J. 1994, 73, 164S–172S. [Google Scholar]
- Eskin, D.G.; Katgerman, L. A Quest for a New Hot Tearing Criterion. Metall. Mater. Trans. A 2007, 38, 1511–1519. [Google Scholar] [CrossRef] [Green Version]
- Rappaz, M.; Drezet, J.M.; Gremaud, M. A new hot-tearing criterion. Metall. Mater. Trans. A 1999, 30, 449–455. [Google Scholar] [CrossRef] [Green Version]
- Kou, S. A criterion for cracking during solidification. Acta Mater. 2015, 88, 366–374. [Google Scholar] [CrossRef]
- Matsuda, F.; Nakagawa, H.; Nakata, K.; Okada, H. The VDR cracking test for solidification crack susceptibility on weld metals and its application to aluminum alloys. Trans. JWRI 1979, 8, 85–95. [Google Scholar]
- Katgerman, L. A Mathematical Model for Hot Cracking of Aluminum Alloys During D.C. Casting. JOM 1982, 34, 46–49. [Google Scholar] [CrossRef]
- Boesenkool, R.; van der Aa, E.M.; van der Veldt, T.; Tata Steel IJmuiden, The Netherlands. Personal communication, 2018.
- Larsson, J.K. Avoidance of crack inducement when laser welding hot-formed car body components—A variable analysis. Phys. Procedia 2010, 5, 115–124. [Google Scholar] [CrossRef]
- VDEh. SEP 1220-3: Testing and Documentation Guideline for the Joinability of Thin Sheet of Steel—Part 3: Laser Beam Welding; Verlag Stahleisen GmbH: Düsseldorf, Germany, 2011. [Google Scholar]
- Omar, M.A. Automotive Joining. In The Automotive Body Manufacturing Systems and Processes; Wiley-Blackwell: Hoboken, NJ, USA, 2011; Chapter 3; pp. 107–176. [Google Scholar] [CrossRef]
- Hong, K.M.; Shin, Y.C. Prospects of laser welding technology in the automotive industry: A review. J. Mater. Process. Technol. 2017, 245, 46–69. [Google Scholar] [CrossRef]
- Agarwal, G.; Gao, H.; Amirthalingam, M.; Hermans, M. In-situ strain investigation during laser welding using digital image correlation and finite element based numerical simulation. Sci. Technol. Weld. Join. 2018, 23, 134–139. [Google Scholar] [CrossRef]
- Shanmugam, N.B.; Buvanashekaran, G.; Sankaranarayanasamy, K.; Kumar, S.R. A transient finite element simulation of the temperature and bead profiles of T-joint laser welds. Mater. Des. 2010, 31, 4528–4542. [Google Scholar] [CrossRef]
- Ma, J.; Kong, F.; Kovacevic, R. Finite-element thermal analysis of laser welding of galvanized high-strength steel in a zero-gap lap joint configuration and its experimental verification. Mater. Des. 2012, 36, 348–358. [Google Scholar] [CrossRef]
- Zain-ul-abdein, M.; Nélias, D.; Jullien, J.F.; Deloison, D. Experimental investigation and finite element simulation of laser beam welding induced residual stresses and distortions in thin sheets of AA 6056-T4. Mater. Sci. Eng. A 2010, 527, 3025–3039. [Google Scholar] [CrossRef]
- Hibbitt, H.D.; Marcal, P.V. A numerical, thermo-mechanical model for the welding and subsequent loading of a fabricated structure. Comput. Struct. 1973, 3, 1145–1174. [Google Scholar] [CrossRef] [Green Version]
- Friedman, E. Thermomechanical Analysis of the Welding Process Using the Finite Element Method. J. Press. Vessel Technol. 1975, 97, 206–213. [Google Scholar] [CrossRef]
- Gao, H.; Dutta, R.K.; Huizenga, R.M.; Amirthalingam, M.; Hermans, M.J.M.; Buslaps, T.; Richardson, I.M. Pass-by-pass stress evolution in multipass welds. Sci. Technol. Weld. Join. 2014, 19, 256–264. [Google Scholar] [CrossRef]
- Feulvarch, E.; Robin, V.; Bergheau, J.M. Thermometallurgical and mechanical modeling of welding—Application to multipass dissimilar metal girth welds. Sci. Technol. Weld. Join. 2011, 16, 221–231. [Google Scholar] [CrossRef]
- Pan, Y. Laser welding of Zinc Coated Steel without Pre-Set Gap. Ph.D. Thesis, Delft University of Technology, Delft, The Netherlands, 2011. [Google Scholar]
- Ahmed, E.A.A. Laser Welding of Advanced High Strength Steels. Ph.D. Thesis, RWTH Aachen University, Aachen, Germany, 2011. [Google Scholar]
- M’Hamdi, M.; Mo, A.; Fjær, H.G. TearSim: A two-phase model addressing hot tearing formation during aluminum direct chill casting. Metall. Mater. Trans. A 2006, 37, 3069–3083. [Google Scholar] [CrossRef]
- Safari, A.R.; Forouzan, M.R.; Shamanian, M. Hot cracking in stainless steel 310s, numerical study and experimental verification. Comput. Mater. Sci. 2012, 63, 182–190. [Google Scholar] [CrossRef]
- Cross, C.E.; Boellinghaus, T. The Effect of Restraint on Weld Solidification Cracking in Aluminium. Weld. World 2006, 50, 51–54. [Google Scholar] [CrossRef]
- Goodwin, G.M. Development of a new hot-cracking test—The sigmajig. Weld. J. 1987, 66, 33s–38s. [Google Scholar]
- Feng, Z. A computational analysis of thermal and mechanical conditions for weld metal solidification cracking. Weld. World 1994, 33, 340–347. [Google Scholar]
- Cross, C.E. On the Origin of Weld Solidification Cracking. In Hot Cracking Phenomena in Welds; Böllinghaus, T., Herold, H., Eds.; Springer: Berlin/Heidelberg, Germany, 2005; pp. 3–18. [Google Scholar]
- Senda, T.; Matsuda, F.; Takano, G.; Watanabe, K.; Kobayashi, T.; Matsuzaka, T. Fundamental Investigations on Solidification Crack Susceptibility for Weld Metals with Trans-Varestraint Test. Trans. Jpn. Weld. Soc. 1971, 2, 141–162. [Google Scholar]
- Matsuda, F.; Nakagawa, H.; Sorada, K. Dynamic Observation of Solidification and Solidification Cracking during Welding with Optical Microscope (I): Solidification Front and Behavior of Cracking. Trans. Jpn. Weld. Soc. 1982, 11, 67–77. [Google Scholar]
- Coniglio, N.; Cross, C.E. Towards Establishment of Weldability Testing Standards for Solidification Cracking. In Cracking Phenomena in Welds IV; Boellinghaus, T., Lippold, J.C., Cross, C.E., Eds.; Springer International Publishing: Cham, Switzerland, 2016; pp. 37–66. [Google Scholar]
- Clyne, T.W.; Wolf, M.; Kurz, W. The effect of melt composition on solidification cracking of steel, with particular reference to continuous casting. Metall. Trans. B 1982, 13, 259–266. [Google Scholar] [CrossRef]
- Feng, Z.; David, S.A.; Zacharia, T.; Tsai, C.L. Quantification of thermomechanical conditions for weld solidification cracking. Sci. Technol. Weld. Join. 1997, 2, 11–19. [Google Scholar] [CrossRef]
Figure 1.
Solidification cracking in the B-pillar of a Volvo XC60 car body. With permission from [16].
Figure 1.
Solidification cracking in the B-pillar of a Volvo XC60 car body. With permission from [16].
Figure 2.
A schematic showing the flange width required in the case of: (a) resistance spot welding and (b) laser welding.
Figure 2.
A schematic showing the flange width required in the case of: (a) resistance spot welding and (b) laser welding.
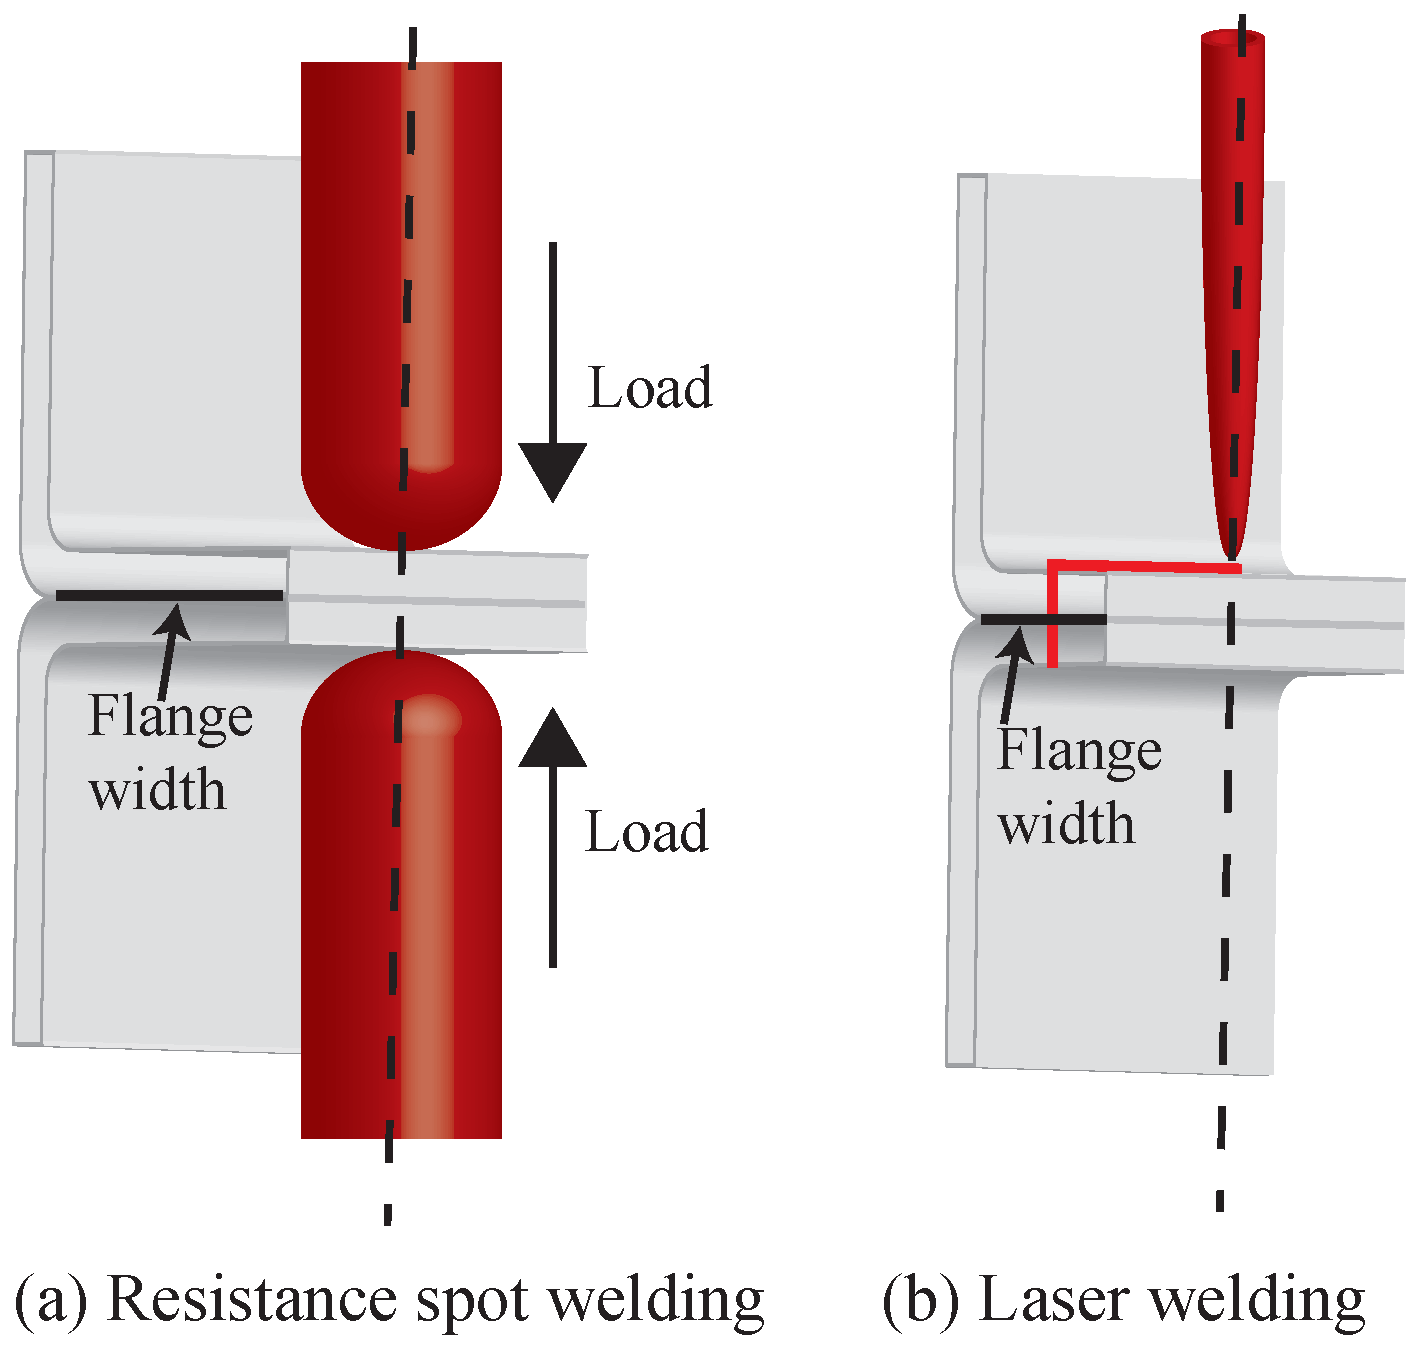
Figure 3.
Schematic of the hot cracking test arrangement.
Figure 4.
3D conical heat source with the Gaussian distribution adopted in the present work.
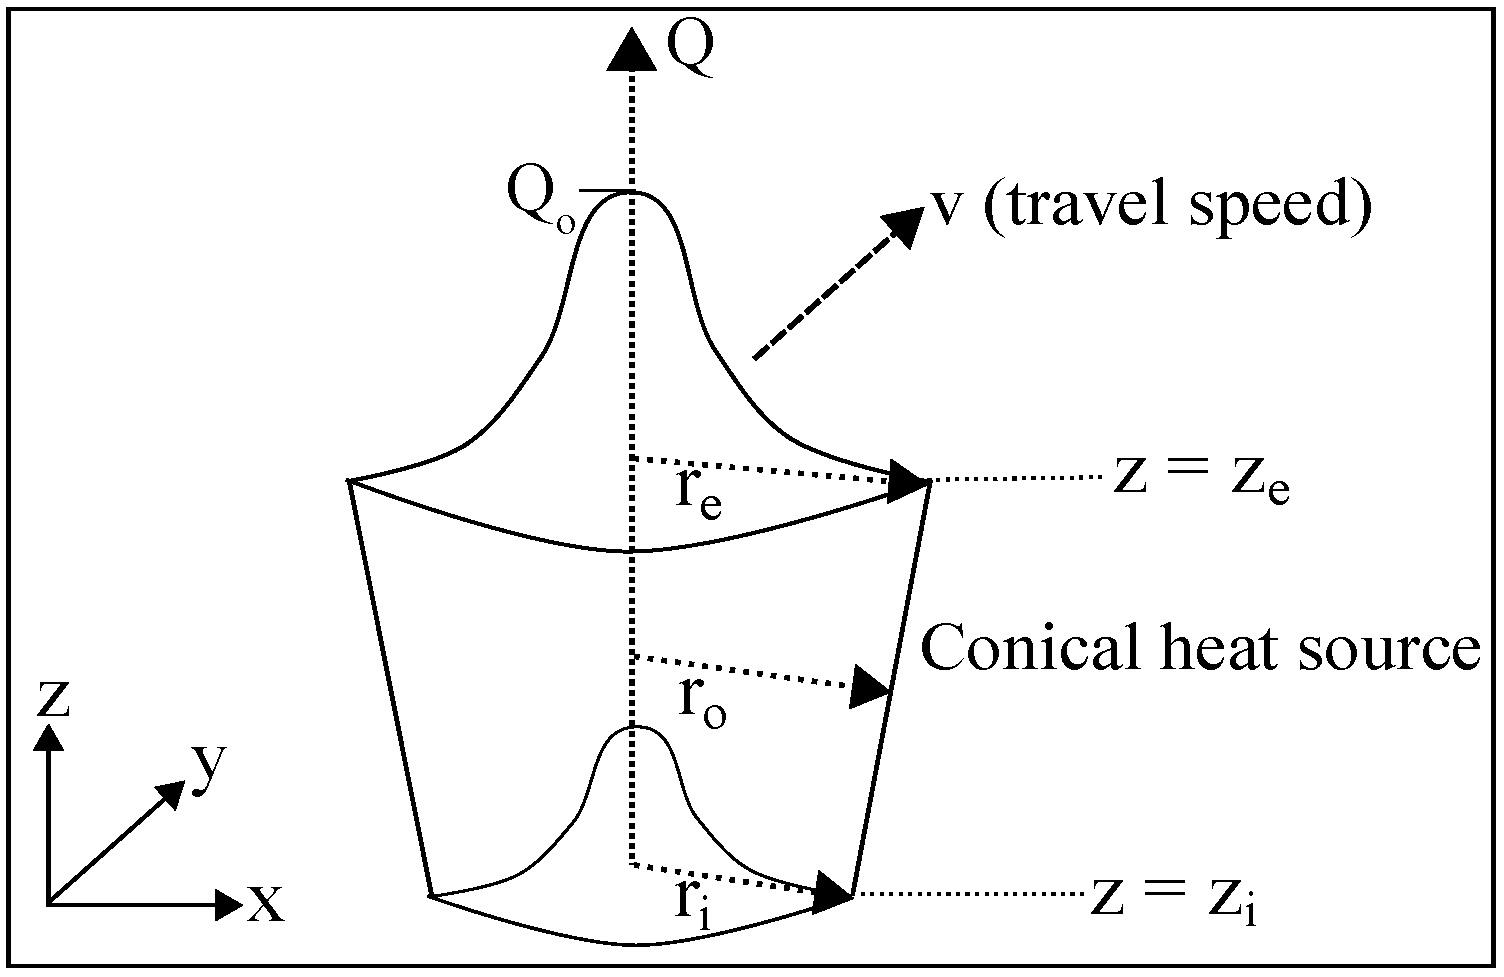
Figure 5.
(a) Thermophysical material properties, (b) thermophysical material properties used in the mushy zone and (c) temperature-dependent mechanical properties.
Figure 5.
(a) Thermophysical material properties, (b) thermophysical material properties used in the mushy zone and (c) temperature-dependent mechanical properties.
Figure 6.
Experimental and calculated temperature cycles for the 13 mm case. The position of the points P1, P2 and P3 with respect to the weld centerline is also indicated. P1 is at a distance of 3 (towards free edge), while P2 and P3 are at and 4 (towards the fixed edge).
Figure 6.
Experimental and calculated temperature cycles for the 13 mm case. The position of the points P1, P2 and P3 with respect to the weld centerline is also indicated. P1 is at a distance of 3 (towards free edge), while P2 and P3 are at and 4 (towards the fixed edge).
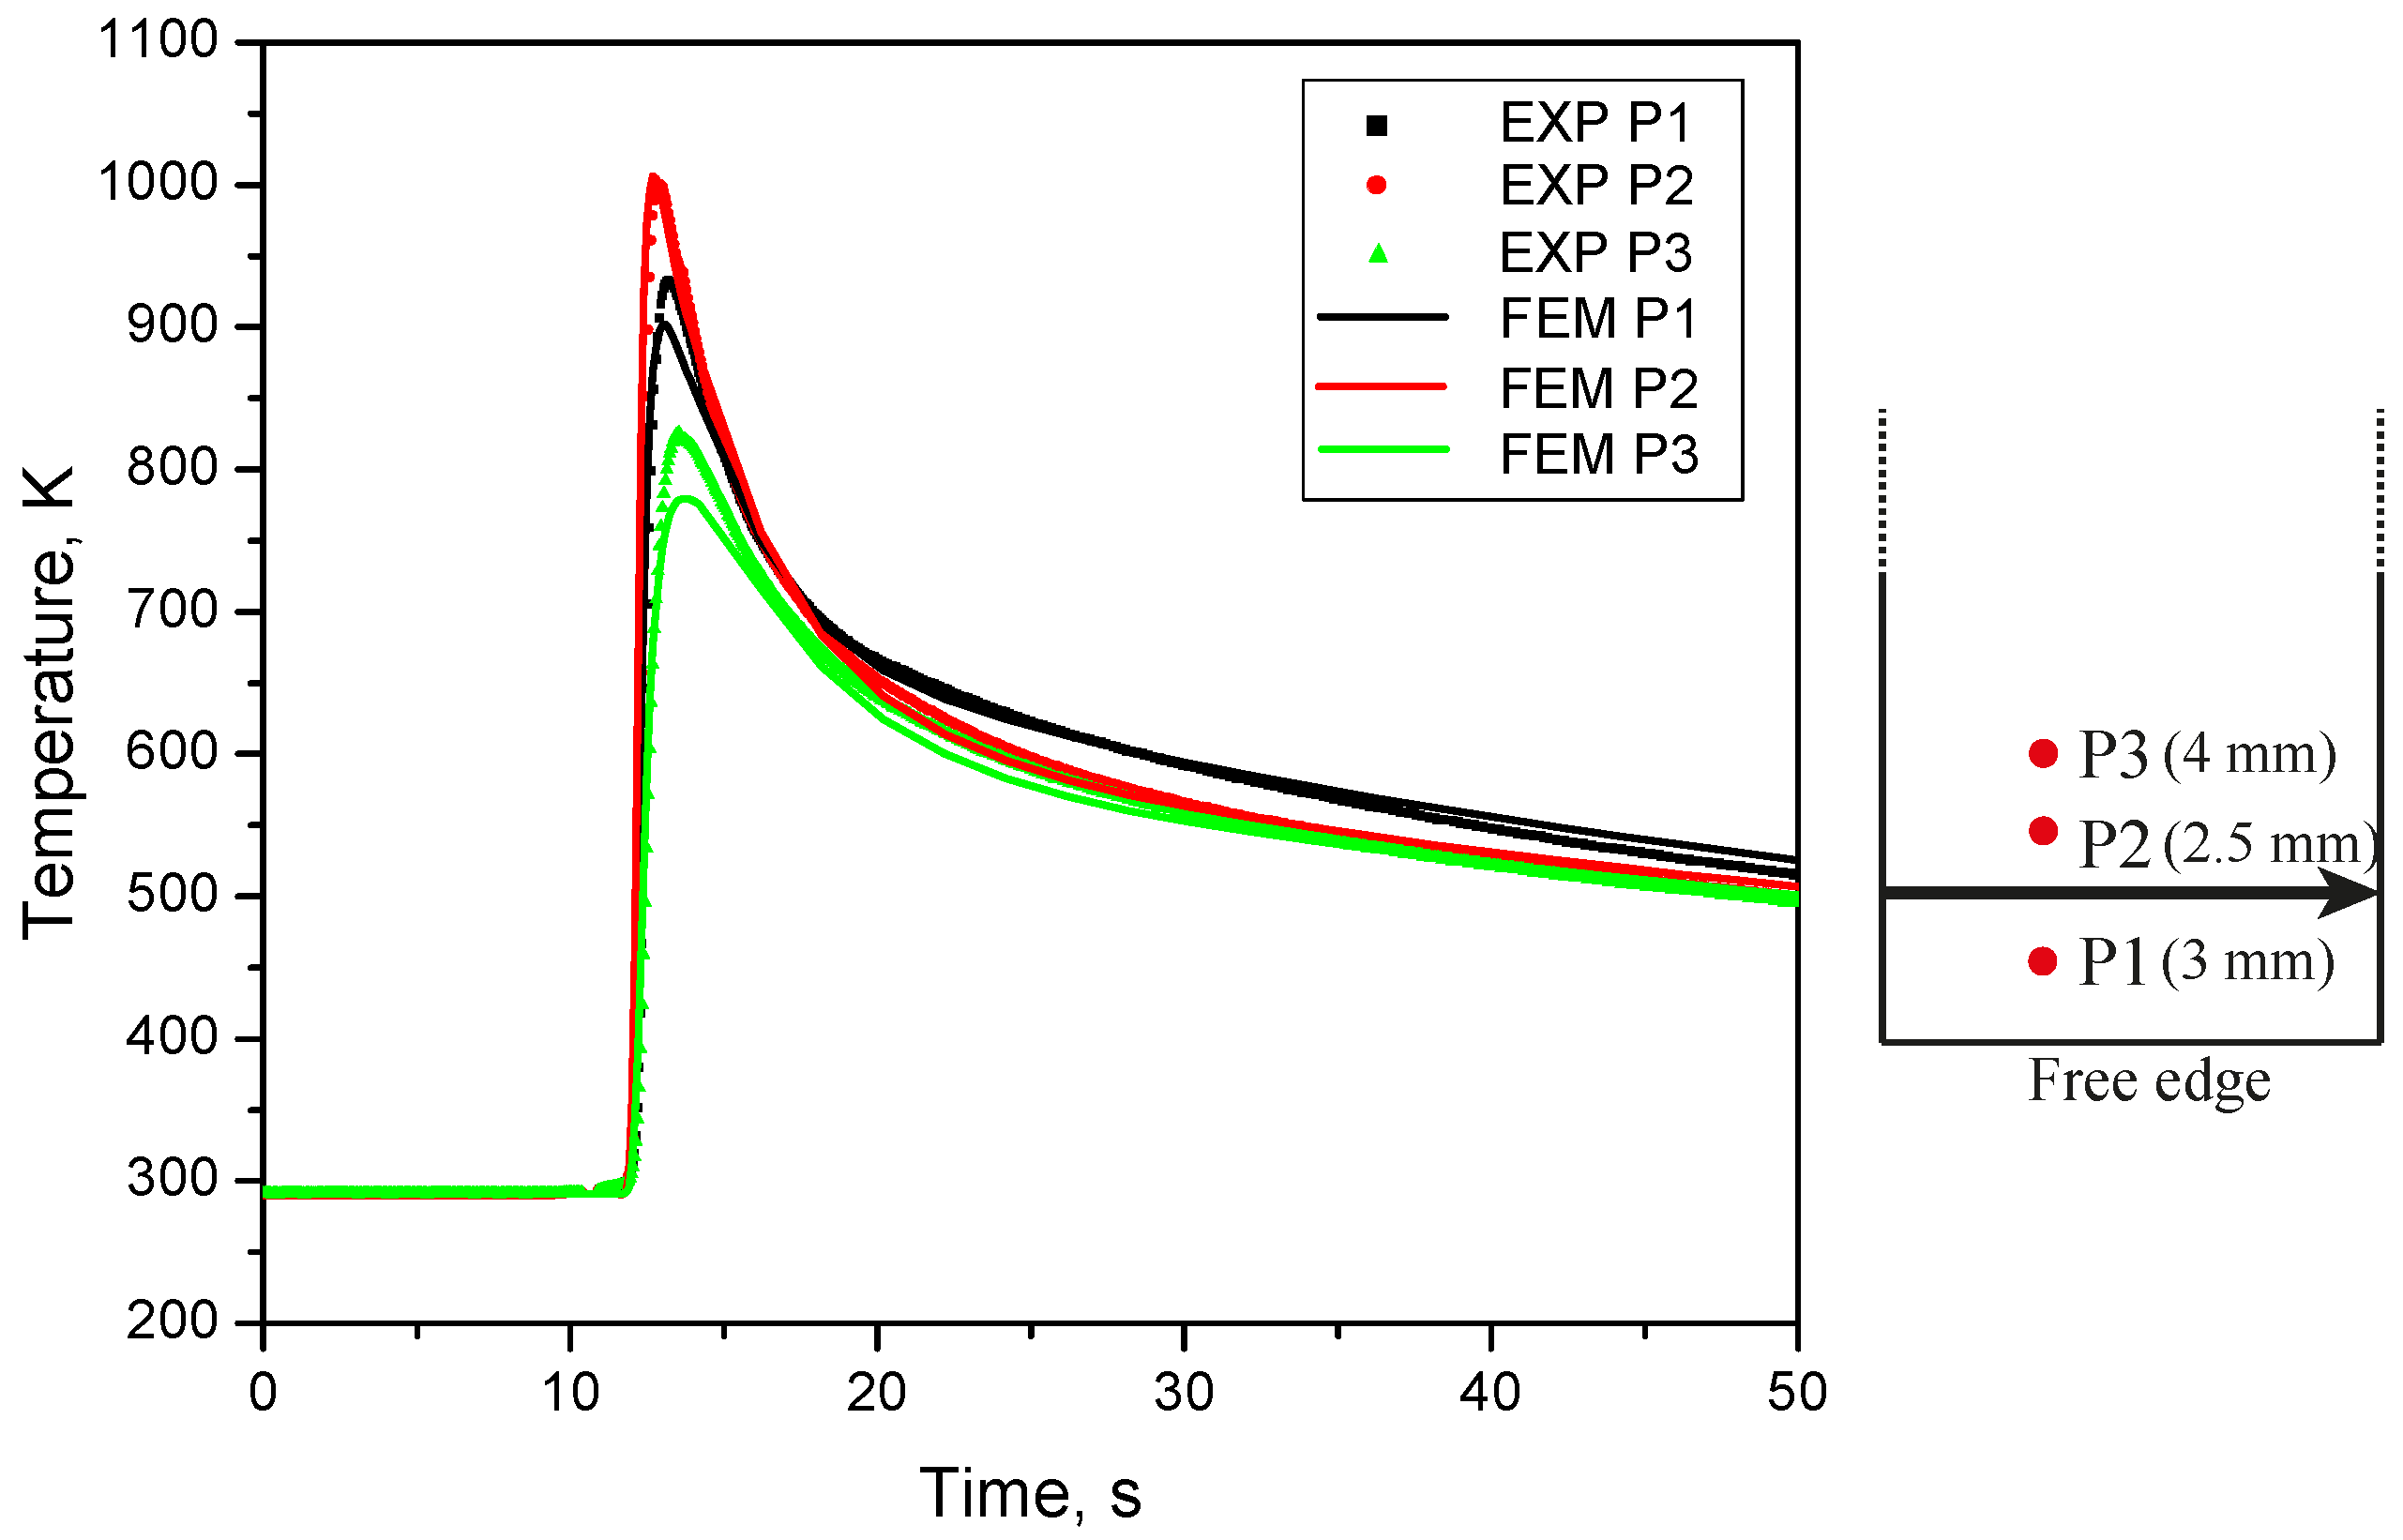
Figure 7.
High speed camera images showing solidification cracking during welding. (a) Solidification crack initiating at the trailing edge of the mushy zone (5 case); (b) full fracture observed (5 case); and (c) the solidification crack stops propagating further (7 case).
Figure 7.
High speed camera images showing solidification cracking during welding. (a) Solidification crack initiating at the trailing edge of the mushy zone (5 case); (b) full fracture observed (5 case); and (c) the solidification crack stops propagating further (7 case).
Figure 8.
Measured crack length for the set of experiments.
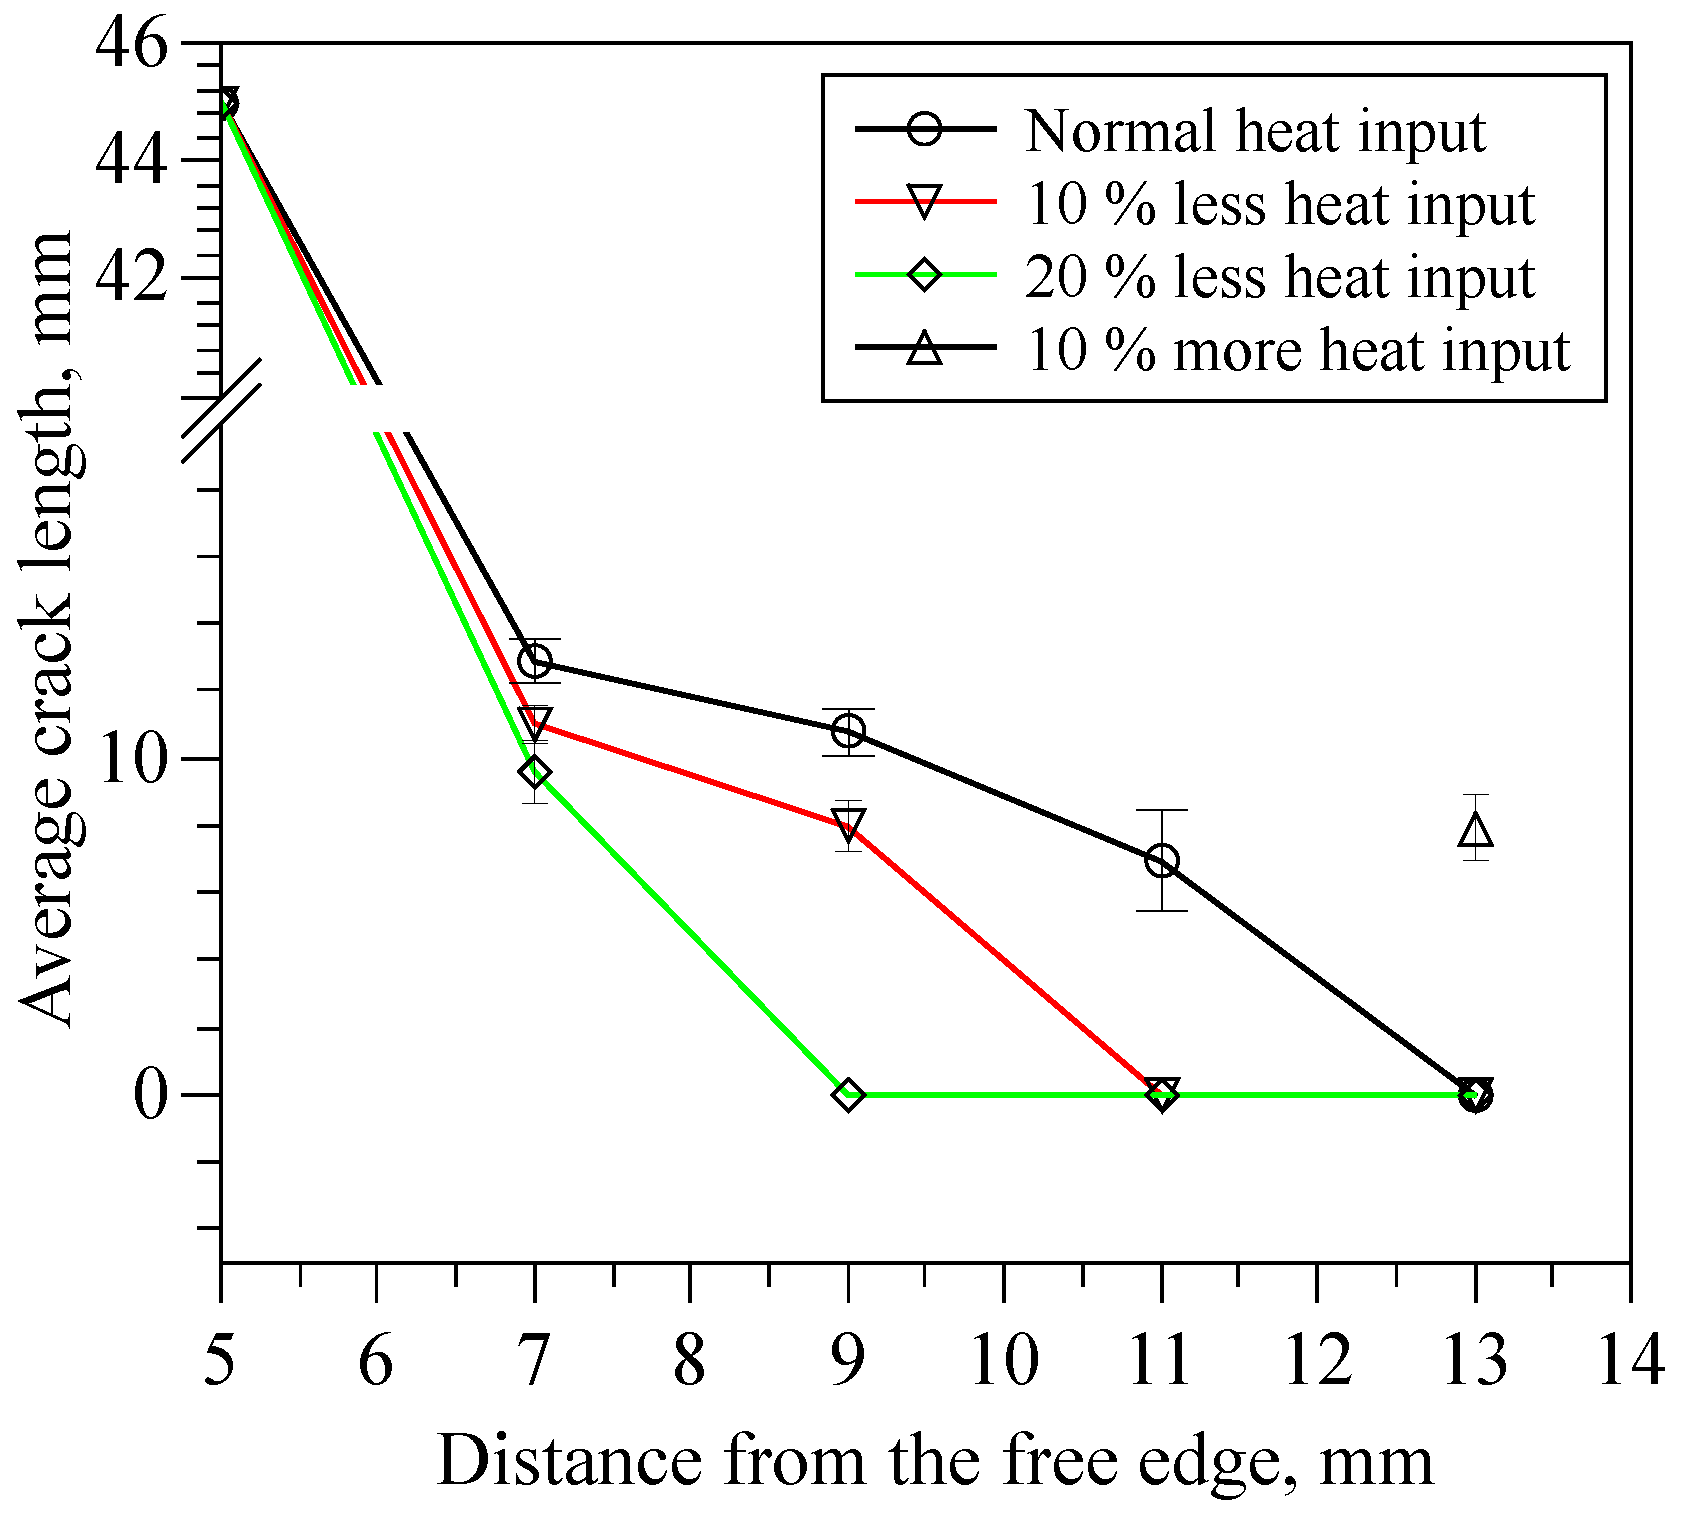
Figure 9.
Micrographs of the fracture surface of TRIP steel (5 case). (a) Liquid film entrapped between dendrites that lead to cracking and (b) micro-cracks on the dendrite tip.
Figure 9.
Micrographs of the fracture surface of TRIP steel (5 case). (a) Liquid film entrapped between dendrites that lead to cracking and (b) micro-cracks on the dendrite tip.
Figure 10.
Simulated peak temperature along the weld centerline for the 5 case.
Figure 11.
Schematic showing the prevailing conditions at . The thermomechanical analysis was performed along the line L1 at and .
Figure 11.
Schematic showing the prevailing conditions at . The thermomechanical analysis was performed along the line L1 at and .
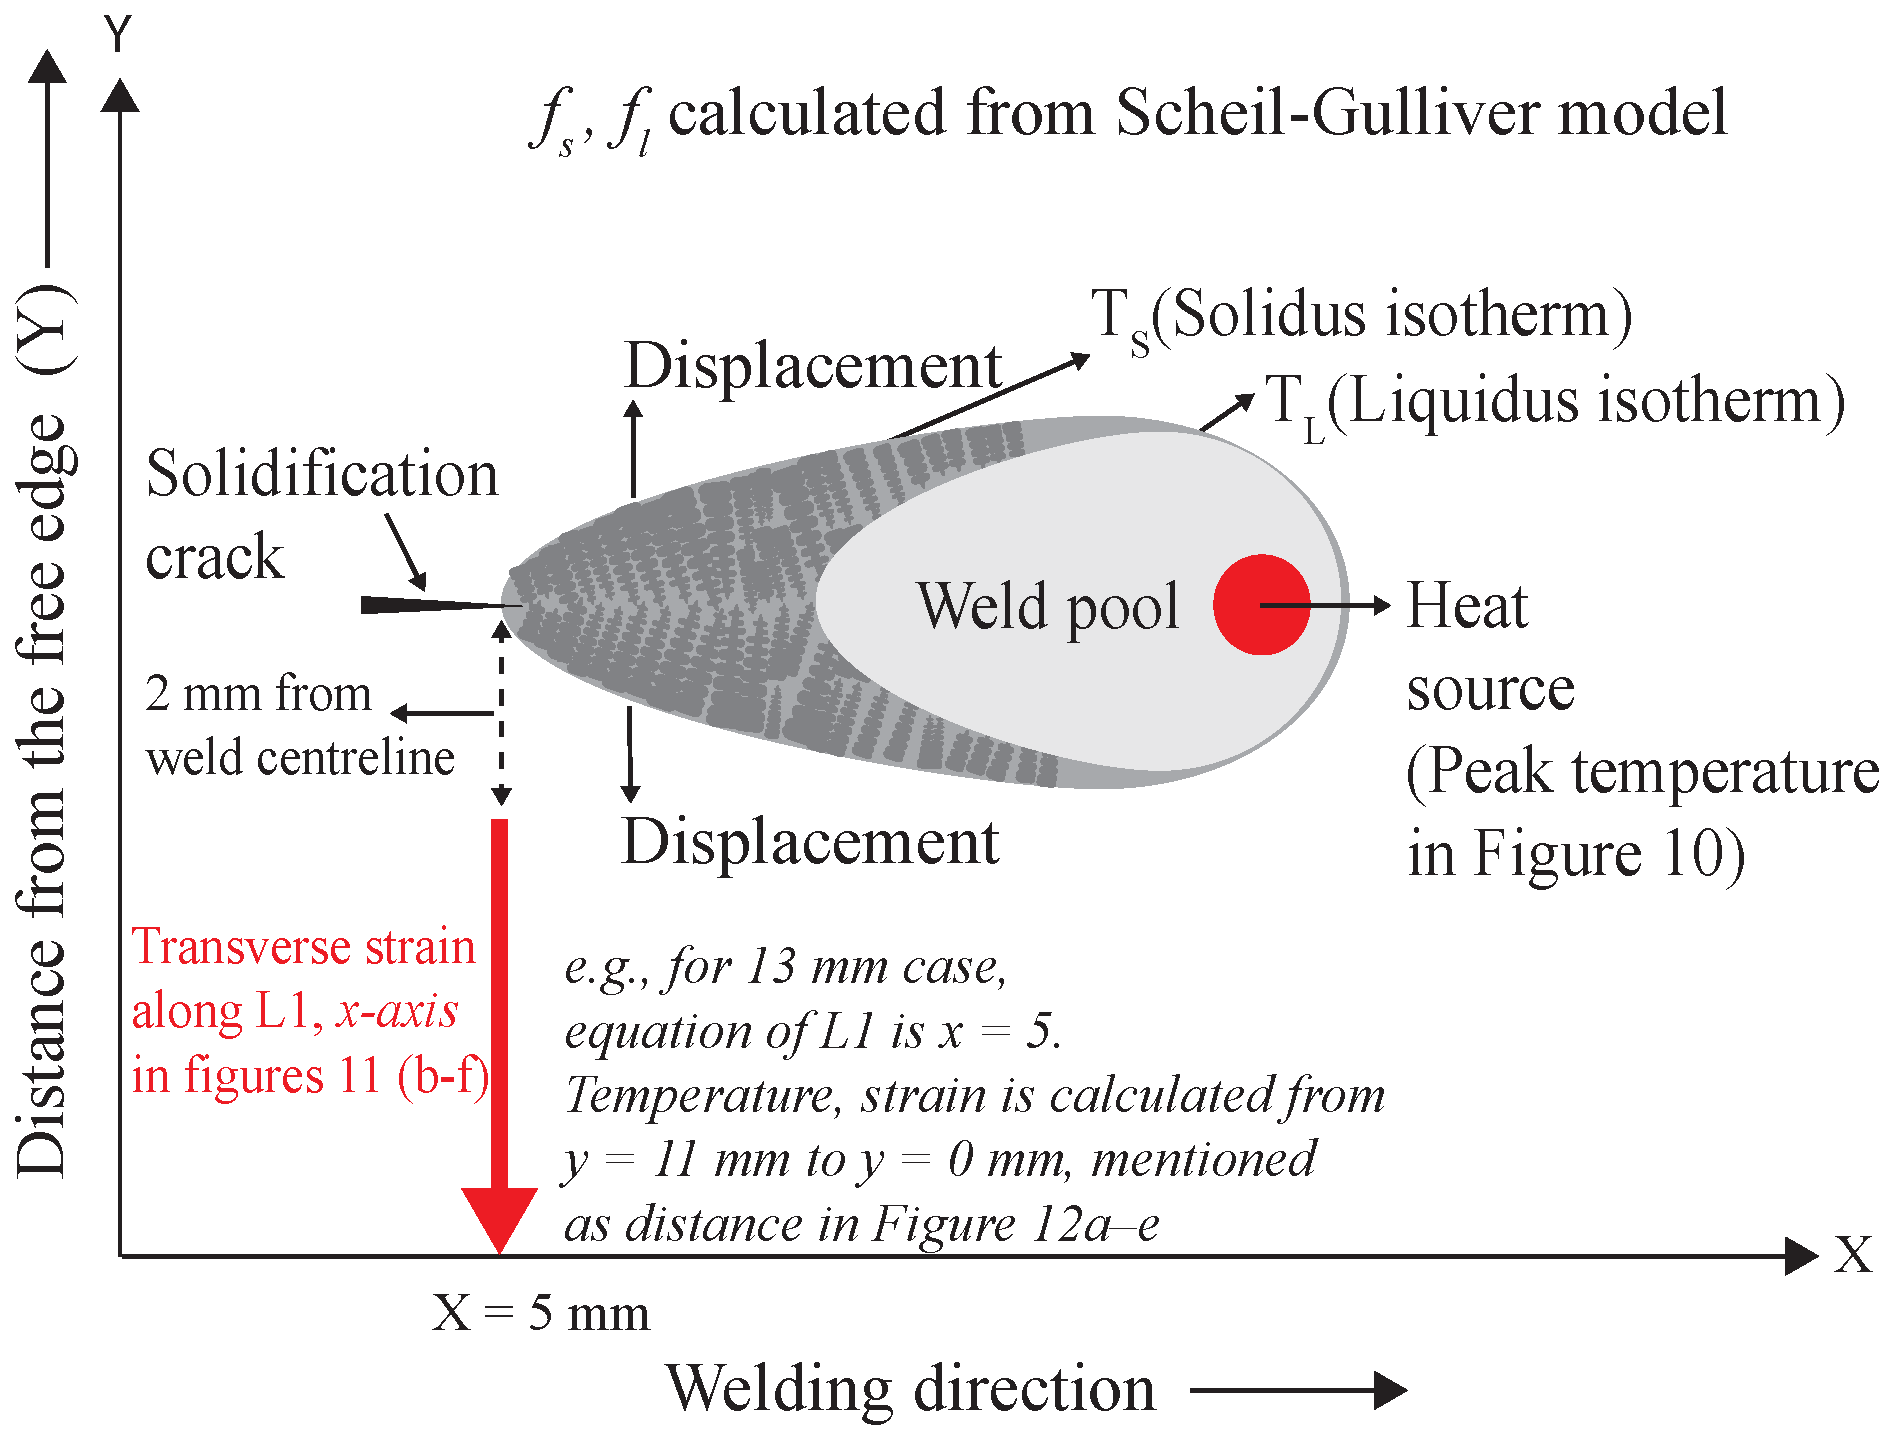
Figure 12.
(a) simulated temperature field along L1 at for different cases, (b) simulated temperature field along L1 at for different cases, (c), simulated strain contributions and total strain for the 5 case, (d) simulated transverse strain (in %) along L1 for different cases at and (e) simulated transverse strain (in %) along L1 for different cases at .
Figure 13.
Effect of heat input on the transverse strain along L1 at . (a) The 11 mm case with normal and 10% less heat input, (b) 9 mm case with normal and 10% and 20% less heat input and (c) 13 mm case with normal and 10% high heat input.
Figure 13.
Effect of heat input on the transverse strain along L1 at . (a) The 11 mm case with normal and 10% less heat input, (b) 9 mm case with normal and 10% and 20% less heat input and (c) 13 mm case with normal and 10% high heat input.
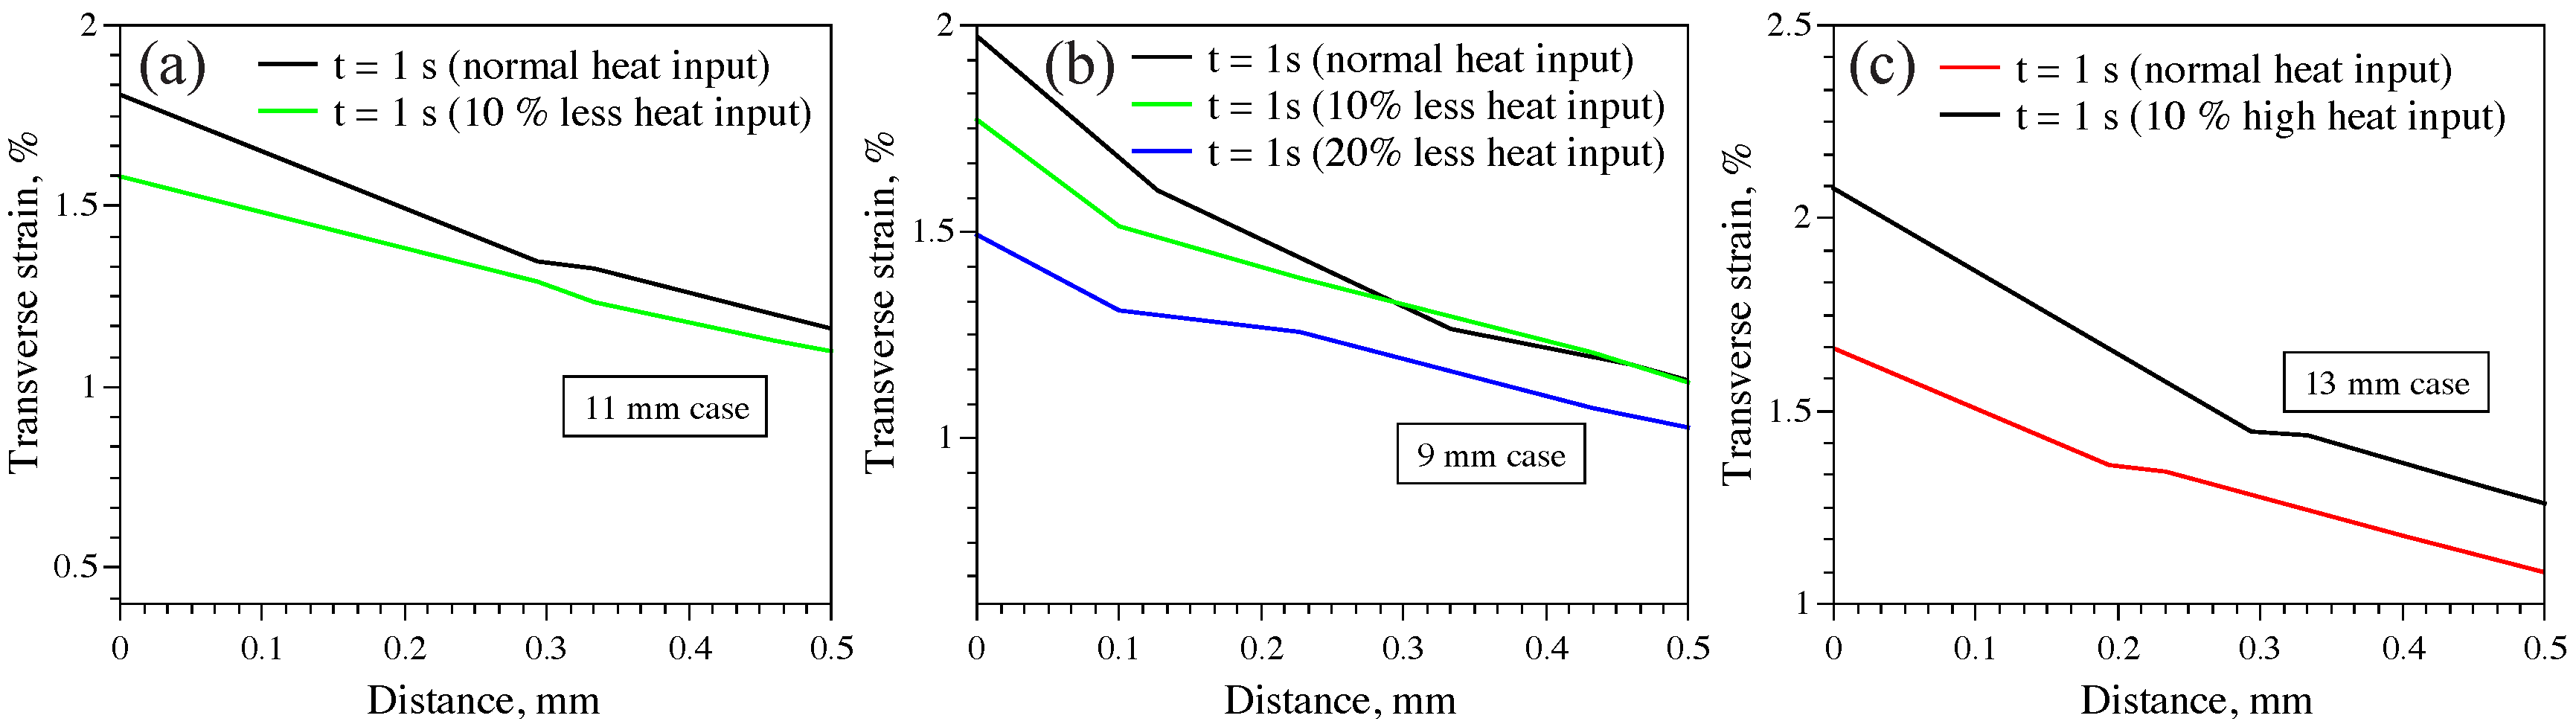
Figure 14.
Solid fraction () versus temperature for the TRIP steel calculated using the non-equilibrium Scheil-Gulliver solidification model.
Figure 14.
Solid fraction () versus temperature for the TRIP steel calculated using the non-equilibrium Scheil-Gulliver solidification model.

Table 1.
Composition of the Transformation-Induced Plasticity (TRIP) steel used in this work (in wt. %).
Table 1.
Composition of the Transformation-Induced Plasticity (TRIP) steel used in this work (in wt. %).
| Elements, wt. % | C | Mn | Al | Si | Cr | P | Fe |
|---|---|---|---|---|---|---|---|
| TRIP | 0.19 | 1.63 | 1.1 | 0.35 | 0.019 | 0.089 | bal. |
Table 2.
Experimental scheme.
| Welding Distance (Yordinate, mm) | Welding Parameters | |
|---|---|---|
| Laser Power (W) | Speed (mm s−1) | |
| 3, 5, 7, 9 and 11 | 10 | |
| 1100 | 11 | |
| 12 | ||
| 13 | 1100 | 9 |
| 10 | ||
| 11 | ||
| 12 | ||
© 2018 by the authors. Licensee MDPI, Basel, Switzerland. This article is an open access article distributed under the terms and conditions of the Creative Commons Attribution (CC BY) license (http://creativecommons.org/licenses/by/4.0/).
Share and Cite
MDPI and ACS Style
Agarwal, G.; Gao, H.; Amirthalingam, M.; Hermans, M. Study of Solidification Cracking Susceptibility during Laser Welding in an Advanced High Strength Automotive Steel. Metals 2018, 8, 673. https://doi.org/10.3390/met8090673
AMA Style
Agarwal G, Gao H, Amirthalingam M, Hermans M. Study of Solidification Cracking Susceptibility during Laser Welding in an Advanced High Strength Automotive Steel. Metals. 2018; 8(9):673. https://doi.org/10.3390/met8090673
Chicago/Turabian StyleAgarwal, Gautam, He Gao, Murugaiyan Amirthalingam, and Marcel Hermans. 2018. "Study of Solidification Cracking Susceptibility during Laser Welding in an Advanced High Strength Automotive Steel" Metals 8, no. 9: 673. https://doi.org/10.3390/met8090673
Note that from the first issue of 2016, this journal uses article numbers instead of page numbers. See further details here.