Article

Study of Nd Electrodeposition from the Aprotic Organic Solvent Dimethyl Sulfoxide

by
Evangelos Bourbos
1,*,
Antonis Karantonis
2,
Labrini Sygellou
3,
Ioannis Paspaliaris
1 and
Dimitrios Panias
1
1
School of Mining & Metallurgical Engineering, National Technical University of Athens, 9 Iroon Polytechniou, 15780 Zografou, Athens, Greece
2
School of Chemical Engineering, National Technical University of Athens, 9 Iroon Polytechniou, 15780 Zografou, Athens, Greece
3
Institute of Chemical Engineering Sciences, Foundation of Research and Technology Hellas, Platani, 26504 Patras, Greece
*
Author to whom correspondence should be addressed.
Metals 2018, 8(10), 803; https://doi.org/10.3390/met8100803
Submission received: 22 September 2018 / Revised: 2 October 2018 / Accepted: 5 October 2018 / Published: 8 October 2018

Abstract

:
The use of organic solvents in an electrolytic system for neodymium electrorecovery by electrolysis at low temperatures is studied in the current work. More specifically, an alternative route, that of the system of DMSO (Dimethyl sulfoxide) with dissolved NdCl3 has been researched and has given promising results. The study of this electrolytic system has been divided into two stages. Firstly, the characteristics of the electrolyte, the dissolution of NdCl3 in DMSO, the conductivity and the viscosity of NdCl3 solutions in DMSO at various temperatures, and the Nd complexation in the solution were studied and secondly, the electrolysis parameters and their impact on the Nd electrodeposition process were evaluated. Finally, the deposits were submitted to SEM-EDS (Scanning Electron Microscopy-Energy Dispersive X-Ray Spectroscopy) analysis and metallic Nd was confirmed to be electrodeposited by X-ray Photoelectron Spectroscopy (XPS) spectroscopy.

1. Introduction

In June 2010, the European Commission published a list of 14 raw materials that are critical for many important emerging technologies. The list was revised in 2014 and 2017, including 20 critical raw materials [1]. In all three lists published, rare earths elements were identified as critical raw materials, while in the last two, greater detail was provided for rare earth elements by splitting them into heavy and light rare earth elements, and scandium. It is evident that rare earth elements are of great interest for the European Union (EU) due to the EU’s high import dependency rate, low substitution, and low recycling rate. Among rare earth elements, neodymium gains significant attention, since its production is considered to be a critical technology metal mostly used for permanent magnets in wind turbines, electric vehicles, hard-disc drives, mobile phones, and more [1,2,3]. The first neodymium and neodymium alloys in industrial scale were produced by calciothermic reduction of neodymium fluoride and chloride electrolysis. However, due to the high demand of pure neodymium for Nd2Fe14B permanent magnets, the calciothermic reduction as a costly batch process was found to be economically inviable for industrial production [4]. On the other hand, neodymium chloride electrolysis could only produce mischmetal or Nd-Fe alloy [5]. It was created with a voltage 10–14 V and a current between 1 and 25 kA, while the electrolysis bath consisted of a mixture of NdCl3-KCl-NaCl and also an addition of LiCl [6] and CaCl2 at 1050 °C. The serious drawbacks of this technology are the fact that above 1000 °C, large quantities of electrolytes evaporate and at the same time a high amount of chlorine off-gas is released, causing environmental and health issues [7]. The fluoride electrolysis can be realized at the required temperatures, but presents similar drawbacks, such as, environmental issues along with the constraint to use neodymium salts as raw material [5,7].
The neodymium oxide electrolysis in a fluoride bath conducted by the United States (US) Bureau of Mines in the 1960s had a lot of problems to overcome, such as the dissolution of neodymium oxide in the salt. The best results were presented by the system composed of NdF3 and LiF [8]. It was suggested that higher than 87% of NdF3 resulted in higher current efficiency and better metal quality. However, the use of LiF is needed in order to decrease the melting point and boost the electrical conductivity. In 1984 an industrial 3 kA electrolysis cell was developed in Baotou China; it had a cylindrical shape with an inner crucible [9]. A tungsten rod was used as a cathode in the center of the cell surrounded by a one-piece tube-like graphite cylinder acting as a consumable anode. Neodymium was electrodeposited on the inert cathode and was dropped as liquid metal into a collecting molybdenum crucible. The substitution of the one-piece anode to divided four-arc shaped anode blocks made it possible to perform electrolysis continuously. This electrolysis cell type is the most wide spread in neodymium production, and in Baotou, the design of four cathode rods inserted vertically and surrounded by block anodes has been implemented [8,9].
During electrolysis for neodymium production, the main off-gas products are CO and CO2, along with CF4 emissions released from the anode. The emission of CF4 is strongly enhanced when the anode effect takes place. The emission of carbon fluorides from neodymium electrolysis can have a significant impact on global warming [10].
The scope of the current work is the study of an alternative to molten salts electrolysis technology for Nd reduction by using a common organic aprotic solvent, namely dimethyl sulfoxide (DMSO), as an electrolyte and to design a potential process for the electrorecovery of metallic neodymium at ambient temperature based on such an electrolytic system.

2. Materials and Methods

The anhydrous organic solvent DMSO was supplied by Sigma Aldrich (Saint Louis, MO, USA) and neodymium chloride by Johnson Matthey (London, UK). The moisture content was less than 50 ppm for the anhydrous DMSO solvent according to the data provided by the company. The organic solvent was placed over 3 A molecular sieves under vacuum for 24 h in order to eliminate the presence of residual water. Cyclic voltammetry and electrolysis tests were performed in a three electrodes cell connected to a VersaSTAT 3 potentiostat by Princeton Applied Research (AMETEK SI, Berwyn, PA, USA); the obtained experimental data were analyzed with the VersaStudio software by Princeton Applied Research (AMETEK SI, Berwyn, PA, USA). In cyclic voltammetry experiments, the working electrode was a platinum disk of 1 mm diameter. The working electrode was polished with 1 μm alumina paste on a velvet pad and by performing voltammetric cycles in 1 M sulfuric acid. As a counter electrode, a Pt wire was used, immersed directly into the solution, whereas, a Pt wire was used as a pseudoreference electrode, calibrated against the reversible couple Fc/Fc+. The ferrocene/ferrocenium (Fc/Fc+) redox potential was recorded vs. the Pt pseudoreference electrode after the direct dissolution of 10 mM of ferrocene in the organic solvent under study and was used as the reference potential. In electrolysis tests, the set up used was identical, with the only difference being a copper sheet as a working electrode, of dimensions 10 × 10 mm2, with a total reactive surface equal to 20 mm2. Before the experiments, the Cu working electrode was polished with a series of abrasive papers.
Although DMSO is stable under normal atmospheric conditions, all electrochemical measurements and tests were performed under inert conditions, to minimize oxygen and moisture contamination, in an Ar atmosphere inside a Pure Lab glove box supplied by INERT (Amesbury, MA, USA) where oxygen and moisture were kept below 20 and 50 ppm, respectively. The viscosity of the solutions was measured with a Brookfield DV-I+LV viscometer (AMETEK SI, Berwyn, PA, USA) supplied with an electric thermomantle. The conductivity was measured by a 4-Pt rings electrode conductometer Si-Analytics HandyLab 200 (Xylem, NY, USA). Chemical analysis, in order to determine neodymium concentration in the solutions prepared, was performed by the use of an inductively coupled plasma optical emission spectrometer (ICP-OES) Perkin Elmer 8000 Optimal (Perkin Elmer, Waltham, MA, USA). The infra-red spectrum was collected from 650 to 4000 cm−1 on an attenuated total reflection (ATR) module with a Perkin Elmer model FTIR Spectrum 100 (Perkin Elmer, Waltham, MA, USA). To perform the measurement, a droplet of the sample was placed on the ATR crystal. The morphology of electrodeposits was examined by Scanning Electron Microscope (JEOL model 6380LV, JEOL, Tokyo, Japan), provided with an Energy Dispersive Spectrometer (JEOL, Tokyo, Japan). The photoemission experiments were carried out in an ultra-high vacuum system (UHV) consisting of a fast entry specimen assembly, a sample preparation chamber, and an analysis chamber. The base pressure in both chambers was 1 × 10⁻⁹ mbar. The analysis chamber was equipped with a hemispherical electron energy analyzer (SPECS LH-10, Scanwel, Gwynedd, UK) and a twin anode X-ray gun for X-ray Photoelectron Spectroscopy (XPS) (Scanwel, Gwynedd, UK) measurements. The preparation chamber consisted of an ion gun for Ar+ sputtering. The unmonochromatized Mg-Kα line at 1253.6 eV and an analyzer pass energy of 97 eV, giving a full width at half maximum (FWHM) of 1.7 eV for the Au 4f7/2 peak, were used in all XPS measurements. The XPS core level spectra were analyzed using a fitting routine, which can decompose each spectrum into individual mixed Gaussian-Lorentzian peaks after a Shirley background subtraction. The samples were in vials in an inert atmosphere and inserted in the UHV system through a glove bag attached to the fast entry specimen assembly of the UHV system. The glove bag was kept under continuous He flow in order to prevent further surface oxidation. Survey scans were recorded for all samples, while the core level peaks that were recorded in detail were: Nd3d, S2p, F1s, O1s, and C1s.

3. Results and Discussion

3.1. Study of the Electrolyte

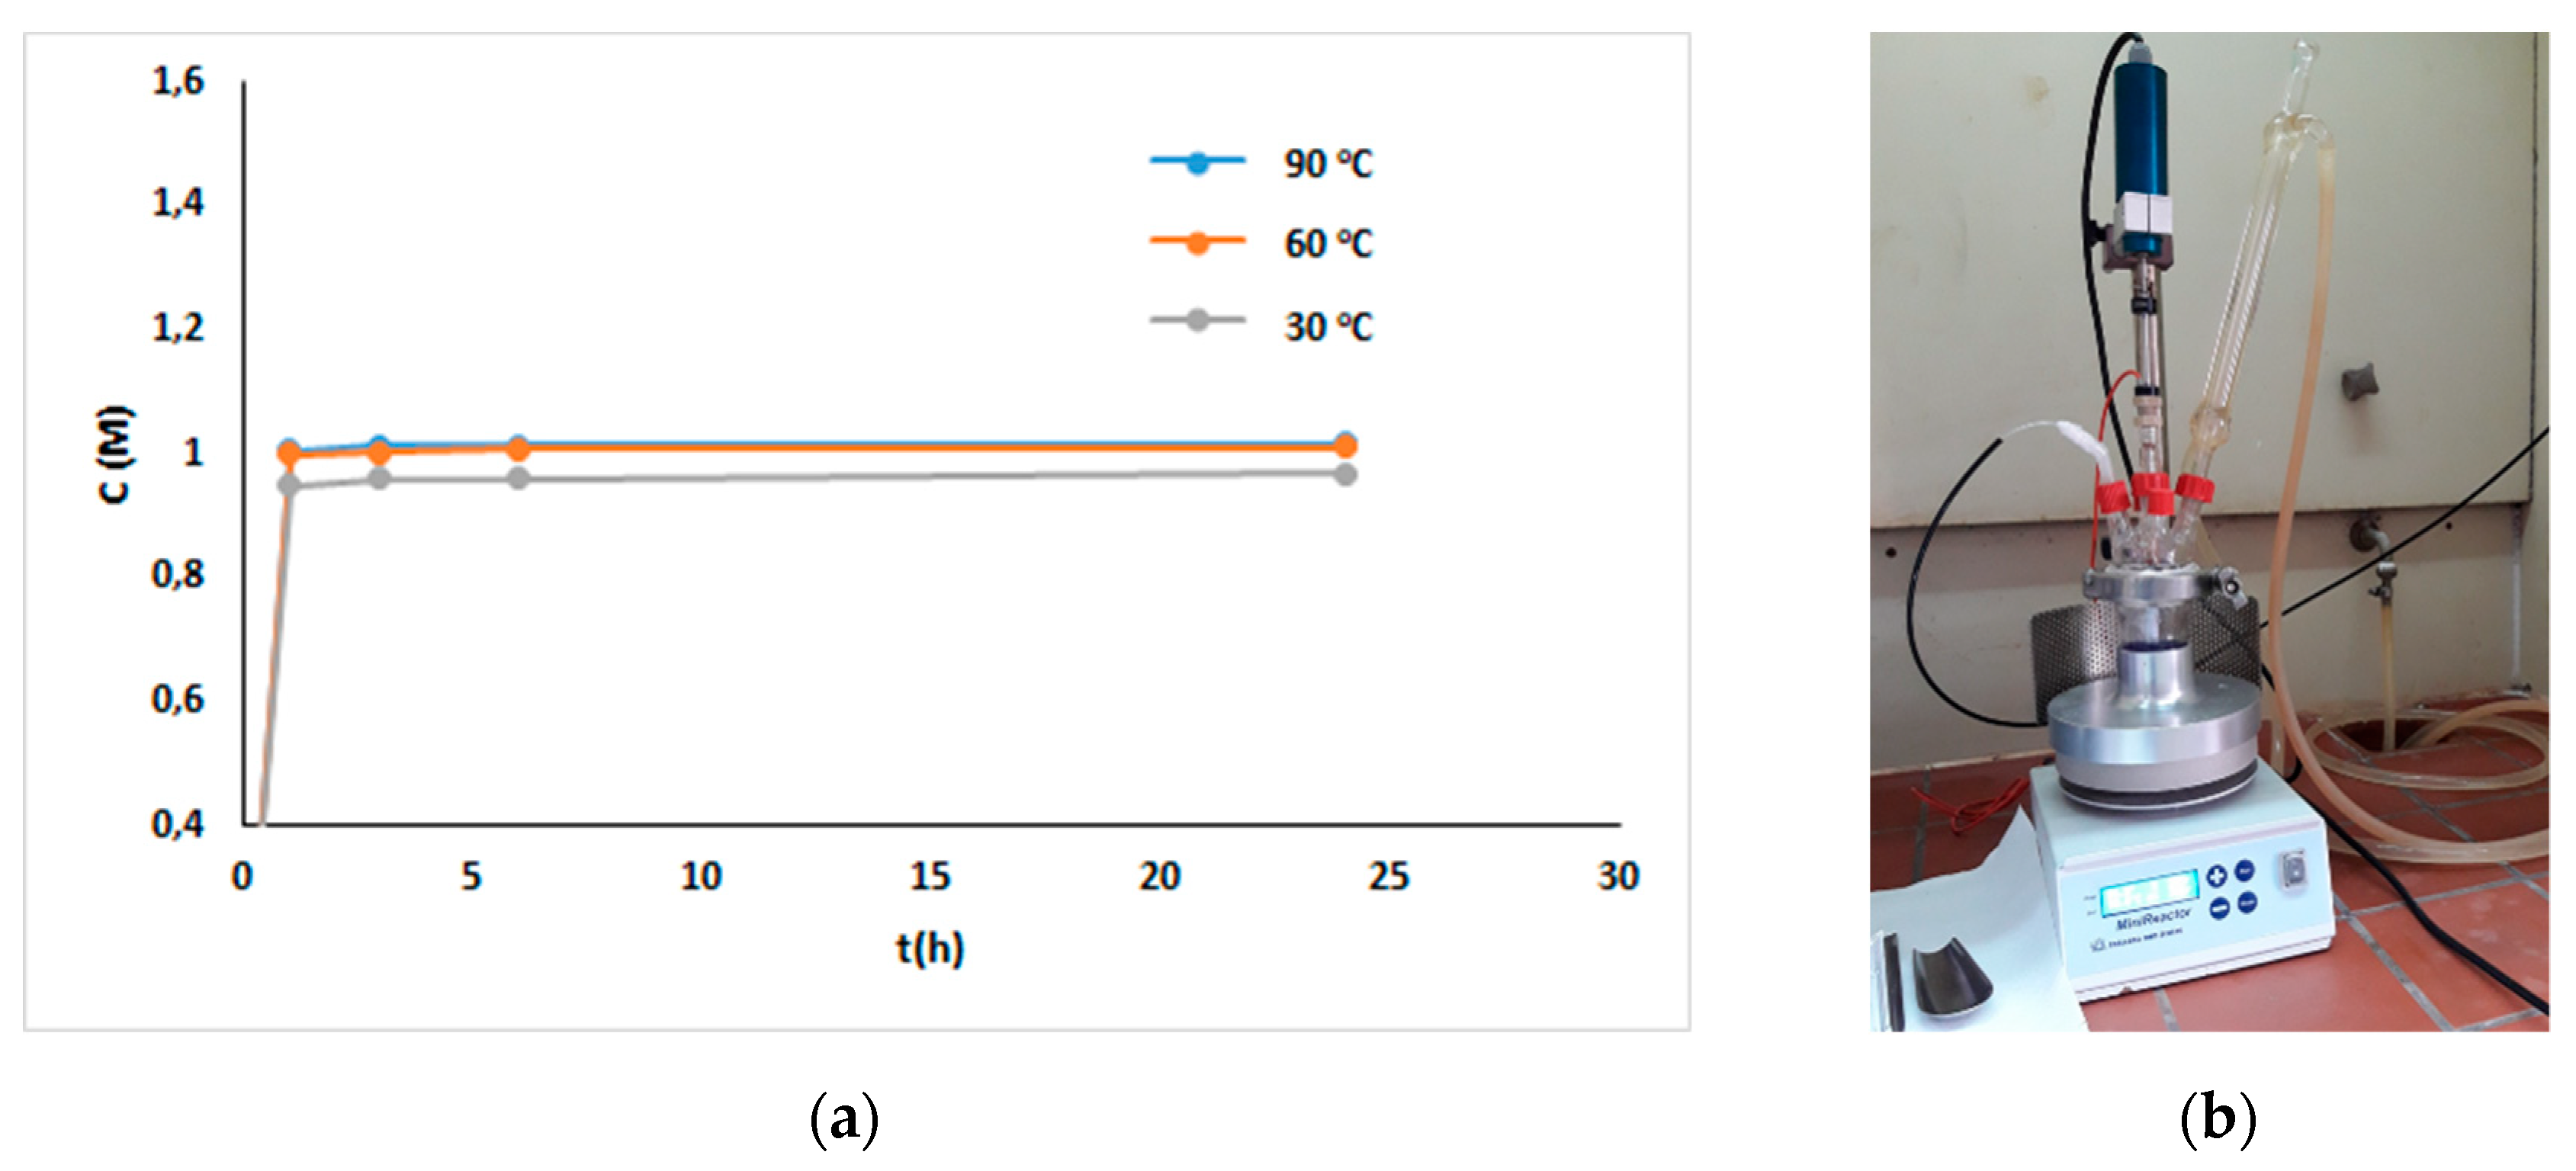
3.1.1. Dissolution Tests of NdCl3 in DMSO at Different Temperatures

Rare earth metals are known to form strong complexes with halide anions, rendering their dissolution a challenging task [11,12]. The halide salts in non-aqueous electrolytes present great interest for electrorecovery applications, because they are oxidized at mild anodic potentials prior to the oxidation of the electrolyte, thus preventing its anodic decomposition. The first point that had to be elucidated in the system under consideration was the dissolution of the halide salt in the organic solvent chosen as the electrolytic medium. It was decided to investigate the dissolution of NdCl3 in DMSO. The dissolution experiments were performed in a mini-reactor of working volume V = 60 mL, under continuous argon purging, stirring set at 300 rpm for a total duration of 24 h. The amount of NdCl3 added to the mini-reactor was determined to be equal to the quantity needed to form a solution of 1 M Nd concentration, if total dissolution occurred. The experiments were performed for three selected temperatures (30 °C, 60 °C, and 90 °C) and samples were collected after the 1st, 3rd, and 6th hours and at the end of the experiment in order to be analyzed by ICP-OES and to measure Nd concentration in the solution. The chemical analyses performed showed that by the first hour almost the total amount of Nd added in DMSO has been dissolved (Figure 1). The concentration of Nd was stable after 3 h. Nd concentration in the final solution produced at 90 °C and 60 °C was 1 M, while it was slightly lower for the solution produced at 30 °C (0.96 M).

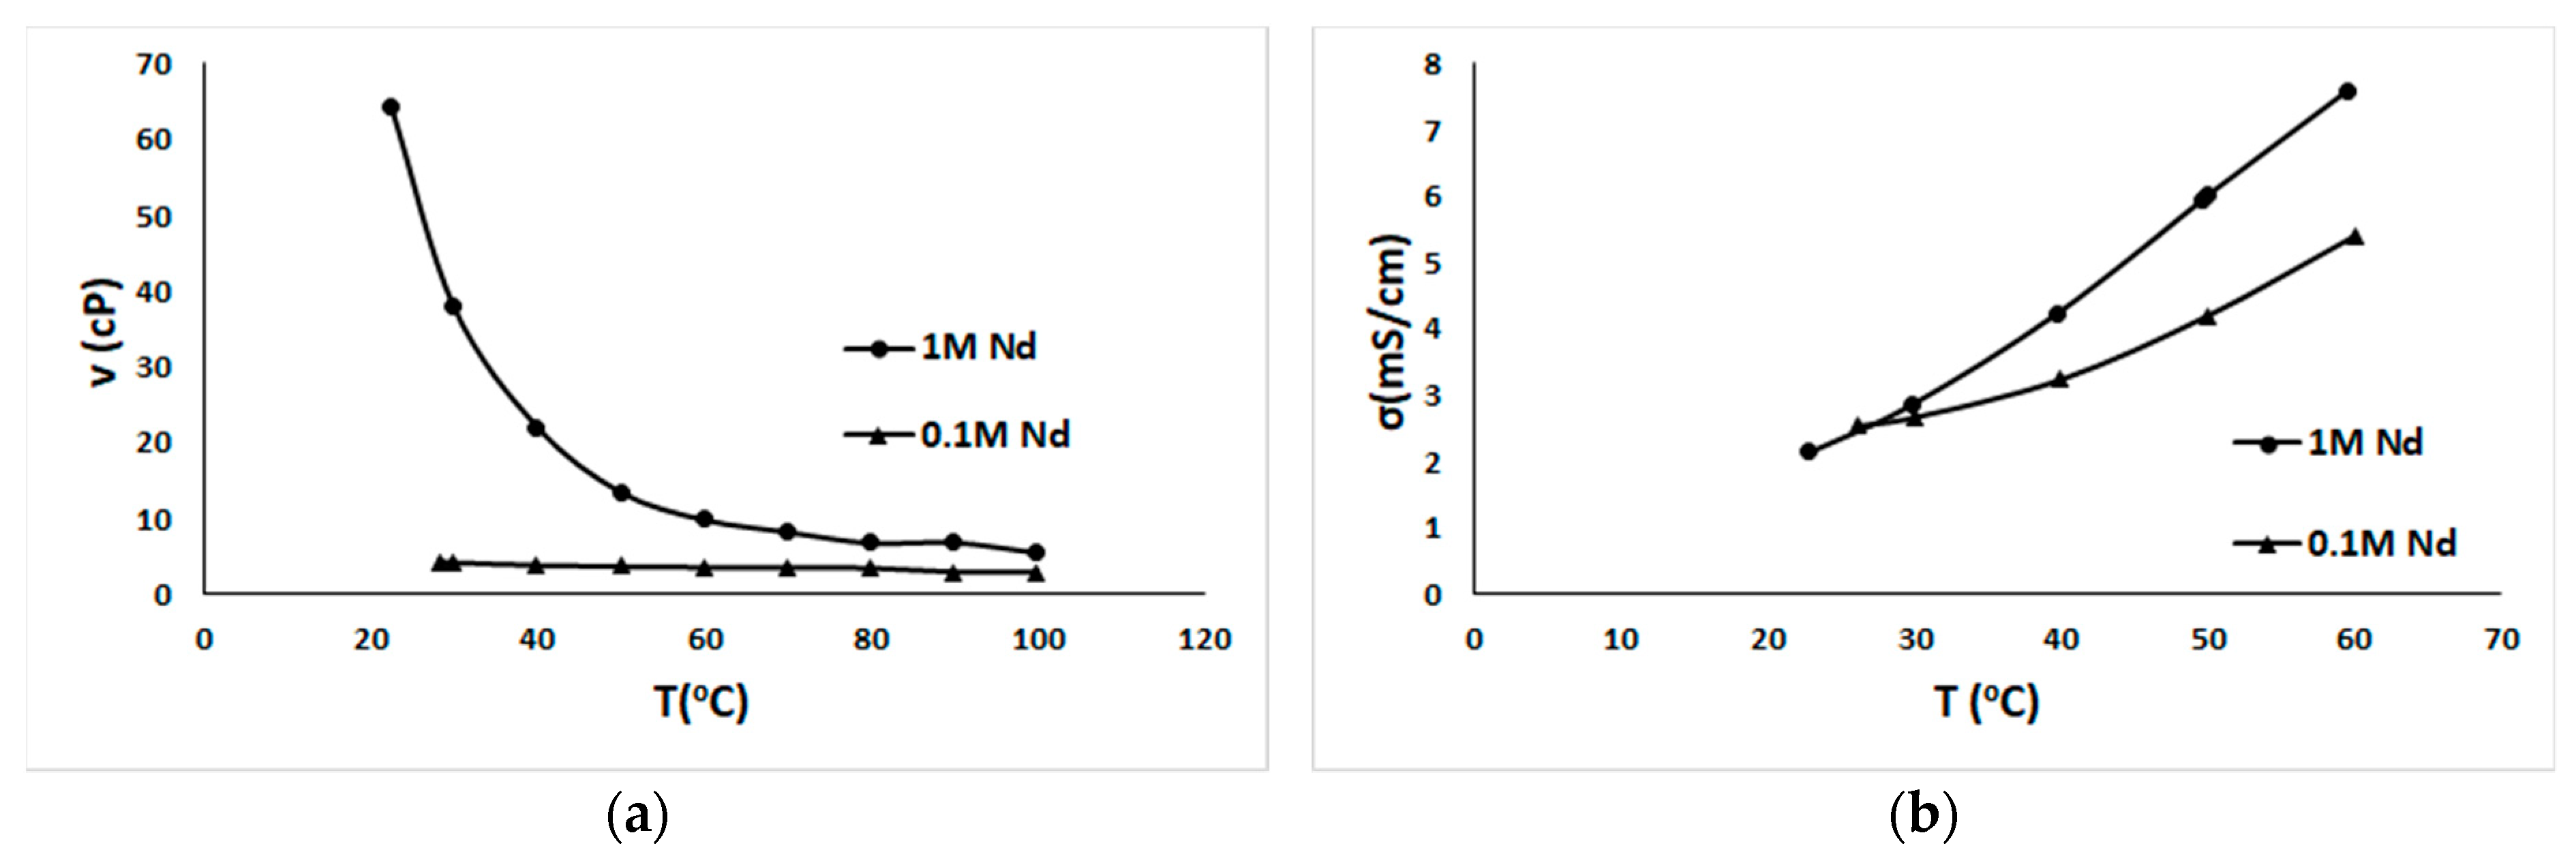
3.1.2. Viscosity and Conductivity Study of NdCl3 and DMSO Solutions

The conductivity and the viscosity of the solutions produced after the dissolution experiments were studied at various temperatures. Figure 2a presents the results for the viscosity measurements performed for the solutions that were previously produced and for a dilute solution of 0.1 M Nd. It was revealed that the more concentrated solutions present higher viscosity. The solution with 1 M Nd, as it was anticipated, presented significant viscosity, while the dilute solution of 0.1 M Nd at room temperature was almost 16 times less viscous than the concentrated one. It is estimated that the higher Nd concentration leads to the complexation of Nd with the solvent’s molecules and the subsequent formation of chemical species that contribute to the increase of the viscosity of the system under study. As the temperature is increased, however, the viscosity of 1 M Nd solution is drastically decreased, and at temperatures higher than 80 °C it is almost comparable with the viscosity of the dilute solution of 0.1 M Nd. The increase of temperature affects, mainly, the concentrated solution and not the dilute one, since for the latter the viscosity at room temperature is already substantially low and it cannot be drastically further decreased. On the other hand, the conductivity measurements that were realized for the concentrated solution (1 M) and the dilute one (0.1 M) and are presented in Figure 2b, demonstrate that at room temperature the conductivity of the two solutions is comparable. Nevertheless, as the temperature is increased above 30 °C, the more concentrated solutions exhibit higher conductivity in comparison to the dilute solution. Apparently, higher conductivity is due to the higher amount of charged species present in the solution. The increase of temperature has, as a result, the consequent decrease of system’s viscosity, as it was reported previously, and, therefore, the charged species present higher mobility. Since the concentrated solutions are present in higher amounts, they lead to the increase of the system’s conductivity.

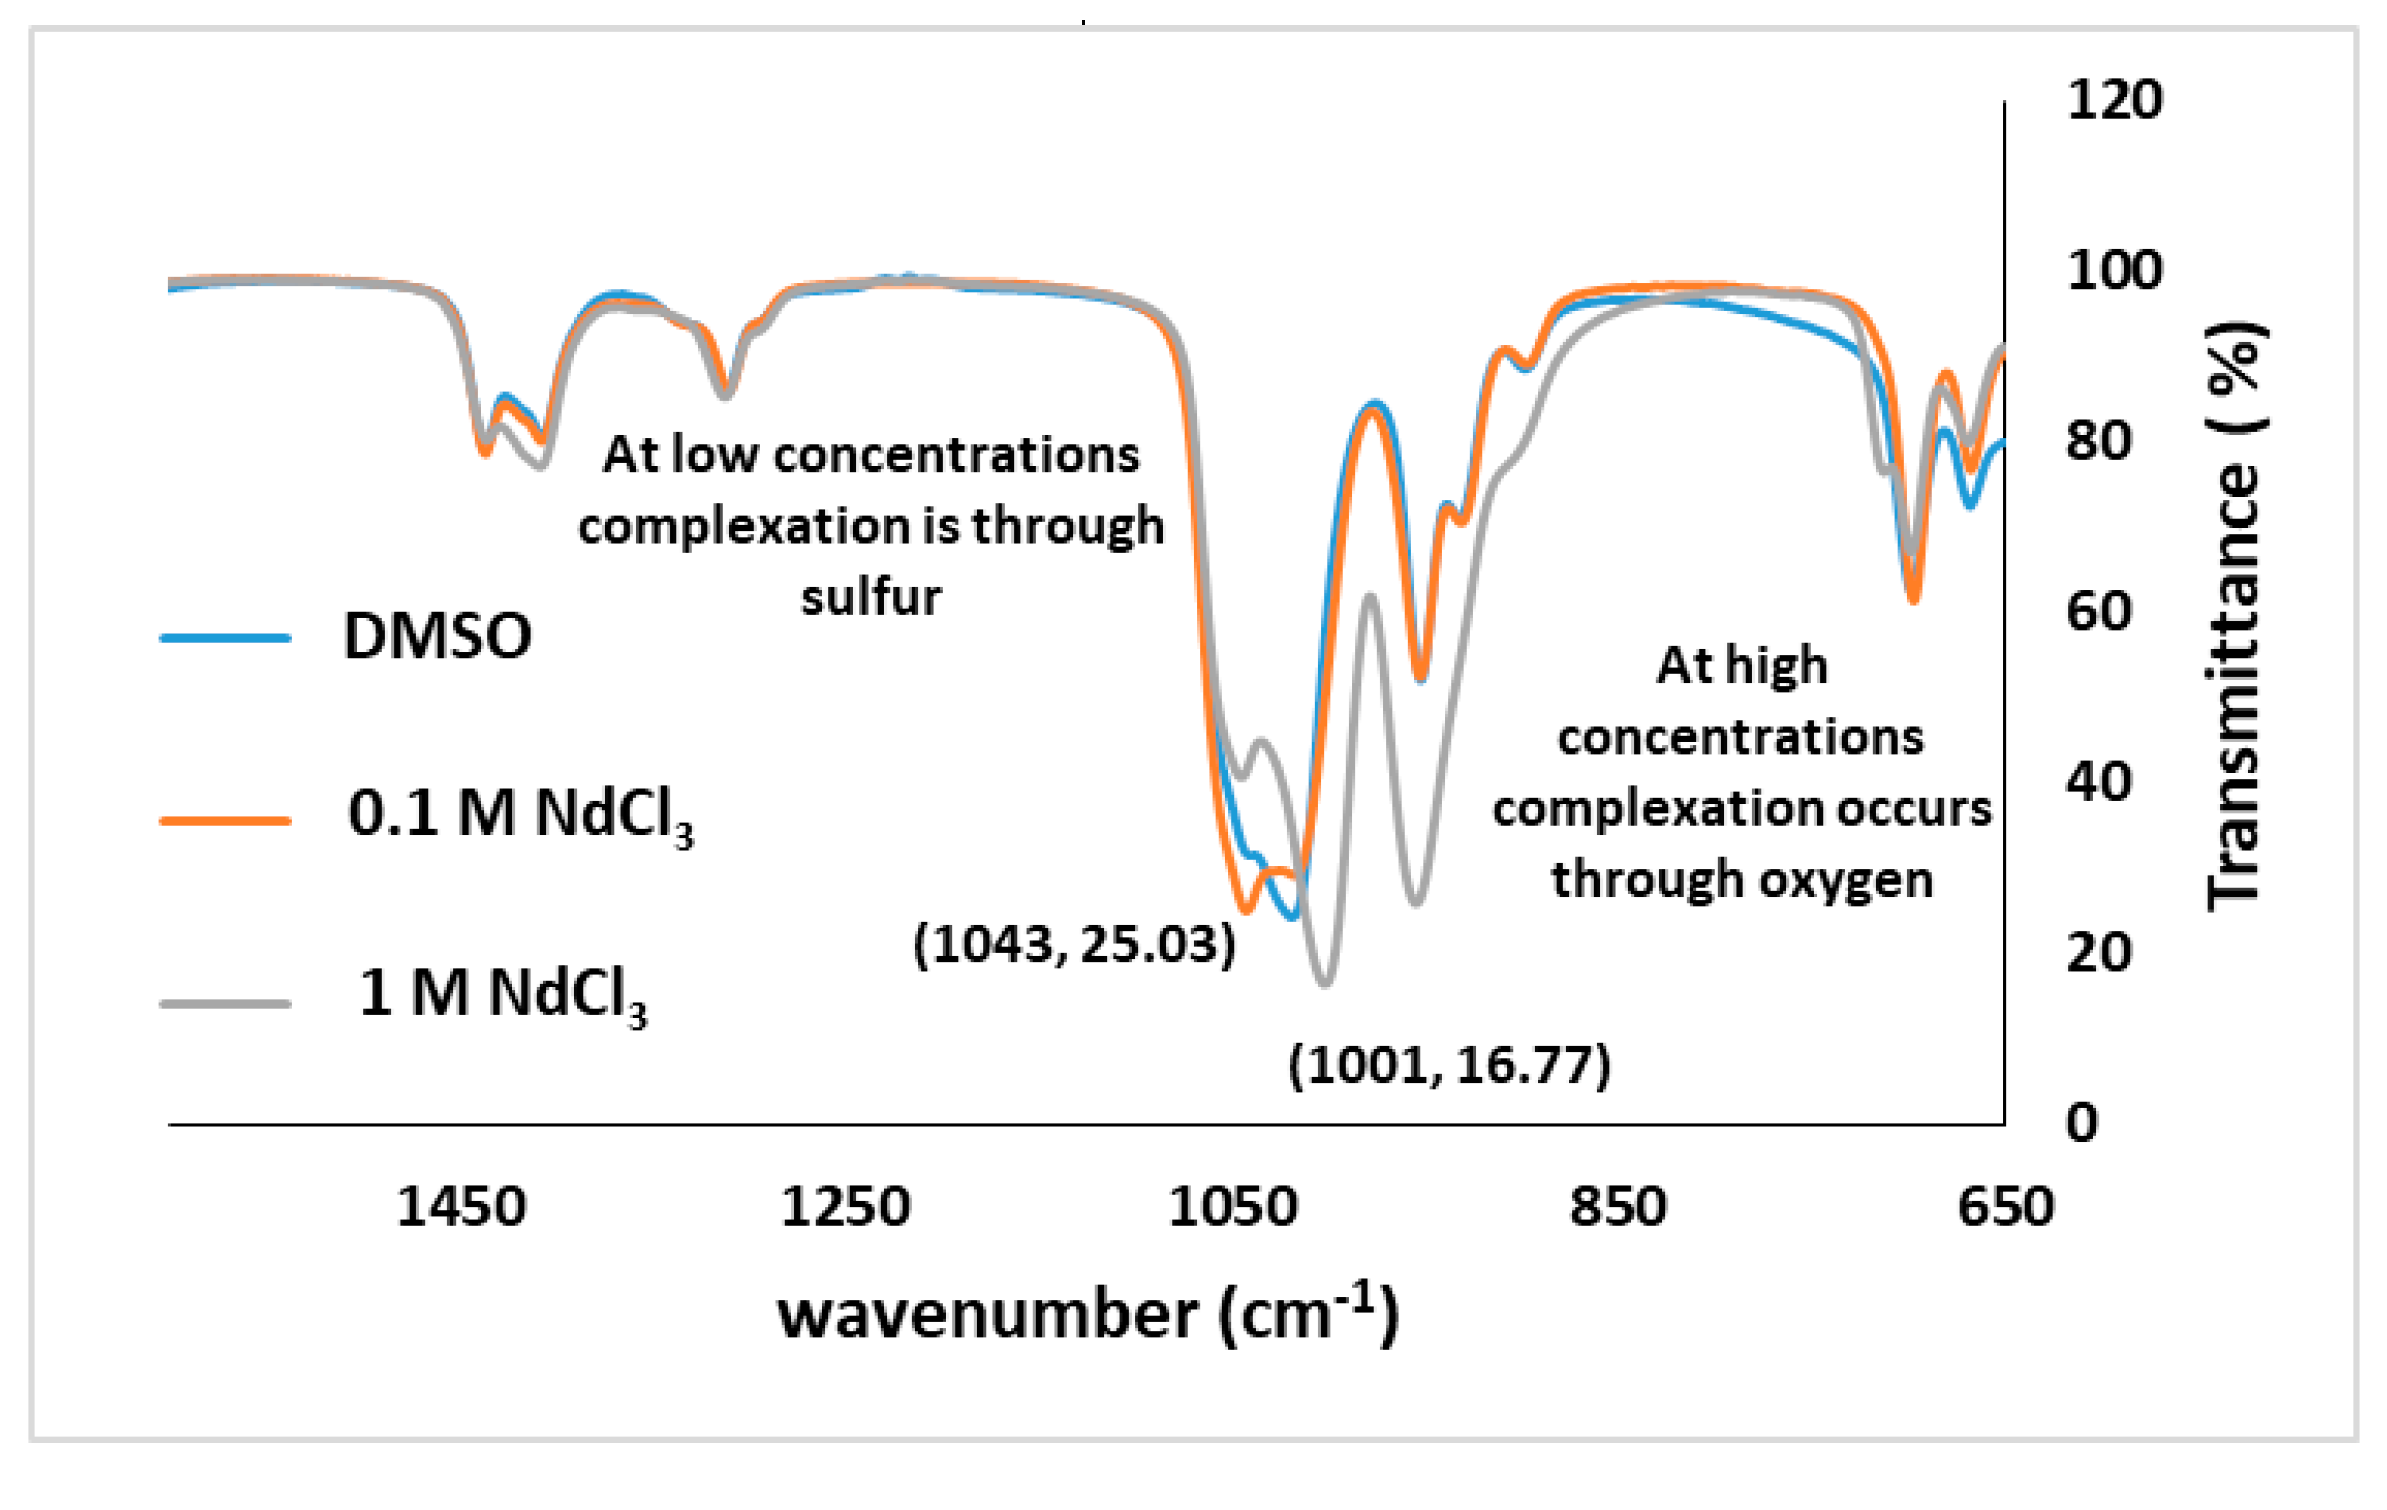
3.1.3. FTIR Study of NdCl3 and DMSO Solutions

It is strongly recognized that the complexation of cations in a solution plays an important role in the properties and characteristics of a potential electrolyte [12,13]. The next step of the study was to determine the state of Nd in the prepared solutions by Infra-Red spectroscopy. The Infra-Red spectra were collected in the range of 4000 to 650 cm−1. The spectra are presented in Figure 3 for the pure DMSO, 0.1 M NdCl3 in DMSO, and 1 M NdCl3 in DMSO. Dimethyl sulfoxide has a sulfonyl group and the normal absorption of the S=O bond occurs at 1050 cm−1 [13,14], as confirmed in Figure 3. Metals can bond to DMSO either through its oxygen or its sulfur [13,15]. If the bonding is to the sulfur, the metal donates electrons from its π orbitals into an empty π orbital on the DMSO ligand, thereby increasing the S–O bond order. Thus, if the metal is bonded to the DMSO at the sulfur, the frequency of the S=O absorption increases. If the bonding is to the oxygen of the DMSO, the metal forms a bond with one of the lone pairs on the oxygen and thereby withdraws electron density from the oxygen [13]. Therefore, the S=O bond order declines and the S=O absorption appears at a lower frequency.
Taking that into account and the FTIR spectra presented in Figure 3 for the different concentrations of Nd, it is implied that at low Nd concentrations, Nd cations are complexated through sulfur since a shift to increased frequency wavenumbers is observed in the spectrum. However, at higher Nd concentrations (1 M) a difference in the complexation trend is noticed and the transmittance peak appears at a lower frequency wavenumber, suggesting that the complexation, in this case, occurs through oxygen.

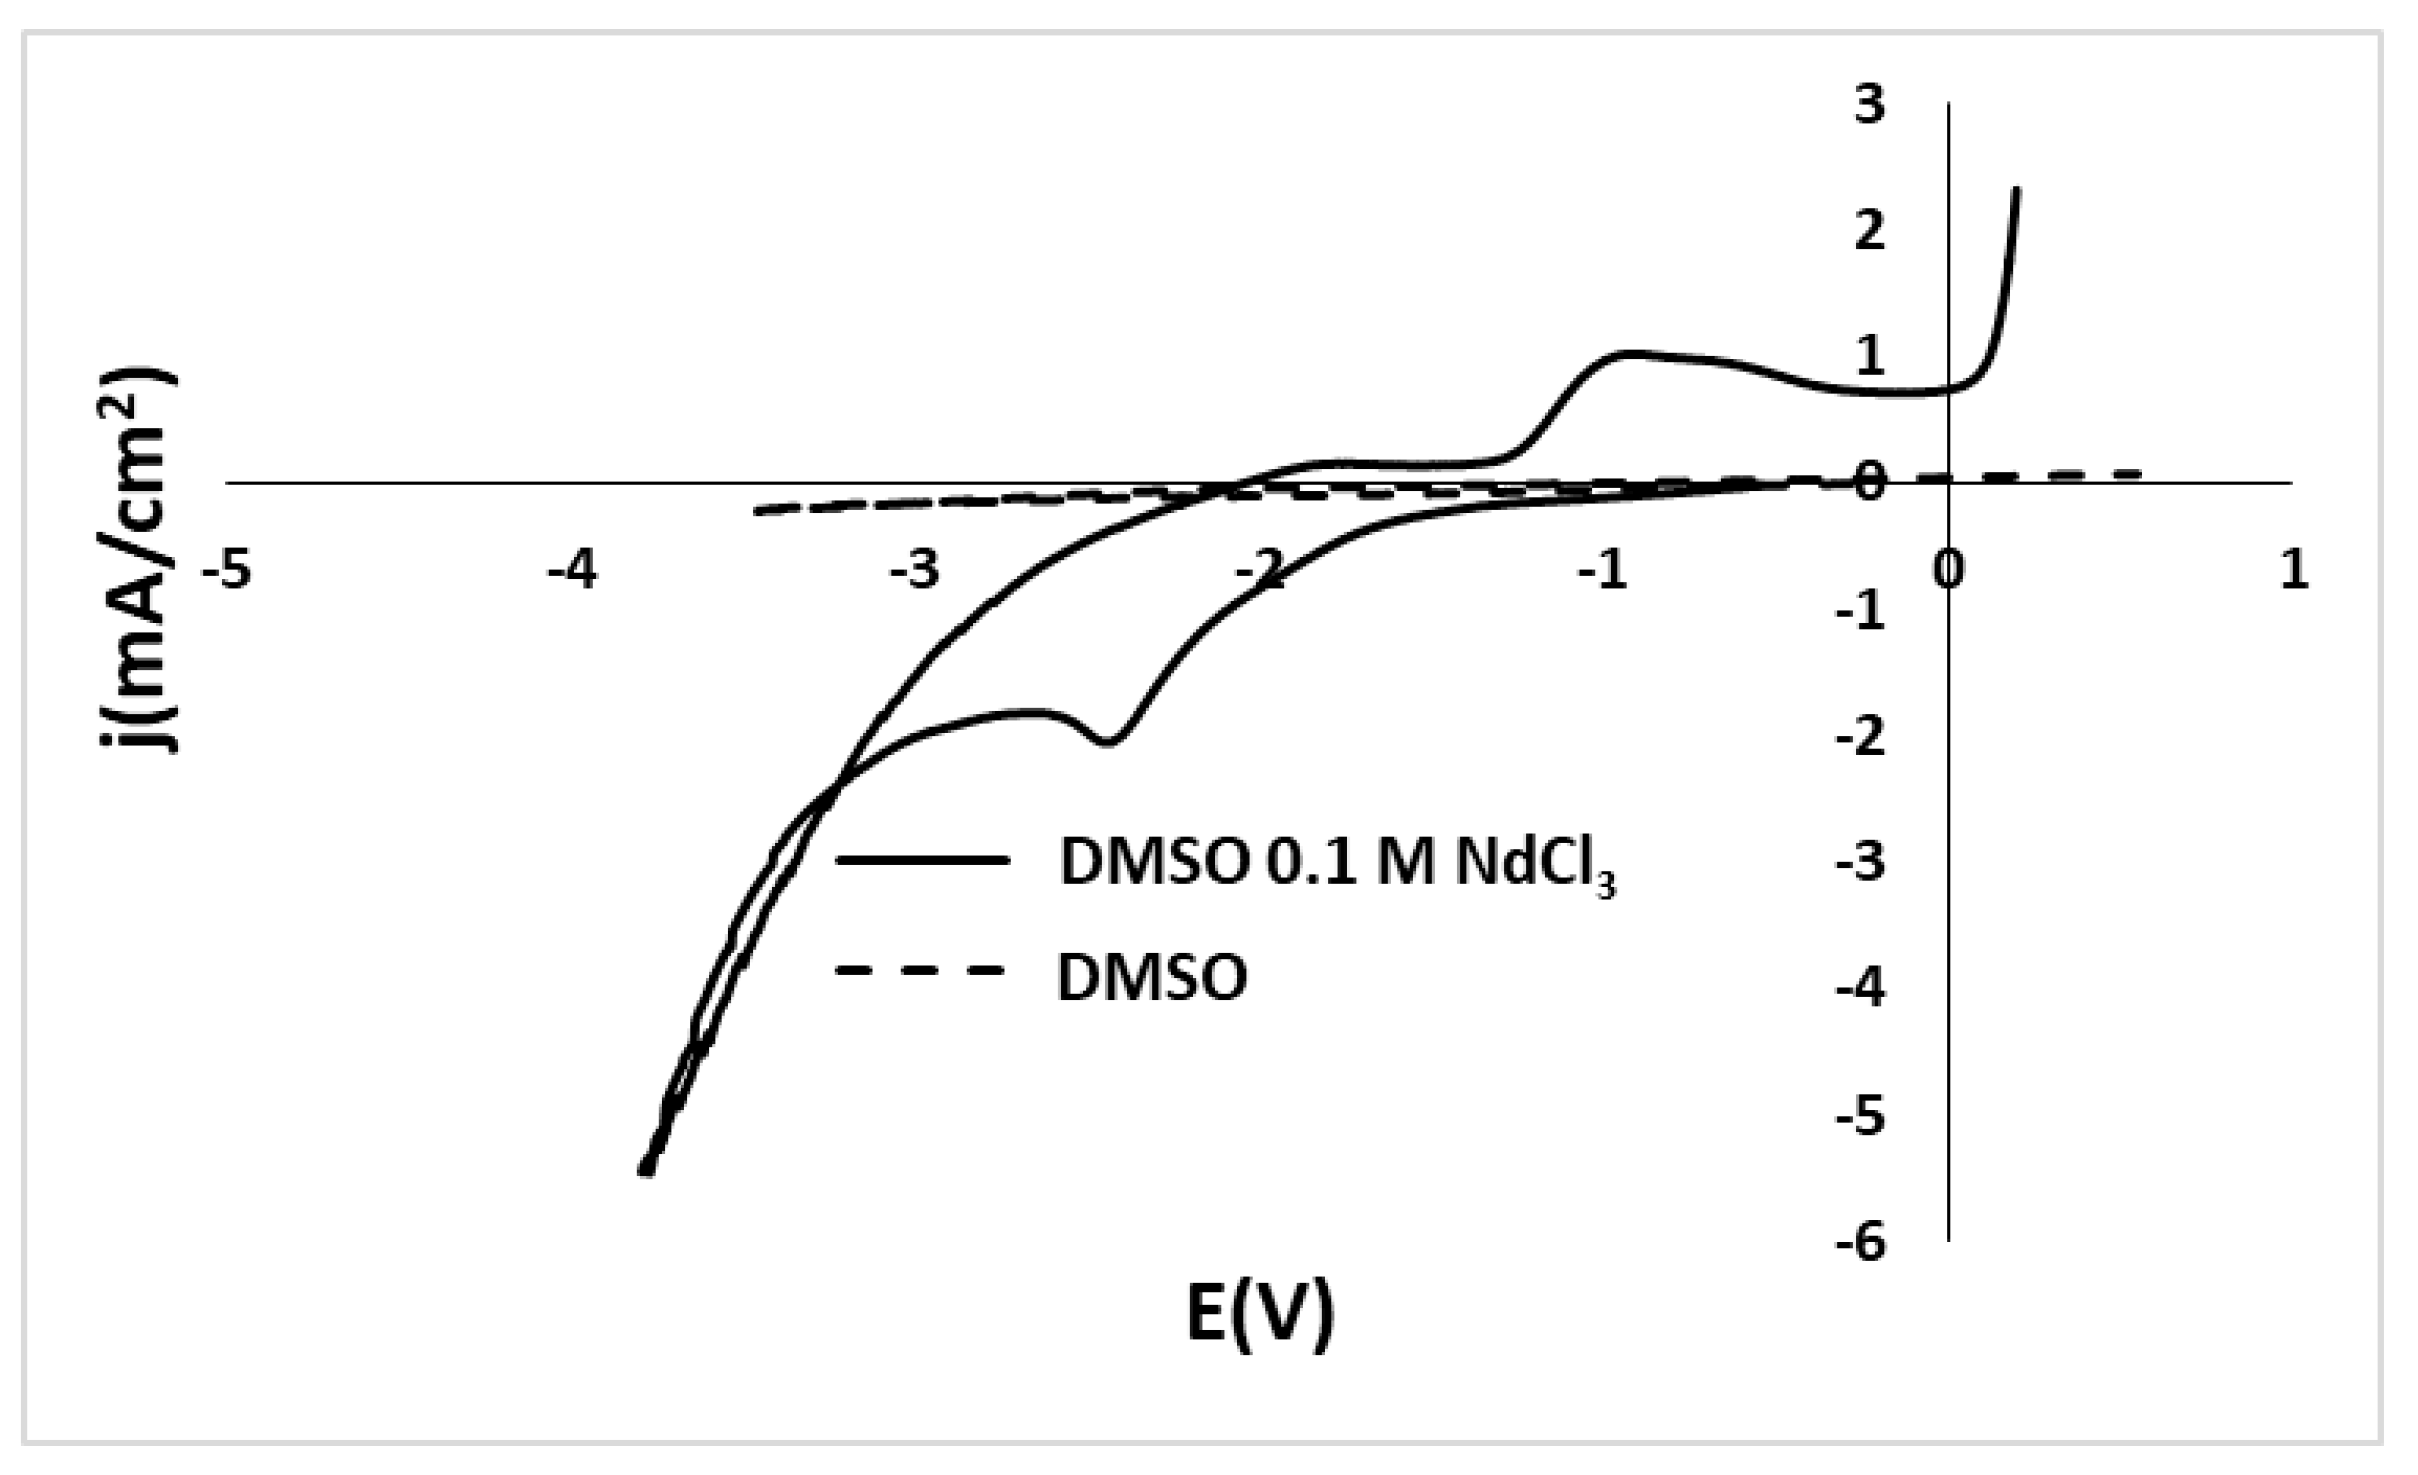
3.1.4. Cyclic Voltammetry of NdCl3 and DMSO Solutions

The extremely negative reduction potential, Ered of Nd3+ imposes severe constraints on the electrodeposition process. It restricts the electrolyte to aprotic materials, because the applied potential, necessary for deposition of this element, will vigorously reduce water and other protic solvents. DMSO has been used as a solvent in non-aqueous polarography and voltammetry and various cathodic processes have been reported to occur [16,17,18,19]. Therefore, DMSO was selected as the electrolyte medium because it is stable at high reducing potentials and is a good, polar solvent [19,20,21,22,23]. In Figure 4 the cyclic voltammograms recorded with a scan rate of 20 mV/s at room temperature for the pure DMSO and 0.1 M Nd in DMSO are reported. The cyclic voltammogram of the solution 0.1 M NdCl3 in DMSO presents a reductive loop that begins when scanning the potential to values more cathodic than −1.8 V and shapes a peak at −2.45 V vs. the reference, which is attributed to the reduction of Nd trivalent cations to the zerovalent state. Moreover, an oxidative peak is observed in the reverse scan at −1.1 V that is ascribed to the oxidation of the deposited metallic Nd, implying that the overall reaction is irreversible.

3.2. Study of Electrolysis Parameters

In the second phase, the parameters affecting electrolysis of Nd from solutions of NdCl3 in DMSO were studied with the aim of concluding to the optimum conditions for Nd electrorecovery. The parameters studied were the mode of electrolysis, the use of supporting electrolyte, concentration, temperature, and stirring. The criteria used to determine the optimum conditions were the presence of impurities in the electrodeposit and the mass of the electrodeposit produced after electrolysis is performed.

3.2.1. Electrolysis Mode

Electrolysis was performed either galvanostatically or potentiostatically and by imposing potential or galvanic pulses. The experiments were performed with dilute solutions, i.e., 0.1 M NdCl3 in DMSO. Four experiments were performed to determine the most efficient electrolysis mode; all experiments were performed at room temperature for a total duration of 24 h. Galvanostatic electrolysis was performed at −0.8 μA. Potentiostatic electrolysis was performed at −2 V. For pulsed current electrolysis, current pulses at −2 mA for t = 1 s and −0.1 μA for t = 3 s were used. Finally, for pulsed potential electrolysis, potential pulses at −2.3 V and −1.5 V were used for the same time intervals as for pulsed current electrolysis. After the end of each electrolysis test, the cathode was thoroughly rinsed with acetone in order to remove the electrolyte, and the cathode was weighed. The difference between the mass of the cathode prior to and after the end of electrolysis was considered the mass of the deposit and is stated in Table 1.
The electrodeposits were evaluated by SEM-EDS analysis in order to be identified. To define the preferable conditions for electrolysis, it was decided to take into consideration both the mass and the quality of the deposit (presence of impurities in the electrodeposited metal). Consequently, after the end of each electrolysis test, rinsing, and weighing, the cathode was removed from the glove box to proceed with SEM-EDS analysis. Nevertheless, the contact with ambient conditions caused the immediate oxidation of the electrodeposited metal forming a greyish film. The oxidized film was identified by SEM-EDS images and the results of the EDS analysis for the electrodeposits are reported in Figure 5.
The EDS analysis confirmed the presence of Nd and O, thus permitting the assumption that neodymium metal was electrodeposited and oxidized after the removal of the electrolyte. It was determined from the SEM-EDS analysis and the mass of the deposit that the optimum electrochemical mode is pulsed electrolysis since the deposits were of higher mass and of higher purity.

3.2.2. Supporting Electrolyte

As was previously stated, DMSO is a polar organic solvent, and solutions of salts can exhibit significant conductivity. However, the use of a supporting electrolyte was tested in order to examine if their addition can boost the electrodeposition of Nd. Aliquat 336 was used as a supporting electrolyte. Aliquat 336 is a common ionic liquid that presents electrochemical stability, which is a prerequisite in this application [24,25]. In addition, Aliquat 336 shares the same anion with the Nd precursors in our system, which is the chloride anion, thus eliminating the introduction of new charged species. In the system, DMSO 0.1 M NdCl3 Aliquat 336 was added as a supporting electrolyte in a volumetric ratio 5:1 (VDMSO/VAliquat = 5/1), and electrolysis was performed by imposing current pulses at −1.8 mA for 1 s and −0.1 μA for 3 s. The total duration of the experiment was 24 h. After the end of electrolysis, the electrodeposit was thoroughly rinsed, its mass was measured, and subsequently, it was submitted to SEM-EDS analysis (Figure 6).
The EDS analysis showed the presence of high amounts of chloride present in the deposit, suggesting its contamination by the electrolyte. It was concluded that the use of this specific supporting electrolyte was detrimental for the process.

3.2.3. Concentration

The electrolysis was performed by imposing current pulses −2 mA for 1 s and −0.1 μA for 3 s at room temperature for a total electrolysis duration of 24 h. The deposits were weighed and examined by SEM-EDS analysis after the end of electrolysis. The neodymium electrodeposited in each electrolysis test is reported in Table 2.
Larger electrodeposits were found for the more concentrated solutions as is presented in Table 2. The SEM-EDS analysis confirmed the presence of Nd and O due to the oxidation of the metal when in contact with the air (Figure 7).

3.2.4. Temperature

Electrolysis was performed at 30 °C, 50 °C, and 70 °C. The electrolysis was realized by imposing current galvanic pulses at −2 mA for 1 s and −0.1 μA for 3 s for a total duration of 5 h, and the solution used for electrolysis was 1 M NdCl3 in DMSO. DMSO has a boiling point at 189 °C that permits the increase of temperature during electrolysis. Nevertheless, there is an unavoidable evaporation at lower temperatures that could alter the volume and by consequence the concentration of the solution. This is the reason that electrolysis was performed for 5 h when studying the effect of the temperature, instead of 24 h. A 24 h test could have been performed by the use of a condenser, but that would render the set up rather difficult to install inside the glove box. The masses of the electrodeposits are presented on Table 3.
As was mentioned, DMSO has a boiling point at 189 °C that permits the increase of temperature during electrolysis. Furthermore, the increase of temperature is considered a simple way to boost the rate of a reaction. Yet, in the system under study, it is observed that at temperatures above 50 °C the final mass of the electrodeposit is decreased, implying that either cracking phenomena take place or a competitive reaction, such as the decomposition of the electrolyte, happens [22]. Among the three electrodeposits, the higher mass was measured for the electrodeposit produced at 50 °C.
Nonetheless, the EDS analysis performed on all three electrodeposits revealed that the increase of temperature to 50 °C and 70 °C increased the impurities found in the electrodeposit, which is detrimental for the process (Figure 8). Hence, it was derived by SEM-EDS analysis that the higher temperatures enhance the incorporation of impurities from the electrolyte, and the preferable temperature to perform electrolysis is T = 30 °C.

3.2.5. Stirring

Current pulsed electrolysis was performed in 1 M NdCl3 in DMSO at −2 mA for 1 s and −0.1 μA for 3 s for a total duration of 24 h at T = 30 °C. Under mild stirring, 21 mg of Nd were electrodeposited, while without stirring that value was 19 mg. As it was anticipated, stirring improved the electrodeposition rate, whereas the deposit in both cases did not present contaminations from the electrolyte (Figure 9).

3.3. Optimum Conditions

Taking into consideration the results from the study of electrochemical parameters, the optimum conditions for electrolysis were defined. The pulsed electrolysis provided the most satisfying results, while the use of supporting electrolyte did not improve the behavior of the system. The more concentrated solutions produced larger deposits. The higher temperatures enhanced the incorporation of impurities from the electrolyte, thus, the preferable temperature was T = 30 °C, while stirring enhanced the electrodeposition of Nd. Electrolysis was performed in the optimum conditions and the electrodeposit was examined by X-ray Photoelectron Spectroscopy in order to confirm metallic Nd electrodeposition. The deposits, after the end of electrolysis, were rinsed and stored inside the glovebox under inert conditions in sealed serum bottles, to perform XPS measurements. The photoemission survey showed the presence of the atoms Nd, O, C, and S. For that reason, Ar+ sputtering cycles (2 kV, 1.2 × 10⁻⁶ mbar Ar) were performed, in order to remove the first atomic layers, and after the first sputtering cycle, no sulfur or carbon was detected, thus revealing that their presence was due to inadequate electrolytes removal from the surface of the deposit and not due to a deposit’s contamination. In Figure 10, the spectrum shown with a black line, which is collected before sputtering cycles, shows the Nd 3d peak of the sample, and the binding energy of Nd3d5/2 is at 983.3 eV and is attributed to the Nd2O3 chemical state. It is obvious that the sealing of the samples after preparation in the serum bottles as well as the introduction to the UHV chamber using a glove bag is not enough to avoid the oxidation of the surface. Sputtering caused the appearance of a second peak component assigned to Nd0 as evidenced by the XPS measurements. In Figure 10, the spectra of Nd3d collected after different periods of sputtering cycles of the sample are presented and show that a second peak at ~3 eV lower binding energy appeared, which is assigned to the Nd0 chemical state [26], thus confirming that metallic Nd is electrodeposited.

4. Conclusions

In the present study, the use of an organic solvent was investigated as a potential electrolytic medium for the reduction of drastic metals of high technological and economic importance, such as Nd. The high-temperature molten salts electrolysis that is the current technology used for the production of Nd is an energy-intensive process with a severe environmental impact. The experimental results showed that NdCl3 can be dissolved rapidly in the aprotic organic solvent DMSO and produce concentrated solutions. In the first part of the study, the viscosity, the conductivity, the way Nd is complexated with the electrolyte, and the electrochemical behavior of the electrolytic system were presented, while in the second part, the research was focused on defining the optimum conditions for electrolysis. The study of the electrolysis parameters revealed that pulsed electrolysis, at low temperatures, under stirring exhibited the best results, and the deposit produced was identified by XPS analysis, and it was confirmed that metallic Nd was electrodeposited indicating that the metallurgical process under development is promising.

Author Contributions

Conceptualization, E.B. and D.P.; Methodology, E.B. and D.P.; Validation, E.B., D.P., and A.K.; Formal Analysis, E.B. and D.P.; Investigation, E.B. and L.S.; Resources, E.B., D.P. and I.P.; Data Curation, E.B.; Writing-Original Draft Preparation, E.B.; Writing-Review and Editing, D.P. and A.K.; Supervision, D.P.; Project Administration, D.P. and I.P.; Funding Acquisition, D.P. and I.P.

Funding

This research was funded by European Community’s Seventh Framework Programme ([FP7/2007-2013]) under grant agreement n°309373. This publication reflects only the author’s view, exempting the Community from any liability. Project web site: www.eurare.eu.

Conflicts of Interest

The authors declare no conflict of interest.

References

  1. European Union. European Commission, Study on the Review of the List of Critical Raw Materials. Critical Raw Materials Factsheets; Publications Office of the European Union: Luxembourg, 2017; pp. 403–411. ISBN 978-92-79-72119-9. [Google Scholar]
  2. Rahman, M.A.; Slemon, G.R. Promising Applications of Neodymium Boron Iron Magnets in Electrical Machines. IEEE Trans. Magn. 1985, 21, 1712–1716. [Google Scholar] [CrossRef]
  3. Le Mercier, T. Applications of Rare Earth Luminescent Materials. In Rare Earths, Science, Technology, Production and Use, 1st ed.; Lucas, J., Lucas, P., Le Mercier, T., Rollat, A., Davenport, W., Eds.; Elsevier: Amsterdam, The Netherlands, 2015; pp. 281–317. ISBN 978-0-444-62735-3. [Google Scholar]
  4. Davensport, W. Metallothermic Rare Earth Metal Reduction. In Rare Earths, Science, Technology, Production and Use, 1st ed.; Lucas, J., Lucas, P., Le Mercier, T., Rollat, A., Davenport, W., Eds.; Elsevier: Amsterdam, The Netherlands, 2015; pp. 109–122. ISBN 978-0-444-62735-3. [Google Scholar]
  5. Firdaus, M.; Rhamdhani, M.A.; Durandet, Y.; Rankin, W.J.; McGregor, K. Review of high-temperature recovery of Rare Earth (Nd/Dy) from magnet waste. J. Sustain. Metall. 2016, 2, 276–295. [Google Scholar] [CrossRef]
  6. Miao, Y.W.; Horng, J.S.; Hoh, Y.C. The Preparation of Nd Metal from Taiwan Black Monazite. In Proceedings of the International Symposium on Production and Electrolysis of Light Metals, Halifax, NS, Canada, 20–24 August 1989. [Google Scholar]
  7. Vogel, H.; Friedrich, B. An estimation of PFC emission by rare earth electrolysis. In Light Metals 2018; Martin, O., Ed.; The Minerals, Metals & Materials Series; Springer: Cham, Switzerland, 2018; pp. 1507–1516. ISBN 978-3-319-72283-2. [Google Scholar]
  8. Krishnamurthy, N.; Gupta, C.K. Rare earth metals and alloys by electrolytic methods. Min. Proc. Ext. Met. Rev. 2001, 22, 477–507. [Google Scholar] [CrossRef]
  9. Krishnamurthy, N.; Gupta, C.K. Extractive Metallurgy of Rare Earths, 2nd ed.; CRC Press: Boca Raton, FL, USA, 2005; pp. 333–442. ISBN 978-1-4665-7638-4. [Google Scholar]
  10. Keller, R. Electrolytic production of neodymium with and without emission of greenhouse gases. Electrochem. Soc. Proc. 1998, 97, 143–145. [Google Scholar] [CrossRef]
  11. Konings, R.J.M.; Kovács, A. Thermodynamic Properties of the Lanthanide(III) Halides. In Handbook on the Physics and Chemistry of Rare Earths, 1st ed.; Gschneidner, K.A., Jr., Bünzli, J.-C.G., Pecharsky, V.K., Eds.; Elsevier Science B.V.: Amsterdam, The Netherlands, 2003; Volume 33, pp. 147–248. ISBN 0-444-51323-33. [Google Scholar]
  12. Reynolds, W.L.; Silesky, H.S. Solubilities of potassium chloride and sodium iodide in dimethylsulfoxide—Water mixtures. J. Chem. Eng. Data 1960, 5, 250. [Google Scholar] [CrossRef]
  13. Reynolds, W.R. Dimethyl sulfoxide in inorganic chemistry. In Progress in Inorganic Chemistry, 1st ed.; Lippard, S.J., Ed.; Interscience: New York, NY, USA, 1970; Volume 12, pp. 3–21. ISBN 978-0-471-540823. [Google Scholar]
  14. Mercer, A.; Trotter, J. Crystal and molecular structure of dichlorotetrakis(dimethyl sulphoxide)ruthenium(II). J. Chem. Soc. Dalton Trans. 1975, 23, 2480–2483. [Google Scholar] [CrossRef]
  15. Meek, D.W.; Straub, D.K.; Drago, R.S. Transition metal ion complexes of dimethyl sulfoxide. J. Am. Chem. Soc. 1960, 82, 6013–6016. [Google Scholar] [CrossRef]
  16. Maxfield, M.; Eckhardt, H.; Iqbal, Z.; Reidinger, F.; Baughman, R.M. Bi-Sr-Ca-Cu-O and Pb-Bi-Sr-Ca-Cu-O superconductor films via an electrodeposition process. Appl. Phys. Lett. 1989, 54, 1932–1933. [Google Scholar] [CrossRef]
  17. Kolthoff, I.M.; Reddy, T.B. Polarography and Voltammetry in Dimethylsulfoxide. J. Electrochem. Soc. 1961, 108, 980–985. [Google Scholar] [CrossRef]
  18. Simka, W.; Puszczyk, D.; Nawrat, G. Electrodeposition of metals from non-aqueous solutions. Electrochim. Acta 2009, 54, 5307–5319. [Google Scholar] [CrossRef]
  19. Handley, T.H.; Cooper, J.H. Quantitative electrodeposition of actinides from dimethylsulfoxide. Anal. Chem. 1969, 41, 381–382. [Google Scholar] [CrossRef]
  20. Li, G.; Tong, Y.; Liu, G. Preparation of Lu–Bi–Ni thin films in dimethylsulfoxide by cylic electrodeposition method. Mater. Lett. 2004, 58, 3839–3843. [Google Scholar] [CrossRef]
  21. Yuan, D.; Liu, G.; Tong, Y. Electrochemical behavior of Tm3+ ion and cyclic electrodeposition of a Tm–Co alloy film in dimethylsulfoxide. J. Electroanal. Chem. 2002, 536, 123–127. [Google Scholar] [CrossRef]
  22. Li, G.; Tong, Y.; Wang, Y.; Liu, G. Electrodeposition of Lu–Ni alloy thin films. Electrochim. Acta 2003, 48, 4061–4067. [Google Scholar] [CrossRef]
  23. Giordano, M.C.; Bazan, J.C.; Arvia, A.J. The electrolysis of dimethylsulphoxide solutions of sodium chloride and sodium iodide. Electrochim. Acta 1966, 11, 741–747. [Google Scholar] [CrossRef]
  24. Giridhar, P.; Venkatesan, K.A.; Subramaniam, S.; Srinivasan, T.G.; Vasudeva Rao, P.R. Electrochemical behavior of uranium (VI) in 1-butyl-3-methylimidazolium chloride and in 0.05 M aliquat-336/chloroform. Radiochim. Acta 2006, 94, 415–420. [Google Scholar] [CrossRef]
  25. Litaiem, Y.; Dhahbi, M. Measurements and correlations of viscosity, conductivity and density of a hydrophobic ionic liquid (Aliquat 336) mixtures with a non-associated dipolar aprotic solvent (DMC). J. Mol. Liq. 2012, 169, 54–62. [Google Scholar] [CrossRef]
  26. Otaa, H.; Matsumiya, M.; Sasayaa, N.; Nishihatab, K. Investigation of electrodeposition behavior for Nd(III) in [P2225][TFSA] ionic liquid by EQCM methods with elevated temperatures. Electrochim. Acta 2016, 222, 20–26. [Google Scholar] [CrossRef]
Figure 1. (a) Nd concentration measured by inductively coupled plasma optical emission spectrometer (ICP-OES) for the solutions prepared and (b) the mini reactor used for the dissolution experiments.
Metals 08 00803 g001
Figure 2. (a) Viscosity measurements vs. temperature (T); (b) Conductivity measurements vs. temperature (T).
Metals 08 00803 g002
Figure 3. Infra-Red spectra for pure dimethyl sulfoxide (DMSO) (in blue line), DMSO_0.1 Μ NdCl3 (in orange line), and DMSO_1 M NdCl3 (grey line).
Metals 08 00803 g003
Figure 4. Cyclic voltammogramm of DMSO_0.1 M NdCl3 (solid line) and DMSO (dash line).
Metals 08 00803 g004
Figure 5. Scanning Electron Microscopy-Energy Dispersive X-Ray Spectroscopy (SEM-EDS) analysis of the electrodeposits produced by (a) Galvanostatic polarization, (b) Potentiostatic polarization, (c) Current pulsed electrolysis, and (d) Potential Pulsed electrolysis.
Metals 08 00803 g005
Figure 6. (a) SEM image and (b) EDS analysis of the electrodeposit.
Metals 08 00803 g006
Figure 7. SEM-EDS analysis of the electrodeposits for the three different concentration solutions (a) 0.1 M; (b) 0.5 M; (c) 1 M.
Metals 08 00803 g007
Figure 8. SEM-EDS analysis of the electrodeposits produced at (a) 30 °C, (b) 50 °C, and (c) 70 °C.
Metals 08 00803 g008
Figure 9. SEM-EDS analysis of the electrodeposits produced (a) without and (b) with stirring.
Metals 08 00803 g009
Figure 10. X-ray Photoelectron Spectroscopy (XPS) core level spectra of Nd3d of the electrodeposit after introduction in UHV before and after Ar+ sputtering for 2 min, 4 min, 40 min, and 120 min.
Metals 08 00803 g010
Table 1. The mass of the deposit (in mg) for each electrochemical test performed.
Electrochemical ModeGalvanostatic PolarizationPotentiostatic PolarizationPotential Pulsed ElectrolysisCurrent Pulsed Electrolysis
Mass33812
Table 2. The mass of the deposit (in mg) for the three different concentration solutions (in M).
Concentration0.10.51
Mass121419
Table 3. The mass of the deposit (in mg) produced at the three tested temperatures (in °C).
Temperature305070
Mass443

