Experimental and Numerical Investigations into the Failure Mechanisms of TRIP700 Steel Sheets


1
Department of Ferrous Metallurgy, RWTH Aachen University, Aachen 52072, Germany
2
Department of Aerospace Engineering, University of Michigan, Ann Arbor, MI 48109, USA
3
Institute of Metal Forming, Freiberg University of Mining and Technology, Freiberg 09599, Germany
*
Author to whom correspondence should be addressed.
Metals 2018, 8(12), 1073; https://doi.org/10.3390/met8121073
Submission received: 15 November 2018
/
Revised: 11 December 2018
/
Accepted: 13 December 2018
/
Published: 17 December 2018
(This article belongs to the Special Issue Microstructure based Modeling of Metallic Materials)
Abstract
:The formability and failure behavior of transformation-induced plasticity (TRIP) steel blanks were investigated through various stress states. The forming limit diagram (FLD) at fracture was constructed both experimentally and numerically. Numerical studies were performed to evaluate the applicability of different damage criteria in predicting the FLD as well as complex cross-die deep drawing process. The fracture surface and numerical results reveal that the material failed in a different mode for different strain path. Therefore, the Tresca model, which is based on shear stress, accurately predicted the conditions where shear had a profound effect on the damage initiation, whereas Situ localized necking criterion could calculate the conditions in which localization was dominant.
1. Introduction
Transformation-induced-plasticity (TRIP) steel sheets are widely used in automotive structures due to their outstanding mechanical properties, such as the forming potential and high energy absorption [1,2,3,4,5]. However, the application of high strength steels requires thorough knowledge of their formability behavior. Forming limit diagram at necking (FLD) is an indispensable tool for evaluating sheet metal formability at the industrial level. This diagram represents the maximum values of major strain–minor strain pairs at the onset of localized necking in a sheet subjected to different proportional linear strain paths. In this way, a boundary is established between strain states that facilitate sheet forming and those that lead the sheets into failure [6,7].
However, the experimental determination of sheet formability is accompanied by many complications and is a time-consuming procedure. Therefore, theoretical prediction methods are considered for calculating and constructing the forming limit diagram for different materials. In this regard, several models have been proposed to calculate damage initiation. The well-known models include Marciniak–Kuczynski (M-K) [8], and Gurson–Tvergaard–Needleman (GTN) [9], which are extensively used for different materials and processes [10,11,12,13], as they can relatively simply and easily be employed and the results are mostly accurate. Panich et al. [12] calculated both strain and stress based forming limit diagrams using M-K model for TRIP780. The results state that stress based FLD can predict failure in the material. However, as the stresses cannot be measured directly, they depend on the strain hardening law and yielding model used. Bhargava et al. [14] applied different failure criteria to construct FLD of a TRIP steel. The results imply that its FLD is better predicted by a model that detects the deviation of major strain compared to those that detect punch force, thickness, and equivalent plastic strain. Paul [15] predicted FLD for various auto grade steel sheets including TRIP780 by developing a nonlinear regression equation. The results match the experimental results well; however, to calibrate the model, they performed several experimental tests.
The objective of the present work was to evaluate the ability of different damage criteria to predict the forming limits of TRIP700 steel sheet. The damage models were selected based on specific characteristics, including simplicity, ease of use, and least dependency on the experimental calibration. Note that these characteristics not only make the models feasible, but can also save time, efforts, and cost. The ability of the models to predict damage for the studied steel was assessed through Nakajima punch stretching and cross-die deep drawing tests to induce linear and nonlinear strain paths, respectively. Cross-die deep drawing test is a new experimental technique, which was originally designed by the automotive industry as a press-shop formability test technique [13,16,17]. Since this method can trigger a wide variety of stress states, i.e., from uniaxial tension to plane-strain, and biaxial tension, it is a good candidate to evaluate the formability of sheets.
2. Experimental Procedure
2.1. Material
The formability of a TRIP700 steel sheet with a thickness of 1.2 mm was investigated. The chemical composition is represented in Table 1. Figure 1 shows the initial microstructure, in which retained austenite embedded in a primary matrix of ferrite, and the hard phase of martensite presents. The mechanical properties were evaluated through different directions by using tensile tests according to DIN EN 10002 standard and hydraulic bulge tests [18] (Figure 2). The anisotropy coefficients for angles 0°, 45°, and 90° are 0.793, 0.909, and 1.305, respectively.
2.2. Nakajima Punch Stretching Test
The experimental forming limit diagram was calculated using Nakajima testing method. In this regard, different specimens with various geometries were first prepared, and then square grid patterns were etched electrochemically on their surface for strain analysis. The specimens were formed up to fracture and the limiting strains at necking and fracture areas were evaluated. Schematic geometries of specimens and the machine used for the forming process are illustrated in Figure 3.
2.3. Cross-Die Test
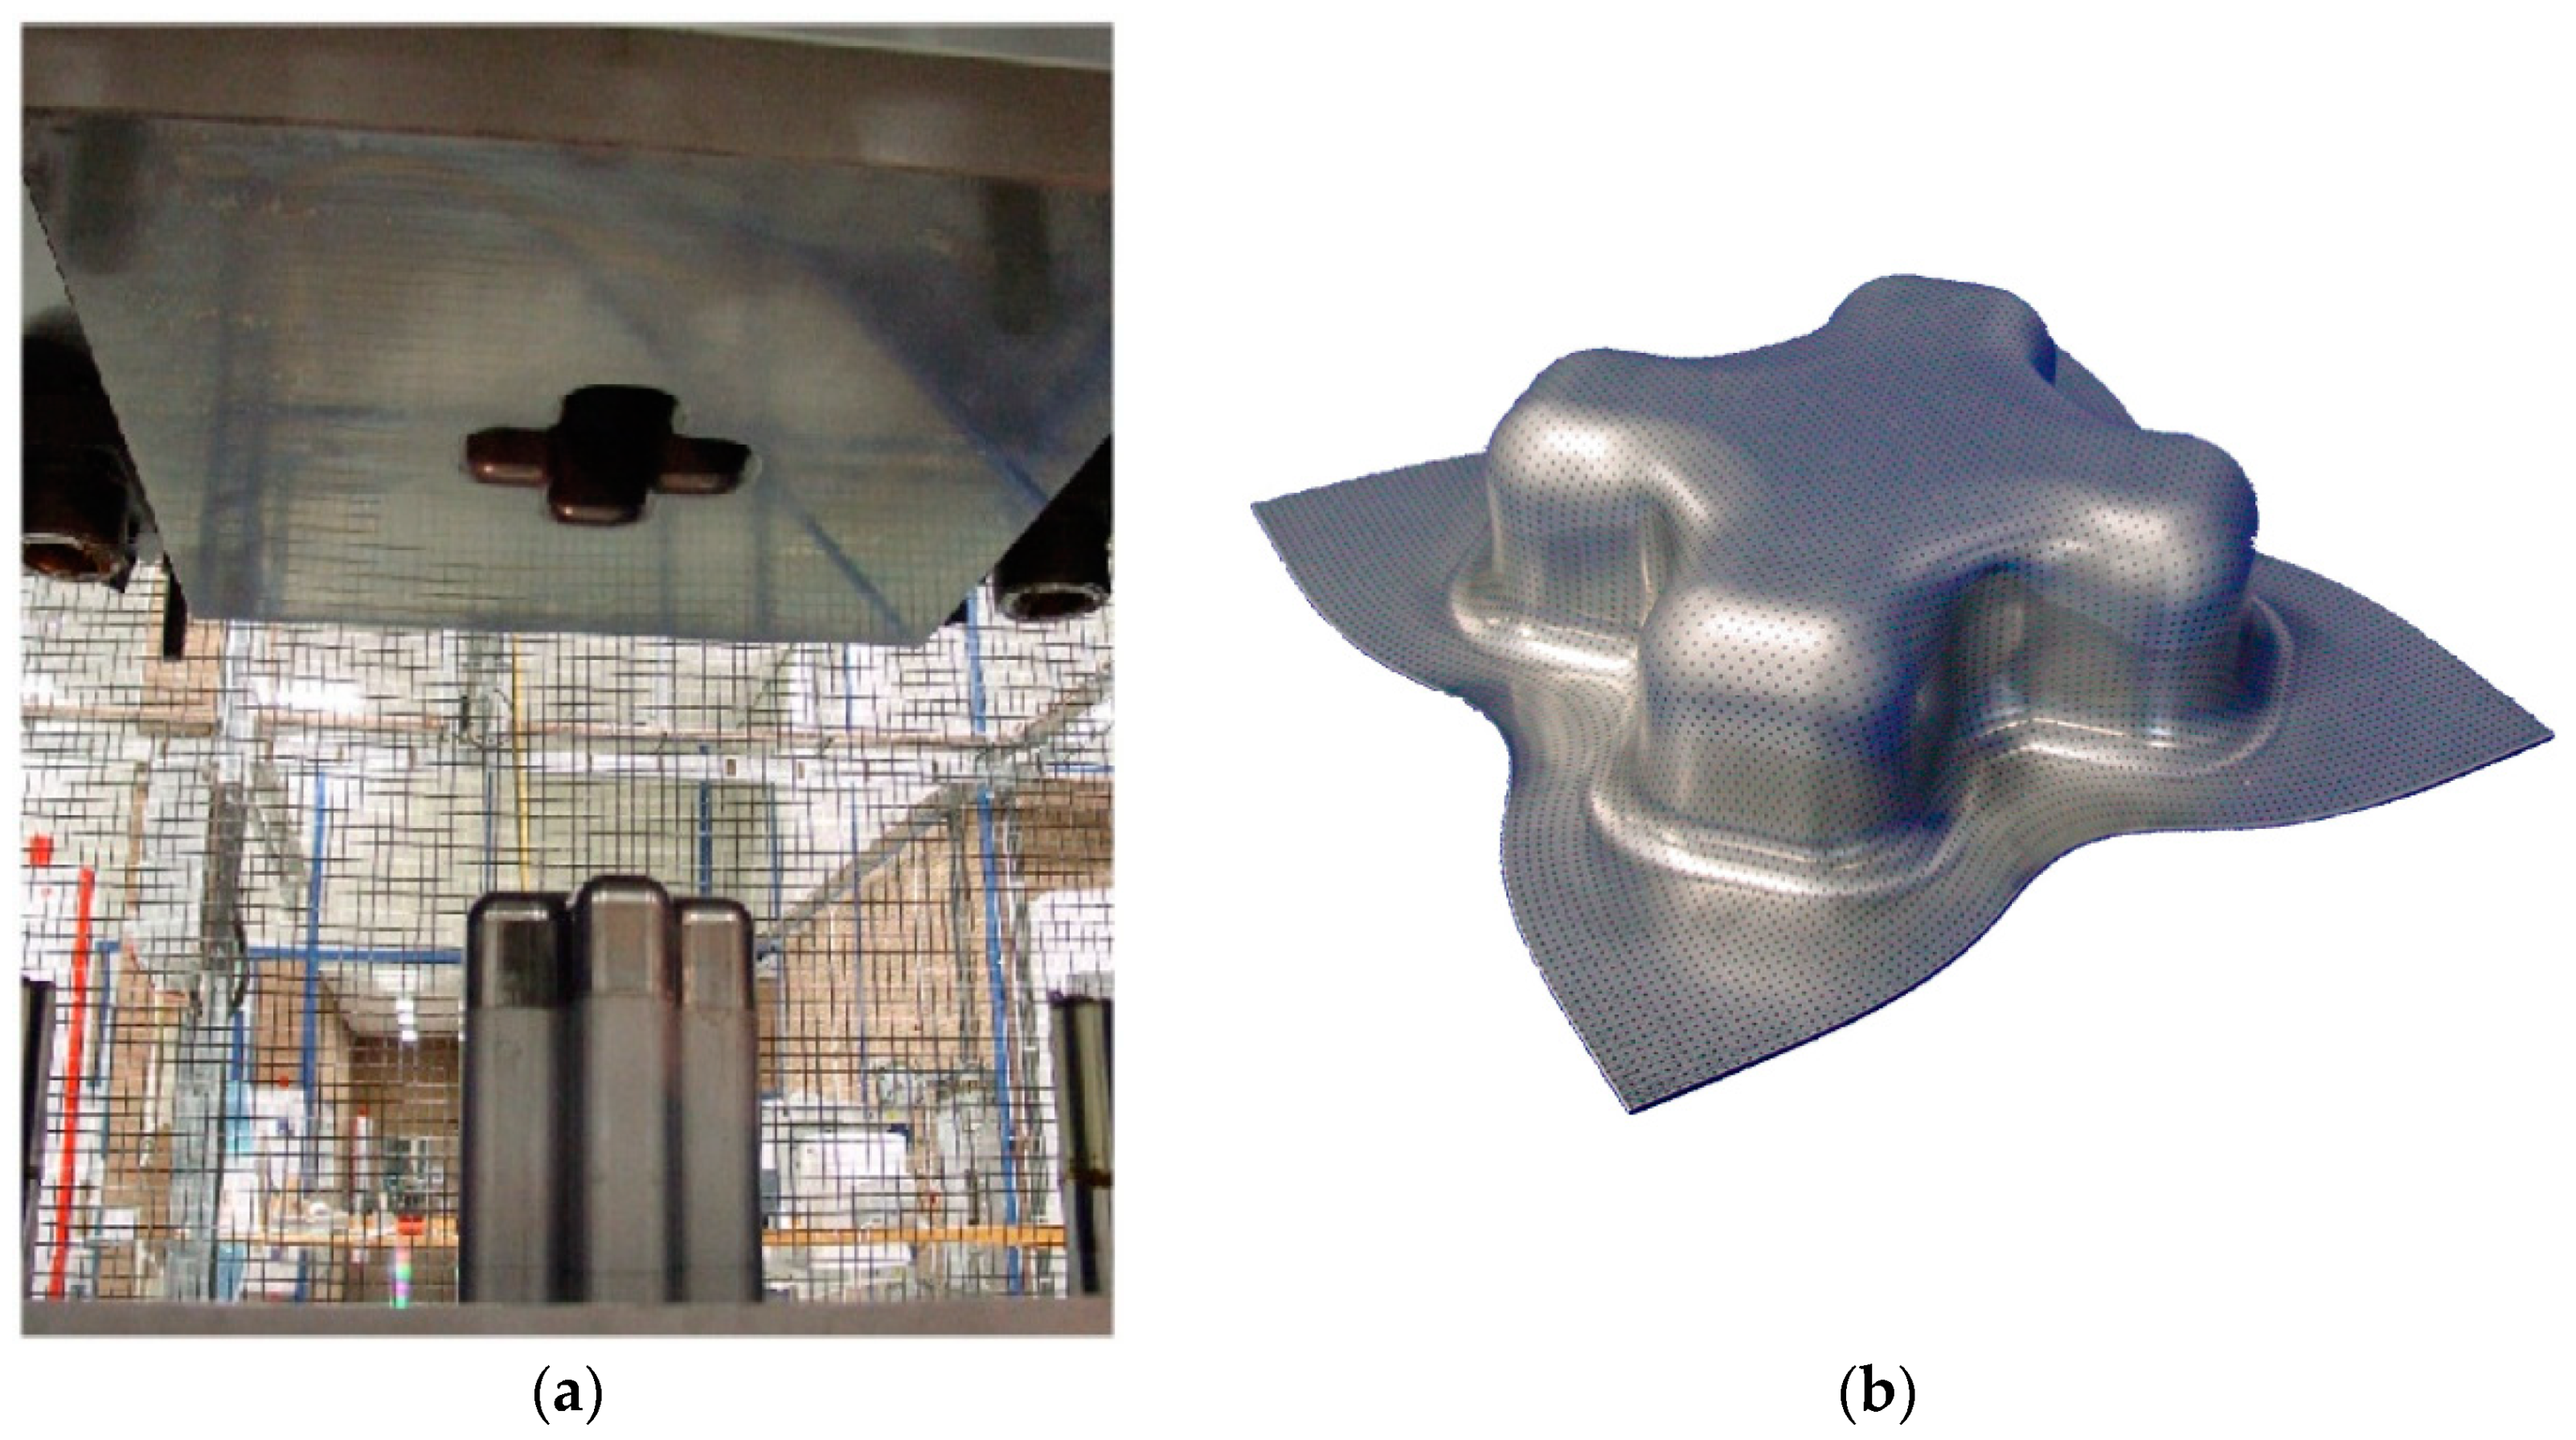
Cross-die deep drawing can cover a wide range of stress states. The experimental setup and the final product configuration are shown in Figure 4. The side dimensions of initial square blanks were about 270 mm. Special oil with a friction coefficient of 0.05 was used to lubricate the steel surfaces. The punching was performed on the semi-industrial SMG press with the speed of 35 mm/s and the blank holder force was set at 667 kN. The strain distribution of the products was measured with PHAST™ photogrammetric strain measuring equipment.
3. Numerical Procedure
3.1. Failure Criteria
To design a successful forming process, prediction of fracture probability during deformation is vital. In this respect, various theories have been introduced to detect the onset of sheet metals’ failure, which are mostly based on deriving strains of necking region that lead to fracture. In the present study, three different failure criteria were applied to calculate the forming limit strains for the different strain paths, as listed in Table 2 and illustrated in Figure 5.
- As the experimental observations in sheet metals [19] show that the fracture plane inclined towards the direction that contains maximum shear stress, a shear failure model was used. Tresca criterion predicts the onset of necking, based on a macroscopic function that describes damage accumulation [20] (Equation (1)).
- Situ et al. [21,22] proposed a localized necking model according to a physical viewpoint. In this criterion, when a critical element exhibits an inflection in its major strain rate history, the localized necking initiates. This inflection corresponds to a maximum in the major strain acceleration (Equation (2)).
- In the other physical criterion, which was suggested by Martínez-Donaire et al. [23], the influence of localized necking zone on the adjacent elements is considered. According to this theory, the strain rate of the adjacent elements to the necking zone is gradually reduced as the strain rate evolution ceases (Equation (3)). In other words, these elements reach a constant level of strain or even undergo some elastic unloading before the fracture initiates, i.e., the deformation is only accompanied by elements in the necking zone.
3.2. Numerical Simulation
3.2.1. Plasticity
The theoretical basis of the failure models is described above. The assumptions used in these analyses are as follows:
- Plane stress conditions, i.e., σ3 = 0.
- Plastic incompressibility during deformation, i.e., dσ1 + dσ2 + dσ3 = 0.
- Associated flow rules,
- An equivalent strain function,
- An assumption of a linear proportional strain path, i.e., .
- Voce hardening law:
To apply any failure criteria, it is crucial to interprete the complete stress–strain history of the material during the deformation process. For this purpose, the Cauchy stress components () and the logarithmic plastic strain components (), which are difficult to acquire directly from the experimental tests, were derived from parallel numerical simulations (explained in the following section (Section 3.2.2) at location of the failure. Furthermore, the other parameters were calculated using the above equations (Equations (4)–(8)). It is worth mentioning that Tresca model was calibrated through both experimental and simulation results of the hemispherical punch tests from the specimens with 45 mm width, i.e., = 539 MPa.
3.2.2. Finite Element Method
3D finite element method simulations using commercial finite element code Abaqus/Explicit 6.14 were performed to analyze the Nakajima punch stretching and cross-die tests. The die, punch, and blank holder were defined as analytical rigid parts, and the sheet was assigned as a deformable homogenous shell (all dimensions were according to the experimental set-ups). The mechanical properties were extracted from the uniaxial tensile test. Hill 1948 criterion was adapted to simulate the yielding and the frictional conditions were considered by Coulomb friction model [25]. The simulation and material data are given in Table 3. A four-node quadrilateral shell element (S4R) with the size of 0.4 × 0.4 mm2 was employed. The mass scaling factor was defined such that that the ratio of kinetic energy to internal energy would not become too large. To reduce the computational time, the mass scaling factor was assumed to be equal to 1000. After clamping, the holder was fixed and the punch was moved towards the sheet. The optimal clamping force was chosen such that the blank neither drew-in nor tore near the draw bead during forming. The examined elements were chosen based on the experimental fracture site and the assumption of each criterion.
4. Results and Discussion
Three different damage modelswere considered to predict the formability of TRIP700 steel sheets through various stress states. To present the results properly, this section is divided into two parts which are based on the utilized testing techniques. In each part, the experimental and numerical results are discussed.
4.1. Nakajima Punch Stretching Tests
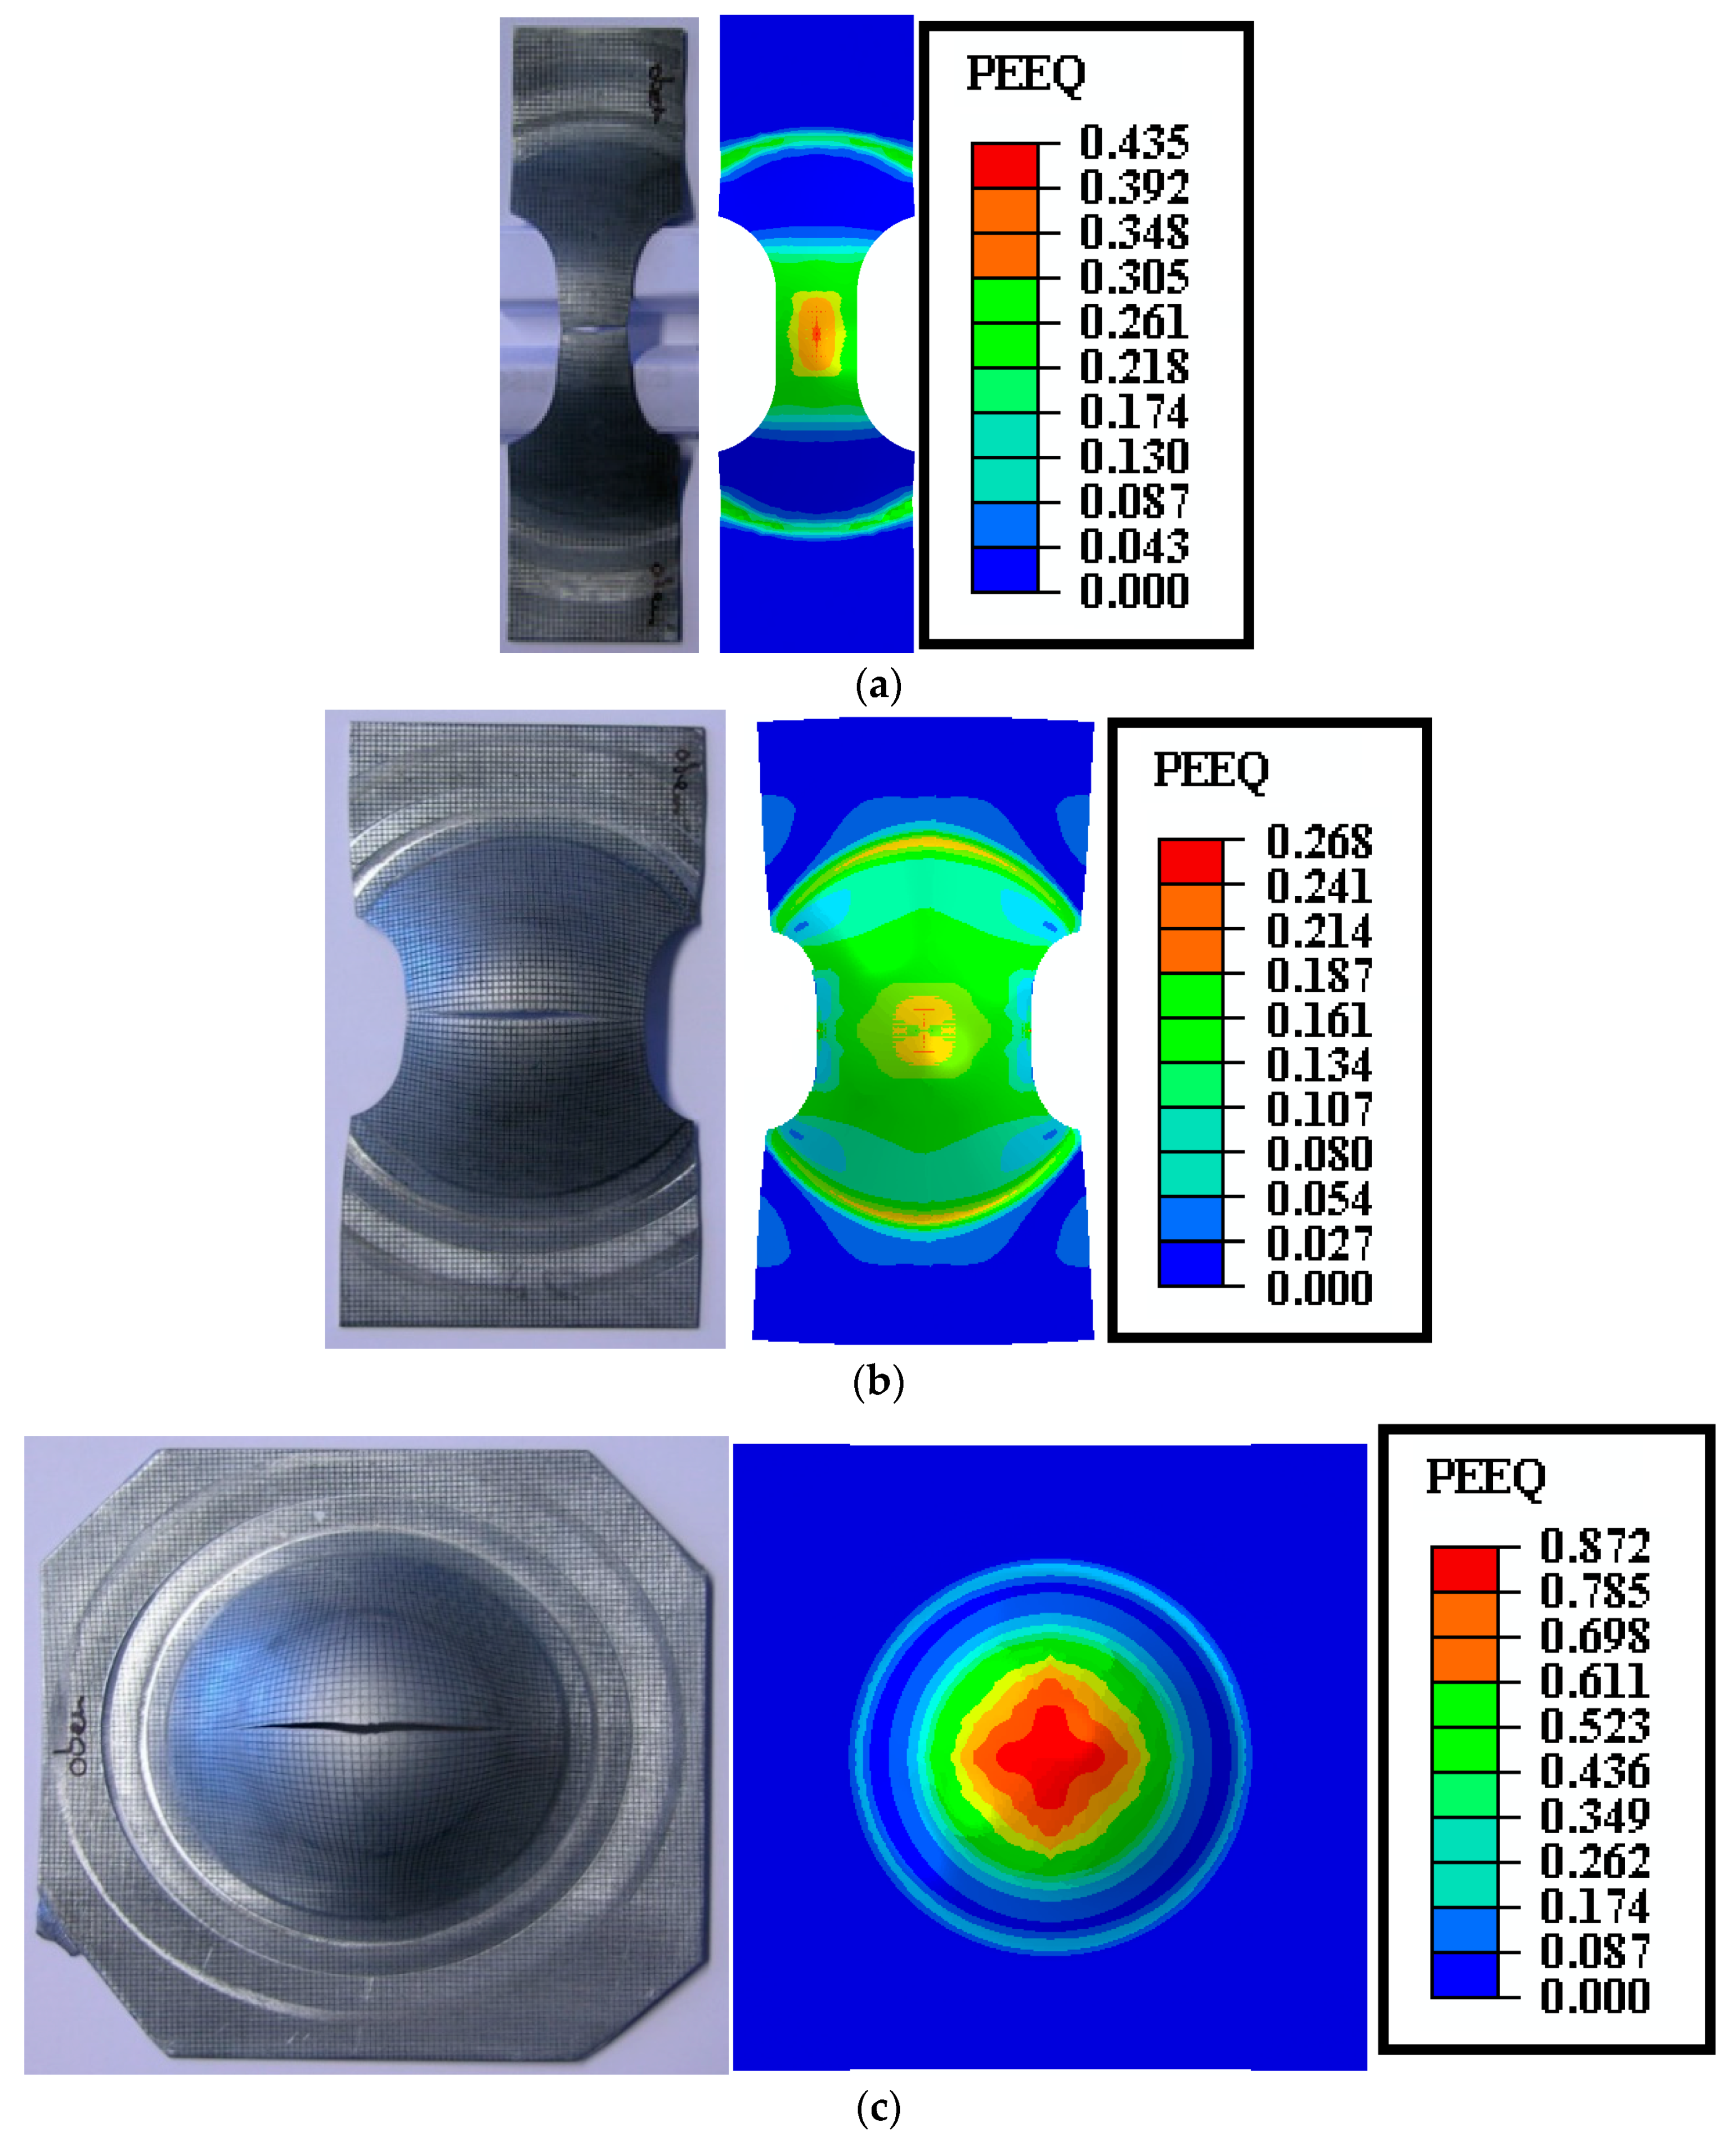
The experiments were carried out for different geometries to induce various strain paths and the FLD was calculated (Figure 6). The simulation results, which were performed according to the experimental tests, show each specimen experienced a specific, almost linear strain path before fracture and the designed specimens were able to cover a wide range of strain paths (Figure 6), from uniaxial tension to equi-biaxial tension. The calculated FLD illustrates relatively low forming limits in comparison to other high strength steels [26,27]. The accuracy of the simulations was evaluated by the deformation history and failure location for all specimens as well (Figure 7).
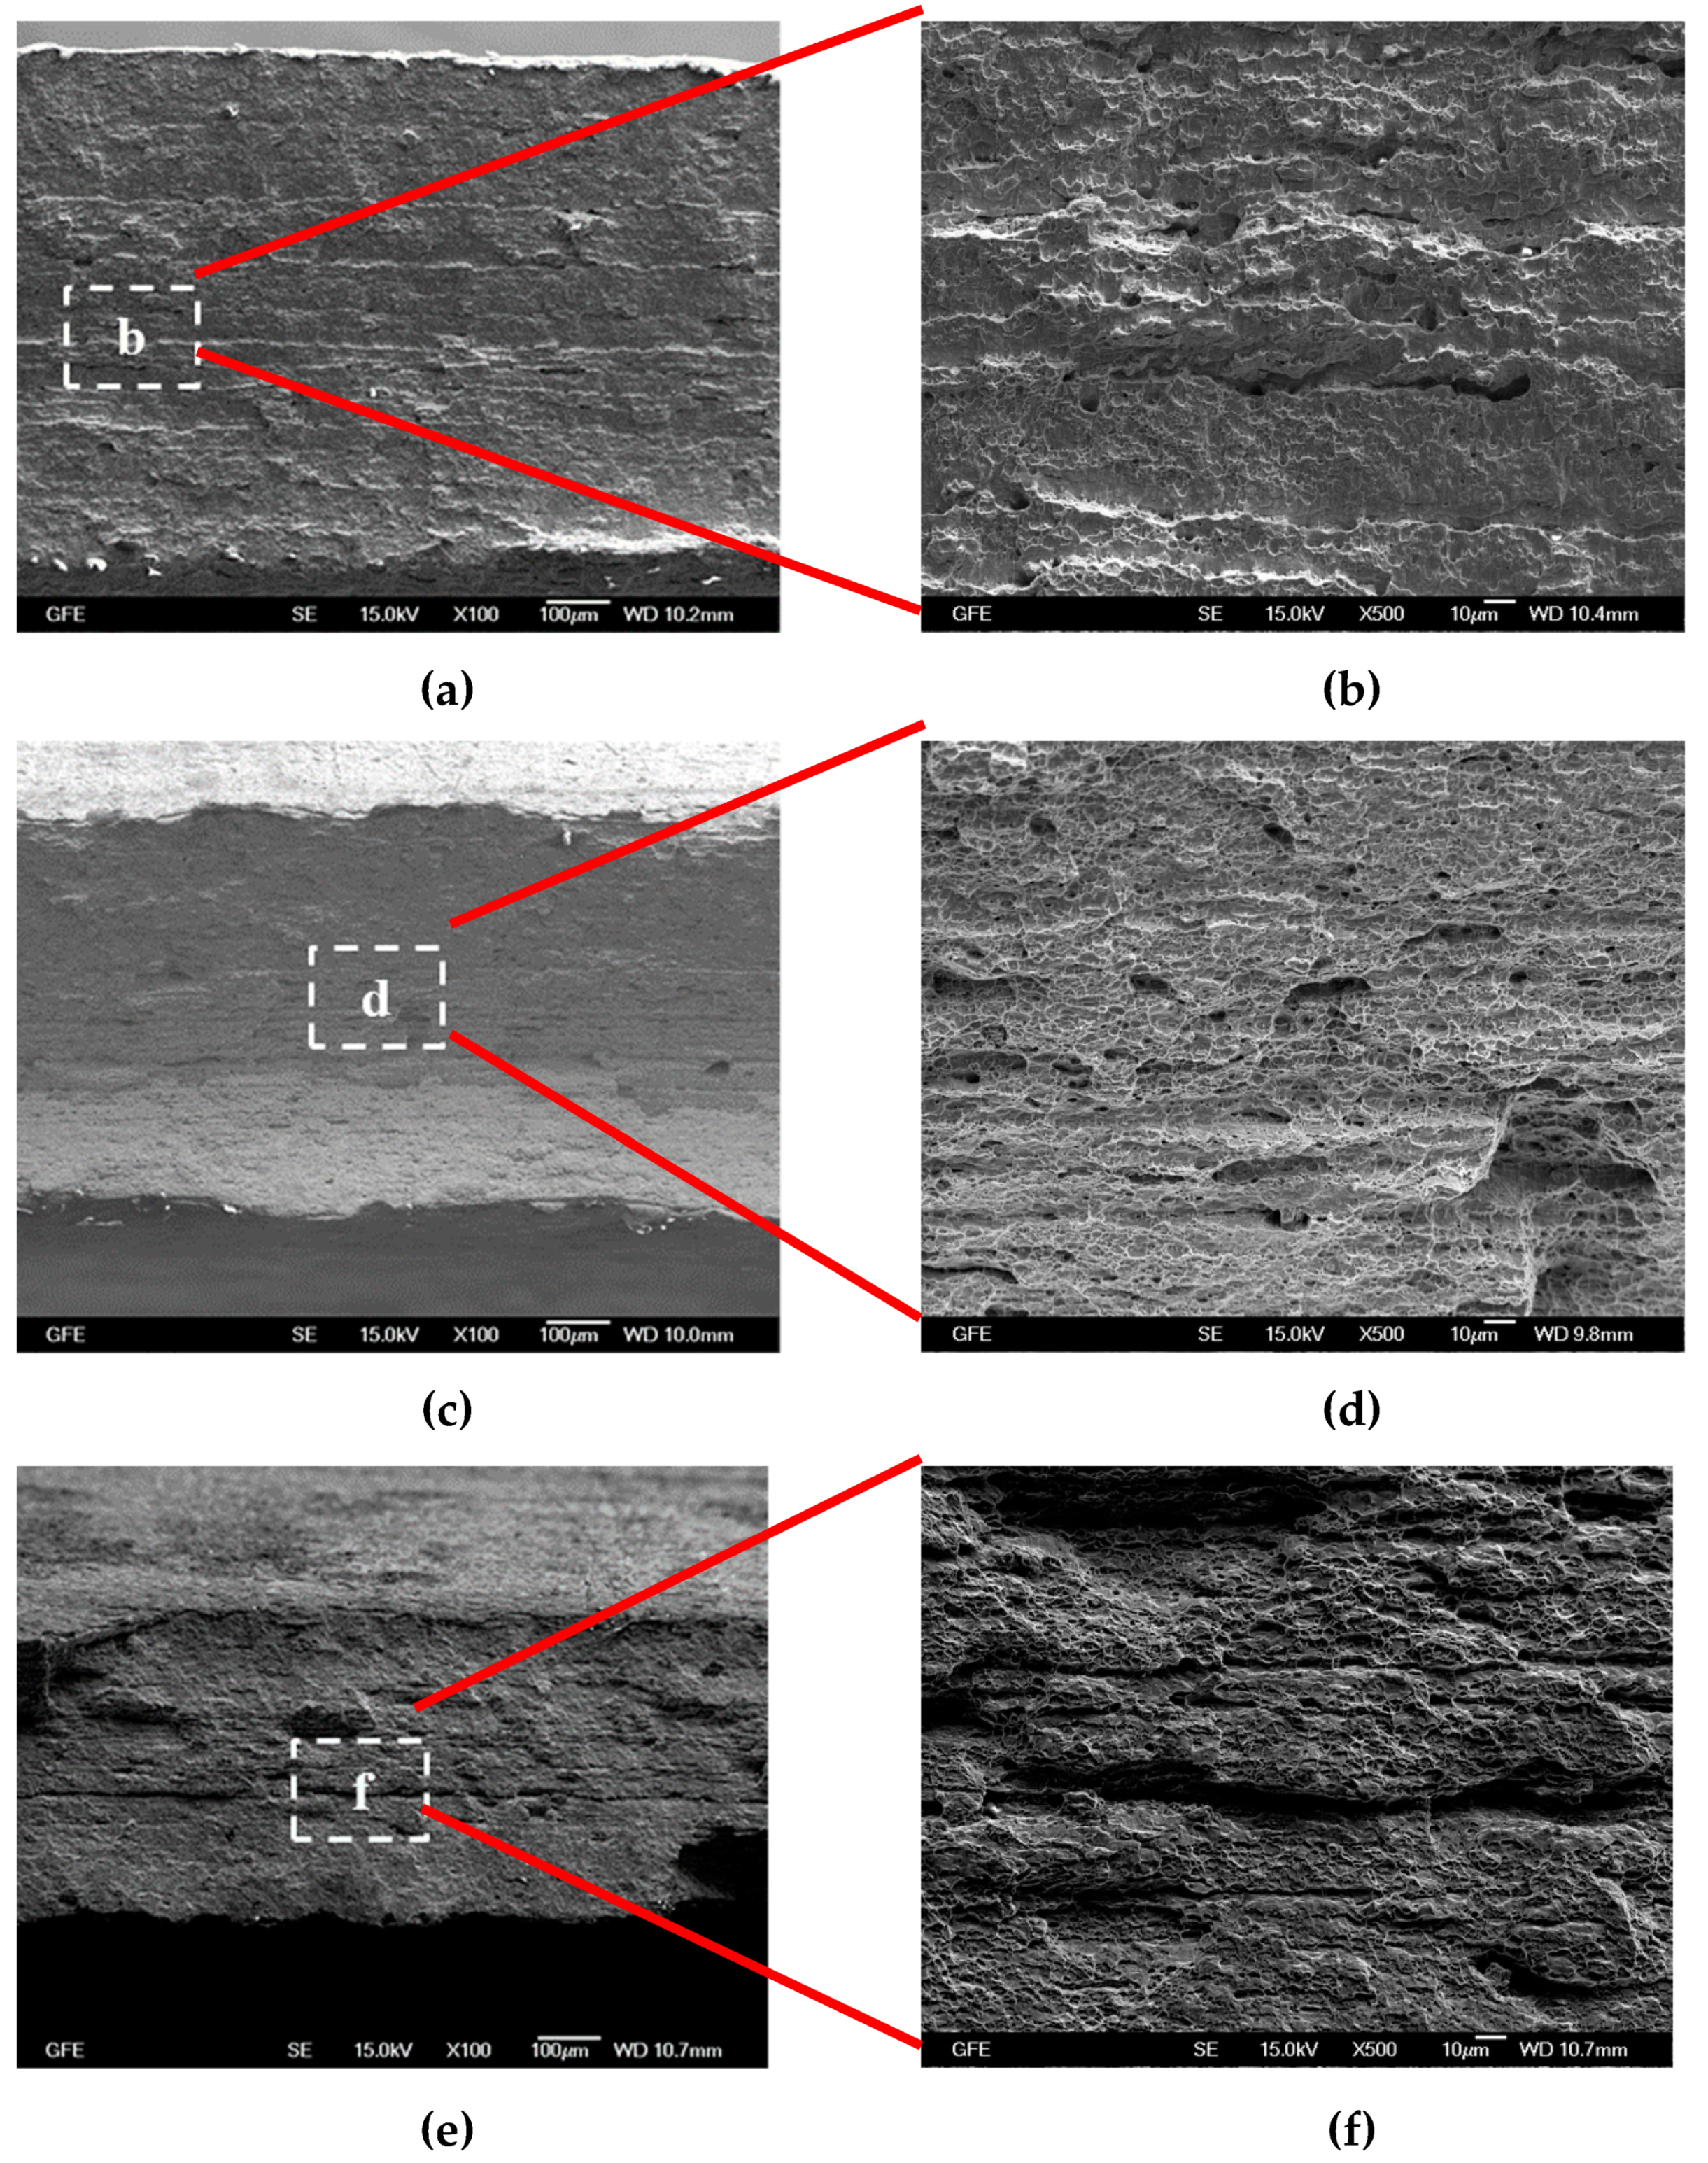
Concerning the fracture surfaces analysis, we refer to literature results from stretched specimens in the different deformation conditions made by Quade [28], as shown in Figure 8. In the low magnifications, the surfaces seem to be smooth as brittle fracture characteristic. However, by increasing the magnification, very fine dimples reveal the ductile dominant feature of fracture for this material, although they are different in number, size, and depth for each strain path. As observed in Figure 8, fracture surface of all specimens show a bimodal distribution of large stringers and fine equi-axed dimples, as reported for other high strength steels [29]. It is worth mentioning the uniaxial tension mode would force the voids to incline towards the loading direction and restrict their growth. It is caused due to the low stress-triaxiality of this mode, which approaches the pure shearing condition [30,31,32]. The increase in stress-triaxiality leads to more void growth and coalescence, which line up more parallel to the loading direction. The existence of fine voids implies the occurrence of shear coalescence, which suppresses large expansion in the voids’ volume [33]. The large stringers of voids indicate the primary voids, which underwent significant growth along the fracture surface.
The forming limits were calculated using the damage models described before. In addition, the capacity of each model in forming limits prediction was assessed (Figure 9b), by statistical analysis of the relative error, calculated by the following equation: Relative error .
The results show that all the models can predict the strain paths near plane strain mode in relatively good agreement to the experiment, i.e., for specimens with 30, 45, and 60 mm width. Nevertheless, the uniaxial tension mode, 15-mm width specimen, was calculated well by Tresca model. It is related to the fact that this condition is near pure shear mode and the effect of shear stress is dominant, as illustrated in Figure 8b. The equi-biaxial condition is better predicted by Situ model than by Tresca. It implies that the material underwent more localized necking in this stress state, as depicted in Figure 6, where the strain path is gradually changing to plane strain mode, and in Figure 8e,f, where more and deeper dimples can be observed throughout the fracture surface, which are characterized by larger size of dimples and elongated dimple colonies, coming from the coalescence of primary dimples and signifying higher plastic deformation. Note that the intensive presence and profuse genesis of dimples indicate the prevalence of localized necking, although it should be noted that the creation of localized necking may not necessarily induce plane strain state immediately. Even after necking, the minor strain keeps varying to some extent as the neck grows [34]. The results of Martínez-Donaire criterion always incline between the other two models, which implies that the model defines damage not based on the effect of shear stress. However, it should always be less than Situ model, since the data were gathered from an adjacent element in the instability region, which seems to be more sensitive to necking. Note that the region of instability, or necking region, included all points that increased monotonically their level of strain until fracture occurred.
4.2. Cross-Die Deep Drawing Tests
Cross-die deep drawing tests were carried out for two different height, 39.5 and 48.6 mm, which resulted in safe and critical products, respectively. The strain distribution measurements for the products were performed with PHASTTM equipment (Figure 10). In both products, the strain distributions are far above the forming limit curve, which was calculated by Nakajima punch-stretching tests (up to 12%). The minor and major strains of the 48.6-mm-height product are illustrated in Figure 11. The strain path analysis of cross-die tests reveals the complex forming process (Figure 11c).
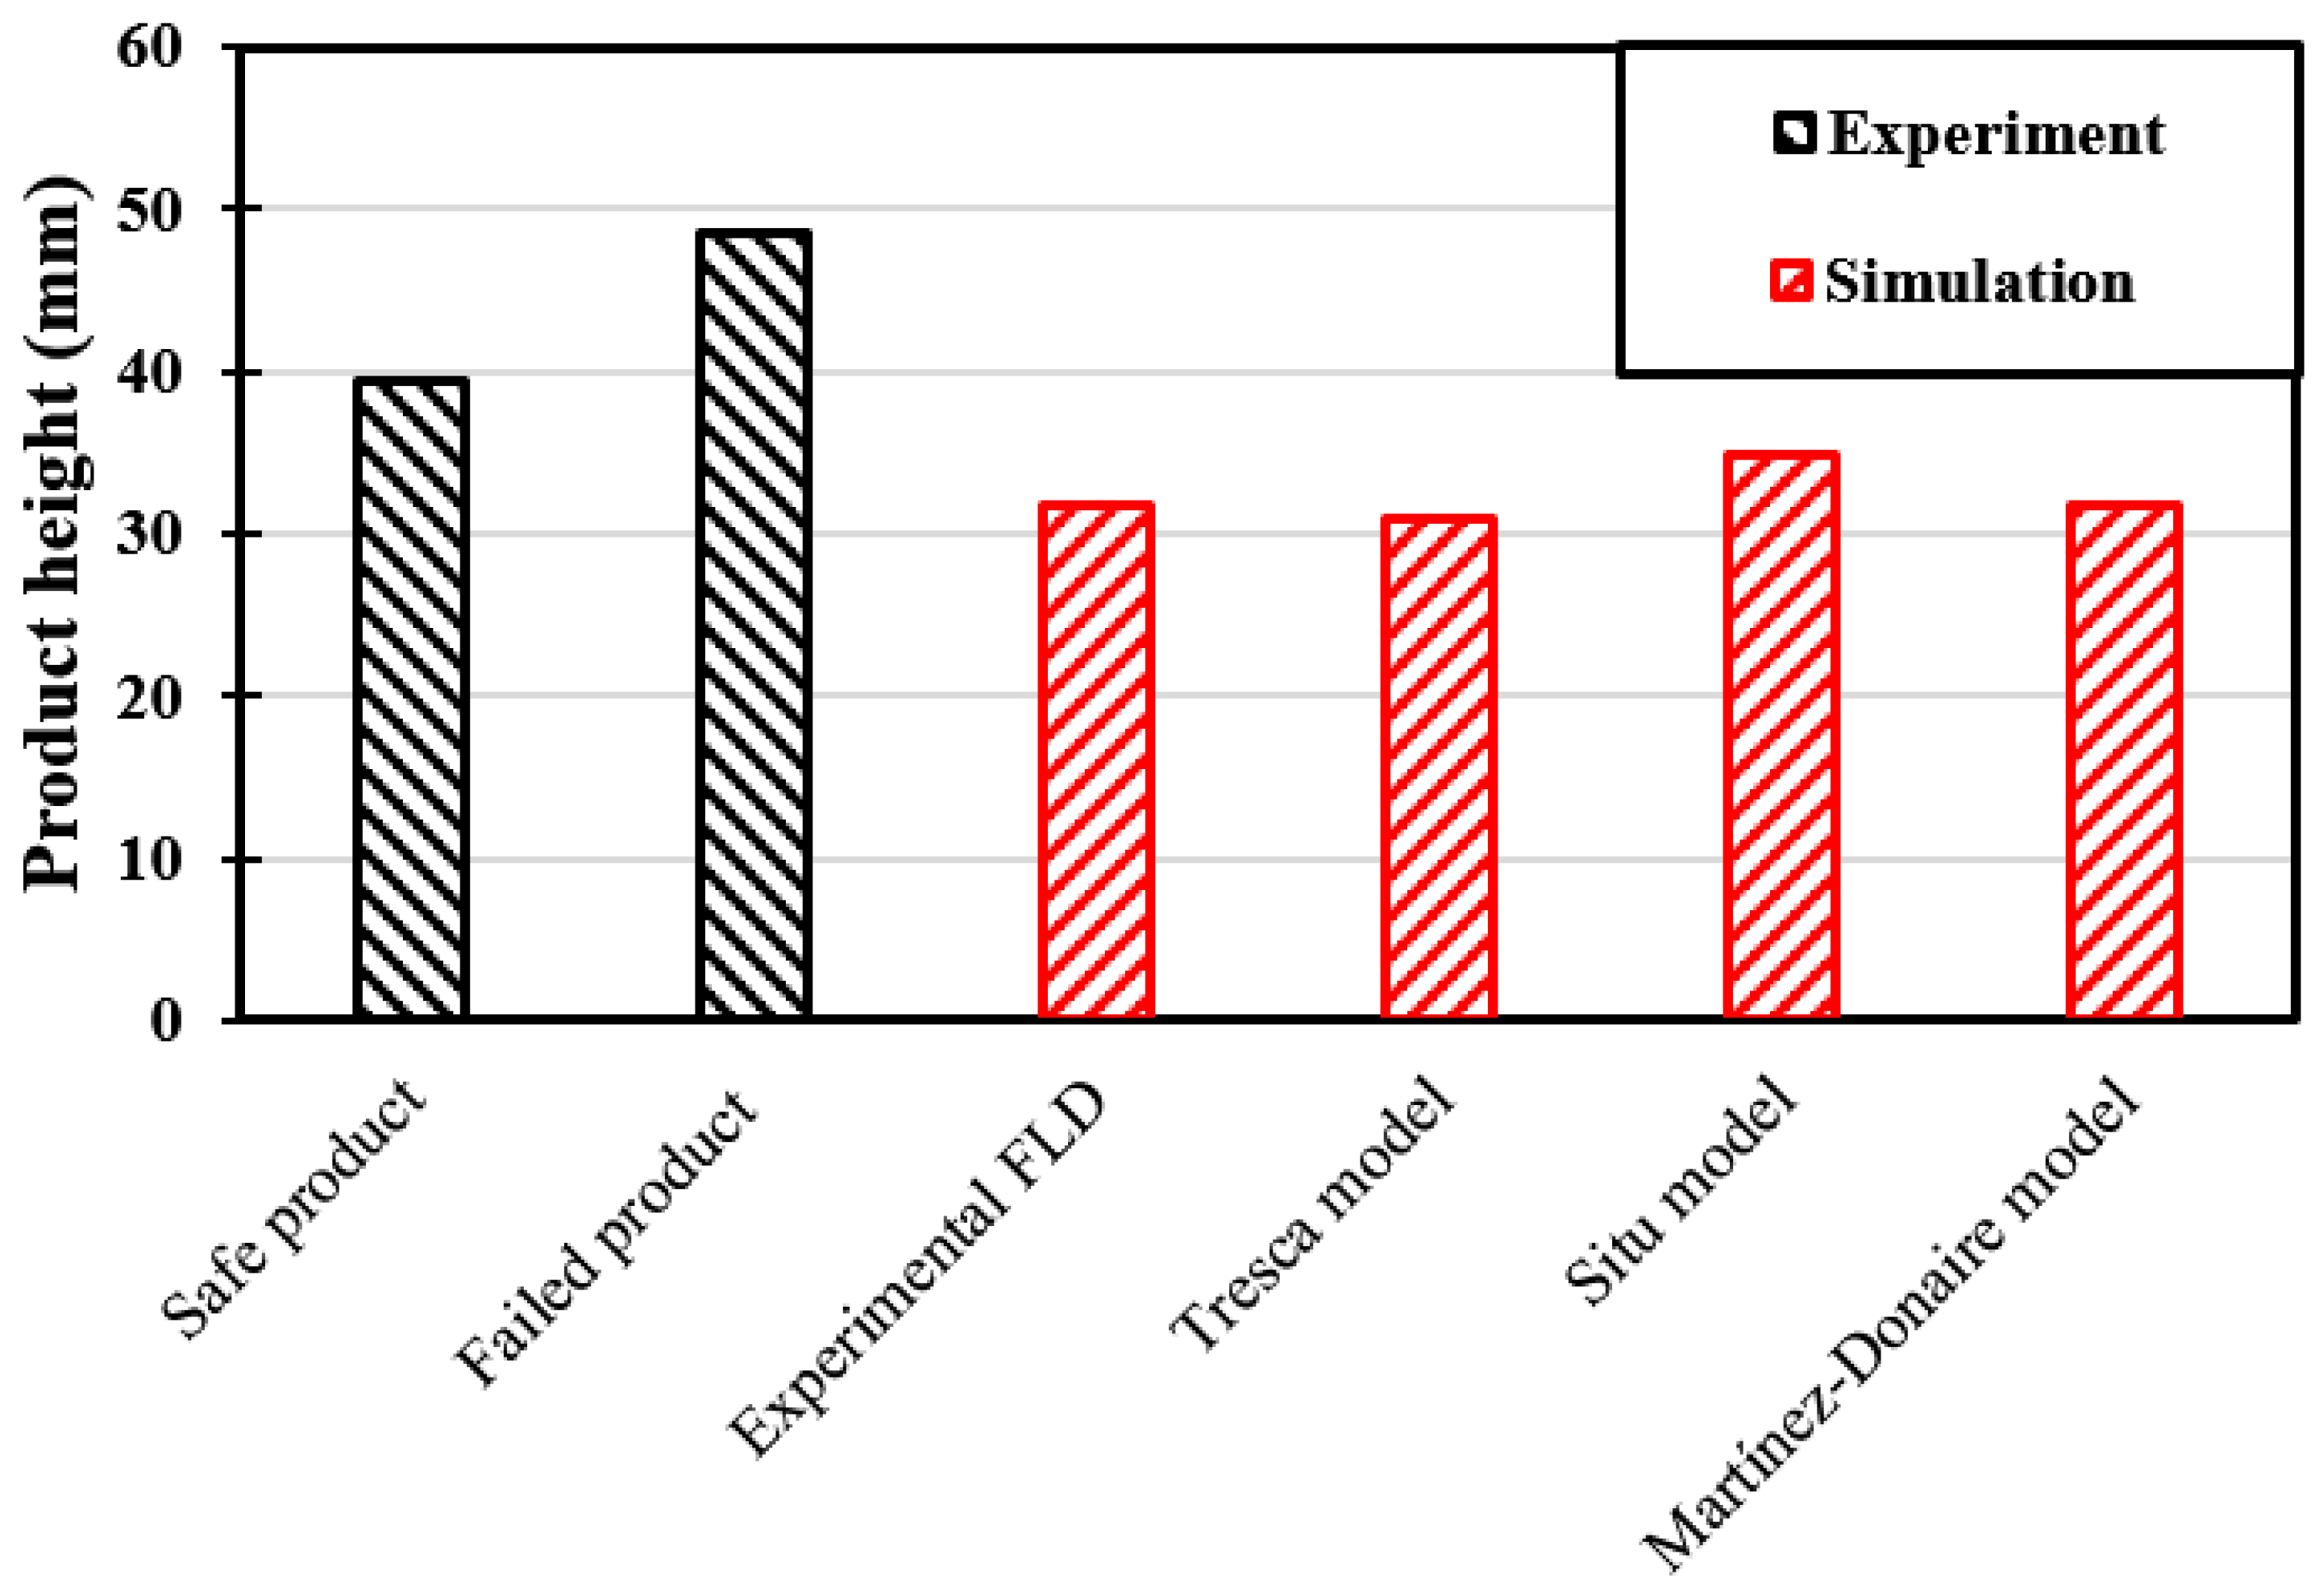
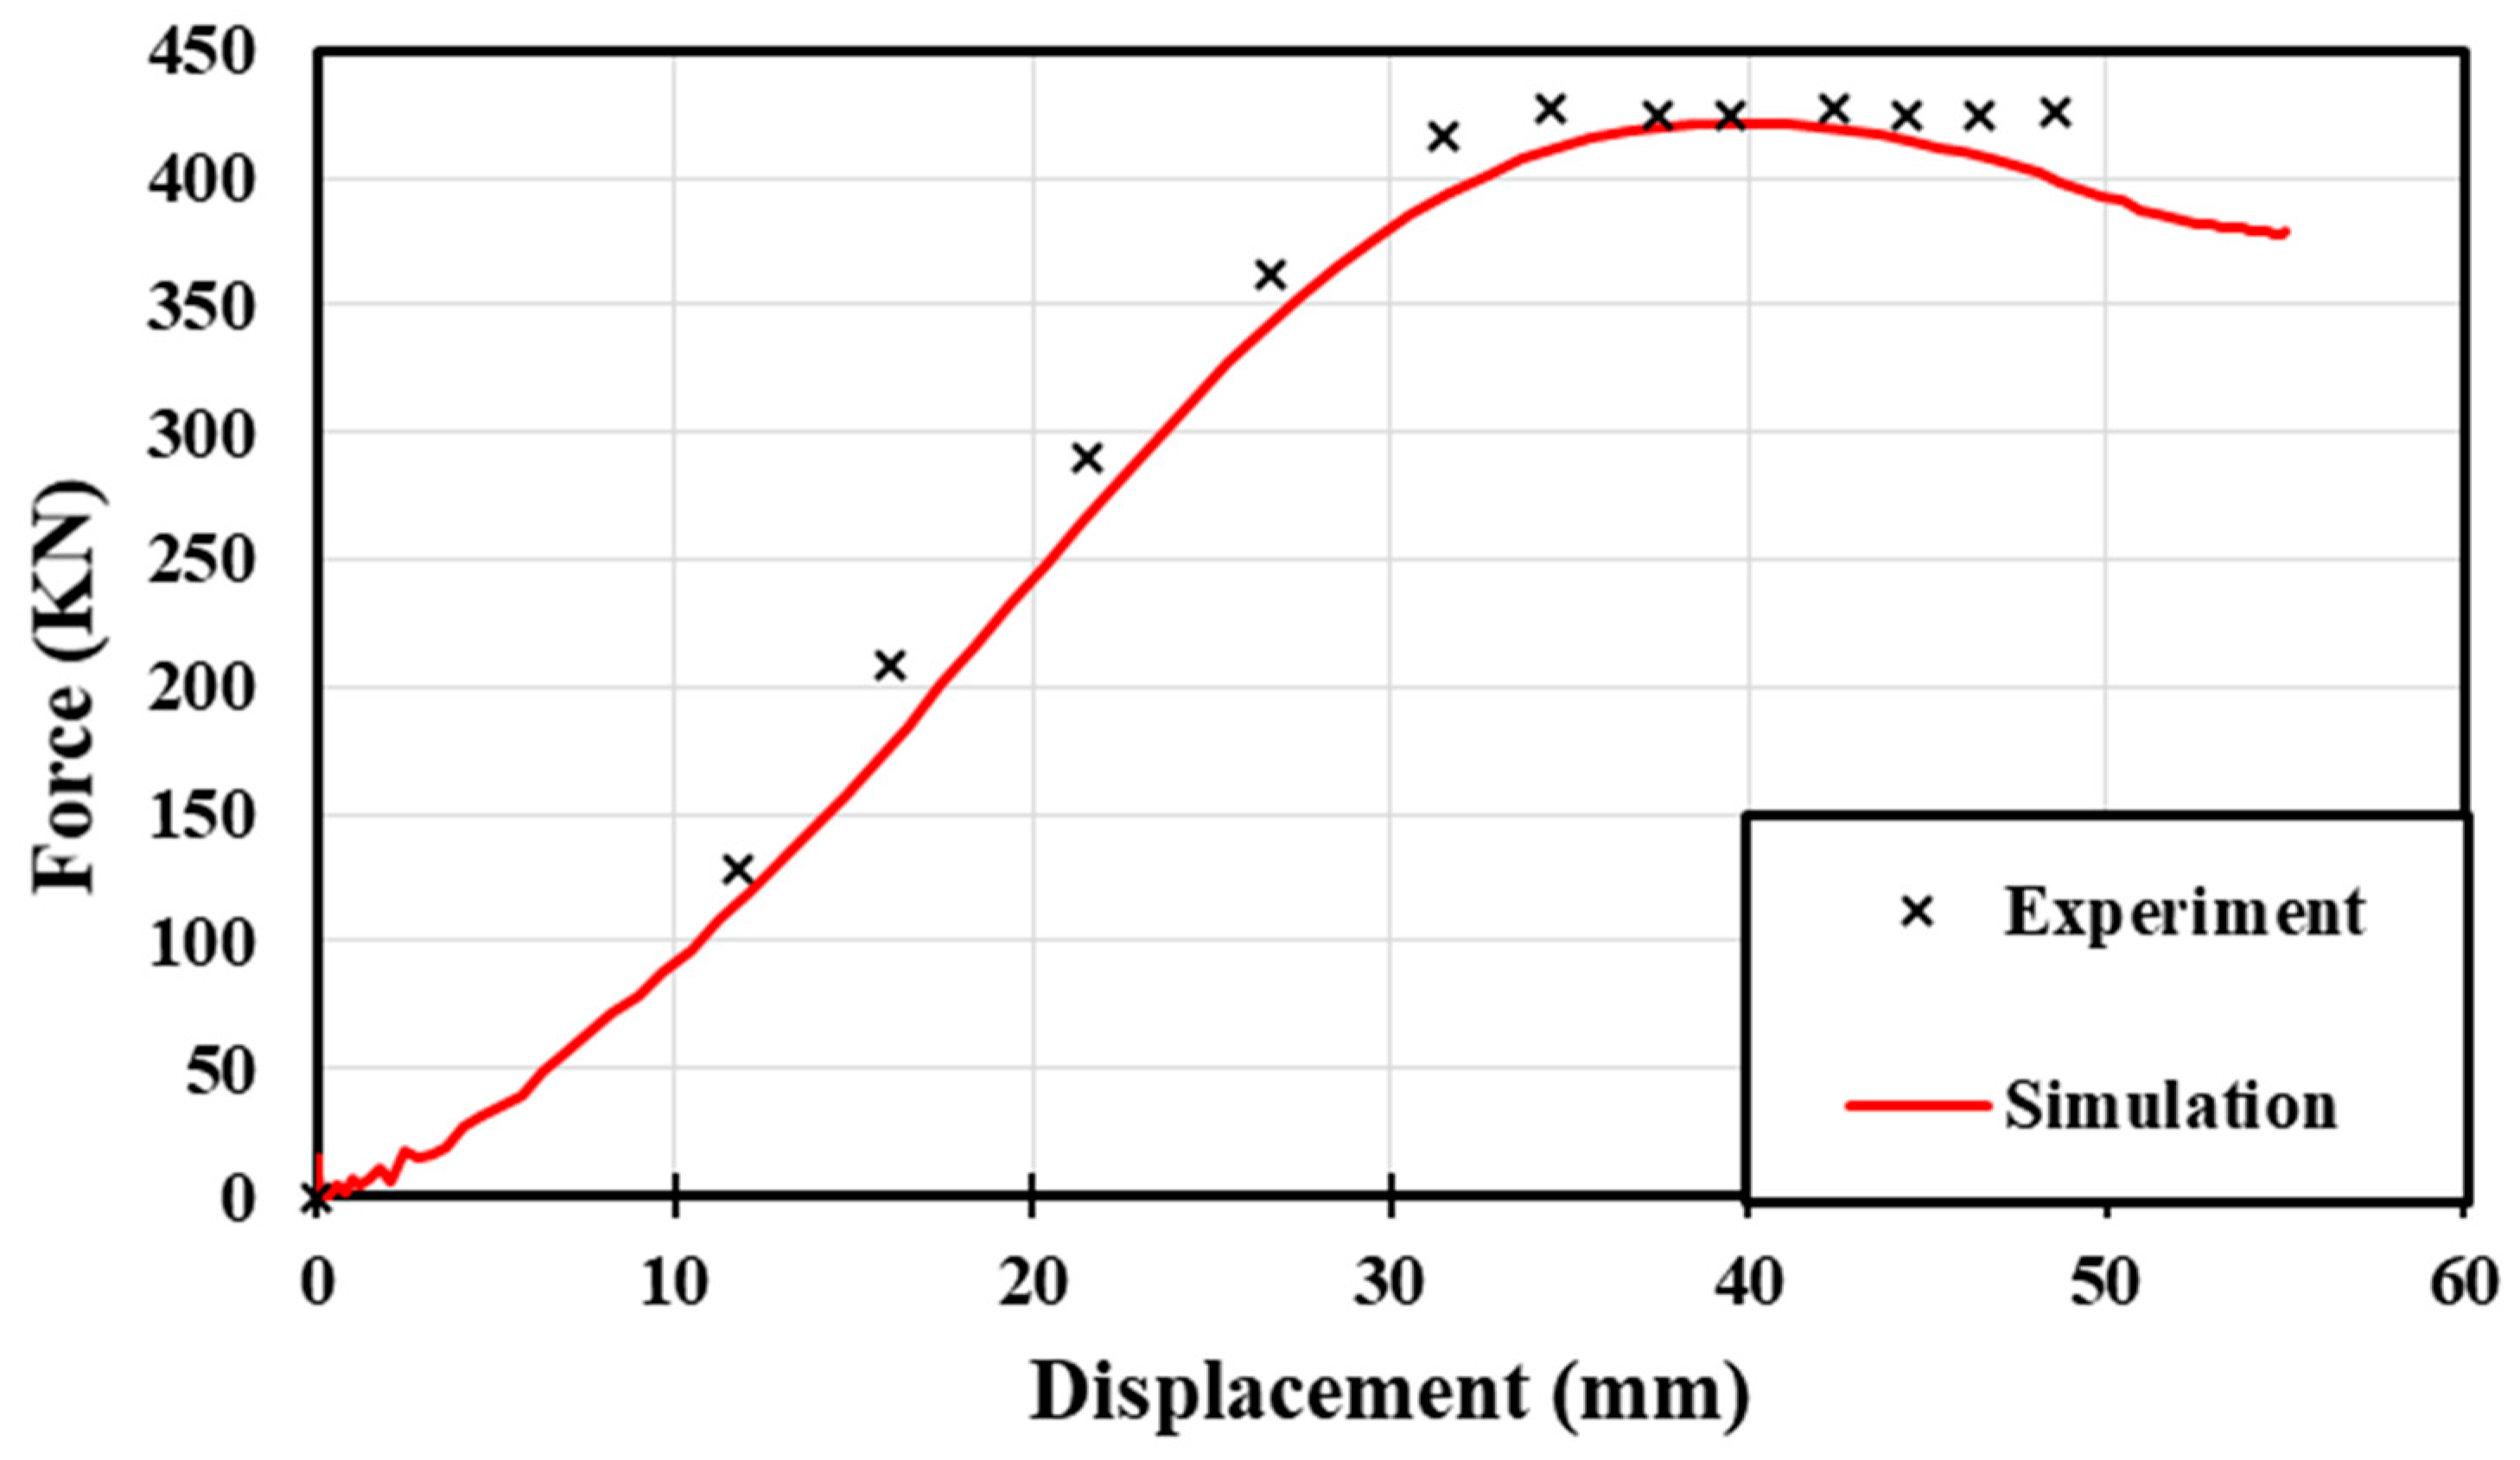
Figure 12, Figure 13 and Figure 14 show the simulation results of the cross-die test. The fracture location and the force–displacement response were predicted precisely. The strain distribution and product height at the onset of damage were obtained through different damage models. In addition, the experimental FLD was considered as one of the damage models. It is worth mentioning that the shape and concavity of the FLD has strong effect on the prediction of damage location. Therefore, these results of cross-die test are different from the ones for DP600 [35]. Figure 15 depicts the calculated height of safe cross-die products by applying different failure models and compares them with experimental data of safe and failed products. In other words, the figure can illustrate the capability of the models in damage prediction of cross-die tests. As the cross-die specimen failed at the plane strain condition and also all the predicted FLDs showed good agreement at this specific strain path, the predicted final heights are in the same range for the failure models and the calculated height by implementing the experimental FLD on the software. It is worth mentioning that some negligible errors might occur in both the experimental and numerical approaches. For instance, in FE simulations, the parameters that are supposed to have minor effects on the final results were eliminated, such as temperature, adiabatic heating, and strain rate. In addition, in the experiment, stopping the process at the exact moment of the fracture onset is very difficult.
However, the location of failure for experiments and simulations are in good agreement. Note that the bending effects result in some differences between integration points on the top or bottom surfaces. The strain states of the integration points on the inside (−) and outside (+) surfaces at the fracture moment are plotted in Figure 12a,b, respectively. These point out that the failure triggered outside of the cross-die product, based on experimental FLD.
Among the studied criteria, Situ and Martínez-Donaire models detected the instant situation of the elements and could consider the nonlinear strain paths. However, Tresca model was dependent on the strain path that was used for the material constant’s calibration. In addition, it neglected the deformation history of the elements. However, good agreement between the predicted results for Tresca model and the experimental data was attributable to the Tresca model being calibrated using the Nakajima specimen with plane-strain path and the failure happening in the near plane-strain condition in the critical elements. It is worth mentioning that the deformation history for different elements in the cross-die test revealed that the different elements mostly experienced a relatively linear strain path up to fracture [35]. Therefore, the nonlinear strain path did not significantly occur in the critical elements through cross-die deep drawing process.
5. Conclusions
The formability of sheet metals is mostly limited by the occurrence of localized necking, i.e., non-uniform strains within a small region in the plane of the sheet. Therefore, estimation of materials’ formability plays a principal role in the design of sheet forming processes. In this regard, applying simple and accurate models is highly beneficial. In this study, three simple damage models were employed on the data of Nakajima punch stretching and cross-die deep drawing tests. The results show that the material failed in different modes for different strain paths. When the shear failure was dominant, e.g., uniaxial tension, the Tresca model could calculate the damage initiation, whereas, for conditions in which the localized necking caused damage initiation, e.g., equi-biaxial tension, the Situ model predicted precisely.
Author Contributions
Investigation, N.H., V.S., U.P. and A.R.; Writing—original draft, N.H.; Writing—review & editing, V.S., U.P. and A.R.
Funding
This research was funded by the Materials innovation institute under the grant number of MC2.07293.
Acknowledgements
This research was carried out under Project Number MC2.07293 in the framework of the Research Program of the Materials innovation institute M2i (www.m2i.nl).
Conflicts of Interest
The authors declare no conflict of interest.
Nomenclature
| A, B, C | strain hardening parameters, various dimensions |
| E | experimental results, in this study the results of equivalent strains |
| F, G, H | parameters of Hill 1948 criterion |
| anisotropic coefficients at from the rolling direction, dimensionless | |
| anisotropic yield stress ratio, dimensionless, | |
| P | predicted results, in this study the results of equivalent strains |
| effective or equivalent plastic strain, dimensionless | |
| logarithmic strain components, dimensionless | |
| strain path, dimensionless, | |
| effective or equivalent stress, MPa | |
| cauchy stress components, MPa | |
| yield stress, MPa | |
| maximum shear stress, MPa |
References
- Tamura, I. Deformation-induced martensitic transformation and transformation-induced plasticity in steels. Met. Sci. 1982, 16, 245–253. [Google Scholar] [CrossRef]
- Fischer, F.-D.; Reisner, G.; Werner, E.; Tanaka, K.; Cailletaud, G.; Antretter, T. A new view on transformation induced plasticity (TRIP). Int. J. Plast. 2000, 16, 723–748. [Google Scholar] [CrossRef]
- Ramazani, A.; Bruehl, S.; Gerber, T.; Bleck, W.; Prahl, U. Quantification of bake hardening effect in DP600 and TRIP700 steels. Mater. Des. 2014, 57, 479–486. [Google Scholar] [CrossRef]
- Luo, H.; Dong, H. New ultrahigh-strength Mn-alloyed TRIP steels with improved formability manufactured by intercritical annealing. Mater. Sci. Eng. A 2015, 626, 207–212. [Google Scholar] [CrossRef]
- Ramazani, A.; Quade, H.; Abbasi, M.; Prahl, U. The effect of martensite banding on the mechanical properties and formability of TRIP steels. Mater. Sci. Eng. A 2016, 651, 160–164. [Google Scholar] [CrossRef]
- Goodwin, G.M. Application of strain analysis to sheet metal forming problems in the press shop. SAE Trans. 1968, 77, 380–387. [Google Scholar]
- Keeler, S.P. Circular grid system—A valuable aid for evaluating sheet metal formability. SAE Trans. 1968, 77, 371–379. [Google Scholar]
- Marciniak, Z.; Kuczyński, K.; Pokora, T. Influence of the plastic properties of a material on the forming limit diagram for sheet metal in tension. Int. J. Mech. Sci. 1973, 15, 789–800. [Google Scholar] [CrossRef]
- Tvergaard, V.; Needleman, A. Analysis of the cup-cone fracture in a round tensile bar. Acta Metall. 1984, 32, 157–169. [Google Scholar] [CrossRef]
- Choi, K.S.; Liu, W.N.; Sun, X.; Khaleel, M.A. Microstructure-based constitutive modeling of TRIP steel: Prediction of ductility and failure modes under different loading conditions. Acta Mater. 2009, 57, 2592–2604. [Google Scholar] [CrossRef]
- Uthaisangsuk, V.; Prahl, U.; Bleck, W. Modelling of damage and failure in multiphase high strength DP and TRIP steels. Eng. Fract. Mech. 2011, 78, 469–486. [Google Scholar] [CrossRef]
- Panich, S.; Barlat, F.; Uthaisangsuk, V.; Suranuntchai, S.; Jirathearanat, S. Experimental and theoretical formability analysis using strain and stress based forming limit diagram for advanced high strength steels. Mater. Des. 2013, 51, 756–766. [Google Scholar] [CrossRef]
- Ramazani, A.; Abbasi, M.; Prahl, U.; Bleck, W. Failure analysis of DP600 steel during the cross-die test. Comput. Mater. Sci. 2012, 64, 101–105. [Google Scholar] [CrossRef]
- Bhargava, M.; Tewari, A.; Mishra, S.K. Forming limit diagram of Advanced High Strength Steels (AHSS) based on strain-path diagram. Mater. Des. 2015, 85, 149–155. [Google Scholar] [CrossRef]
- Paul, S.K. Prediction of complete forming limit diagram from tensile properties of various steel sheets by a nonlinear regression based approach. J. Manuf. Process. 2016, 23, 192–200. [Google Scholar] [CrossRef]
- Lingbeek, R.; Meinders, T.; Rietman, A. Tool and blank interaction in the cross-die forming process. Int. J. Mater. Form. 2008, 1, 161–164. [Google Scholar] [CrossRef]
- Niazi, M.S.; Wisselink, H.; Meinders, T.; Huétink, J. Failure predictions for DP steel cross-die test using anisotropic damage. Int. J. Damage Mech. 2012, 21, 713–754. [Google Scholar] [CrossRef]
- Bleck, W.; Blumbach, M. Laser-Aided Flow Curve Determination in Hydraulic Bulging. Steel Res. Int. 2005, 76, 125–130. [Google Scholar] [CrossRef]
- Bressan, J.; Williams, J. The use of a shear instability criterion to predict local necking in sheet metal deformation. Int. J. Mech. Sci. 1983, 25, 155–168. [Google Scholar] [CrossRef]
- Tresca, H. Mémoire sur l’écoulement des corps solides soumis à de fortes pressions. Comptes Rendus Hébdom. Acad. Sci. Paris 1864, 59, 754–758. [Google Scholar]
- Situ, Q.; Jain, M.; Metzger, D. Determination of forming limit diagrams of sheet materials with a hybrid experimental–numerical approach. Int. J. Mech. Sci. 2011, 53, 707–719. [Google Scholar] [CrossRef]
- Situ, Q.; Jain, M.K.; Bruhis, M. A suitable criterion for precise determination of incipient necking in sheet materials. Proc. Mater. Sci. Forum 2006, 519, 111–116. [Google Scholar] [CrossRef]
- Martínez-Donaire, A.; García-Lomas, F.; Vallellano, C. New approaches to detect the onset of localised necking in sheets under through-thickness strain gradients. Mater. Des. 2014, 57, 135–145. [Google Scholar] [CrossRef]
- Hill, R. A theory of the yielding and plastic flow of anisotropic metals. Proc. R. Soc. Lond. A Math. Phys. Eng. Sci. 1948, 193, 281–297. [Google Scholar] [CrossRef]
- Ghosh, A.K. A method for determining the coefficient of friction in punch stretching of sheet metals. Int. J. Mech. Sci. 1977, 19, 457–470. [Google Scholar] [CrossRef]
- Bleck, W.; Deng, Z.; Papamantellos, K.; Gusek, C.O. A comparative study of the forming-limit diagram models for sheet steels. J. Mater. Process. Technol. 1998, 83, 223–230. [Google Scholar] [CrossRef]
- Anderson, D. Application and Repairability of Advanced High-Strength Steels; American Iron and Steel Institute: Charlotte, NC, USA, 2008. [Google Scholar]
- Quade, H. Mechanical Properties, Damage Behaviour and Retained Austenite Stability in Low-Alloyed Trip Steels—Experimental & Numerical Analyses (Berichte aus dem Institut fur Eisenhuttenkunde); Shaker Verlag GmbH: Herzogenrath, Germany, 2014; pp. 114–116. [Google Scholar]
- Savic, V.; Hector, L., Jr.; Fekete, J. Digital image correlation study of plastic deformation and fracture in fully martensitic steels. Exp. Mech. 2010, 50, 99–110. [Google Scholar] [CrossRef]
- Kang, J.; Wilkinson, D.S.; Bruhis, M.; Jain, M.; Wu, P.D.; Embury, J.D.; Mishra, R.K.; Sachdev, A.K. Shear localization and damage in AA5754 aluminum alloy sheets. J. Mater. Eng. Perform. 2008, 17, 395–401. [Google Scholar] [CrossRef]
- Habibi, N.; Zarei-Hanzaki, A.; Abedi, H.-R. An investigation into the fracture mechanisms of twinning-induced-plasticity steel sheets under various strain paths. J. Mater. Process. Technol. 2015, 224, 102–116. [Google Scholar] [CrossRef]
- Situ, Q.; Jain, M.K.; Bruhis, M. Further experimental verification of a proposed localized necking criterion. AIP Conf. Proc. 2007, 908, 907–912. [Google Scholar]
- Teirlinck, D.; Zok, F.; Embury, J.; Ashby, M. Fracture mechanism maps in stress space. Acta Metall. 1988, 36, 1213–1228. [Google Scholar] [CrossRef]
- Situ, Q.; Bruhis, M.; Jain, M. Obtaining Formability Characteristics of Automotive Materials Using On-line Strain Imaging System. AIP Conf. Proc. 2005, 778, 131–135. [Google Scholar]
- Habibi, N.; Ramazani, A.; Sundararaghavan, V.; Prahl, U. Failure predictions of DP600 steel sheets using various uncoupled fracture criteria. Eng. Fract. Mech. 2018, 190, 367–381. [Google Scholar] [CrossRef]
Figure 1.
(a) As-received microstructure; and (b) fracture surface of the studied TRIP700 steel.

Figure 2.
The flow curve of TRIP700 steel: (a) through uniaxial tension tests at different directions from the rolling direction; and (b) through bulge test with fitted strain hardening curve.
Figure 2.
The flow curve of TRIP700 steel: (a) through uniaxial tension tests at different directions from the rolling direction; and (b) through bulge test with fitted strain hardening curve.
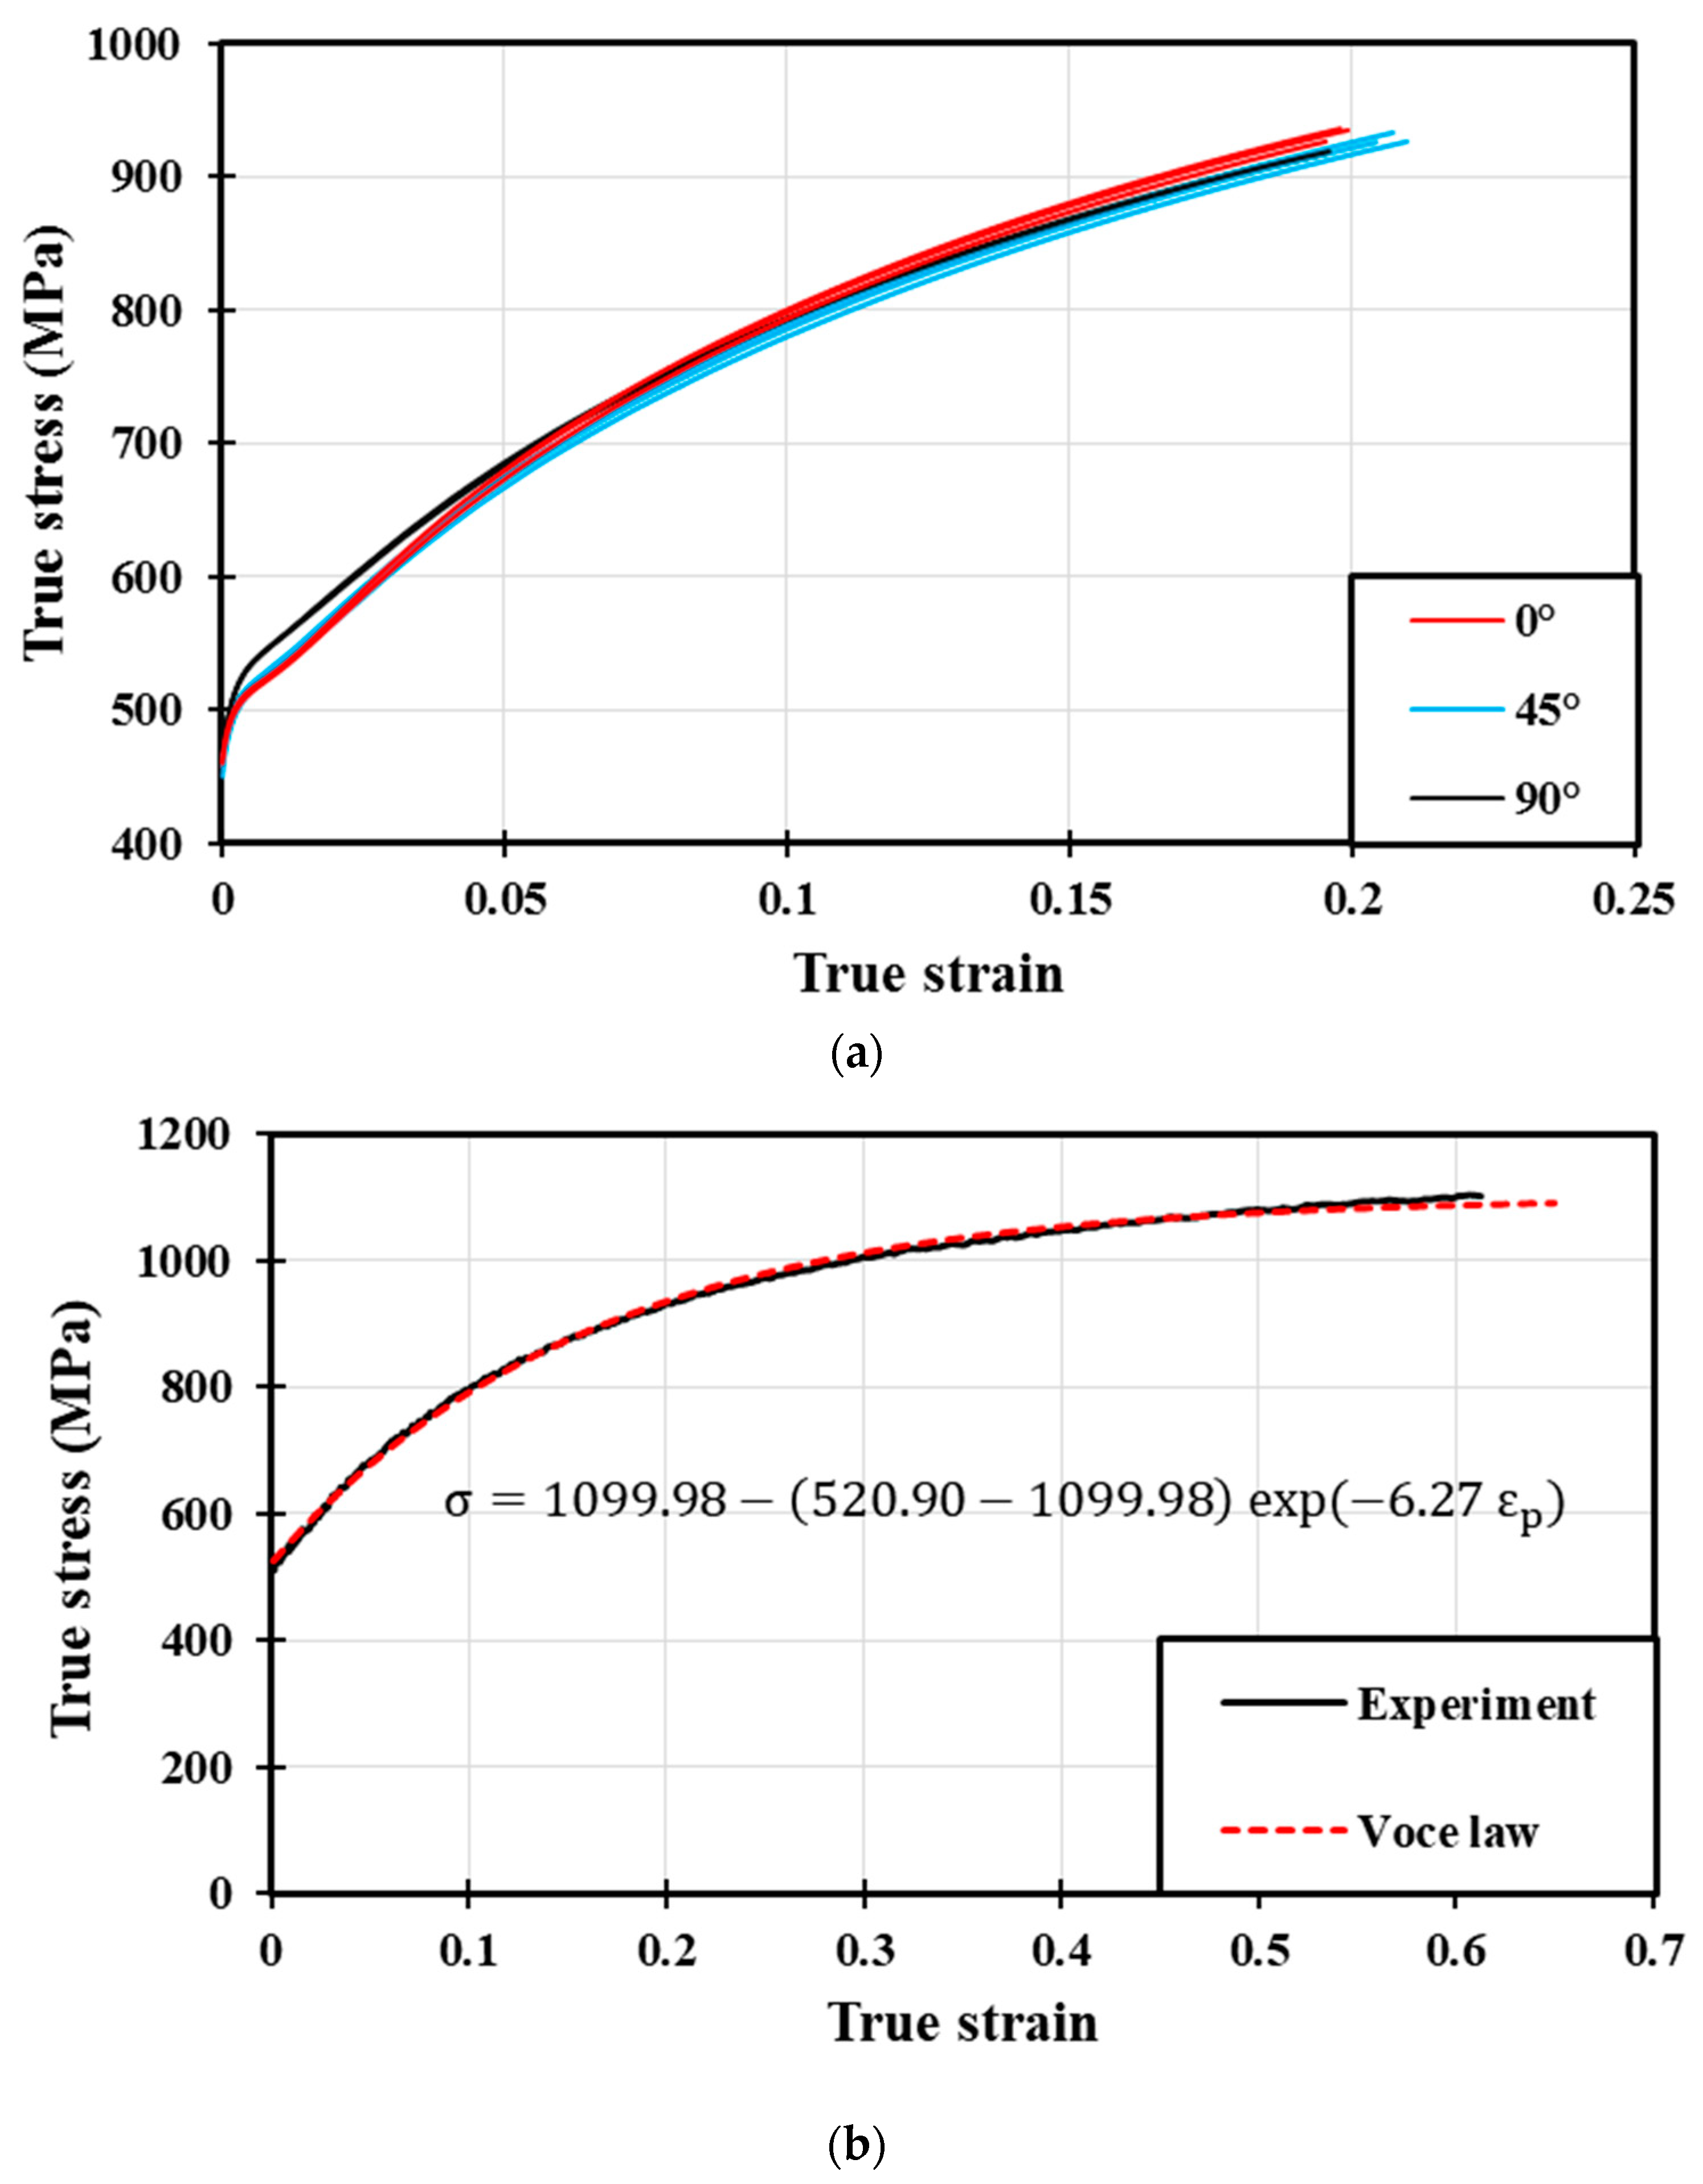
Figure 3.
Nakajima stretch-forming test: (a) geometries of the specimens (all dimensions in mm); and (b) the test set-up.
Figure 3.
Nakajima stretch-forming test: (a) geometries of the specimens (all dimensions in mm); and (b) the test set-up.
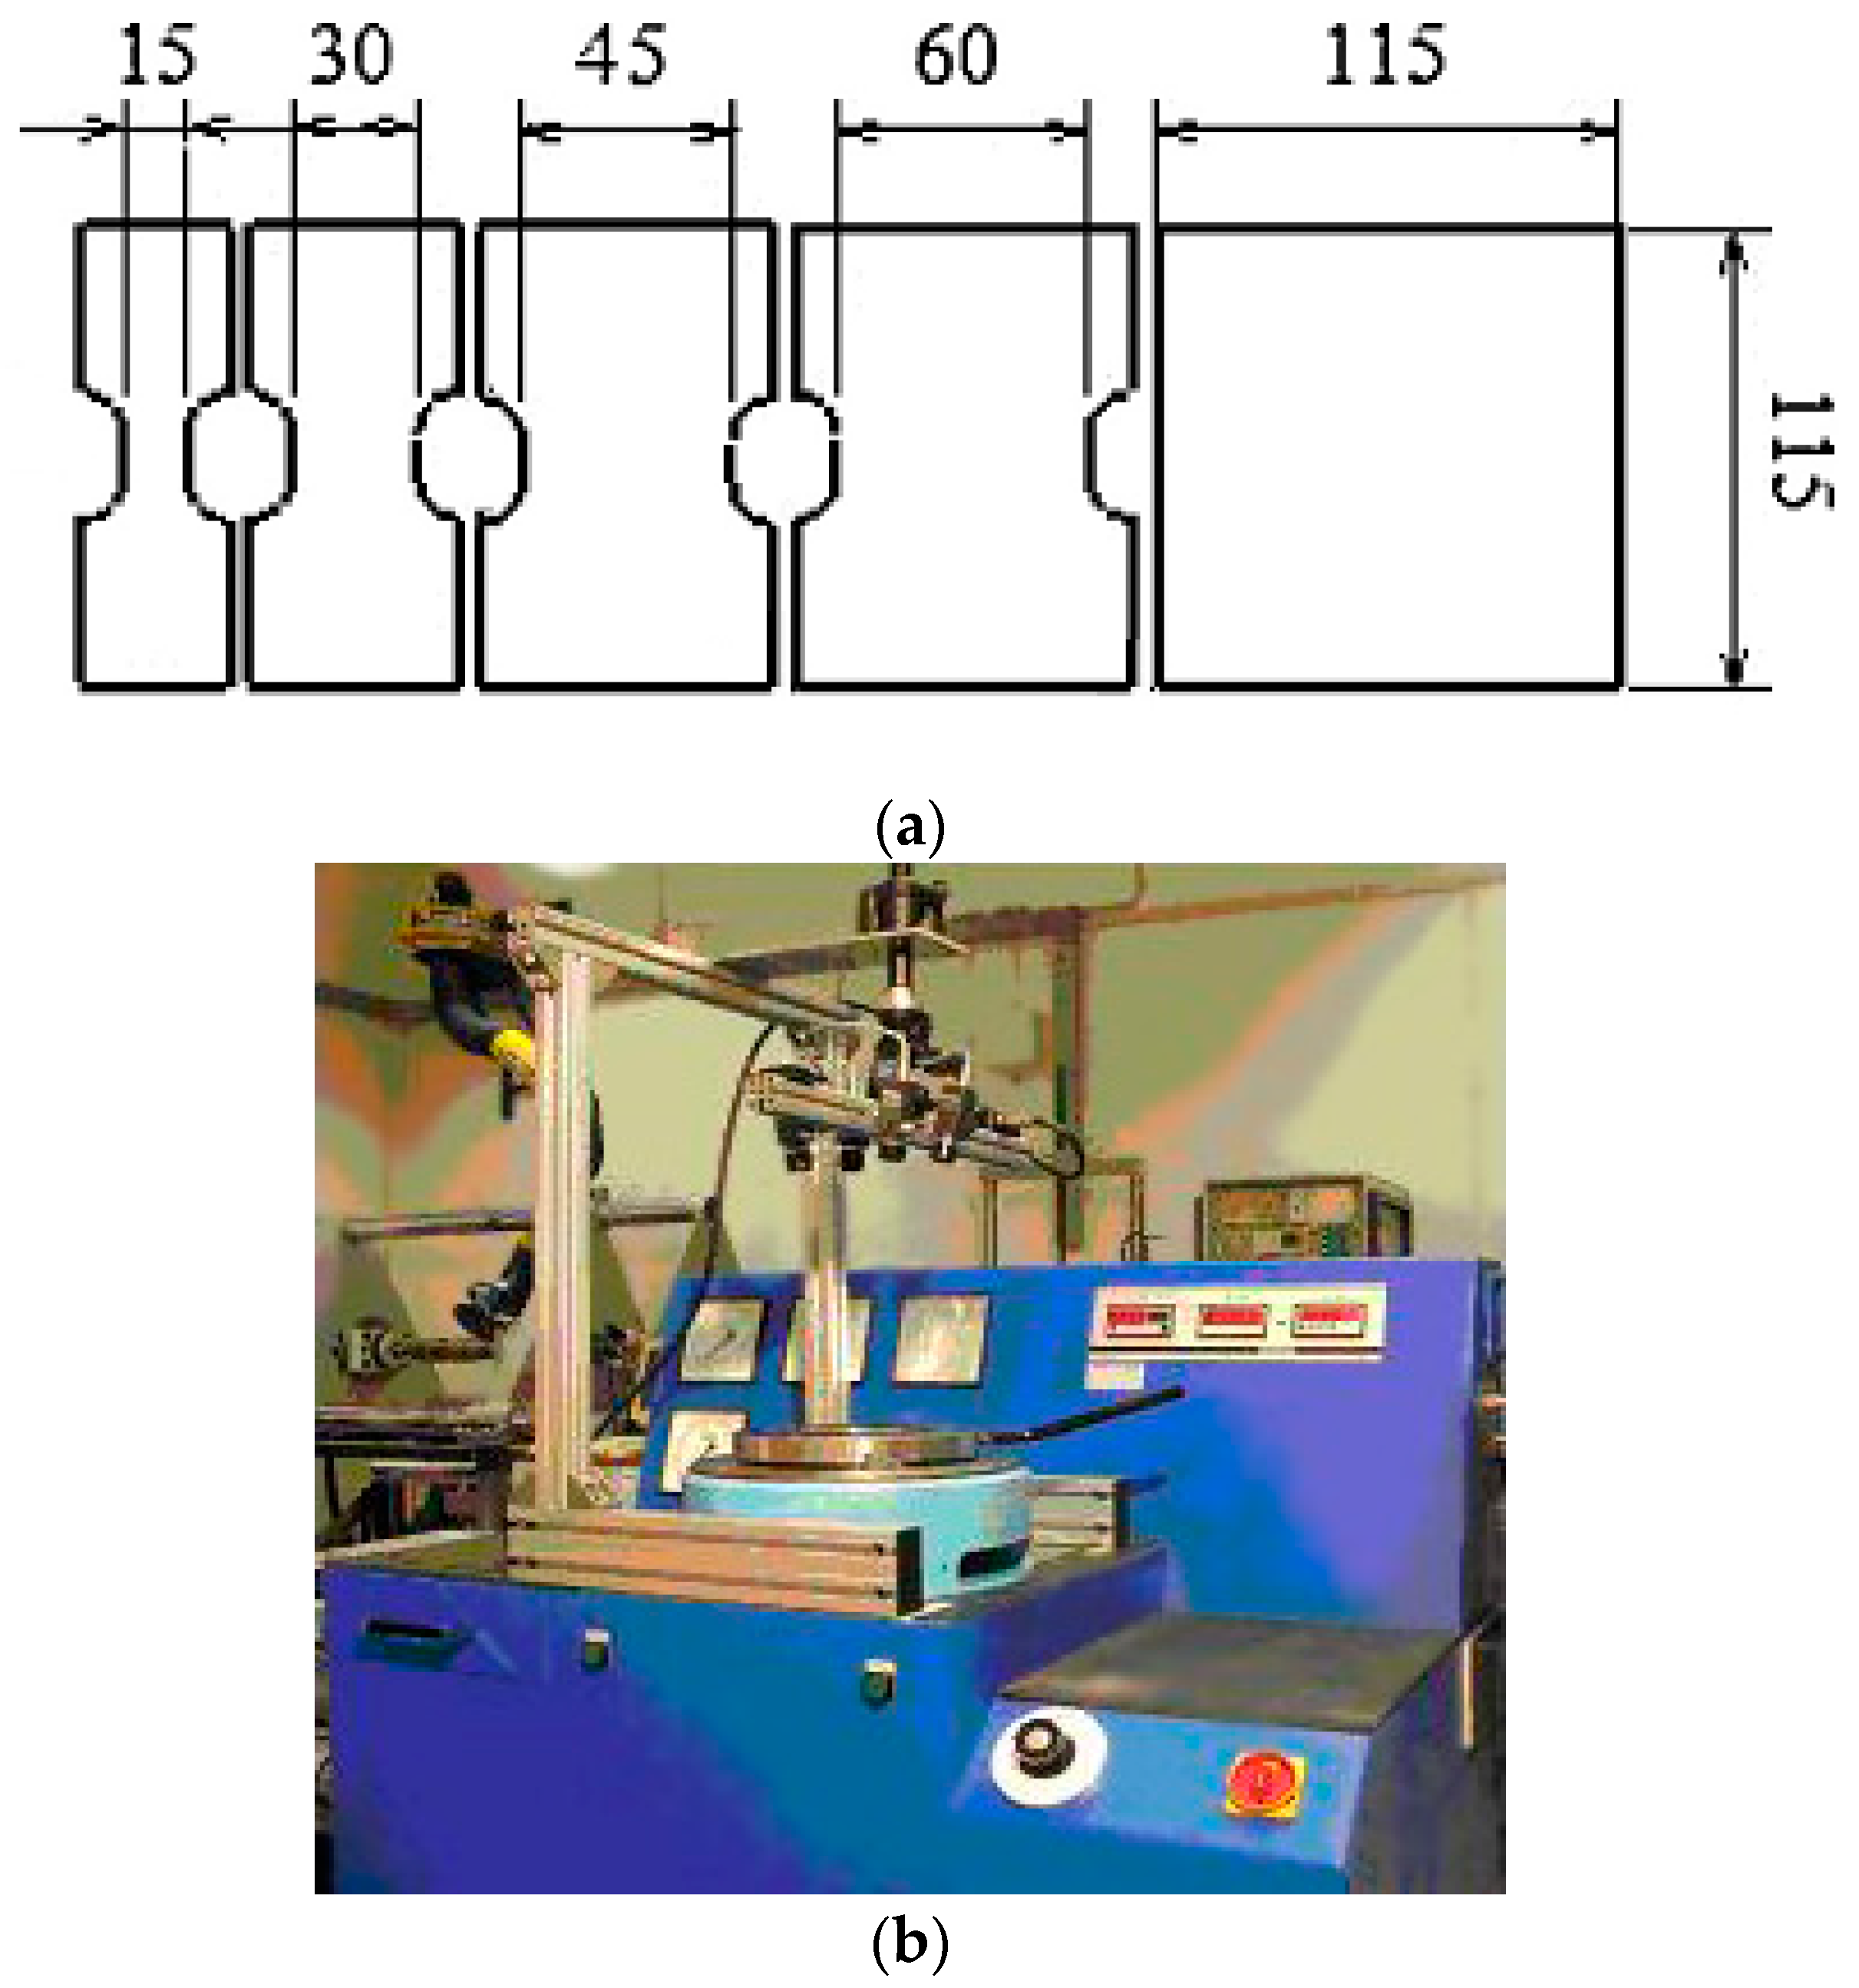
Figure 4.
Cross-die test: (a) the set-up; and (b) the final production.

Figure 5.
Illustration of the investigated point in each failure criterion; (a) Tresca, (b) Q. Situ et al. and (c) A.J. Martínez-Donaire et al.
Figure 5.
Illustration of the investigated point in each failure criterion; (a) Tresca, (b) Q. Situ et al. and (c) A.J. Martínez-Donaire et al.
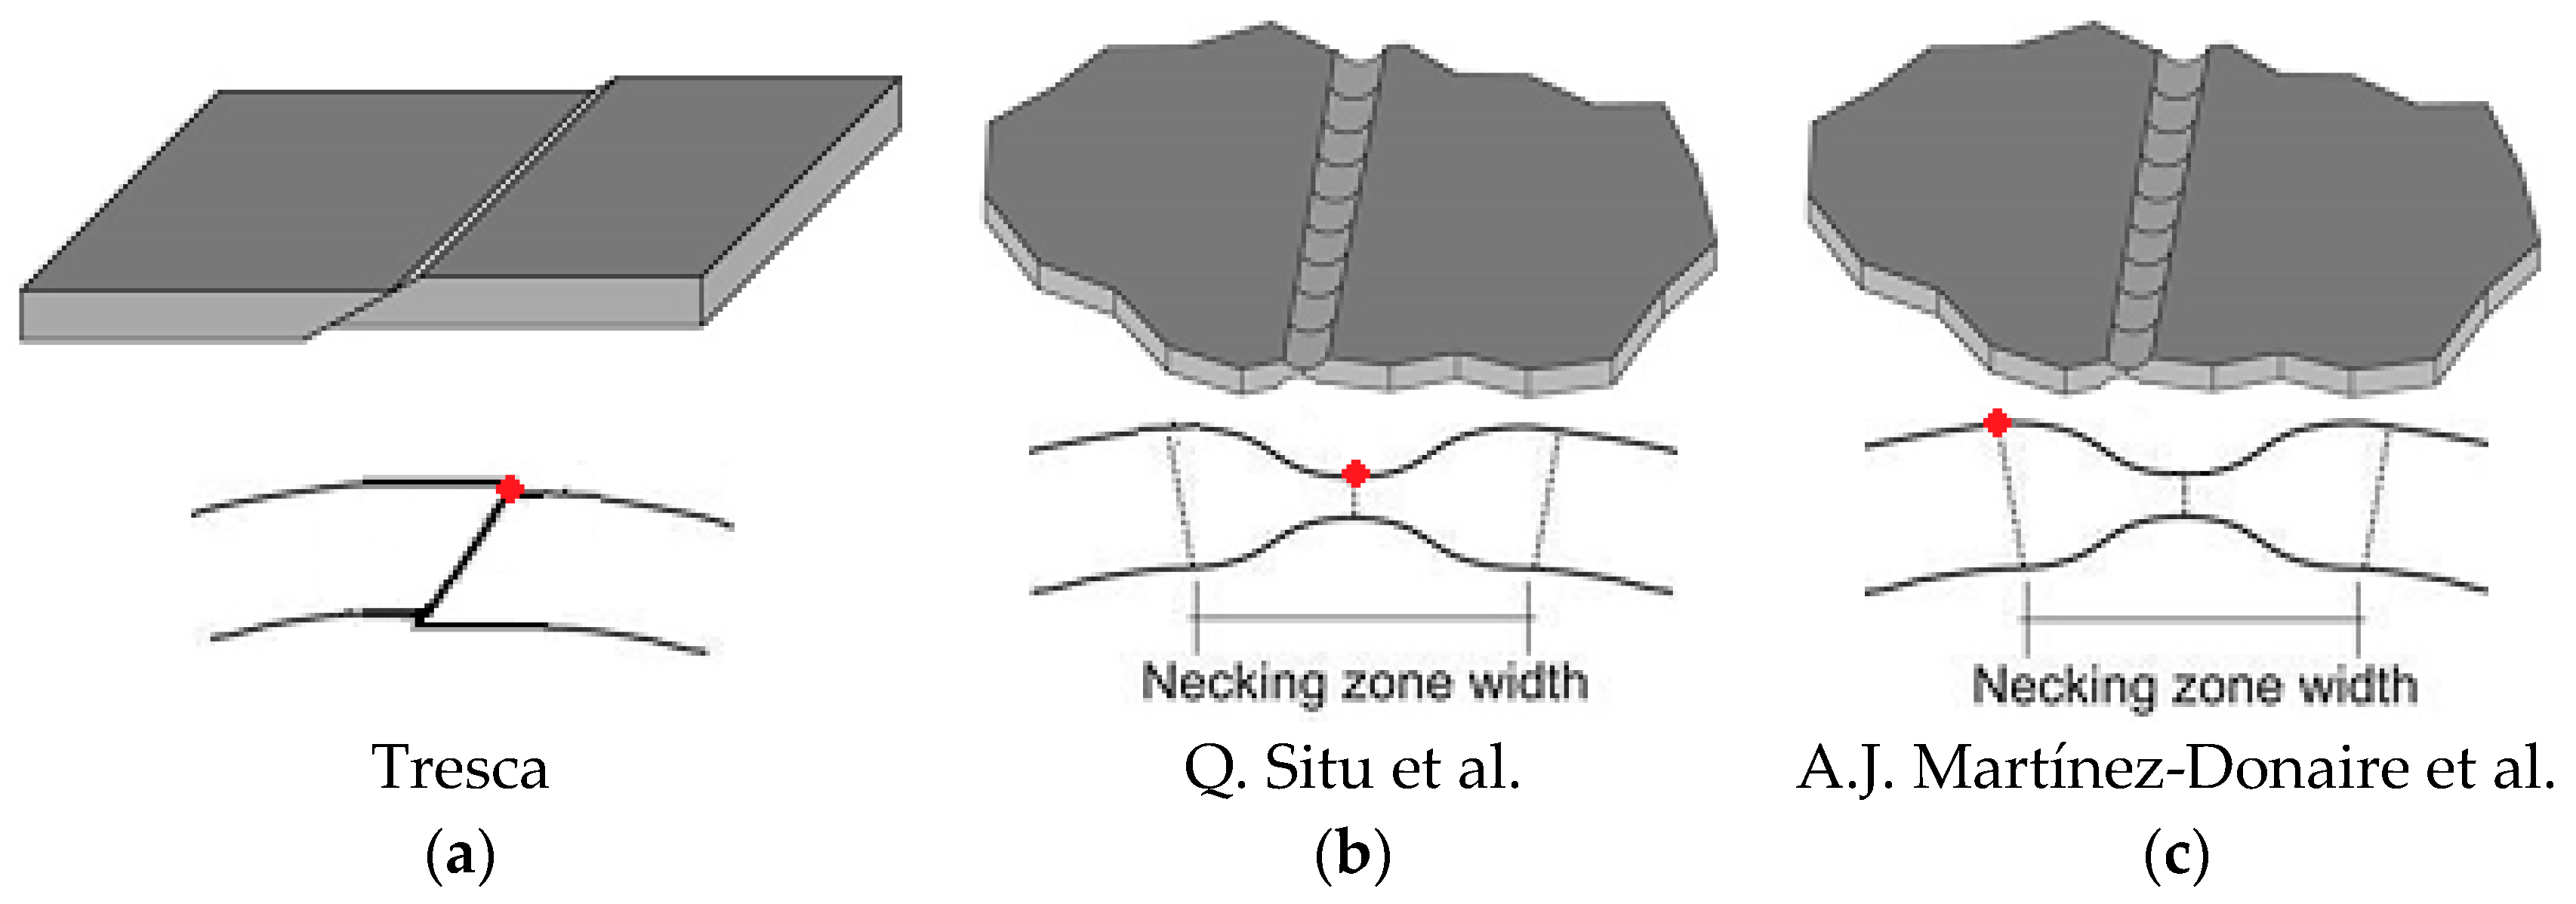
Figure 6.
The calculated strain path of each specimen through Nakajima punch stretching test and the experimental FLD.
Figure 6.
The calculated strain path of each specimen through Nakajima punch stretching test and the experimental FLD.
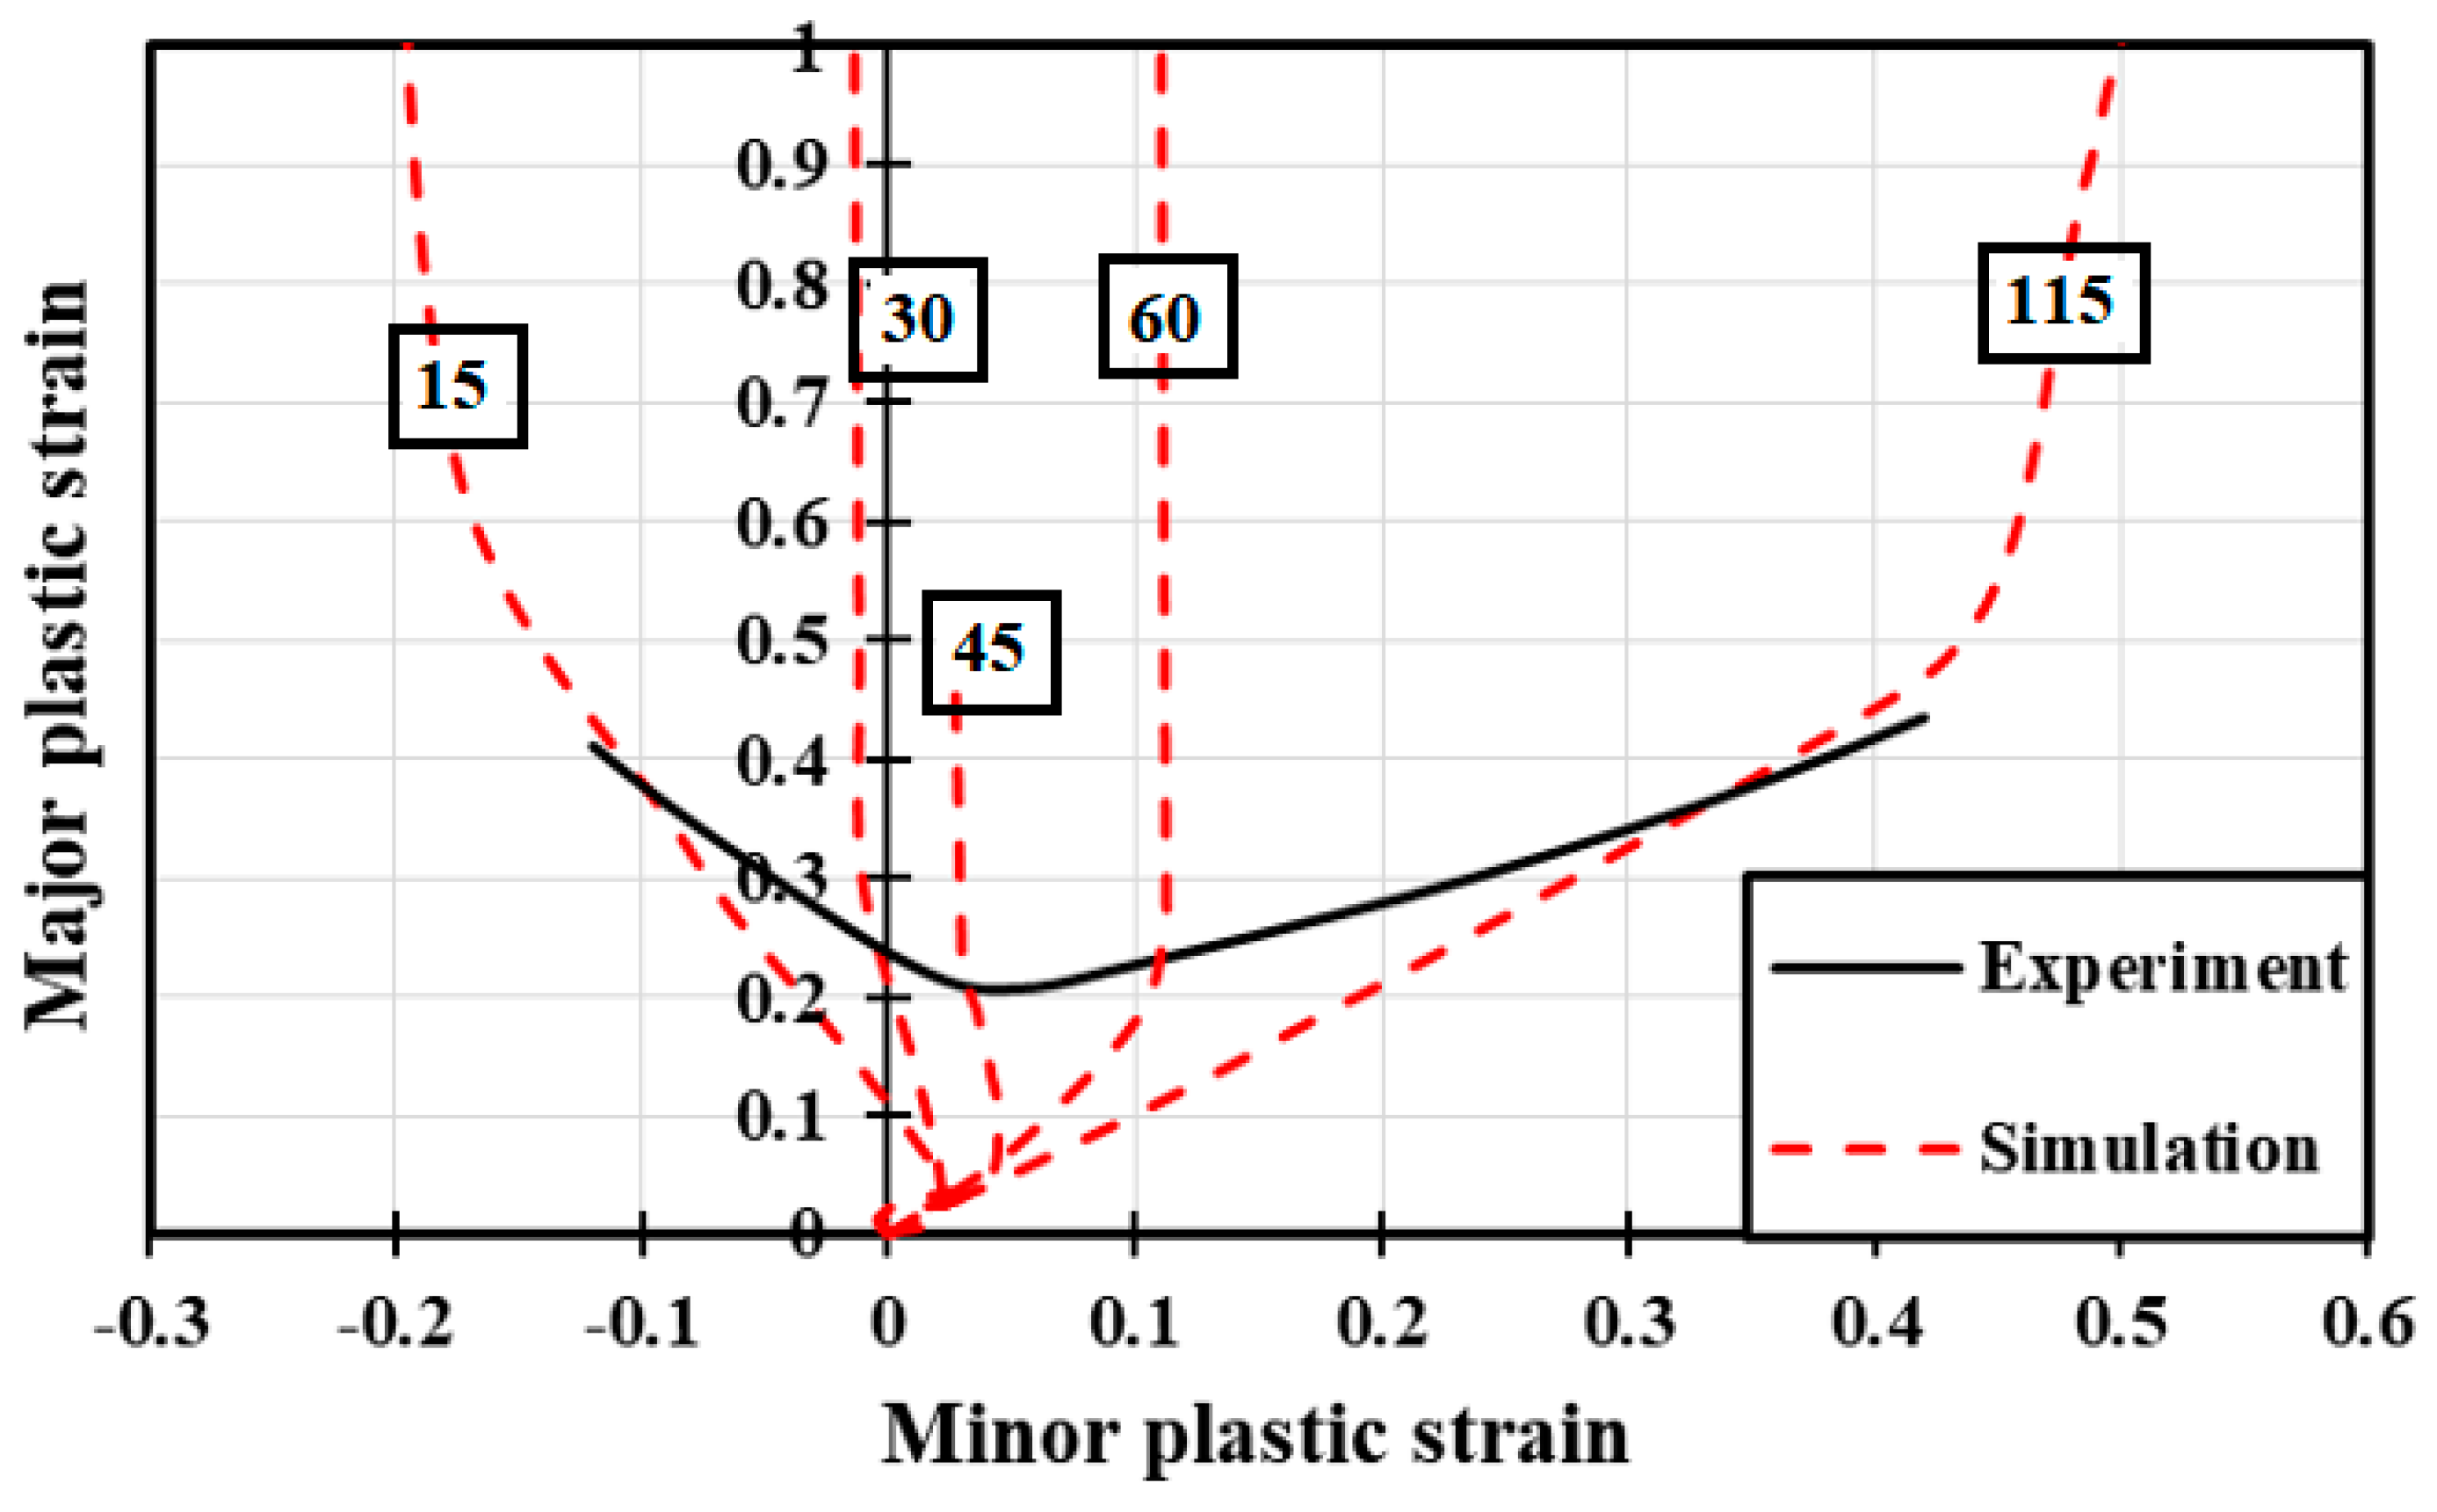
Figure 7.
The comparison of equivalent plastic strain distribution and fracture location for specimens with: (a) 15 mm width; (b) 45 mm width; and (c) 115 mm width.
Figure 7.
The comparison of equivalent plastic strain distribution and fracture location for specimens with: (a) 15 mm width; (b) 45 mm width; and (c) 115 mm width.

Figure 8.
The fracture surfaces of Nakajima test specimens with: (a,b) 15 mm width; (c,d) 45 mm width; and (e,f) 115 mm width. This figure was adopted from Ref. [28].
Figure 8.
The fracture surfaces of Nakajima test specimens with: (a,b) 15 mm width; (c,d) 45 mm width; and (e,f) 115 mm width. This figure was adopted from Ref. [28].

Figure 9.
The comparison between simulations and experiments of Nakajima tests: (a) the predicted FLDs; (b) the experimental equivalent plastic strain; and (c) the relative errors of equivalent plastic strain for each specimen geometry and model.
Figure 9.
The comparison between simulations and experiments of Nakajima tests: (a) the predicted FLDs; (b) the experimental equivalent plastic strain; and (c) the relative errors of equivalent plastic strain for each specimen geometry and model.

Figure 10.
Experimental results of cross-die tests: (a) strain distribution; and (b) the final product with height of 48.6 mm.
Figure 10.
Experimental results of cross-die tests: (a) strain distribution; and (b) the final product with height of 48.6 mm.
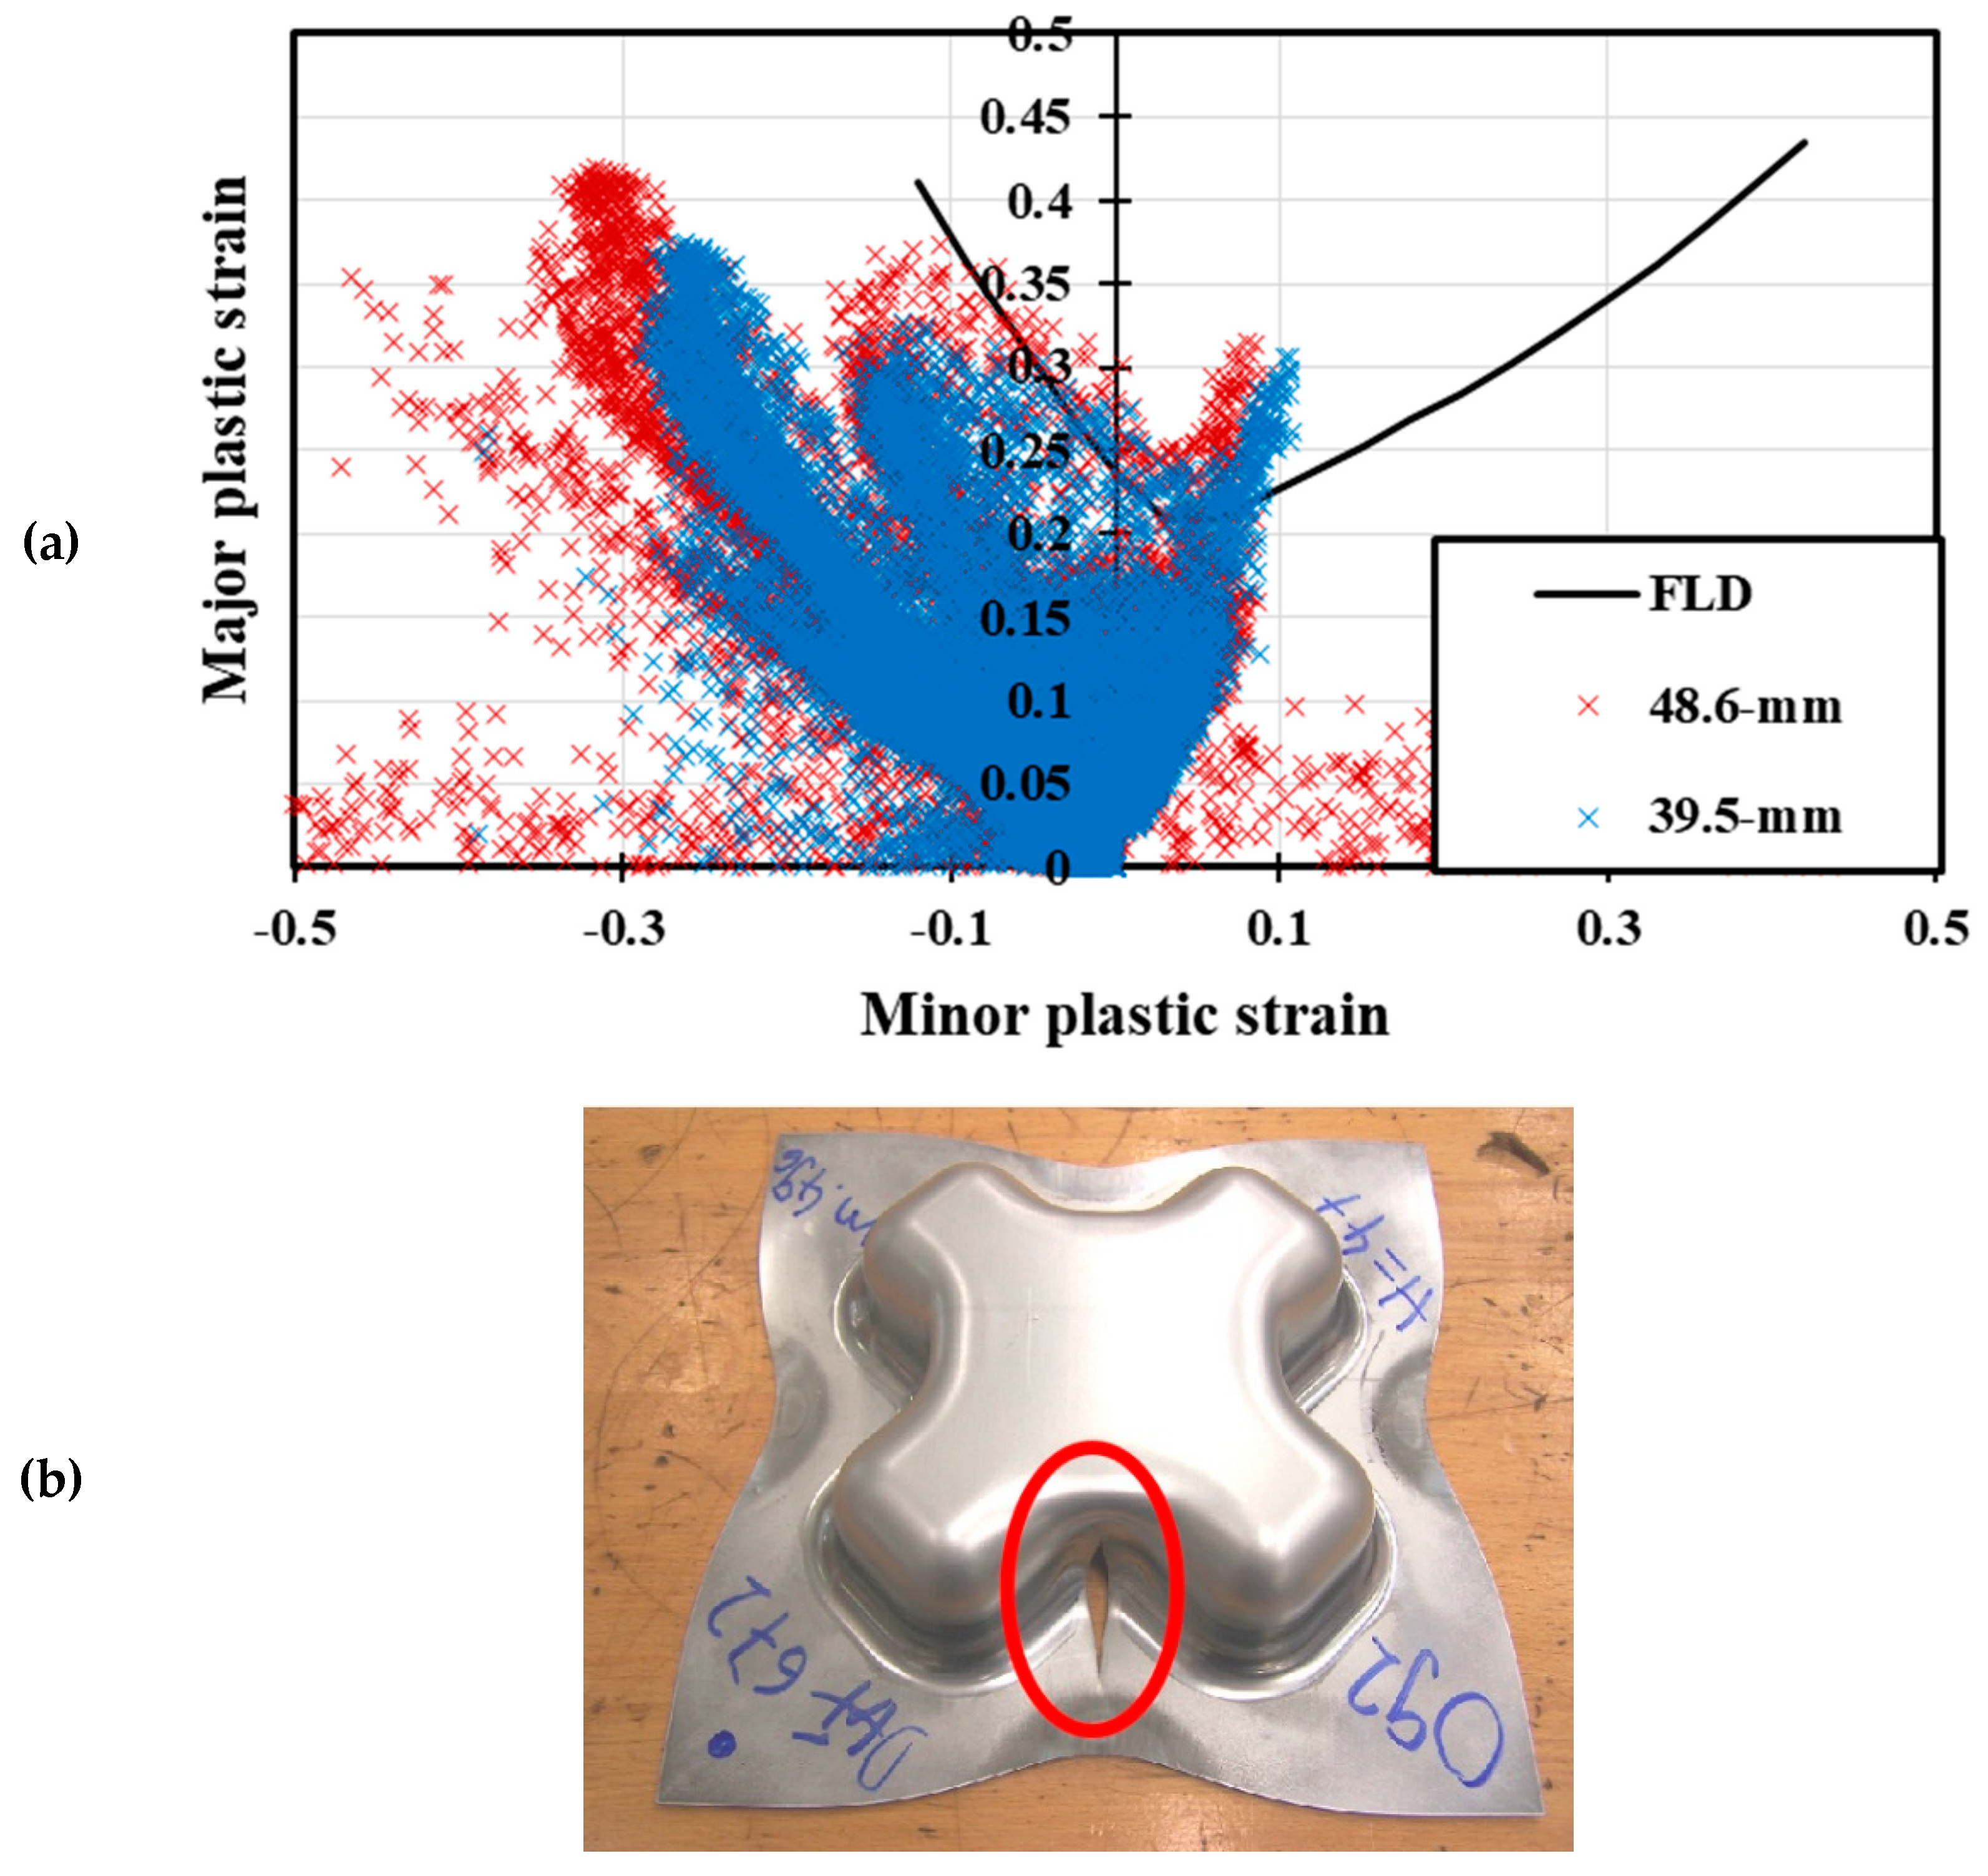
Figure 11.
The experimental data of final product with 48.6 mm height, which was measured using PHASTTM equipment: (a) major strain distribution; (b) minor strain distribution; and (c) measured strains for the different locations.
Figure 11.
The experimental data of final product with 48.6 mm height, which was measured using PHASTTM equipment: (a) major strain distribution; (b) minor strain distribution; and (c) measured strains for the different locations.
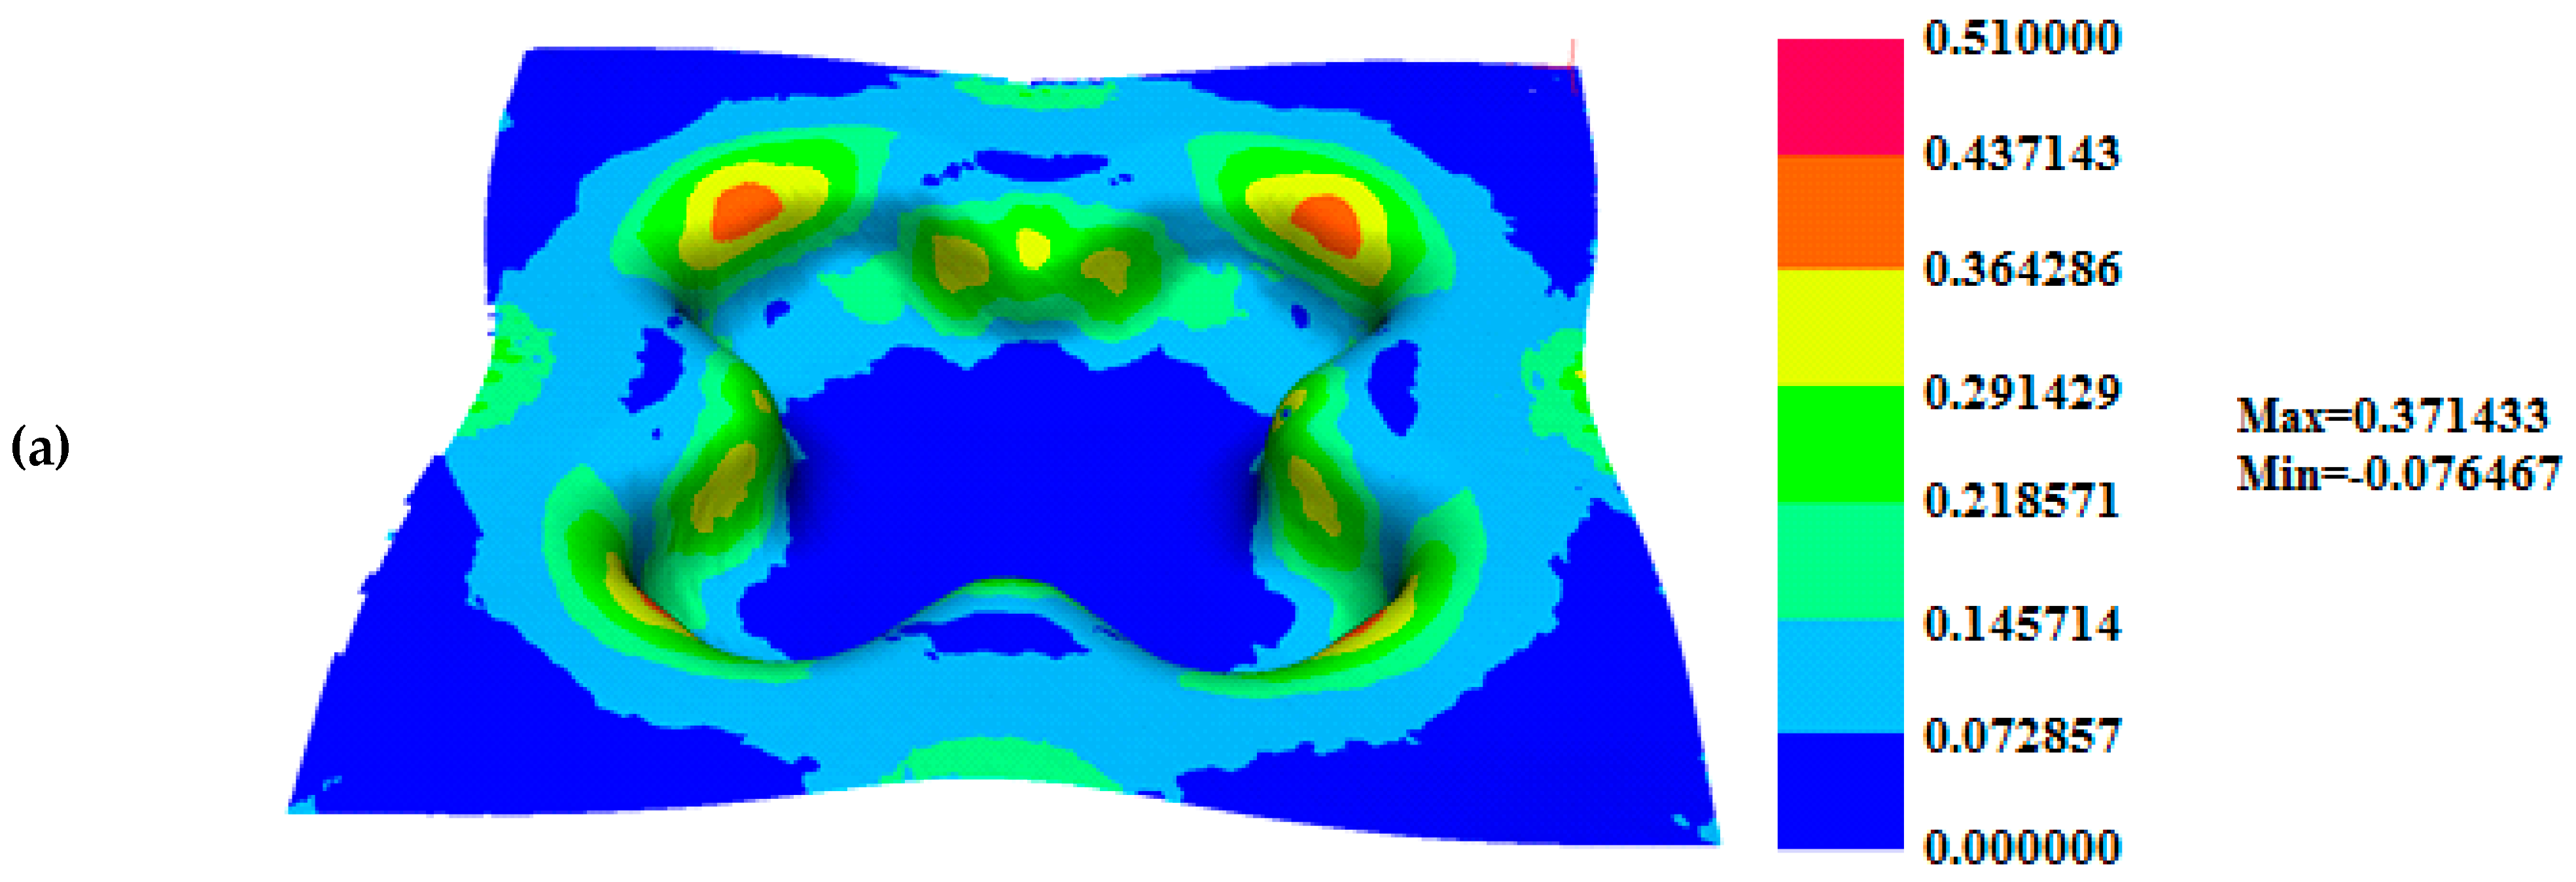
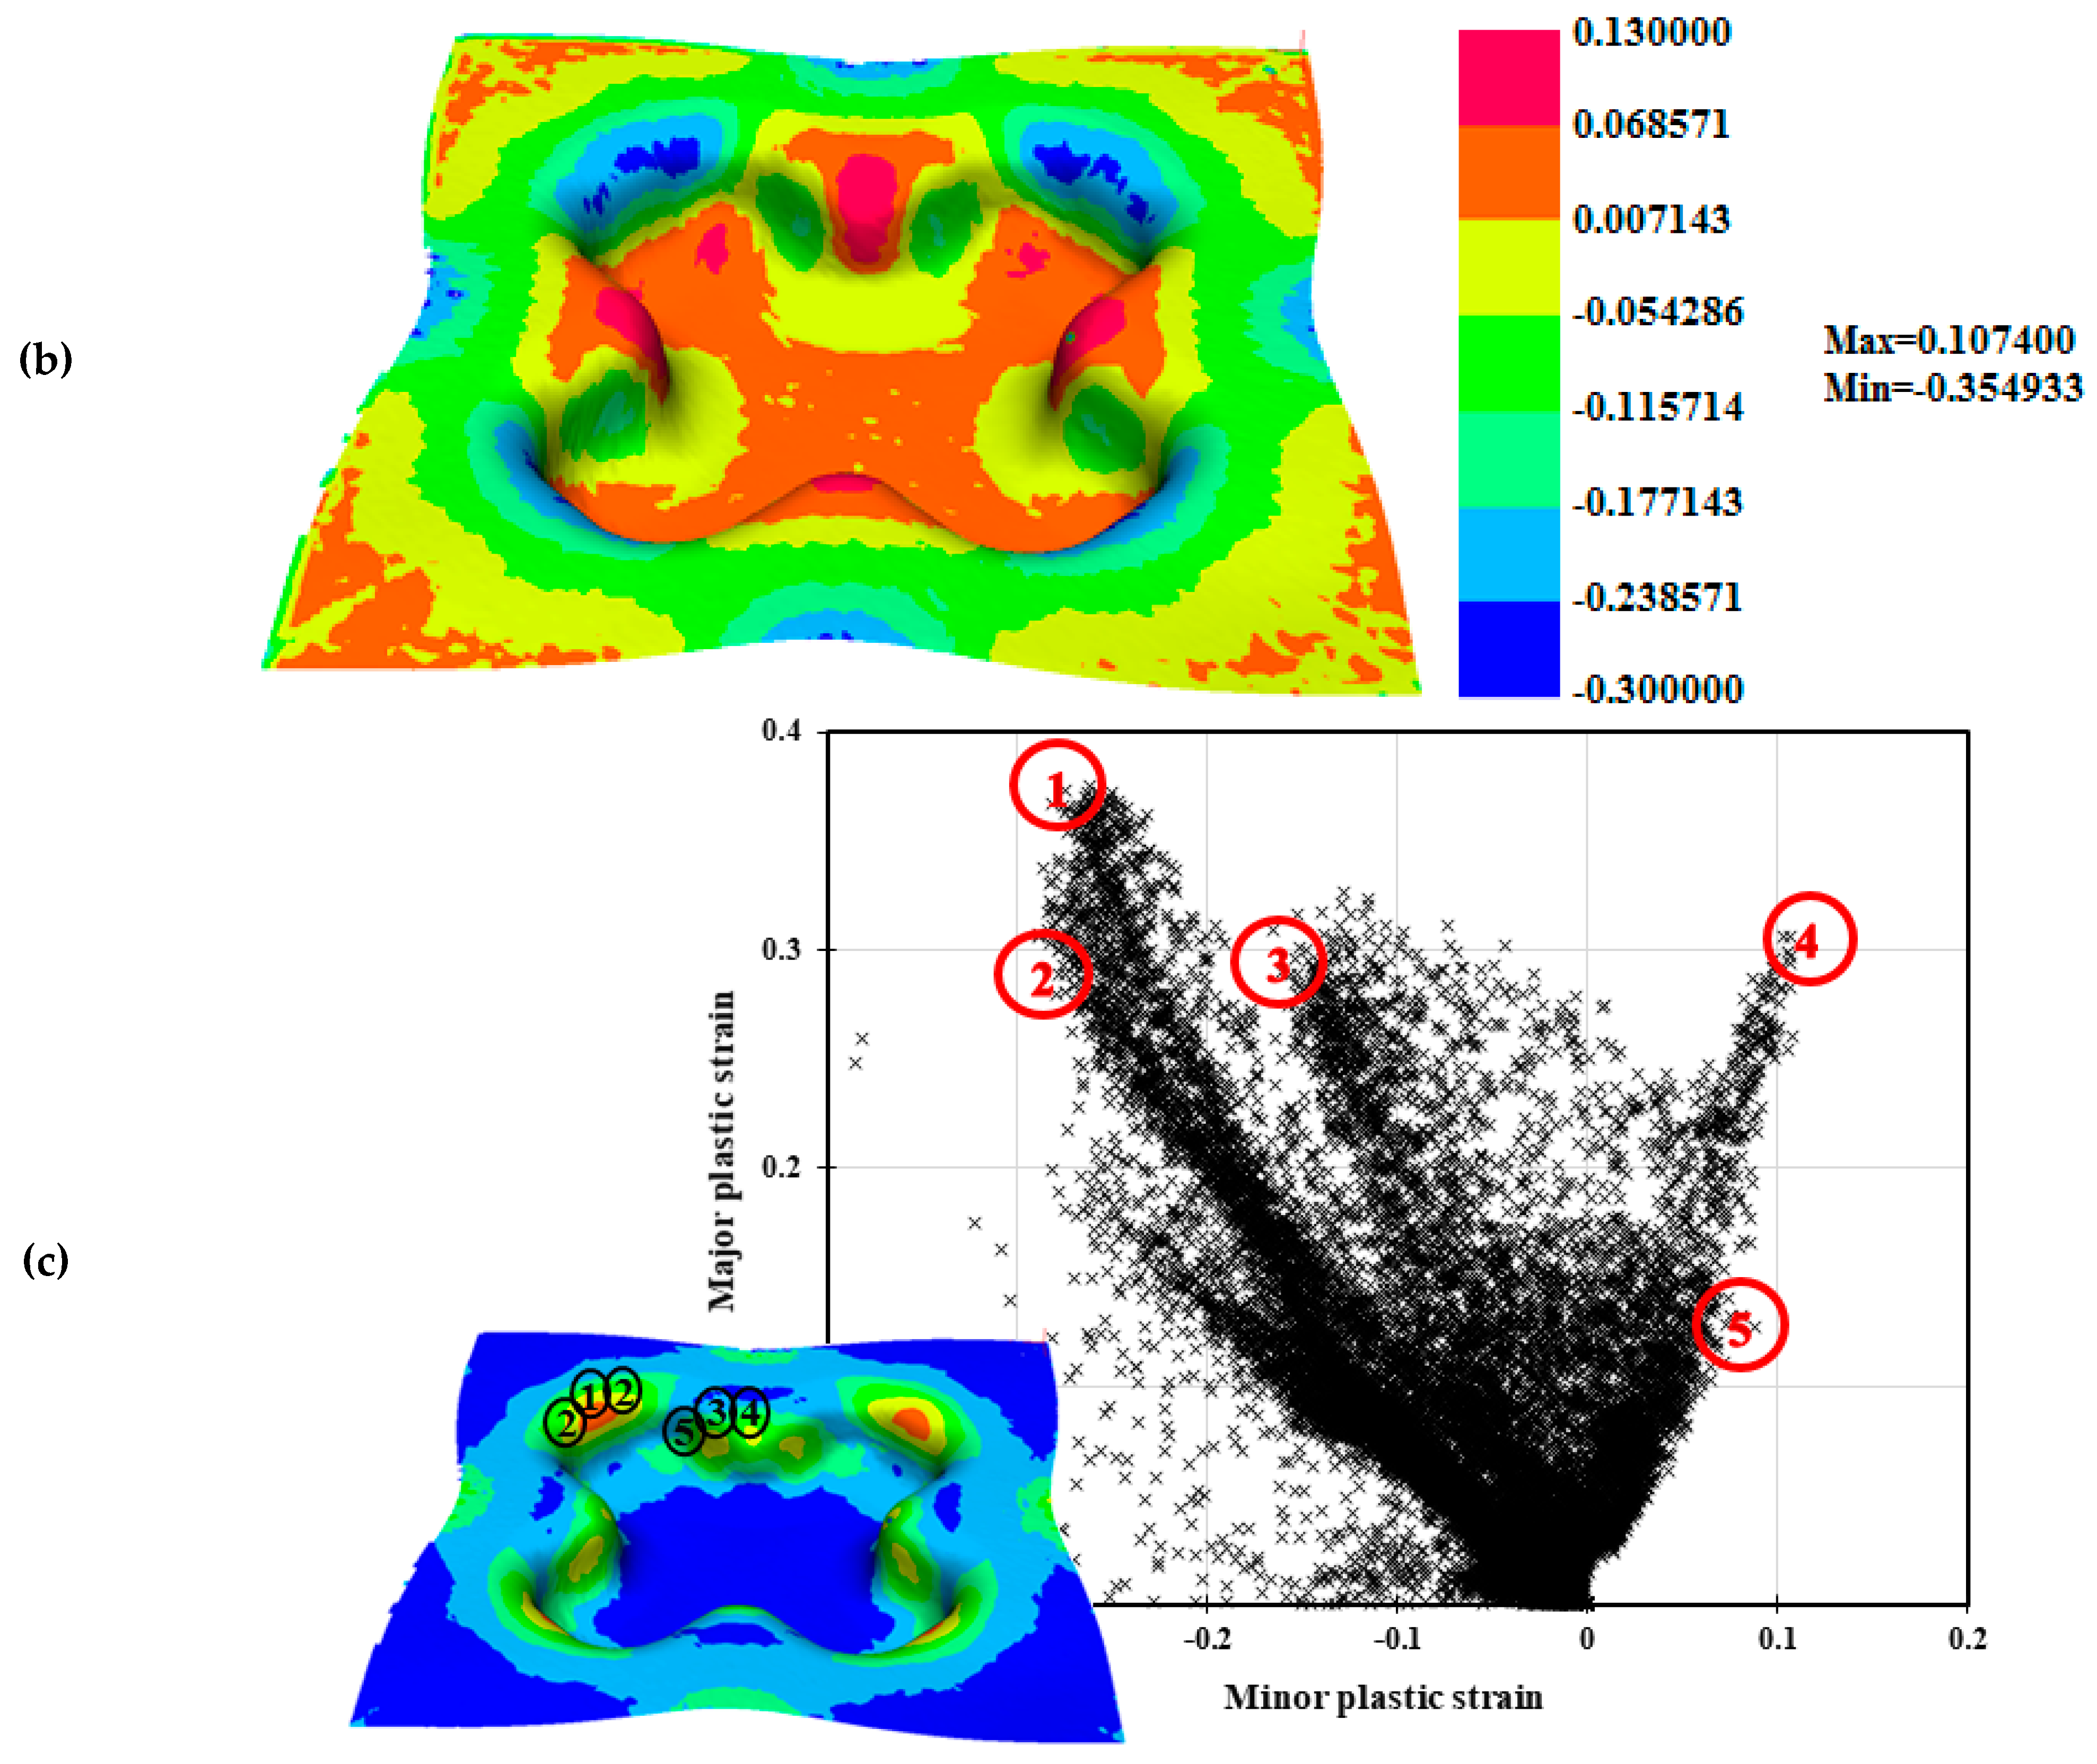
Figure 12.
Global strain status and the damage indicator at the integration points located at: (a) the negative surface; and (b) the positive surface (the colors represent the values of damage indicator calibrated by experimental FLD).
Figure 12.
Global strain status and the damage indicator at the integration points located at: (a) the negative surface; and (b) the positive surface (the colors represent the values of damage indicator calibrated by experimental FLD).
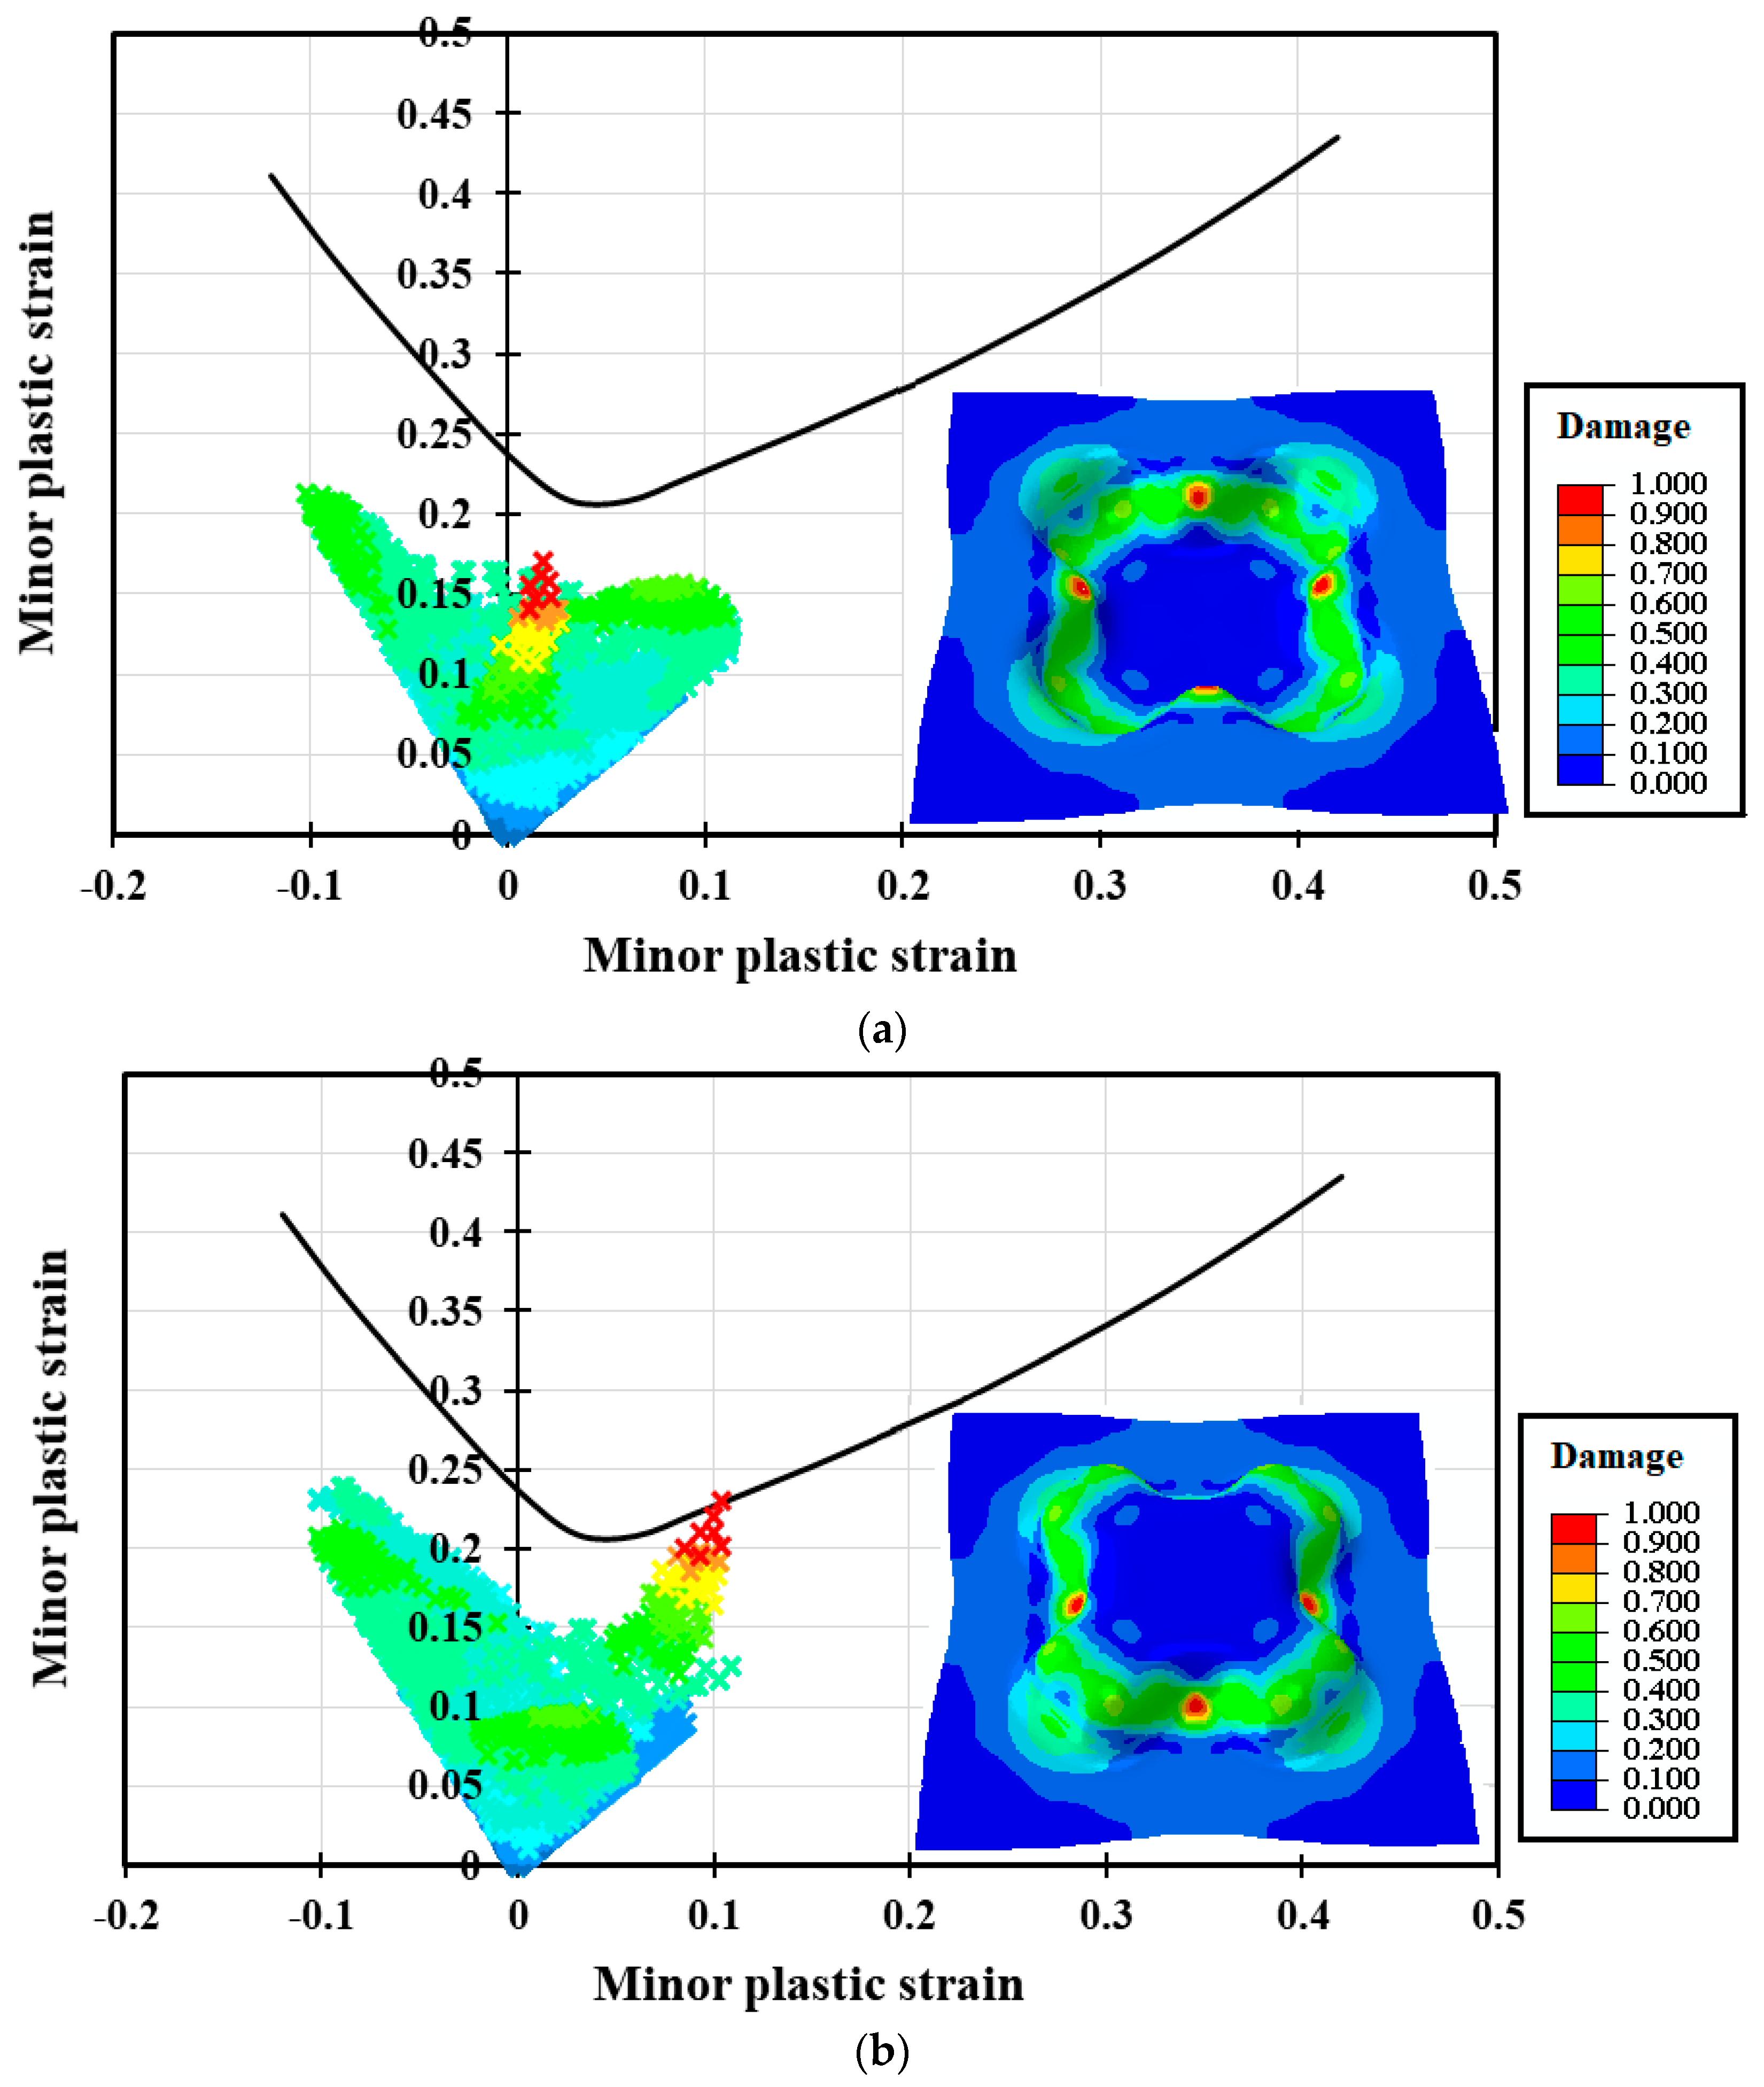
Figure 13.
The simulation results for cross-die deep drawing test. Distribution of major, minor, and equivalent plastic strains at the onset of damage represented in (a–c), respectively (the experimental FLD was assumed as the damage criterion).
Figure 13.
The simulation results for cross-die deep drawing test. Distribution of major, minor, and equivalent plastic strains at the onset of damage represented in (a–c), respectively (the experimental FLD was assumed as the damage criterion).
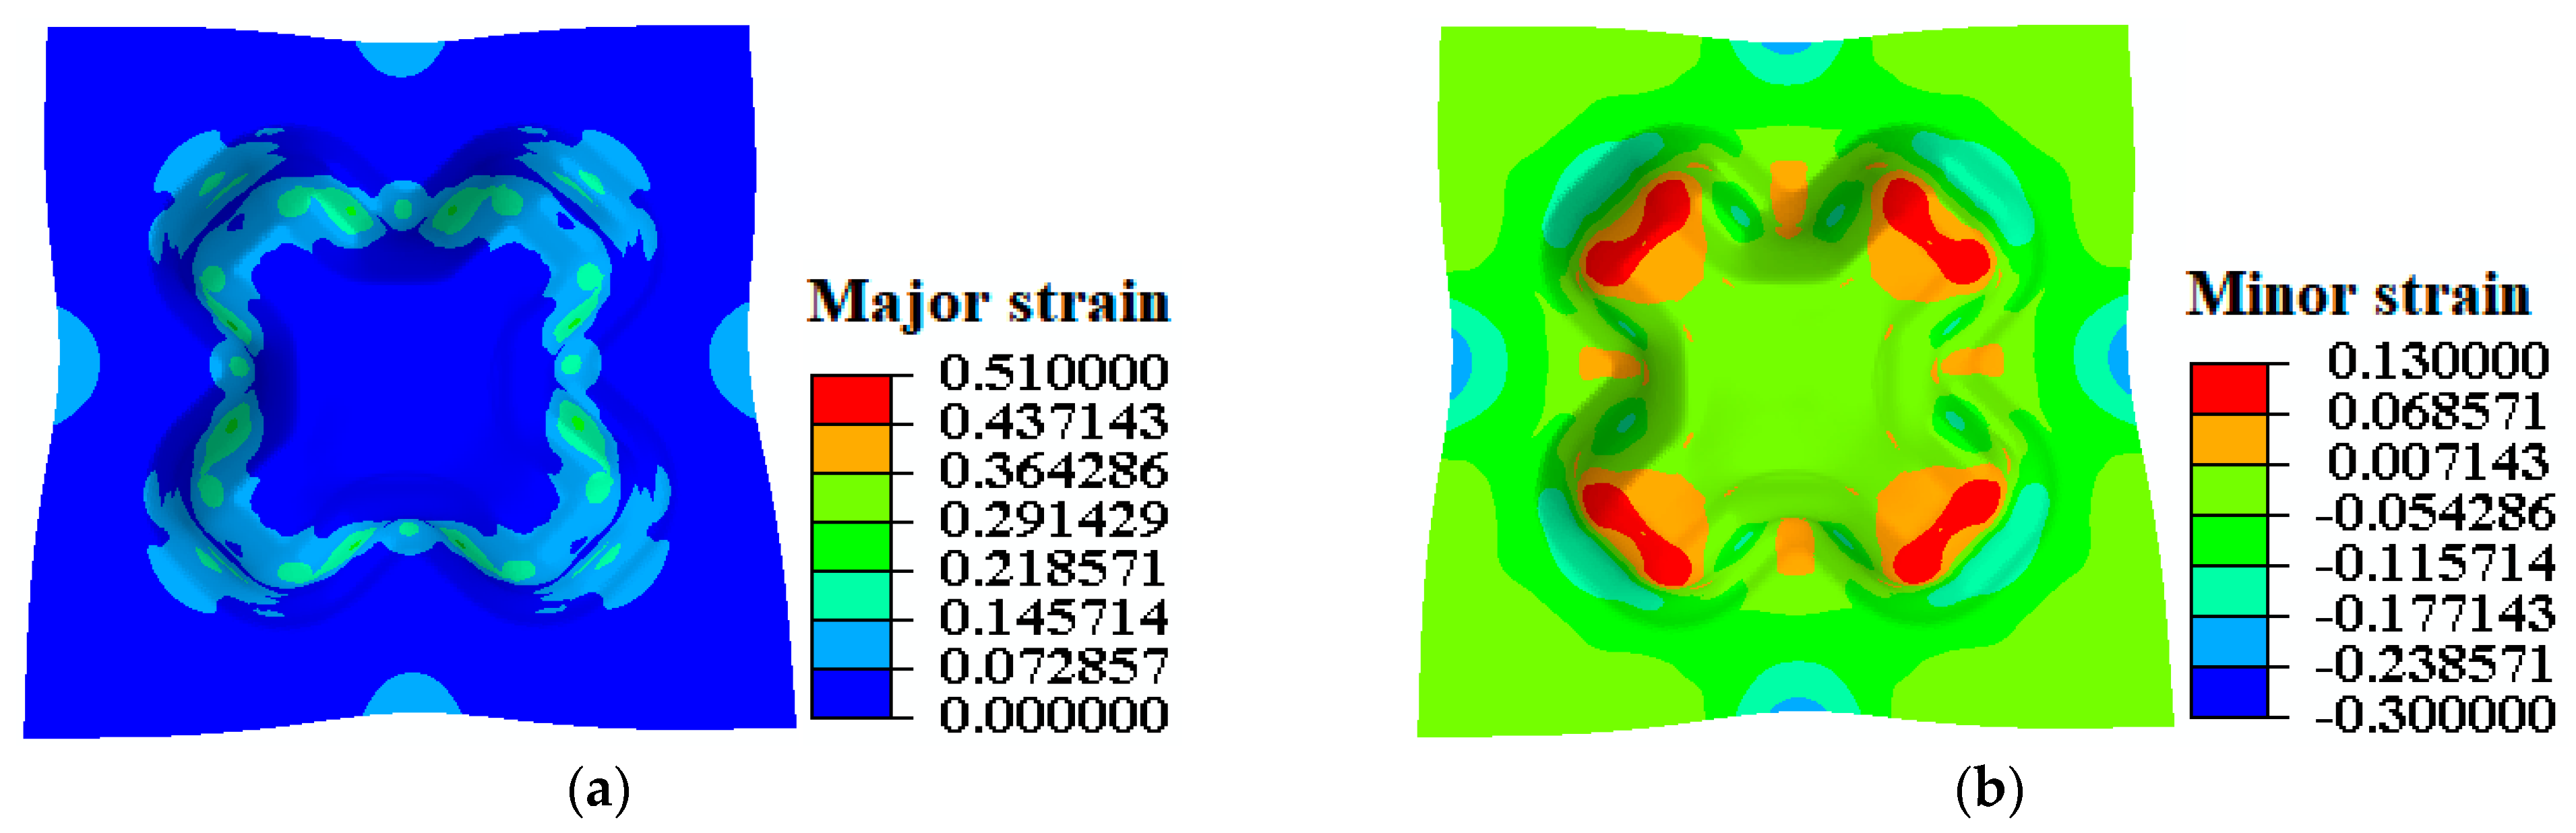
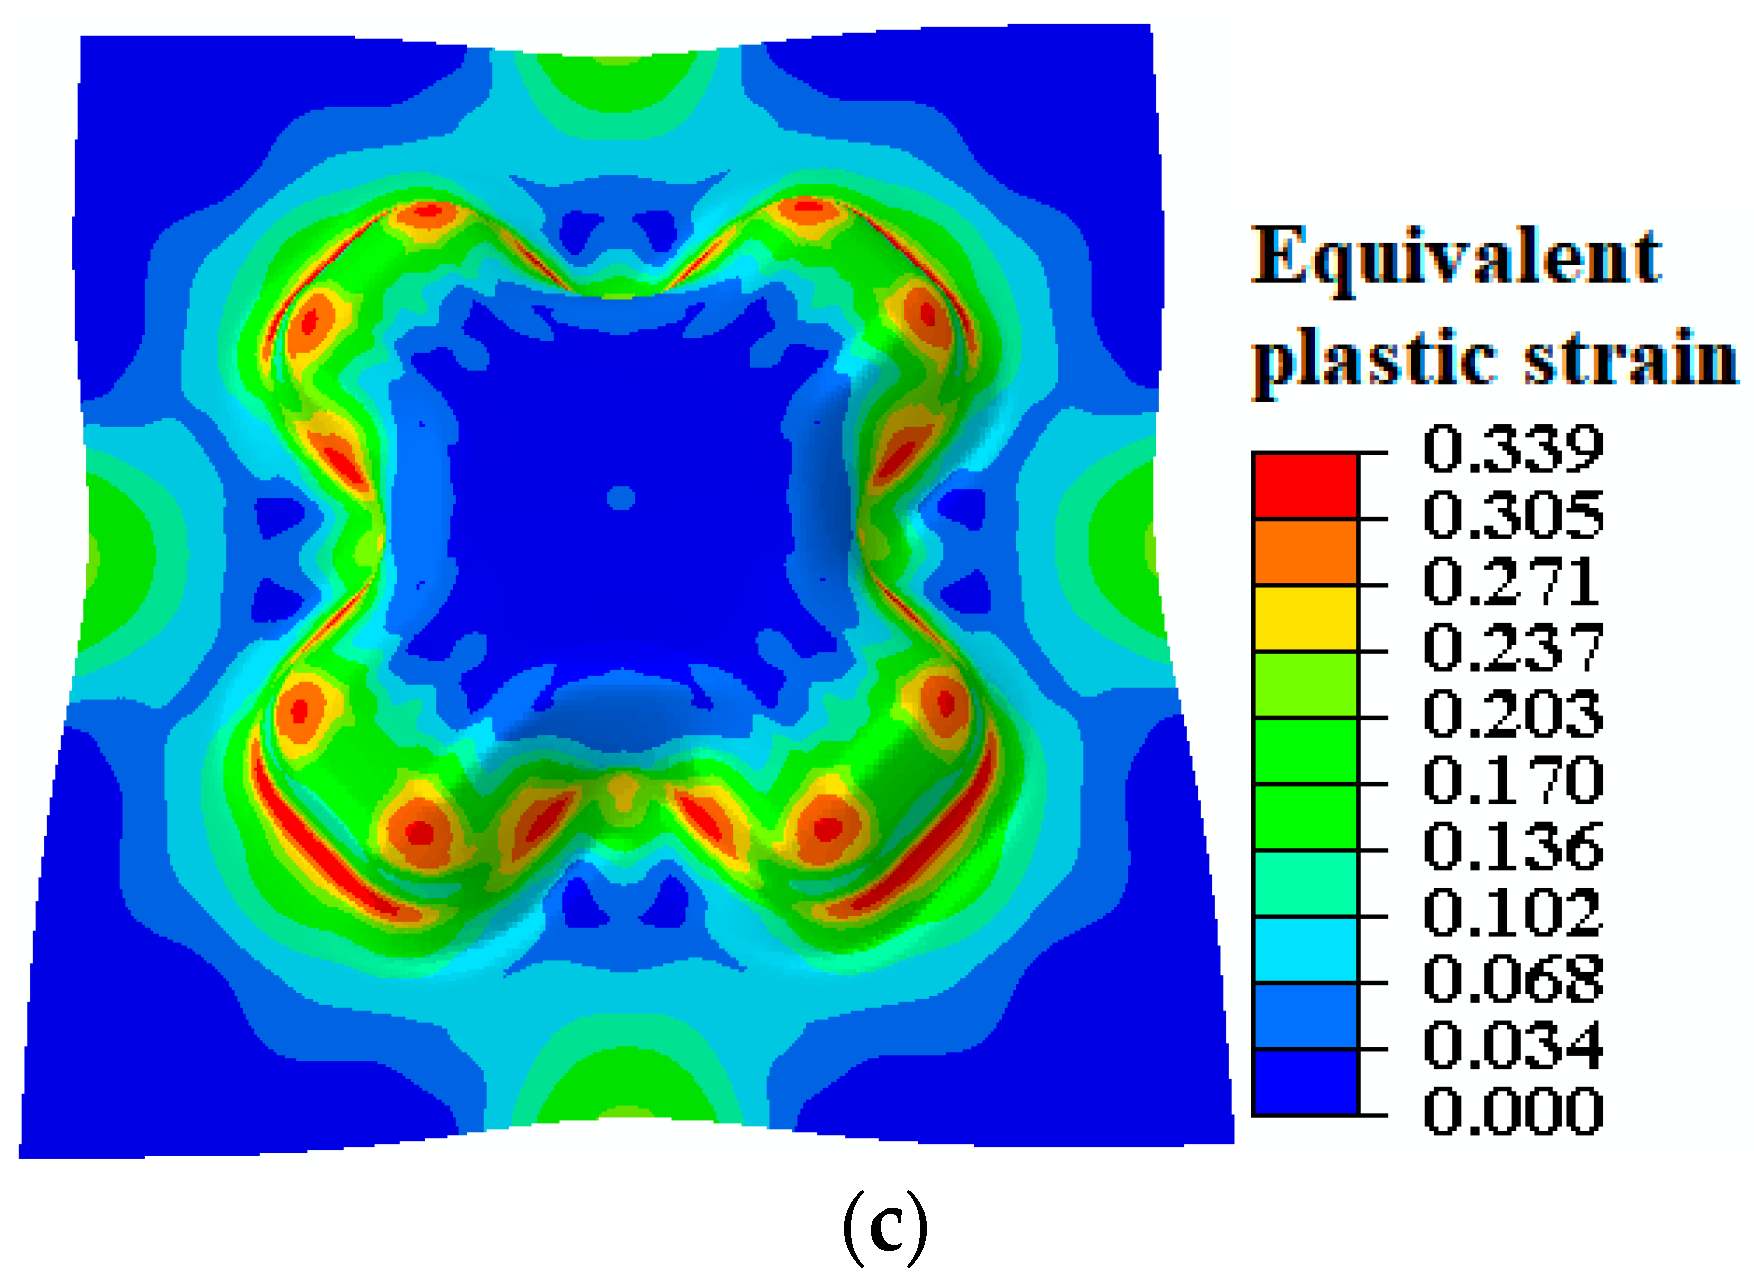
Figure 14.
Force–displacement responses through experiment and simulation of cross-die test.

Figure 15.
The calculated height of the final products of cross-die test.

Table 1.
Chemical composition of the investigated TRIP700 steel (wt. %).
| C | Mn | Si | Al | N | P | S | V | Ti | Fe |
| 0.187 | 1.620 | 0.350 | 0.917 | >0.001 | 0.087 | 0.003 | 0.003 | 0.009 | Bal. |
Table 2.
The failure criteria were used in the study.
| Criterion | Equation |
|---|---|
| Tresca [20] | (1) |
| Q. Situ et al. [21] | (2) |
| A.J. Martínez-Donaire et al. [23] | (3) |
Table 3.
The utilized data for numerical simulation.
| Simulation data | ||||||
| Friction coefficient | - | |||||
| blank-punch interface | 0.05 | |||||
| blank-matrix interface | 0.10 | |||||
| blank-holder interface | 0.10 | |||||
| Material data | ||||||
| Density (kg m−3) | 7800 | |||||
| Young’s modulus (GPa) | 210 | |||||
| Poisson ratio | 0.3 | |||||
| >Hardening law of the base material | >- | |||||
| >A | >B | >C | ||||
| >1099.98 | >520.90 | >6.27 | ||||
| >R11 | >R22 | >R33 | >R12 | >R23 | >R13 | |
| >1 | >1.0724 | >1.0076 | >1.0396 | >1 | >1 | |
| * , , , | ||||||
© 2018 by the authors. Licensee MDPI, Basel, Switzerland. This article is an open access article distributed under the terms and conditions of the Creative Commons Attribution (CC BY) license (http://creativecommons.org/licenses/by/4.0/).
Share and Cite
MDPI and ACS Style
Habibi, N.; Sundararaghavan, V.; Prahl, U.; Ramazani, A. Experimental and Numerical Investigations into the Failure Mechanisms of TRIP700 Steel Sheets. Metals 2018, 8, 1073. https://doi.org/10.3390/met8121073
AMA Style
Habibi N, Sundararaghavan V, Prahl U, Ramazani A. Experimental and Numerical Investigations into the Failure Mechanisms of TRIP700 Steel Sheets. Metals. 2018; 8(12):1073. https://doi.org/10.3390/met8121073
Chicago/Turabian StyleHabibi, Niloufar, Veera Sundararaghavan, Ulrich Prahl, and Ali Ramazani. 2018. "Experimental and Numerical Investigations into the Failure Mechanisms of TRIP700 Steel Sheets" Metals 8, no. 12: 1073. https://doi.org/10.3390/met8121073
Note that from the first issue of 2016, this journal uses article numbers instead of page numbers. See further details here.