Article

Evaluation of the Aging Effect on the Microstructure of Co-28Cr-6Mo-0.3C Alloy: Experimental Characterization and Computational Thermodynamics

1
Department of Materials and Textile Engineering, Faculty of Engineering, Razi University, Kermanshah 6714414971, Iran
2
Department of Metallurgical and Materials Engineering, Kocaeli University, Kocaeli TR-41380, Turkey
3
Faculty of Engineering, University of Kashan, Kashan 8731751167, Iran
4
Department of Aerospace Engineering, University of Michigan-Ann Arbor, Ann-Arbor, MI 48109, USA
*
Author to whom correspondence should be addressed.
Metals 2019, 9(5), 581; https://doi.org/10.3390/met9050581
Submission received: 11 April 2019 / Revised: 13 May 2019 / Accepted: 16 May 2019 / Published: 19 May 2019
(This article belongs to the Special Issue Microstructure based Modeling of Metallic Materials)

Abstract

:
In the current research, we studied the role of the solution treatment and aging on the microstructure of a Co–28Cr–5Mo–0.3C alloy. We used metallographic observations, scanning electron microscopy (SEM), and hardness measurements for the evaluations. We also made a comparison between the phase equilibrium calculated with Thermo-Calc, using TCFE8 and TCNI8 thermodynamic databases and experimental findings. The experimental results showed that the transformation of the metastable FCC phase to the HCP phase during aging was extremely sensitive to the solution treatment prior to aging. The effect of the increase in the solution temperature and time was detectable through promotion of the martensitic transformation during quenching in which HCP1 (straight bands) and HCP2 (lamellar-type constitution) phases had developed. In contrast, a low solution temperature and time caused most of the primary carbides to remain in an undissolved condition in the matrix; therefore, during aging, no sign of the FCC to HCP1 (straight bands) phase transformation could be observed. However, we observed the formation of the HCP2 phase (lamellar-type constitution) at the grain boundaries. In addition, the X-ray diffraction pattern indicated that the sample solution treated at lower temperatures and shorter times had a stronger martensitic transformation during aging compared to the sample solution treated at higher temperatures and longer times. Hardness measurements confirmed the results. Thermodynamical calculations showed that an agreement existed between the experiments and calculations. We also discuss the results from the TCFE8 and TCNI8 databases.

1. Introduction

The ASTM F75 cast alloy, with a Co–28Cr–5Mo–0.3C nominal wt. % composition, is one of the most widely used cobalt-base alloys for orthopedic implants, such as knee, hip, and shoulder implants [1,2,3]. The mechanical properties of this alloy and its microstructure are strongly related. In-homogeneities in carbide morphology, size, and distribution result in a decrease of the alloy’s mechanical properties, which can be eliminated using heat treatment. Various microstructural features, including stacking faults, twins, dislocations, and carbides are associated with heat treatment. Heat treatment can result in the homogenous distribution of carbides and the elimination of casting defects [4,5,6].
The FCC to HCP transformation in cobalt base alloys is very sluggish. Therefore, under normal cooling conditions, the FCC phase stays below the phase boundary in the metastable FCC state. In pure Co, the transformation takes place at about 427 °C (TC) via a diffusion-less mechanism. The transformation temperature (TC) increases as Cr and Mo are added to the Co, because they expand the HCP field of stability [7].
The HCP phase can be induced from the FCC phase through plastic deformation (strain-induced transformation) [6], quenching from T (T > TC) (athermal martensite), or isothermal aging below TC (isothermal martensite) [5]. In the Co–28Cr–5Mo–0.3C alloy, due to the high amount of C, a full phase transformation by means of quenching and aging is limited [6]. Moreover, premature fracture during plastic deformation prevents the commencement of transformation beyond 50–60%, through strain-induced transformation. Therefore, a complete FCC to HCP transformation requires the simultaneous activation of all the procedures [5].
The specific microstructural features related to the FCC- > HCP martensitic transformation seem to be strongly influenced by the alloy composition and heat treatment conditions. In the current research, the role of the solution temperature and aging on the microstructure of the Co-28Cr-5Mo-0.3C alloy, as well as the metastable FCC->HCP phase transformation during aging, was investigated.
Thermodynamic equilibrium calculations can predict the phase transformations during heat treatments. To model the phase diagrams for multicomponent systems, the CALPHAD (CALculation of PHAse Diagram) approach is effective. Thermodynamical calculations yield the microstructural changes that should take place at different temperatures, and thereby facilitate the optimum temperature for heat treatments such as aging. The Thermo-Calc software (TCS) [8] coupled with thermodynamic databases is widely used for calculations related to cobalt-based alloys. Recent studies [9,10,11,12,13] have employed databases for steel and nickel alloys. The current version is the TCS Steels/Fe-alloys Database Version 8 (TCFE8) [14], where the recommended composition limit for Co in this database is lower than 20 (wt. %). On the other hand, the TCS Ni-based Superalloys Database Version 8 (TCNI8) provides no indication of the limit for the Co content. The TCFE6 database was used for Co–Cr–W-based dental alloys by Yamanaka et al. [9,10], and for Co–29Cr–6Mo alloys by Kurosu et al. [11]. According to their work [9,10,11], the TCFE6 database offers comparable results with experimental findings. In particular, Kurosu et al. [11] investigated an alloy with a similar composition to the alloy used in this work, although without carbon addition. They calculated the FCC and HCP phases, as well as the Sigma phase, owing to the lack of carbon in the composition. On the other hand, the Ni-based superalloys database was used for the Co based alloys [12,13]. Koßmann et al. [12] studied micro-segregation and the precipitates of as-cast Co–Al–W superalloys from the TCNI5 database, but they found limited applicability of results from the thermodynamical calculations to their experimental results. Contrarily, an excellent agreement with the experimental results was given in a study on Co–Ni–Cr–Al–Re–Y alloys by Salam et al. [13], although their compositions included Ni up to 31.5 wt. %. In our work, we provide thermodynamical calculations using both the TCFE8 and TCNI8 databases, which are compared to the experimental results.

2. Calculations and Experimental Procedure

2.1. Thermodynamic Calculations

Thermodynamic equilibrium calculations can predict phase transformations during heat treatments. Therefore, it is possible to define a proper temperature range for the solution and aging treatments. It is also possible to obtain the chemical composition of equilibrated phases at the aging temperature. In the current work, we performed thermodynamic equilibrium calculations using the Thermo-Calc software 2016a (Thermo-Calc Software AB, Solna, Sweden). Similar compositions of cobalt-based alloys [9,10,11,12,13] were calculated using databases developed for both steels and nickel-based superalloys. Therefore, the calculations were performed using the thermodynamic databases TCFE8 and TCNI8. In the Thermo-Calc databases, TCFE8 and TCNI8, both databases include the elements Co, Cr, Mo, and C. Both the databases also contain LIQUID, HCP_A3, and M23C6 phases. However, the TCNI8 databased predicts the ordered cubic FCC_L12 phase, whilst the disordered FCC_A1 phase is stable in the TCFE8 database. In addition, calculations using the TCNI8 database resulted in the SIGMA intermetallic phase at a temperature range between 900 and 950 °C. In the calculations, we retained all the possible phases.

2.2. Experimental Procedure

Table 1 shows the chemical composition of the as-cast studied Co–Cr–Mo–C alloy. As-cast specimens were machined and cut into cylindrical samples with the dimensions of 10 mm height and 8 mm diameter. Solution treatments were followed by quenching in water at ambient temperature. Two different solution treatments were applied, solution temperature at 1230 °C for time of 3 h and at 1200 °C for time of 1 h. Aging treatment was carried out at 850 °C for 24 and 48 h in order to develop isothermal martensite. All The heat treatments were carried out in a high-temperature tube furnace under an inert gas (argon) atmosphere.
A conventional metallographic technique was employed for the microstructural studies. Prior to the metallographic examination, the surface was ground for a depth of about 1 mm to achieve a smooth surface and to remove any decarburized or deformed material, since the sectioning of the samples might possibly have induced an allotropic transformation within the metastable FCC cobalt matrix. The samples were polished and etched by means of an etchant containing 92% HCl, 5% H2SO4, and 3% HNO3. The microstructures of the samples were examined using scanning electron microscopy (SEM), as well as optical microscopy (OM). Then semi-quantitative analysis was conducted using electron dispersive spectroscopy (EDS) to distinguish the phases at the microstructures. Phase identification was carried out by the X-ray diffraction method using Cu Kα (λ = 1.54184 A°) radiation in a Philips machine. The scan angle (2θ) was selected between 40° and 55°, with step size of 0.02° 2θ × S−1. The X-ray diffraction experiments were employed for the determination of the most intense isolated (200)FCC and (1011)HCP X-ray diffraction peaks. Additionally, the effect of the phase transformation on the hardness of the Co–28Cr–5Mo–0.3C was characterized using microhardness measurements under an applied load of 50 g and dwell time of 10 s.

3. Results and Discussion

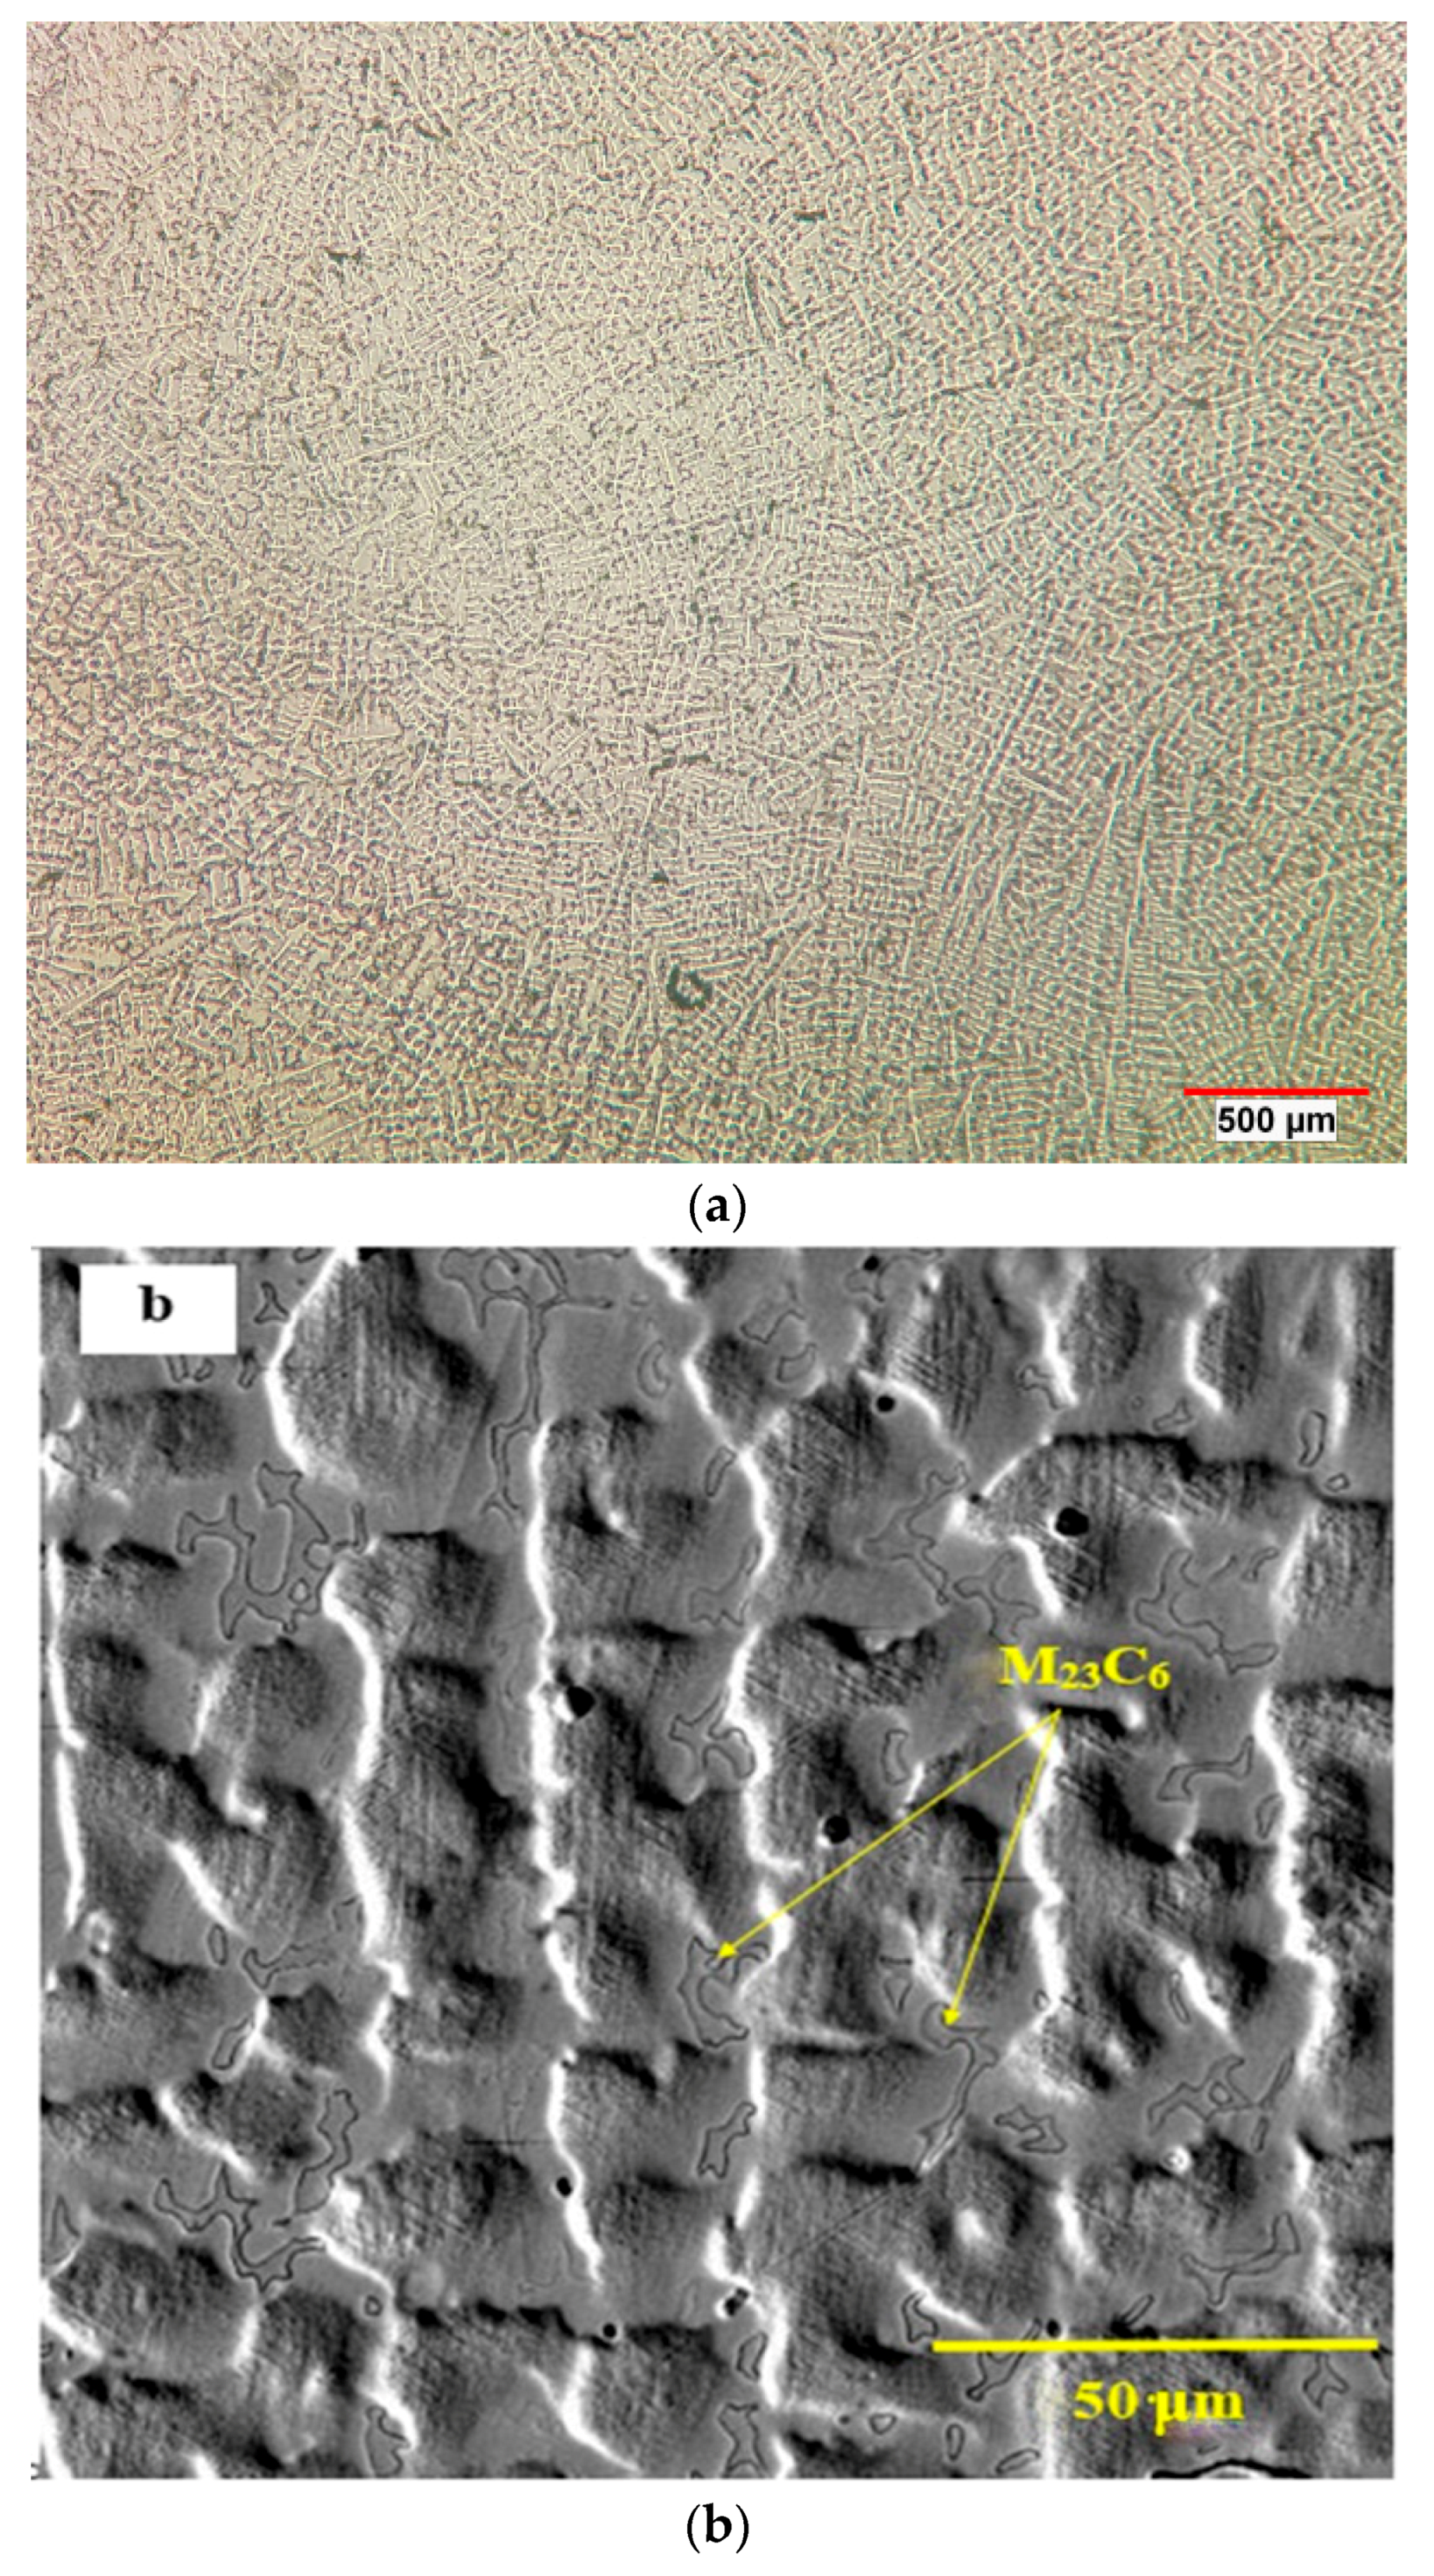
3.1. As-Received Alloy

The as-cast structure of the Co–28Cr-5Mo–0.3C alloy is shown in Figure 1. The microstructure consisted of a Cr and Mo rich dendritic matrix γ (Figure 1a), and secondary phases, mainly blocky carbides of the M23C6 type that appeared in the interdendritic regions and grain boundaries (Figure 1b). In general, the M23C6 carbide has been identified as the main secondary phase in this alloy, as well as in alloys of a similar chemical composition [15].

3.2. Thermodynamical Calculations

In Figure 2, the calculated isopleth and phase amounts for the Co–28Cr–5Mo–0.3C alloy are presented using the TCFE8 and TCNI8 databases. In general, both databases gave similar phase transformations at slightly different temperatures, as shown in Figure 2b and Table 2. However, the calculations based on the TCNI8 database also indicated a sigma phase transformation. The sigma phase decomposes again at 900 °C. Therefore, the HCP and M23C6 phases exist at 800 °C in equilibrium according to the TCFE8 and TCNI8 databases.
Typical solution treatment of ASTM F75 involves annealing carried out at temperatures around 1200 °C. The Thermo-Calc results suggested that the M23C6 phase was stable with the FCC phase at this temperature, and it dissolved at temperatures above 1255 °C in the liquid phase. Thus, the solution treatment conditions that were finally chosen for this work were temperatures of 1200 and 1230 °C. Higher temperatures were avoided to prevent the formation of the liquid phase. We could also observe that the HCP + M23C6 phase region lay at temperatures below 921 °C. The aging temperature was selected as 850 °C in the HCP + M23C6 phase region to precipitate fine M23C6 carbides. As shown in Table 3, M23C6 is a Cr rich carbide, and the low value of carbon is dissolved in the HCP phase. Both databases indicated similar phase amounts and chemical compositions.

3.3. Solution Treatment and Quenching

Figure 3, shows the microstructure of the studied alloy after solution treatment and quenching. The solution treatment at 1230 °C for 3 h resulted in nearly the full dissolution of the interdendritic carbides, and it also led to spheroid carbides (Figure 3a). Meanwhile, the solution treatment at 1200 °C for 1 h caused the partial dissolution of the carbides, and therefore, some of the primary carbides remained undissolved in the alloy matrix (Figure 3b).
When the Co–28Cr–5Mo–0.3C alloy was quenched from the FCC phase field, the material partially transformed to athermal martensite. The estimated amounts of the athermal martensite were calculated using the expression developed by Sage and Gillaud [16]. We found that the martensite percentages for the samples quenched at 1200 and 1230 °C were 2% and 4%, respectively. To begin the athermal martensitic transformation, a certain nucleation enthalpy (ΔG) is considered necessary; and to supply this energy, a super cooling over the temperature difference ΔT is necessary. It is known that as super cooling increases, the volume fraction of martensite increases. Moreover, as the time of the solution treatment increases, more carbides dissolve and the homogeneity of the matrix increases, and correspondingly, the nucleation sites for equilibrium transformations decrease [17]. Therefore, the amount of the athermal martensite (HCP) phase formed on quenching would increase by increasing the solution temperature and time.
The relatively small amounts of athermal martensite indicated that its development was strongly restricted by the promotion of coherency stresses at the HCP–FCC interfaces, or most importantly by the relatively high intrinsic stacking fault energy of the carbon supersaturated HCP faults. In other words, the athermal martensitic transformation during rapid cooling is suppressed due to an increase in the carbon content, since carbon acts as a γ (FCC) stabilizer for cobalt-based alloys [18].

3.4. Aging of the Nearly Fully Solution Treated Sample

Figure 4a,b, respectively, show the microstructural development of the sample solution treated at 1230 °C for 3 h and then aged at 850 °C for 24 h and 48 h. The formation of the HCP phase is also seen in these figures. Isothermal aging of the solution treated and quenched Co–Cr–Mo–C alloy promotes the FCC- > HCP phase transformation. This phase transformation is composed of two steps that occur simultaneously, that is, the discontinuous precipitation of carbides and the formation of HCP phase. Two microstructurally different forms of the HCP phase, that is, HCP1 (epsilon martensite) and HCP2 (pseudoperlite) might also be constituted [15]. During aging, the FCC phase transforms into the HCP1 phase as a series of straight bands. These bands become increasingly thick with the increasing aging times. The martensite also nucleates preferentially at the FCC grain boundaries, developing a morphology that resembles pearlite (a constituent typical of carbon steels), and it is known as the HCP2 phase. This appearance results from the formation of carbides along with the development of the martensite phase [15].
Figure 5a shows the X-ray diffraction patterns of the samples presented in Figure 4a,b. According to Figure 5a, the relative intensities of the (1010)HCP and (1011)HCP diffraction peaks increased with the aging time. The HCP peak intensity enhancement indicates the FCC- > HCP phase transformation development during aging. Isothermal aging of the nearly fully solution treated sample at 850 °C leads to the formation of HCP1 as discontinuous bands, which continually grow and form continuous bands (Figure 4a,b).
In addition to the HCP1 phase, the HCP2 phase also formed during the isothermal aging. It exhibited a lamellar morphology (Figure 6a). Furthermore, extensive carbide precipitation occurred within the lamellar HCP2 phase (Figure 6b). The lamellar-type constituent nucleated and grew readily at the grain boundaries. The cause was the large mismatch that may be accommodated in these regions, as well as the increased growth rate owing to the high diffusion rate along the grain boundaries [19,20].

3.5. Aging of the Partially Solution Treated Sample

The microstructures of the sample solution treated at 1200 °C for 1 h and then aged at 850 °C for 24 and 48 h are shown in Figure 7a,b, respectively. The lamellar-type constituent nucleated and grew at the grain boundaries. However, there was no clearly traceable HCP1 phase that had developed in the sample solution treated at 1200 °C for 1 h, similar to the one observed in the nearly fully solution treated sample. Furthermore, the undissolved primary carbide remained in the alloy matrix due to the partial solution treatment (Figure 8a). The EDS analysis of the undissolved carbide is shown in Figure 8b. We observed that the major elemental constituent is Cr. The undissolved primary carbides contain a considerable amount of Cr and Mo elements, which include the HCP stabilizer and thus result in a stable FCC cobalt matrix phase [21].
As can be seen in Figure 8b, the EDS compositional profile with distance indicates that the Cr content drops continually in the matrix as the distance from the undissolved carbide interface increases. However, the grain boundary regions, as nucleation sites for the HCP2 phase, were found to be slightly richer in Cr and Mo than the Co-matrix due to the preferential segregation of these elements [6]. As a result, the HCP2 phase easily forms during aging and it easily grows further with an increase in the aging time.
During the subsequent aging at 850 °C for 48 h, the FCC phase transformed to isothermal HCP martensite, as indicated by the X-ray diffraction patterns in Figure 5b and the corresponding microstructure in Figure 7b. As seen in the X-ray diffraction pattern, during aging of the Co–28Cr–5Mo–0.3C alloy at 850 °C, the FCC phase transformed into the HCP phase, and consequently, the relative intensities of the (1010)HCP and (1011)HCP diffraction peaks concomitantly increased with the increasing aging time. The peak intensity enhancement relates to the continual formation of isothermal martensite during aging. In comparison to the sample solution treated at higher temperatures and time, the solution treated sample at lower temperatures, i.e., 1200 °C for 1 h, showed more FCC (metastable) to HCP phase transformation as the aging time increased. This could be related to the presence of a higher amount of the unstable FCC phase, which transforms to HCP as the aging time increases. Figure 5 shows that the peak intensity of the HCP phase for the fully solution treated sample was higher than the partially treated sample after quenching, but as the aging time increased, the intensity of the HCP peak for the latter sample increased significantly.
Table 4 shows the equilibrium compositions and the volume fractions of the FCC and M23C6 phases at different solution temperatures. Thermodynamic equilibrium calculations using the TCFE8 database indicated that annealing at 1200 °C should comprise a 97.75 vol. % FCC phase containing 27.13 wt. %Cr, 4.86 wt. %Mo, and 0.19 wt. %C, with the remaining 2.25 vol. %M23C6. When increasing the temperature from 1200 °C to 1230 °C, the FCC amount should be increased from 97.75 vol. % to 98.31 vol. %. The chemical composition of the FCC also varies with the temperature. For example, the Cr, Mo, and C contents in the austenite increased at 1230 °C, and the volume of the M23C6 decreases from 2.25 to 1.69 vol. %. However, the TCNI8 database predicted a higher amount of the M23C6 phase between 3.92–4.33 vol. % according to the results in Table 4.

3.6. Microhardness Evolution

The microhardness values of the fully and partially solution treated Co–28Cr–5Mo–0.3C alloy samples, that were aged at 850 °C, as a function of the aging time, are shown in Table 5. In general, hardness represents the resistance of the substance to plastic deformation, and it increases with the presence of hard phases and carbides [22]. Table 5 shows that the hardness of the partially solution treated and quenched sample, despite its lower martensite content, was higher than the other sample. This presence of undissolved carbides in the microstructure that enhance the hardness may explain this effect. The hardness of the fully solution treated sample during isothermal aging at 850 °C for 24 and 48 h showed improvement of approximately 36% and 39%, respectively. Improvements in the microhardness occurred due to the formation of HCP phases, i.e., HCP1 within the grains, as well as HCP2 at the grain boundaries regions. The hardness enhancements for the partially solution treated sample during isothermal aging at 850 °C for 24 and 48 h were about 58% and 72%, respectively. It was in good correlation with the XRD analyses.

4. Conclusions

(1).
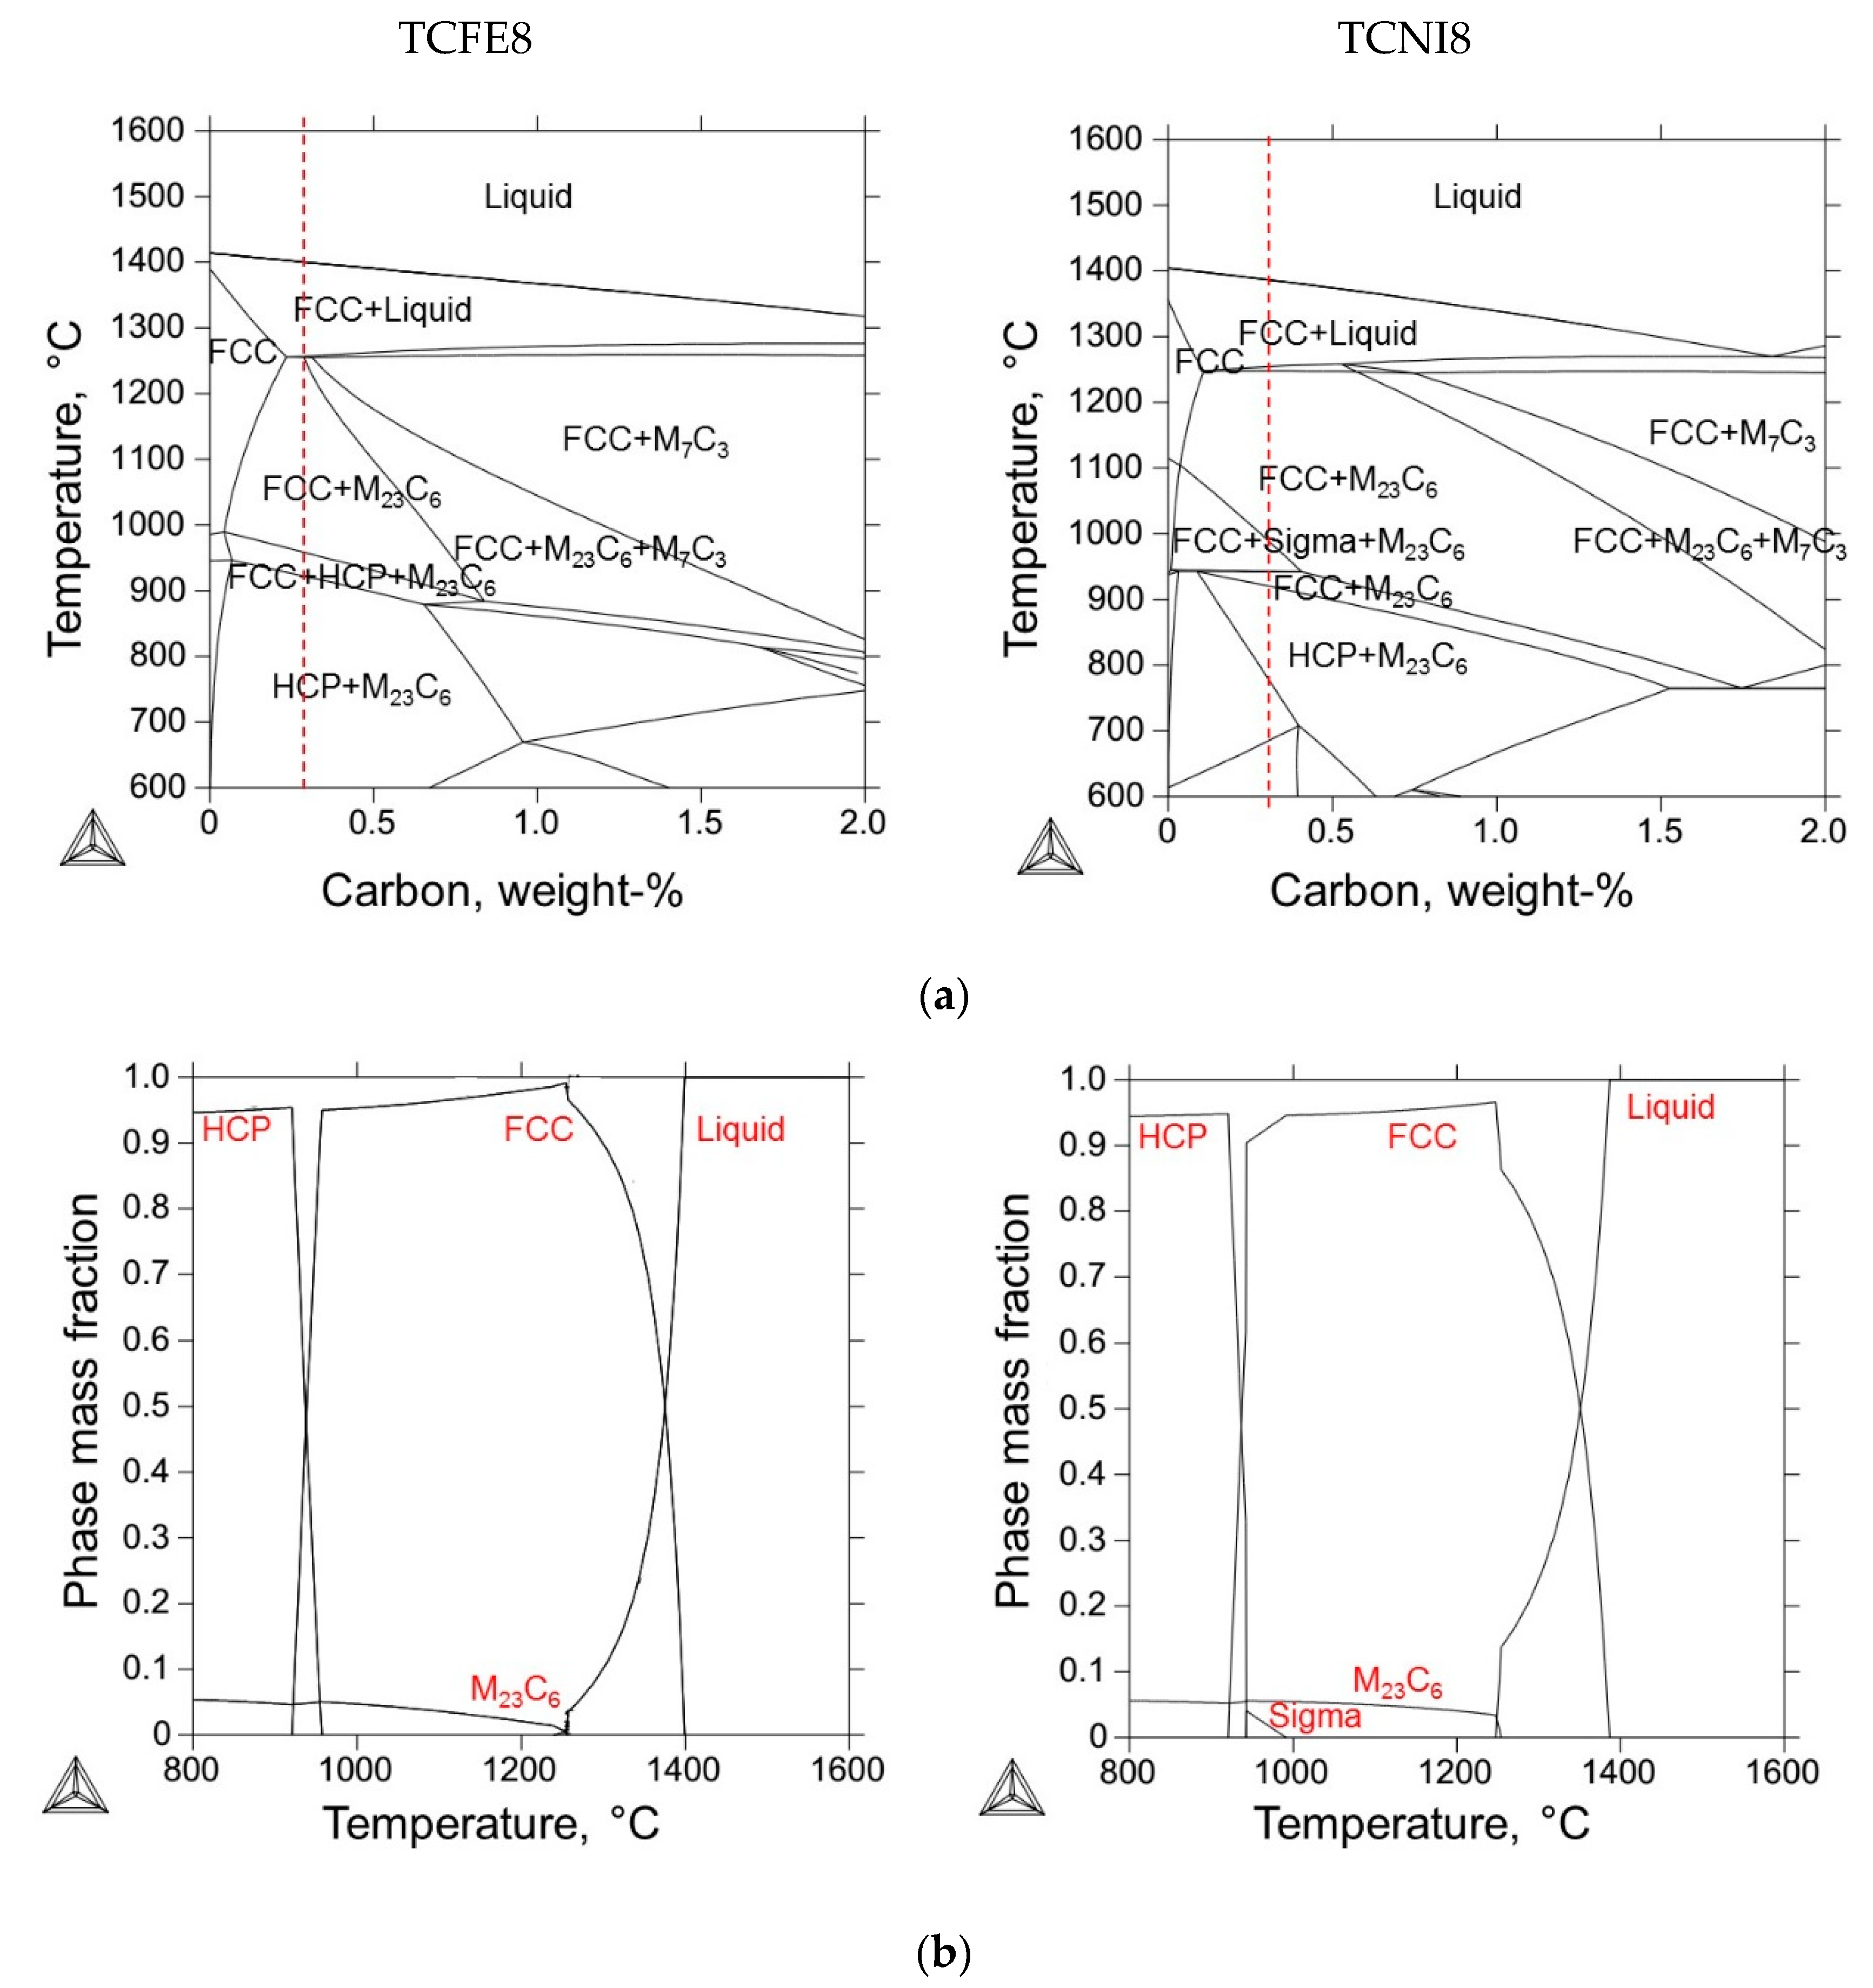
We used the thermodynamic databases, TCFE8 and TCNI8, for calculations with the ThermoCalc software. Despite observing similarities for the phase transformations at similar temperatures, we also observed some differences, such as the appearance of the sigma phase formation according to the TCNI8 database. The FCC phase also calculated the FCC_L12 and FCC_A1 structures.
(2).
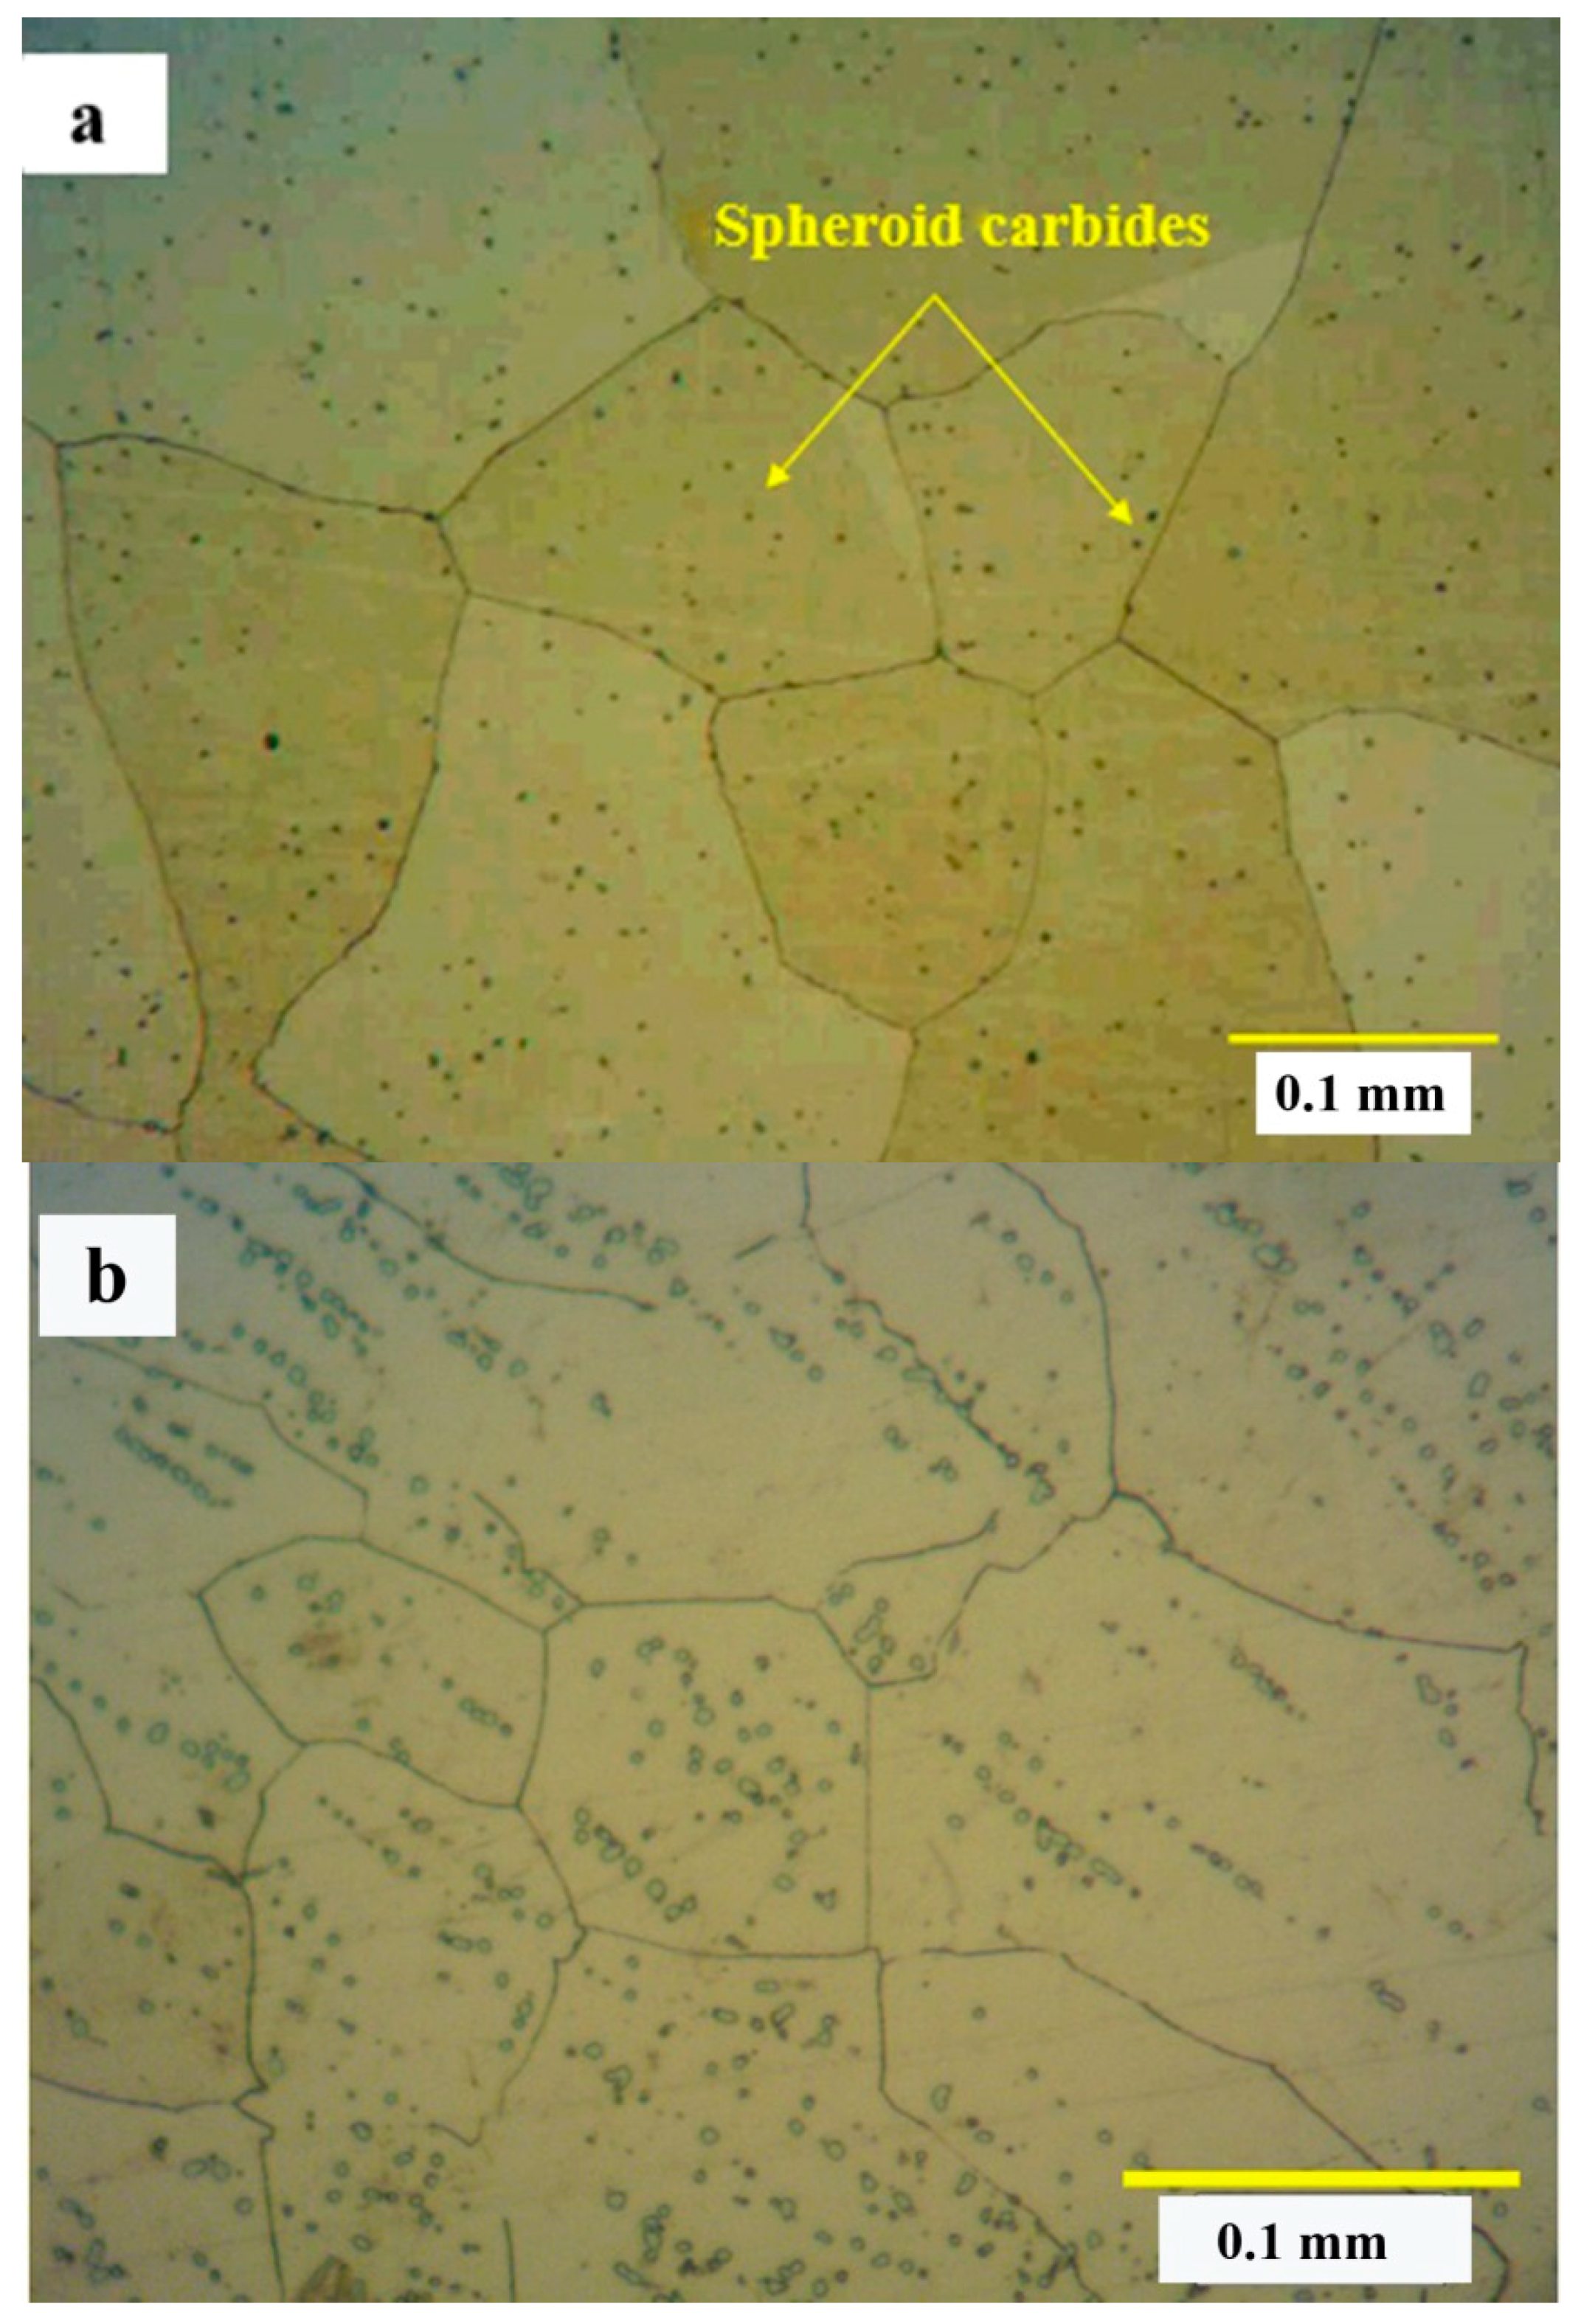
Solution treatment at 1230 °C for 3 h resulted in the nearly fully solution of carbides, whilst solution treatment at 1200 °C for 1 h caused most of the primary carbides to remain in the matrix in an undissolved condition. The thermodynamic calculations were also consistent with the experimental results. Based on the calculations, ~1.7–4.3% of the carbides should be present at 1200 °C and 1230 °C.
(3).
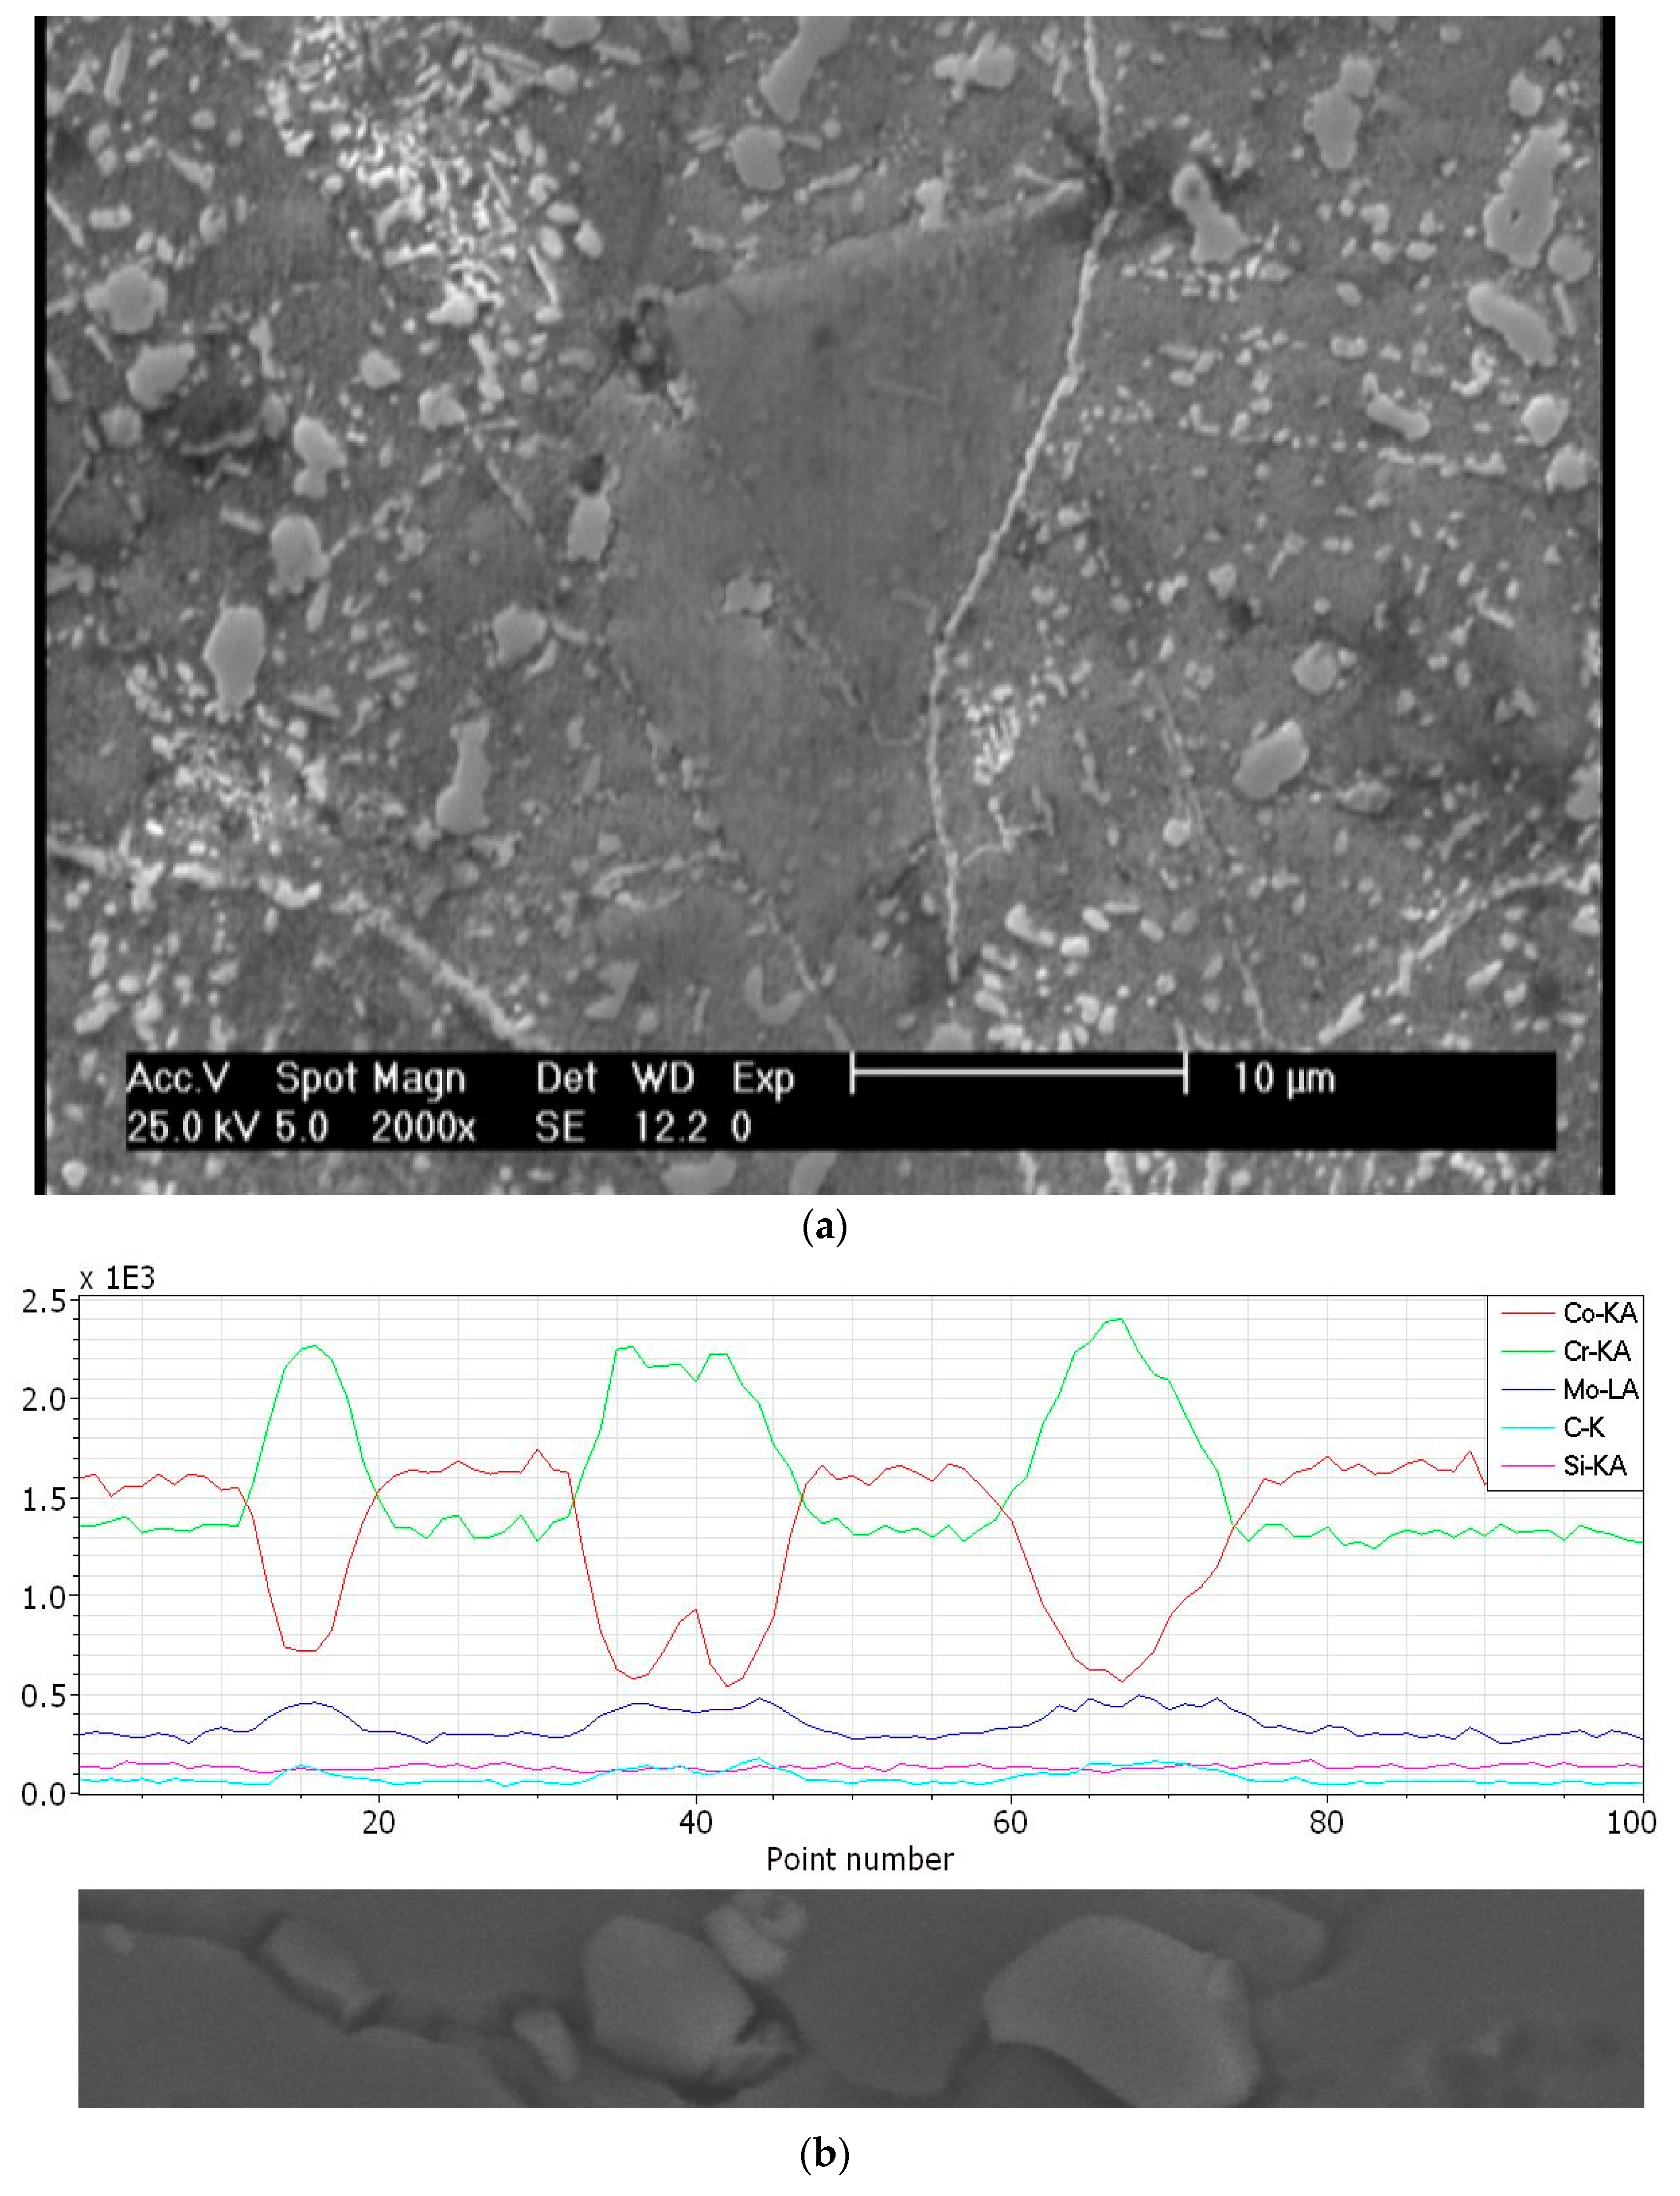
The undissolved carbides of Cr, Mo, and Co have significant effects on the microstructural and mechanical characteristics of the solution treated and aged sample.
(4).
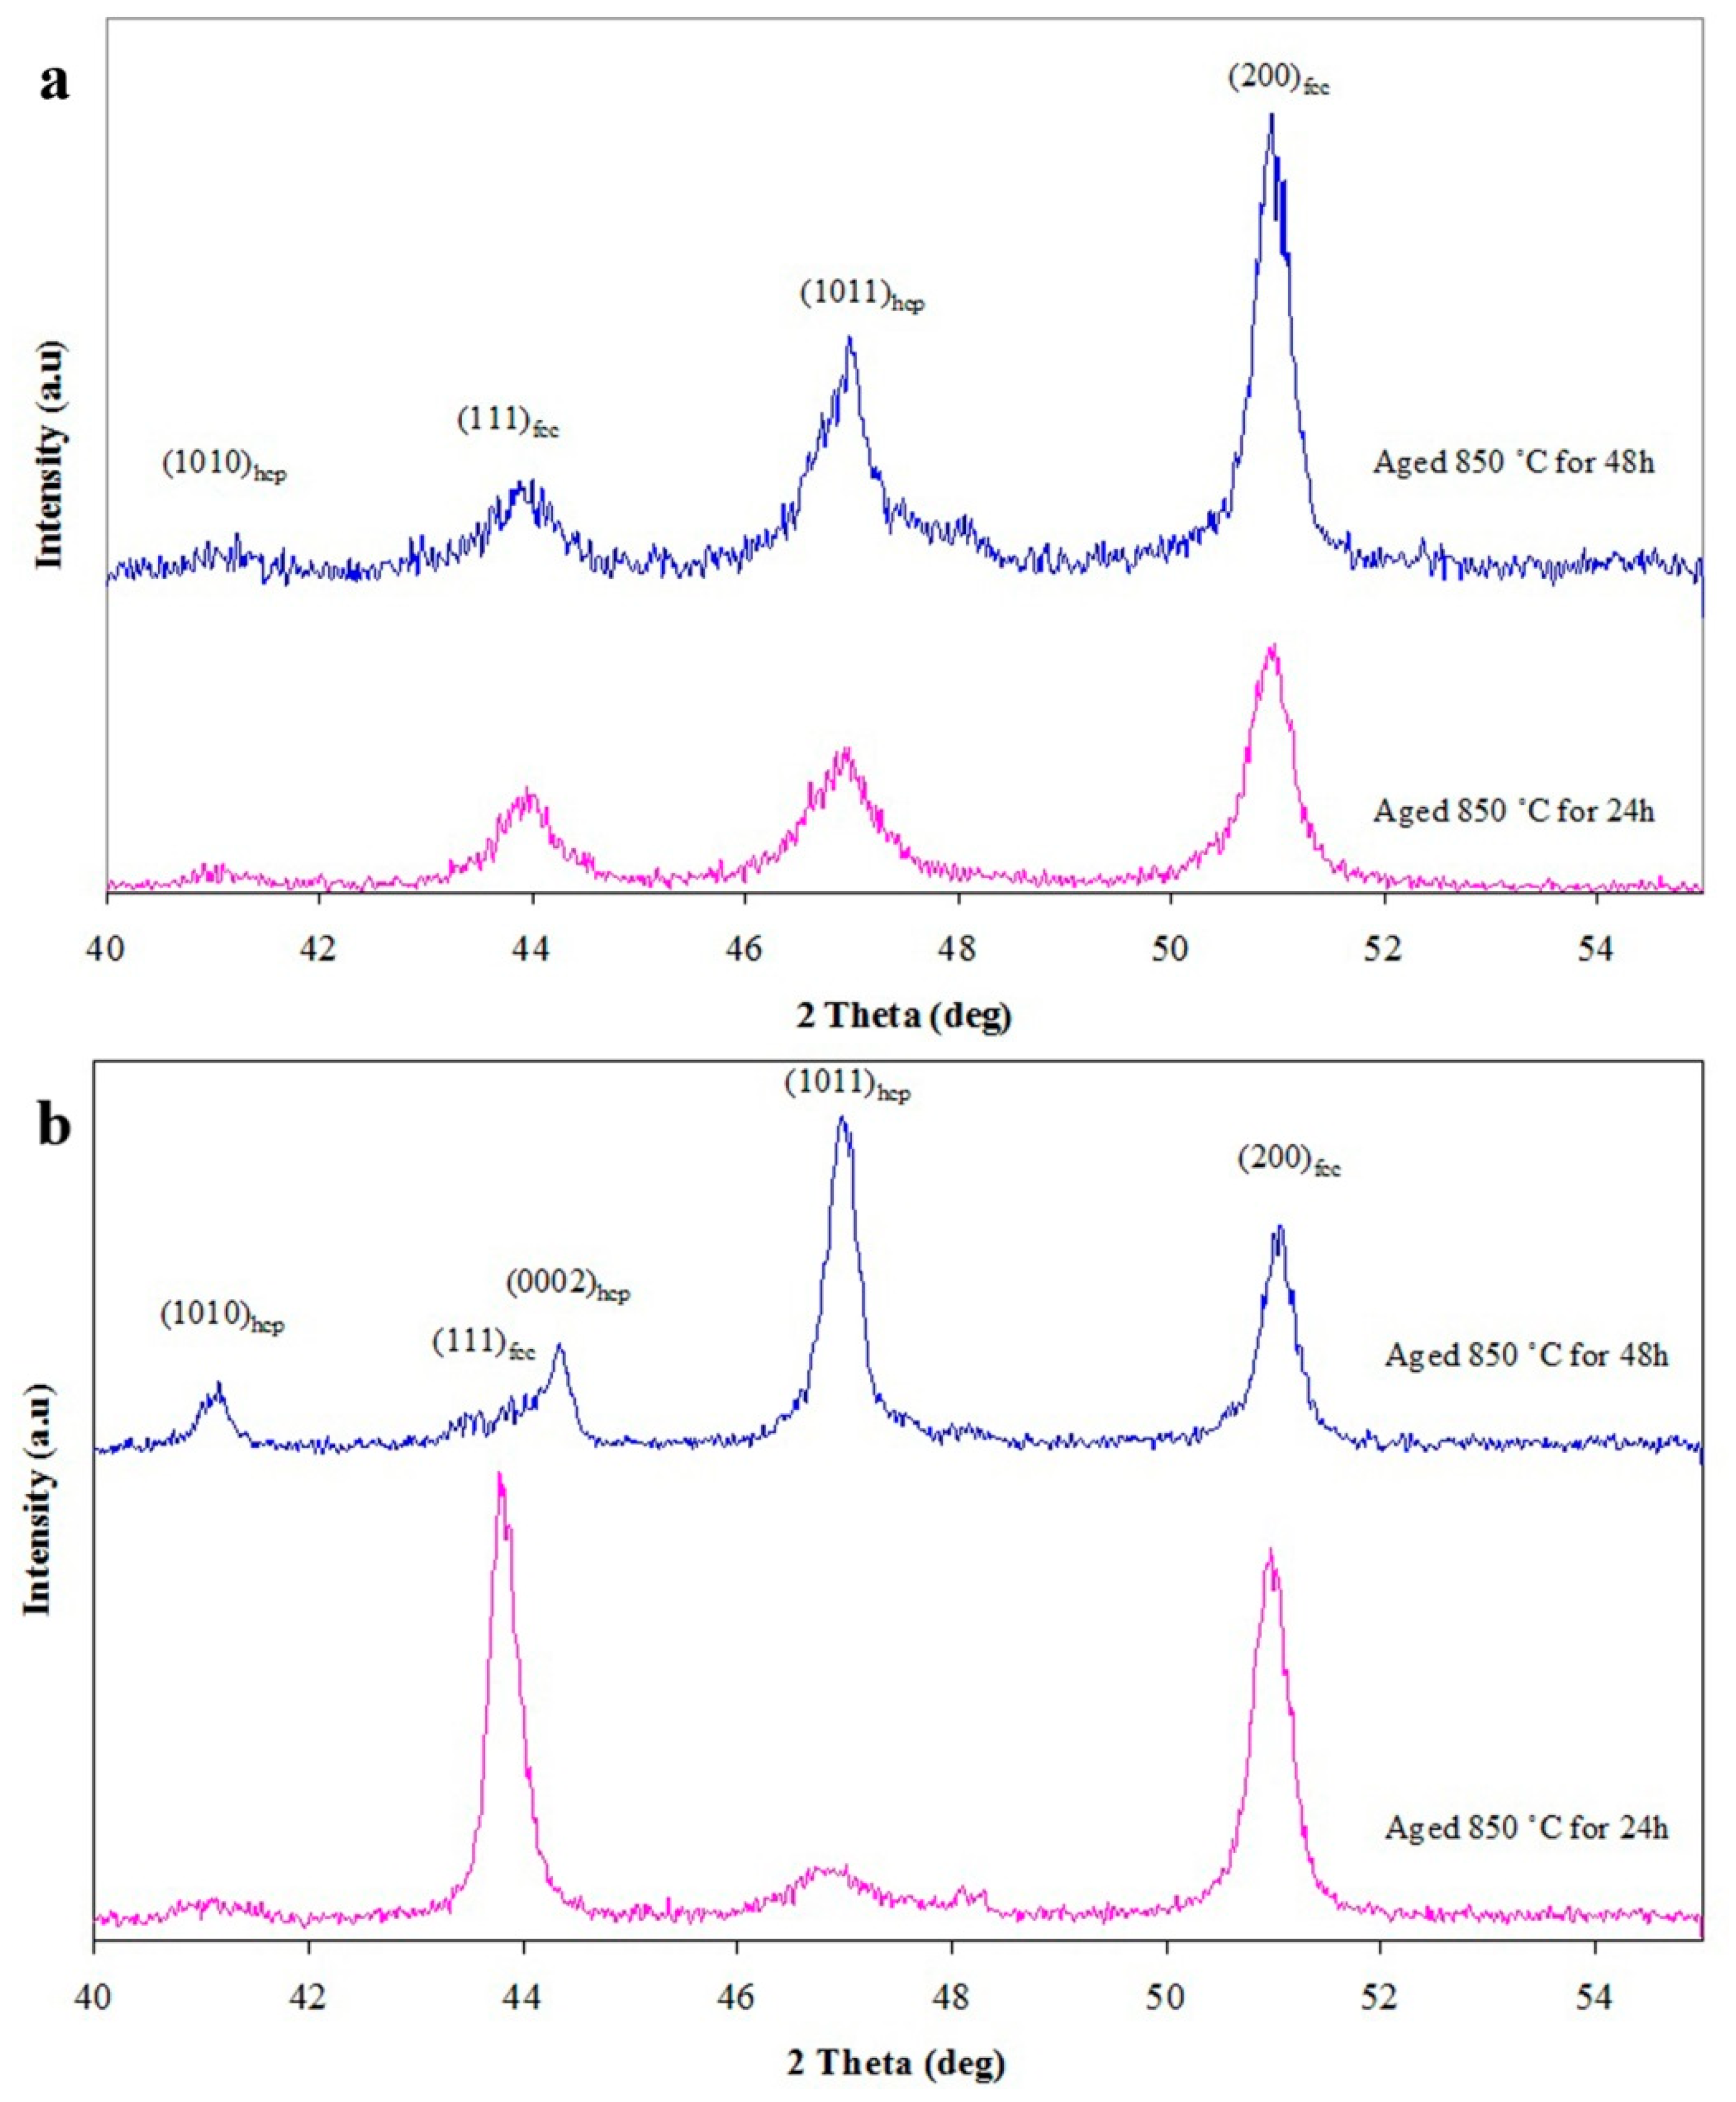
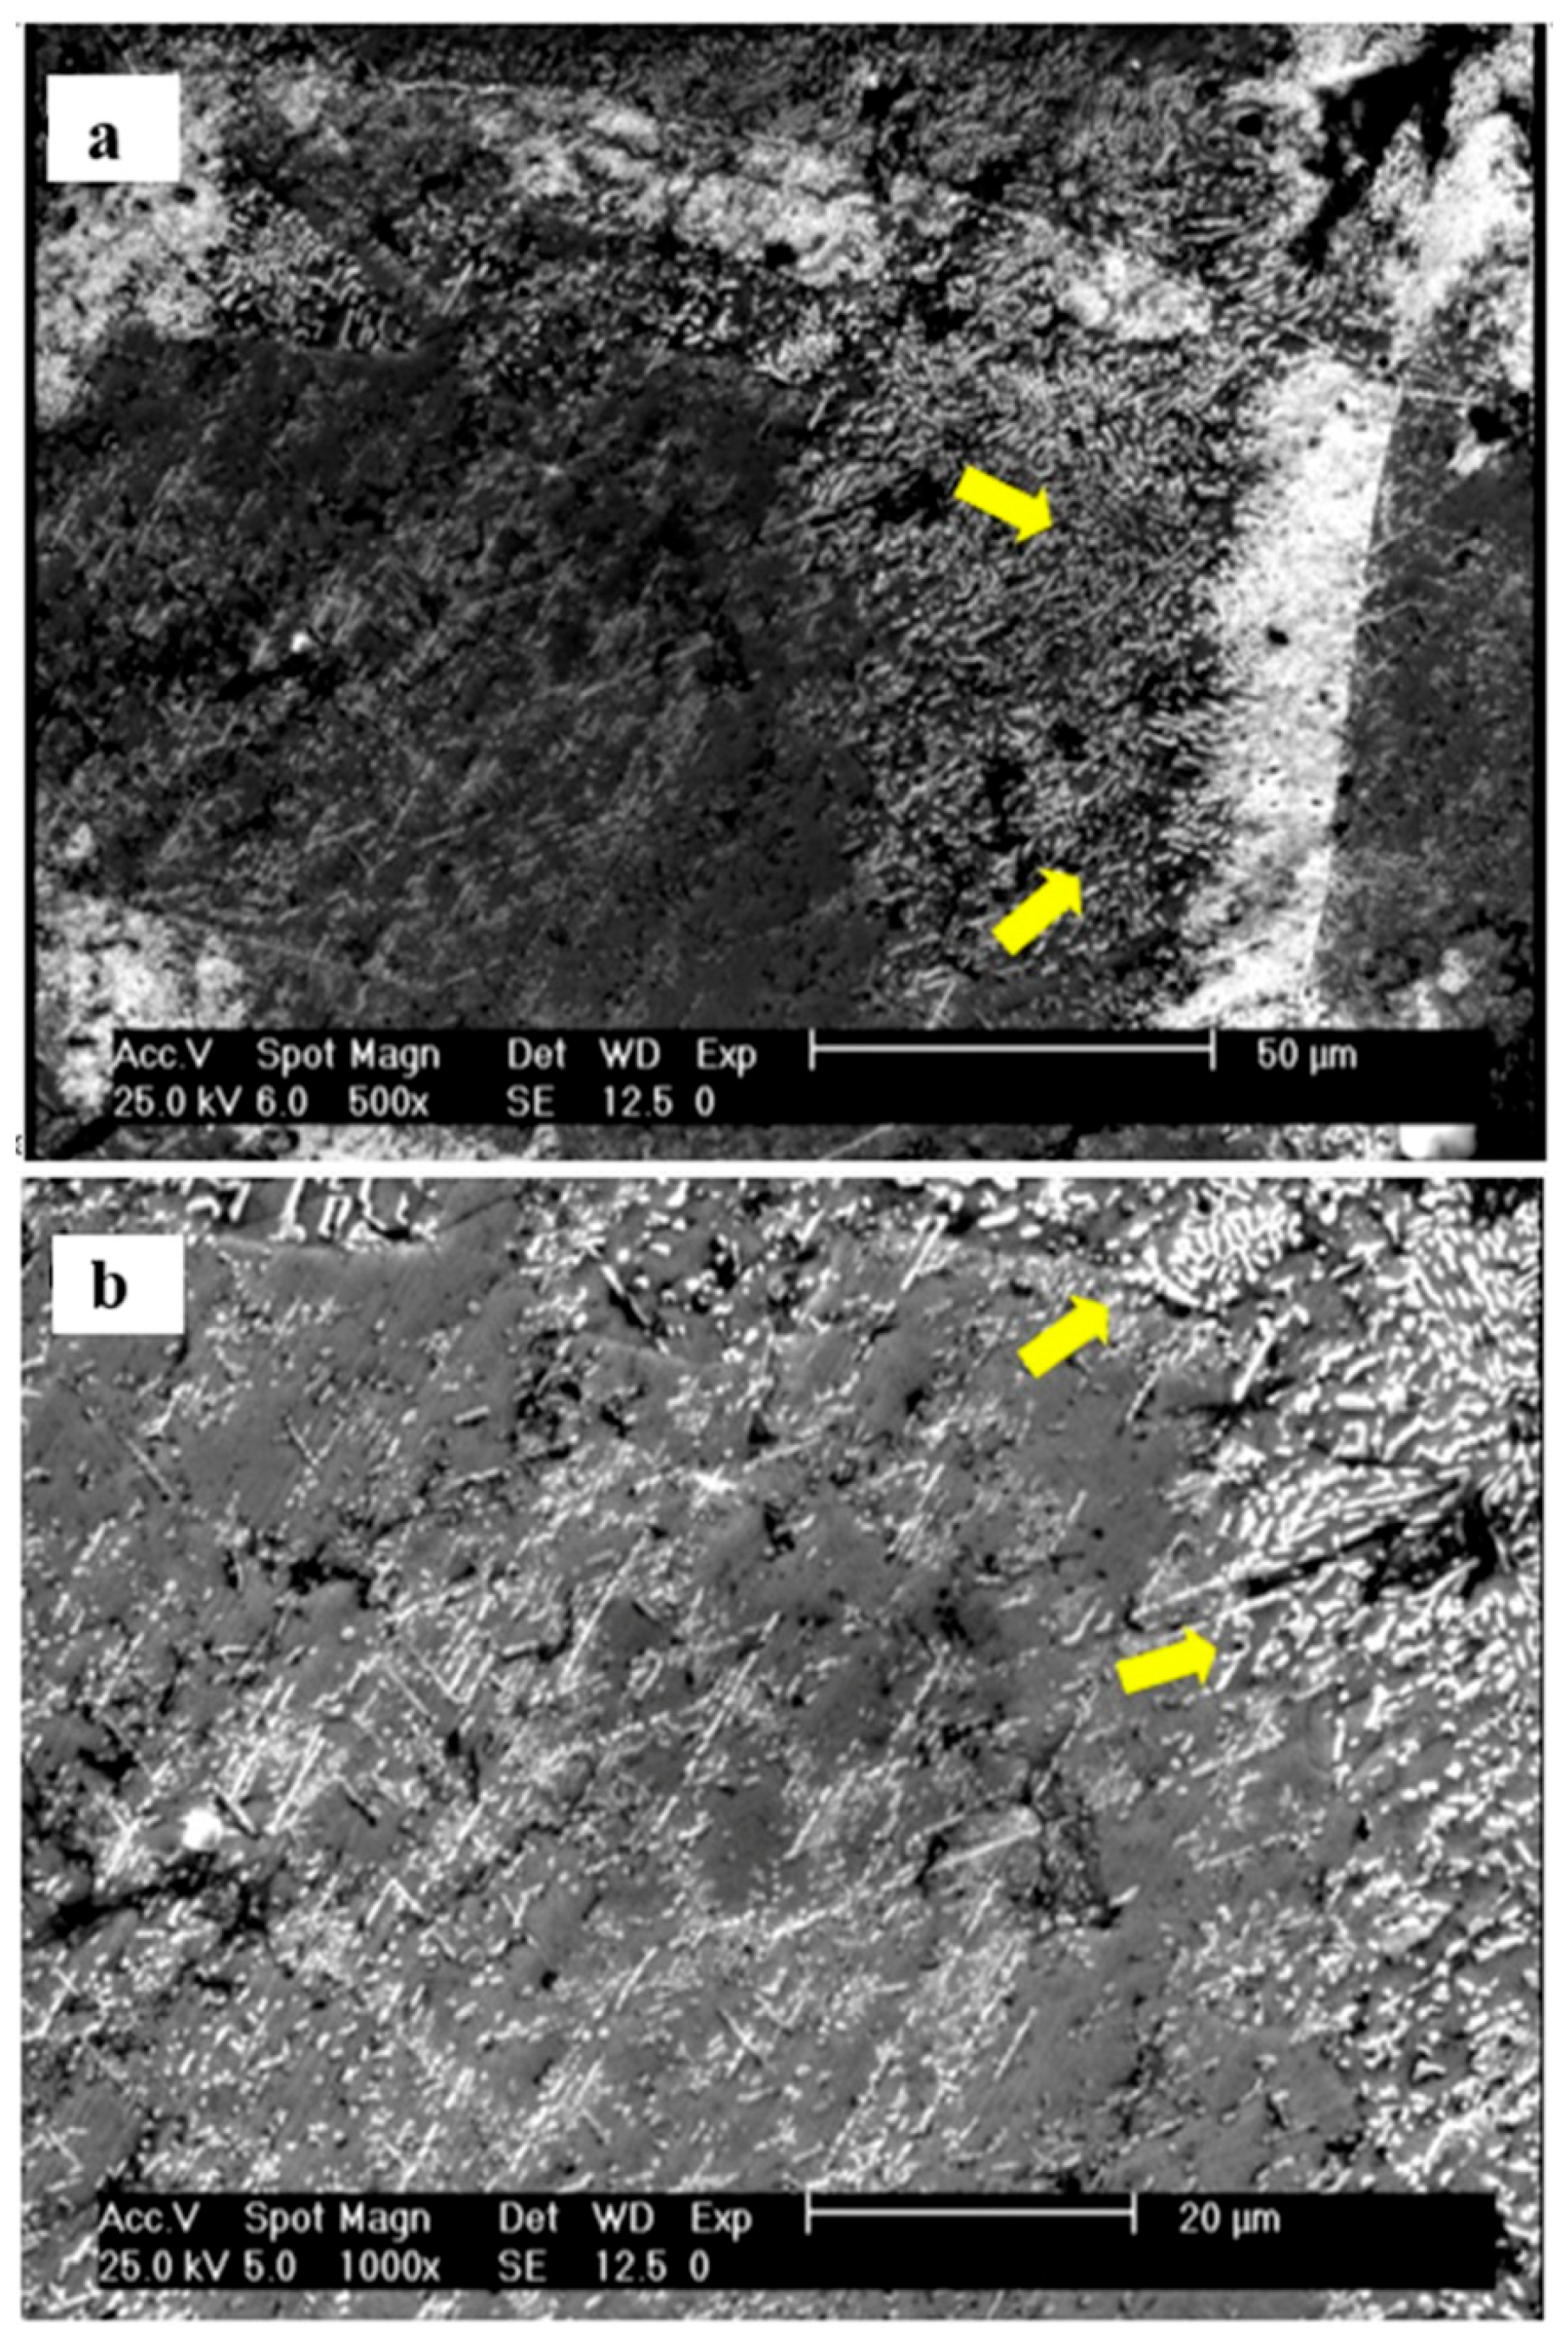
Aging of the nearly fully solution treated sample resulted in the development of HCP1 (straight bands) and HCP2 (lamellar-type constitution) phases, but aging of the partially solution treated sample resulted in formation of the HCP2 phase (lamellar-type constitution) at the grain boundaries.
(5).
The presence of undissolved carbides of Cr, Mo, and Co depletes the matrix from the HCP stabilizer elements, and it consequently enhances the FCC peak intensity of the substance after quenching. However, the FCC matrix changes more intensively compared to the HCP during aging. Thermodynamical calculations also indicated a decrease of the Cr and C amount in the FCC phase, with increasing solution temperatures.
(6).
The hardness enhancement as a result of aging for the sample solution treated at 1230 °C for 3 h was lower than that for the sample solution treated at 1200 °C for 1 h.

Author Contributions

Experimental measurements: S.Z., and M.A.; Computational research: E.E., and A.R.; validation: M.A., and A.R.; analysis: S.Z., and E.E.; writing—original draft preparation: S.Z., and E.E.; writing—review and editing: M.A., and A.R.; and supervision: A.R.

Funding

This research received no external funding.

Conflicts of Interest

The authors declare no conflict of interest.

References

  1. Saldívar, A.J.; López, H.F. Role of aging on the martensitic transformation in a cast cobalt alloy. Scr. Mater. 2001, 45, 427–433. [Google Scholar] [CrossRef]
  2. Julián, L.C.; Muñoz, A.L. Influence of microstructure of HC CoCrMo biomedical alloys on the corrosion and wear behaviour in simulated body fluids. Tribol. Int. 2011, 44, 318–329. [Google Scholar] [CrossRef]
  3. Huang, P.; López, H.F. Athermal ε-martensite in a Co–Cr–Mo alloy: Grain size effects. Mater. Lett. 1999, 39, 249–253. [Google Scholar] [CrossRef]
  4. Montero-Ocampo, C.; Lopez, H.; Talavera, M. Effect of alloy preheating on the mechanical properties of as-cast Co-Cr-Mo-C alloys. Metall. Mater. Trans. A 1999, 30, 611–620. [Google Scholar] [CrossRef]
  5. Zangeneh, S.; Lashgari, H.R.; Saghafi, M.; Karshenas, M. Effect of isothermal aging on the microstructural evolution of Co–Cr–Mo–C alloy. Mater. Sci. Eng. A 2010, 527, 6494–6500. [Google Scholar] [CrossRef]
  6. Lashgari, H.R.; Zangeneh, S.; Hasanabadi, F.; Saghafi, M. Microstructural evolution during isothermal aging and strain-induced transformation followed by isothermal aging in Co-Cr-Mo-C alloy: A comparative study. Mater. Sci. Eng. A 2010, 527, 4082–4091. [Google Scholar] [CrossRef]
  7. López, H.F.; Saldivar-Garcia, A.J. Martensitic Transformation in a Cast Co-Cr-Mo-C Alloy. Metall. Mater. Trans. A 2008, 39, 8–18. [Google Scholar] [CrossRef]
  8. Thermo-Calc TCC Software Users Guide, Version S. Available online: https://www.thermocalc.com/media/8136/tcc_usersguide.pdf (accessed on 17 May 2019).
  9. Yamanaka, K.; Mori, M.; Chiba, A. Effects of carbon concentration on microstructure and mechanical properties of as-cast nickel-free Co–28Cr–9W-based dental alloys. Mater. Sci. Eng. C 2014, 40, 127–134. [Google Scholar] [CrossRef] [PubMed]
  10. Yamanaka, K.; Mori, M.; Sato, K.; Chiba, A. Characterisation of nanoscale carbide precipitation in as-cast Co–Cr–W-based dental alloys. J. Mater. Chem. B 2016, 4, 1778–1786. [Google Scholar] [CrossRef]
  11. Kurosu, S.; Matsumoto, H.; Chiba, A. Isothermal phase transformation in biomedical Co-29Cr-6Mo alloy without addition of carbon or nitrogen. Metall. Mater. Trans. A 2010, 41, 2613–2625. [Google Scholar] [CrossRef]
  12. Koßmann, J.; Zenk, C.H.; Lopez-Galilea, I.; Neumeier, S.; Kostka, A.; Huth, S.; Hammerschmidt, T. Microsegregation and precipitates of an as-cast Co-based superalloy—microstructural characterization and phase stability modelling. J. Mater. Sci. 2015, 50, 6329–6338. [Google Scholar] [CrossRef]
  13. Salam, S.; Hou, P.Y.; Zhang, Y.D.; Zhang, X.H.; Wang, H.F.; Zhang, C.; Yang, Z.G. Microstructural modelling solution for complex Co based alloys and coatings. Surf. Coat. Technol. 2013, 236, 510–517. [Google Scholar] [CrossRef]
  14. Thermodynamic database TCFE8-TCS Steels/Fe-alloys database (v.8.0) for Thermo-Calc. Available online: www.thermocalc.com (accessed on 17 May 2019).
  15. Thermodynamic database TCNI8-TCS Ni-based Superalloys Database (v.8.0) for Thermo-Calc. Available online: www.thermocalc.com (accessed on 17 May 2019).
  16. Zangeneh, S.; Farhangi, H. Influence of service-induced microstructural changes on the failure of a cobalt-based superalloy first stage nozzle. Mater. Des. 2010, 31, 3504–3511. [Google Scholar] [CrossRef]
  17. Sage, M.; Gillaud, C. Méthode d’analyse quantitative des variétés allotropiques du cobalt par les rayons X. Rev. Met. 1950, 49, 139–145. [Google Scholar] [CrossRef]
  18. Bleck, W. Material Science of Steel: Textbook for RWTH Students; Mainz: Aachen, Germany, 2007. [Google Scholar]
  19. Koizumi, Y.; Suzuki, S.; Yamanaka, K.; Lee, B.-S.; Sato, K.; Li, Y.; Kurosu, S.; Matsumoto, S.; Chiba, A. Strain-induced martensitic transformation near twin boundaries in a biomedical Co–Cr–Mo alloy with negative stacking fault energy. Acta Mater. 2013, 61, 1648–1661. [Google Scholar] [CrossRef]
  20. Ramírez, L.E.; Castro, M.; Méndez, M.; Lacaze, J.; Herrera, M.; Lesoult, G. Precipitation path of secondary phases during solidification of the Co–25.5%Cr–5.5%Mo–0.26%C alloy. Scr. Mater. 2002, 47, 811–816. [Google Scholar] [CrossRef]
  21. Zangeneh, S.; Ketabchi, M. Grain refinement by pearlitic-type constituents in Co–28Cr–5Mo–0.3C alloy. Mater. Lett. 2013, 94, 206–209. [Google Scholar] [CrossRef]
  22. Sims, C.T.; Stoloff, N.S.; Hagel, W.C. Superalloys II; Wiley: New York, NY, USA, 1987. [Google Scholar]
Figure 1. (a) Optical microscopy OM micrograph of the as-cast sample contained dendrite microstructure, and (b) Scanning electron microscopy (SEM) micrograph of the primary carbides.
Metals 09 00581 g001
Figure 2. Calculated (a) isopleth and (b) phase amounts for Co- C-0.261 Si-0.29 Mn-1.47 Cr-0.0474 Ni steel using the Thermo-Calc TCFE8 and TCNI8 databases.
Metals 09 00581 g002
Figure 3. Microstructure of (a) the sample solution treated at 1230 °C for 3 h and (b) the sample solution treated at 1200 °C for 1 h.
Metals 09 00581 g003
Figure 4. Microstructure of the sample solution treated at 1230 °C for 3 h, followed by quenching and aging at 850 °C for (a) 24 h and (b) 48 h.
Metals 09 00581 g004aMetals 09 00581 g004b
Figure 5. X-ray diffraction patterns of (a) the sample solution treated at 1230 °C for 3 h and aged at 850 °C for 24 and 48 h, (b) the sample solution treated at 1200 °C for 1 h and aged at 850 °C for 24 and 48 h.
Metals 09 00581 g005
Figure 6. SEM micrographs of the sample solution treated at 1230 °C for 3 h and aged at 850 °C for 48 h, (a) lamellar carbides (b) progressive formation of carbides on the HCP1 phase during aging.
Metals 09 00581 g006
Figure 7. Microstructure of the sample solution treated at 1200 °C for 1 h and aged at 850 °C for (a) 24 h and (b) 48 h.
Metals 09 00581 g007
Figure 8. SEM micrographs of the partially solution treated sample, that was aged at 850 °C for 48 h, (a) un-dissolved primary carbides, (b) EDS analysis of the un-dissolved carbides along a line transmits within the un-dissolved carbides.
Metals 09 00581 g008
Table 1. Chemical composition of the studied cobalt alloy (wt. %).
%Cr%Mo%C%Si%Co
2850.31.5Balance
Table 2. Calculated phase transformation temperatures using the TCFE8 and TCNI8 databases.
DatabaseTemperature, °C
LiquidusSolidusM23C6HCPSigma
TCFE8139912551260921 °C-
TCNI8138012481255942 °C950 °C
Table 3. Calculated phase compositions and phase fractions at 850 °C obtained using the TCNI8 and TCFE8 databases.
DatabaseHCPM23C6
Phase vol.-%wt.-% in HCPPhase vol.-%wt.-% in M23C6
CrMoCCrMoC
TCFE894.3625.844.280.0375.6467.8518.325.237
TCNI893.9825.684.320.0176.0267.9916.645.182
Table 4. Equilibrium compositions and volume fractions of the FCC and M23C6 at 1200 °C and 1230 °C.
Temperature, °CDatabaseFCCM23C6
Phase vol.-%wt.-% in FCCPhase vol.-%wt.-% in M23C6
CrMoCCrMoC
1200TCFE897.7527.134.860.1932.2568.3911.655.282
1200TCNI895.6726.374.670.0914.3366.6115.425.249
1230TCFE898.3127.354.910.2201.6969.0910.795.299
1230TCNI896.0726.544.720.1113.9266.4512.385.255
Table 5. Microhardness values (VHN) of the studied alloys for different states.
Solution TreatmentSolutionized and QuenchedAged at 850 °C for 24 hAged at 850 °C for 48 h
1230 °C for 3 h380 ± 10520 ± 15530 ± 25
1200 °C for 1 h410 ± 15647 ± 23705 ± 30

