Article

Petrological Study of Ferrous Burden-Crucible Interaction in Softening & Melting Experiments: Implications for the Relevance of Pressure Drop Measurements

Tata Steel, PO Box 10.000, 1970 CA IJmuiden, The Netherlands
*
Author to whom correspondence should be addressed.
Metals 2018, 8(12), 1082; https://doi.org/10.3390/met8121082
Submission received: 27 November 2018 / Revised: 13 December 2018 / Accepted: 17 December 2018 / Published: 19 December 2018
(This article belongs to the Special Issue Selected Papers from 8th ICSTI 2018)

Abstract

:
Numerous tests are used worldwide to investigate the advanced high temperature reduction, softening, and melting (S&M) of blast furnace ferrous burden material. Commonly, the curve of pressure drop (dP) against temperature, measured over the experimental charge, is taken as directly indicative of the evolution of ferrous layer permeability. Previous authors have expressed concerns about the reproducibility and practical relevance of dP measurements due to narrow crucible diameter and wall effects. Petrological study of samples from interrupted Advanced Softening and Melting (ASAM) experiments, performed with ferrous burdens comprising a mixture of pellets (C/S 0.1–0.7) and highly basic sinter (C/S 2.4–3.5), sheds light on the nature and controlling mechanisms of systematic artefacts influencing the measurement of dP. The observations imply that the dP-T curves in ASAM, and likely other similar S&M, tests most immediately reflect the varying ease of gas flow in a sidewall bypass around the qualitatively impermeable ferrous burden layer, rather than through it. This is controlled by the formation of diverse oxide(-slag)-metal segregations at the exterior of the ferrous burden layer. The potential correlation of parameters derived from dP measurements with input burden characteristics is not in itself sufficient evidence that the measurements are indicative of the ferrous layer permeability.

1. Introduction

Understanding the controls on permeability loss in the cohesive zone of the blast furnace is of key importance in optimising operational efficiency. To this end, numerous experimental simulations have been developed worldwide to investigate the behaviour of ferrous burden materials during advanced high temperature reduction, softening, and melting under load [1,2]. For convenience, these may be collectively referred to as ‘softening and melting’ or ‘S&M’ tests. Many S&M simulations have in common the measurement of pressure drop (dP) of gas forced through an experimental charge of ferrous burden material as it softens and melts with increasing temperature, though precise experimental conditions, setup, and procedure vary widely. In most such tests, the gas is forced vertically (either upwards or downwards) through an experimental burden charged into a vertical cylindrical crucible, hence perpendicular to the layer of interest [2]. Commonly, the shape and dimensions of the curve of dP against T (henceforth dP curve), measured over the experimental charge, are taken as directly indicative of key stages in the development of the cohesive zone in the BF process and the resulting loss of permeability that is associated with it [2]. Specifically, it has been argued [3] that the so-called ‘S-value’—the area that is integrated under the dP-T curve between certain key inflection points (generally the onset and end of an obvious peak in dP)—provides a relative proxy of the total resistance to gas flow that would be posed by the cohesive zone in the actual BF process for different burdens, or with different operating conditions. An obvious implicit assumption is that the measured dP curve is reliably indicative of changes in the permeability of the ferrous burden layer, i.e., that the apparent permeability (change) measured in the experiment can be regarded as representative of an internally uniform small cylindrical volume, which would enable the results to be translated to the industrial BF process [4]. Concerns over the reproducibility and practical relevance of dP measurements in S&M tests, as outlined above, have previously been expressed in literature [2,3,4,5]. Specifically, the inner diameter of the experimental crucible relative to the particle size of the input materials is of concern, and it has been proposed [3] that the ratio of the former to the latter should be at least 7:1 to reduce ‘wall effects’, while avoiding too large a diameter due to inhomogeneous temperature distribution. Unfortunately, we are not aware of any published study directly addressing the influence of variable crucible diameter on dP measurements, nor of any detailed discussion of the ‘wall effects’ alluded to and the direct physical-chemical mechanisms involved. To address the second of these issues, we discuss here the implications for the immediate physical meaning of the measured dP curve, based on detailed petrological study of post-experimental samples from one such metallurgical simulation, the Advanced Softening and Melting (ASAM) test.

2. Materials and Methods

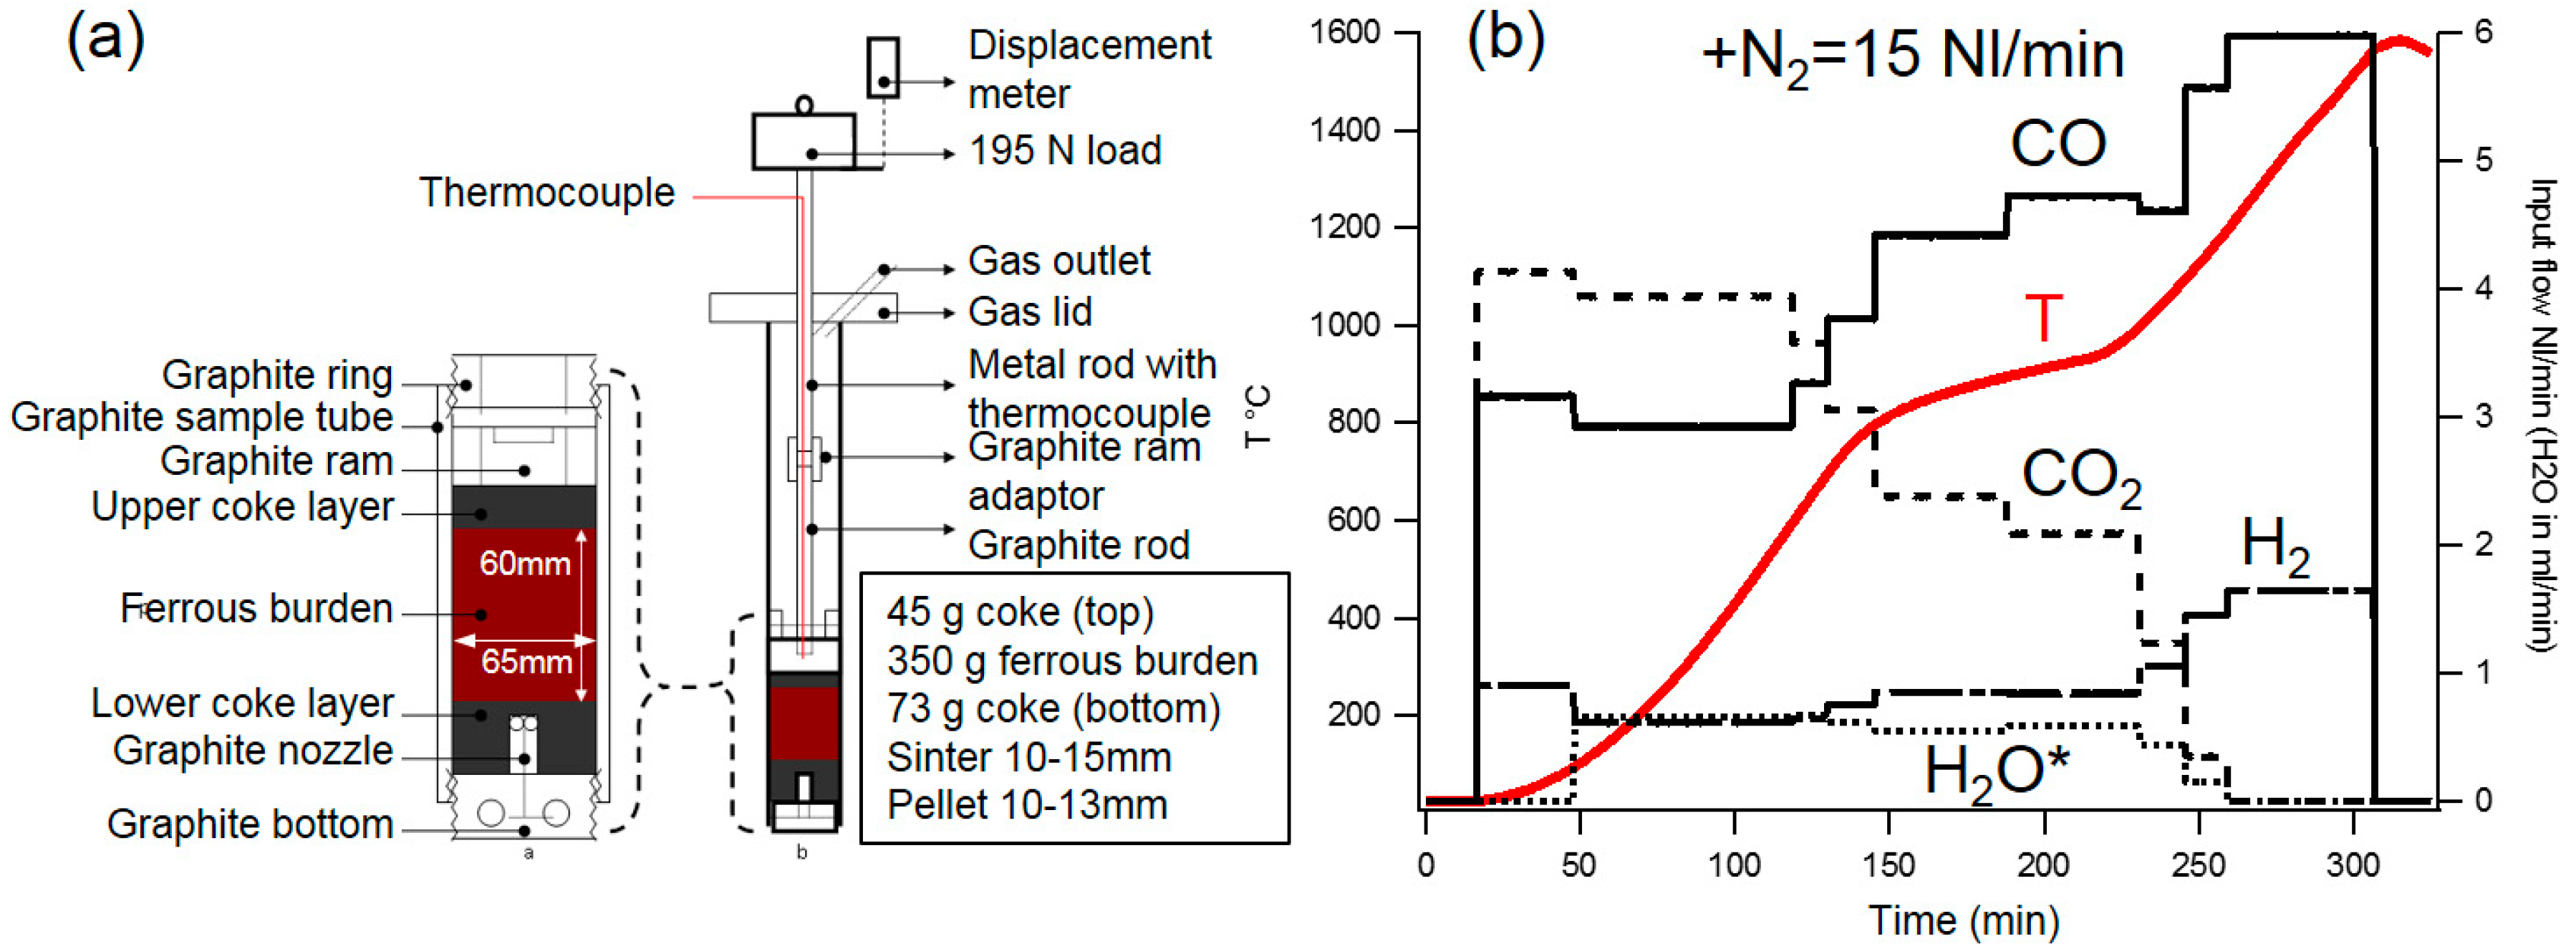
2.1. Experimental Setup and Procedure

The Advanced Softening and Melting (ASAM) simulation test used in this study [6] is adapted from that developed by Clixby and co-workers at British Steel in the 1980s [7,8]. Figure 1 shows a schematic of the experimental setup and the T and gas profile used in this study. A mixture of c. 350 g of screened sinter (10–15 mm) and pellets (10–13 mm) is charged in a graphite crucible between two layers of coke (c. 73 g bottom and 45 g top layer; screened to 5–10 mm particle size). The inner diameter of the crucible is 65 mm, which at 4.3 times the maximum sinter diameter falls far short of the ratio that was proposed by Tayama et al. [3]. The target ferrous layer thickness is 60 mm. Samples are heated under a progressive profile of reducing gas, intended to simulate conditions appropriate for a centre-working blast furnace with a coal injection rate of 200 kg/tHM. Total gas flow during the experiments is 15 normal litre/min (NL/min), with N2 making up the difference between this and the summed gas flows that are shown in Figure 1. During experiments, pressure drop (dP) over the charged material, vertical displacement (dh) indicating bed contraction, and chemistry of the off-gas are all continuously measured. Due to complications with water dosage and calibration, the off-gas analyses are insufficient for quantitative mass balance calculations. However, they are sufficient to note qualitatively (i.e., the timing of) the production of excess CO in the crucible by the consumption of solid carbon. Samples were not rapidly quenched, but they were cooled under a N2 atmosphere to minimise redox modification during a regulated cooling profile designed to protect the alumina furnace tube from thermomechanical damage. Furnace cooling rate was regulated to 5 K/min from peak temperature to 1100 °C and it was unregulated thereafter. Thermocouple measurements just above the sample indicate average cooling rate of approximately 5 K/min to 900 °C and gradually slowing cooling under this temperature. In addition to complete experiments, additional experiments were performed and interrupted at key points with respect to the dh and dP curves, as discussed in later sections.

2.2. Investigation of Post-Experimental Samples

Following cooling, experimental crucibles and their contents were impregnated with green-tinted EpoFix resin (Struers, Copenhagen, Denmark) and sectioned longitudinally for petrological investigation. Polished sections were prepared for characterisation with light optical microscopy (LOM) and scanning electron microscopy (SEM) with energy dispersive X-ray spectroscopy (EDS). LOM was carried out using a ZEISS AxioImager Z1 microscope with integrated ZEISS AxioVision software 4.9 (Carl Zeiss, Jena, Germany). Thereafter, the sample was coated with approximately 10 nm of carbon for SEM investigation. SEM-EDS analysis was performed with a JEOL JSM-7001F SEM (JEOL, Tokyo, Japan) equipped with two 30 mm2 SDD detectors and NORAN-System7 with NSS.3.3 software (Thermo Fisher Scientific, Madison, WI, USA). Manual point and area-raster analyses were used to identify and characterise the chemistry of individual phases and phase intergrowths. The accelerating voltage used was variously 10 or 15 kV for manual analyses, the beam current was approximately 3–5 nA, and the counting live-times 5–300 s, depending on the required analytical precision. Additionally, automated grid acquisitions of square, 0.5 mm-wide area rasters were used to map out meso-scale variations in local bulk chemistry. For these analyses, accelerating voltage was 15 kV, beam current approximately 3–5 nA and counting live-times 30–60 s. EDS spectra were converted to quantitative chemical analysis in standardless mode using Phi-Rho-Z correction. Equilibrium calculations have been performed with the thermochemical software package Factsage 7.2 [9,10] to aid in the interpretation of the observed structural and chemical features. Calculations were performed in the Equilib module, using the Factsage 7.2-integrated databases FactPS, FToxid and FSstel, respectively, for pure substances, oxide solution phases (including slag liquid) and metallic solution phases (including metal liquid).
Chemical compositions of the studied sinter-pellet burden mixtures and their constituent sinters and pellets are shown in Table 1. These three burdens comprise a mixture of highly basic industrial sinter (C/S 2.4–3.5) with (industrial) pellets. Burdens M1 and M2 have the least basic sinter and each include a mixture of two types of pellet, one of which in both cases is fluxed with olivine (PA), the second being (respectively) with limestone-dolomite (PB) or dolomite only (PC). Burden M3 has the most highly basic, and largest amount of sinter, combined with the most acid pellet (PD) fluxed with olivine. The normalised internal proportions of the slag components CaO, MgO, Al2O3, and SiO2 (the sum of which is hereafter referred to as CMAS) are broadly similar for the resultant burden mixtures M1–M3, with C/S ranging from 1.6–1.7, respectively. The total CMAS concentration in M3 is slightly higher than M1 and M2. A fourth burden mix, M4, was used for some of the experiments that are discussed here, with broadly similar individual sinter and pellet compositions as those for M1 but a different ratio of sinter to pellets, resulting in a substantially different CMAS composition with lower basicity (C/S 1.3).

3. Results

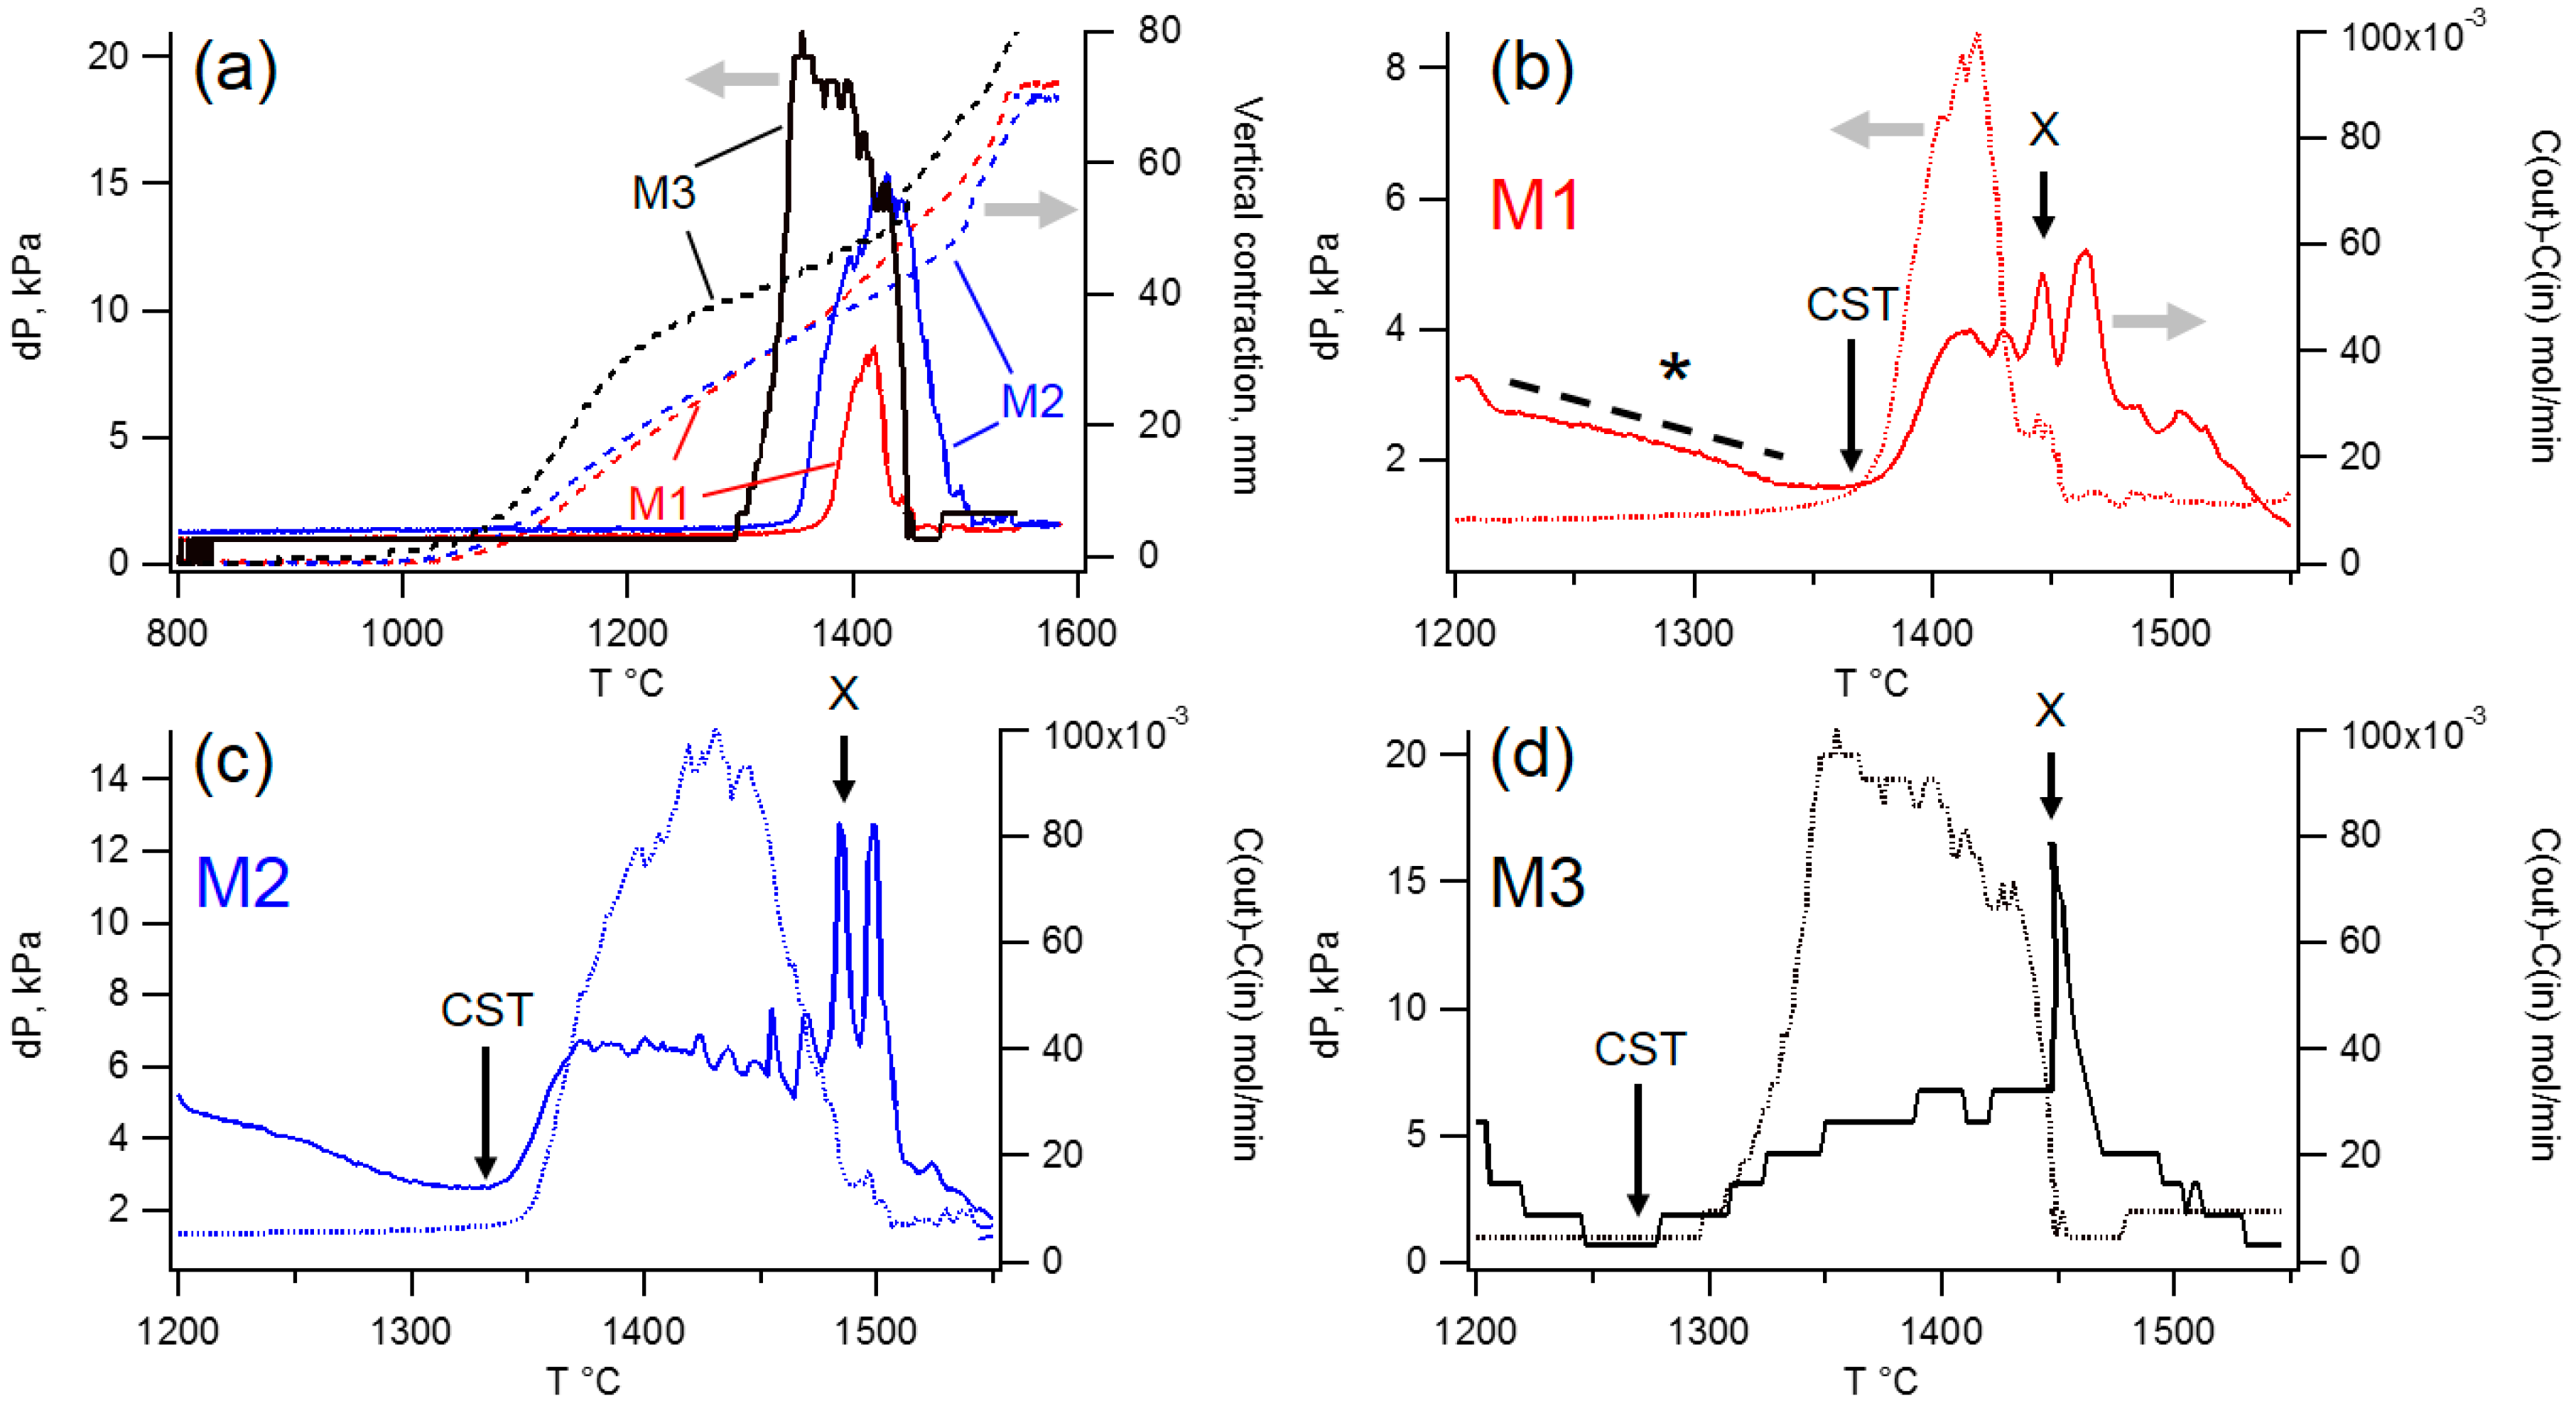
3.1. ASAM Experimental Results

Complete ASAM runs were performed for burden mixes M1–M3 and for all individual sinter and pellet types used. The resultant dP and vertical contraction curves are shown in Figure 2a. All of the burden mixes show a clear peak in dP with increasing T, which is passed by the end of the experiment. In all cases, the onset of the dP peak comes abruptly, after 33–40 mm of vertical contraction (around 47–51% of the final vertical contraction), with no significant change in dP being detected up until this point—a key observation that will be returned to later. Burden M3 shows the highest dP peak, with the lowest onset-T, while it also undergoes more vertical contraction at a lower T than the M1 and M2. The true onset T of bed contraction, based on inspection of the rate dh/dt against T (not shown) is similar in the three burdens, at around 1000 °C, and it is the higher contraction rate initially following this which distinguishes M3 from the other two burdens. After the onset of vertical contraction, the rate dh/dt clearly decreases in the leadup to the dP peak onset for burdens M2 and M3, remaining initially lower during the sharp increase in dP. Vertical contraction accelerates sharply at the very end of the dP peak, as dP arrives back at datum. M1, with the lowest and narrowest dP peak, shows a relatively constant rate of deformation in the leadup to, and through the dP peak, with an abrupt increase in dh/dt occurring only well after the return of dP to datum following its peak. In all cases, the final sharp acceleration in vertical contraction is interpreted to correspond with dripping down of molten burden material. While issues with calibration and experimental setup unfortunately prevent reliable quantitative mass balance calculation for these experiments, it is nevertheless possible to identify a clear anomaly in the off-gas analysis consistently corresponding with the onset of the dP peak for each burden mix (Figure 2b–d). This is entirely consistent with well-documented observations from Clixby [8], which he termed the ‘carbon start temperature’ (CST) and interpreted as the onset of significant direct reduction of molten, FeO-rich burden material in reaction with cokes and graphite. Moreover, for each burden, a sharp anomaly/set of spikes (marked x) is observed in the off-gas analysis corresponding consistently with the very final stages of the dP peak in each case. Such a peak was also noted by Clixby and was ascribed to late-stage reduction of the remaining FeO-rich liquid.
The key observations from the continuous ASAM measurements, of relevance to the mechanistic interpretation of the curves, are as follows. Bed deformation initiates in all burdens from around 1000 °C and slows somewhat prior to the onset of the dP peak. No significant change in dP is measured until vertical contraction is more than half that of the original ferrous layer thickness (60 mm). The onset of the dP peak corresponds consistently with the CST anomaly in off-gas analysis. The very final stages of the return of dP from the peak to datum correspond with another spike in off-gas analysis. In all cases, there is an abrupt increase in the vertical contraction rate at or after the return of dP to datum following the peak.

3.2. Petrological Investigation of Interrupted Experimental Samples

Experiments were repeated and interrupted at key moments relative to the dP and dh curves (Figure 3) to better understand the mechanisms that are behind the observed differences in ASAM results among the mixed burdens M1–M3. For these three burdens, experiments were interrupted at the onset T of the dP peak (point 2 in Figure 3) and as close as possible to the maximum in dP (point 3). For M2, an additional experiment was interrupted after around a 75% decrease in dP from the maximum (point 4). Extra experiments were later performed on burden M4 (see previous section), with interruption points at (1) 10% dh, (4) c. 75% decrease in dP from maximum, (5) return of dP to datum, and finally a complete run (see Figure 3).
Regular photographic imagery of the sectioned crucibles at interruption points 1–6 for burdens M1 and M4 is shown in Figure 3 to illustrate some of the key developments that are visible on the macro scale. Figure 4 shows a montage of LOM mosaic-overview imagery for samples from burdens M1–M3 (only) at interruption points 2, 3, and 4. Figure 5 shows LOM imagery of specific features of interest from these sections, as well as the sample for M4, interruption point 1.

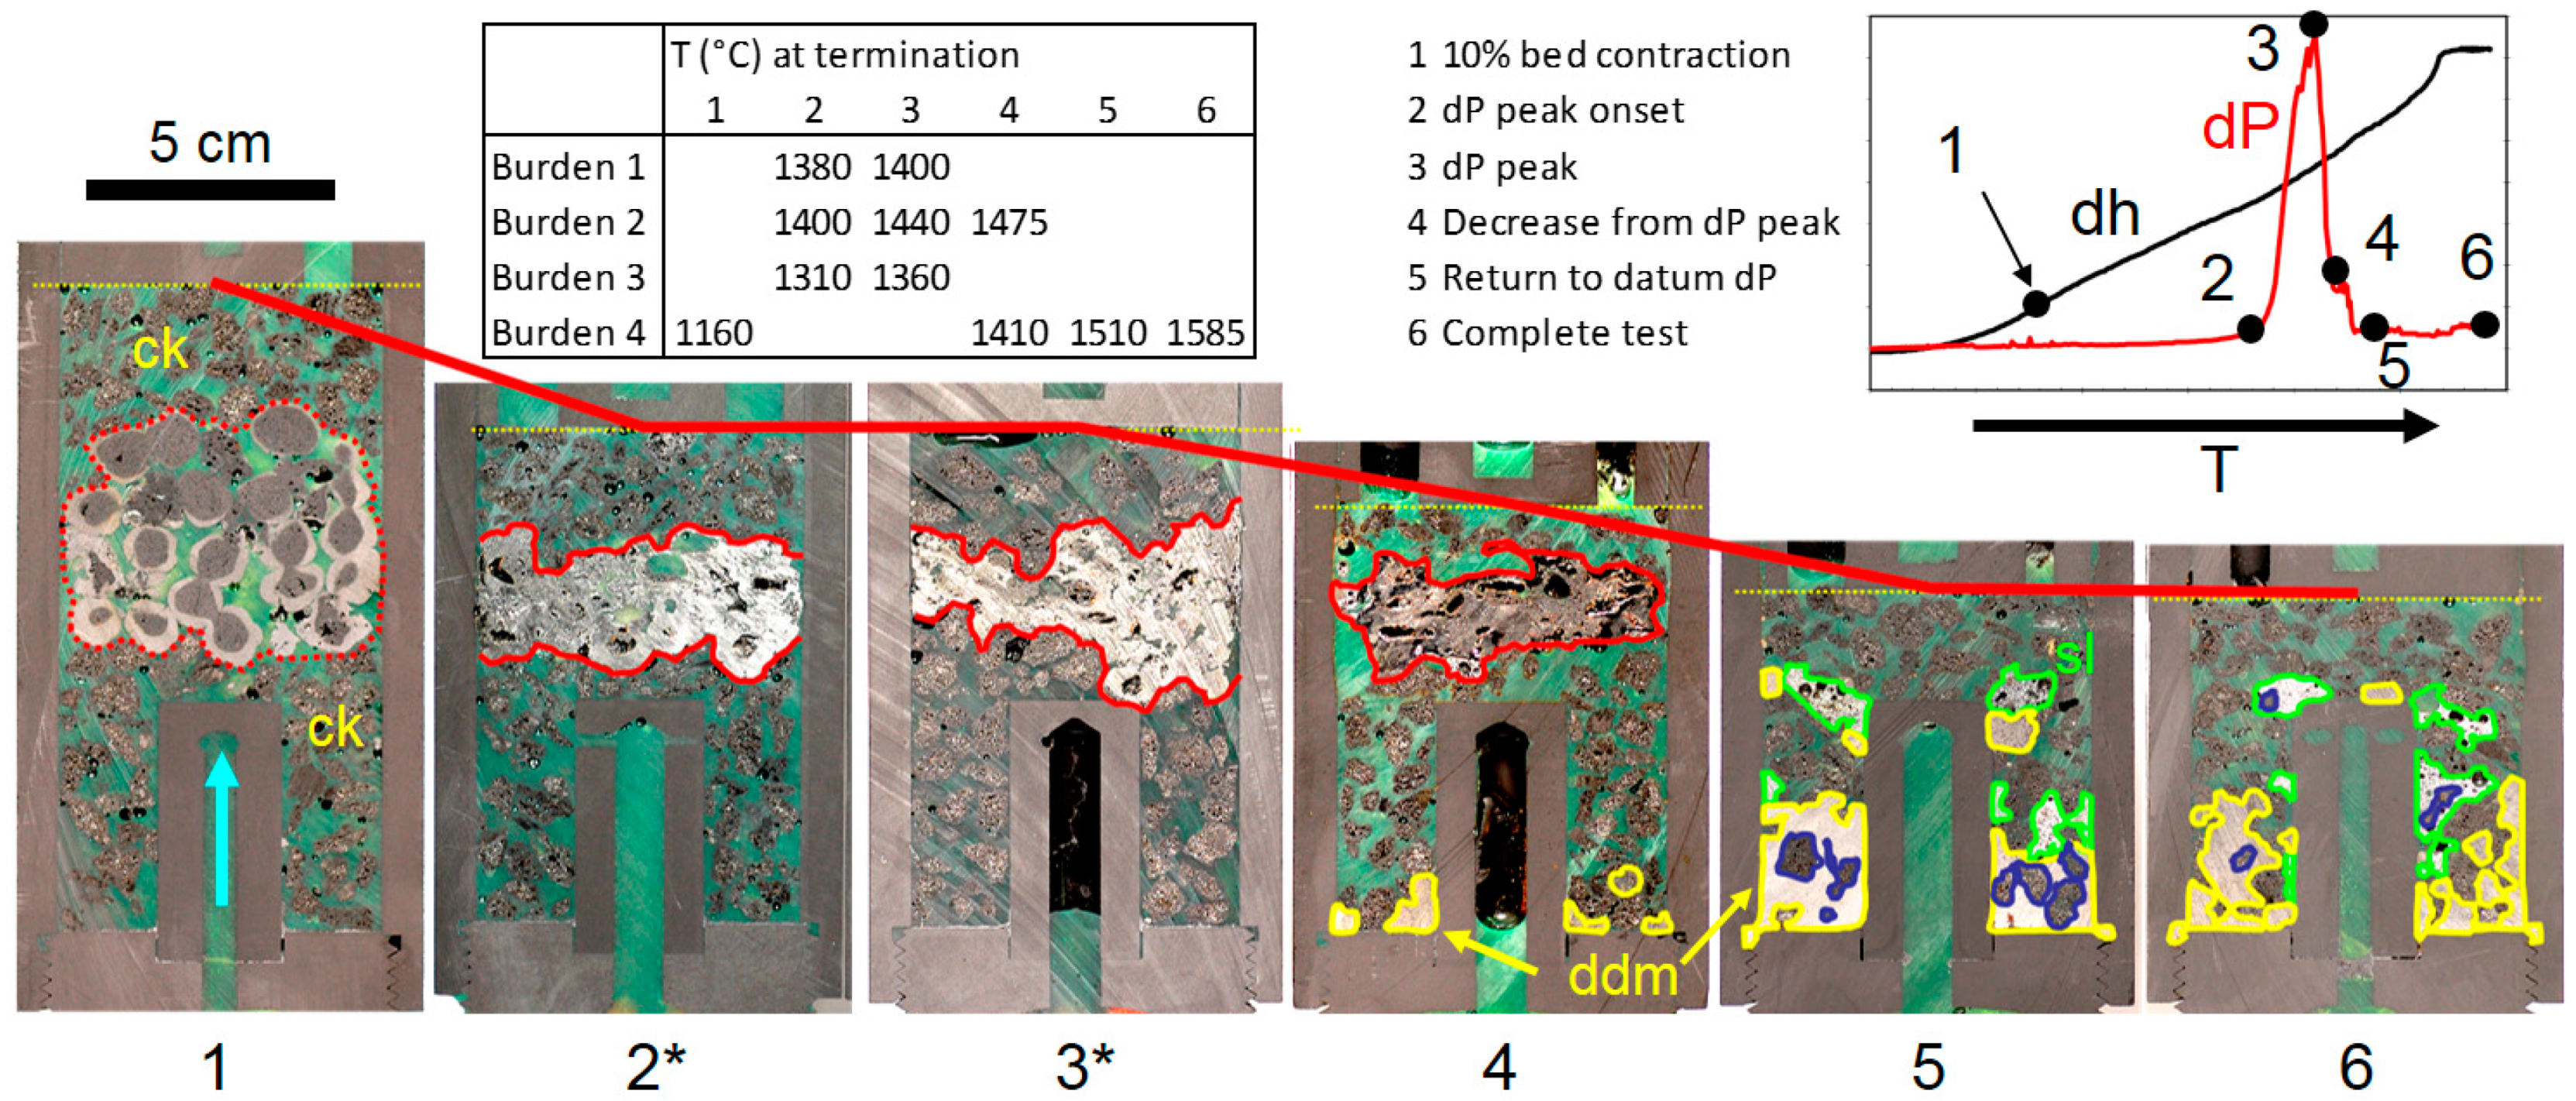
3.2.1. 10% Bed Contraction (Burden M4)

Incipient melting and liquid-mediated chemical interaction are inferred between sinter and pellets, and between the two different types of pellet. Where sinter is in direct contact with a pellet, a microstructurally distinct reaction zone extends into the sinter with thickness of a few hundred µm, in which the local bulk composition is relatively acidic and original C2S is partly to completely reacted out and replaced by olivine/glass (in the final solidified microstructure). Both sinter fragments and pellets display core-rim zoning in reduction degree, with a higher metal fraction in their exteriors and dominantly wustite in their interiors (visible as bright rims and darker interiors in Figure 3). Superimposed over this scale of variation in reduction degree, there is an overall change in reduction degree from bottom to top of the ferrous layer, with generally thicker metal-rich rims towards the bottom. This points toward gaseous reduction of the materials being limited by supply of fresh gas relative to consumption by reaction. Moreover, asymmetric reduction rim thicknesses in pellets at the side-edges of the burden (Figure 5a) suggest a greater supply of fresh (CO-richer) gas on the side facing into the free space between the burden and the crucible than on the side facing into the interior of the burden. The impression is that there is, at this stage, already preferential flow of gas around the ferrous burden as opposed to through it.

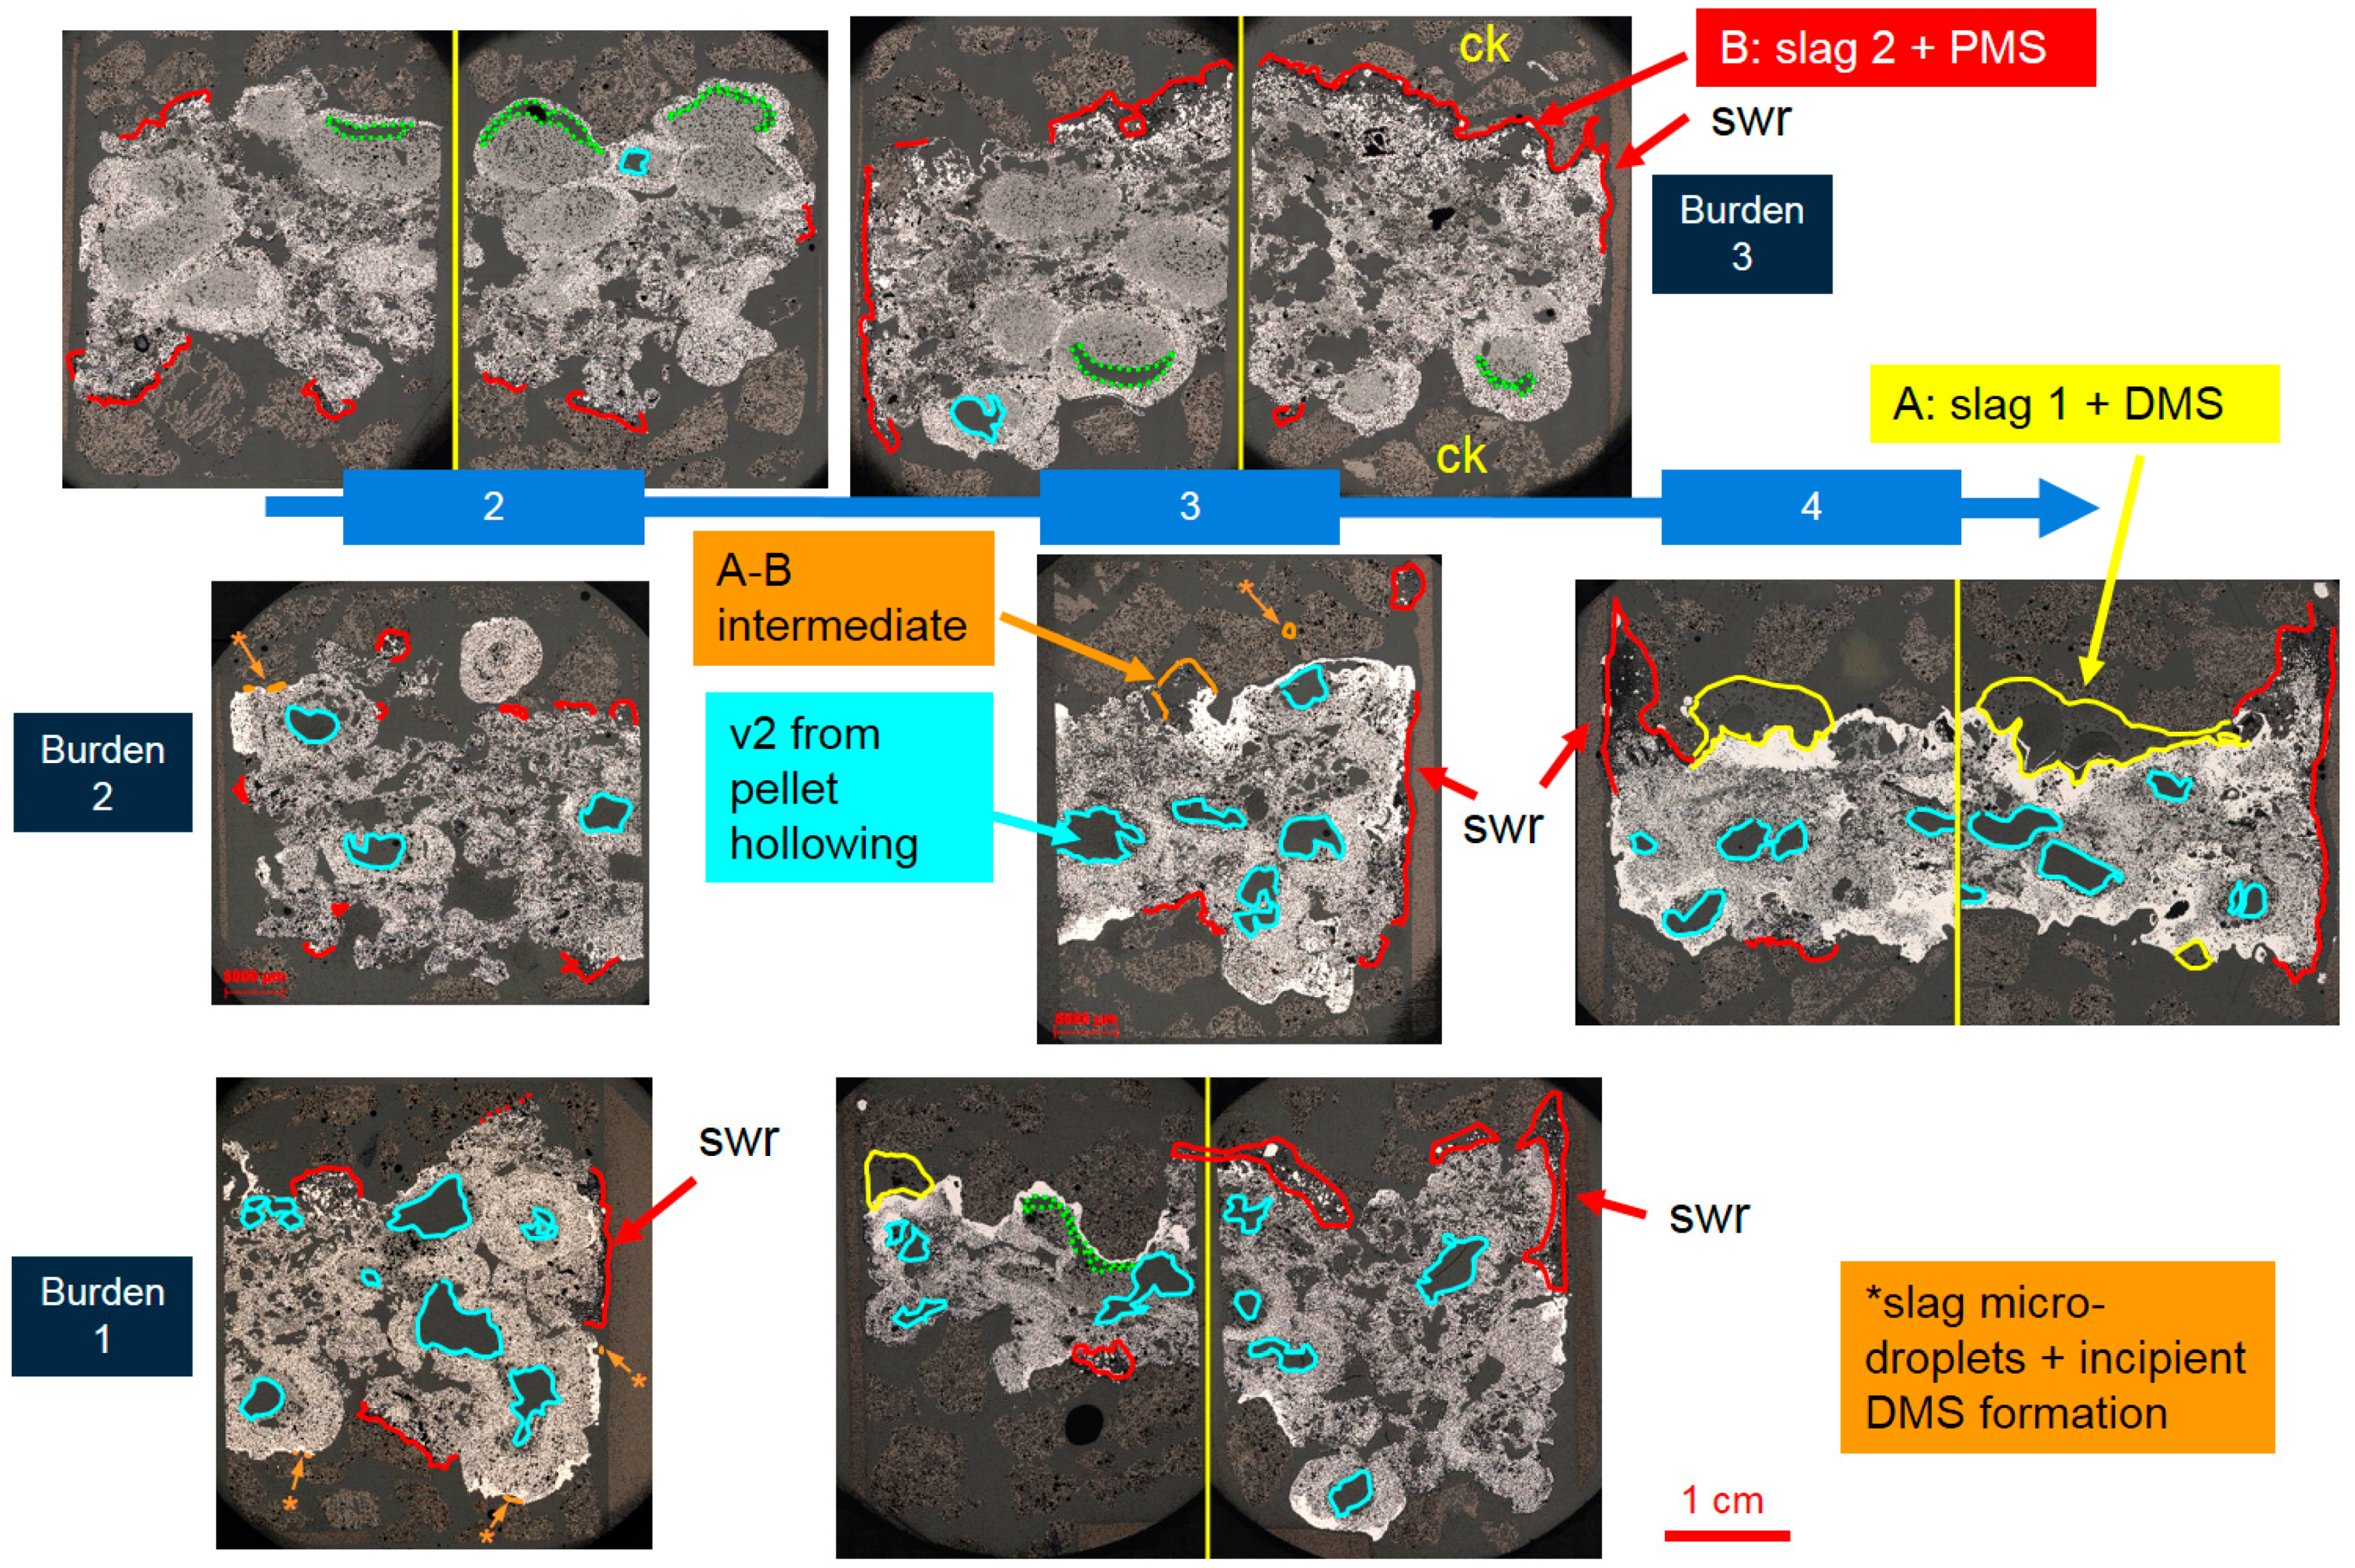
3.2.2. Onset and Development of dP Peak (Burdens M1-M3)
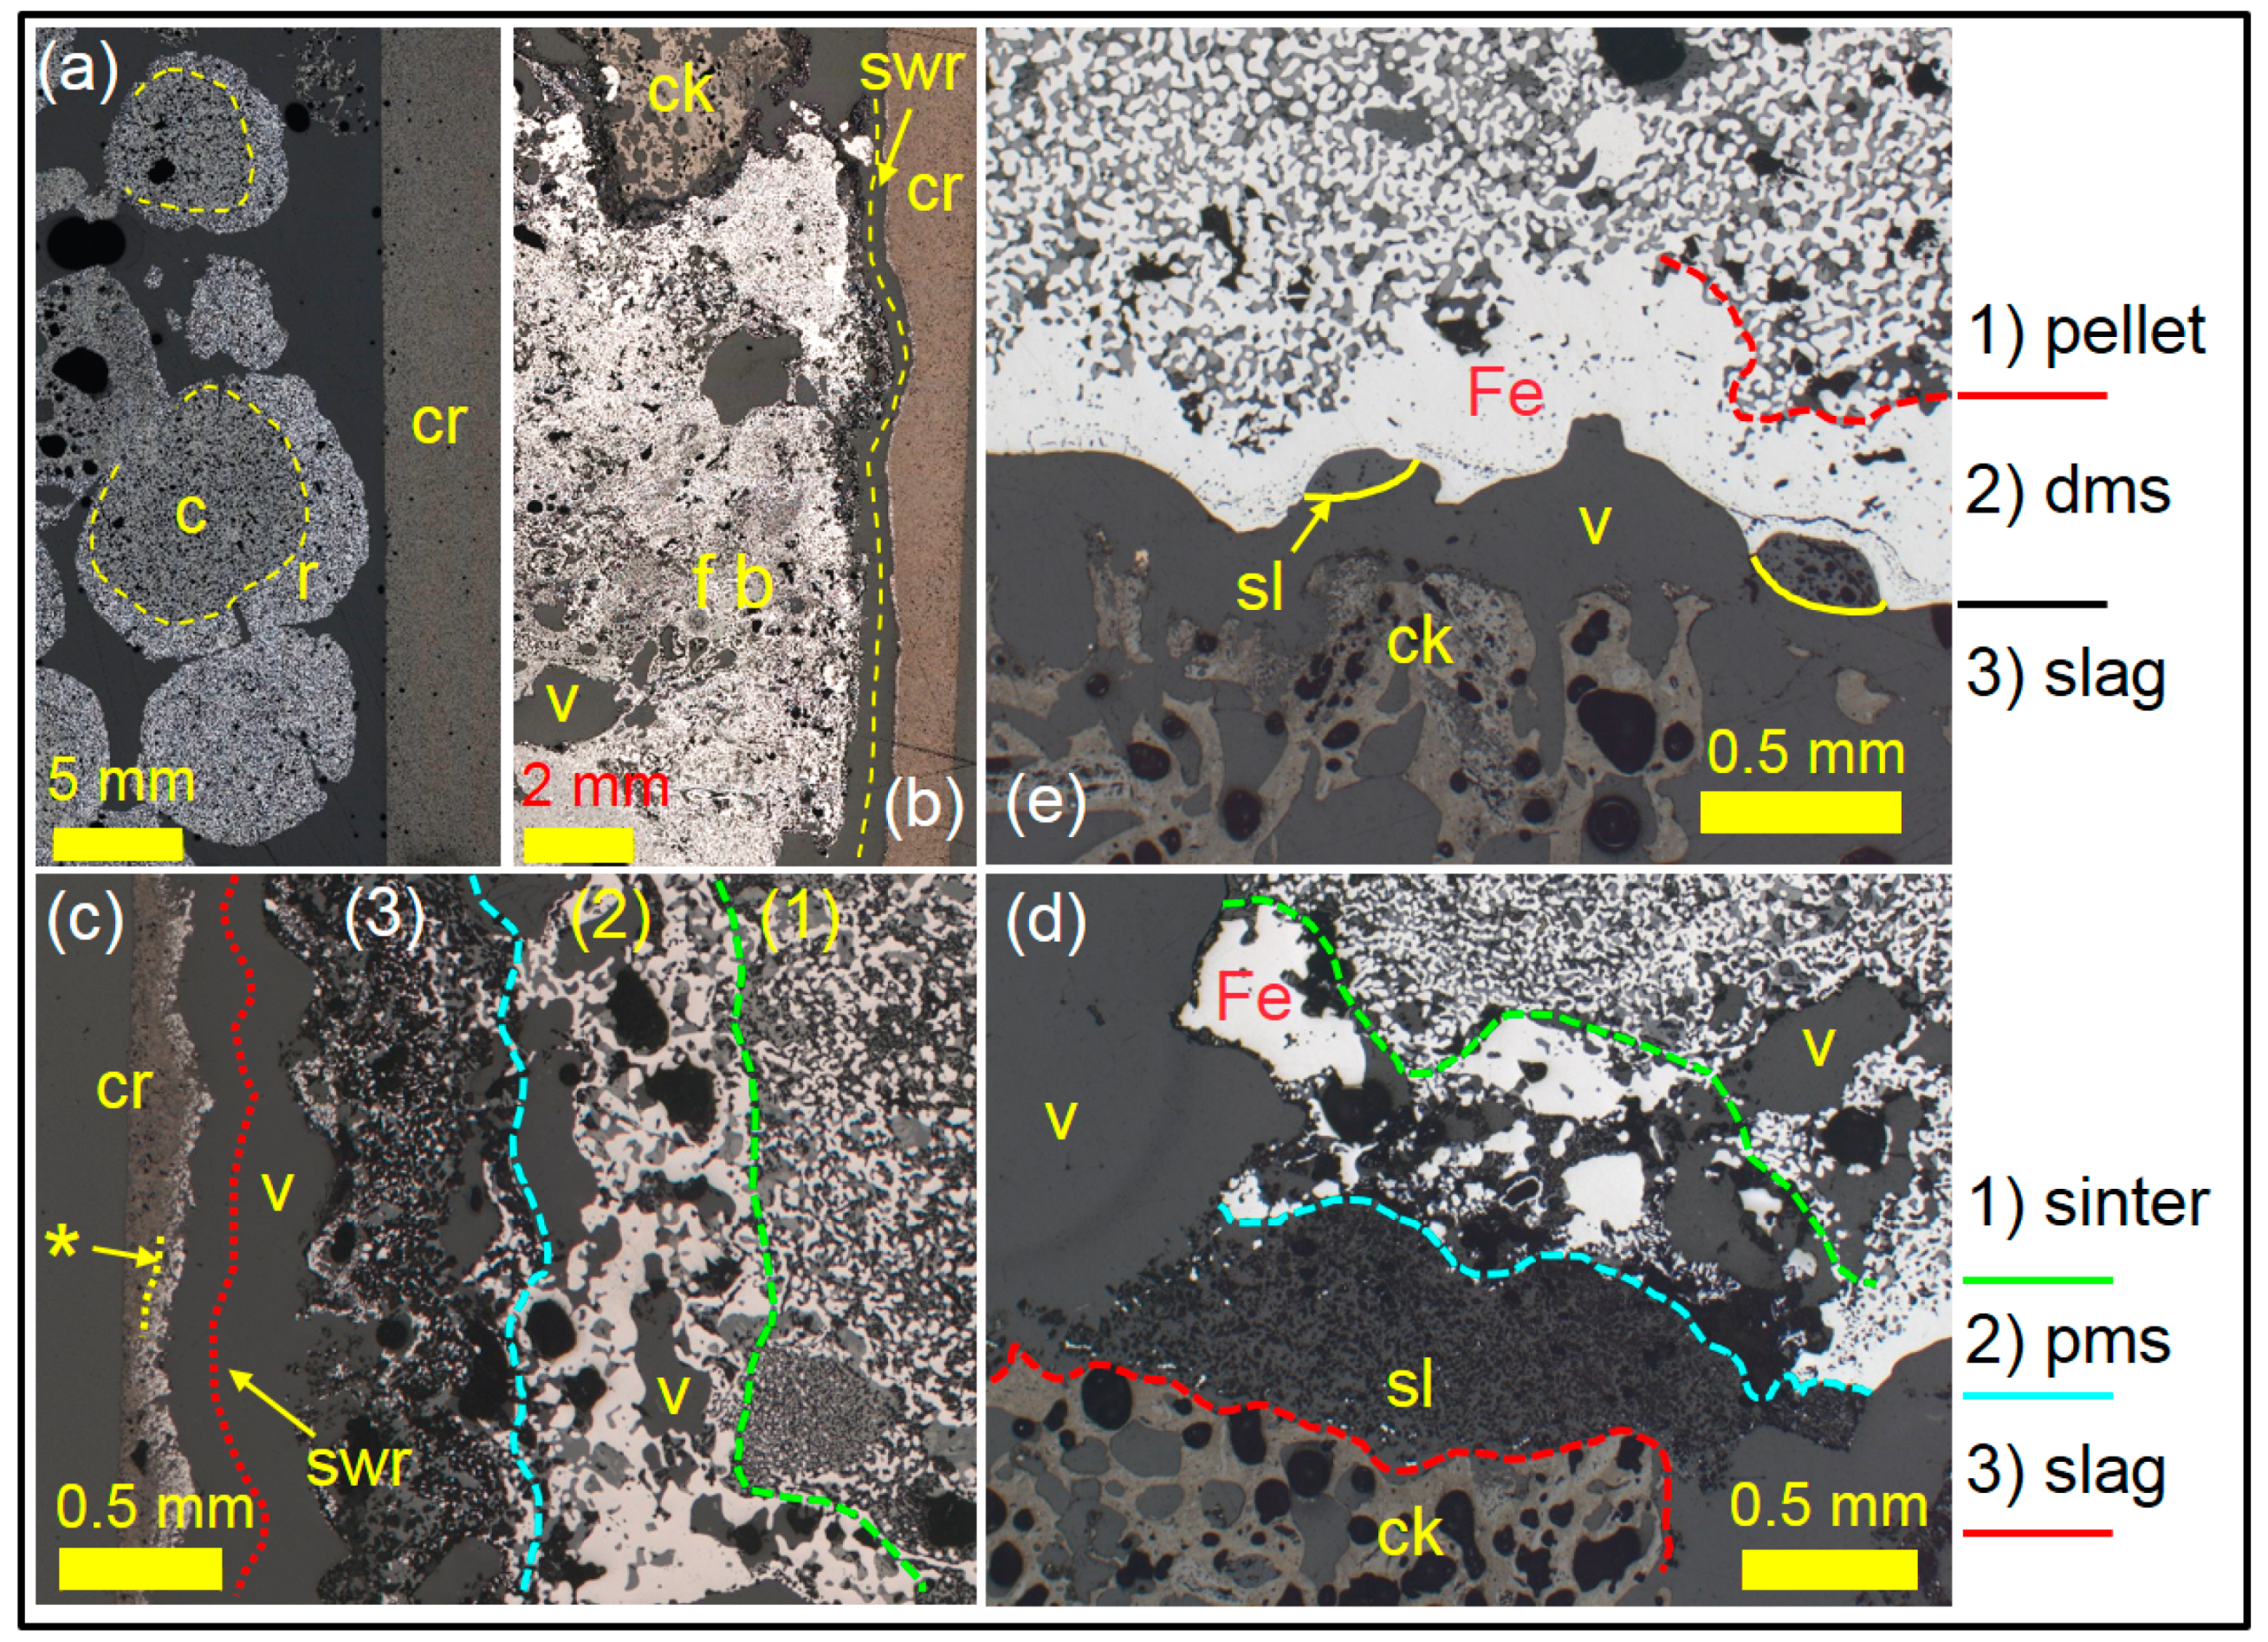
Pellet hollowing and formation of dense metallic shell around burden exterior—Burdens M1 and M2 both show extensive hollowing-out of pellets at interruption point 2 (blue highlights in Figure 4), and incipient formation of dense metallic shell (DMS) in the rims of pellets that are situated at the external margin of the ferrous burden (* annotation in Figure 4; detail shown in Figure 5e). Where DMS forms, micro-droplets of FeO-poor slag are observed on the outer surface of the shell. Much of the original primary void between sinter pieces and pellets is already obliterated by this stage, though some remains. The interior surfaces of the cavities in hollowed-out pellets show a distinct enrichment in MgO in their local bulk chemistry, reflecting the accumulation of relatively magnesian magnesio-wustite (MW). This, in combination with the hollowing, is interpreted as accumulated residual solid material (MW) left by migration of FeO-rich liquid out of the pellet interiors. The deformed but still-recognisable rims of the original pellets are rich in metallic Fe—presumed solid at peak experimental conditions, hence providing some rigidity. The incipient formation of DMS around the burden exterior, together with droplets of FeO-poor, essentially melilite-slag liquid, is interpreted as the reduction of initially FeO-rich liquids derived from melting of the pellet interiors. By this stage of interruption, there is clear evidence in local bulk compositions (measured by EDS raster) of liquid-mediated intra-burden chemical interaction between sinter and pellets, though there is still strong heterogeneity in CMAS composition corresponding with the original sinter and pellet bodies.
Formation of partial metallic segregation at burden exterior during sinter melting—Burden M3, with a significantly lower-T onset in dP peak, shows little or no hollowing of the pellets at interruption points 2 and 3, and the DMS formation is only visible incipiently on the smallest of scales (not visible in Figure 4). Pellets are deformed but are still easily recognisable, while sinter appears to have turned into a relatively soft and internally porous coherent matrix between the pellets. Most conspicuous is the formation of distinct structures around the exterior of the burden, associated with original sinter material, and highlighted red in Figure 4 (annotation B). These structures are present at interruption point 2 (M3) chiefly where sinter is exposed at the top or bottom edge of the burden, adjacent the cokes layer, while in the sample at interruption point 3, they are extensive along both the upper- and side-exterior surfaces of the burden wherever sinter is exposed. This is partly a reflection of the coincidental differences in the configuration of sinter pieces and pellets in the plane of section, and partly a genuine reflection of increased thickness and development of the structures by interruption point 3. The structures comprise a consistent layered sequence, as illustrated in Figure 5c,d, with a transition from interior to exterior, as follows:
(1)
relatively fine (mostly dendritic) intergrowth of metallic Fe and oxidic material;
(2)
a layer with irregular, coarser bodies of largely low-C (pearlite-free) metallic Fe and intervening oxidic material; and
(3)
an exterior layer separating layer (2) from the cokes or crucible graphite, comprising dominantly oxidic material with either little or no metallic Fe (as in (d)) or some quantity of very finely dispersed dendritic Fe in the final solidified microstructure (as in (c)).
Layer (2) is referred to henceforth as partial metal segregation, or PMS. At the temperatures of interruption, with the low C contents implied by the general absence of pearlite in the microstructure, the metal in the PMS would have been solid. Strikingly, outside the slag layer (3), adjacent and inside porosity within the cokes or against the crucible graphite, small bodies (~100 µm–1 mm) of C-rich metal are observed with abundant segregated graphite in their solidified microstructure, which are interpreted to have been liquid at interruption temperature. Layer (3) generally comprises either C2S + C2(A,F) + minor MW, or C3S + C2(A,F) + C12A7 + minor MW in its solidified phase assemblage. In places, it has a fragmented, almost powdery appearance, while in others it is a coherent layer with the appearance of having once behaved as a liquid. Generally speaking, the material closer to the coarse metal in layer (2) is more coherent and it contains more FeOx (up to c. 20–25 wt% FeOtot) in the form of C2(A,F) and MW, while the more fragmented material is generally lower in FeOx. Bulk chemically speaking, these layers can contain as little as 3 wt% FeOtot, and have highly calcic CMAS composition, close to the C/CMAS proportions of sinter but commonly somewhat shifted towards more acid composition, and most significantly with a trend towards high alumina and low silica relative to that of any of the original burden components. This is illustrated with the example of sample M3 at interruption point 3 in Figure 6. A spatially correlated chemical trend towards higher A/CMAS and lower S/CMAS is seen in the meso-scale chemical mapping (EDS area raster) moving from the ferrous burden interior towards the highlighted PMS regions at the top and left-hand edge. PMS regions in the other interrupted samples are also consistently distinguished by similar chemical deviations from the rest of the burden in terms of their CMAS composition.
Equilibrium calculations were performed with Factsage 7.2 for the starting composition of sinter (SC) in two extreme scenarios: (1) CMAS-FeOx, with the original Fetot of the sinter expressed as FeO in the starting composition (i.e., O/Fe fixed at 1), and (2) with CMAS component only, and no FeOx. The calculated liquid compositions with increasing T are plotted on the plot of S/CMAS vs A/CMAS Figure 6b. These calculations imply that the first-formed liquid from FeO-rich sinter regions (assuming bulk sinter composition) at 1090 °C would have a CMAS composition deviating towards higher A/CMAS and lower S/CMAS than bulk sinter. Liquid composition would evolve via the shown (blue) curve towards that of the bulk sinter by the liquidus T of 1361 °C (coincidentally almost identical to the temperature of interruption of the experiment illustrated in the figure). In the FeO-absent scenario, the first-formed liquid would have an even more strongly-deviating composition relative to bulk sinter, and then follow the curve (pink) as shown with increasing T. The solidus T (1390 °C) in this case is slightly higher than that of the interruption point of the experiment (1360 °C). However, additional isothermal calculations (not shown) that were performed with a range of FeO bridging the two extreme scenarios at the interruption temperature of the experiment indicate that there would be liquid with composition plotting close towards the solidus-end of the pink curve with as little as c. 3 wt% FeO in the liquid. This in fact agrees very closely with manually analysed compositions (EDS) of layers, such as that shown in Figure 5d, where only the oxide component was included in the analyses (avoiding contamination by intergrown metallic Fe). In short, the compositions of the slag material encountered together with PMS formation are consistent with once having been partial liquids derived from sinter, with CMAS composition deviating strongly from that of bulk sinter. These had certainly been depleted in FeO component by the point of interruption, either by in situ fractional reduction at the burden exterior or by being emitted already as relatively FeO-poor slag.
Reaction of ferrous burden material with graphite inner wall of crucible—Notwithstanding the large differences in structure and appearance of burden M3 as compared with M1 and M2 at interruption points 1 and 2, during the increase in dP to its peak, all of these samples show the following common feature: clear reaction of ferrous burden material with the graphite inner wall of the crucible. The locations where this is visible are highlighted (swr) in Figure 4, and examples are shown in progressively higher magnifications in Figure 5b,d. At these locations, the graphite wall is clearly worn and had been reacting with adjacent burden-derived material. While in the solidified samples there is now a small gap separating the crucible wall from the burden material, this is interpreted as having occurred due to shrinkage upon cooling, and prior to interruption there would have been intimate contact along a chemically reactive interface. Reaction and visible wear of the crucible wall is consistently associated with PMS formation at the burden margin, rather than DMS structures. The marginal structures containing PMS are flush against the crucible wall, giving the impression effectively of a good contact of the graphite by the precursor liquids. The marginal structures containing DMS, in contrast, appear to have been wrapped around the burden interior and effectively ‘non-contacting’ as an overall structure with respect to the graphite crucible, much as the associated slag liquid droplets themselves appear non-contacting. From this we infer that the marginal structures associated with PMS should pose a qualitatively greater local impedance to gas flow along the previous free space there than those associated with DMS. Due to the coarsely heterogeneous nature of the samples and the limited observation area in any given plane of section, no reliable quantification is possible of the surface area of inner crucible wall affected by reaction with the burden. It does appear, however, that this phenomenon is more advanced and covers more surface area by the peak of dP at interruption point 3. The formation of PMS structures and demonstrable consumption of crucible graphite by reaction to reduce the burden material are certainly operative at the point of the CST off-gas anomaly in burdens M1–M3. In the case of burden M3, the off-gas signal cannot be attributed to the wholesale direct reduction of pellet-derived FeO-rich liquid to form DMS at the burden margins, since this is not observed, and the formation of PMS by reduction of molten sinter-derived material is the only candidate. For burdens M1 and M2, there is additionally hollowing of pellets by exudation of FeO-rich liquids and incipient DMS formation by the point of the dP peak-onset. Hence, the onset of the dP peak in burdens M1–M3 is most demonstrably linked to the formation of PMS structures, where FeO-rich sinter-derived liquid makes contact with the inner wall of the graphite crucible and is reduced. This is not to suggest that DMS formation makes no contribution to the CST or the evolution of the dP curve; however, for these specific burdens and experiments, the abrupt increase in dP consistently corresponds with the formation of PMS structures.

3.2.3. Decrease of dP from Peak to Datum

The sample from burden M2 interrupted after a 75% decrease from maximum dP (interruption point 4, Figure 3) contained no visible dripped-down material in the bottom of the crucible when sectioned. When compared to the state of the same burden at the peak of dP (interruption point 3), the burden is by this stage more compact, with very little original void remaining. The secondary void (v2) produced by the hollowing of the pellet interiors remains clearly visible and it is not qualitatively more deformed than at interruption point 3. The top of the burden is clearly more depressed in the middle, with the formation of thick DMS and the emission of macroscopically visible cm-scale slag droplets (annotation A, yellow highlights). At both sides of the burden there are wedge-like structures, tapering out upwards, comprising PMS + calcic slag (red highlights). It appears that the vertical contraction is accommodated partly by the coke pushing down into the centre of the burden, while it wedges in material to the sides. These wedge-like structures are also seen in less-advanced form at interruption point 3 in burden M1. The carbon content of the metal shell is generally qualitatively low—i.e., no pearlite visible—and inferred largely solid at interruption T. Incipient carburisation of the metal shell is visible in places where pearlite and cementite-bearing microstructures are visible. Generally, the DMS is not in direct physical contact with the cokes: it wraps around the burden, rather than around the cokes. Where in contact with the cokes, this is interpreted as the coke being pressed into already-formed DMS and deforming it, rather than necessarily having formed in intimate contact (in contrast with the reaction interfaces at the inner wall graphite (swr)). The material lining the secondary void after hollow pellets is dominated by magnesio-wustite (plus inferred intergranular slag liquid), with only minimal metal being present. This is direct evidence for the continued effective closure of these voids to the gas phase. The burden by this stage increasingly behaves as a coherent mass, with a more highly metallised exterior wrapping around a more wustite-rich interior. There is no impression of significant further progress of gaseous reduction in the burden interior as compared with earlier interruption points. Increases in the metal fraction are more related to emission of FeO-rich material to the exterior to form DMS and PMS. Based on the microstructural observations, there is no reason whatsoever to suppose that the ferrous burden layer has a more gas permeable structure than it did at the peak of dP, despite the decrease of 75% in dP by this stage.
In the case of burden M4, at interruption point 4 (also at 75% decrease from maximum dP), there is some dripped down metal in the bottom of the crucible (Figure 3). This metal is clearly C-rich with a microstructure that is typical of grey cast iron. Most of the burden material is still present at the original sample location, where it has assumed a more rounded shape, contracting away from the crucible inner wall. The exterior of the burden is covered by highly developed DMS (several mm-thick in most places), and macroscopic slag droplets are suspended just underneath the ferrous burden layer, with no dripping of slag yet visible. The metal in the DMS shows incipient carburisation in places, with pearlite and cementite visible, while in other locations, the metal is still free of pearlite. The observations are interpreted as evidence that gradual carburisation of the initially solid metal in the DMS leads to its melting due to the lowering of the liquidus with increased carbon. A body of highly calcic slag intergrown with coarse metallic bodies appears to be analogous in location and origin to the wedge-like structures that are noted along the sides of burden M2 at the same interruption point but it was interpreted to be more liquid by the point of interruption.
The large slag droplets emitted by burdens M2 and M4 by interruption point 4, associated with thick DMS formation, are expected to have been dominantly liquid at interruption temperature, based on their measured composition (by SEM-EDS area raster) and calculated melting behaviour (CMAS component) in Factsage. The slag regions that are associated with the PMS regions by this stage have a clearly distinct composition, being more calcic and closer to the composition of sinter. It is beyond the scope of this article to further discuss these slag compositions besides noting that they reflect heterogeneous melting of the ferrous burden and the presence of diverse slag compositions around its exterior.
After the return of dP to datum following the peak (interruption point 5), burden M4 has experienced full melt-down, and no burden material is observed in the sample location in the plane of section. The quantity of residual material has not been measured in bulk, so it cannot be ruled out that some ferrous burden material may remain in the cokes, however melt-down and dripping is considered basically to be complete with burden M4.

4. Discussion

The common interpretation of the dP curve in the ASAM and similar S&M tests is that it measures the change in permeability of the ferrous burden layer as it reduces, softens, and melts [3,4]. The onset temperature of rapid increase towards a peak of dP is regarded as being the point at which the tested ferrous burden layer becomes highly impermeable to gas flow, and some authors, e.g. Clixby [8] regard this as more of a useful a proxy for the start of the cohesive zone in the BF than the start of bed deformation, which consistently starts at lower T than the onset of the dP peak. As in the studies of Clixby [7,8], the results here imply the timing of the dP peak onset and an anomaly in the off-gas analysis indicating the consumption of solid carbon—the so-called ‘carbon start temperature’—are mutually related. Clixby regarded the two as effectively synchronous, and even went so far as to use the CST as a proxy for the onset of the cohesive zone, due to the practical difficulty of pinpointing the dP peak onset. Our present investigation of interrupted experimental samples confirms that this moment corresponds with the onset of significant (direct) reduction of FeO-rich liquids at the margins of the burden. Specifically, for the mixed sinter-pellet burdens that were used here, the dP peak onset corresponds in each case with reaction of sinter-derived, FeO-rich liquid with the graphite inner wall of the crucible, with visible consumption and wear of the graphite. The reaction products form a layered complex of partially segregated solid metal and residual slag (partial metal segregation; PMS) with a few-hundred micron thick layer of FeO-poor (as low as 3 wt%), highly calcic, and aluminous slag separating the metal-rich layer from the graphite crucible and apparently impeding the carburisation of the metal. Where present, these structures effectively fill up and seal off locally the free space between the ferrous burden and the inner crucible wall. In two of the burdens (M1 & M2) at the dP peak onset, there is additionally clear evidence of hollowing of pellet cores by exudation of FeO-rich liquid combined with the incipient formation of solid dense metallic shell (DMS) and the accumulation of FeO-poor residual slag liquid on the surface of this at the burden’s exterior. These latter structures do not appear to ‘plug’ the previously existing free space between ferrous burden and crucible inner wall—nor do they adhere to the latter—in the same way that the PMS-related structures do. We consider it a qualitative and physically significant difference between the burdens that M1 and M2 show both (1) PMS formation and (2) advanced hollowing of pellets and incipient DMS formation at the onset of the dP peak, while burden M3 shows only the former. Up to this point in the experiments, by which the bed has already contracted by more than 50% vertically, no significant change in dP was measured, while the variation in reduction degree over the bed, and asymmetric reduction-rim thickness around pellets and sinter, imply that the reducing gas starts to become channeled preferentially around the burden—rather than through it—from as early as 10% bed compaction.
The combination of the above observations leads us to suggest that, up to the point of abrupt increase in dP in these experiments, the gas had been able to flow around the burden, along the free space between the latter and the inner crucible wall, masking a real loss in permeability within the ferrous sample layer itself. The sudden increase in dP at this point corresponds with the partial sealing-off of this gas-bypass. It could be argued that the sealing-off of the inner-wall gas-bypass, by the melting and reduction reactions, as observed, is coincident with changes in the true permeability of the ferrous layer itself. Certainly, there is a necessary relationship between the timing of the formation of the marginal structures around the burden and an increase in liquid fraction in the interior of the ferrous layer. The CST off-gas anomaly is as such a fairly reliable indicator of the timing of the arrival of more voluminous FeO-rich liquids at the exterior of the burden, where they are reduced and solid carbon is consumed, which is certainly of interest in understanding S&M behaviour. However, the physical relationship of the dP measurement with any relevant change in ferrous burden layer permeability is the question of relevance here. It could be argued that the peak value of dP would still give a meaningful indication of the permeability loss within the ferrous layer, even if the onset of the dP peak is detected late due to the earlier gas bypass around the layer. However, if the bypass is partially and variably sealed-off, then the peak value in dP could reflect how effectively it is sealed as much as it reflects the true permeability of the layer itself. The effectiveness of sealing reflects the characteristics of material that is located around the exterior margins of the burden, specifically at the interface with the inner crucible wall. This is no direct indication of the permeability and void structure of the bulk of the layer itself. Moreover, we propose that the formation of PMS structures along the sidewall would impede local gas flow more than the formation of DMS structures. Given that this in turn is directly related to the reduction and melting behaviour of different burden materials, and interaction between these, it is expected that this is a systematic effect and is not merely a source of random scatter in dP curve measurements, though the poor reproducibility of dP curves is certainly a documented issue, e.g., [5,8]. Hence, correlation of dP curve properties, e.g. the S-value, with burden makeup is not in itself sufficient evidence for the physical validity of the dP measurement as proxy of the ferrous layer permeability.
The physical significance of the gradual decrease in dP from peak back to datum (if reached) is also not entirely clear in terms of translation to the BF process. The cohesive zone only truly ends in the BF where metal and slag drip away. The gradual decrease in dP in this study is evidently not directly correlated with the timing of dripping: in one burden (M2), there is a 75% decrease in dP with no dripping whatsoever, while in another (M4), dripping of metal (not slag) is occurring but far from complete at an equivalent decrease from peak in dP. Dripping can in any case be independently detected—and is, in several softening and melting simulations worldwide—and the dP curve need not be used to infer the onset and completion of dripping. The gradual decrease in dP towards datum after the peak is more demonstrably linked with the re-opening of free space between the ferrous burden and the inner wall as the increasingly deformable dense metallic shell (DMS) tends to contract around the burden. There is no microstructural evidence to suggest that the ferrous burden itself becomes more permeable to the gas during this stage of the experiment, and, on the contrary, the interior of the burden clearly remains a last refuge of FeO-rich material that is shielded from the imposed gas atmosphere. The increase in gas flow at this stage of the experiment, prior to dripping, is attributed to bypass around the highly impermeable burden package, and hence a misleading artefact. Similar concerns have previously been raised by Clixby [8], noting cases, with burdens comprising only high-basicity sinter (C/S~2), where a highly impermeable, congealed mass of metal and slag remained in the sample location (un-dripped) after test completion, while the dP measurement nevertheless returned to datum before completion. He attributed this to gas bypass through a hole in the sample and regarded it as a misleading measurement artefact. Based on the present study and the observations of Clixby [8], we consider changes in dP during this stage of the experiment to be unreliable as a proxy of the permeability of the ferrous layer itself. A direct measurement of the temperature interval over which dripping occurs, and the final amount of any residual (un-dripped) material after the experiment’s completion, are necessary to robustly infer the end of the simulated cohesive zone.

5. Conclusions

Advanced Softening and Melting (ASAM) experiments have been performed with ferrous burdens comprising a mixture of pellets (C/S 0.1–0.7) and highly basic industrial sinter (C/S 2.4–3.5). Detailed study of samples from interrupted experiments sheds light on the nature and controlling mechanisms of wall-effects influencing the measurement of dP, as is commonly used for inferring permeability changes in the ferrous burden layer. Three misleading artefacts are identified:
(1)
Demonstrable bypass of gas along the free space between the crucible’s inner wall and ferrous burden layer during initial bed deformation (softening), which masks an actual permeability loss in the layer itself.
(2)
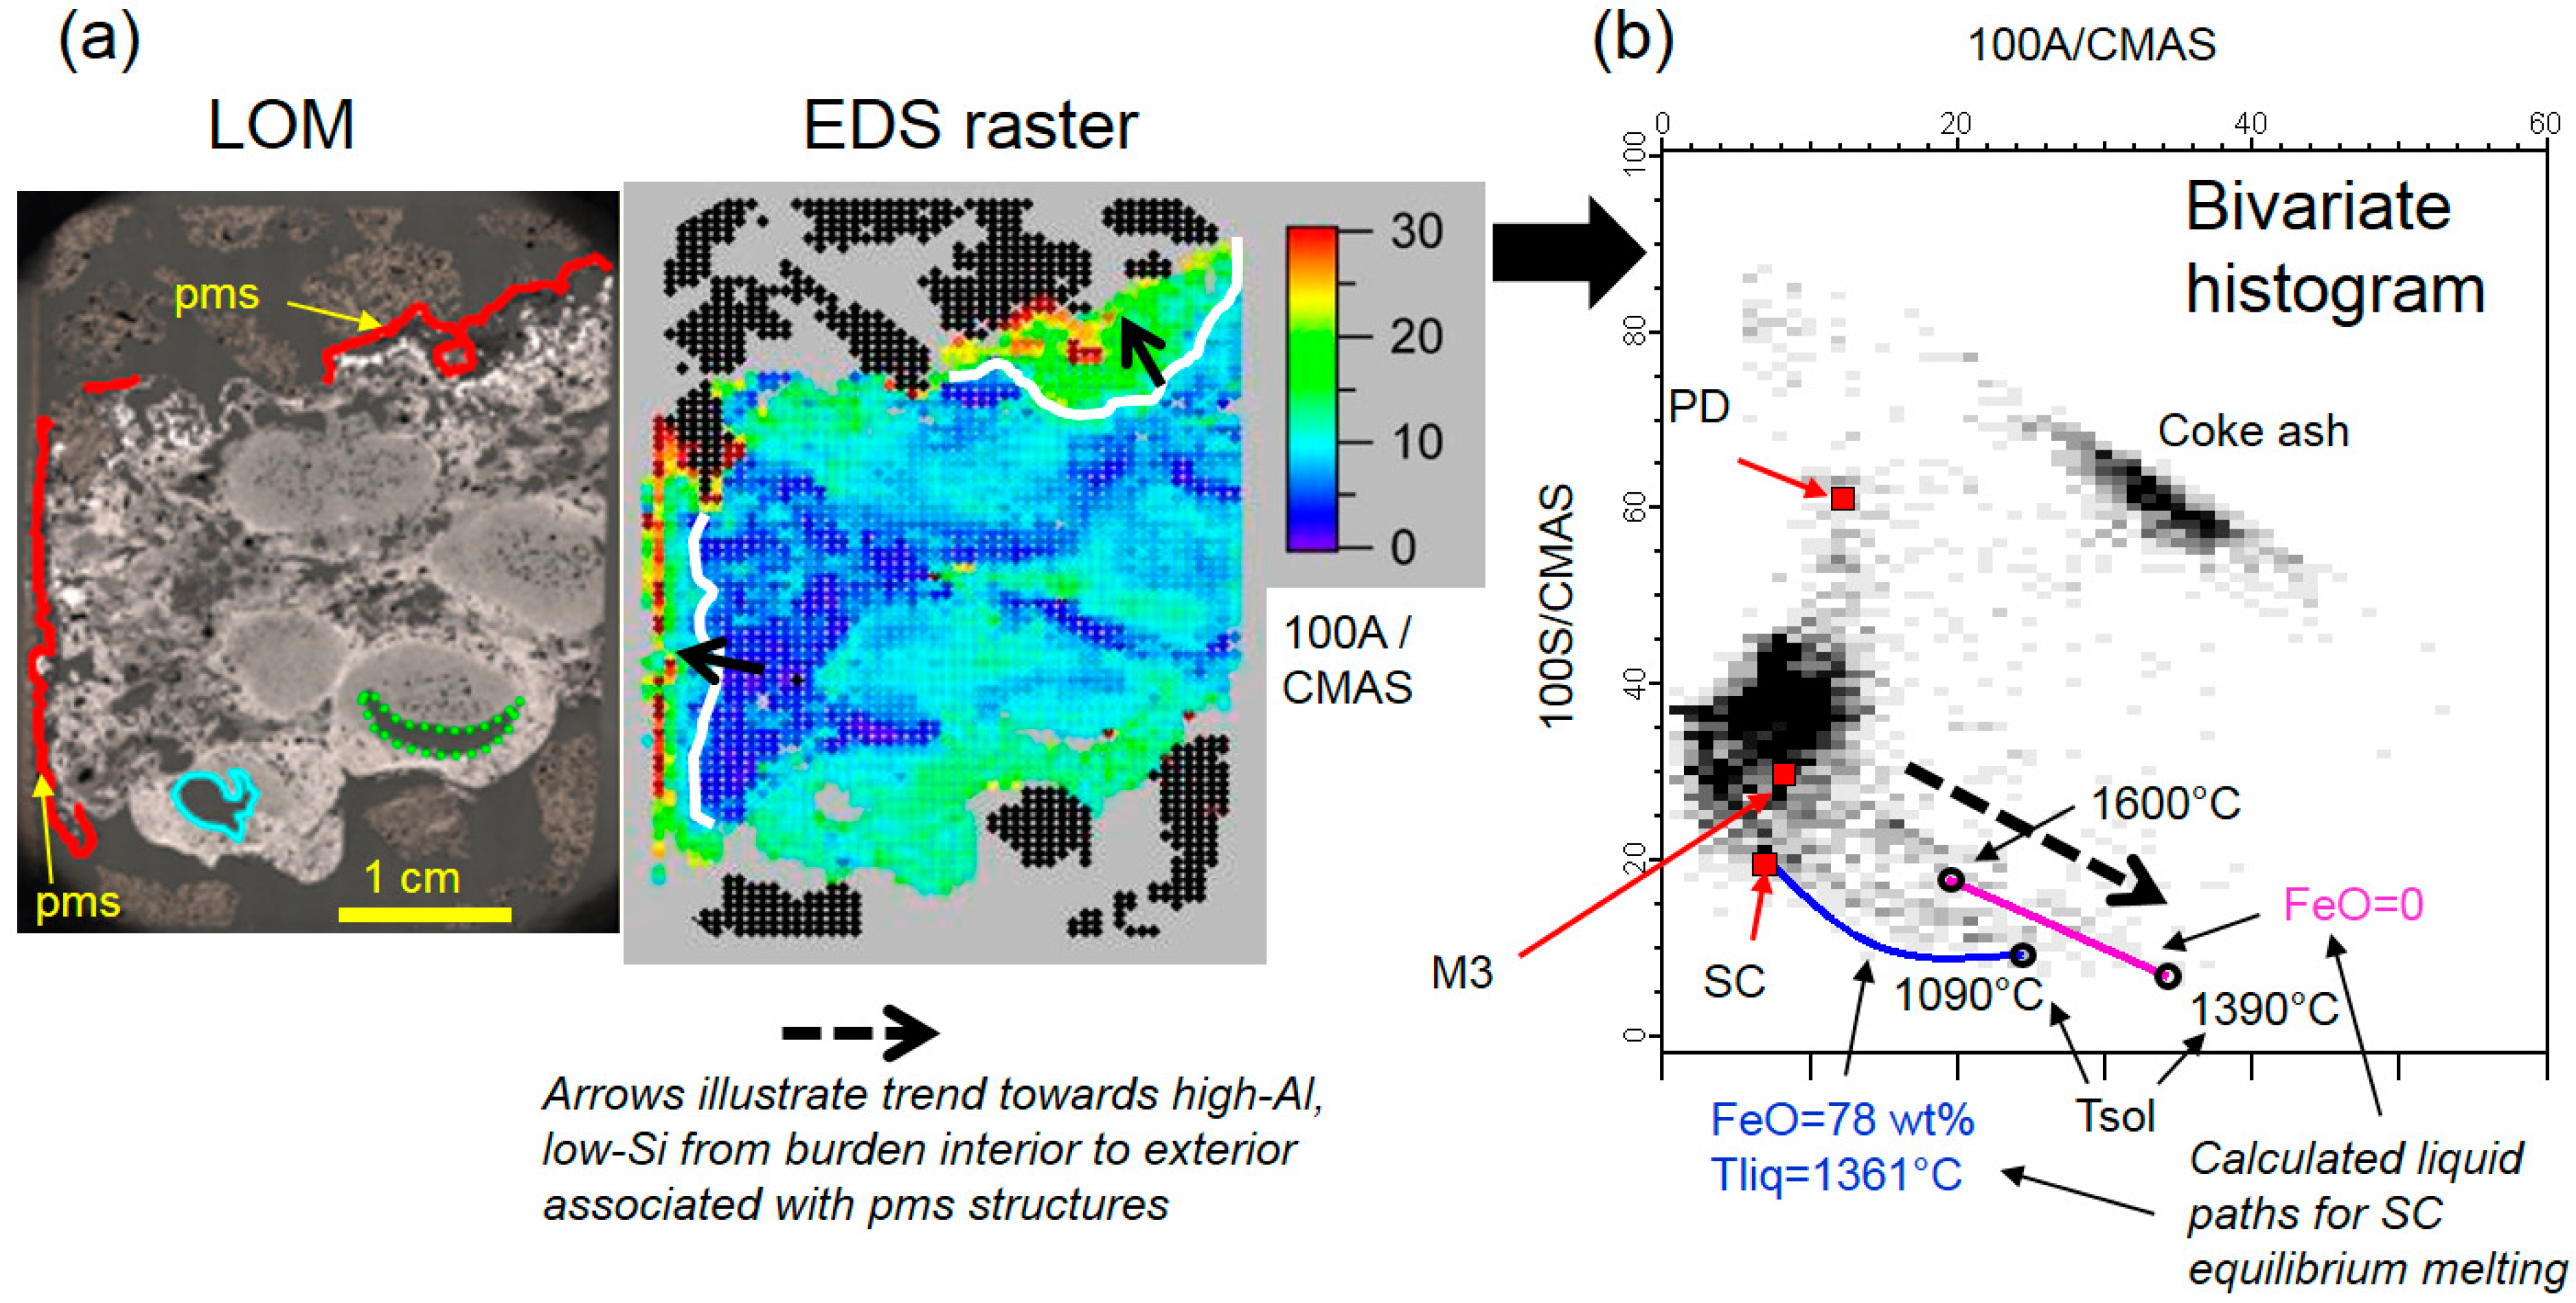
The onset of abrupt increase in dP is synchronous with, and influenced by, variably effective sealing of the previously free space between ferrous burden and crucible by the formation of oxide(-slag)-metal segregations at the exterior of the ferrous burden layer. This consistently corresponds with the carbon start temperature (CST) off-gas anomaly and represents the (direct) reduction of FeO-rich liquids at the ferrous burden’s exterior. Specifically, in the studied burden mixtures, partial metal segregation (PMS) structures of solid metal and partially molten slag residue form where FeO-rich liquids that are derived from sinter react with the crucible graphite. This results in reactive contact between the PMS and the crucible wall and it locally impedes gas flow along the latter. In contrast, the formation of dense metallic shell (DMS) and slag liquid droplets, associated initially with pellets that are exposed at the burden exterior, shows no such reactive contact and is inferred to pose less impedance to gas flow along the crucible wall, since the burden there is at most mechanically pressed against the wall. The character and areal extent of such diverse marginal structures around the burden exterior are directly related to the burden materials used, hence correlations can be expected, but this is not an indication of the permeability of the ferrous burden layer itself. As such we consider this a misleading, systematic measurement artefact affecting the measured maximum value of dP.
(3)
The gradual decrease from maximum dP to datum does not consistently correlate with dripping, and instead it reflects the re-opening of free space between the ferrous burden layer and the crucible wall, while the ferrous burden itself remains in its original location and highly impermeable to the gas phase.
The relatively narrow inner diameter of the ASAM crucible (65 mm) means that the systematic wall-effect artefacts that are described above have a disproportionate effect on gas flow. Our observations imply that the dP-T curves most immediately reflect the varying ease of gas flow in a sidewall bypass around the qualitatively impermeable ferrous burden layer rather than through it. This is likely the case in similar S&M experimental setups with comparatively narrow crucible diameter. The potential correlation of the dP measurement (and derived parameters, such as the S-value) with input burden characteristics is not in itself sufficient evidence that the measurements are indicative of the ferrous layer permeability.

Author Contributions

Conceptualisation and investigation, K.A., A.A., J.S. and E.Z.; methodology—experimental, K.A., A.A.; methodology—sample investigation, J.S. and E.Z.; writing, J.S.

Funding

This research received no external funding.

Acknowledgments

The authors would like to thank Tata Steel for allowing this research to be performed and published. We would like to specifically thank Jeroen Stuurwold, Yanping Xiao, Hans Jak, Gerard Tijhuis, Antoine Steeghs, Willemijn Husslage and Sieger van der Laan for insightful discussions, Donald Mittertreiner for performing some of the ASAM experiments, Corrie van Hoek for assistance with electron microscopy, Frank van der Does and Sjaak Metselaar for sample preparation.

Conflicts of Interest

The authors declare no conflict of interest.

References

  1. Iljana, M.; Kemppainen, A.; Paananen, T.; Mattila, O.; Heikkinen, E.; Fabritius, T. Evaluating the Reduction-Softening Behaviour of Blast Furnace Burden with an Advanced Test. ISIJ 2016, 56, 1705–1714. [Google Scholar] [CrossRef] [Green Version]
  2. Liu, X.; Honeyands, T.; Evans, G.; Zulli, P.; O’Dea, D. A Review of High-Temperature Experimental Techniques Used to Investigate the Cohesive Zone of the Ironmaking Blast Furnace. Ironmak. Steelmak. 2018. [Google Scholar] [CrossRef]
  3. Tayama, A.; Shimomura, Y.; Kushima, K.; Nakata, T.; Fujita, K. Production and Use of High Quality Pellets. In Proceedings of the Ironmaking Conference, Washington, DC, USA, 23–26 March 1980; Volume 139, pp. 390–398. [Google Scholar]
  4. Ranade, M.G. Testing of Softening and Melting Characteristics of Iron-Bearing Materials: A Critical Review of Procedures and Applications. In Proceedings of the 42nd Ironmaking Conference, Atlanta, GA, USA, 17–20 April 1983; pp. 129–144. [Google Scholar]
  5. Loo, C.E.; Matthews, L.; O’Dea, D. Lump Ore and Sinter Behaviour During Softening and Melting. ISIJ Int. 2011, 51, 930–938. [Google Scholar] [CrossRef]
  6. Chaigneau, R.; Bakker, T.; Steeghs, A.; Bergstrand, R. Quality Assessment of Ferrous Burdens: Utopian Dream? In Proceedings of the 60th Ironmaking Conference, Baltimore, MD, USA, 25–28 March 2001; Volume 84, pp. 689–703. [Google Scholar]
  7. Clixby, G. Simulated Blast-Furnace Reduction of Acid Pellets in Temperature Range 950–1350 °C. Ironmak. Steelmak. 1986, 7, 169–175. [Google Scholar]
  8. Clixby, G. High Temperature Reduction, Softening and Meltdown Studies of Burden Materials; Report EUR 10762 EN, Catalogue Number CD-NA-10-762-EN-C; Commission of the European Communities: Luxembourg, 1987; Available online: https://publications.europa.eu/s/juUy (accessed on 14 November 2018).
  9. Bale, C.W.; Bélisle, E.; Chartrand, P.; Decterov, S.A.; Eriksson, G.; Gheribi, A.E.; Hack, K.; Jung, I.H.; Kang, Y.B.; Melançon, J.; et al. FactSage Thermochemical Software and Databases, 2010–2016. Calphad 2016, 54, 35–53. [Google Scholar] [CrossRef]
  10. Available online: www.factsage.com (accessed on 14 November 2018).
Figure 1. (a) schematic of experimental setup; (b) T and gas composition profile of Advanced Softening and Melting (ASAM).
Metals 08 01082 g001
Figure 2. (a) Pressure drop (solid curves) and vertical bed contraction (dashed curves) against temperature for mixed burdens M1–M3; (bd) per burden, calculated C(out)-C(in) based on off-gas and in-gas analyses, with dP curve for reference.
Metals 08 01082 g002
Figure 3. Appearance of vertically (longitudinally) sectioned post-experimental samples stopped at points 1–6 as illustrated. Samples for 1, 4–6 using burden 4 (M4), samples for 2* and 3* using burden 3 (M3). Red outlines highlight ferrous burden layer. ck = coke; ddm = dripped-down metal; sl = slag. Blue arrow indicates gas inlet extending from bottom of crucible.
Metals 08 01082 g003
Figure 4. Light optical microscopy (LOM) imagery of vertical (longitudinal) sections from interrupted experiments for burdens 1–3 (M1-3). swr = sidewall reaction; v2 = secondary void. Dense metallic shell (DMS) appears white. Generally brighter areas are richer in metallic Fe, darker grey in wustite.
Metals 08 01082 g004
Figure 5. LOM imagery of various regions of interest. c = wustite-rich pellet core; r = metal-rich pellet rim; cr = crucible (graphite); ck = coke; swr = sidewall reaction interface; v = void; sl = slag; * = reaction intergrowth within crucible graphite. See text for further explanation.
Metals 08 01082 g005
Figure 6. (a) spatial variations in local bulk chemistry (0.5 mm resolution) associated with partial metal segregation (PMS) structures; (b) bivariate histogram of EDS area raster analyses from (a)—greyscale indicates density of analyses: black = high density, white = zero (no analyses). Sinter (SC), pellet (PD), M3: see Table 1.
Metals 08 01082 g006
Table 1. Chemical compositions of individual burden components and bulk burden mixes. Abbreviations: C = CaO; M = MgO; A = Al2O3; S = SiO2. FeO* = 100FeOtot/[FeOtot + sumCMAS], where FeOtot = total Fe expressed as FeO wt%.
wt% 100% CMAS Normalisation Burden Mix Proportions
MaterialFe2O3FeOCaOMgOSiO2Al2O3TiO2MnOC/SSum CMASCMASFeO*1234
Sinter A (SA)69.8313.0310.071.064.191.230.150.452.4016.5460.876.387.4125.3382.1045---
Sinter B (SB)71.2710.7811.421.093.961.040.140.292.8917.5165.236.205.9722.6081.05-40--
Sinter C (SC)70.479.1513.221.353.841.370.170.433.4519.7866.876.816.9119.4178.58--53-
Sinter D (SD)72.5611.319.051.293.771.560.150.332.4015.6557.798.219.9424.0583.03---35.4
Pellet A (PA)95.160.430.461.402.050.240.180.080.234.1511.1433.665.8149.3995.401520-16.2
Pellet B (PB)91.190.192.631.403.460.700.210.210.768.2032.0717.148.5742.2390.9440---
Pellet C (PC)91.170.122.551.703.460.690.180.130.748.4030.3520.198.2441.2290.73-40--
Pellet D (PD)92.110.100.331.634.470.890.200.270.077.324.5322.2212.2161.0491.90--47-
Pellet E (PE)91.540.222.601.183.540.570.220.130.737.8932.9114.997.2444.8591.28---48.4
wt%
Burden 1 (M1)82.186.005.651.253.580.870.180.301.5811.3449.8110.997.6631.5487.57
Burden 2 (M2)84.044.415.681.403.400.740.160.171.6711.2250.6512.456.6330.2787.71
Burden 3 (M3)80.684.897.151.484.131.140.180.361.7313.8951.4510.628.2229.7084.80
Burden 4 (M4)85.414.184.531.253.380.870.190.191.3410.0345.2012.508.6433.6788.98

