Abstract
The flow behavior of Fe-6.5wt. %Si alloys during hot compression was investigated at temperatures 650–950 °C and strain rates 0.01–10 s−1. The results showed that the flow stress depended distinctly on the deformation temperatures and strain rates. The flow stress and work hardening rate increased with the decrease of temperature and the increase of strain rate. The activation energy under all the deformation conditions was calculated to be 410 kJ/mol. The constitutive equation with hyperbolic sine function and Zener–Hollomon parameter was developed. The peak stress, critical stress, and steady-state stress could be represented as σ = A + Bln(Z/A). Dynamic recrystallization occurred under the deformation conditions where the values of Z were lower than 1020. Processing maps were established to optimize the processing parameters. The power dissipation efficiency decreased in the high temperature and low strain rate region, increased in the high temperature and high strain rate region, and remained unchanged in other regions with the increase of true strain. Furthermore, the unstable area expanded. The true strain of 0.7 was the optimum reduction according to the processing map. Based on the analysis of surface quality, microstructures, and ordered structures, the optimized processing parameters for the Fe-6.5wt. %Si alloys were the temperature and strain rate of higher than 900 °C and 0.01–10 s−1, respectively, or 800–900 °C and lower than 0.4 s−1, respectively.
1. Introduction
Fe-6.5wt. %Si alloy has been considered as a potential material for application in high-frequency fields, such as transformers, power generators, and electric relays, as it is an excellent soft magnetic material with high electrical resistance, high relative permeability, nearly zero magnetostriction, low coercive force, and low iron loss [1,2,3]. However, ordered structures such as B2 (Pm3m) and D03 (Fm3m) are formed in this alloy [4,5], which result in the strengthening of lattice resistance and formation of anti-phase boundary. These lead to room-temperature fragility of the alloy. In order to avoid room-temperature embrittlement, various techniques have been developed, such as chemical vapor deposition [6], hot dipping [7], spray forming [8,9,10], rapid solidification [11,12,13], and direct powder rolling [14]. Moreover, a hot-warm-cold rolling method combined with proper heat treatments was reported for the fabrication of sheets of thickness 0.03–0.05 mm [15,16,17]. As indicated in previous reports, the rolling parameters, including temperature, rolling reduction, and strain rate, control the flow behavior [18] and microstructural evolution [19]. Moreover, other factors such as the degree of ordering [20] are important in the rolling process. These factors determine the deformation mechanisms of the alloy during the rolling process.
Generally, softening mechanisms such as dynamic recovery (DRV) and dynamic recrystallization (DRX) often occur during hot deformation such as rolling. Recently, Niu et al. [21] reported that the softening mechanisms of the Fe-6.5wt. %Si alloy were DRV and DRX during hot compression. Liang et al. [22] observed that DRX was the main softening mechanism above 900 °C, whereas DRV was the main softening mechanism below 700 °C. Furthermore, Haghdadi et al. [23,24] claimed that ferrite softens through continuous dynamic recrystallization (CDRX) at low strain rate and discontinuous dynamic recrystallization (DDRX) at high strain rate. Castan et al. [25] reported that DDRX occurs at high temperature and high strain rate, whereas CDRX occurs at lower temperature and strain rate. However, the correlation between the deformation mechanisms and rolling process should be clarified via further experiments. The processing map (PM) technique based on the dynamic materials model (DMM) could be one of the choices. PMs have been considered a useful approach to distinguish the feasibility of rolling process, investigate the transformation of microstructures, and observe the formation of textures. Therefore, these techniques can be used to optimize the rolling parameters and control the microstructures and textures. PMs have been employed to evaluate the processing technology of various alloys, e.g., austenitic steels and Al–Cu–Mg–Ag alloys [26,27]. However, there is no research about the processing map of the Fe-6.5wt. %Si alloys for simulating the rolling parameters. Thus, it is necessary to analyze the flow behavior characteristics and processing map and to simulate the rolling parameters to ensure the rolling stability for the industrialized production of the Fe-6.5wt. %Si alloys.
In this study, the effect of deformation conditions on the flow behavior and microstructural evolution of the Fe-6.5wt. %Si alloy during compression was investigated. The constitutive equations were established. The relationship between the microstructure and the constitutive equation was investigated. PMs were generated to investigate the feasibility of the rolling process, and the microstructures corresponding to each region of a particular PM were also observed. Based on the analysis of the surface quality, microstructures, and ordered structures, the optimized processing parameters were obtained.
2. Materials and Methods
Fe-6.5wt. %Si alloy ingots were cast in a vacuum medium-frequency induction furnace by melting pure iron (Fe = 99.5 wt. %) and metallic silicon (Si = 99 wt. %) above 1500 °C. The chemical composition is presented in Table 1. After homogenization at 1050 °C for 50 h, the ingots were die-forged into square billets with a cross-section of 24 × 24 mm2 at 800–1100 °C.

Table 1.
Chemical composition of Fe-6.5wt. %Si alloy (wt. %).
Cylindrical specimens of Ф6 mm × 12 mm were machined from the square billets with equiaxed grains. Isothermal compression tests were conducted using a GleebleTM thermo-mechanical test frame (Gleeble-1500, Dynamic System Institution, New York, NY, USA) at temperatures ranging from 650–950 °C and strain rates ranging from 0.01–10 s−1. The height reductions were 50% and 80%, and, hence, the corresponding true stains were 0.7 and 1.6, respectively. The specimens were heated to the required temperature at 20 °C/s, maintained for 180 s, compressed at a specified temperature, and finally quenched in water. Recently, the research indicates that the range of the temperature is less than 9 °C at 500 °C and 10 s−1, and the slight increase of the temperature has almost no influence on the strain stress. The temperature correction is not further studied. In our case, the measurements showed this value was about 8 °C. Thus, the temperature correction was not further studied.
The compressed specimens were polished and etched with a solution of 5% HNO3 in deionized water. The microstructures of these specimens were observed using an optical microscope (Zeiss, Jena, Germany).
The ordered structures of the specimens after deformation were observed using X-ray diffraction (XRD, D/max2550HB+/PC) (Bruker, Karlsruhe, Germany). An electron backscattered diffraction detector (EBSD) mounted on a Zeiss Supra 55 scanning electron microscope (Oxford Instruments, Oxford, UK,) was used to detect recrystallization fractions of the specimens. HKL Channel 5 programs were used for processing the data.
3. Results and Discussion
3.1. Flow Behavior Characteristics
The true stress–true strain curves of the Fe-6.5wt. %Si alloy at a total true strain of 1.6 under various deformation conditions are shown in Figure 1. It can be observed that the flow stress increased rapidly at the beginning of deformation, reached a steady state after a stress peak, and increased slowly at the end in most of the curves e.g., in the curve indicating deformation at the temperature of 750 °C and strain rate of 0.01 s−1 (Figure 1a). It is also observed that the flow stress depended distinctly on the temperature, strain rate, and strain. The flow stress decreased with the increase of deformation temperature, and increased with the increase of strain rate. A peak stress was evident in most of the curves e.g., in the curve indicating deformation at the temperature of 650 °C and strain rate of 0.1 s−1 (Figure 1b).
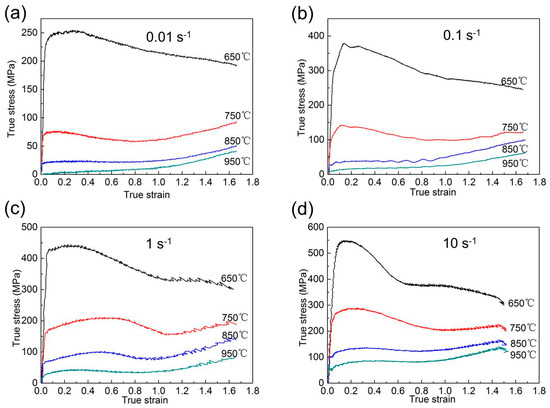
Figure 1.
True stress–true strain curves of the Fe-6.5wt. %Si alloy under various deformation conditions: (a) 0.01 s−1; (b) 0.1 s−1; (c) 1 s−1; (d) 10 s−1.
Hot compressive deformation is influenced by work hardening and dynamic softening. Li reported [20] that, with the increase of the dislocation density, the flow stress increases during the hot compression. Therefore, at the beginning of the deformation, dislocation multiplication leads to work hardening. It exceeds dynamic softening, which causes the increase of the flow stress. DRX begins when the strain reaches a critical value. This leads to dynamic softening and causes the decrease of the flow stress. As the deformation progresses, the dynamic softening offsets the work hardening, and, consequently, the flow stress remains stable. This is called the DRX model, as observed in the curve indicating deformation at the temperature of 750 °C and the strain rate of 0.01 s−1. However, as the deformation progresses, the flow stress increases slowly or is in the steady state, and DRV but not DRX occurs, which is called the DRV model, as observed in the case of the deformation at the temperature of 950 °C and the strain rate of 0.01 s−1. In contrast, the flow stress continues to decrease beyond peak stress, as in the case of the deformation at the temperature of 650 °C. The reason for this phenomenon is that the degree of ordering decreases gradually with deformation, and a disordered alloy is finally obtained. The deformation-induced disordering and DRV are the main softening mechanisms [20].
The work hardening rate during compression can be calculated using the equation () [28]. Notably, the effects of work hardening and softening mechanisms are considered during the plastic deformation, and it is necessary to remove the elastic stage of the flow curves [29]. Figure 2 shows the θ–ε and θ–σ curves of the Fe-6.5wt. %Si alloy at the true strain of 0–0.6.
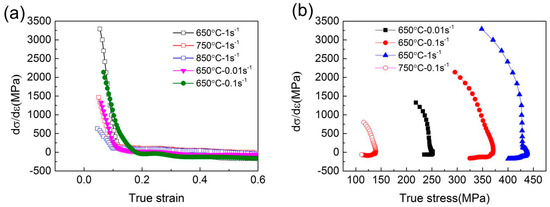
Figure 2.
θ–ε and θ–σ curves of the Fe-6.5wt. %Si alloy: (a) θ–ε; (b) θ–σ.
The positive values of θ indicate that the work hardening exceeds the dynamic softening. The peak stress and corresponding strain can be obtained from the flow curve, whereas the true peak stress () and strain () can be calculated from the θ–ε and θ–σ curves when θ = 0 [29], as presented in Table 2.
Table 2.
Peak stress (MPa) and corresponding strain of the Fe-6.5wt. %Si alloy.
It can be observed that the work hardening rate increased with the decrease of temperature and increase of strain rate, as shown in Figure 2a. Similarly, the peak stress increased with the decrease of temperature and increase of strain rate, as shown in Figure 2b.
The DRX was initiated before the flow stress reached a peak. The critical stress () and corresponding strain () could satisfy the condition [30]. The critical stress and corresponding strain are listed in Table 3.
Table 3.
Critical stress (MPa) and corresponding strain of the Fe-6.5wt. %Si alloy.
3.2. Constitutive Equation
A constitutive equation is usually used to describe the relationship among the flow stress, strain rate, and temperature:
where is the strain rate, σ is the flow stress, A1, A2, A, n1, β, α (=), and n are constants, R is the gas constant (8.314 J·mol−1K−1), T is the deformation temperature, and Q is the activation energy of the deformation. The value of Q reflects the relationship between the work hardening and dynamic softening during the hot compressive deformation, and it also describes the formability of the alloy.
The above three constitutive equations correspond to various conditions, i.e., the power function (1) corresponds to low stress, the exponential function (2) corresponds to high stress, and the hyperbolic sine function (3) corresponds to a wide range of flow stresses [31,32,33].
In addition, the relationship between the strain rate and temperature during compression can be represented by the Zener–Hollomon parameter [34]:
These constants and the activation energy are calculated using the peak stress, steady-state stress, or another stress at a certain strain. The peak stress is usually favored because it is useful in industrial production [35]. In this study, not all the peak stresses could be obtained. Therefore, the steady-state stress was also used. Applying logarithm on both sides of Equations (1)–(4), the new equations can be derived as follows:
The slopes of curves of vs. and σ represent the values of and β, respectively, as shown in Figure 3a,b. The value of α (=) can also be calculated. The slope of curve of vs. is the value of n, as shown in Figure 3c. The slope of curve of vs. is , and the intercept is , as shown in Figure 3d. Therefore, the values of Q and A can be obtained, as listed in Table 4.
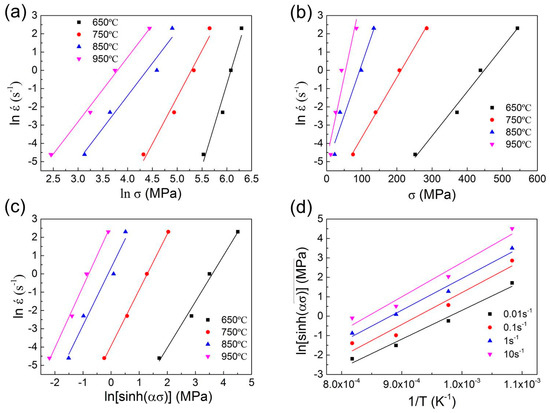
Figure 3.
Plots of (a) vs. ; (b) vs. σ; (c) vs. ; (d) vs. .
Table 4.
Constants and activation energy of the Fe-6.5wt. %Si alloy.
The value of Q was 410 kJ/mol in the present study. Liang [22] reported that the activation energy of the Fe-6.5wt. %Si alloy varies from 211 kJ/mol (at 800–1100 °C) to 478 kJ/mol (at 500–700 °C), depending on the crystalline structure and deformation temperature. Therefore, the constitutive equation with the hyperbolic sine function, Equation (3), and Zener–Hollomon parameter, Equation (4), is written as
However, Kim [36] indicated that the peak stress could be expressed better as a function of than as a function of Z. Moreover, the critical stress (σc) for DRX [37] and the steady-state stress (σss) [36] could be also expressed as functions of . Figure 4 shows the relationship between stresses and of the Fe-6.5wt. %Si alloy. The stresses are expressed as a function of , and the relationships can be expressed using linear equations. When the value of is higher than ‒2.5, the relationship between these stresses and the value of can be written as
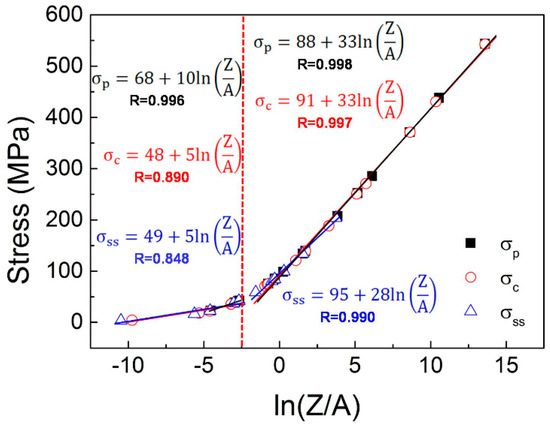
Figure 4.
Linear form of compression stress as functions of for the Fe-6.5wt. %Si alloy.
When the value of is lower than −2.5, the equations can be written as
When the value of was lower than −2.5, the dynamic softening offset the work hardening, and the flow stress remained stable without a peak, i.e., in the DRV model, as observed in the curve indicating deformation at the temperature of 950 °C and strain rates of 0.01 s−1 and 0.1 s−1, as shown in Figure 1a,b and Table 2. According to Equations (11)–(16), σc and σss could be expressed using σp as (), or ().
3.3. Relationship between Microstructures and Z Parameters
Figure 5 shows the microstructures before and after the deformation at the true strain of 1.6 under various deformation conditions. The original grains were equiaxed with the grain size of 400 μm, as shown in Figure 5a. When the specimen was deformed at the true strain of 1.6, temperature of 650 °C, and strain rate of 0.01 s−1, a few serrated boundaries (indicated by a black arrow) appeared in the deformation zones, and fibril-shaped vimineous grains also appeared. The elongated grains were spread across all the deformation areas, as shown in the inset of Figure 5b. With the increase of temperature to 750 °C, the content of the fibrous grains decreased. Some dynamically recrystallized grains appeared inside the elongated grains (indicated by a red arrow) and along the serrated boundaries (indicated by the black arrow) after deformation at the strain rate of 0.01 s−1, namely, the CDRX occurred [24], as shown in Figure 5c. With the increase of strain rate to 0.1 s−1 at 750 °C, the degree of DRX decreased, and the grain sizes of the dynamically recrystallized grains became refined. Moreover, the elongation grains and serrated boundaries remained unchanged, as shown in Figure 5d. The specimen was deformed at the temperature of 850 °C and strain rate of 1 s−1, some fibrous grains disappeared, and irregular grain boundaries emerged, which indicated the initial stages of DRX [38]. The nucleated fine grains (indicated by the red arrow) appeared, and some dynamically recrystallized grains could be observed as shown in the inset of Figure 5e. Moreover, a few elongated grains still existed in the Fe-6.5wt. %Si alloy. Figure 5f shows the microstructure of the specimen deformed at the temperature of 950 °C and strain rate of 10 s−1, which is similar to that deformed at the temperature of 850 °C and strain rate of 1 s−1. The elongated grains existed in the specimen, and dynamically recrystallized formed along elongated grain boundaries. Namely, the DDRX occurred [24]. The serrated boundaries and straight boundaries simultaneously existed in the deformation areas. In summary, higher temperature and lower strain rate are beneficial to recrystallization.

Figure 5.
Microstructures of the Fe-6.5wt. %Si alloy (a) before and after deformation at the true strain of 1.6 under various deformation conditions: (b) 650 °C and 0.01 s−1; (c) 750 °C and 0.01 s−1; (d) 750 °C and 0.1 s−1; (e) 850 °C and 1 s−1; (f) 950 °C and 10 s−1.
The Z parameters under various deformation conditions are listed in Table 5, which are obtained from Equation (10). The values of Z in the frames correspond to the deformation conditions discussed above (in the box in Table 5) and demonstrate that DRX occurs under certain conditions. The dynamically recrystallized grains grow in the gray areas, which are zones of low Z values. It can be concluded that, when the values of Z are lower than 1020, DRX occurs in the deformation areas. Especially, a lower value of Z usually corresponds to a higher degree of DRX.
Table 5.
Z parameters under various deformation conditions.
3.4. Processing Map
A PM based on the DMM is a very useful technique to investigate the deformation characteristics of metallic materials and alloys. PMs combined with microstructure evolution are beneficial in order to investigate the deformation mechanism, optimize the processing parameters, and control the microstructures. PMs are created with a power dissipation map and an instability map. The power dissipation map is drawn based on the value of power dissipation efficiency (η) at various deformation temperatures and strain rates. The value of η can indicate the deformation mechanism, such as DRV and DRX [39]. It can be calculated using the following equation:
where m is the strain rate sensitivity parameter and is given as
Generally, the microstructure transformation become more stable and secure and the workability is improved with the increase of the value of η. Therefore, the deformation condition with the maximum value of η is usually adopted in the processing. Processing instability may increase during hot deformation. Prasad’s criterion [40] is an effective method to distinguish whether an unstable flow occurs, and is given by
If ξ < 0, the unstable flow occurs during the hot deformation, which is harmful to the material processing. Depending on the value of ξ at various deformation temperatures and strain rates, the instability map can be obtained. The optimized deformation temperature and strain rate can be derived from the PMs based on the power dissipation map and instability map. The PMs at various true strains are shown in Figure 6. The power dissipation efficiency is represented by the black line, and instability levels are indicated by the colored areas.
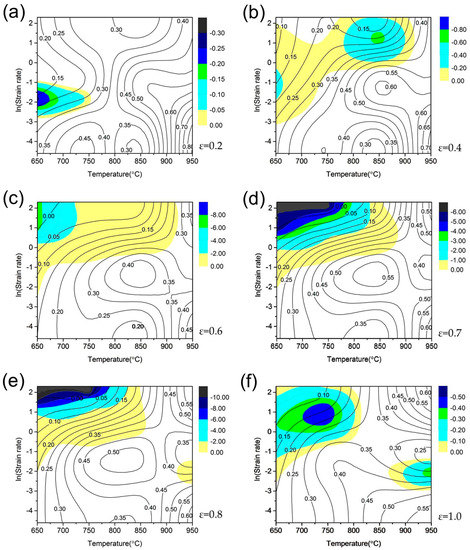
Figure 6.
Processing maps of the Fe-6.5wt. %Si alloy at various true strains: (a) 0.2; (b) 0.4; (c) 0.6; (d) 0.7; (e) 0.8; (f) 1.0. The contour lines represent the values of the power dissipation efficiency. The colored areas and bar charts represent the instability levels.
A high value of η is observed in the regions with high temperatures, and the unstable area lies in the regions with low temperatures and high strain rates (Figure 6a). With the increase of strain from 0.2 to 1.0, as indicated from Figure 6a–f, the value of η decreased in the region with high temperatures and low strain rates, increased in the region with high temperatures and high strain rates, and remained unchanged in the other regions. Furthermore, the unstable areas expanded, and the unstable flow occurred even in the region with high temperature and low strain rate (Figure 6f), when the reduction ratio increased. Notably, the unstable areas were relatively smaller in the PM at the true strain of 0.7, and the values of η were between 0.4 and 0.6 in the stable regions, which can be adopted in the rolling processing. The true strain of 0.7 corresponds to the reduction ratio of approximately 50%, which is usually adopted in our rolling Fe-6.5wt. %Si alloy sheet because it provides a relatively high possibility of achieving good quality in statistics. These results theoretically prove that the rolling reduction of 50% is favorable to the rolling stability of the Fe-6.5wt. %Si alloy.
The PM at the true strain of 0.7 can be divided into five domains, as shown in Figure 7. The deformation temperatures and strain rates corresponding to the five domains are presented in Table 6. The hot deformation is unstable (ξ < 0) below 800 °C and above 1 s−1 (Domain 1), and the representative sample was compressed at the temperature of 650 °C and strain rate of 10 s−1. Conversely, some regions above 900 °C and below 0.1 s−1 are stable (ξ > 0), where the values of η are the highest, i.e., less than 0.6 (Domain 2, 5). These regions are considered as reasonable regions for processing. The typical samples were deformed at the temperature of 950 °C and strain rate of 10 s−1 (Domain 2) and the temperature of 950 °C and strain rate of 0.01 s−1 (Domain 5). The values of η also exhibited a peak in the temperature range of 800–900 °C and the strain rate range of 0.1–0.4 s−1 (Domain 3), and reached 0.55; further, the typical sample was compressed at the temperature of 850 °C and strain rate of 0.2 s−1. Other regions (Domain 4) below 800 °C and below 0.1 s−1 were also stable, but the power dissipation efficiency was lower (η < 0.35), and the specimen was deformed at the temperature of 650 °C and strain rate of 0.01 s−1.
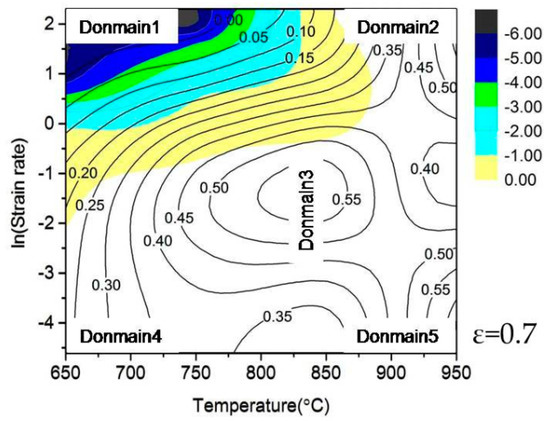
Figure 7.
Labeled PMs of the Fe-6.5wt. %Si alloy at the true strain of 0.7.
Table 6.
Temperatures and strain rates corresponding to the five domains.
3.5. Optimization of Processing Parameters
The optimized processing parameters can be obtained depending on the PM. The processing parameters are chosen from the region with high power dissipation efficiency and stability. However, micro-cracking often occurs when the power dissipation efficiency is excessively high (η > 0.6). In general, DRX is the best choice for hot deformation in order to acquire good mechanical properties and proper microstructure. As the power dissipation efficiency is suitable (0.5 ≤ η ≤ 0.55, for high stacking fault energy materials), and hot deformation is stable [40], the deformation conditions in Domains 2, 3, and 5 are the theoretically optimized processing parameters for the Fe-6.5wt. %Si alloy, according to Figure 7. The corresponding temperatures and strain rates are above 900 °C and 0.01–10 s−1, respectively, or 800–900 °C and below 0.4 s−1, respectively. However, the ordered structures and ordering degree also influence the mechanical property [41]. Therefore, the surface quality, microstructures, and ordered structures should be investigated to verify the validity of the theoretical parameters.
Figure 8 shows the specimens before and after deformation at the true strain of 0.7 under various deformation conditions (corresponding to the five domains). It is observed that the specimen was distinctly unstable during hot deformation at the temperature of 650 °C and strain rate of 10 s−1 (Domain 1, the unstable region). The shape of the specimen was barreled after deformation at the temperature of 650 °C and strain rate of 0.01 s−1 (Domain 4, the region with low power dissipation efficiency), but the compression surfaces were non-parallel. Others (Domains 2, 3, and 5; the region with high power dissipation efficiency and stability) deformed stably, and no crack or deformation instability appeared.
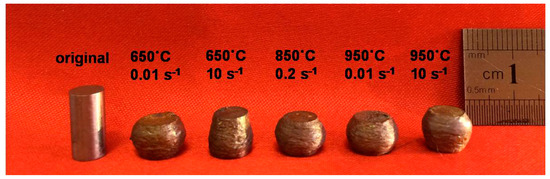
Figure 8.
Specimens before and after deformation at the true strain of 0.7 under various deformation conditions.
Figure 9 shows the XRD patterns of the specimens after deformation at the true strain of 0.7 under various conditions. Generally, as the forgings are obtained by subsequent air cooling after hot forging, the A2 disordered phase, B2 ordered phase and D03 ordered phase mainly exist in the Fe-6.5wt. %Si alloy. It is observed in Figure 9 that the Fe14Si2 phase, B2 ordered phase and A2 disordered phase were present in all the specimens, whereas the D03 ordered phase was not formed. Li [42,43] reported that the D03 ordered phase is extremely harmful to the mechanical property of the Fe-6.5wt. %Si alloy. However, the B2 structures have little effect on the mechanical property. Therefore, the five kinds of deformation conditions are considered feasible from the analysis of surface quality and ordered phases.
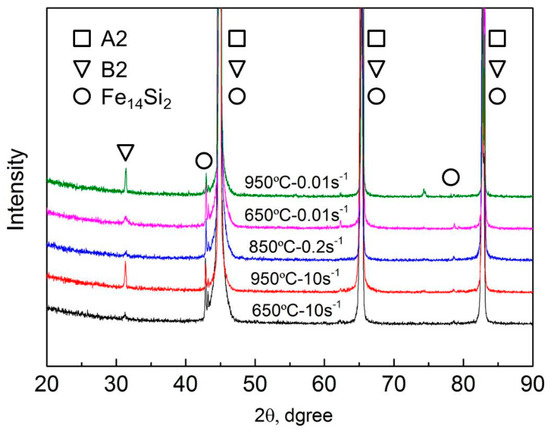
Figure 9.
X-ray diffraction patterns of the Fe-6.5wt. %Si alloy after deformation at the true strain of 0.7.
The Z parameters corresponding to the five domains are listed in Table 7. As the previous discussion and conclusion indicated, with the values of Z lower than 1020, DRX occurs in the deformation areas. A lower value of Z often indicates a higher degree of DRX. Theoretically, very few dynamically recrystallized grains would appear in Domains 1 and 4, according to Table 7. Owing to the values of Z lower than 1020, DRX occurs in Domains 2, 3, and 5. The investigation of each domain is described in detail as follows.
Table 7.
Z values corresponding to the five domains.
Domain 1 indicates low power dissipation efficiency (0 < η < 0.2) and very high instability (ξ < −0.2), and is a highly unstable region in the PM. Figure 10 shows the corresponding microstructure and recrystallized fraction at the true strain of 0.7. The elongated grains were spread across all the deformation areas, and no DRX was observed in the inset of Figure 10a. The content of complete recrystallization (high-angle grain boundaries, misorientation angle θ > 15°) was approximately 0, as shown in Figure 10b. The content of partial recrystallization (low-angle grain boundaries, 15° θ > 3°) occurring in the marginal area reached only 2.37%. The deformed grains occupied almost the entire region. Thus, the deformation conditions of Domain 1 are not appropriate for the Fe-6.5wt. %Si alloy.
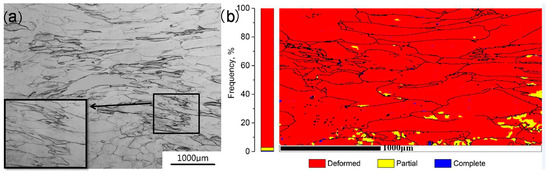
Figure 10.
(a) microstructure; (b) recrystallized fractions of Domain 1 at the true strain of 0.7.
Domain 2 indicates high power dissipation efficiency (0.4 < η < 0.55) and low instability (ξ > 0), and is a very stable region in the PM. Figure 11 shows the microstructure and recrystallized fraction of the specimen deformed at the true strain of 0.7, temperature of 950 °C, and strain rate of 10 s−1. The deformed grains almost disappeared, and DRX occurred in the deformation area, as shown in Figure 11a. However, a small number of elongated grains still existed in the deformation region. The recrystallized fraction including complete and partial recrystallization reached 68.62%, and the content of deformed grains was almost 30%, as shown in Figure 11b. Therefore, these deformation parameters (Domain 2) are applicable for the Fe-6.5wt. %Si alloy.
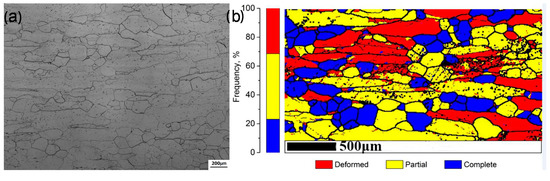
Figure 11.
(a) microstructure; (b) recrystallized fractions of Domain 2 at the true strain of 0.7.
Domain 3 also indicates high power dissipation efficiency (0.4 < η < 0.55) and low instability (ξ > 0), and is a very stable region. The specimen was deformed at the temperature of 850 °C and strain rate of 0.2 s−1. Figure 12 shows the microstructure and recrystallized fraction of the specimen at the true strain of 0.7. The deformed grains could be observed in the center area (indicated by the black arrow), and a few fine recrystallized grains were formed in this region (indicated by the red arrow), as shown in Figure 12a. The DRX fraction was 31%, and the content of deformed grains reached 70%, as shown in Figure 11b. These deformation parameters of Domain 3 are applicable for the Fe-6.5wt. %Si alloy.
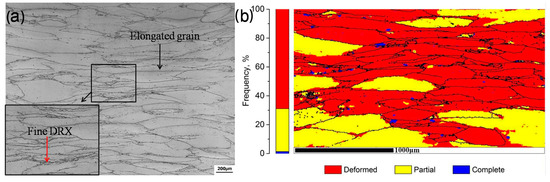
Figure 12.
(a) microstructure; (b) recrystallized fractions of Domain 3 at the true strain of 0.7.
Domain 4 reveals a medium power dissipation efficiency (0.2 < η < 0.35) and low instability (ξ > 0), and is a stable region. Figure 13 shows the microstructure and recrystallized fraction of this specimen. The microstructure of this specimen was similar to that deformed at the temperature of 650 °C and strain rate of 0.01 s−1. It can be observed that the center region was filled with elongated grains, and small deformation grains occupied the corner region, as shown in Figure 13a. The complete DRX fraction in Domain 4 was similar to that in Domain 1, but the partial DRX fraction was 20%, which occurred in the marginal area. The content of deformed grains reached 80%, as shown in Figure 13b. Hence, Domain 4 is not applicable to the Fe-6.5wt. %Si alloy.
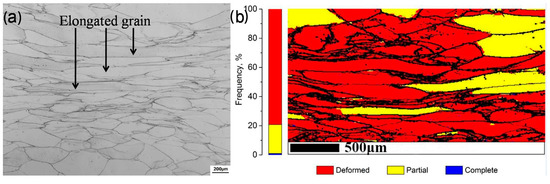
Figure 13.
(a) microstructure; (b) recrystallized fractions of Domain 4 at the true strain of 0.7.
Domain 5 indicates high power dissipation efficiency (0.45 < η < 0.6) and low instability (ξ > 0), and is a very stable region in the PM. Figure 14 shows the corresponding microstructure and DRX content at the true strain of 0.7. It can be observed that no deformed grains appeared in this region, which was filled with DRX grains, as shown in Figure 14a. The content of complete DRX was 21%, and the partial DRX fraction reached 66%, as shown in Figure 14b. The degree of deformed grains was only approximately 10%. Thus, the deformation conditions of Domain 5 are very favorable to the Fe-6.5wt. %Si alloy.
Figure 14.
(a) microstructure; (b) recrystallized fractions of Domain 5 at the true strain of 0.7.
Based on the analysis of surface quality, microstructures, and ordered structures, it can be concluded that the Fe-6.5wt. %Si alloy is unstable under the deformation conditions of Domain 1. The order of Z corresponding to the five specimens is 3.1 × 10¹⁵ (Domain 5) < 2.3 × 10¹⁸ (Domain 3) < 3.1 × 10¹⁸ (Domain 2) < 1.5 × 10²¹ (Domain 4) < 1.5 × 1024 (Domain 1), and the order of the DRX fractions is 88% (Domain 5) > 69% (Domain 2) > 31% (Domain 3) > 21% (Domain 4) > 3% (Domain 1). DRX occurred in the deformation areas where the value of Z was lower than 1020. The processing parameters of Domains 2 and 5 are very favorable to the Fe-6.5wt. %Si alloy, and those of Domain 3 are applicable. Therefore, the optimized processing parameters for the Fe-6.5wt. %Si alloy are the temperature and strain rate of more than 900 °C and 0.01–10 s−1, respectively, or 800–900 °C and less than 0.4 s−1, respectively, according to the PMs and the analysis of the surface quality, ordered phases, and microstructures. Finally, based on the analysis of the processing maps, the optimum rolling parameters can be adopted to ensure the rolling stability for the industrialized production of the Fe-6.5wt. %Si alloys.
4. Conclusions
The flow behavior of the Fe-6.5wt. %Si alloy during hot compression was investigated at temperatures ranging from 650–950 °C and strain rates ranging from 0.01–10 s−1. PMs were established at various true strains. The following conclusions can be drawn:
- (1)
- The activation energy of the Fe-6.5wt. %Si alloy was 410 kJ/mol at 650–950 °C. The constitutive equation with the hyperbolic sine function and Zener–Hollomon parameter is written as: .
- (2)
- A linear relationship between the flow stress (σp, σc, σss) and the value of was derived. In addition, σc and σss could be expressed using σp as (), or ().
- (3)
- DRX occurred at the deformation areas with the values of Z lower than 1020. In particular, a lower value of Z usually corresponds to a higher degree of DRX.
- (4)
- The value of η decreased in the region with high temperature and low strain rate, increased in the region with high temperature and high strain rate, and remained constant in other regions with the increase of true strain. Furthermore, the unstable areas expanded.
- (5)
- The microstructure and formability of the Fe-6.5wt. %Si specimen were consistent with the PM. The unstable areas were relatively small in the PM at the true strain of 0.7, and the values of η were relatively high (0.4 < 0.6) in the stable regions. Very high DRX contents were observed in the stable regions with high power dissipation efficiency.
- (6)
- This study demonstrated that the true strain of 0.7 corresponds to the optimum reduction for compressing the Fe-6.5wt. %Si alloy. The optimized processing parameters are the temperature and strain rate of more than 900 °C and 0.01–10 s−1, respectively, or 800–900 °C and less than 0.4 s−1, respectively.
Acknowledgments
Financial support from the Natural Science Foundation of China (51471031, U1660115) and the State Key Laboratory for Advanced Metals and Materials (2016Z-17) are gratefully acknowledged.
Author Contributions
Shibo Wen conceived, designed and performed the experiments; Chaoyu Han and Bao zhang contributed to the EBSD work; Shibo Wen wrote the manuscript; Yongfeng Liang, Feng Ye and Junpin Lin supervised the work.
Conflicts of Interest
The authors declare no conflict of interest.
References
- Arai, K.; Tsuya, N. Ribbon-form silicon-iron alloy containing around 6.5 percent silicon. IEEE. Trans. Magn. 1980, 16, 126–129. [Google Scholar] [CrossRef]
- Narita, K.; Teshima, N.; Mori, Y.; Enokizono, M. Recent researches on high silicon-iron alloys. IEEE. Trans. Magn. 1981, 17, 2857–2862. [Google Scholar] [CrossRef]
- Bozorth, R.M. Ferromagnetism; Van Nostrand: New York, NY, USA, 1951; pp. 50–52. ISBN 0-7803-1032-2. [Google Scholar]
- Raviprasad, K.; Tenwick, M.; Davies, H.A.; Chattopadhyay, K. The nature of ordered structures in melt spun iron-silicon alloys. Scr. Mater. 1986, 20, 1265–1270. [Google Scholar] [CrossRef]
- Raviprasad, K.; Chattopadhyay, K. The influence of critical points and structure and microstructural evolution in iron rich Fe-Si alloys. Acta Metall. 1993, 41, 609–624. [Google Scholar] [CrossRef]
- Takada, Y.; Abe, M.; Masuda, S.; Inagaki, J. Commercial scale production of Fe-6.5 wt % Si sheet and its magnetic properties. J. Appl. Phys. 1988, 64, 5367–5369. [Google Scholar] [CrossRef]
- Ros-Yanez, T.; Houbaert, Y.; Gómez Rodríguez, V. High-silicon steel produced by hot dipping and diffusion annealing. J. Appl. Phys. 2002, 91, 7857–7859. [Google Scholar] [CrossRef]
- He, X.D.; Li, X.; Sun, Y. Microstructure and magnetic properties of high silicon electrical steel produced by electron beam physical vapor deposition. J. Magn. Magn. Mater. 2008, 320, 217–221. [Google Scholar] [CrossRef]
- Machado, R.; Kasama, A.H.; Jorge, A.M.; Kiminami, C.S.; Fo, W.B.; Bolfarini, C. Evolution of the texture of spray-formed Fe-6.5 wt % Si-1.0 wt % Al alloy during warm-rolling. Mater. Sci. Eng. A. 2007, 449, 854–857. [Google Scholar] [CrossRef]
- Lima, C.C.; Da Silva, M.C.A.; Sobral, M.D.C.; Coelho, R.E.; Bolfarini, C. Effects of order-disorder reactions on rapidly quenched Fe-6.5%Si alloy. J. Alloys Compd. 2014, 586, S314–S316. [Google Scholar] [CrossRef]
- Fish, G.E.; Chang, C.F.; Bye, R. Frequency dependence of core loss in rapidly quenched Fe-6.5 wt % Si. J. Appl. Phys. 1988, 64, 5370–5372. [Google Scholar] [CrossRef]
- Liang, Y.F.; Wang, S.; Li, H.; Jiang, Y.M.; Ye, F. Fabrication of Fe-6.5 wt % Si ribbons by melt spinning method on large scale. Adv. Mater. Sci. Eng. 2015, 25, 296197. [Google Scholar]
- Wang, S.; Jiang, Y.M.; Liang, Y.F.; Ye, F.; Lin, J.P. Magnetic properties and core loss behavior of Fe-6.5 wt % Si ribbons prepared by melt spinning. Adv. Mater. Sci. Eng. 2015, 2015, 410830. [Google Scholar]
- Li, R.; Shen, Q.; Zhang, L.; Zhang, T. Magnetic properties of high silicon iron sheet fabricated by direct powder rolling. J. Magn. Magn. Mater. 2004, 281, 135–139. [Google Scholar] [CrossRef]
- Liang, Y.F.; Ye, F.; Lin, J.P.; Wang, Y.L.; Chen, G.L. Effect of annealing temperature on magnetic properties of cold rolled high silicon steel thin sheet. J. Alloys Compd. 2010, 491, 268–270. [Google Scholar] [CrossRef]
- Patterson, E.E.; Field, D.P.; Zhang, Y. Characterization of twin boundaries in an Fe-17.5Mn-0.56C twinning induced plasticity steel. Mater. Charact. 2013, 85, 100–110. [Google Scholar] [CrossRef]
- Liang, Y.F.; Ye, F.; Lin, J.P.; Wang, Y.L.; Zhang, L.Q.; Chen, G.L. Effect of heat treatment on mechanical properties of heavily cold-rolled Fe-6.5 wt % Si alloy sheet. Sci. China Technol. Sci. 2010, 53, 1008–1011. [Google Scholar] [CrossRef]
- Haghdadi, N.; Zarei-Hanzaki, A.; Abedi, H.R. The flow behavior modeling of cast A356 aluminum alloy at elevated temperatures considering the effect of strain. Mater. Sci. Eng. A 2012, 535, 252–257. [Google Scholar] [CrossRef]
- Samantaray, D.; Mandal, S.; Jayalakshmi, M.; Athreya, C.N.; Bhaduri, A.K.; Sarma, V.S. New insights into the relationship between dynamic softening phenomena and efficiency of hot working domains of a nitrogen enhanced 316L (N) stainless steel. Mater. Sci. Eng. A 2014, 598, 368–375. [Google Scholar] [CrossRef]
- Li, H.; Liang, Y.F.; Yang, W.; Ye, F.; Lin, J.P.; Xie, J.X. Disordering induced work softening of Fe-6.5wt %Si alloy during warm deformation. Mater. Sci. Eng. A 2015, 628, 262–268. [Google Scholar] [CrossRef]
- Niu, C.S.; Wang, Y.L.; Lin, J.P.; Lin, Z.; Chen, G.L. Dynamic recrystallization mechanisms of Fe3Si based alloys. Trans. Mater. Heat Treat. 2003, 24, 28–32. [Google Scholar]
- Liang, Y.F.; Ge, J.W.; Fang, X.S.; Ye, F.; Lin, J.P. Hot deformation behavior and softening mechanism of Fe-6.5wt % Si alloy. Mater. Sci. Eng. A 2013, 570, 8–12. [Google Scholar] [CrossRef]
- Haghdadi, N.; Zarei-Hanzaki, A.; Farabi, E.; Cizek, P.; Beladi, H.; Hodgson, P.D. Strain rate dependence of ferrite dynamic restoration mechanism in a duplex low-density steel. Mater. Design 2017, 132, 360–366. [Google Scholar] [CrossRef]
- Haghdadi, N.; Cizek, P.; Beladi, H.; Hodgson, P.D. A novel high-strain-rate ferrite dynamic softening mechanism facilitated by the interphase in the austenite/ferrite microstructure. Acta Mater. 2017, 126, 44–57. [Google Scholar] [CrossRef]
- Castan, C.; Montheillet, F.; Perlade, A. Dynamic recrystallization mechanisms of an Fe-8% Al low density steel under hot rolling conditions. Scr. Mater. 2013, 68, 360–364. [Google Scholar] [CrossRef]
- Wang, Y.; Jiang, S.Y.; Zhang, Y.Q. Processing map of NiTiNb shape memory alloy subjected to plastic deformation at high temperatures. Metals 2017, 7, 328. [Google Scholar] [CrossRef]
- Wu, J.; Lü, Z.D.; Zhang, C.J.; Han, J.C.; Zhang, H.Z.; Zhang, S.Z.; Hayat, M.; Cao, P. Investigation of the deformation mechanism of a near β titanium alloy through isothermal compression. Metals 2017, 7, 498. [Google Scholar] [CrossRef]
- Ryan, N.D.; McQueen, H.J.; Evangelista, E. Dynamic recovery and strain hardening in the hot deformation of type 317 stainless steel. Mater. Sci. Eng. 1986, 81, 259–272. [Google Scholar] [CrossRef]
- Mirzadeh, H.; Cabrera, J.M.; Najafizadeh, A. Modeling and prediction of hot deformation flow curves. Metall. Mater. Trans. A 2012, 43, 108–123. [Google Scholar] [CrossRef]
- Poliak, E.I.; Jonas, J.J. A one-parameter approach to determining the critical conditions for the initiation of dynamic recrystallization. Acta Mater. 1996, 44, 127–136. [Google Scholar] [CrossRef]
- Xiang, L.; Tang, B.; Xue, X.Y.; Kou, H.C.; Li, J.S. Characteristics of the dynamic recrystallization behavior of Ti-45Al-8.5 Nb-0.2 W-0.2 B-0.3 Y alloy during high temperature deformation. Metals 2017, 7, 261. [Google Scholar] [CrossRef]
- Sellars, C.M.; McTegart, W.J. On the mechanism of hot deformation. Acta Metall. 1966, 14, 1136–1138. [Google Scholar] [CrossRef]
- Jonas, J.J.; Sellars, C.M.; Tegart, W.M. Strength and structure under hot-working conditions. Platin. Met. Rev. 1969, 14, 1–24. [Google Scholar] [CrossRef]
- Zener, C.; Hollomon, J.H. Effect of strain rate upon plastic flow of steel. J. Appl. Phys. 1944, 15, 22–32. [Google Scholar] [CrossRef]
- McQueen, H.J.; Ryan, N.D. Constitutive analysis in hot working. Mater. Sci. Eng. A 2002, 322, 43–63. [Google Scholar] [CrossRef]
- Kim, S.I.; Yoo, Y.C. Prediction of dynamic recrystallisation behaviour of AISI type 4140 medium carbon steel. Mater. Sci. Technol. 2013, 18, 160–164. [Google Scholar] [CrossRef]
- Babu, K.A.; Mandal, S.; Athreya, C.N.; Shakthipriya, B.; Sarma, V.S. Hot deformation characteristics and processing map of a phosphorous modified super austenitic stainless steel. Mater. Design 2017, 115, 262–275. [Google Scholar] [CrossRef]
- Han, Y.; Liu, G.; Zou, D.; Liu, R.; Qiao, G. Deformation behavior and microstructural evolution of as-cast 904 L austenitic stainless steel during hot compression. Mater. Sci. Eng. A 2013, 565, 342–350. [Google Scholar] [CrossRef]
- Raj, R. Development of a processing map for use in warm-forming and hot-forming processes. Metall. Mate. Trans. A 1981, 12, 1089–1097. [Google Scholar] [CrossRef]
- Prasad, Y. Recent advances in the science of mechanical processing. Indian J. Technol. 1990, 28, 435–451. [Google Scholar]
- Lin, J.P.; Ye, F.; Chen, G.L.; Wang, Y.L.; Liang, Y.F.; Jin, J.N.; Liu, Y. Fabrication technology, microstructures and properties of Fe-6.5 wt % Si alloy sheets by cold rolling. Front. Sci. 2007, 2, 13–26. [Google Scholar]
- Li, H.; Liang, Y.F.; Ye, F. Effect of heat treatment on ordered structures and mechanical properties of Fe-6.5mass%Si alloy. Mater. Trans. 2015, 56, 759–765. [Google Scholar] [CrossRef]
- Li, H.; Liang, Y.F.; He, R.Q.; Lin, J.P.; Ye, F. Ordered structure and mechanical properties of Fe-6.5%Si alloy fabricated by rapid quenching. Acta Metall. Sin. 2013, 49, 1452–1456. [Google Scholar] [CrossRef]
© 2018 by the authors. Licensee MDPI, Basel, Switzerland. This article is an open access article distributed under the terms and conditions of the Creative Commons Attribution (CC BY) license (http://creativecommons.org/licenses/by/4.0/).