Article

Optimization of Graphite Morphology in Mottled Nihard Cast Irons Inoculated with Feb and Manufactured by Centrifugal Casting

by
Juan Asensio-Lozano
1,
Jose Florentino Álvarez-Antolín
2,*,
Alejandro González-Pociño
2 and
Benito Del Río-López
3
1
Departamento de Ciencia de los Materiales e Ingeniería Metalúrgica, Escuela de Ingeniería de Minas, Energía y Materiales, Universidad de Oviedo, C/Independencia 13, 33004 Oviedo, Spain
2
Departamento de Ciencia de los Materiales e Ingeniería Metalúrgica, Edificio Departamental Este, Universidad de Oviedo, C/Wifredo Ricart s/n, 33204 Gijón, Spain
3
Departamento de Física Aplicada e Ingeniería de Materiales, Escuela Técnica Superior de Ingenieros Industriales, Universidad Politécnica de Madrid, c/ José Gutiérrez Abascal 2, 28006 Madrid, Spain
*
Author to whom correspondence should be addressed.
Metals 2018, 8(5), 293; https://doi.org/10.3390/met8050293
Submission received: 27 March 2018 / Revised: 19 April 2018 / Accepted: 20 April 2018 / Published: 24 April 2018
(This article belongs to the Special Issue Alloy Design)

Abstract

:
The present research was focused on the identification of manufacturing factors that have an active influence on the graphite phase formation in Nihard cast irons inoculated with FeB, constituting the outer layer of duplex work rolls. These rolls are used in the finishing stands of hot-strip steel mills where the following are desired: (a) between 2.5 and 4 vol % of graphite; (b) homogeneous graphite distribution across the layer section; and, (c) a reasonable high number of graphite particles across the layer. The research methodology that followed consisted of the application of a saturated design of experiments (DOE), with seven factors, eight experiments, and resolution III. The analyzed responses obtained by quantitative metallographic techniques were: the volume fraction of graphite, Vv; the number of counts per unit area of graphite, NA; and the graphite morphology across the layer thickness. Increasing the addition of FeB from 6 to 10 kg/T reduced the graphite volume fraction and the count number, but had no influence on its morphology. However, an increase of the liquidus temperature from 1225–1230 to 1250–1255 °C, and an increase in the amount of SiCaMn added to the ladle from 0.3 to 0.6 kg/T produced the desired compact graphite morphology.

1. Introduction

Ni-Hard cast irons are white hypoeutectic cast irons where the matrix is composed of cementite and the dispersed constituent is mostly martensite. The martensite is obtained by simple cooling in ambient air as a result of the dissolved alloying elements in the solid austenite solution, which confer a high quenchability. The main alloying elements are Ni, Cr, and Mo in proportions of around 3–5%, 1.5–5%, and <1%, respectively. These cast irons are used when high abrasive wear resistance is required. Depending on the solidification conditions and the Si content, the precipitation of graphite is possible, thus obtaining Nihard mottled cast iron. The purpose of this research was to identify and select variables among the various controllable manufacturing process that were believed to play a role in the precipitation of graphite in Nihard mottled cast irons used as the outer layer of duplex work rolls for finishing stands in hot strip mills in the steel industry. The work was conducted as a collaboration between a Spanish roll manufacturer and the Materials-Pro research group of the Materials Science and Metallurgical Engineering Department, Oviedo University, Spain. The industrial scale study was performed on duplex work rolls with compositions falling within the specification range (Table 1).
These rolls have a core of gray cast iron with a ferrite-pearlite matrix that provides rigidity. The outer ring layer is Nihard cast iron. The manufacturing process is performed by vertical centrifugal casting. During the rolling pass, the working layer is exposed to thermal cycles. This thermal cycling generates thermal stresses that can lead to the fracture of the material [1]. Graphite helps improve thermal shock resistance and reduces friction between the work roll and the rolled strip. The combination of abrasion and thermal fatigue causes a high wear, which is more pronounced in the last steps of the hot strip mill, which is where these rolls are located. The cracks begin to nucleate in the regions where cementite has precipitated. However, their growth develops jointly through this phase and through graphite particles with a laminar morphology [2]. The progression of these cracks may come to a halt if they encounter spheroidal graphite morphologies in their path [3]. A compact graphite geometry, intermediate between laminar and spheroidal morphologies, allows a faster evacuation of heat than the spheroidal geometry [4]. A suitable design of the alloy is decisive for achieving the right proportion and morphology of graphite. The graphite precipitates, forming part of the stable eutectic; however, it does not begin to precipitate until the metastable eutectic has finished precipitating, when the residual liquid has been depleted in carburizing elements [5]. A small amount of fine graphite is desired for this outer layer [6]. When this investigation began, these rolls were manufactured with a graphite percentage of approximately 6–7% in volume, when the maximum objective was 4%. In turn, the graphite had a heterogeneous distribution, with elongated groupings according to the radial direction of the roll, when the objective was to produce a graphite of small size and uniformly distributed with compact morphology, avoiding a possible “notch” effect of the lamellar graphite, and improving the evacuation of the heat when compared to a spheroidal morphology. Table 1 shows the usual chemical composition of the working layer of these work rolls. The objective of this study was to determine which manufacturing factors had a significant effect on the volume fraction, the distribution on the thickness of the working layer, and the morphology of the precipitated graphite. When the entire study was carried out on an industrial scale, with an eminently practical goal, the object of analysis was not to determine the possible physico-metallurgical mechanisms of graphite nucleation, but rather to determine the effect of varying certain industrial factors on the amount, distribution, and morphology of precipitated graphite. In previous studies carried out by the authors of this paper [7,8], it was concluded that the main manufacturing factors with a significant effect on these variables were the Liquidus Temperature, % Si, the type of FeSi employed and the amount of SiCaMn, both added to the inoculation of the molten iron bath. The type of centrifuge machine did not have a direct effect on the amount or morphology of the precipitated graphite, although it was found to have a significant effect related to the Liquidus Temperature. Thus, if the Liquidus Temperature dropped to 1235–1240 °C, the volume fraction of graphite increased [8]. These factors were analyzed once again in this paper, though with modified values or levels in the sense that the aforementioned previous studies predicted an improvement in the microstructure of the material. An original factor of this research was the inclusion of FeB as a bath inoculant and as an element favoring a compact morphology of precipitated graphite [9]. Recent studies have confirmed that an increase in the content of B reduces the volume fraction of graphite and deteriorates the spheroidal morphology [10]. In White Cast Irons, B tends to segregate principally at the Austenite/Carbide interface, decreasing the proportion of proeutectic austenite versus the metastable constituent [11]. In a previous study, the ‘whitening’ effect of adding FeB was verified by increasing the volume fraction of Ledeburite and mixed carbides (CrFe)3C [12,13]. Another new manufacturing factor included in this study was the % Ni. Ni contributes to quenchability [14], although its content, along with that of Si, influences the volume fraction of precipitated graphite [15]. The diameters of these rolls oscillated between 650 and 750 mm, and their lengths between 1800 and 2200 mm. The thickness of the working layer was around 50–60 mm.

2. Materials and Methods

The manufacturing process of these rolls, and in particular, their working layer, can be summarized in the following steps: (a) Melting conducted in a medium frequency induction furnace; (b) Bleeding at a temperature of 1380 °C; and (c) Stream-ladle treatment with bath inoculants [16]. Table 2 shows the chemical composition of the inoculants and additives used and the amounts added in the ladle. The size of the inoculants ranges from 5 to 20 mm. The casting is done in several stages: Initially, the working layer is poured. This working layer is run through a ceramic duct with three outlet holes in the bottom of the mold, which project the molten alloy towards the periphery of the mold as it rotates. Subsequently, the first layer of the core is poured, which must ensure an optimum union with the working layer. Finally, the rest of the core is poured. The casting temperature of the working layer is 1320 °C. Demolding takes place 4 to 5 days after casting [17].
The research methodology followed was a Saturated Experiment Design, where seven factors of manufacture and two levels of work were analyzed for each factor, with a total of eight experiments [18]. Using this research methodology and deliberately varying certain working conditions, the aim was to generate more detailed knowledge regarding a given industrial response. To this end, the variations in the response to changes in certain work factors were analyzed [19]. In this case, the analyzed industrial responses were the volume fraction of graphite, the number of graphite “counts” per unit area, and the graphite morphology, measured by the ratio between the maximum and minimum Feret diameters. In industrial processes, a few factors are usually responsible for the major variations in the analyzed response, with the remaining factors being responsible for minor variations, often indistinguishable from experimental noise. Full factorial designs of experiments require a large number of experiments, which grows exponentially depending on the number of factors studied. When there are k factors in a full factorial design of experiments (DOE), the number of tests is 2k, where 2 is the number of levels applied to each of the factors [20,21]. Fractional factorial DOEs allow a large number of factors to be studied by means of a much smaller number of experiments, assuming the loss of information of possible interactions between factors, which are not usually very significant in practice. It should be noted that fractional factorial DOEs are represented as 2 N k q , where 2 is the number of levels, k the number of factors, p the degree of fractionation, and N the resolution. The resolution of a DOE indicates the level of confounding generated in the estimation of the effects; i.e., it represents the loss of information of possible interactions between factors. In general, a DOE with resolution N is one in which no effect of q factors is confounded with another containing less than N-q factors [22]. In our case, the proposed DOE is of the type 2 III 7 4 , which means that its resolution is III, hence the main effects are confused with 2-factor interactions. It can be seen that 3(resolution) = 1(main effects) + 2(2 − factor interactions).
The research was carried out on an industrial scale, so the eight samples analyzed corresponded to eight real rolls. Table 3 shows the factors of manufacture analyzed and the levels that were fixed for each factor. Factor D corresponds to the type of centrifugal casting machine used.
The difference between level −1 and level +1 was that the machine corresponding to level + 1 had an additional insulation layer that promoted slower solidification rates in the working layer. The Liquidus Temperature was obtained from the actual cooling curve during the solidification of the alloy. Table 4 shows the matrix of the experiments including the generators of the matrix columns and the confusions. In this analysis, it was only possible to estimate the principal effects. Table 4 presents the DOE matrix, while Table 5 shows the generators, effects, and confusions. The “Generators” column indicates the applied sign algorithm in the construction of columns D, E, F, and G. The “Confounders” column shows the confounding pattern [23]. Table 4 shows the array of experiments where Columns D, E, F, and G were constructed as the product of columns A × B, A × C, B × C, and A × B × C, respectively. These “products” were denominated as 2 III 7 4 design generators and introduced second-order confounders (2-factor interactions) with the main effects. The “Confounders” column in Table 5 indicates the second-order interactions (2 factors) whose effects were confounded. In this case, for instance, interactions BD + CE + FG will be confounded with main effect A and the rest of the 2nd-order interactions listed in this column.
The experimental procedure describing the metallographic techniques leading to the measured responses specified above can be summarized as follows. After solidification, samples were cut from the upper part of the roll barrel corresponding to its upright position when vertical centrifugal casting took place. The dimensions of the metallographic specimens were approximately 15 mm × 15 mm × 40 mm with the major length coincident with the layer thickness in the direction of the roll radius. Specimen preparation was conducted by mechanical grinding with 60-, 120-, 240- and 600-grit SiC papers. Next, they were polished in two consecutive stages with 6 μm and 1 µm oil-based diamond paste without etching to reveal the graphite phase [24]. For the sake of simplicity in the analysis of the results, the samples were divided into four zones of equal size comprised between the periphery and the ring-core roll interface. Five micrographs were randomly taken from each zone with an Olympus PMG3 light optical microscope (LOM, Olympus Corporation, Hamburg, Hamburg, Germany) connected to an OmniMet® Enterprise device for electronic image data acquisition and archiving. Quantitative metallographic assessment of the graphite phase was performed with an Image ProPlus (version 4.5.0.29, Media Cybernetics, Rockville, MD, USA) coupled to a Materials-Pro module imaging software [25]. In order to conduct the DoE analysis and the derivation of the significant effects, the commercial statistics software package Statgraphics Plus (version 5.1, Statgraphics Technologies, The Plain, VA, USA) was employed [26]. The responses studied in this DoE were:
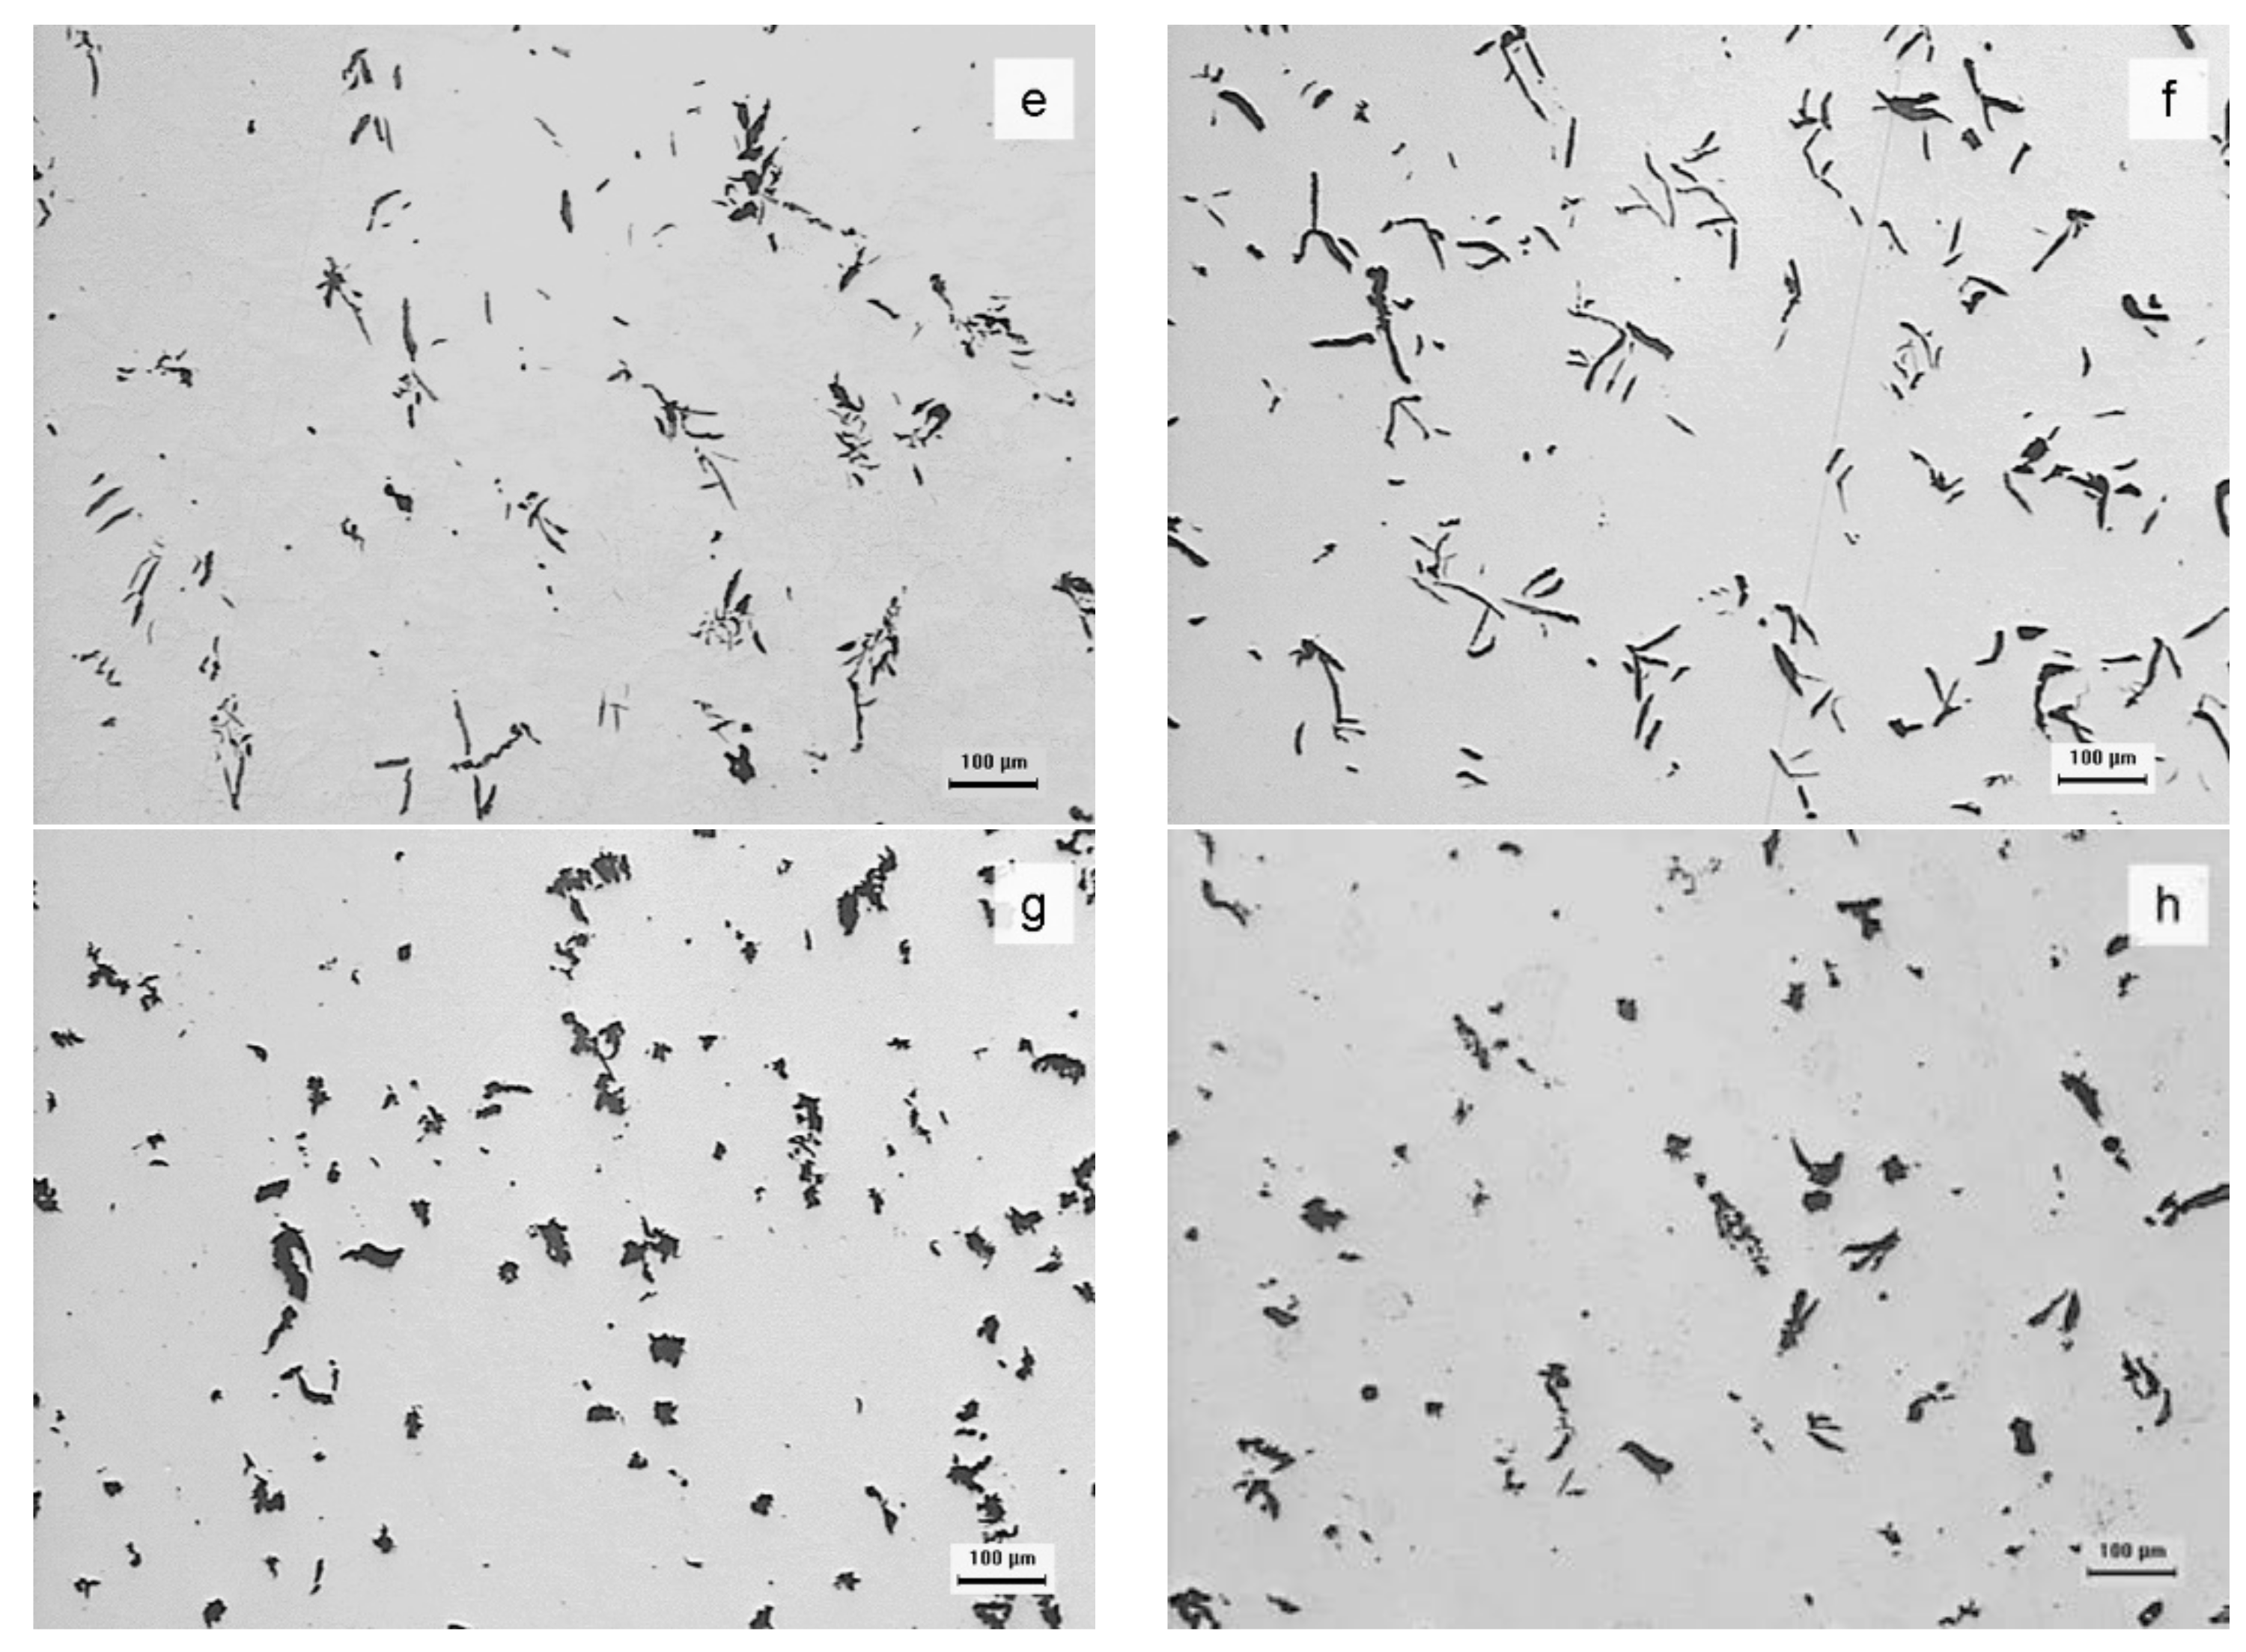
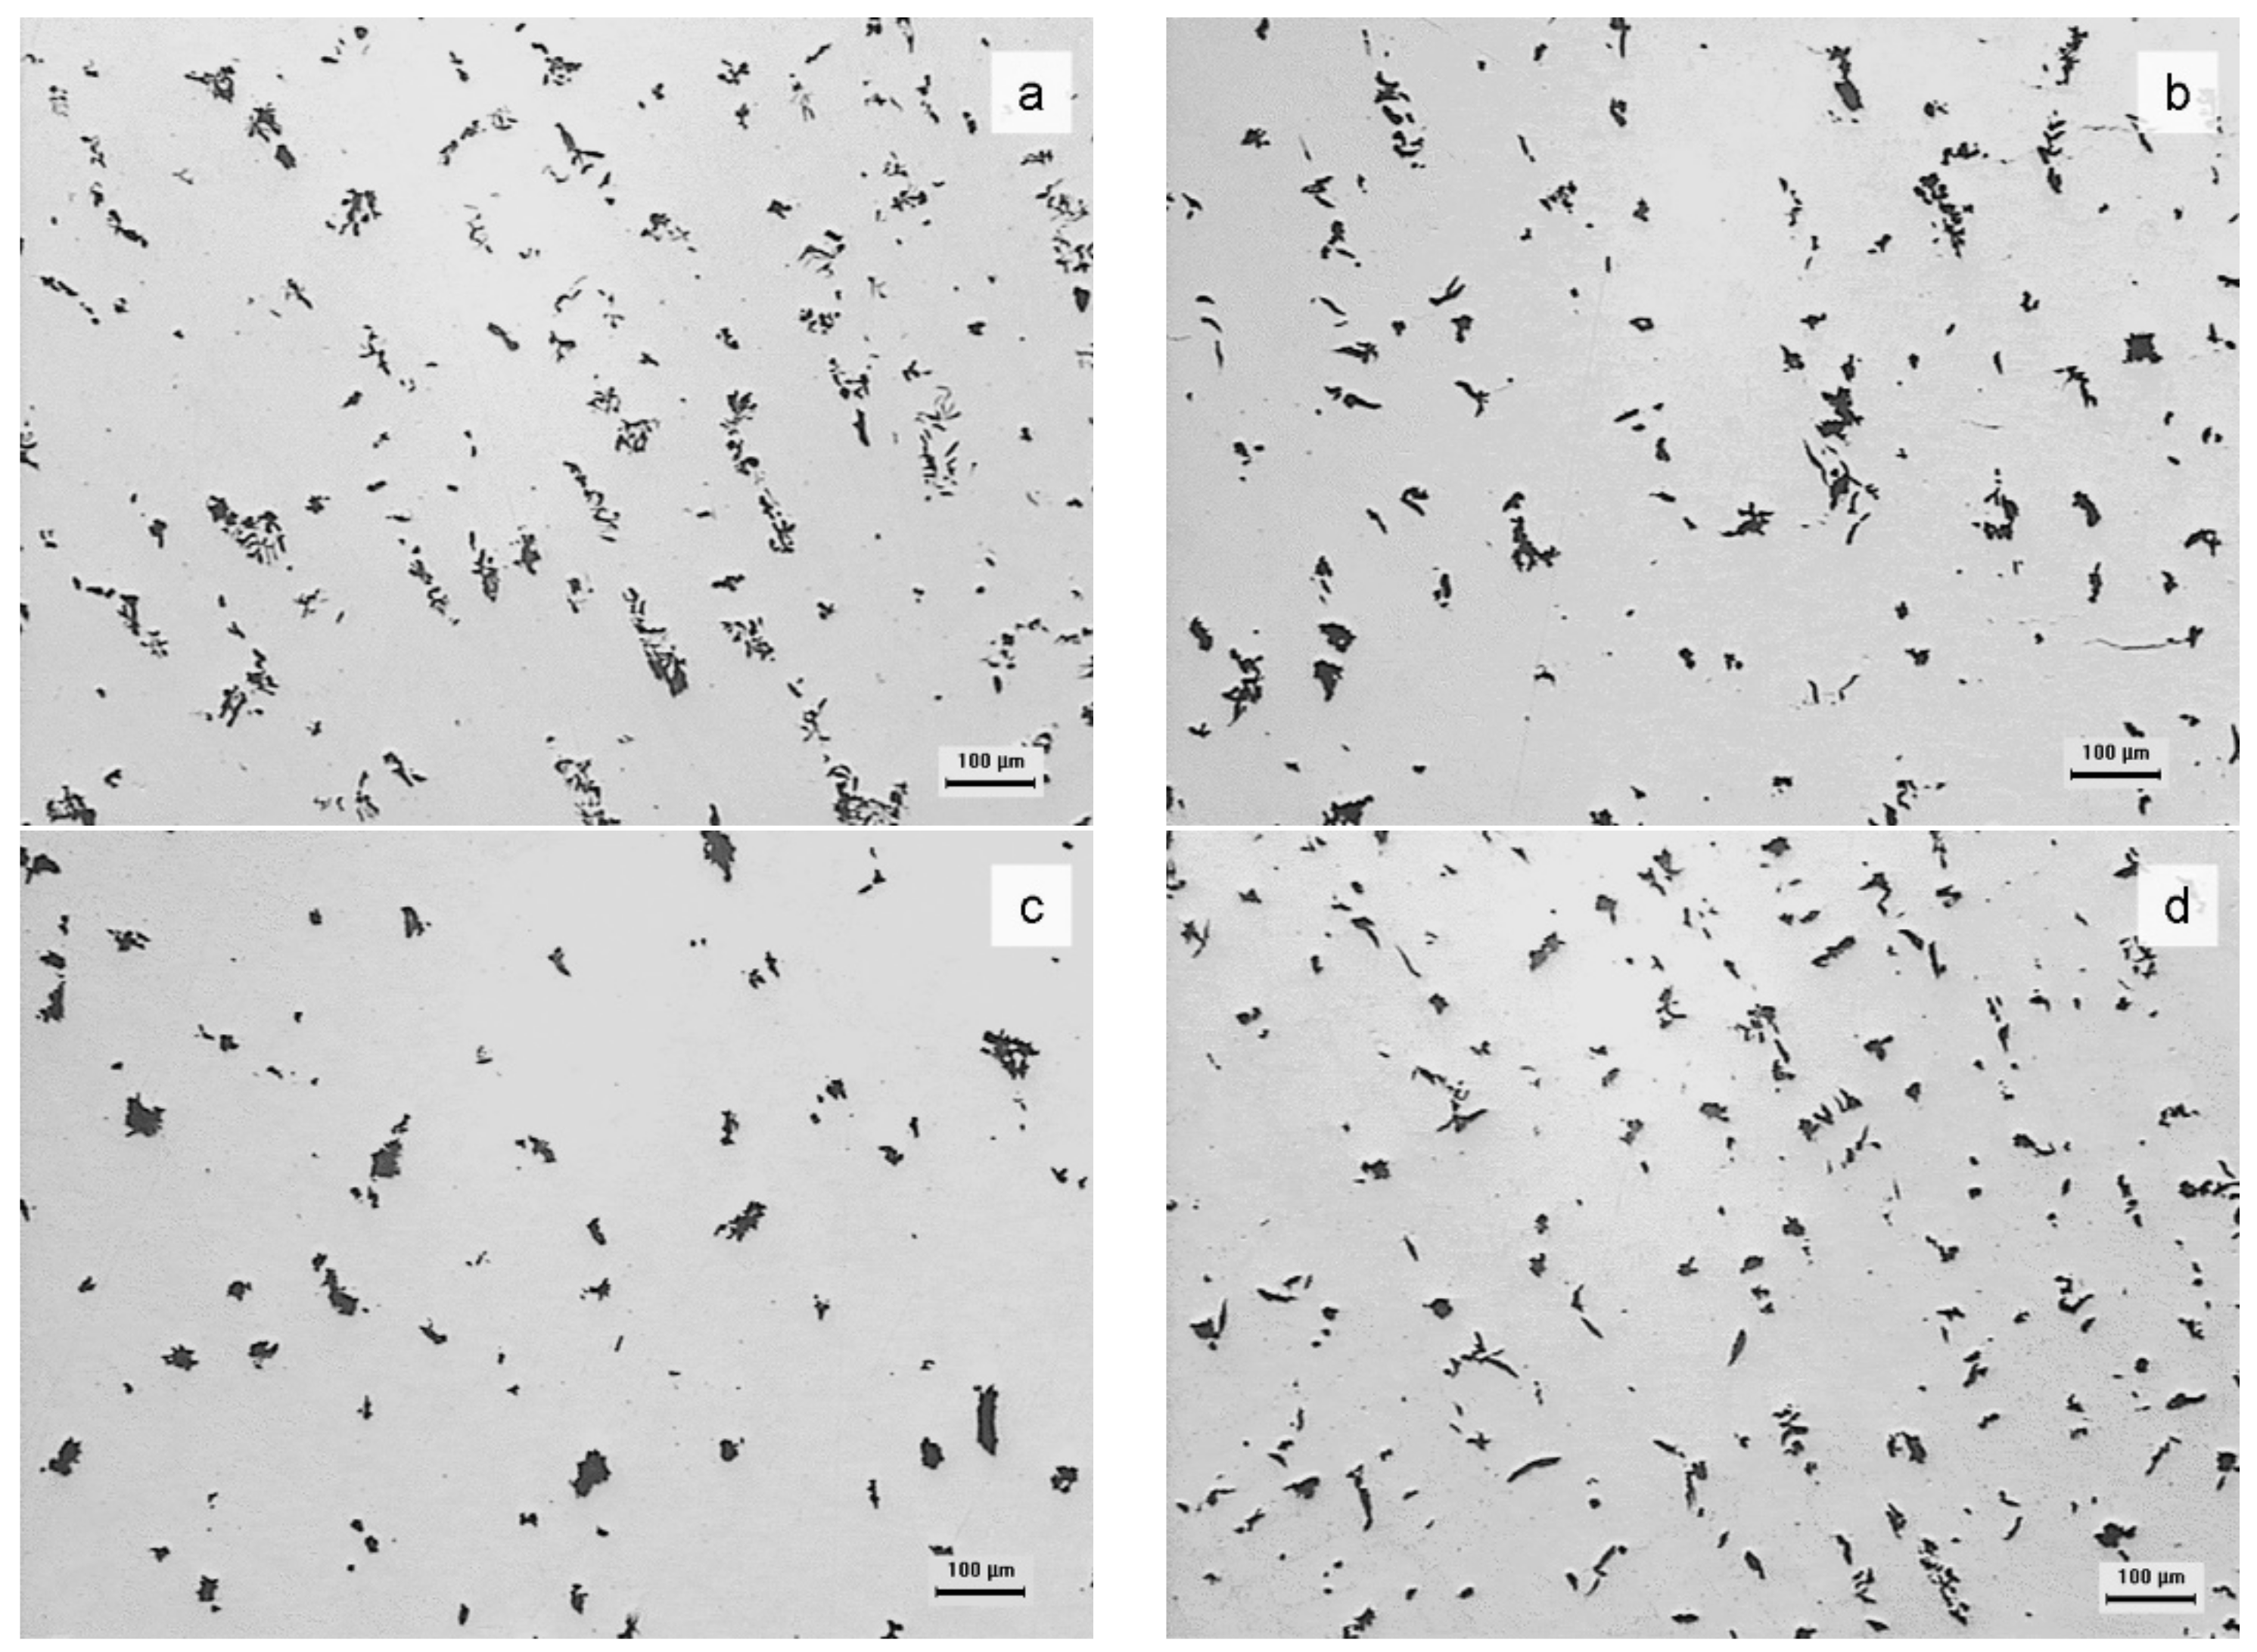
  • The volume fraction of graphite, denoted by Vv.
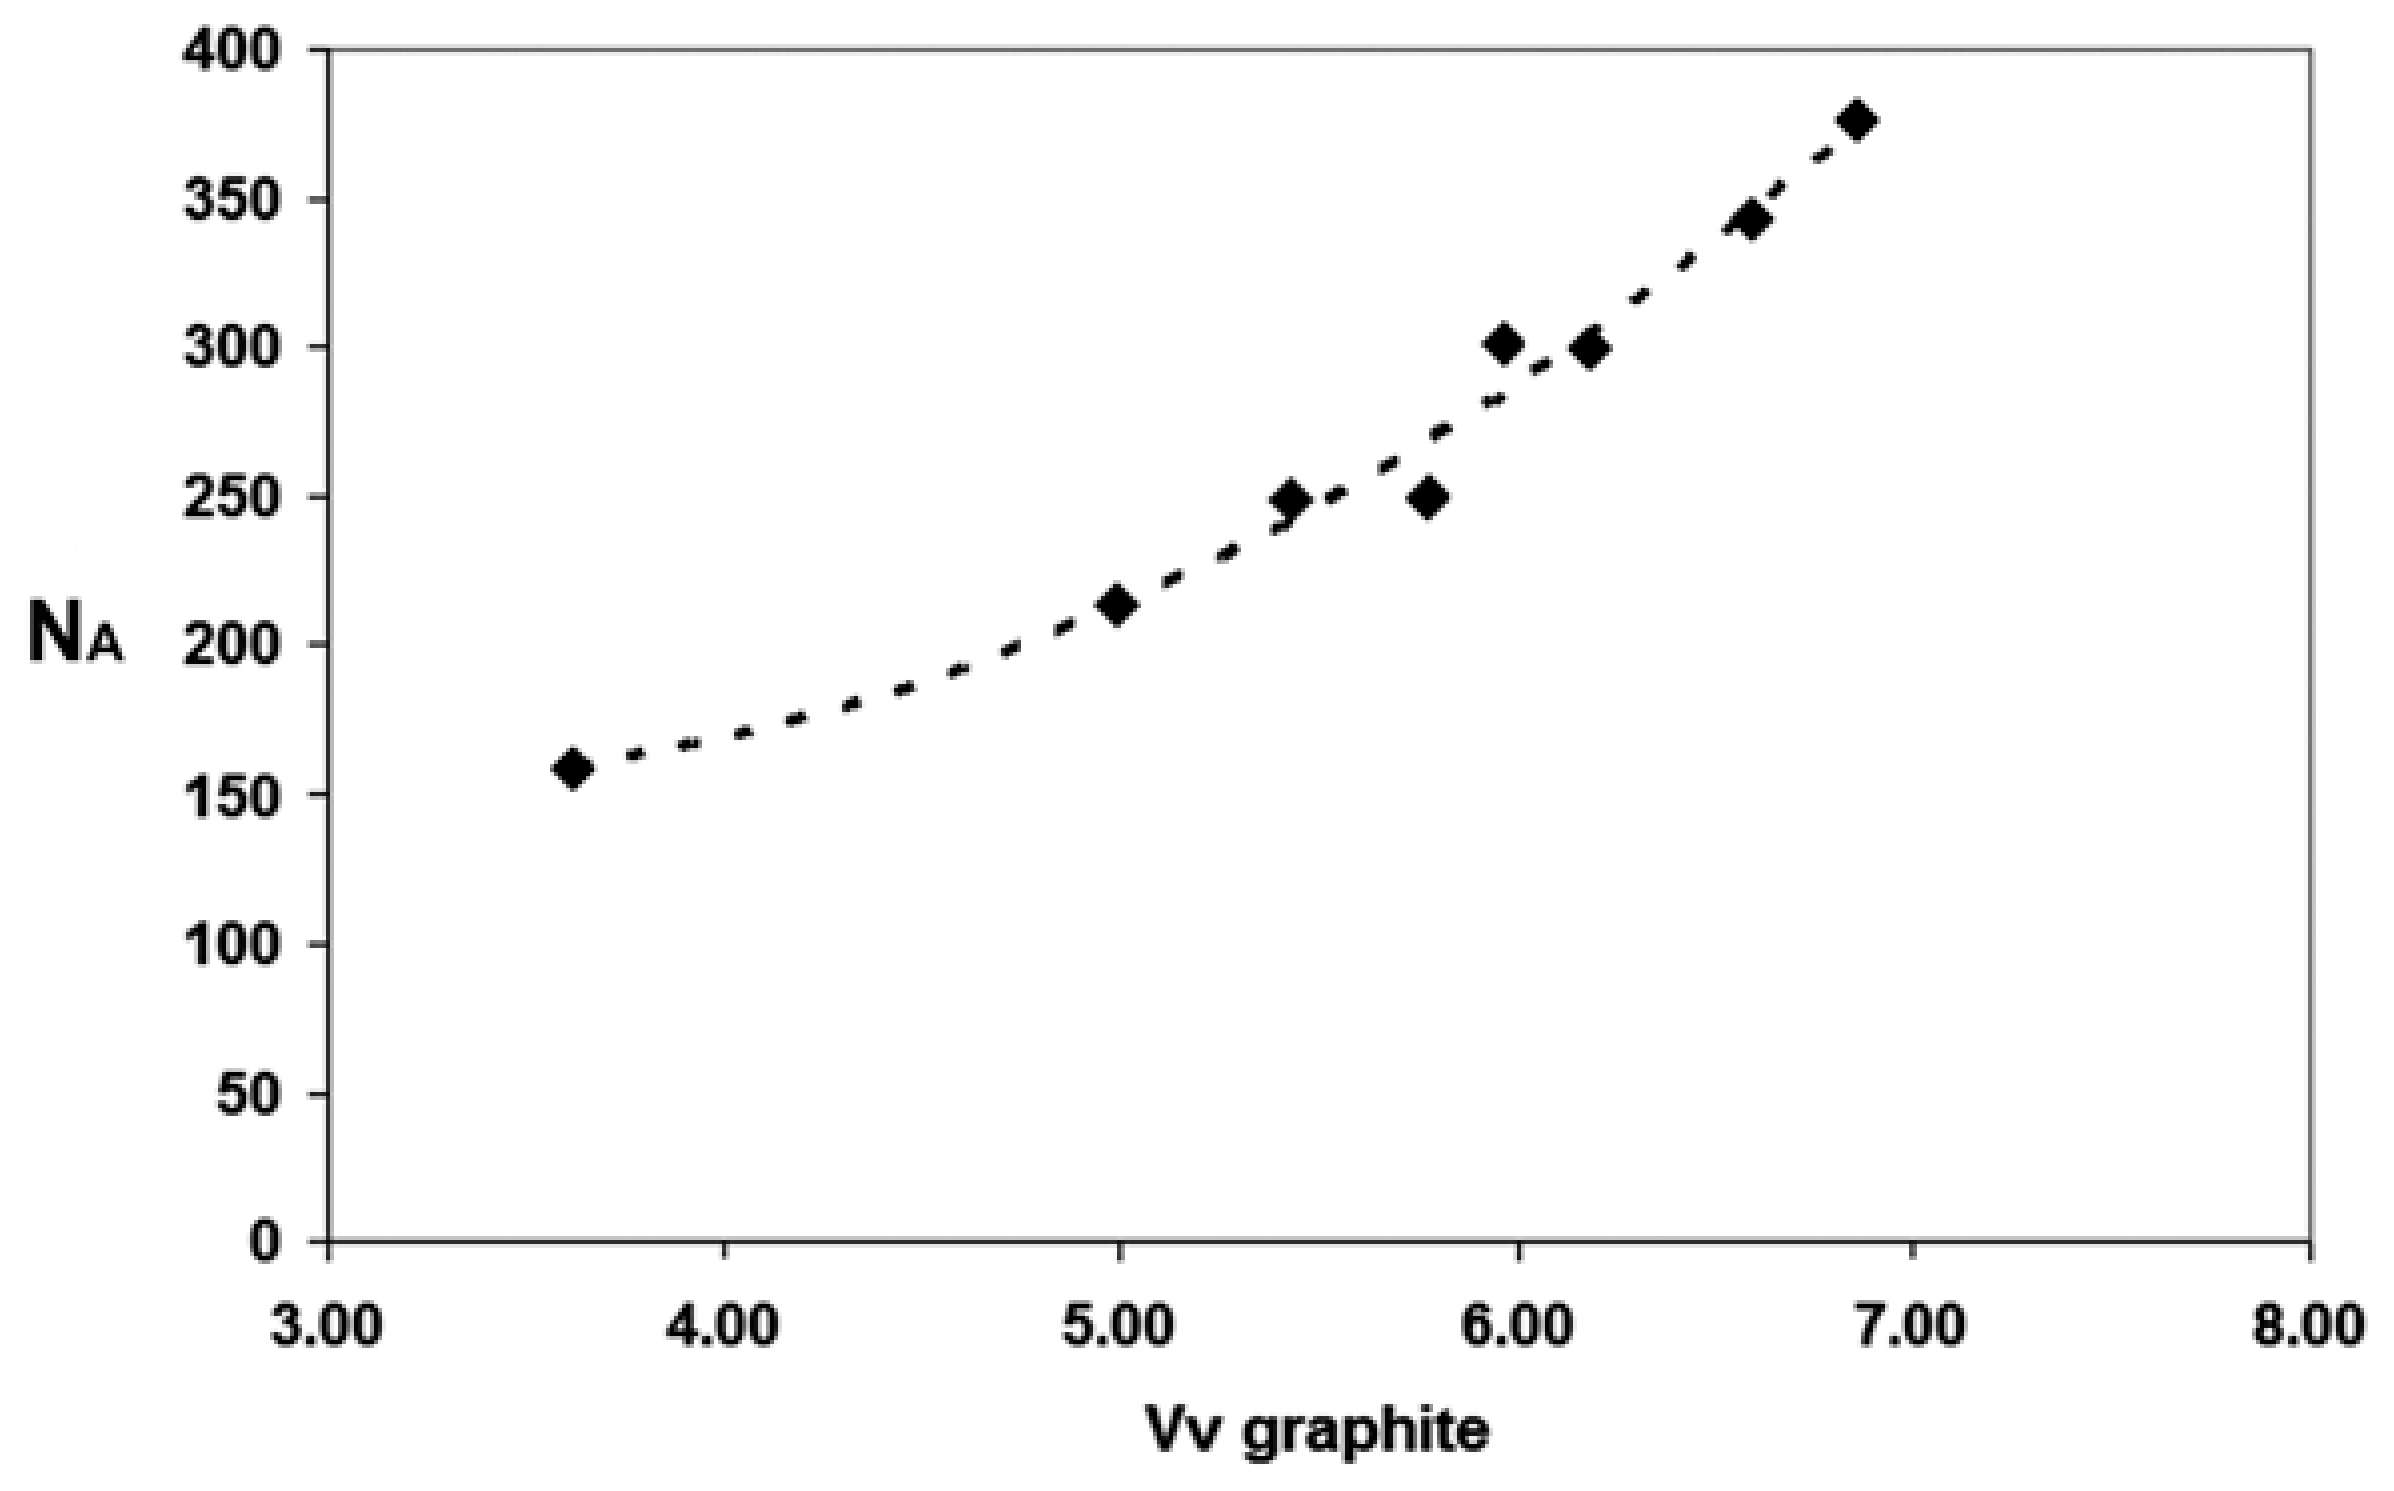
  • The number of counts per mm 2, denoted by NA. Each graphite unit was considered a microstructural characteristic, and therefore was counted individually, independently of the eutectic cell or “rosette” of origin.
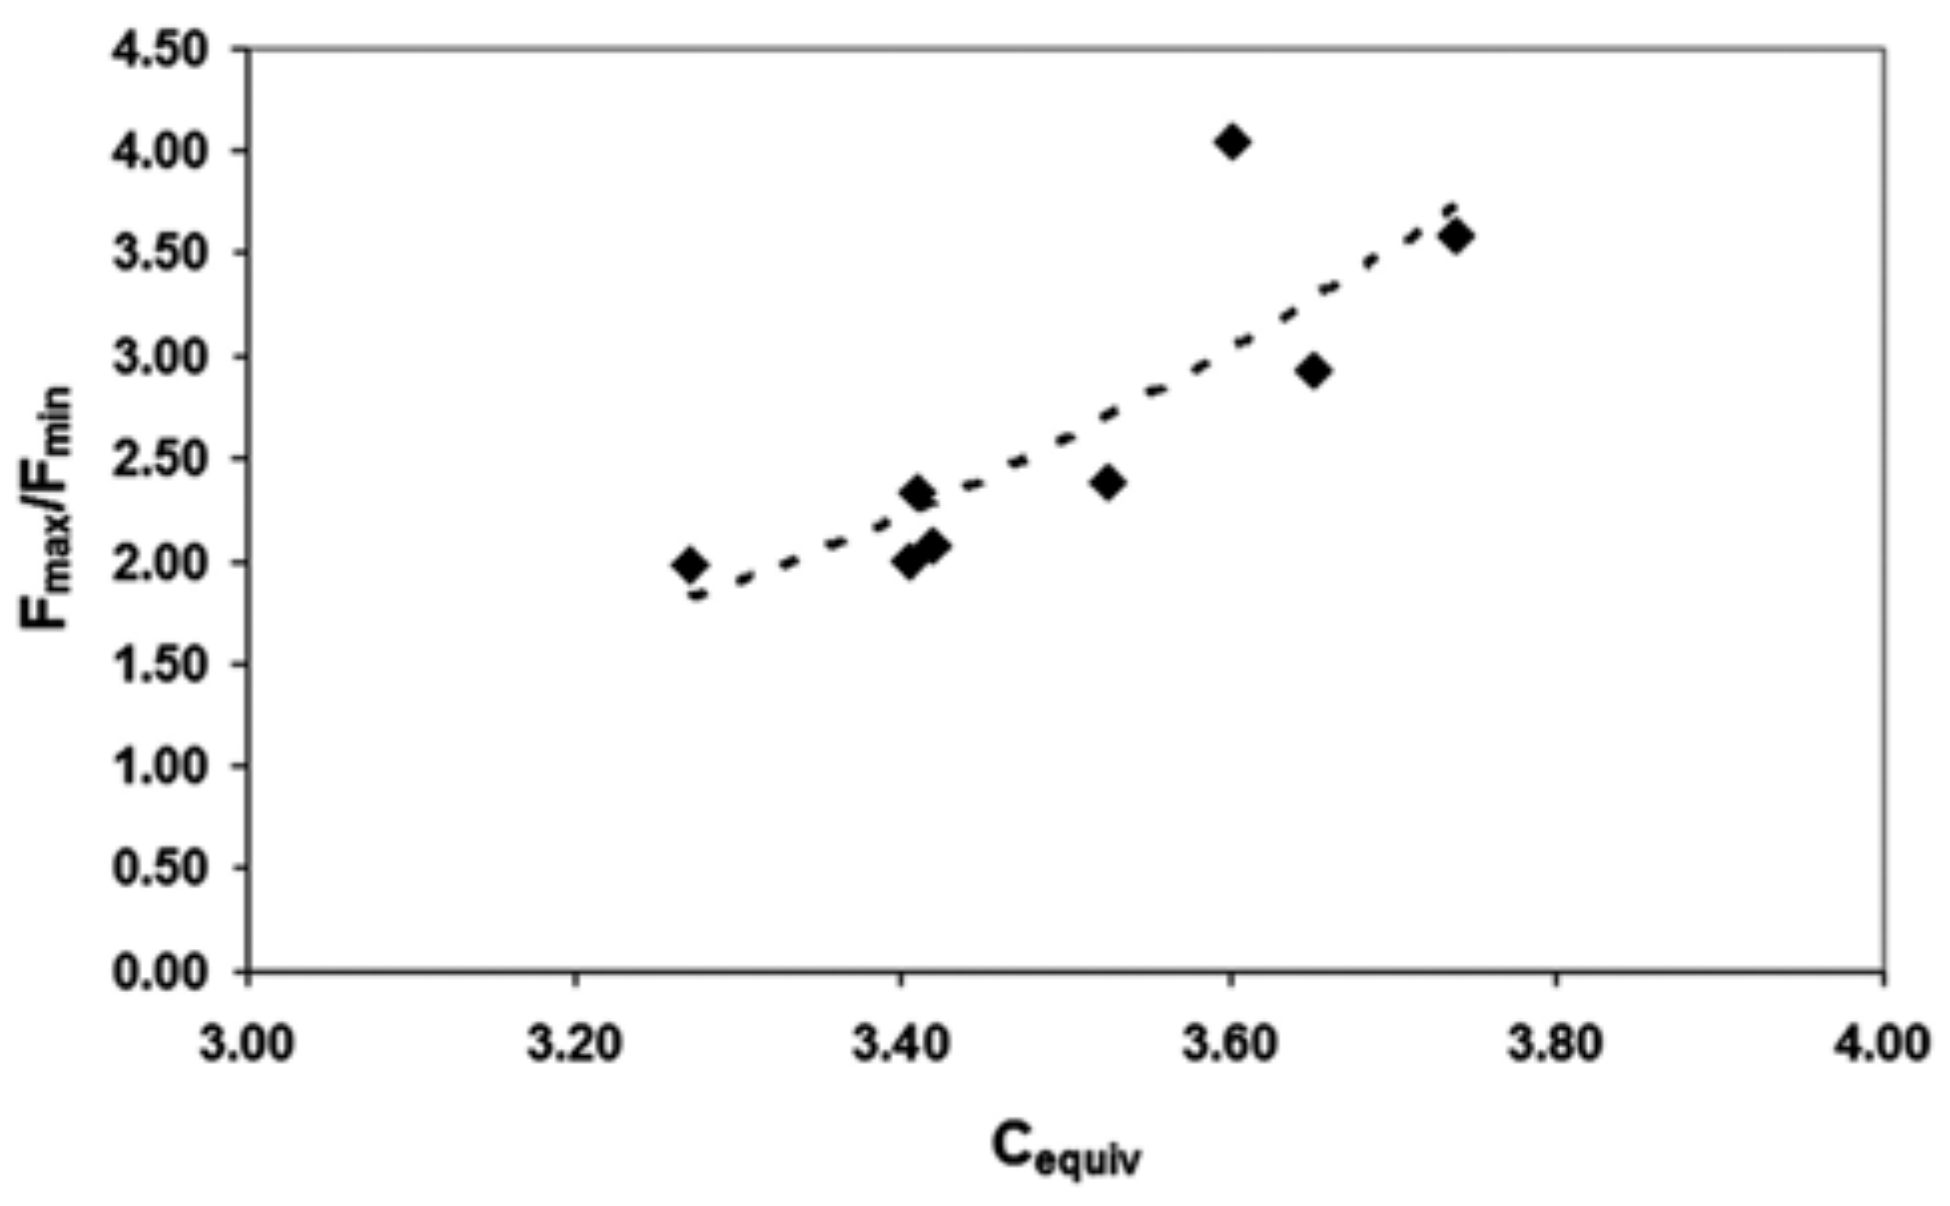
  • The Feret quotient was expressed by Fmax/Fmin, where Fmax was the maximum Feret diameter and Fmin stood for the minimum Feret diameter.
  • These responses were measured in each of the 20 micrographs obtained for each experiment.

3. Results

The results are presented in Figure 1, Figure 2, Figure 3, Figure 4, Figure 5 and Figure 6 and Table 5, Table 6, Table 7 and Table 8. Figure 1 shows a representative micrograph of each of the eight experiments, obtained in an intermediate zone of the work surface.
Table 6 shows the manufacturing process parameters for the eight experiments. Table 6, Table 7 and Table 8 show the derivation of the effects for each response according to Yates’ algorithm [27].
Figure 2, Figure 3 and Figure 5 illustrate the standardized effects, i.e., the ratio of the effect to its standard deviation, presented using normal probability plots where the significant effects are noted with their corresponding identifying letters [28]. Presentation of data with a normal distribution using a normal probability plot will reveal an alignment of the data points. The straight line so defined should pass through the point of coordinates (0, 50%) for the standardized effects and probability percent, respectively, thus indicating that the mean variability of the distribution is zero. The slope of the line represents the magnitude of the experimental error. Every experimental response is subjected to random variations. This variation follows a normal law; its standard deviation represents the experimental error. The effects are linear combinations of the responses; hence, by application of the central limit theorem, they follow a normal law. If all the effects were non-significant, they would follow an N (0, σ) distribution, thus appearing aligned to describe a straight line when represented on a normal probability plot. The significant effects follow an N (μ, σ) distribution, represented by points which are off the straight line defined by the non-significant effects. As a result, each effect can be considered as a random variable; the value so determined is an estimate of its arithmetic mean. Accordingly, this value is accompanied by its standard deviation. The significance of a given effect is based on the ratio of its mean value to its error using the Student t-statistic at the 95% confidence level [29].

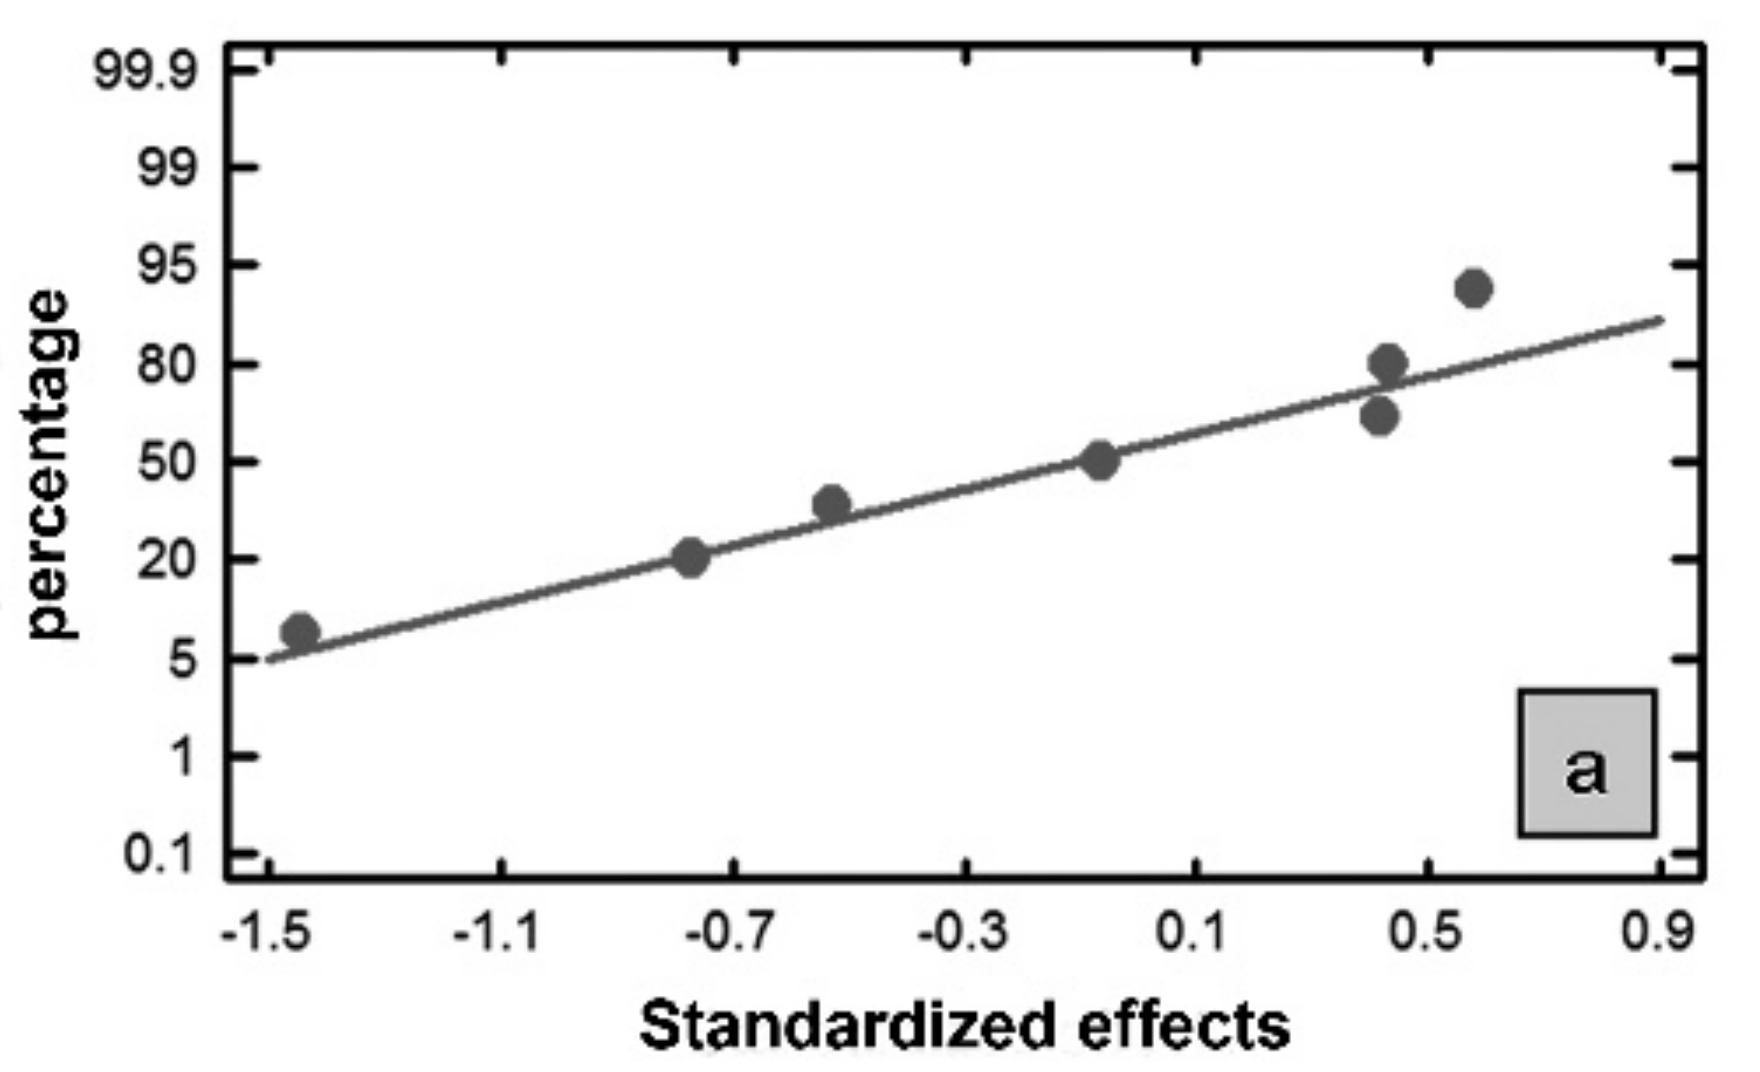
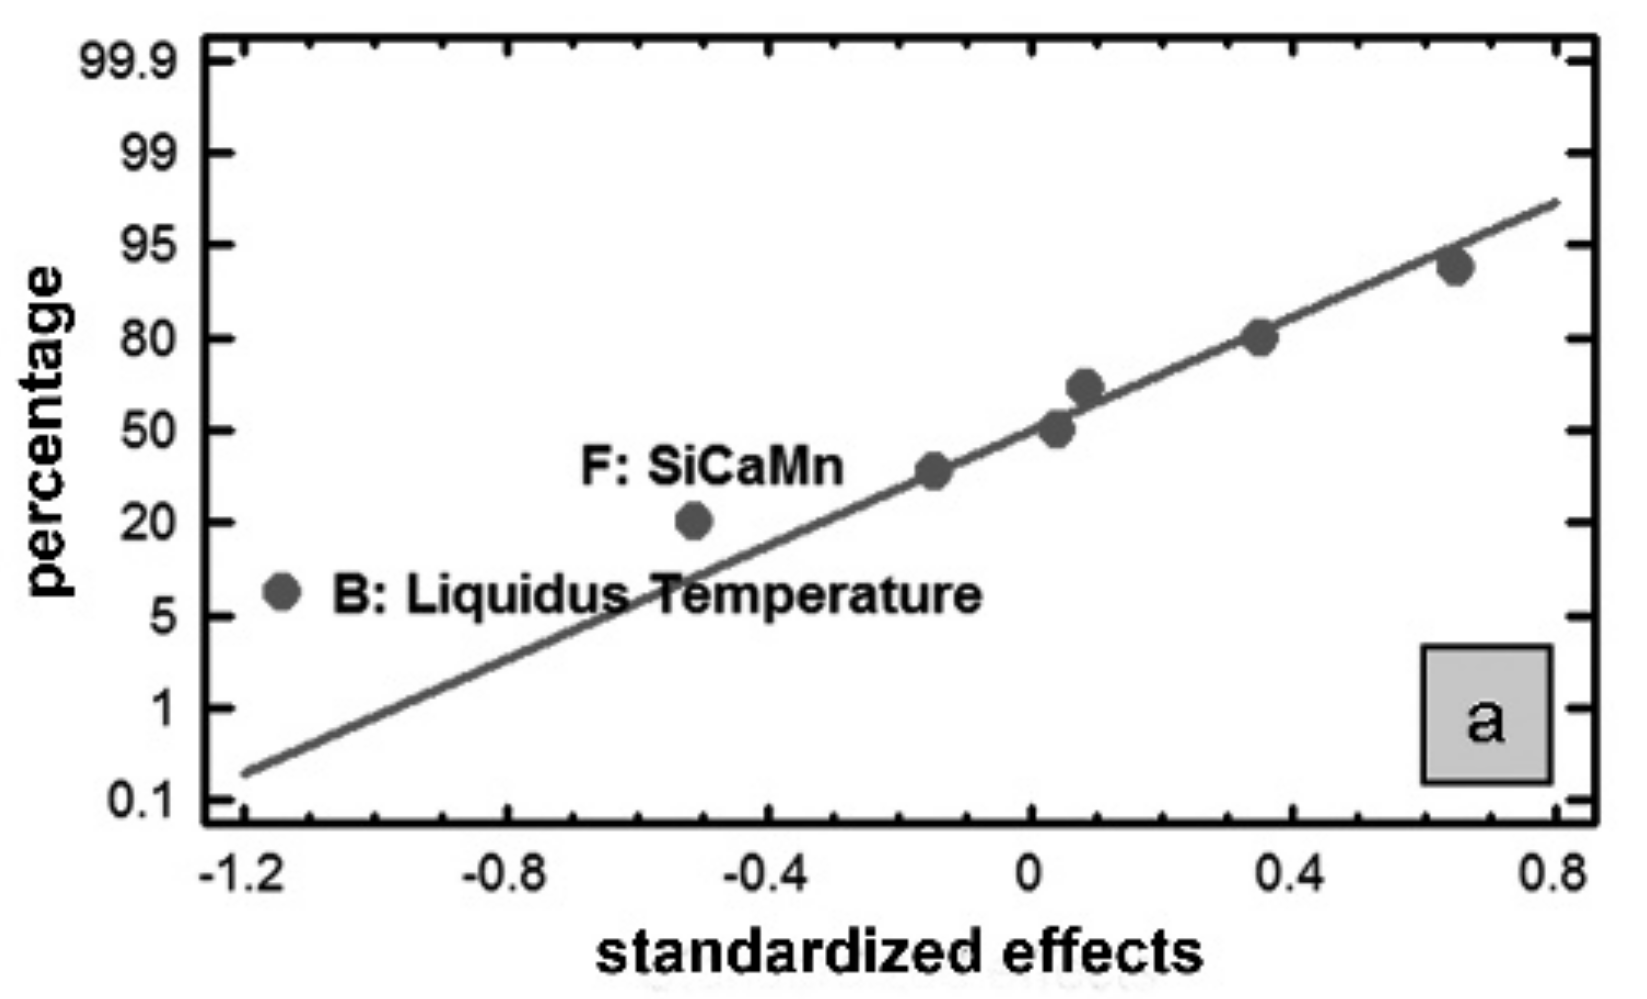
3.1. Significant Effects in the Volume Fraction of Graphite

Table 7 shows the calculated effects after applying Yates’ algorithm for the volume fraction of graphite.
Figure 2a illustrates of the absence of significant effects on the layer average. This might be explained by the high variability of the results. However, a more detailed analysis conducted for each of the four studied layer sections (Figure 2b–e) concluded that the significant effects were of FeB in zones I, II and III; the liquidus temperature in zones I and III; the inoculation with A-type FeSi in zone III; and the type of centrifugal cast machine in zone IV. Higher graphite volume fractions were favored at the lowest level of FeB added, which indicated the “whitening” effect power of B on eutectic solidification. The use of high liquidus temperatures to the order of 1250–1255 °C, will also help decrease the volume fraction of graphite. The result obtained in zone III is noteworthy in relation to the type of FeSi that was added as an inoculant: the addition of B-type FeSi (Fe-75Si with Ti, C, and S as active graphite forming elements) favored a marked increase in the graphite volume fraction when compared to the addition of A-type FeSi (Fe-75Si with the presence of small amounts of Ca and Zr). On the other hand, in zone IV, corresponding to the layer section adjacent to the transient zone with the roll core, the increase in the amount of precipitated graphite was obtained by the use of a centrifugal casting machined equipped with a movable isolating sleeve.

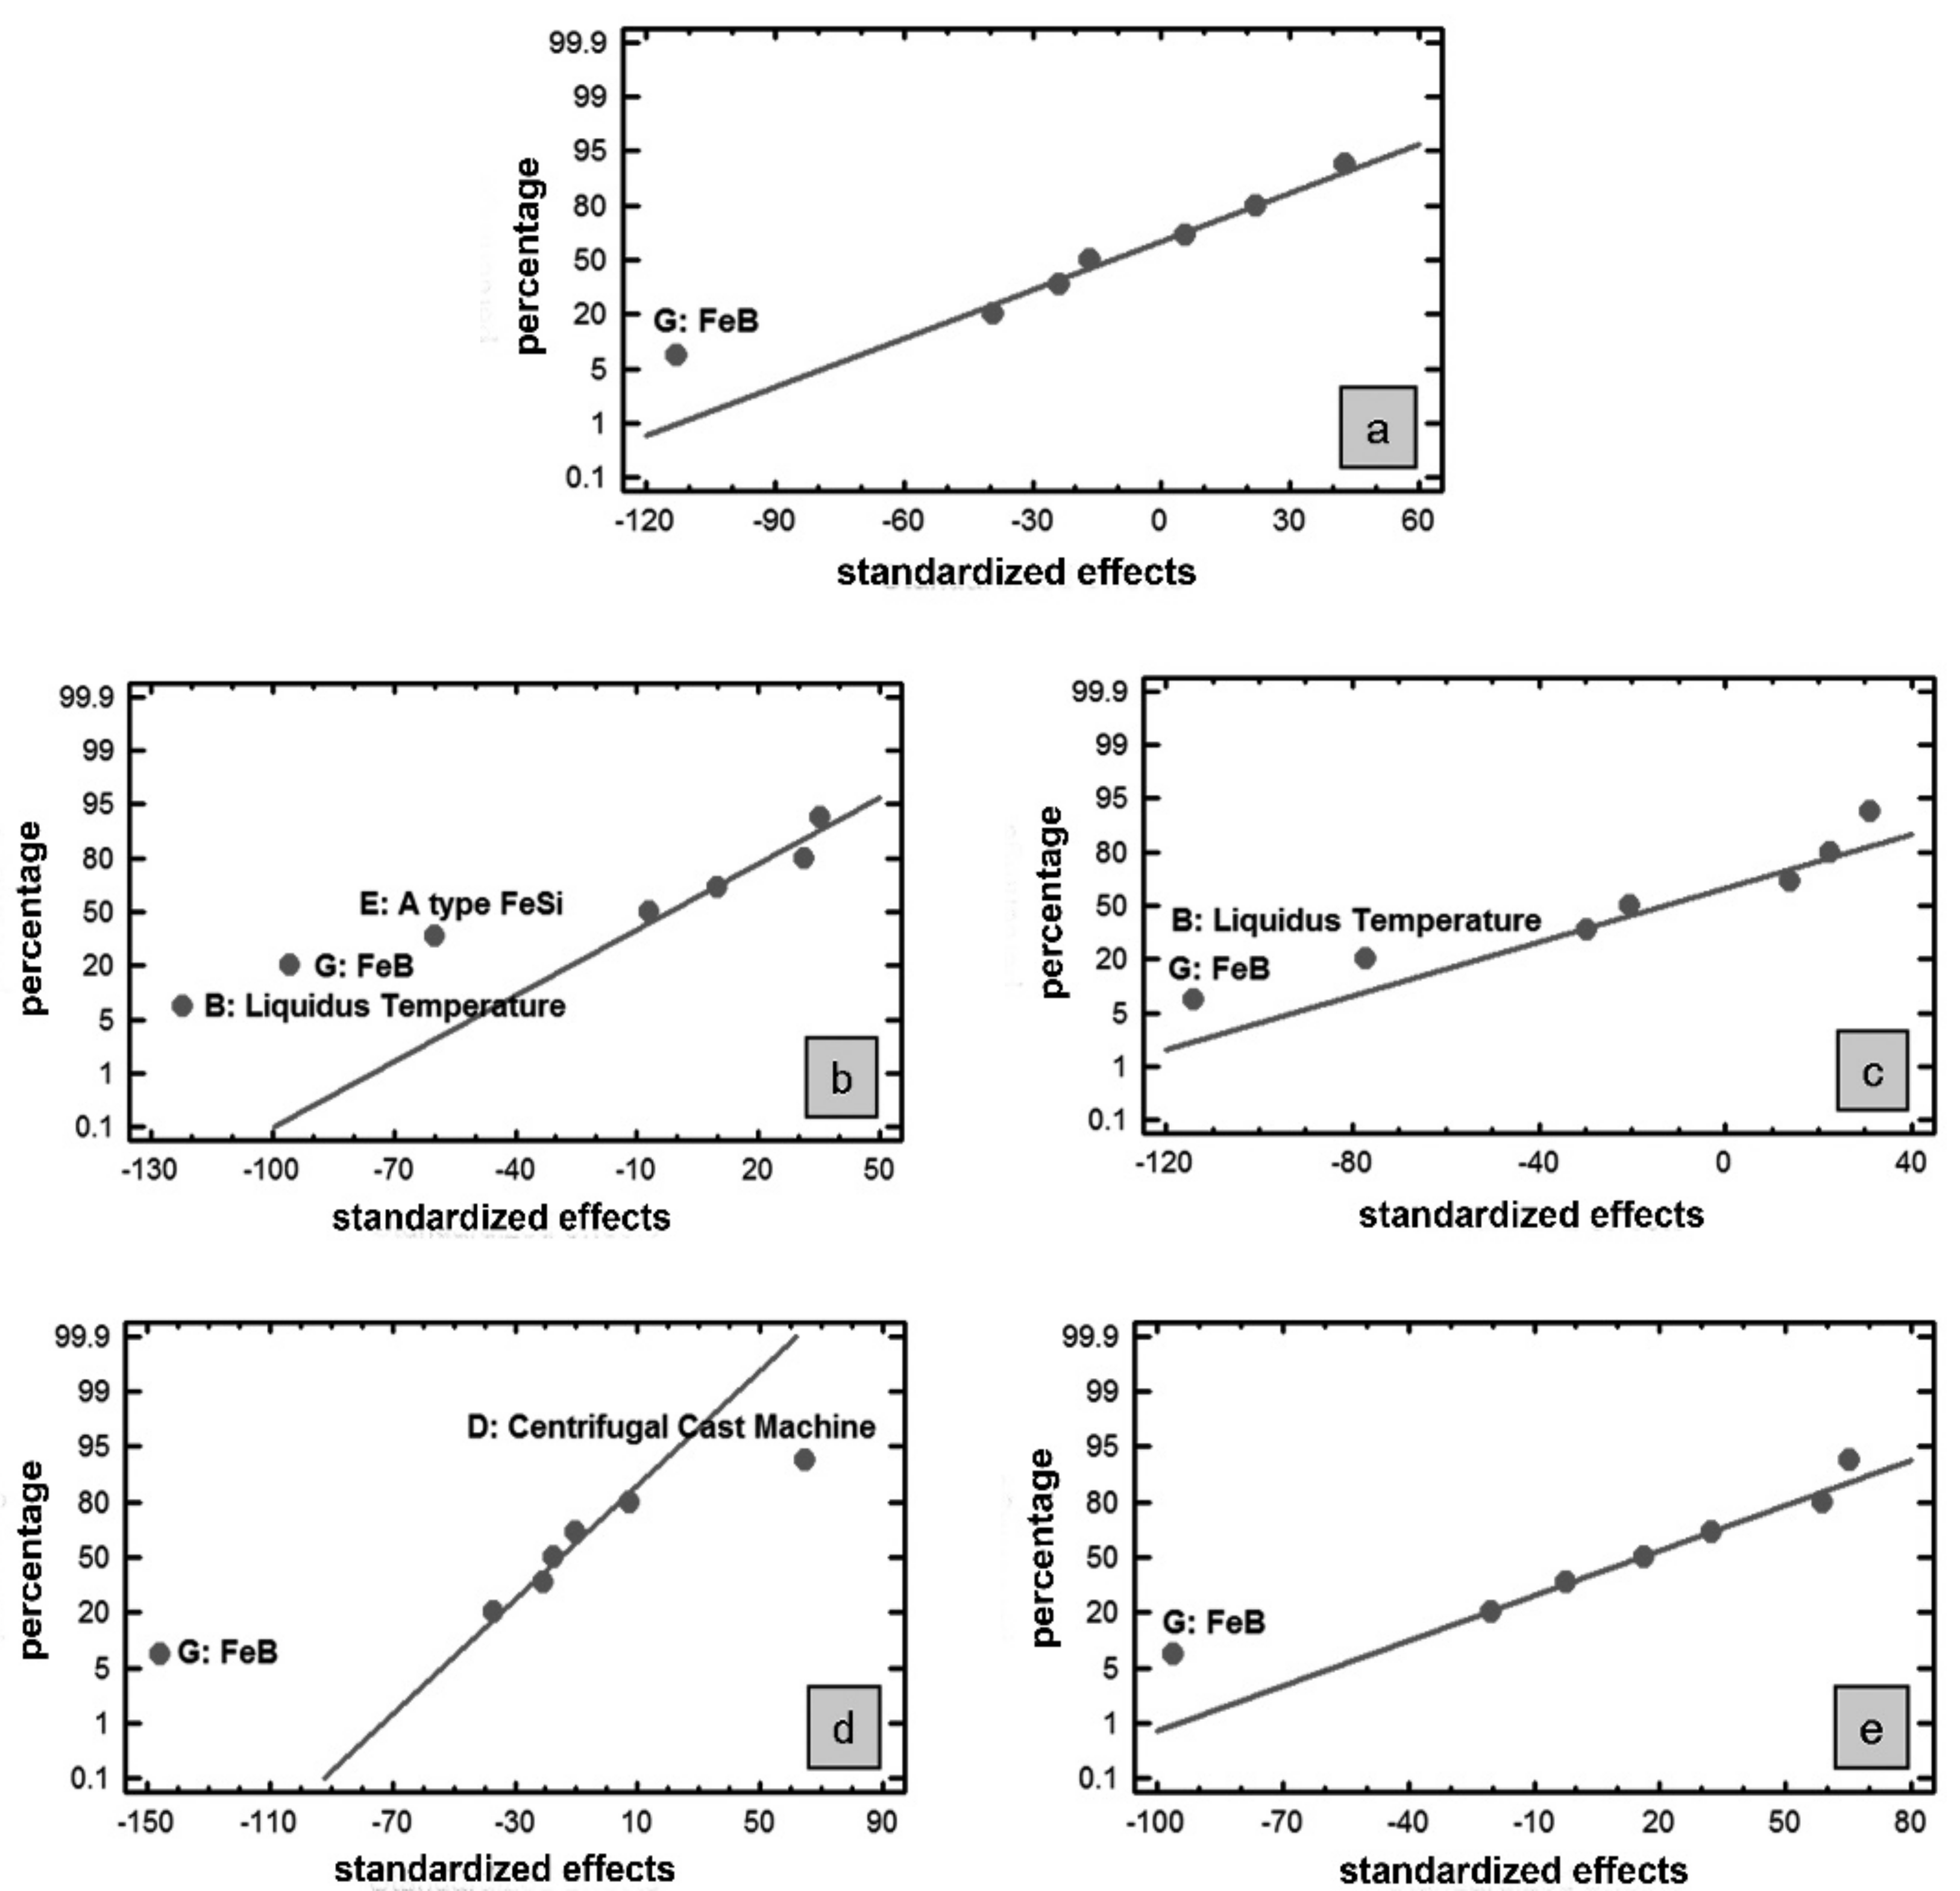
3.2. Significant Effects in the Graphite Count Number

Table 8 shows the calculated effects after applying Yates’ algorithm for the number of particles of graphite, NA.
Figure 3a shows the significant effect of the FeB inoculation on the layer average. Detailed studies of the layer by the zones (see Figure 3b–e) also showed the significant effect of inoculation with FeB. An increase in the amount of FeB added as the inoculant between 6 to 10 kg/T produced a decrease in the number of counts of graphite per unit area, NA. For the two most outer zones of the roll shell (zones I and II), melts with low liquidus temperatures (1225–1230 °C) appeared to favor a high graphite.
This result agreed with the observations made for gray and SG irons, and with studies conducted by the authors in mottled Nihard cast irons [6,7] where higher carbon equivalent contents in the vicinity of the eutectic composition strongly increased the graphite NA. The study confirmed that in zone I inoculation with B-type FeSi (Fe-75Si with small amounts of Ti, C and S) rather than inoculation with A-type FeSi (Fe-75Si containing small amounts of Ca and Zr) produced high graphite NA values. In zone III, a similar effect was observed with the use of centrifugal cast machine no. 2 with the use of the isolating sleeve. Figure 4 shows that in the outer shells of AIC rolls inoculated with FeB, the increase in the volume fraction of graphite produced an increase in its count number, NA.

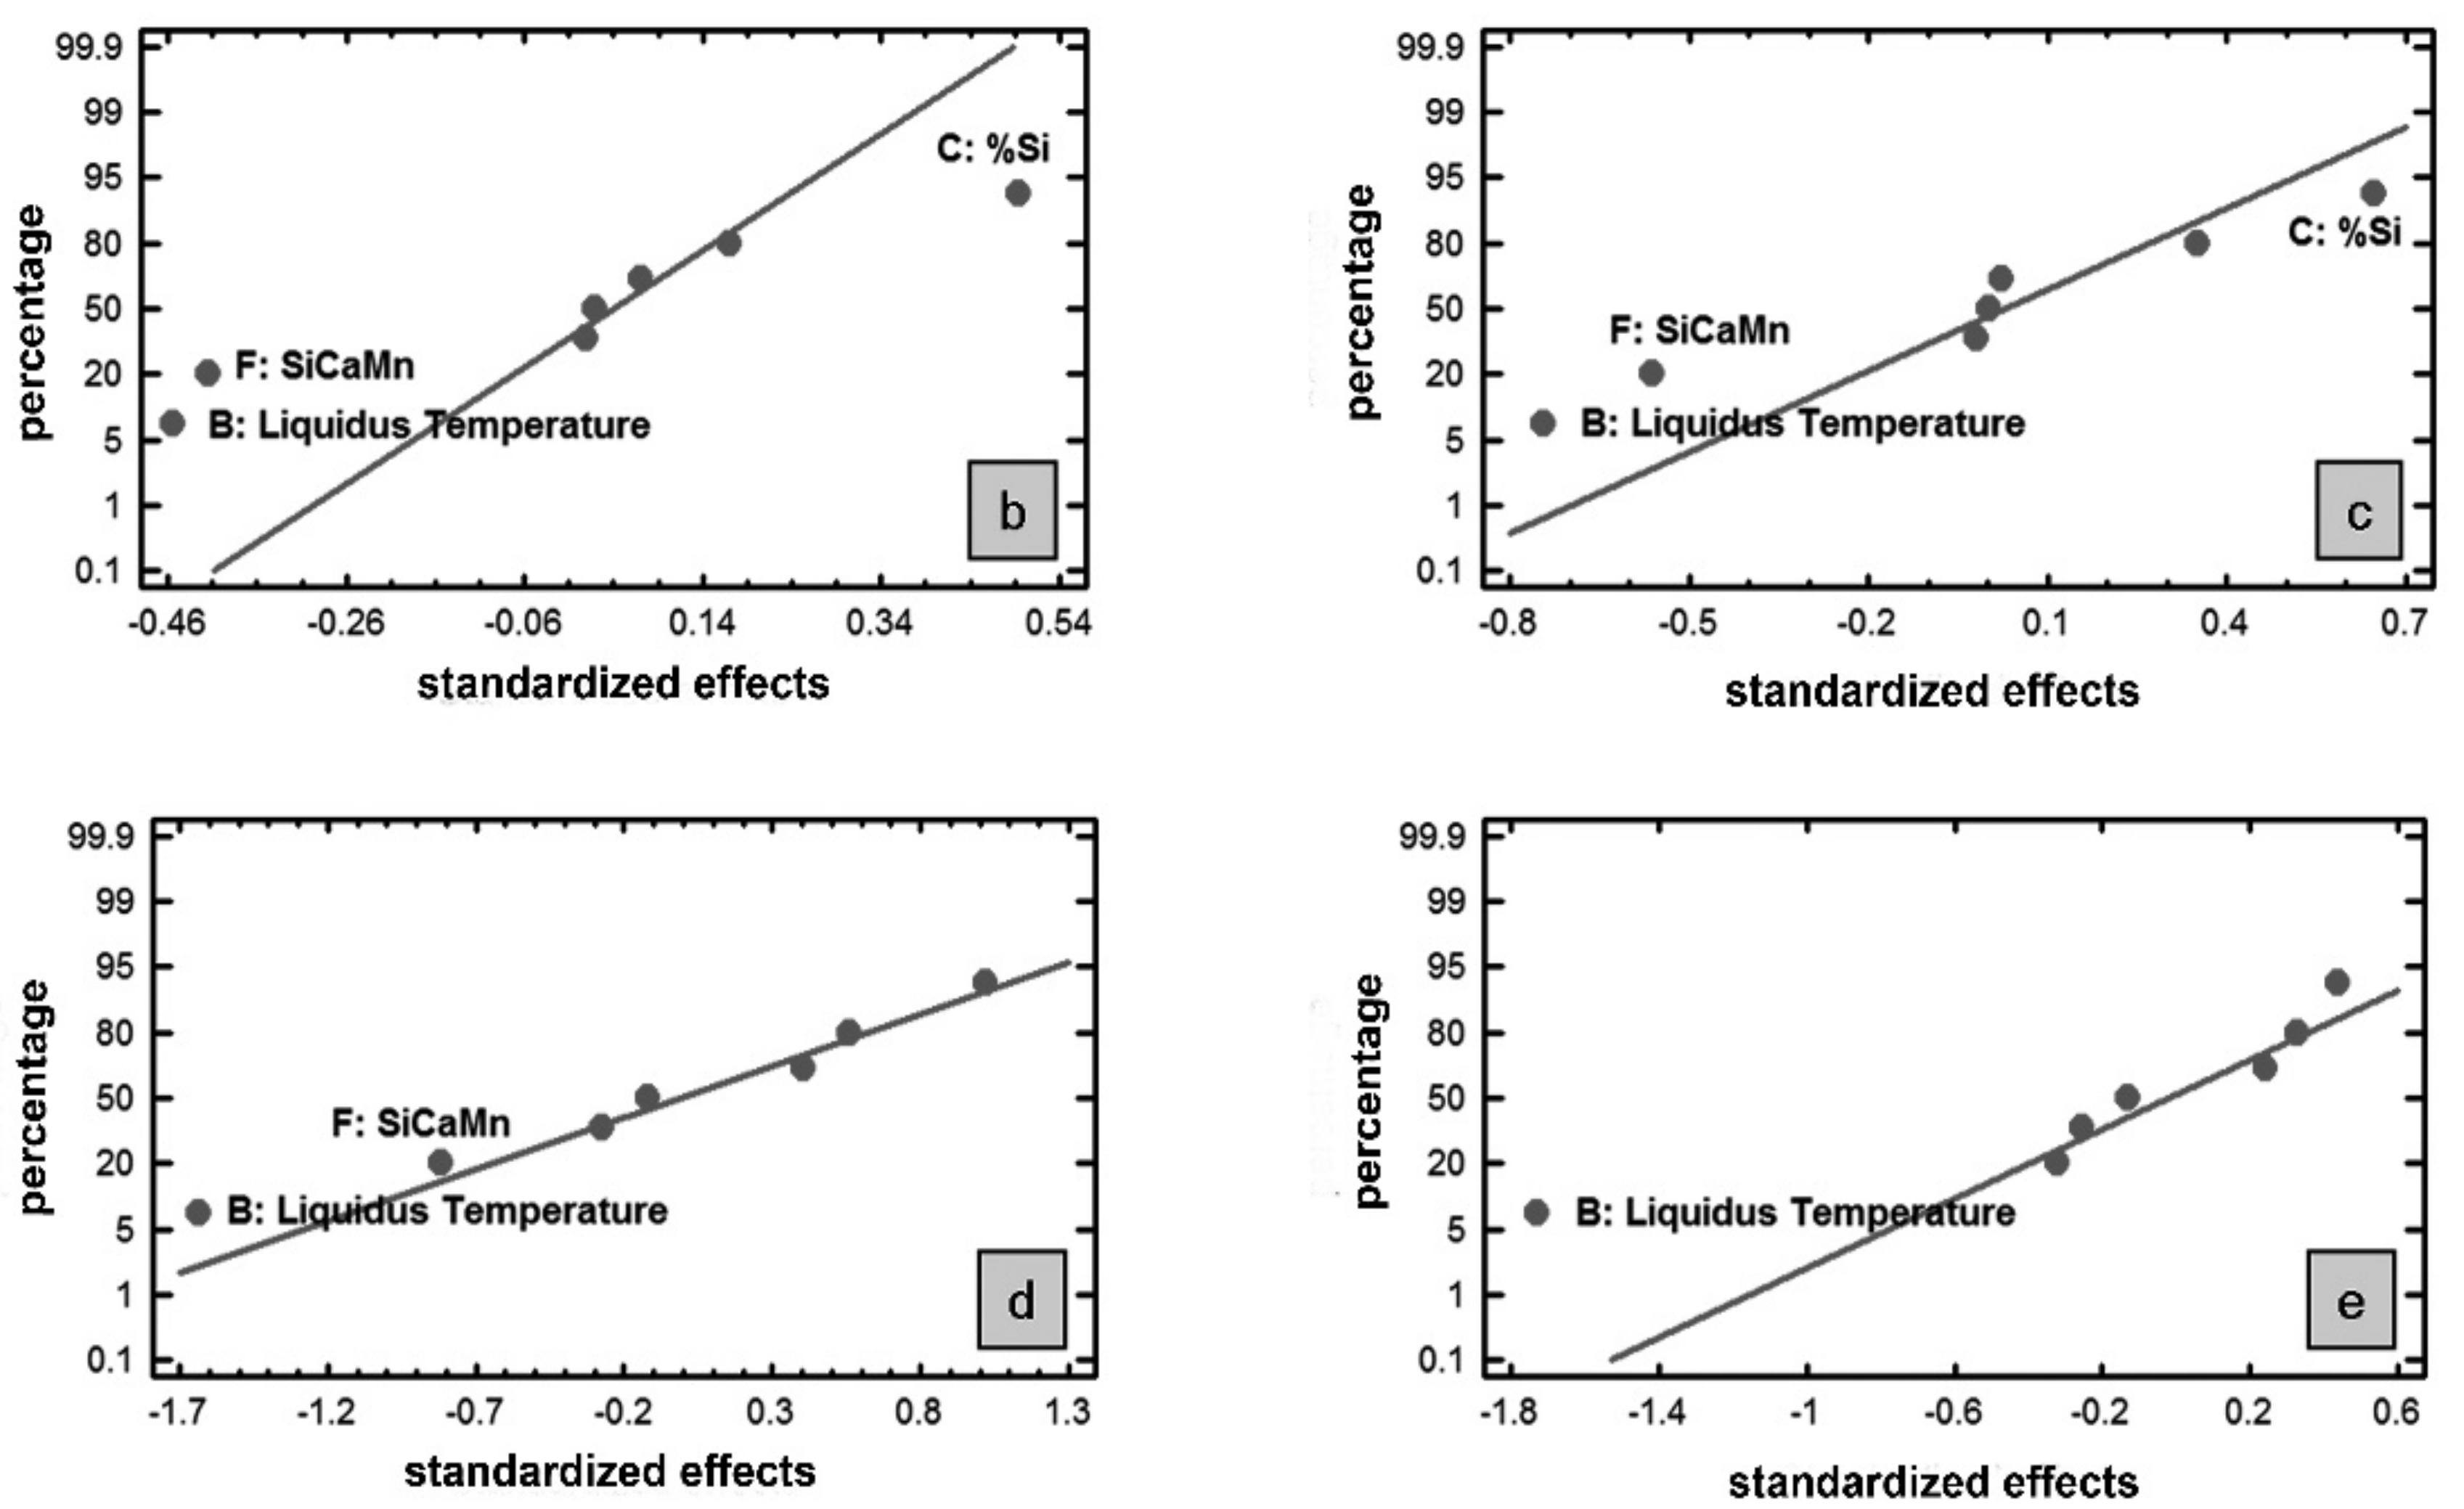
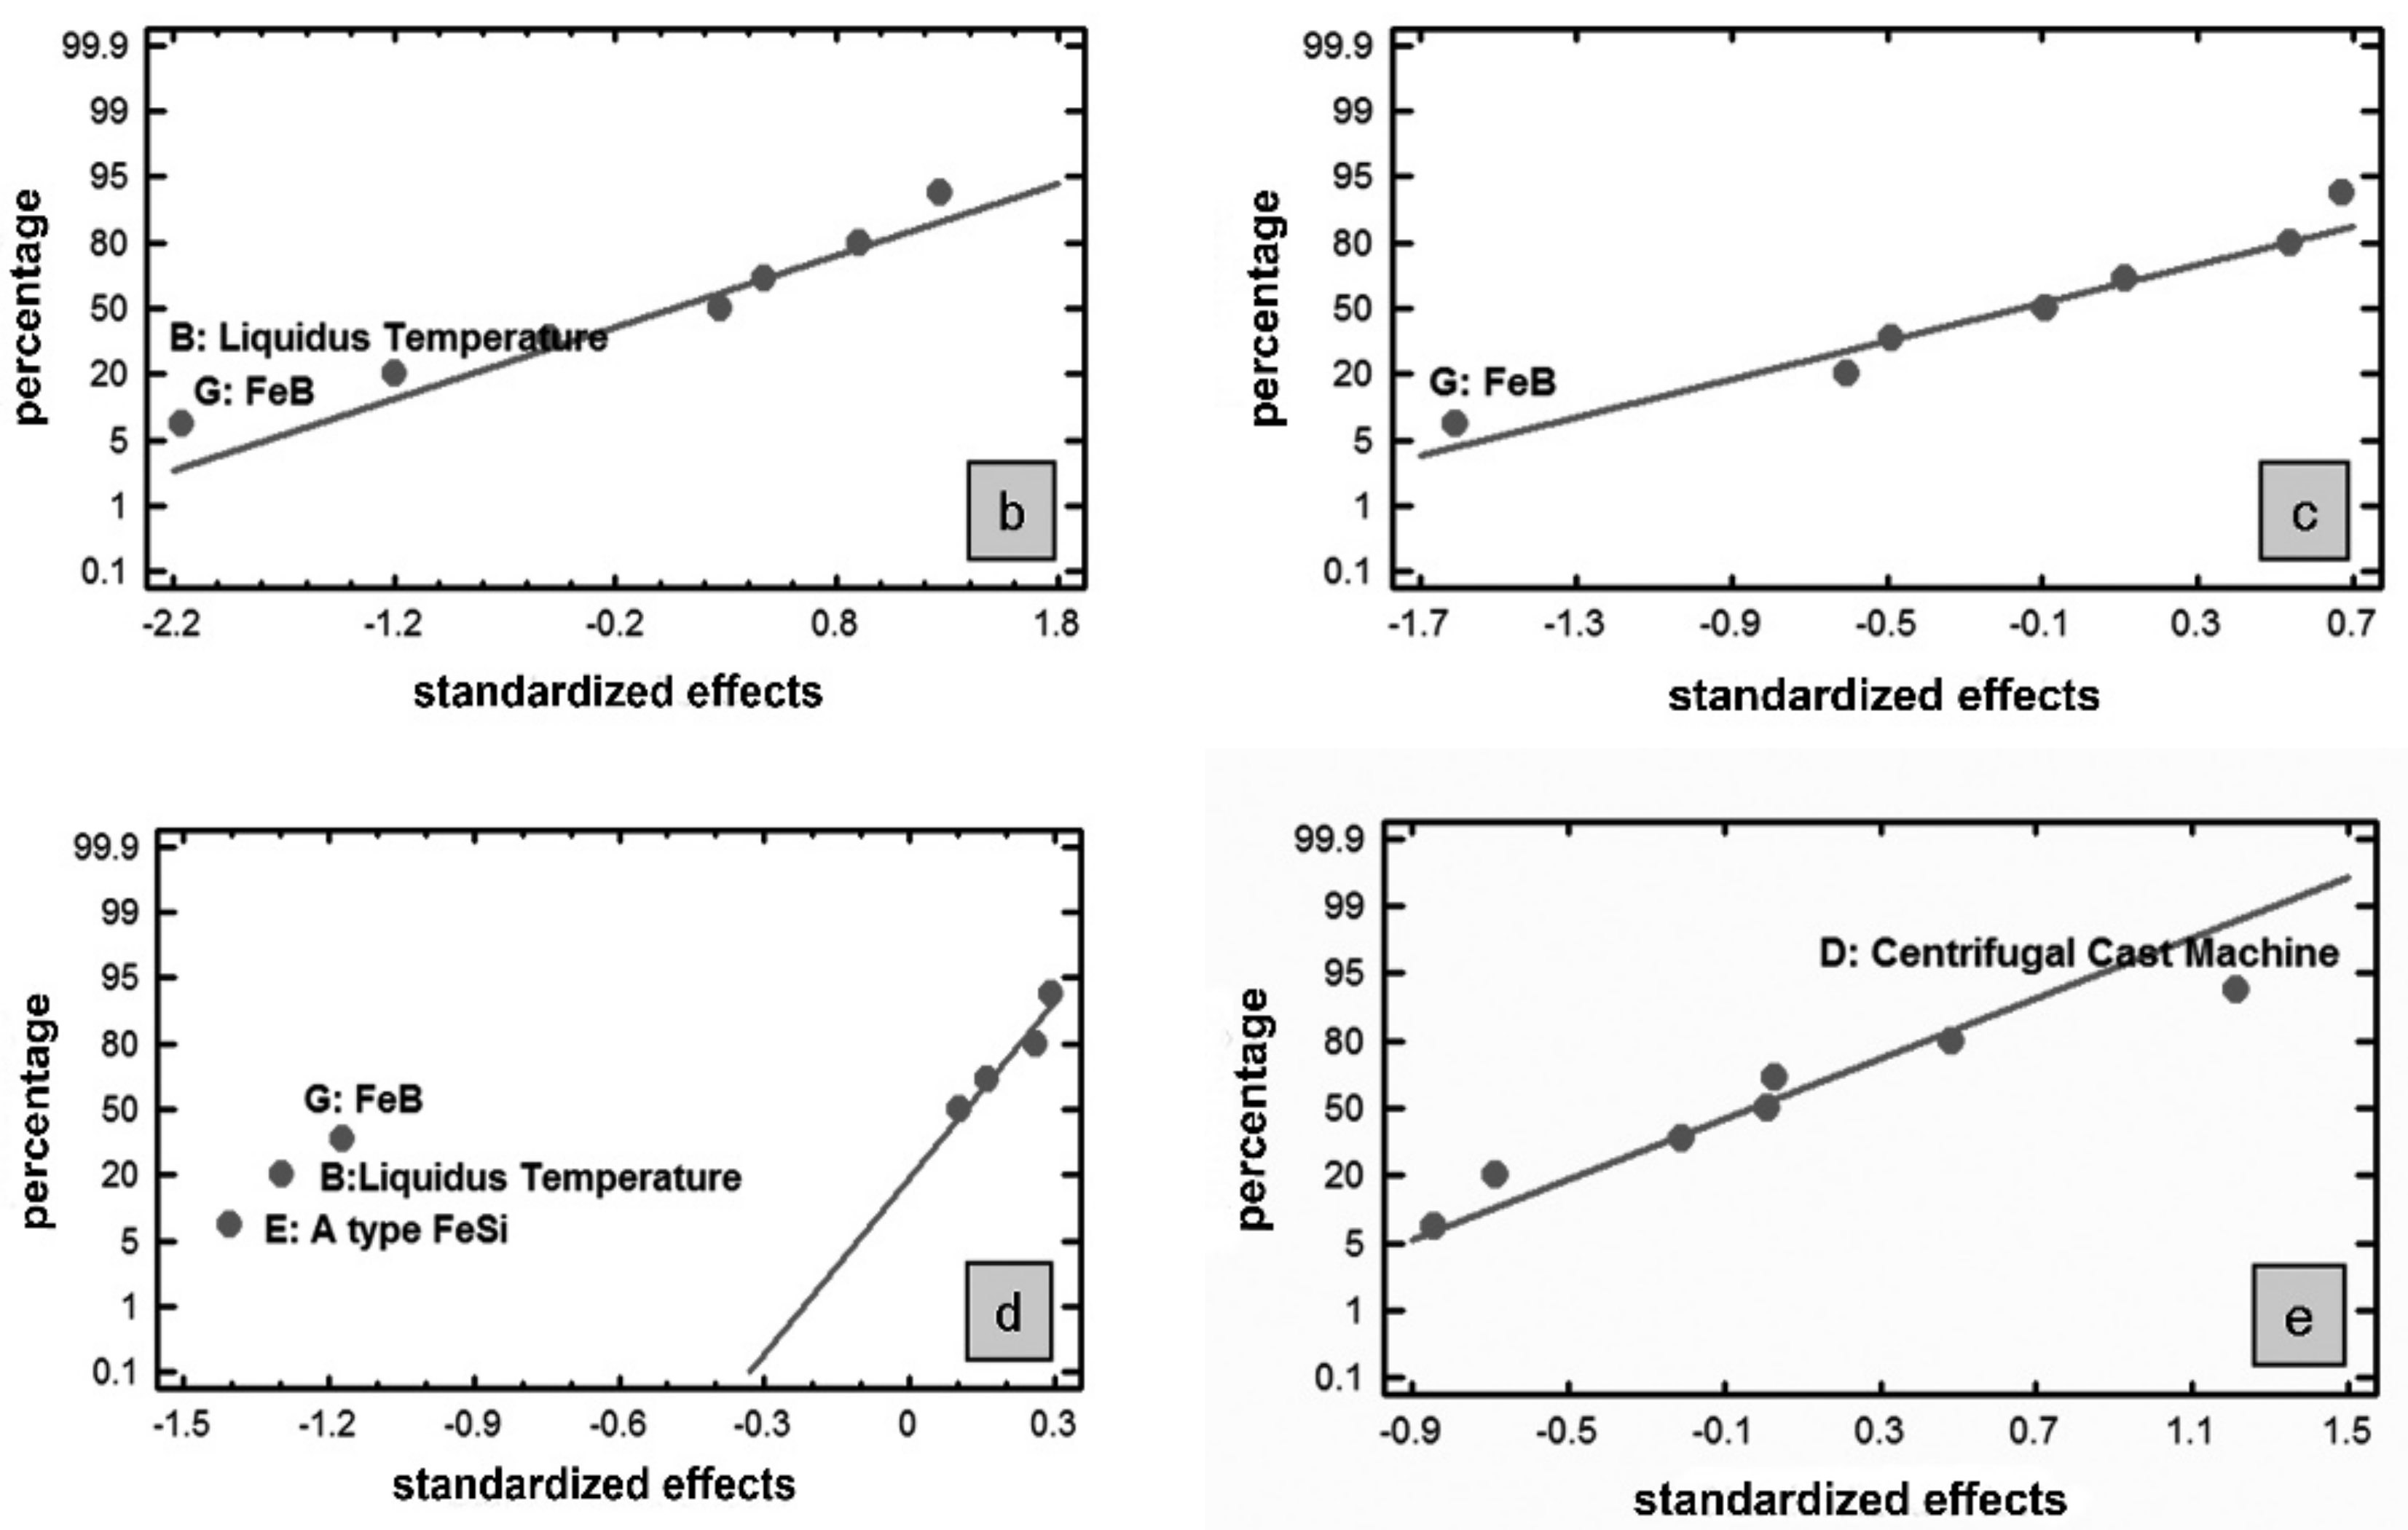
3.3. Significant Effects on the Feret’s Diameter Ratio

Table 9 shows the calculated effects after applying Yates’ algorithm for the Feret’s diameter ratio, Fmax/Fmin.
Figure 5a shows that over the layer average, melts with higher liquidus temperatures (1250–1255 °C) inoculated with 0.6 kg/T instead of 0.3 kg/T of SiCaMn developed compacted graphite morphologies. A study of the four regions where the layer was divided showed that the effect of the liquidus temperature remained the same in all of the shell sections; while inoculation with SiCaMn was significant in all except the layer section adjacent to the shell-core interface as illustrated in Figure 5b–e. This reflects that the effect of SiCaMn as an inoculant in the molten metal on a compact graphite morphology was not significant in inner regions of the layer; however, this does not mean that it favors a laminar morphology in these regions. It should be noted that, as with SiCaMn, the %Si had a significant effect on the graphite morphology in the outermost region of the work layer (zones I and II), promoting a compact morphology at its −1 level (content in Si between 0.9% and 1%); see Figure 5b,c. It should be stressed that the addition of FeB at the levels defined in this study did not have a significant effect on the morphology of the precipitated graphite.
Similarly, the total percent silicon in zones I and II (see Figure 5b,c) with a low Si amount between 0.9–1.0 wt % also favored the production of the compacted graphite morphology. It was concluded that high carbon equivalent contents, calculated as % C + % S i 3 +   % P 3 + 0.4 × % S i 0.027 × % M n , might favor the development of elongated graphite shapes in Nihard mottled irons, as depicted in Figure 6. The carbon equivalent defines the carbon content of the eutectic constituent.

4. Conclusions

Table 10 summarizes the results obtained in the DoE and presents the significant factors revealed by this study. It also shows the levels that define the steepest ascent gradient permitting an increase in each of the studied variables. For the levels defined by the metallurgical factors which define the manufacturing ranges studied in the present DoE, it was concluded:
  • An increase in the amount of FeB added reduced the amount of precipitated graphite, i.e., promoted metastable eutectic solidification while reducing the graphite count number. Higher additions of B did not significantly affect the morphology of graphite or favor compact graphite morphologies.
  • Precipitation of compact graphite was favored by higher liquidus temperatures (~1250–1255 °C), low final Si levels in the ladle (~0.9–1.0 wt %), and by inoculation with high SiCaMn (~0.6 kg/T).
  • An increase in the amount of SiCaMn had no effect on the volume fraction of the precipitated graphite or on the number of counts per unit area.
  • Lastly, an increase in Ni content from 4.3 to 4.7 wt % had no significant effect over the responses studied, particularly with regard to the development of either the stable (Fe-C(g)) or metastable (Fe-Fe3C) solidification, despite its known graphite forming tendency.
  • The centrifugal casting machine, which has a higher level of insulation, produced an increase in the volume fraction of graphite in the innermost regions of the work layer, adjacent to the core of the rolling cylinder.

Author Contributions

J.A.-L. conceived and designed the experiments; A.G.-P. performed the experiments; J.F.A.-A. analyzed the data; B.D.R.-L. contributed reagents/materials/analysis tools; and J.F.A.-A. wrote the paper.

Acknowledgments

No type of grant has been received to carry out this study.

Conflicts of Interest

The authors declare no conflict of interest.

References

  1. Noda, N.A.; Hu, K.; Ono, K.; Hosokawa, Y. Residual Stress Simulation for Hot Strip Bimetallic Roll during Quenching. Steel Res. Int. 2016, 87, 1478–1488. [Google Scholar] [CrossRef]
  2. Tercelj, M.; Fajfar, P.; Godec, M.; Kugler, G. Characteristics of the thermal fatigue resistance for 3.1C, 0.8Si, 0.9Mn, 1.7Cr, 4.5Ni and 0.3Mo ICDP cast iron roll at 600 °C. Mater. Technol. 2017, 51, 515–521. [Google Scholar] [CrossRef]
  3. Bombac, D.; Kugler, G.; Bostjan, M.; Tercelj, M. Hot work roller surface layer degradation progress during thermal fatigue in the temperature range 500–700 °C. Int. J. Fatigue 2017, 104, 355–365. [Google Scholar] [CrossRef]
  4. Mohammed, W.M.; Eu-Gene, N.G.; Elbestawi, M.A. On stress propagation and fracture in compacted graphite iron. Int. J. Adv. Manuf. Technol. 2011, 56, 233–244. [Google Scholar] [CrossRef]
  5. Miyahara, H.; Bravo, S.V.; Yamamoto, K.; Ogi, K. Solute Concentration and Carbides Formation for Steel Milling Rolls. ISIJ Int. 2009, 49, 1075–1079. [Google Scholar] [CrossRef]
  6. Sergio, V.; Shikawa, S.; Yamamoto, K.; Miyahara, H. Control of graphite formation in solidification of white cast iron. Int. J. Cast Met. Res. 2008, 21, 27–30. [Google Scholar] [CrossRef]
  7. Asensio, J.; Álvarez, J.F. Saturated fractional design of experiments: Toughness and graphite phase optimizing in Nihard cast irons. J. Mater. Eng. Perform. 2008, 17, 216–223. [Google Scholar] [CrossRef]
  8. Asensio, J.; Álvarez, J.F.; Vander Voort, G.F. Identification and quantification of active manufacturing factors for graphite formation in centrifugally cast Nihard cast irons. J. Mater. Process. Technol. 2008, 206, 202–215. [Google Scholar] [CrossRef]
  9. Varela, A.; García, A.; Zaragoza, S.; Mier, J.L.; Barbadillo, F.; García, L. Influencia de los tratamientos térmicos en el comportamiento frente al desgaste por abrasión de una fundición de grafito esferoidal obtenida mediante adición de boro. Rev. Metal. 2008, 44, 293–298. [Google Scholar]
  10. Dojka, R.; Studnicki, A. Influence of Boron on Crystallization and Microstructure of Ductile Cast Iron. Arch. Foundry Eng. 2016, 17, 15–20. [Google Scholar] [CrossRef]
  11. Correa, R.; Bedolla-Jacuinde, A.; Mejia, I.; Cardoso, E.; Hernández, B. Effect of boron on microstructure of directionally solidified high chromium white irons. Int. J. Cast Met. Res. 2011, 24, 37–44. [Google Scholar] [CrossRef]
  12. Col, M.; Koc, F.G.; Oktem, H.; Kir, D. The Role of Boron Content in High Alloy White Cast Iron (Ni-Hard 4) on Microstructure, Mechanical Properties and Wear Resistance. Wear 2016, 348, 158–165. [Google Scholar] [CrossRef]
  13. Asensio, J.; Álvarez, J.F.; Vander Voort, G.F. Microstructural control of FeB-inoculated mottled low-alloy white iron by a design of experiments approach. Int. J. Mater. Res. 2008, 11, 1237–1247. [Google Scholar] [CrossRef]
  14. Borisov, I.A; L’Boba, S.S. Choice of steel for rolling mill Rolls. Met. Sci. Heat Treat. 2009, 51, 272–277. [Google Scholar] [CrossRef]
  15. Bravo, S.V.; Yamamoto, K.; Miyahara, H.; Ogi, K. Control of carbides and graphite in Ni-hard type cast iron for hot strip mills. Mater. Sci. Forum 2007, 561–565, 1023–1026. [Google Scholar] [CrossRef]
  16. Harvey, J.N.; Noble, G.A. Inoculation of Cast Irons. An Overview. In Proceedings of the 55th Indian Foundry Congress, Agra, India, 2–4 February 2007; pp. 343–360. [Google Scholar]
  17. Álvarez, J.F.; Álvarez, C.H.; Asensio, J. Identification of metallurgical manufacturing factors with a significant effect on the flexural strength of mottled Ni-Hard cast irons through a design of experiments approach. Int. J. Met. 2017, 11, 467–474. [Google Scholar] [CrossRef]
  18. Prat, A.; Tort-Martorell, X.; Grima, P.; Pozueta, L. Métodos Estadísticos, Control y Mejora de la Calidad; UPC: Barcelona, Spain, 1997; pp. 170–172. ISBN 9788498802320. [Google Scholar]
  19. Ramachandran, K.M.; Tsokos, C.P. Mathematical Statistics with Applications in R, 1st ed.; Elsevier: San Diego, CA, USA, 2009; pp. 466–471. ISBN 9780080951706. [Google Scholar]
  20. Tanco, M.; Viles, E.; Ilzarbe, L.; Álvatrez, M.J. Implementation of Design of Experiments projects in industry. Appl. Stoch. Models Bus. Ind. 2009, 25, 478–505. [Google Scholar] [CrossRef]
  21. Cox, D.R.; Reid, N. The Theory of Design of Experiments; Chapman & Hall/CRC: Washington, DC, USA, 2000; pp. 99–115. ISBN 1-58488-195-X. [Google Scholar]
  22. Montgomery, D.; Runger, G. Probabilidad y Estadística Aplicada a la Ingeniería, 2th ed.; Limusa: México, DF, Mexico, 2003; pp. 693–703. ISBN 9789681859152. [Google Scholar]
  23. Romero, R.; Zúnica, L.R. Métodos Estadísticos en Ingeniería; Universidad Politécnica de Valencia: Valencia, Spain, 2005; pp. 275–278. ISBN 84-9705-727-9. [Google Scholar]
  24. Vander Voort, G.F. Metallography: Principles and Practice; McGraw-Hill Inc.: New York, NY, USA, 1984; p. 410. ISBN 9780070669703. [Google Scholar]
  25. Image-Pro Plus, version 5.5.0.29; Media Cybernetics, Inc.: Rockville, MD, USA, 2000.
  26. Statgraphics Plus, version 5.1; Statgraphics Technologies, Inc.: The Plains, VA, USA, 2001.
  27. Johnson, R. Probabilidad y Estadística para Ingenieros, 3rd ed.; Prentice-Hall Hispanoamérica: México, DF, Mexico, 1997; pp. 489–494. ISBN 9688809616. [Google Scholar]
  28. Walpole, R.; Myers, R.; Myers, S. Probabilidad y Estadística para ingenieros, 6th ed.; Prentice-Hall Hispanoamericana, S.A.: México, DF, Mexico, 1999; p. 566. ISBN 970-17-0264-6. [Google Scholar]
  29. Chatfield, C. Statistics for Technology—A Course in Applied Statistics, 3rd ed.; Chapman and Hall: Bristol, UK, 1983; p. 257. ISBN 9780412253409. [Google Scholar]
Figure 1. Selected light optical micrographs of the mid-section or working zone (zone II and/or zone III) of the ring roll layers for each experiment in the DOE analysis: (ah), Experiment 1 to 8. Microstructures presented in the as-polished state.
Metals 08 00293 g001aMetals 08 00293 g001b
Figure 2. (ae) Normal Probability Plot for the Volume Fraction of Graphite (%) in: (a) the Layer Average; (b) the periphery of the layer (zone I); (c) zone II; (d) zone III; and (e) in the layer section adjacent to the shell- interface region (zone IV).
Metals 08 00293 g002aMetals 08 00293 g002b
Figure 3. (ae) Normal Probability Plot for the graphite count number NA, in: (a) the Layer Average; (b) the periphery of the layer (zone I); (c) zone II; (d) zone III; and (e) in the layer section adjacent to the shell-interface region (zone IV).
Metals 08 00293 g003
Figure 4. Relation between the graphite count number per mm2, NA, and its volume fraction.
Metals 08 00293 g004
Figure 5. (ae) Normal Probability Plot for the Feret diameter ratio (Fmax/Fmin) in: (a) the Layer Average; (b) the periphery of the layer (zone I); (c) zone II; (d) zone III; and (e) in the layer section adjacent to the shell- interface region (zone IV).
Metals 08 00293 g005aMetals 08 00293 g005b
Figure 6. Relationship between the equivalent carbon and the graphite morphology given by the Feret diameter ratio.
Metals 08 00293 g006
Table 1. Chemical composition ranges of the outer ring layers expressed in weight percent (wt %).
CMnSiSPCrNiMo
3.2–3.30.9–1.00.9–1.0<0.015<0.0351.7–1.84.2–4.40.25
Table 2. Chemical composition of inoculants expressed in weight percent with an indication of regular amounts added to the treatment ladle expressed in kg/T.
InoculantsBase ChemistryAmount Added
SiCaAlZrTiCSPMnBFe
A-type FeSi75.02.51.41.6------------------rem.0
B-type FeSi75.40.51.0---0.0310.20.0010.012------rem.2.4
FeMn2.0------------5.80.0140.13069.4---rem.0.8
SiCaMn58.316.41.1---0.0300.60.0300.03014.8---7.40.38
FeB0.4------------0.3---------17.9rem.6
Table 3. Factors and Level Description for DOE.
FactorsLevels
CodeMetallurgical Parameter CorrespondenceLevel −1Level +1
A% Ni4.34.7
BLiquidus Temperature1225–12301250–1255
C% Si0.9–11.1–1.2
DCentrifugal Cast Machine12
EA–Type FerroSiliconNone4 kg/T
FSiCaMn0.3 Kg/T0.6 Kg/T
GFeB6 kg/T10 kg/T
Table 4. ( 2 III 7 4 ) Array for DOE.
No.ABCDEFG
1−1−1−1+1+1+1−1
2+1−1−1−1−1+1+1
3−1+1−1−1+1−1+1
4+1+1−1+1−1−1−1
5−1−1+1+1−1−1+1
6+1−1+1−1+1−1−1
7−1+1+1−1−1+1−1
8+1+1+1+1+1+1+1
Table 5. Generators and Confusions in the ( 2 III 7 4 ) matrix consisting of eight experiments and seven factors.
GeneratorsConfusions
D = AB
E = AC
F = BC
G = ABC
A + BD + CE + FG
B + AD + CF + EG
C + AE + BF + DG
D + AB + EF + CG
E + AC + DF + BG
F + BC + DE + AG
G + AF + BE + CD
Table 6. Casting parameters measured for each experiment in the DOE.
Casting ParametersUnitsExperiment Number
12345678
C%3.233.3833.143.423.283.083.1
Mn%0.890.880.860.880.890.890.9060.9
Si%1.0170.940.940.951.1061.111.121.07
S%0.0120.0120.010.020.0080.0110.0120.015
P%0.0280.0260.0260.0290.0220.0240.0230.02
Cr%1.7551.791.791.781.781.781.781.8
Ni%4.284.764.434.724.274.844.284.62
Mo%0.2450.250.270.380.270.260.2960.28
Type A-FeSikg/T40400404
Type B-FeSikg/T04044040
FeBkg/T610106106610
FeMnKg/T00000000
SiCaMnkg/T0.60.60.30.30.30.30.60.6
Liquidus Temperature°C12301224125212541225123212551252
Casting Temperature°C13371330134813571338132813551371
Centrifugal Cast MachineNo.21122112
Table 7. Calculation of the Effects by means of Yates’ Algorithm, for the percentage of volume fraction of Graphite, (Vv(Graphite)-%).
ExperimentMeanEffectsZone IEffectsZone IIEffectsZone IIIEffectsZone IVEffectsEffects
16.855.689.166.055.945.045.975.596.346.02Mean 1
25.770.425.900.275.380.676.360.265.450.49A
33.62−0.773.64−1.203.08−0.603.24−1.294.500.01B
46.590.586.500.905.960.116.180.117.731.21C
55.43−0.074.77−0.494.19−0.096.340.306.420.03D
66.19−0.536.770.475.87−0.496.26−1.415.85−0.69E
75.960.446.101.275.620.546.270.165.85−0.21F
84.99−1.445.58−2.164.31−1.614.06−1.176.02−0.85G
1 Average value of the responses analyzed in the eight experiments.
Table 8. Calculation of the Effects by means of Yates’ Algorithm for NA (number of counts per mm2).
ExperimentMeanEffectsZone IEffectsZone IIEffectsZone IIIEffectsZone IVEffectsEffects
1376.29273.95428.39338.75391.26288.51369.91239.37315.60229.16Mean 1
2249.935.80414.0031.44297.5022.39169.87−10.44118.35−20.19A
3158.85−39.45164.76−122.41154.55−76.93135.06−17.17181.0158.71B
4343.9242.82362.0210.33351.8131.21355.5264.51306.3265.21C
5248.07−16.59350.41−7.08271.51−20.54200.97−36.43169.40−2.32D
6300.40−23.55407.04−59.99347.63−29.36251.09−20.65195.8615.78E
7300.9822.28348.5635.39291.9314.27272.447.43291.0132.02F
8213.15−112.90234.85−95.49201.89−114.29160.12−145.73255.73−96.07G
1 Average value of the responses analyzed in the eight experiments.
Table 9. Calculation of the Effects by means of Yates’ Algorithm, for Feret max/Feret min, Fmax/Fmin.
ExperimentMeanEffectsZone IEffectsZone IIEffectsZone IIIEffectsZone IVEffectsEffects
12.392.671.962.292.112.502.212.993.262.88Mean 1
22.930.352.170.172.420.353.570.563.540.33A
31.99−1.141.98−0.461.91−0.742.07−1.641.98−1.73B
42.07−0.142.070.012.260.002.07−0.271.87−0.32C
53.590.652.920.493.280.654.571.023.580.44D
64.050.043.030.023.670.024.88−0.124.600.24E
72.00−0.511.97−0.421.99−0.561.98−0.822.05−0.25F
82.330.082.240.072.35−0.022.560.402.17−0.13G
1 Average value of the responses analyzed in the eight experiments.
Table 10. Significant factors and levels providing an increase in the selected layer average responses.
ResponseSignificant FactorsSteepest Ascent Level
CodeMetallurgical Parameter InvestigatedLevelCorresponding Value
VV(Graphite)GFeB−16 kg/T
NAGFeB−16 kg/T
Fmax/FminBLiquidus Temperature−11225–1230 °C
FSiCaMn−10.3 Kg/T
C%Si+11.1–1.2%

