Article

Impact of Angular Distortion on the Fatigue Performance of High-Strength Steel T-Joints in as-Welded and High Frequency Mechanical Impact-Treated Condition

by
Markus J. Ottersböck
*,
Martin Leitner
and
Michael Stoschka
Chair of Mechanical Engineering, Montanuniversität Leoben, 8700 Leoben, Austria
*
Author to whom correspondence should be addressed.
Metals 2018, 8(5), 302; https://doi.org/10.3390/met8050302
Submission received: 28 March 2018 / Revised: 19 April 2018 / Accepted: 19 April 2018 / Published: 27 April 2018
(This article belongs to the Special Issue Fatigue and Wear for Steels)

Abstract

:
In general, distortion has significant effects on the assembly process of welded structures and remarkable influences on the strength of the welds. Therefore, this work focuses on the effect of angular welding distortion on fatigue strength to improve transferability of specimen results to components. Experimental investigations cover manufacturing and fatigue testing of three single-sided transversal stiffeners series exhibiting different angular distortions. The fatigue test results of as-welded specimen show a distinct link between fatigue performance and initial angular distortion. However, in case of a high frequency mechanical impact (HFMI)-treated weld toe, the fatigue strength increases up to base material level and is independent of the distortion. A comprehensive numerical analysis reveals a complex interaction between the applied nominal load, initial specimen distortion and the local stress field. In this context, an engineering-feasible assessment is derived to estimate the local effective stresses featuring the acting local stress range as well as the stress ratio. The application of this distortion factor enables the set-up of a uniform S/N-curve with a significantly reduced scatter band.

1. Introduction

Distortion in welded components is a result of the thermal heat-input during welding [1,2] and its mechanical restraints [3,4]. In addition, phase transformations affect the distortion by changes of the inherent strain state within the heat-affected zone [5]. The distorted state of the joints affects the assembling process of welded structures and has remarkable influence on the strength of the weld [6,7,8]. Therefore, numerous recent publications deal with the estimation of welding distortion using transient thermo-mechanical simulation techniques or inherent strain methods [9,10,11]. In [12] measurements as well as numerical simulations to evaluate the angular distortion of fillet welded T-joints made of steel were presented. The numerical results revealed that phase transformations significantly affect the final state of distortion. A prediction of the welding distortion based on local displacement in the weld plastic zone by utilizing the inherent strain method was given in [13]. It was concluded that the proposed method estimates the welding distortion quite well, but it cannot properly estimate the variation of the transverse bending along the welding direction. A more detailed simulation technique to assess angular weld distortions was introduced in [14], in which the physics of the welding arc were considered. Therein the authors concluded that more details of the heat transport phenomenon and temperature dependency of the material properties need to be employed to improve the accuracy of the procedure. Besides numerical methods, also analytical computations are commonly applied; however, formulae are available only for selected geometries, like beams [15], which cannot be generalized for complex weld structures. Furthermore, local residual stress conditions additionally affect the distortion state and interact with them [16,17]. As the weld quality such as the angular distortion majorly affects the fatigue strength [18], it is important to optimize angular distortion as well as weldment characteristics as shown in [19]. A study in [20] presented that the local residual stress and angular distortion state remarkably changes the effective stress ratio at weld toe, which finally acts as superior influence factor on the fatigue strength. In addition, not only the weld characteristics, but also the external loading takes impact on the fatigue performance [21]. As no comprehensive analysis regarding both weld quality in terms of global properties such as angular distortion, and local parameters like residual stress and stress concentration, and external loading exists yet, this paper scientifically contributes to a holistic investigation of these effects on the fatigue strength of steel T-joints.
This work primarily researches the effect of angular welding distortion on fatigue test results. Fatigue testing clamps are often transversally fixed implying a straightening of the specimen during clamping. Thereby, the specimen is loaded by a clamping stress acting as additional mean stress. This circumstance influences the effective stress ratio at the weld toe during the subsequent cyclic loading. It mainly depends on the externally applied load stress level, the local residual stress condition, and the angular distortion of the specimen, which interacts with the free length between the clamping jaws. In case of bending fatigue tests on the other hand, specimen distortion plays only a minor role as the effective clamping-induced mean stresses and the impact on its effective stress ratio is almost negligible. Previous investigations presented in [22] concluded that the effective stress ratio in case of bending fatigue tests is independent of the angular welding distortion.
On the contrary, bending loading goes along with a gradual nominal stress distribution over specimen thickness, whereat in case of tensile loading, the nominal stress gradient into depth is zero. Thus, nominal stress fatigue results should be evaluated under consideration of the load case. Equation (1) shows the IIW-recommended [23] influence factor accounting the angular weld distortion α within a nominal stress assessment:
k m ( α , σ m e m ) =   1 + 3 α l c 2 t · tanh ( β 2 ) ( β 2 ) , β =   2 l c t 3 σ m e m E .
For a basic estimation, such analytical formulae are well applicable; however, to accurately consider distortion-induced clamping effects and their interactions with local characteristics and external loadings, a more elaborated concept is encouraged. Hence, an additional study on fatigue strength incorporating the use of the effective notch stress approach is conducted in the course of this research paper. The scientific aim of this work is to contribute to the effect of angular specimen distortion on the fatigue strength of welded transversal joints. Previous research work [24,25] already emphasized that further investigations on this topic are needed. The current analysis includes tumescent tensile fatigue tests involving specimens with varying welding distortion. A novel approach incorporating residual, distortion-induced clamping and load dependent stresses utilizing the effective notch stress method is presented to enable an improved fatigue assessment of welded joints. Furthermore, the effect of high frequency mechanical impact (HFMI) post-treatment is also discussed.

2. Specimen Manufacturing

The manufacturing of the T-joint specimen was conducted according to a previous work methodology given in [26] to ensure comparability of the test results. The base plate and the transversal stiffener consist of a high-strength steel S690 with 5 mm sheet thickness. A G69 solid wire filler metal and standard M21 shielding gas are utilized implying an even-matching nominal tensile strength of the weld seams. The sheets are sliced to specimen arrays of eight single specimens using water-jet cutting before welding. Figure 1 illustrates the welding setup, where each array is welded continuously to ensure a constant welding process. Furthermore, every specimen is clamped separately to establish equal fixture conditions and hence, a similar weld quality for each specimen is maintained. After the first pass, the array is cooled down to room temperature by natural air convection in fully clamped state. Subsequently, the second pass is welded in reverse direction and the array is finally unclamped after again reaching steady-state room temperature. In order to achieve certain levels of specimen distortions, some arrays are pre-stressed by a wire, which is placed beneath the array before final clamping; details are provided in [26]. Three different states of distortion are studied leading to different clamping-induced mean stresses at the weld toe:
  • V0: Natural welding distortion leading to a tensile clamping-induced mean stress state.
  • V1: No measurable welding distortion leading to about zero clamping-induced mean stresses.
  • V2: Welding distortion leading to a compressive clamping-induced mean stress state.
Overall, five arrays are welded per distortion state resulting in a total number of 120 specimens. During welding, temperature measurements are carried for the calculation of the t8/5-cooling time. The mean value is about t8/5 = 4 s, independent of the distortion state. After truncating of the arrays to single specimens, the side surfaces are machined and ground flush to obtain the final specimen shape. Thereby, each sample is optically inspected, whereat no distinctive differences in the local weld toe topography such as undercuts are visible.
Distortion measurements are carried out on each sample in order to evaluate the macroscopic angular welding distortion α. On each side of the transversal attachment, three measuring points are specified as depicted in Figure 2. Besides, the definition of α is shown in this figure causing positive values in case of bending towards the transversal stiffener. Subsequently, the angular welding distortion is evaluated by a linear interpolation of the respective measurement results on each fillet weld. The outcome of these calculations are shown in Figure 3 and the values are summarized in Table 1. In the chart, the specimen position is set according to the weld path of the second weld. This means, position number one refers to the at last weld seam in pass one and to the first seam segment in pass two. The different distortion states can be clearly distinguished, although some outliers are present. There is almost no significant correlation between the position of the specimen in the array and its angular distortion, which validates a constant weld process for all specimens. Only the first specimen tend to have a slightly higher distortion value than average, which may be caused by minor variations in stiffness within the array. In general, the values of the angular distortion are comparable for each manufactured series and follow the expected trend. Additionally, X-ray surface residual stress measurements at the weld toe are carried out on two specimens per distortion state, where the results are shown in Table 2. The residual stresses of the joint in distorted condition are measured in loading direction of the specimens. They are slightly compressive and indicate higher negative values at the first weld path consistently. Interestingly, the residual stress conditions are comparable for all distortion states.
Ten specimens of each distortion state are additionally HFMI post-treated, whereby an overview of the post-treatment clamping situation is depicted in Figure 4. The treatment is performed according to the recommendations given in [27]. One should note that the currently treated specimen side is unclamped to ensure the post-treatment is applied without clamping constraints and the samples can deform freely. Hence, it can be assumed that the observable change in angular distortion due to the post-treatment is primarily based on a modification of the residual stress condition at the weld toe and not due to bending of the specimens. Subsequently, additional distortion measurements quantify the change in angular specimen distortion due to the HFMI-treatment; see Figure 5. The left part of the figure shows the absolute values of distortion before and after post-treatment, whereas a certain impact on the angular deformation is clearly visible. On the right part, the difference in distortion is illustrated, showing that the HFMI-induced change in angular distortion towards negative values is comparable for all specimen series. Summing up, a mean change of about Δα = −0.6° is obtained by this post-treatment.

3. Fatigue Tests

The experimental investigations cover fatigue tests in as-welded and HFMI post-treated condition under tumescent tensile loading at a nominal load stress ratio of R = 0.1. The test stop criterion is burst fracture or run-out at ten million load-cycles. The evaluation of the test results in the finite lifetime domain is performed according to [28] whereas the high-cycle fatigue region is evaluated exercising [29]. Beyond the transition knee point Nk, a declination of ten percent per decade is applied corresponding to an inverse slope value of k′ = 22 matching the recommendation given in [30].
The experiments are performed on a hydraulic test rig at a test frequency of 10 Hz for higher load ranges and on a SincoTec resonance pulsator at about 85 Hz for testing in the endurance region. In addition, samples in the finite life region are tested by both machines to ensure that no test rig dependency exists. As introduced, the free length between the clamping devices has a major influence on the local stress state induced by the clamping process. Therefore, this parameter is set to a constant value of lc = 155 mm for all specimens on both test facilities.

3.1. Distortion Induced Clamping Stress

The stiffness of fatigue test rigs is significantly higher than the stiffness of the specimens. Therefore, clamping of distorted specimens causes a straightening leading to a constant bending moment over the specimens’ free length. In order to quantify this effect, every specimen is equipped with a uniaxial strain gauge to measure the occurring stresses due to specimen clamping. It is applied perpendicular to the second weld pass about 20 mm apart from the weld toe, see Figure 6. Therefore, this position captures only the changes in nominal stress state and is not affected by notch stress concentration [31]. As the further analysis is based on stress-evaluation, the strains measured at the strain gauges are converted to stresses using Hooke’s law with an elastic modulus of E = 210,000 MPa. Figure 6 shows the correlation between the measured clamping stress and the individual angular specimen distortion of every as-welded specimen. The linear regression of the data points clearly points out a linear relationship within the considered range. Furthermore, the result of a linear-elastic numerical analysis is illustrated in the graph indicating a sound accordance with the measured data; details are given in Section 4.1.

3.2. Fatigue Test Results

The outcome of the fatigue tests for the as-welded condition is shown in Figure 7 in terms of nominal stresses. The summary of the individual fatigue tests results is given in Table A1 in Appendix A. The statistical evaluation is performed for each distortion state separately, see Table 3. In addition, a combined evaluation of all datasets is given. The effect of various distortion states is clearly recognizable in terms of a shift in load cycles. However, the statistically evaluated inverse slopes in the finite life region are nearly identical. The distorted specimens with tensile clamping-induced mean stresses labelled as series V0 exhibit the lowest fatigue strength. Quite high compressive clamping stresses in series V2 lead to an increase of the nominal fatigue strength. As expected, series V1 featuring no specific welding distortion is placed between the two other limiting curves. All but one specimens show crack initiation from the weld toe, an exemplary fracture surface is shown in Figure 9a. The one outlier failed from a scratch at the sheet surface and is therefore excluded from evaluation.
Figure 8 depicts the fatigue test results of the HFMI-treated specimens, the data of the combined statistical analysis is also listed in Table 3. The summary of the individual fatigue tests results is given in Table A2 in Appendix A. As the majority of the specimens exhibit crack initiation from the base material, fatigue testing covers only five welded specimens per distortion state. Thereof, the majority of specimens failed at the bottom of the transversal stiffener.
Exemplary fracture surfaces are shown in Figure 9b,c, where the latter shows crack initiation from sheet surface at the bottom of the stiffener. The fatigue strength of the post-treated specimens reaches base material strength in both run-out level and finite life region although a comparably huge scatter band is observed. Hence, no characteristic dependency of the evaluated fatigue strength on the welding distortion can be identified. The fatigue performance of S690 base material as well as of HFMI-treated T-joints was already investigated in depth within previous work, see [32,33,34]. Table 3 contains a combined statistical evaluation using these HFMI-treated fatigue test results as well. Due to the thereby increased amount of testing data, the scatter band in the finite life domain is noticeably reduced.

4. Numerical Analysis

In this work, linear elastic numerical simulation runs are performed to analyse the local stress distribution of the investigated test series. For this purpose, six 3D-solid models are set-up including different angular distortion values α from −2° up to 
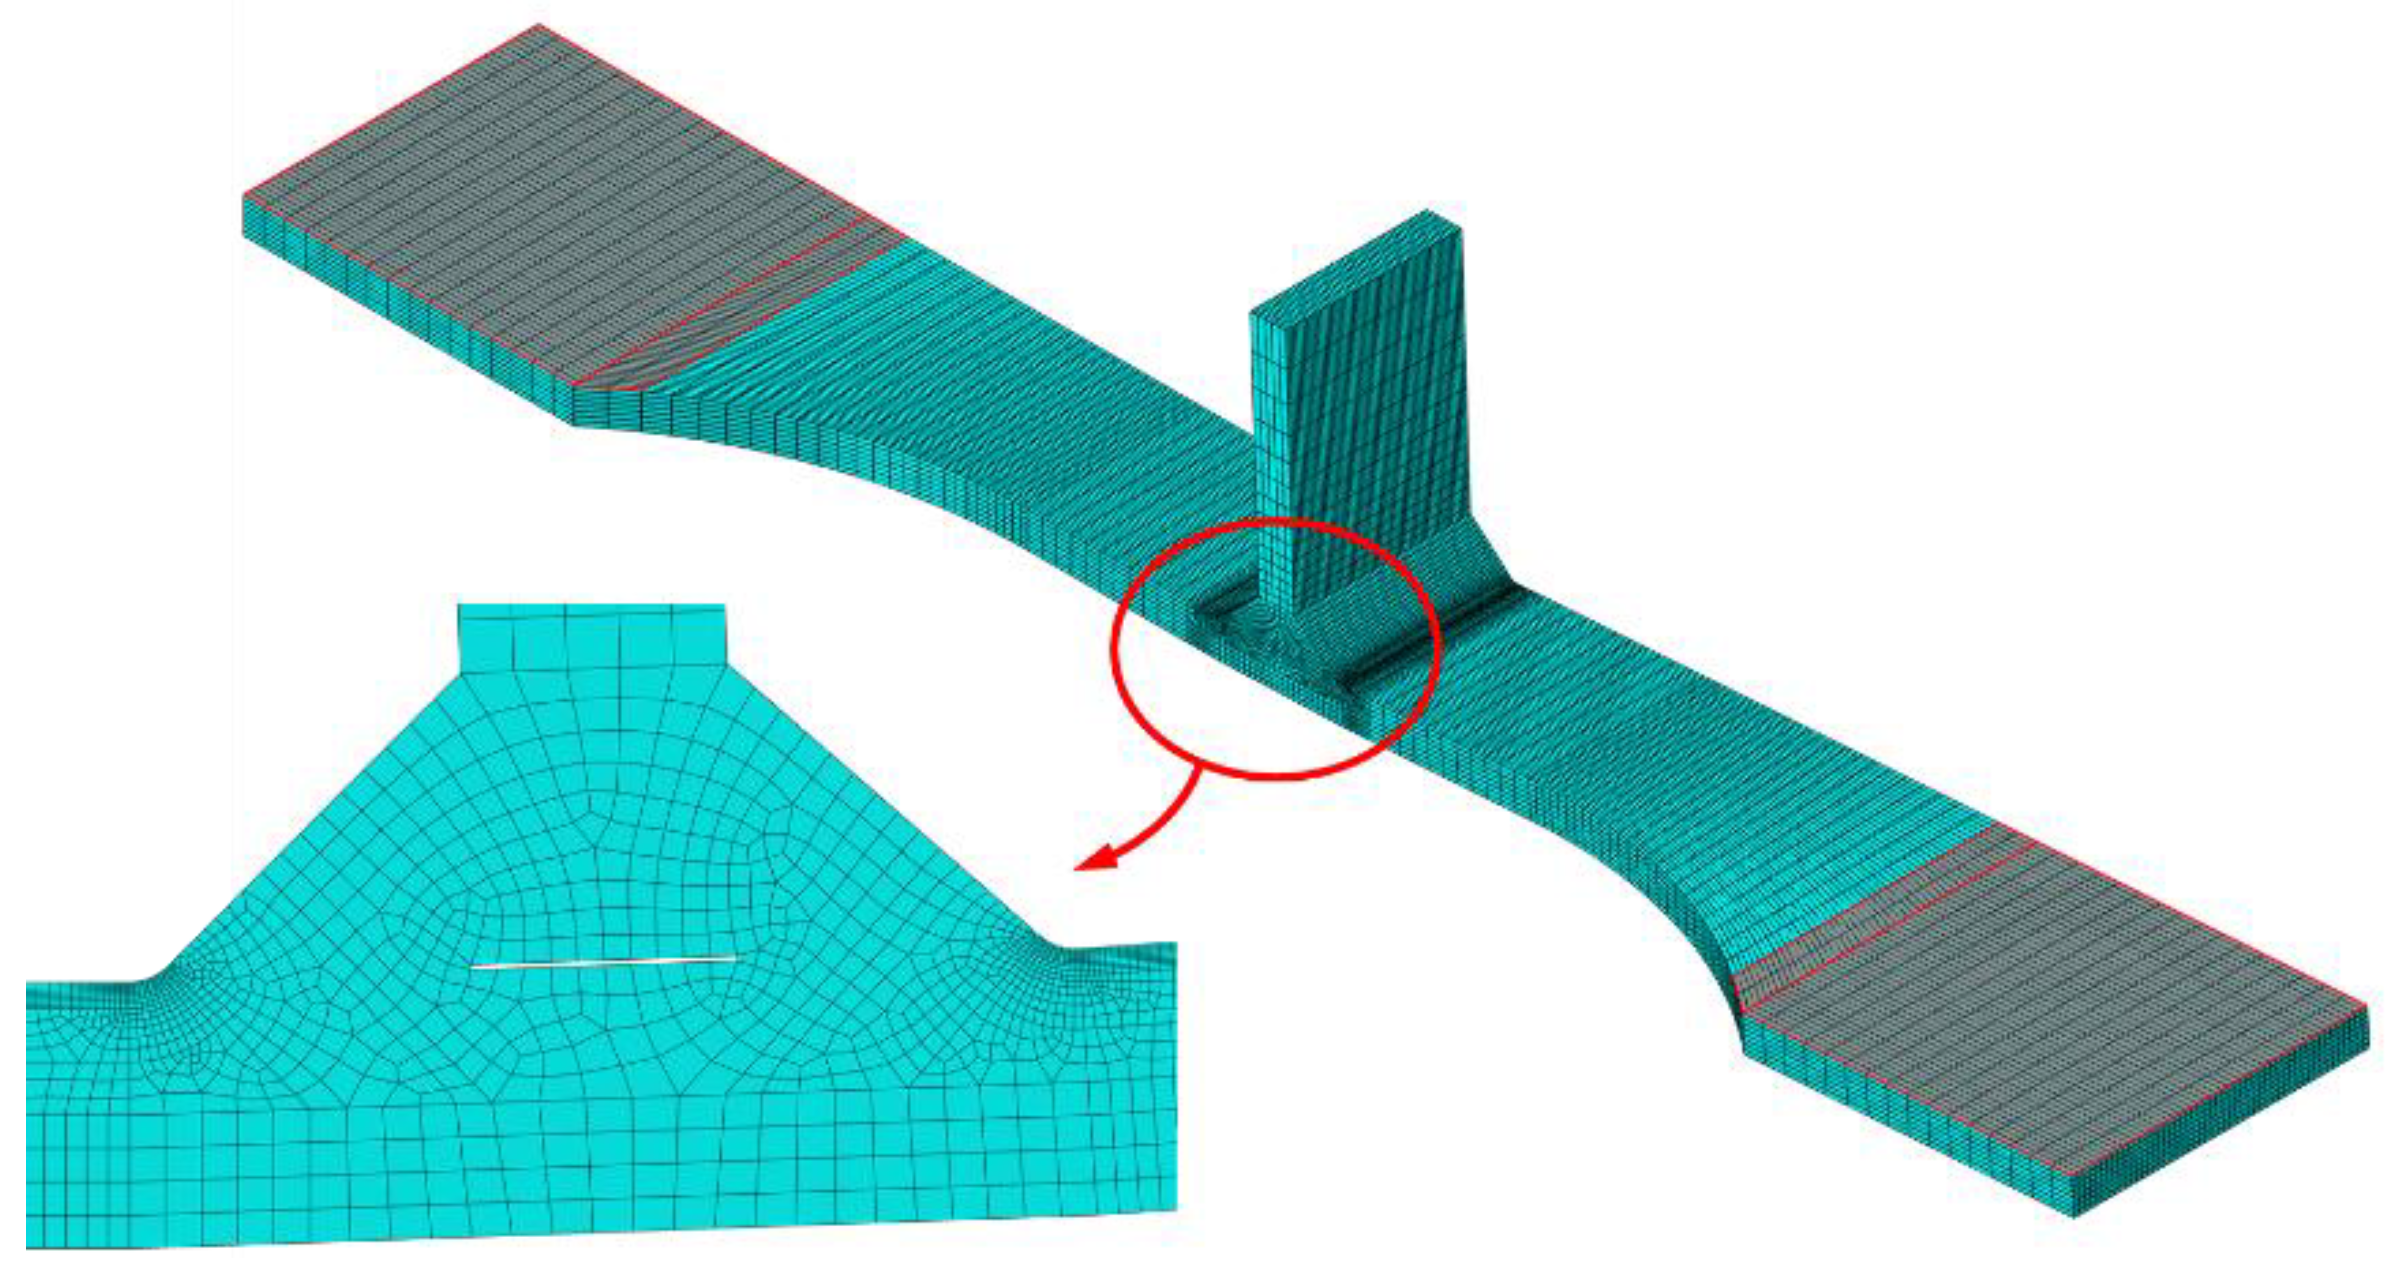
+4°. The geometry of the half-symmetric models represents the specimen including the broadening near the clamping area. For modelling of the weld topography, a weld throat thickness of 4 mm and a flank angle of 45° is uniquely applied. Furthermore, the region between the base plate and the stiffener is modelled as a gap with a thickness of 0.1 mm neglecting any possible contact between these surfaces. The evaluation of the effective notch stresses requires additional rounding of the weld toe with a fictitious radius of rref = 1 mm according to the approaches given in [35,36,37]. Figure 10 gives an overview of the half-symmetric model and the meshing in the joint region.
Besides the stress at the position of the strain gauge σSG and the effective notch stress σnotch, a structural stress σhs according to the IIW-guideline [23,38,39] is used within the fatigue assessment. Hereby, quadratic extrapolation following Equation (2) is applied, which fits to the spatial finite element models and mesh properties:
σ h s = 2.52 σ 0.4 t 2.24 σ 0.9 t + 0.72 σ 1.4 t .
In this context, Figure 11 illustrates the stress definitions and the corresponding evaluation procedures. The meshing of the model is performed in accordance to the suggestions in [40] applying hexahedral elements with quadratic shape functions and reduced integration scheme. To assess any nonlinear geometric effects due to high loads properly, the large deformation theory is enabled.

4.1. Clamping Stresses

The first part of the numerical investigations deals with the estimation of the stresses acting due to specimen clamping. As welded specimens exhibit various amounts of angular misalignment, an explicit formulation of the clamping stresses σclamp with respect to the distortion angle α is necessary. Therefore, a simplified model is set up in correlation with the testing facilities exhibiting a free length of lc = 155 mm between the clamps. The clamping process itself is simulated by adjusting the clamping areas horizontally. Thereby, Figure 10 illustrates the effective area of the clamping jaws. In detail, the left clamping area is fully fixed corresponding to a specimen clamped on one side. Subsequently, the right fixing area is rotated about the angular distortion of the specimen while allowing any movement in horizontal loading direction, see Figure 12. Although a global levelling of the specimen is forced by the clamping procedure, some distortion is still visible in the region around the weld detail.
Figure 13 gives an overview of the stresses resulting from the clamping process with respect to the initial angular distortion; the corresponding values are listed in Table 4. All three evaluated stresses show a linear dependency on the angle of distortion within the investigated range. Thereby, Equations (3)–(5) denote the outcome of the respective linear regression runs for nominal, hot-spot and notch stress distribution:
σ S G , c l a m p ( α ) =   67.2 MPa deg · α 0.195   MPa ,
σ h s , c l a m p ( α ) =   77.6 MPa deg · α 0.539   MPa ,
σ n o t c h , c l a m p ( α ) =   139.2 MPa deg · α 2.026   MPa .
The simulated nominal stresses at the strain gauge position are compared to the measured values in Figure 6 and reveal a sound accordance.

4.2. Specimen Loading

Building on the results of the clamping procedure, the loading of the specimen is simulated, see Figure 12. At first, a unity load leading to a nominal stress of 1 MPa in the cross section is applied. Subsequently, the load increases to 1000 MPa in steps of 100 MPa to cover the effect of the external load level. Hereby, an actual stress concentration factor Kact is defined and evaluated stepwise in order to assess the stress concentration without influence of the clamping stresses due to initial specimen distortion, see Equation (6):
K a c t =   σ l o c a l σ c l a m p σ N .
It is defined as the local stress σlocal subtracted by the clamping stress σclamp over the nominal σN or membrane stress 
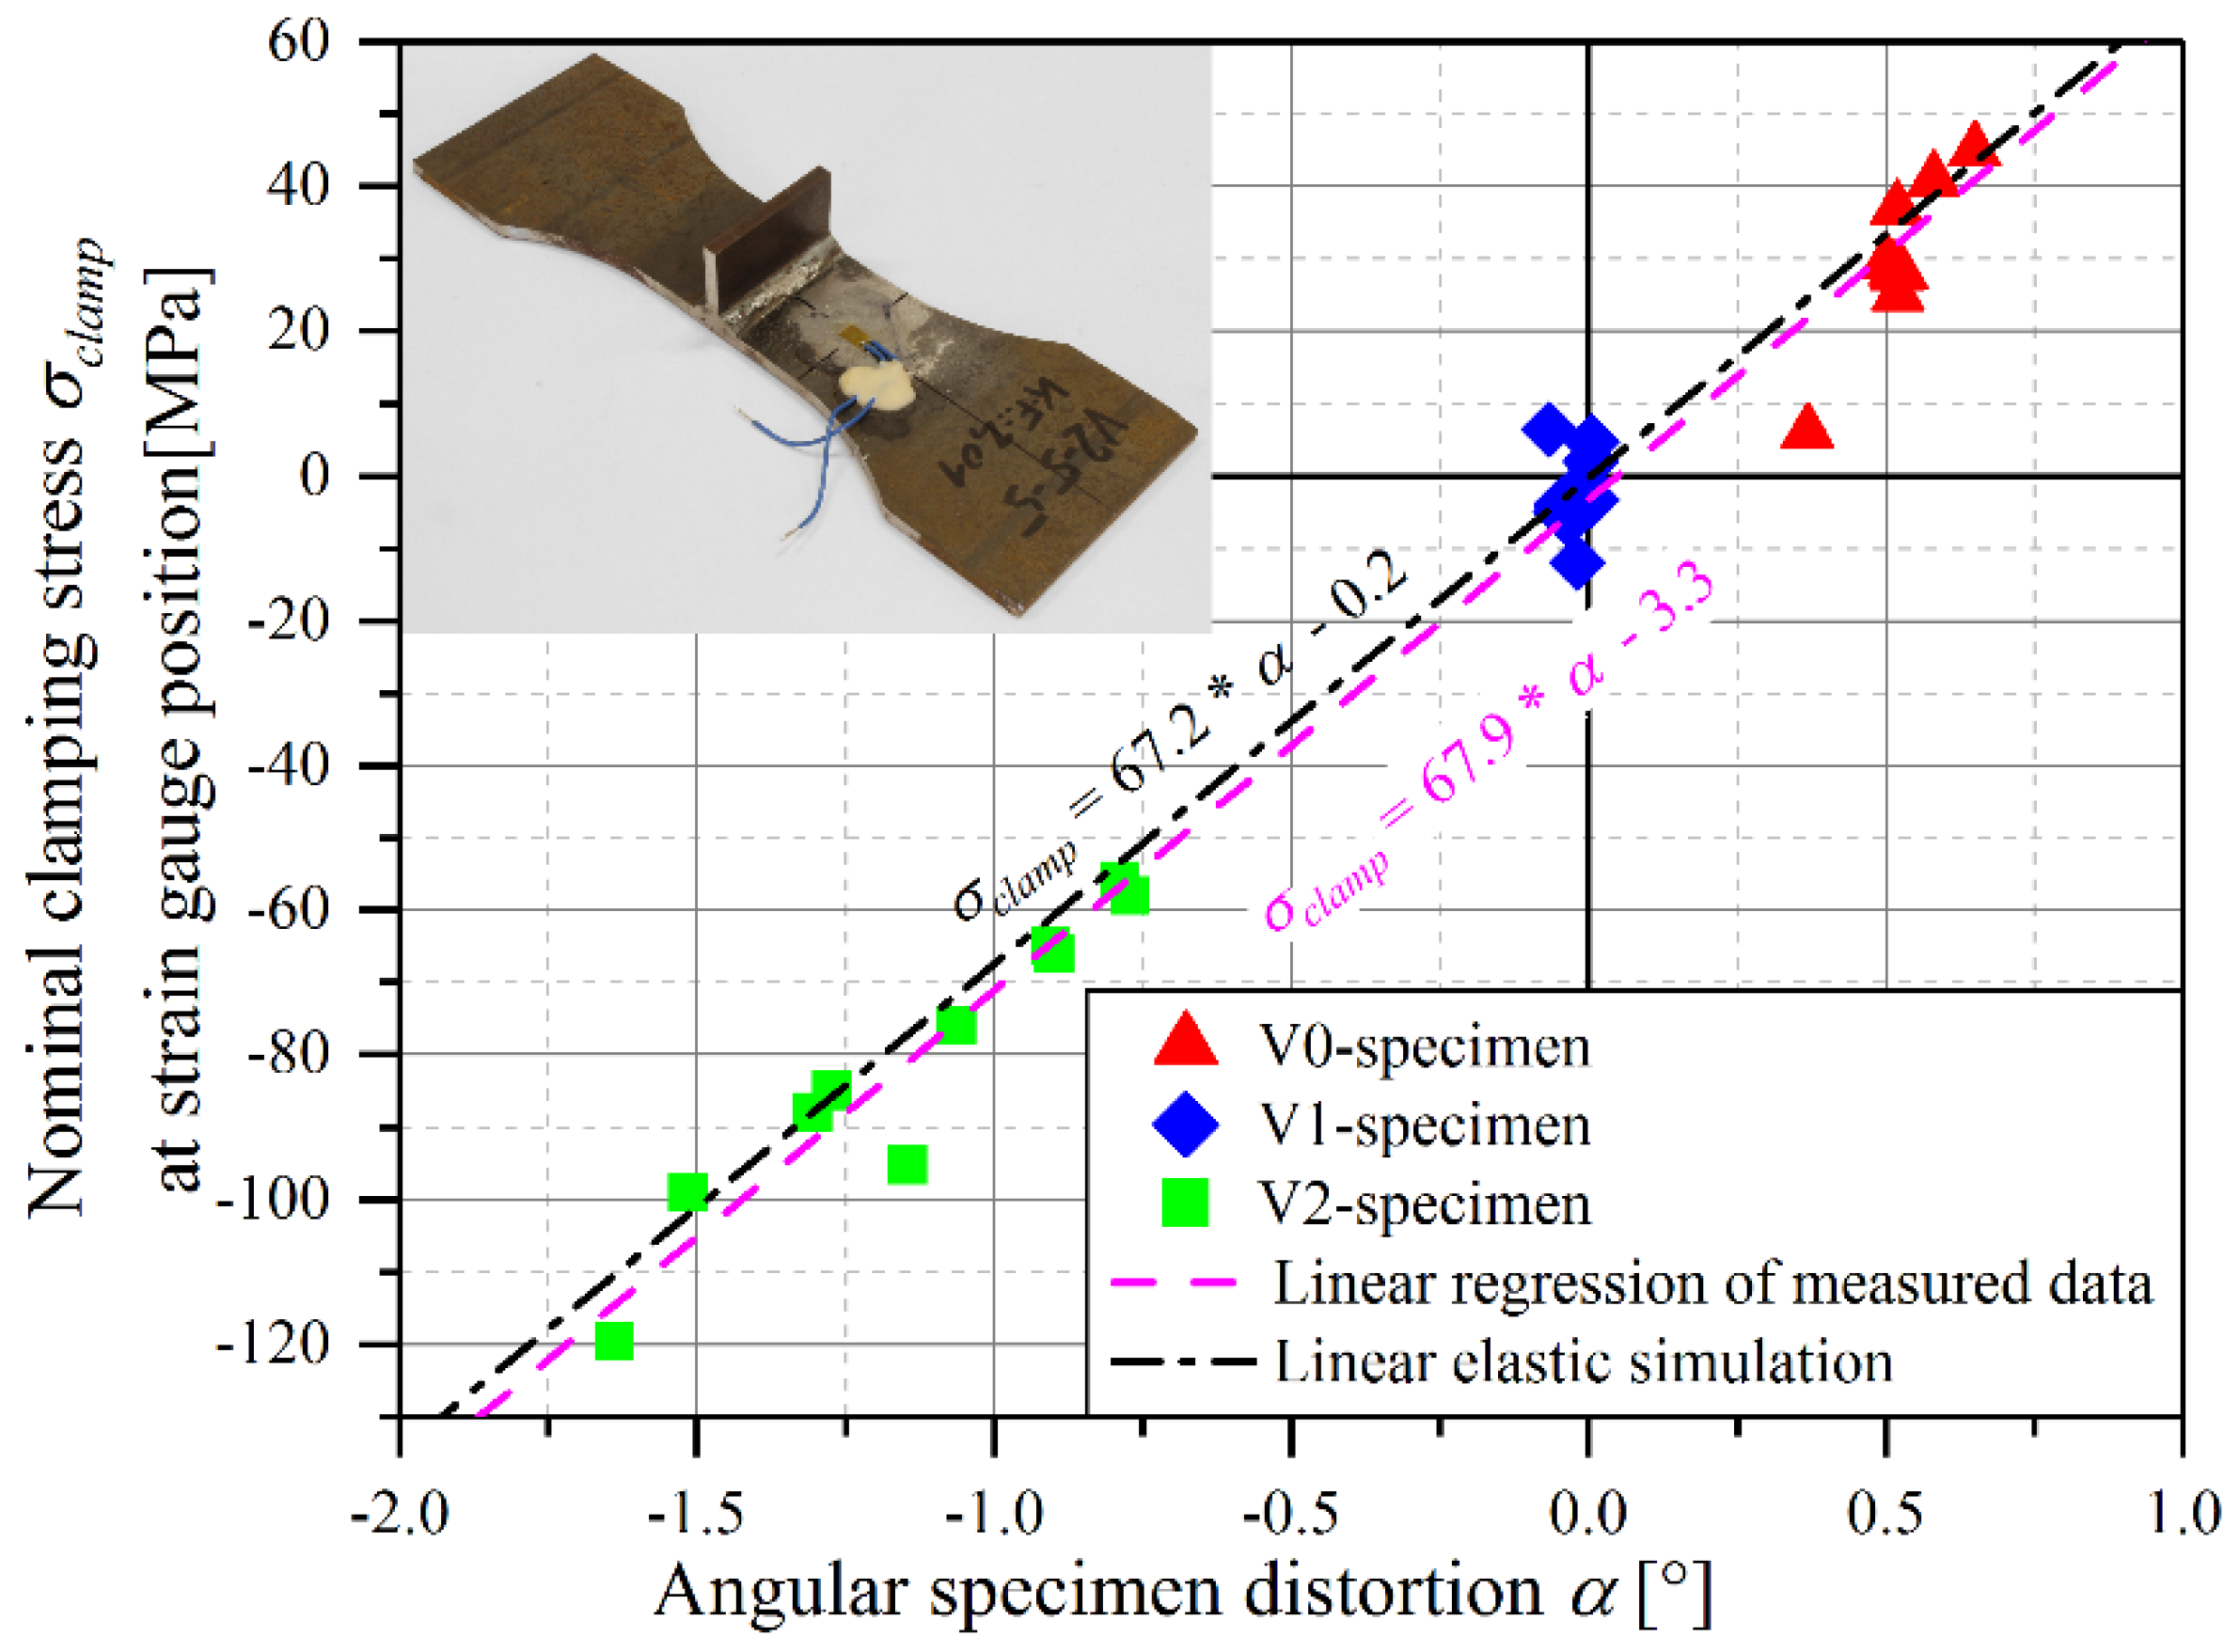
σmem. The clamping stress itself is independent of the load level and only a function of the respective specimen distortion angle. Table 5 lists the structural and effective notch stresses for six different angular distortion states for one and 1000 MPa nominal load with the respective actual stress magnification factors. For the first case, a comparably huge deviation between these values is be observed depending on the initial distortion. This fact can be traced back to a further external load driven straightening of the specimen introducing an additional bending moment. For positive angular distortion values, this moment exhibits tension at the weld toe leading to an increased actual stress concentration factor and vice versa. A nominal load of 1000 MPa results in a more pronounced straightening reducing the effect of secondary bending. Therefore, the deviation between the stress concentration of negative and positive angular distortion abates. However, another bending effect occurs due to the single sided transversal attachment and the deviation of its centre-of-mass to the clamping plane. Its effect becomes visible in case of the non-distorted model, where the stress concentration increases from one and 1000 MPa nominal load.
Figure 14 provides a graphical representation of the course of the actual stress concentration factor for the effective notch stress with increasing nominal load and angular distortion. Here, the already described additional bending in case of the non-distorted specimen is clearly visible. In case of the model exhibiting one degree of angular distortion, the two mentioned effects apparently counteract each other leading to a curve almost independent of the nominal stress. A similar tendency is observed in Figure 15, where the corresponding vertical displacement of the specimen centre yv during clamping and loading is plotted. The straightening of the specimen with increasing load leads to a movement towards the centreline. However, the fictive final level of saturation for very high loads seems to be somewhat below the level of the clamping jaws.
Further investigations require a functional relationship of the actual stress concentrations with respect to nominal σN or membrane stress σmem and angular distortion α. For this, an approach based on the recommendations of the IIW to cover angular misalignments is applied at first. The original formula in Equation (1) uses a tanh(√x)/√x-function and a set of parameters describing the geometry of the weld detail. This notation does not fully cover the values for Κact received by numerical analysis. Therefore, the parameters of the function are generalized and summarized in order to use it for a parameter fitting procedure. Additionally, a further parameter subtracted from α is introduced, see Equation (7):
K a c t ( α , σ N ) =   A 1 + A 2 · ( α A 3 ) · tanh ( A 4 · σ N ) σ N .
Parameter A1 specifies the base level of the curves, whereas A2 defines the spreading in vertical direction. The novel parameter A3 covers the effect of the single sided stiffener; A4 affects the curvature with increasing nominal load. Table 6 lists the parameter-sets obtained by the fitting procedure. It additionally contains the values of the transferred parameters of Equation (1) showing a rather high deviation. It should be noted, that as this equation is just valid for a linear stress magnification km, the values are only comparable to the structural stress concentration Khs,act. The evaluation of the function is pictured in Figure 16 exhibiting a sound agreement with the simulation results. These two charts show the courses of structural and effective notch stress concentration with respect to the nominal stress. Here, it should be noted, that both evaluated stresses have the same fundamental behaviour. This circumstance is underlined by the similarity of the parameters A3 and A4.
Figure 17 sketches the development of the actual stress concentration factor Kact with respect to the nominal stress for a welding distortion of α > 1° in red and α < 0° in blue dye. Furthermore, the lower and upper stresses of a tumescent tensile stress range ΔσN are displayed, where their intersections with the red and blue line give the associated values for the actual stress concentration factor. In case of negative distortion values, this leads to an increase of Kact with increasing nominal stress. For positive distortion values α > 1°, this connection reverses and an increase of nominal stress causes a decrease of Kact due to secondary bending. Thus, the local stress range is strongly dependent on the initial angular specimen distortion especially in case of high distortion values.
This relationship of the stress concentration at the weld toe with increasing nominal load does not allow a direct application of Equation (7) for stress ranges. Here, the calculation of the respective actual upper and lower stresses σu,act and σl,act based on the nominal upper and lower stresses are necessary to calculate the actual stress range Δσact acting at the weld toe, see Equations (8)–(10):
σ u , a c t ( Δ σ N , R , α ) =   σ u , N · K a c t ( α , σ u , N ) + σ c l a m p ( α ) =   Δ σ N · 1 1 R · K a c t ( α , Δ σ N · 1 1 R ) + σ c l a m p ( α ) ,
σ l , a c t ( Δ σ N , R , α ) =   σ l , N · K a c t ( α , σ l , N ) + σ c l a m p ( α ) =   Δ σ N · R 1 R · K a c t ( α , Δ σ N · R 1 R ) + σ c l a m p ( α ) ,
Δ σ a c t =   σ u , a c t σ l , a c t = Δ σ N · { 1 1 R · K a c t ( α , Δ σ N · 1 1 R ) R 1 R · K a c t ( α , Δ σ N · R 1 R ) } .
Subsequently, the actual concentration factor for the stress range ΔKact is introduced describing the ratio between the actual and the nominal stress range; see Equation (11). This parameter is of special interest as it shows the effect of the weld detail with its angular distortion and the nominal stress ratio on the nominal stress range. In this context, Figure 18a displays the trace of ΔKact for two different tumescent stress ratios, namely R = 0.1 and R = 0.5. For small stress ranges, the values are similar for both nominal stress ratios. With higher nominal stress ranges, the deviation increases significantly. This evaluation confirms the IIW-recommended procedure to test fatigue specimens at high mean stress levels to obtain fatigue strengths that are quite independent of the initial specimen distortion, thus enabling specimen fatigue results to components. However, the introduced equations support a more thorough evaluation of these effects.
The described change in stress concentration with respect to nominal loading and angular welding distortion goes along with a shift in the actual stress ratio Ract at the weld toe; see Equation (12) and Figure 18b. The initial clamping stress due to angular distortion has a very large impact, as it changes the mean stress directly. For example, this means a specimen with an angular distortion of α = 4° tested at ΔσN =200 MPa and R = 0.1 has a local actual stress ratio of about Ract = 0.5. Even specimens with absolute distortion values of around |α| = 1° show a rather high deviation from the nominal stress ratio. In general, the difference to the nominal stress ratio decreases with increasing nominal stress range and increasing mean stress. Therefore again, testing at high tumescent tensile stress ratios should be favoured in order to minimize influence of specimen distortion as recommended in the IIW-guideline [23]. At this point should be noted, that Figure 18b does not show the actual stress ratios of low nominal stress ranges for negative distortion values. This would result in Ract-values below the singularity at σu = 0 MPa having a rather distracting effect on the illustration.
Δ K a c t = Δ σ a c t Δ σ N ,
R a c t = σ l , a c t σ u , a c t .

5. Effect of Angular Specimen Distortion on the Fatigue Performance

The numerical investigations reveal a significant influence of the global distortion state and the type of weld detail on the local stress distribution during the fatigue tests. This has a substantial effect on the actual local stress range acting on the fillet weld. In combination with clamping and residual stresses at the weld toe a change in the local effective stress ratio is observed affecting the fatigue performance of the welded joint.

5.1. Actual Stress Range

The global distortion state and the asymmetric weld detail result in a local stress range deviating from the nominal stress range applied by external loading. This shape and load-dependent behaviour is investigated in the previous section and can be approximated by a tanh(√x)/√x-approach in Equation (7). The resulting function for the local actual stress range Δσact with respect to the angular distortion of the specimen α, the nominal stress range ΔσN and the nominal load stress ratio R is shown in Equation (10). This enables the direct calculation of the actual stress range for each specimen for both, structural and effective notch stresses.
The corresponding results for the present fatigue test data set of as-welded joints is displayed in Figure 19. Both evaluated local stresses show a significant reduction of the scatter band to the level of a single distortion state in the finite life domain. At the run-out level, a less pronounced decrease in scattering is visible. Overall, the consideration of the actual stress range leads to sound results and can be further on used for the fatigue assessment of samples with angular distortion.

5.2. Effective Stress Ratio

The use of the actual stress range for the fatigue assessment of angular distorted specimens produces reasonably results. However, it does not include residual and clamping stresses, which may lead to a significant shift in the local stress ratio. In literature, this consequential stress ratio is often referred to as effective stress ratio Reff [23], see Equation (13):
R eff = ( σ r e s + σ m e a n + σ c l a m p ) Δ σ 2 ( σ r e s + σ m e a n + σ c l a m p ) + Δ σ 2 .
As it includes local values, it must be treated as local parameter evaluated at the highly-stressed points in a welded structure. For a consideration of the impact of the effective stress ratio on fatigue strength a modification factor f(Reff) is suggested in [23]. It introduces a linear relationship between the fatigue factor and the effective stress ratio. Its magnitude is also dependent on the complexity and constraint of the welded structure. Equation (14) shows the definition applicable for ‘small-scale thin-walled simple structural elements’ which is used for the further investigations in this work:
f ( R eff ) = 1.3 for R eff <   1 f ( R eff ) = 0.4   R eff + 0.9 for 1 R eff   0.25 . f ( R eff ) = 1 for R eff >   0.25
The fatigue factor serves as multiplier for the fatigue strength of the respective evaluated weld detail. The equations derived in Section 4.2 enable the calculation of the upper and lower stresses instead of a mean stress and an amplitude value. Furthermore, the definition according to Equation (6) already includes the clamping stresses in these parameters. Therefore, Equation (15) shows the transformed equation for the effective stress ratio with the use of the actual upper and lower stresses:
R eff = σ r e s + σ l , a c t σ r e s + σ u , a c t .
In this context, Figure 20 depicts an overview on the actual and effective stress course with the mean stresses changing residual and clamping stresses. By applying Equations (8) and (9), it is possible to provide an analytical expression of the effective stress ratio for the present specimen type with respect to the distortion angle and the nominal stress range as well as load stress ratio. Equation (16) shows the expression for hot-spot stresses, where the corresponding clamping stress is already defined in Equation (4). It should be noted that for structural stress analysis, the effect of residual stresses could not be taken into account. Equation (17) describes the local effective stress ratio for effective notch stresses additionally including residual stresses at this point. The values are taken from the measurements in Table 2, whereby the highest value of each distortion state is selected as a conservative approach. The clamping stresses were calculated by Equation (5):
R eff , h s ( α , Δ σ N , R ) = σ h s , c l a m p ( α ) + Δ σ N · R 1 R · K h s , a c t ( α , Δ σ N · R 1 R ) σ h s , c l a m p ( α ) + Δ σ N · 1 1 R · K h s , a c t ( α , Δ σ N · 1 1 R ) ,
R eff , n o t c h ( α , Δ σ N , R ) = σ r e s + σ n o t c h , c l a m p ( α ) + Δ σ N · R 1 R · K t , a c t ( α , Δ σ N · R 1 R ) σ r e s + σ n o t c h , c l a m p ( α ) + Δ σ N · 1 1 R · K t , a c t ( α , Δ σ N · 1 1 R ) .
Subsequently, the effective stress ratio correction is performed for each specimen separately based on the actual stress range and the effective stress range for both, structural and effective notch stresses. Figure 21 illustrates the results as S/N-curves. In case of structural stress analysis, the correction does not affect finite life domain. In the high-cycle fatigue region, a slight increase is observed. The evaluation according to effective notch stresses leads to a more distinct change as clamping and residual stresses are considered.

5.3. Discussion

The major impact on the fatigue performance of the distorted specimens is covered by the consideration of the local actual stress range. Thereby, all geometric effects causing a change in local stresses such as specimen straightening and bending due to the single sided stiffener are considered. This leads to coinciding fatigue test results for both, structural and effective notch stress evaluation for all three investigated distortion states. The combined statistical evaluation shows a reduced scatter which is well comparable to a single distortion state.
An additional consideration of the actual local stress ratio based on the IIW-recommendations mainly affects specimens tested at load levels near the run-out level and for high negative distortion angle values. However, for structural stress evaluation the further consideration of the stress ratio does only have limited effects. In addition, residual stresses calculated or measured at the weld toe cannot be properly applied for this evaluation method. But for the effective notch stress approach, local residual stresses measured at the weld toe are included and lead to a further reduction of the evaluated scatter index.

6. Summary and Conclusions

For the investigation of the effect of angular specimen distortion on fatigue strength, three test series of T-joint specimens exhibiting different angular distortions covering are manufactured. The distorted structure covers both positive and negative angles, implying tensile and compressive stresses at the weld toe in case of sample straightening.
Tumescent tensile fatigue tests of the three characteristic distortion conditions show a significant difference in nominal fatigue strength in the finite life domain as well for the high-cycle fatigue region. HFMI-treatment of the weld toe leads to a noticeable increase of the fatigue strength up to base material fatigue strength. At the same time, there is no observable influence of angular specimen distortion for such post-treated samples.
Numerical investigations of the clamping procedure show a linear correlation of the clamping stress with the initial angular specimen distortion for nominal, structural and effective notch stress evaluation. A comparison with strain gauge measurements during specimen clamping supports these simulated results for the investigated range of distortion angles. A more detailed numerical analysis of the specimen loading under consideration of nonlinear geometric effects reveals a quite complex connection between the applied nominal load, initial specimen distortion and the local stress distribution. These actual stress magnification factors, evaluated in terms of structural and effective notch stresses, show in most cases a significant deviation from stress magnification factors obtained by linear simulations on undeformed models. Therefore, an updated equation is presented that enables a thorough estimation of the local actual stress condition for each specimen series.
The application of the developed formula reveals a significant change of the actual local stress range compared to the nominally applied load, taking both the load level and the specimens’ individual distortion state into account. For the verification of this angular distortion based correction factor method, the stress range is re-calculated for each specimen series separately. This leads to almost coinciding fatigue tests results for all three investigated distortion states with a comparably low scatter index for both structural and effective notch stress evaluation. This is interesting as mean stress changing effects such as clamping or residual stresses were not yet included in the procedure. A further consideration of the effective stress ratio according to IIW-recommendations for structural stress evaluation does not improve the results noticeably. On the contrary, in case of effective notch stress evaluation, a further reduction of the scatter index of the S/N-curve is observed taking both distortion based effects and changes in effective stress into account.
Summing up, the present methodology featuring the change in local acting stress range by specimen distortion and effective notch stresses leads to a continued noticeable improvement in small-scale sample based fatigue assessment and enhances transferability of specimen results to components.
In general, testing at high tumescent tensile stress ratios should be favored in order to minimize influence of specimen distortion as recommended in the IIW-guideline [23]. However, especially for comparison of fatigue test results, the knowledge and consideration of angular specimen distortion is very important. This is of particular significance for fatigue tests at low load levels in the high-cycle fatigue domain, where the mean stress changing clamping stresses and the effect of secondary bending have the largest impact.

Author Contributions

Markus Ottersböck conducted the experimental tests including specimen manufacturing and fracture surface analysis, performed the numerical investigations and fatigue data evaluation, and wrote the manuscript. Martin Leitner contributed to the literature review, guided the experimental test strategy and fatigue strength assessment, and supported the scientific discussion. Michael Stoschka supported the analytical and numerical model development and performed a critical revision on the article.

Acknowledgments

Special thanks are given to the Austrian Research Promotion Agency (FFG), who founded the research project by funds of the Austrian Ministry for Transport, Innovation and Technology (bmvit) and the Federal Ministry of Science, Research and Economy (bmwfw). Scientific support was given within the “Christian Doppler Laboratory for Manufacturing Process based Component Design” scope for research. The financial support by the Austrian Federal Ministry for Digital and Economic Affairs and the National Foundation for Research, Technology and Development is gratefully acknowledged.

Conflicts of Interest

The authors declare no conflict of interest.

Nomenclature

A 1 A 4 Set of parameters for Equation (7) [-, MPa0.5·rad−1, rad, MPa−0.5]
E Young’s modulus [MPa]
F A T Stress range at 2 × 10⁶ load cycles at PS = 97.7% [MPa]
K t Stress concentration factor [-]
k Inverse slope of S/N-curve [-]
k m Stress magnification factor [-]
l c Free length between the clamps [mm]
N k Transition knee point of S/N-curve [-]
P S Probability of survival [-]
R Load stress ratio [-]
t Sheet thickness [mm]
1 : T σ Scatter index of S/N-curve [-]
y v Vertical position of specimen centre [mm]
α Angular welding distortion [°]
Δ σ Stress range [MPa]
σ Stress [MPa]
σ c l a m p Stress due to clamping of the specimen [MPa]
σ m e m Membrane stress [MPa]
σ r e s Residual stress [MPa]
σ S G Stress measured at a strain gauge [MPa]
Recurring subscripts
act Actual value
eff Effective value
hs Structural hot spot stress value
l Lower value
N Nominal value
notch Effective notch stress value
u Upper value

Appendix A

Table A1. Fatigue test and evaluation data of as-welded specimens.
Testα [°]N [-]ΔσN [MPa]Structural Stress ApproachEffective Notch Stress Approach
Δσhs,actReff,hsf(Reff)Δσhs,act,RΔσnotch,actReff,notchf(Reff)ΔσNotch,act,R
V0-10.52247,930300353.00.181.00353.0573.00.141.00573.0
V0-20.5810,000,000200236.70.231.00236.7384.30.181.00384.3
V0-30.5829,639500597.00.161.00597.0970.20.131.00970.2
V0-40.393,753,730250288.10.171.00288.1466.60.121.00466.6
V0-50.5210,000,000200234.50.221.00234.5380.40.161.00380.4
V0-60.52254,183300353.20.181.00353.2573.20.141.00573.2
V0-70.5370,625400473.10.161.00473.1768.20.131.00768.2
V0-80.37103,163400463.50.141.00463.5750.90.111.00750.9
V0-90.5029,676500591.40.151.00591.4960.10.121.00960.1
V0-100.6510,000,000250299.30.221.00299.3486.70.181.00486.7
V0-110.5286,119400472.70.161.00472.7767.50.131.00767.5
V0-120.5928,103500597.40.161.00597.4970.90.131.00970.9
V1-10.00482,299300328.10.101.00328.1528.20.111.00528.2
V1-20.0110,000,000200216.50.101.00216.5348.20.111.00348.2
V1-30.0149,513500555.90.101.00555.9896.50.101.00896.5
V1-40.002,865,847250271.70.091.00271.7437.10.111.00437.1
V1-5−0.07124,270400437.10.091.00437.1703.50.091.00703.5
V1-6−0.03319,375300326.20.091.00326.2524.80.101.00524.8
V1-7−0.0235,196500554.30.091.00554.3893.50.101.00893.5
V1-8−0.0510,000,000250269.90.081.00269.9433.90.101.00433.9
V1-9−0.05123,710400438.20.091.00438.2705.60.101.00705.6
V1-10−0.04514,187300325.70.091.00325.7523.90.101.00523.9
V1-110.06523,098300330.60.111.00330.6532.70.121.00532.7
V1-120.0261,503500557.10.101.00557.1898.60.101.00898.6
V2-1−1.52Fracture in BM300254.1−0.581.13287.7395.2−1.331.30513.8
V2-2−1.6410,000,000300248.1−0.721.19294.6384.5−1.741.30499.8
V2-3−1.15560,492300272.1−0.301.02277.1427.6−0.661.16497.4
V2-4−0.77199,715400394.3−0.051.00394.3626.7−0.181.00626.7
V2-5−1.2768,931500464.6−0.131.00464.6732.6−0.281.01741.9
V2-6−1.3170,962500462.3−0.141.00462.3728.5−0.301.02741.7
V2-7−0.79335,610350341.1−0.091.00341.1541.3−0.251.00541.3
V2-8−0.90220,275400386.1−0.091.00386.1612.0−0.241.00612.0
V2-9−0.901,493,630300284.1−0.171.00284.1449.2−0.421.07479.4
V2-10−1.0610,000,000250227.2−0.361.04236.9357.1−0.851.24443.5
V2-11−1.0693,505500479.7−0.081.00479.7759.7−0.201.00759.7
V2-12−1.06275,958350326.0−0.181.00326.0514.2−0.411.06547.3
V2-13−1.5138,765600548.6−0.141.00548.6863.1−0.271.01871.5
Table A2. Fatigue test data of HFMI-treated specimens.
Testα [°]N [-]ΔσN [MPa]Comment
as-WeldedHFMI-Treated
V0-HFMI-1−0.270.30660,583300Fracture in base material
V0-HFMI-2−0.55−0.0710,000,000300Run-out
V0-HFMI-3−0.55−0.07100,801500Fracture in base material
V0-HFMI-4−0.58−0.18667,118350Fracture in base material
V0-HFMI-5−0.260.3010,000,000400Run-out
V1-HFMI-10.140.7610,000,000300Run-out
V1-HFMI-20.981.27261,103350Fracture in base material
V1-HFMI-3−0.040.2910,000,000350Run-out
V1-HFMI-40.180.97557,511350Fracture in base material
V1-HFMI-50.190.77271,996450Fracture in base material
V1-HFMI-60.381.07179,120500Fracture in base material
V2-HFMI-11.472.4210,000,000350Run-out
V2-HFMI-21.472.4293,016500Fracture in base material
V2-HFMI-30.701.5010,000,000350Run-out
V2-HFMI-40.701.5080,125500Fracture in base material
V2-HFMI-50.901.6144,751600
V2-HFMI-61.081.70189,567400Fracture in base material
V2-HFMI-70.901.5444,582600Fracture in base material
V2-HFMI-80.741.49192,000500Fracture in base material

References

  1. Okano, S.; Tsuji, H.; Mochizuki, M. Temperature distribution effect on relation between welding heat input and angular distortion. Sci. Technol. Weld. Join. 2016, 22, 59–65. [Google Scholar] [CrossRef]
  2. Okano, S.; Matsushita, K.; Mochizuki, M.; Toyoda, M.; Ueyama, T. Experimental study on relationship between heat parameter and angular distortion. Weld. Int. 2012, 28, 289–300. [Google Scholar] [CrossRef]
  3. Schenk, T.; Doig, M.; Esser, G.; Richardson, I.M. Influence of clamping support distance on distortion of welded T joints. Sci. Technol. Weld. Join. 2013, 15, 575–582. [Google Scholar] [CrossRef]
  4. Park, J.-U.; Lee, H.-W.; Bang, H.-S. Effects of mechanical constraints on angular distortion of welding joints. Sci. Technol. Weld. Join. 2013, 7, 232–239. [Google Scholar] [CrossRef]
  5. Luo, Y.; Deng, D.; Xie, L.; Murakawa, H. Prediction of deformation for large welded structures based on inherent strain. Trans. JWRI 2004, 33, 65–70. [Google Scholar]
  6. Aygül, M.; Al-Emrani, M.; Barsoum, Z.; Leander, J. Investigation of distortion-induced fatigue cracked welded details using 3D crack propagation analysis. Int. J. Fatigue 2014, 64, 54–66. [Google Scholar] [CrossRef]
  7. Gannon, L.; Liu, Y.; Pegg, N.; Smith, M.J. Effect of welding-induced residual stress and distortion on ship hull girder ultimate strength. Mar. Struct. 2012, 28, 25–49. [Google Scholar] [CrossRef]
  8. Deng, D.; Murakawa, H. FEM prediction of buckling distortion induced by welding in thin plate panel structures. Comput. Mater. Sci. 2008, 43, 591–607. [Google Scholar] [CrossRef]
  9. Deng, D.; Murakawa, H. Prediction of welding distortion and residual stress in a thin plate butt-welded joint. Comput. Mater. Sci. 2008, 43, 353–365. [Google Scholar] [CrossRef]
  10. Long, H.; Gery, D.; Carlier, A.; Maropoulos, P.G. Prediction of welding distortion in butt joint of thin plates. Mater. Des. 2009, 30, 4126–4135. [Google Scholar] [CrossRef]
  11. Barsoum, Z.; Ghanadi, M.; Balawi, S. Managing welding induced distortion—Comparison of different computational approaches. Procedia Eng. 2015, 114, 70–77. [Google Scholar] [CrossRef]
  12. Mikami, Y.; Mochizuki, M.; Toyoda, M.; Morikage, Y. Measurement and numerical simulation of angular distortion of fillet welded T-joints—Welding angular distortion control by transformation expansion of weld metals (Report 1). Weld. Int. 2007, 21, 547–560. [Google Scholar] [CrossRef]
  13. Gu, Y.; Li, Y.D.; Qiang, B.; Boko-haya, D.D. Welding distortion prediction based on local displacement in the weld plastic zone. Weld. World 2017, 61, 333–340. [Google Scholar] [CrossRef]
  14. Okano, S.; Mochizuki, M.; Yamamoto, K.; Tanaka, M. An attempt to enhance numerical models of angular distortion by considering the physics of the welding arc. Weld. World 2011, 55, 93–100. [Google Scholar] [CrossRef]
  15. Farkas, J.; Jármai, K. Special cases of the calculation of residual welding distortions. Weld. World 2007, 51, 69–73. [Google Scholar] [CrossRef]
  16. Teng, T.-L.; Fung, C.-P.; Chang, P.-H.; Yang, W.-C. Analysis of residual stresses and distortions in T-joint fillet welds. Inter. J. Press. Vessel. Pip. 2001, 78, 523–538. [Google Scholar] [CrossRef]
  17. Vasantharaja, P.; Maduarimuthu, V.; Vasudevan, M.; Palanichamy, P. Assessment of residual stresses and distortion in stainless steel weld joints. Mater. Manuf. Process. 2012, 27, 1376–1381. [Google Scholar] [CrossRef]
  18. Iida, K.; Iino, N. Effect of angular distortion on fatigue strength of transverse butt-welds in high strength steels. Trans. Jpn. Weld. Soc. 1977, 8, 3–10. [Google Scholar]
  19. Narang, H.K.; Mahapatra, M.M.; Jha, P.K.; Biswas, P. Optimization and prediction of angular distortion and weldment characteristics of tig square butt joints. J. Mater. Eng. Perform. 2014, 23, 1750–1758. [Google Scholar] [CrossRef]
  20. Leitner, M. Influence of effective stress ratio on the fatigue strength of welded and HFMI-treated high-strength steel joints. Int. J. Fatigue 2017, 102, 158–170. [Google Scholar] [CrossRef]
  21. Park, J.-U.; An, G.; Lee, H.-W. Effect of external load on angular distortion in fillet welding. Mater. Des. 2012, 42, 403–410. [Google Scholar] [CrossRef]
  22. Ottersböck, M.J.; Leitner, M.; Stoschka, M. Effect of local stress state on fatigue strength of welded T-joints. In Mathematical Modelling of Weld Phenomena 11; Sommitsch, C., Enzinger, N., Mayr, P., Eds.; Verlag der Technischen Universität Graz: Graz, Austria, 2016; pp. 241–258. [Google Scholar]
  23. Hobbacher, A. The new IIW recommendations for fatigue assessment of welded joints and components—A comprehensive code recently updated. Int. J. Fatigue 2009, 31, 50–58. [Google Scholar] [CrossRef]
  24. Stoschka, M.; Leitner, M.; Fössl, T.; Leitner, H.; Eichlseder, W. Application of fatigue approaches on fillet welds of high strength steel: Ermüdungsversuche an Kehlnähten bei hochfesten Stählen. Mater. Werkst. 2010, 41, 961–971. [Google Scholar] [CrossRef]
  25. Leitner, M.; Mössler, W.; Putz, A.; Stoschka, M. Effect of post-weld heat treatment on the fatigue strength of HFMI-treated mild steel joints. Weld. World 2015, 59, 861–873. [Google Scholar] [CrossRef]
  26. Stoschka, M.; Leitner, M.; Fössl, T.; Posch, G. Effect of high-strength filler metals on fatigue. Weld. World 2012, 56, 20–29. [Google Scholar] [CrossRef]
  27. Marquis, G.; Barsoum, Z. Fatigue strength improvement of steel structures by high-frequency mechanical impact: Proposed procedures and quality assurance guidelines. Weld. World 2014, 58, 19–28. [Google Scholar] [CrossRef]
  28. ASTM International (ASTM). Practice for Statistical Analysis of Linear or Linearized Stress-Life (S-N) and Strain-Life (e-N) Fatigue Data, E739; ASTM International: West Conshohocken, PA, USA, 2010. [Google Scholar]
  29. Dengel, D.; Harig, H. Estimation of the fatigue limit by progressively-increasing load tests. Fatigue Fract. Eng. Mater. Struct. 1980, 3, 113–128. [Google Scholar] [CrossRef]
  30. Sonsino, C.M. Course of SN-curves especially in the high-cycle fatigue regime with regard to component design and safety. Int. J. Fatigue 2007, 29, 2246–2258. [Google Scholar] [CrossRef]
  31. Ottersböck, M.J.; Leitner, M.; Stoschka, M. Effect of Loading Type on Welded and HFMI-Treated T-Joints; IIW-Doc. XIII-2584-15; International Institute of Welding: Paris, France, 2015. [Google Scholar]
  32. Leitner, M.; Stoschka, M.; Eichlseder, W. Fatigue enhancement of thin-walled, high-strength steel joints by high-frequency mechanical impact treatment. Weld. World 2014, 58, 29–39. [Google Scholar] [CrossRef]
  33. Leitner, M.; Stoschka, M.; Schanner, R.; Eichlseder, W. Influence of high frequency peening on fatigue of high-strength steels. FME Trans. 2012, 40, 99–104. [Google Scholar]
  34. Leitner, M.; Gerstbrein, S.; Ottersböck, M.J.; Stoschka, M. Fatigue strength of HFMI-treated high-strength steel joints under constant and variable amplitude block loading. Procedia Eng. 2015, 101, 251–258. [Google Scholar] [CrossRef]
  35. Fricke, W. Guideline for the Fatigue Assessment by Notch Stress Analysis for Welded Structures; IIW-Doc. XIII-2240r1-08/XV-1289r1-08; International Institute of Welding: Paris, France, 2009. [Google Scholar]
  36. Sonsino, C.M.; Fricke, W.; de Bruyne, F.; Hoppe, A.; Ahmadi, A.; Zhang, G. Notch stress concepts for the fatigue assessment of welded joints—Background and applications. Int. J. Fatigue 2012, 34, 2–16. [Google Scholar] [CrossRef]
  37. Morgenstern, C.; Sonsino, C.M.; Hobbacher, A.; Sorbo, F. Fatigue design of aluminium welded joints by the local stress concept with the fictitious notch radius of rf = 1 mm. Int. J. Fatigue 2006, 28, 881–890. [Google Scholar] [CrossRef]
  38. Huther, M.; Henry, J.; Parmentier, G. Hot Spot Stress in Cyclic Fatigue for Linear Welded Joints; International Institute of Welding: Paris, France, 1992. [Google Scholar]
  39. Niemi, E.; Fricke, W.; Maddox, S.J. Fatigue Analysis of Welded Components—Designer’s Guide to the Structural Hot-Spot Stress Approach; Woodhead Publishing Ltd.: Cambridge, UK, 2006. [Google Scholar]
  40. Baumgartner, J.; Bruder, T. An efficient meshing approach for the calculation of notch stresses. Weld. World 2013, 57, 137–145. [Google Scholar] [CrossRef]
Figure 1. Overview of weld setup including t8/5-measurement.
Metals 08 00302 g001
Figure 2. Procedure of distortion measurements.
Metals 08 00302 g002
Figure 3. Distortion measurements over specimen position in array during welding.
Metals 08 00302 g003
Figure 4. Clamping condition for HFMI-treatment.
Metals 08 00302 g004
Figure 5. Effect of HFMI-treatment on angular distortion.
Metals 08 00302 g005
Figure 6. Correlation of clamping stress and angular specimen distortion.
Metals 08 00302 g006
Figure 7. Nominal fatigue test results for as-welded condition.
Metals 08 00302 g007
Figure 8. Nominal fatigue test results for HFMI-treated condition.
Metals 08 00302 g008
Figure 9. Fracture surface examples. (a) Crack initiation at weld toe in as-welded condition, (ΔσN = 600 MPa, N = 38.765); (b) Crack initiation at weld toe in HMFI-treated condition, (ΔσN = 400 MPa, N = 826,530); (c) Crack initiation at base material just below the weld in HMFI-treated condition, (ΔσN = 600 MPa, N = 44,582).
Metals 08 00302 g009
Figure 10. Numerical model with effective area of the clamping jaws.
Metals 08 00302 g010
Figure 11. Definition of stresses and stress concentration factors.
Metals 08 00302 g011
Figure 12. Simulation flow: straightening of the specimen due to clamping process and subsequent loading.
Metals 08 00302 g012
Figure 13. Clamping stress in dependence of angular specimen distortion.
Metals 08 00302 g013
Figure 14. Actual notch stress concentration Kt,act with respect to nominal stress and angular distortion.
Metals 08 00302 g014
Figure 15. Vertical position of the specimen centre during clamping and loading.
Metals 08 00302 g015
Figure 16. Comparison of simulation results and the function output. (a) Actual structural stress concentration; (b) Actual effective notch stress concentration.
Metals 08 00302 g016
Figure 17. Effect of the actual stress concentration on upper and lower stresses with respect to the nominal stresses.
Metals 08 00302 g017
Figure 18. Course of actual values with nominal stress range. (a) Effective notch stress range; (b) Stress ratio.
Metals 08 00302 g018
Figure 19. Resulting S/N-curves with consideration of specimen distortion. (a) Actual structural stress; (b) Actual notch stress.
Metals 08 00302 g019
Figure 20. Shift of mean stress due to residual and clamping stresses.
Metals 08 00302 g020
Figure 21. Resulting S/N-curves with consideration of specimen distortion. (a) Actual structural stress including consideration of effective stress ratio; (b) Actual notch stress including consideration of effective stress ratio.
Metals 08 00302 g021
Table 1. Summary of angular distortion measurements in degrees.
SpecimensStatistical Key FigureV0V1V2
All specimens in as-welded conditionAverage angular distortion αm0.54−0.06−1.13
Standard deviation0.210.210.29
Specimens in as-welded condition selected for fatigue testing (10 per distortion state)Average angular distortion αm0.54−0.02−1.11
Standard deviation0.070.030.31
Specimens in as-welded condition selected for HFMI-treatment (10 per distortion state)Average angular distortion αm0.53−0.10−1.00
Standard deviation0.190.240.24
Specimens in HFMI-treated condition selected tensile fatigue testing (10 per distortion state)Average angular distortion αm−0.06−0.75−1.72
Standard deviation0.300.290.37
Table 2. Transversal residual stresses measured at the weld toe in MPa.
SpecimensV0V1V2
Path 1Path 2Path 1Path 2Path 1Path 2
Specimen 1−188−70−120−58−101−51
Specimen 2−161−37−908−164−101
Table 3. Summary of fatigue test results.
Weld Toe TreatmentDistortion StateInverse Slope kScatter Index 1:TσTransition Knee Point NkFAT-Value [MPa]ΔσN (N = 107) [MPa]
As-weldedV04.21.091.2 × 106175178
V14.41.131.1 × 106194201
V23.91.090.85 × 106205228
Combined4.01.290.68 × 106166192
HFMICombined4.01.280.26 × 106201285
Combined, including [32]4.41.250.30 × 106213278
Table 4. Numerically computed stresses due to clamping.
Initial Angular Distortion α [°]σSG,clamp [MPa]σhs,clamp [MPa]σnotch,clamp [MPa]
+4267.9310.0553.6
+2134.3155.2276.1
+167.277.7137.9
00.00.00.0
−1−67.0−78.3−141.1
−2−135.1−156.8−282.1
Table 5. Stresses resulting from 1 and 1000 MPa nominal loading stress.
Initial Angular Distortion α [°]σN = 1 MPaσN = 1000 MPa
σhs [MPa]Khs,act [–]σnotch [MPa]Kt,act [–]σhs [MPa]Khs,act [–]σnotch [MPa]Kt,act [–]
+4311.91.881556.73.1741934.51.6243262.02.708
+2156.71.469278.62.4371534.11.3782547.52.271
+179.01.262140.02.0681332.71.2552190.12.052
01.0551.0551.7001.7001130.41.1301832.31.832
−1−77.50.848−139.81.314929.61.0071461.71.602
−2−156.10.637−281.10.937723.80.8801093.11.375
Table 6. Parameter-set for Equation (7) obtained by the least-square fit.
Fitted Parameter A 1   [ ] A 2   [ M P a 0.5 · r a d 1 ] A 3   [ r a d ] A 4   [ M P a 0.5 ]
K h s , a c t 1.2419246.590.01600.0481
K t , a c t 2.0231441.760.01580.0483
Values for Equation (1)1396.86-0.1172

