Article

Softening Characterization of 300M High-Strength Steel during Post-Dynamic Recrystallization

State Key Laboratory of Materials Processing and Die & Mould Technology, School of Materials Science and Engineering, Huazhong University of Science and Technology, Wuhan 430074, China
*
Author to whom correspondence should be addressed.
Metals 2018, 8(5), 340; https://doi.org/10.3390/met8050340
Submission received: 7 April 2018 / Revised: 7 May 2018 / Accepted: 8 May 2018 / Published: 10 May 2018
(This article belongs to the Special Issue Dynamic Recrystallization Behavior of Metallic Materials)

Abstract

:
This paper investigates softening phenomena within the post-dynamic recrystallization (PDRX) process in 300M high-strength steel specimens with different initial dynamically recrystallized volume fractions. Isothermal, interrupted compression experiments were performed on a Gleeble-3500 at a temperature of 1273 K and strain rate of 0.01 s−1. To acquire different initial volume fractions of dynamically recrystallized (DRX) grains, deformation was interrupted at two strain levels and immediately followed by isothermal annealing treatments. The softening behaviors respectively caused by the static recrystallization (SRX) and metadynamic recrystallization (MDRX) were qualitatively characterized by variations in the mechanical properties of the deformed and recrystallized grains. On the basis of the Taylor dislocation model, the evolution of geometric necessary dislocations (GNDs) and statistically stored dislocations (SSDs) densities were also discussed to qualitatively clarify the nature of different softening behaviors. Results indicate that the SRX occurred alone in samples without initial DRX grains, after an incubation time of approximately 50 s, while MDRX initially appeared within 1 s and completed at about 8 s in samples with a high initial volume fraction of DRX grains. The microhardness, indentation hardness, and Young’s modulus in the deformed and recrystallized grains decreased gradually with an increase of MDRX and SRX volume fractions. The sink-in and pile-up phenomena were enhanced by the SRX and MDRX softening processes, respectively. The SSDs density decreased more noticeably during the MDRX process than that during the SRX, which indicates that the MDRX process contributed to a more significant softening effect within the microstructural evolution regimes.

1. Introduction

As a result of its high strength, outstanding fracture toughness, and excellent corrosion resistance properties, 300M steel has drawn extensive attention within the field of aviation as well as the military with regard to the manufacture of landing gear [1,2]. During heavy forgings, control of the microstructure after the complex multi-stage thermoforming is fundamental in the optimization of mechanical properties and material flow. The microstructural evolution caused by dynamic recrystallization (DRX) has been studied by numerous researchers [3,4,5]. In contrast to the DRX regime during thermoforming, the post-dynamic recrystallization (PDRX), encompassing the recrystallization which occurs after the hot deformation is interrupted, has been demonstrated as having a significant influence on the final microstructure [6,7,8,9,10]. The possible recrystallization regimes which occur during post-deformation annealing consist of static recrystallization (SRX) and metadynamic recrystallization (MDRX) [11].
Studies have shown that the softening phenomena during post-deformation annealing can be attributed to the MDRX and SRX process [12,13,14,15,16,17]. Djaic and Jonas [12] first proposed the concepts of SRX and MDRX and designed several double-pass compression experiments to distinguish the softening effects caused by these two varieties of recrystallization regimes. To clarify the recrystallization essence in relationship to the structures within the sub-micrometer and nanometer range, the evolution of sub-grain boundaries and twins during the MDRX softening process was demonstrated by the Electron Backscattered Diffraction (EBSD) technique. Concurrently, the relevant patterns of dislocation annihilation and dislocation climb were characterized using a Transmission Electron Microscope [13]. Huang [14] investigated the softening mechanisms of SRX and MDRX by conducting quasi in situ EBSD observation of heating experiments on 304L steels with different interruption strains. Results indicated that SRX took place through nucleation and grain growth after a relatively long incubation time, while MDRX was activated by consuming the dislocation density stored in severely deformed grains with no or limited incubation time. Zeng et al. [15] conducted an in situ laser confocal observation of heating experiments on 300M samples with different initial DRX volume fractions and analyzed the effects of strain-induced grain boundary migration on the softening effects which resulted from SRX and MDRX. Using the same characterization method as employed by Huang [14], the twin boundary fractions and grain growth of Inconel 718 were observed by Zouari et al. [16] to be strongly dependent on the progress of MDRX and SRX. Huang et al. [17] examined the softening mechanism of 5753 aluminum alloy during post-deformation annealing and developed a kinetic model to describe the softening fractions of MDRX. Previous studies on PDRX have predominantly focused on its softening mechanisms and overall softening effect, which is qualitatively represented by the recrystallized volume fraction. However, there have been few reports about the softening effects of SRX and MDRX regimes on grains and the contributions of deformed grains and recrystallized grains to integral mechanical properties. The softening characterization of MDRX and SRX on mechanical properties of various types of grains is of great significance for the optimization of the integrated performance of large forgings.
Variation of hardness and Young’s modulus have been used to evaluate softening and hardening behaviors, both of which are predominantly attributed to the dislocation proliferation and annihilation at the boundaries of a grain. Ashby [18] classified dislocations into statistically stored dislocation (SSD) and geometrically necessary dislocation (GND). An SSD evolves from random mutual trapping in crystal; its density increases through the proliferation and interaction with resistance to the uniform plastic deformation [19]. GND accumulates by randomly trapping one another for the sake of compatible deformation of various parts of the specimen under a gradient of plastic deformation [18]. Research has demonstrated that the densities of GNDs are directly related to the permanent geometrical change at the surface of a specimen. Accordingly, a nano-indentation test was an economical and reliable characterization method for measuring the mechanical properties and dislocations within the sub-micrometer scale [20,21]. Nix and Gao [22] derived the simplified model between indentation hardness of crystal copper and total density of GNDs and SSDs and developed the phenomenological model of the actual contact area. Oliver and Pharr [23] proposed an improved technique for determining Young’s modulus and contact area, both of which were also important mechanical properties for qualitatively describing the softening behaviors. On the basis of the Taylor dislocation model [24], the hardening and softening behaviors of different torsion deformation regions in the same rod were verified by the variation of the microhardness, indentation hardness, GNDs, and SSDs [19]. Using the similar nano-indentation testing method, Lei et al. [25] characterized the resultant softening effects by qualitatively analyzing the indentation hardness of three constituent phases and microhardness of an integrated trimodal microstructure under complex, hot working conditions. The previously mentioned studies have shown that the integrated softening effects of a material can be qualitatively characterized by the variation of mechanical properties of each component. However, limited research has been conducted on the comprehensive relationships and responses of mechanical properties between the deformed grains and recrystallized grains during PDRX process. To qualitatively describe the softening effects caused by MDRX and SRX, a uniform awareness as to the variation of microhardness, indentation hardness, and modulus in the different types of grains needs to be achieved.
In this work, isothermal, interrupted compression experiments were performed on a Gleeble-3500 at a temperature of 1273 K and strain rate of 0.01 s−1. Deformation was interrupted at interruption strains of 0.151 and 0.511 to acquire different initial volume fractions of dynamically recrystallized grains; this was immediately followed by isothermal annealing treatments, which were held at the same temperature for a range of holding times between 0 s and 600 s. Metallographic preparations were conducted to provide direct observations of the microstructural evolution during SRX and MDRX. The softening behaviors during SRX and MDRX were qualitatively characterized by the variations of mechanical properties including microhardness, indentation hardness, Young’s modulus, and indentation morphology. On the basis of the Taylor dislocation model, the evolution of GNDs and SSDs densities were also discussed to clarify the essence of different softening behaviors.

2. Materials and Methods

2.1. Materials

The hot-forged 300M steel (also known as AISI 4340M) was used as the testing material. It represented heat-treatable, low-alloy, commercial high-strength steel with the austenite morphology above 1144 K [26]. In comparison with AISI 4340 steel, it contains silicon (which increases its stability at elevated temperatures). A vacuum arc re-melting (VAR) technique was used to obtain a preferred ingot structure [27]. The chemical composition of the hot-rolled 300M steel is listed in Table 1.

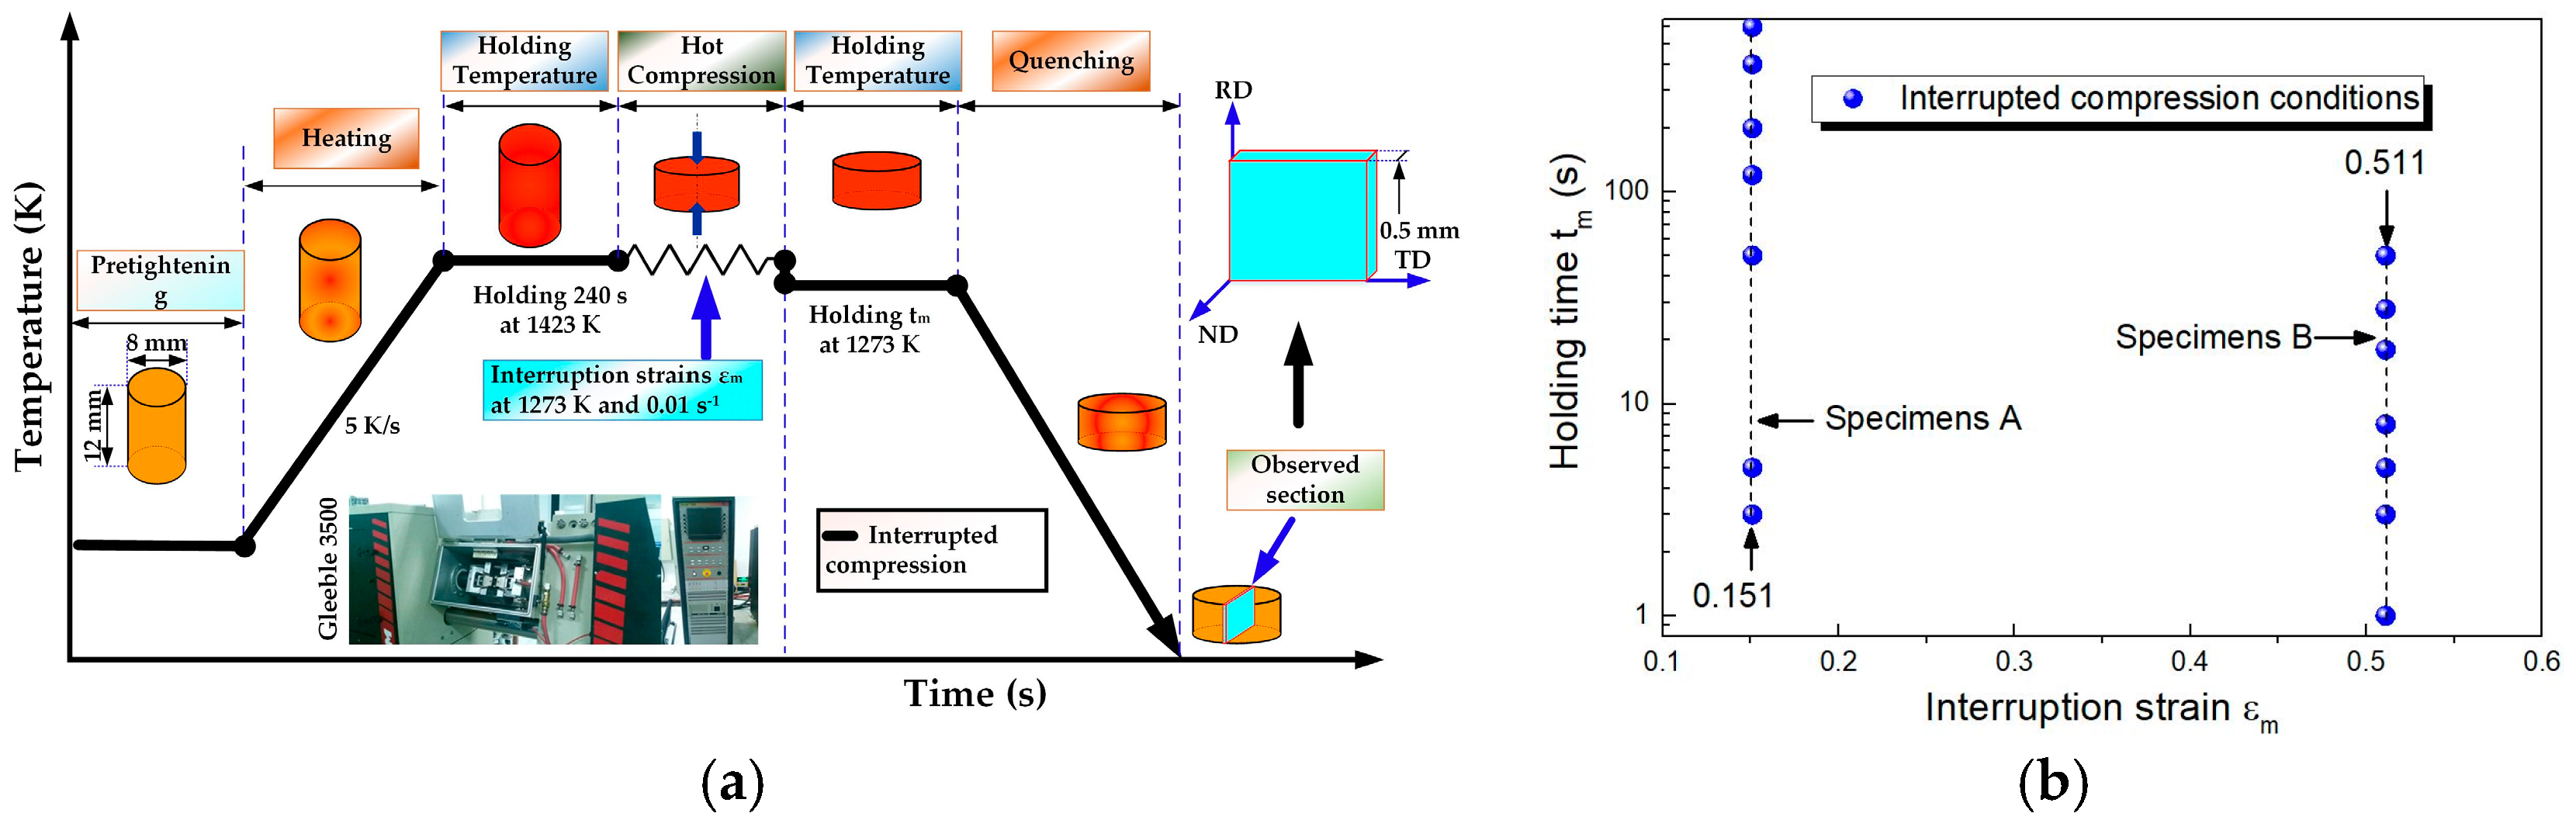
2.2. Isothermal Interrupted Compression

All 300M steel specimens utilized for isothermal interrupted compression testing were thoroughly fabricated by wire-cutting along the diameter direction into cylindrical ingots with diameters of 8 mm and heights of 12 mm. The detailed procedure of compression experiments performed on a Gleeble-3500 (DSI, Austin, TX, USA) thermomechanical simulator is shown in Figure 1. Before compression testing, all 300M steel specimens were clamped at a pretightening force of around 300 N to maintain contact with dies; a lubricant composed of graphite mixed with machine oil was applied to the interfaces. The specimens were heated to 1423 K at a heating rate of 5 K/s, then held for 240 s to eliminate thermal gradients and transform the phase to completely austenitic microstructure. Subsequently, uniaxial compression processes were performed on these specimens at a temperature of 1273 K and strain rate of 0.01 s−1. Deformation was interrupted at two different interruption strains (0.151 and 0.511 for A and B, respectively). The deformed specimens were held for times ranging from 1 s to 600 s (see Figure 1b) at a temperature of 1273 K; water quenching immediately followed to preserve the microstructure of the prior austenite grain. In contrast to the microstructure during post-deformation annealing, the holding time of 0 s (in addition to the above conditions) was also used for specimens A and B to obtain the initial microstructure in the absence of SRX and MDRX processes. In this study, the conditions of holding times refer to the isothermal time after single compression.
Finally, a thin lamella sample was fabricated by wire-cutting along the direction of compression and prepared using the standard metallographic technique (in accordance with Luo et al. [1]). The samples were polished and etched using a chemical solution (which was composed of 30 mL saturated aqueous picric acid solution + 5 mL CCl4 + 5 mL HCl + 15 mL detergent) for 5 min at a temperature of 323 K. In this method, the prior austenite grain boundaries preserved after quenching were etched instead of the martensitic grain boundaries. The microstructure within the prior austenite grain boundaries were composed of martensite and retained austenite grains [28]. Metallographic images of samples A and B were captured on a VHX-1000C (Keyence, Shanghai, China) super-high magnification lens zoom microscopy. In addition, the microstructure parameters were measured using Image-Pro Plus 6.0 (Image Pro International, Miami, FL, USA) analysis software.

2.3. Hardness Tests

Although it was possible to observe the prior austenite grain boundaries using picric etching of the mixed microstructure, the martensite and retained austenite grains were preserved after quenching. To simplify the complex martensitic transformation process, we assumed that the initial occurring martensitic laths contained a constant value of dislocation density and the dislocation densities of martensitic laths varied as a result of the dislocation entanglement. According to the dislocation theory proposed by Levitas [29], the dislocation density in newly formed martensitic laths can be quantified through the use of the inner stress gradient, which can be calculated from the average dislocation density gradient in prior austenitic grains. The widely recognized Kurdjumov-Sachs orientation describes the relationship between the prior austenite and martensite laths [30], implying that the crystal orientations within the newly formed martensite laths are directly related to the distribution of dislocation density in prior austenite grains. Therefore, the GNDs yield the following relationship [31],
ρ G N D = 2 ϑ / u b
where ϑ is mis-orientation angle, u is the unit length, and b is the magnitude of the Burger vector. It can be assumed that the variation of average GNDs densities in the martensitic laths and retained austenite grains can qualitatively represent changes in the GNDs of the prior austenite grains. As the total dislocation density of martensitic laths (total density of GNDs and SSDs) can also be calculated from the prior dislocation density gradient, the variation of SSDs follows a similar pattern to that of the GNDs. The variations of average GND density, SSD density, and average hardness in the mixed microstructure can qualitatively represent changes in the dislocation and hardness of the prior austenite grains [31,32]. Microhardness tests and nano-indentation tests were conducted to investigate the softening phenomena observed during PDRX. The former tests were carried out using a micro Vickers hardness instrument (TMVS-1, Beijing Time Group Inc., Beijing, China). The testing points were chosen to be in the center of samples A and B with a loading force of 9.8 N and a holding time of 20 s. Nano-indentation tests were performed using a nanomechanical test instrument (Hysitron TI 750, Hysitron, Minneapolis, MN, USA) with a plug-in of Scanning Probe Microscopy (SPM), which could accurately locate different recrystallized regions in the etched samples A and B. According to our previous in situ observation experiments [15], a sole SRX process occurred in sample A when the interruption strain was lower than the critical strain [11]; however, only MDRX was observed in sample B because the rapid MDRX quickly consumed all available stored dislocations before SRX could occur [16]. With the aid of the SPM, the indentation arrays were found to be located in the center of the deformed grains and recrystallized grains (including dynamically recrystallized grains, SRX grains, and MDRX grains), as shown in Figure 2a. For each sample, three deformed grains and 10 recrystallized grains were randomly tested. To minimize the effects of martensite lath width, solute atom concentrations, and particles of microalloying elements, 16 nodal points of 4 × 4 squares with a length of 5 μm were measured for each array and the average value was utilized for subsequent analysis. As shown in Figure 2b, the maximal load of 6000 μN and dwell time of 2 s were implemented on the surface of all the samples. Additionally, a pyramidal Berkovich indenter was used in all the nano-indentation tests. When we assumed that the original dislocation density of martensitic lath was a constant value which was related to the shape, the average dislocation density value of SRX and MDRX grains during high temperature could be simplified to allow for evaluation by nanoindentation tests on a mixture microstructure of the martensitic lathes and retained austenite at room temperature.

3. Results and Discussion

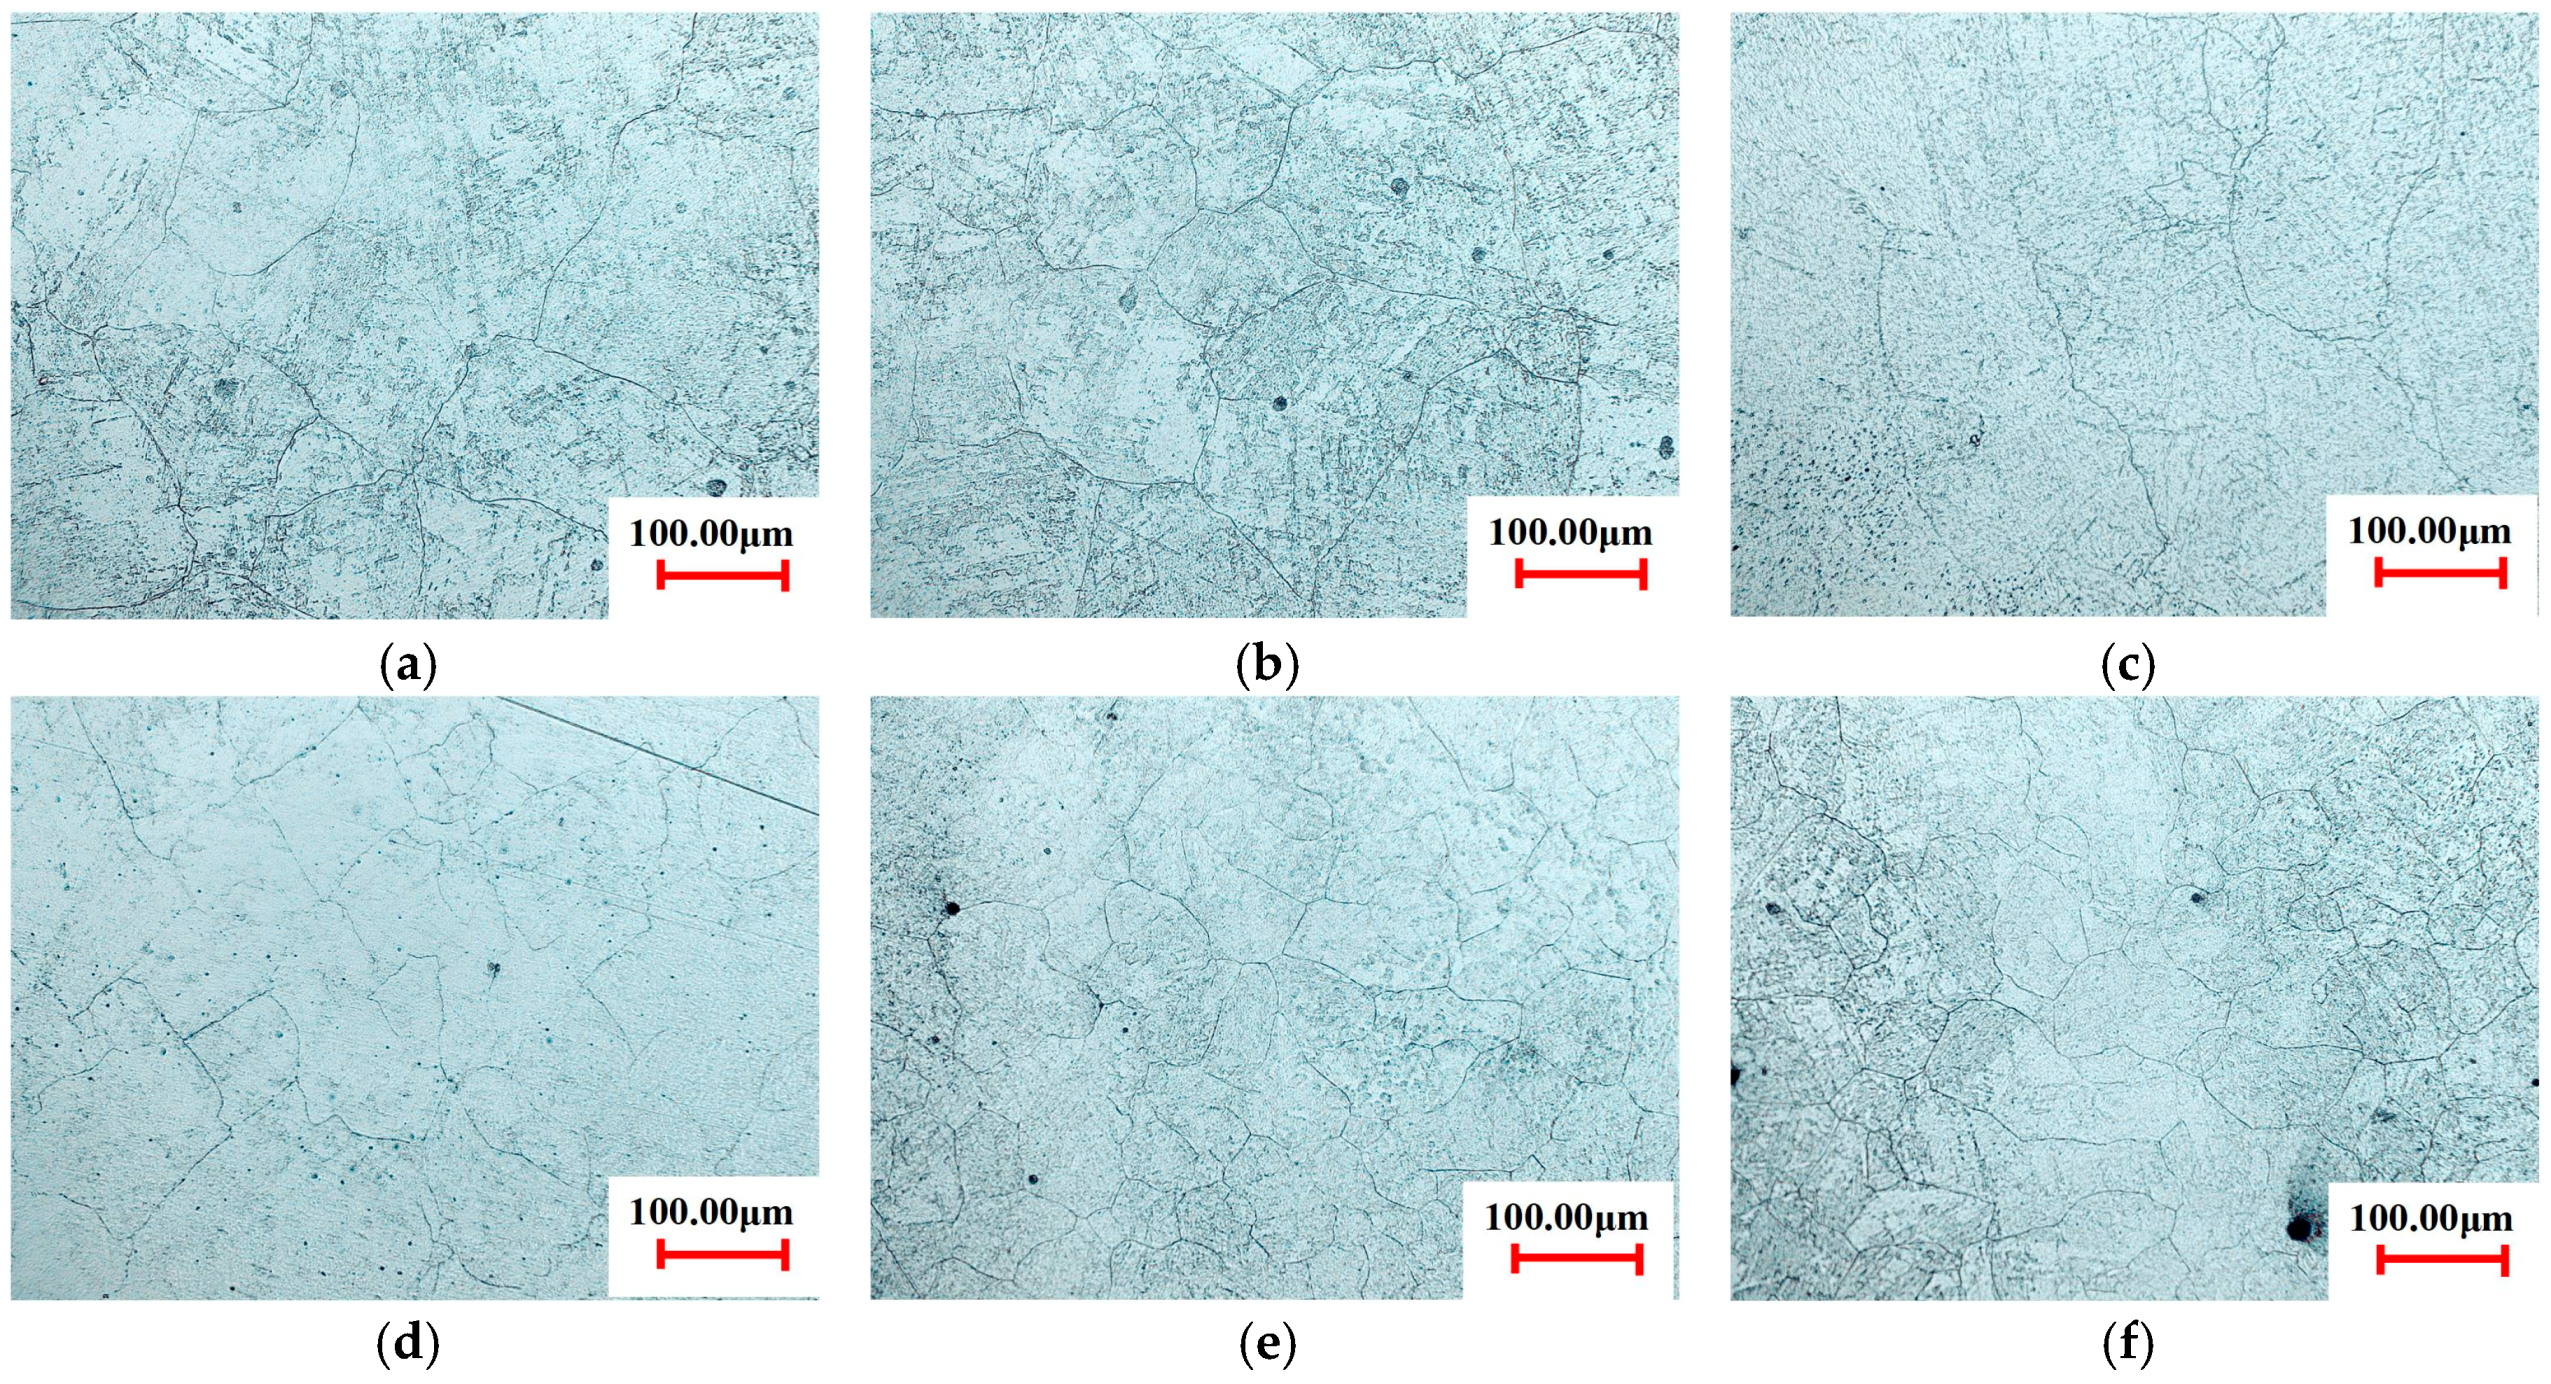
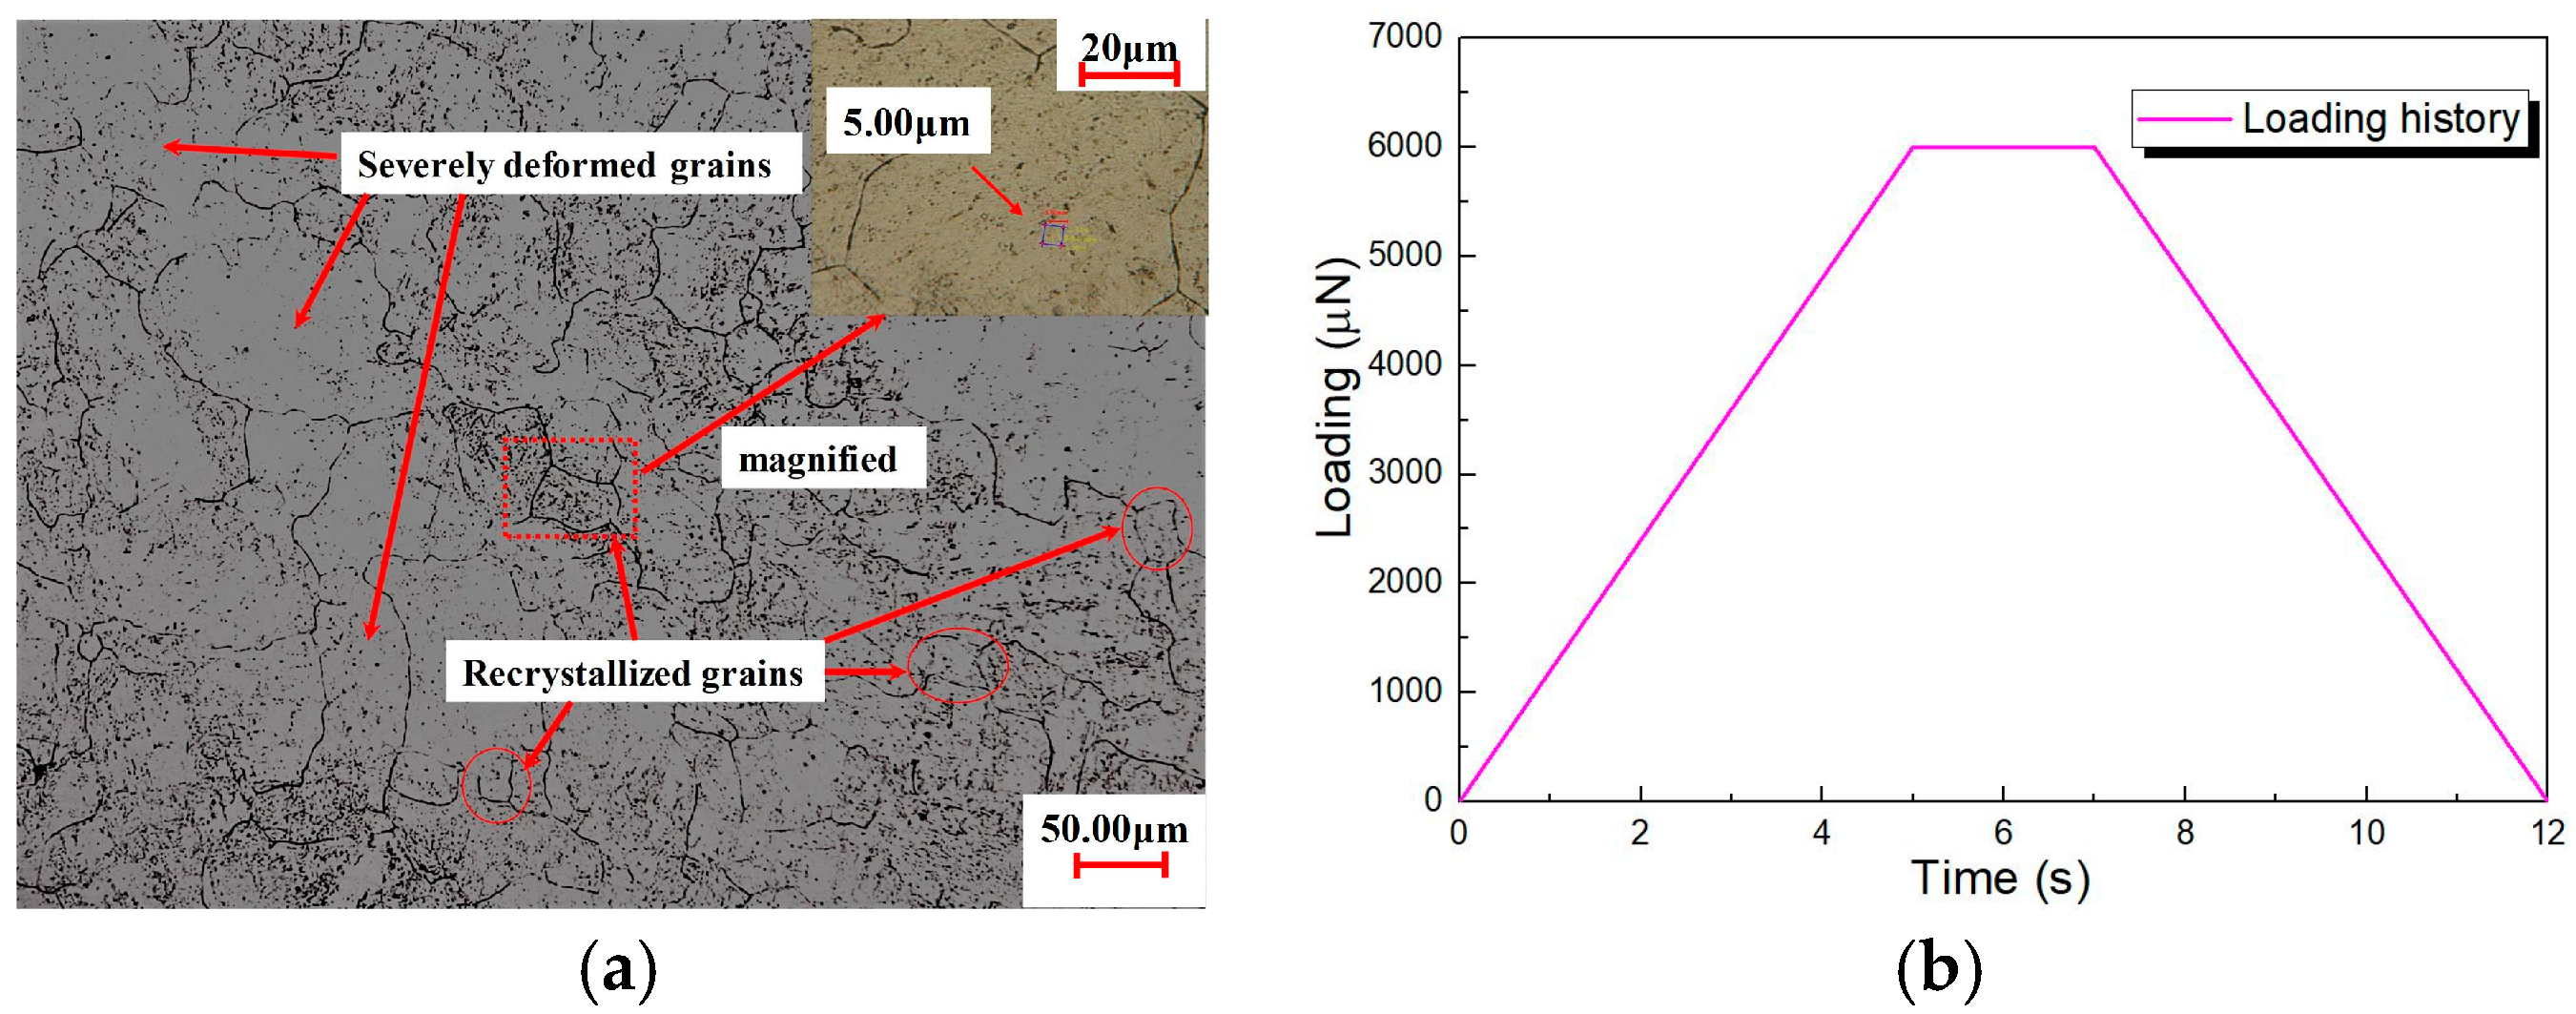
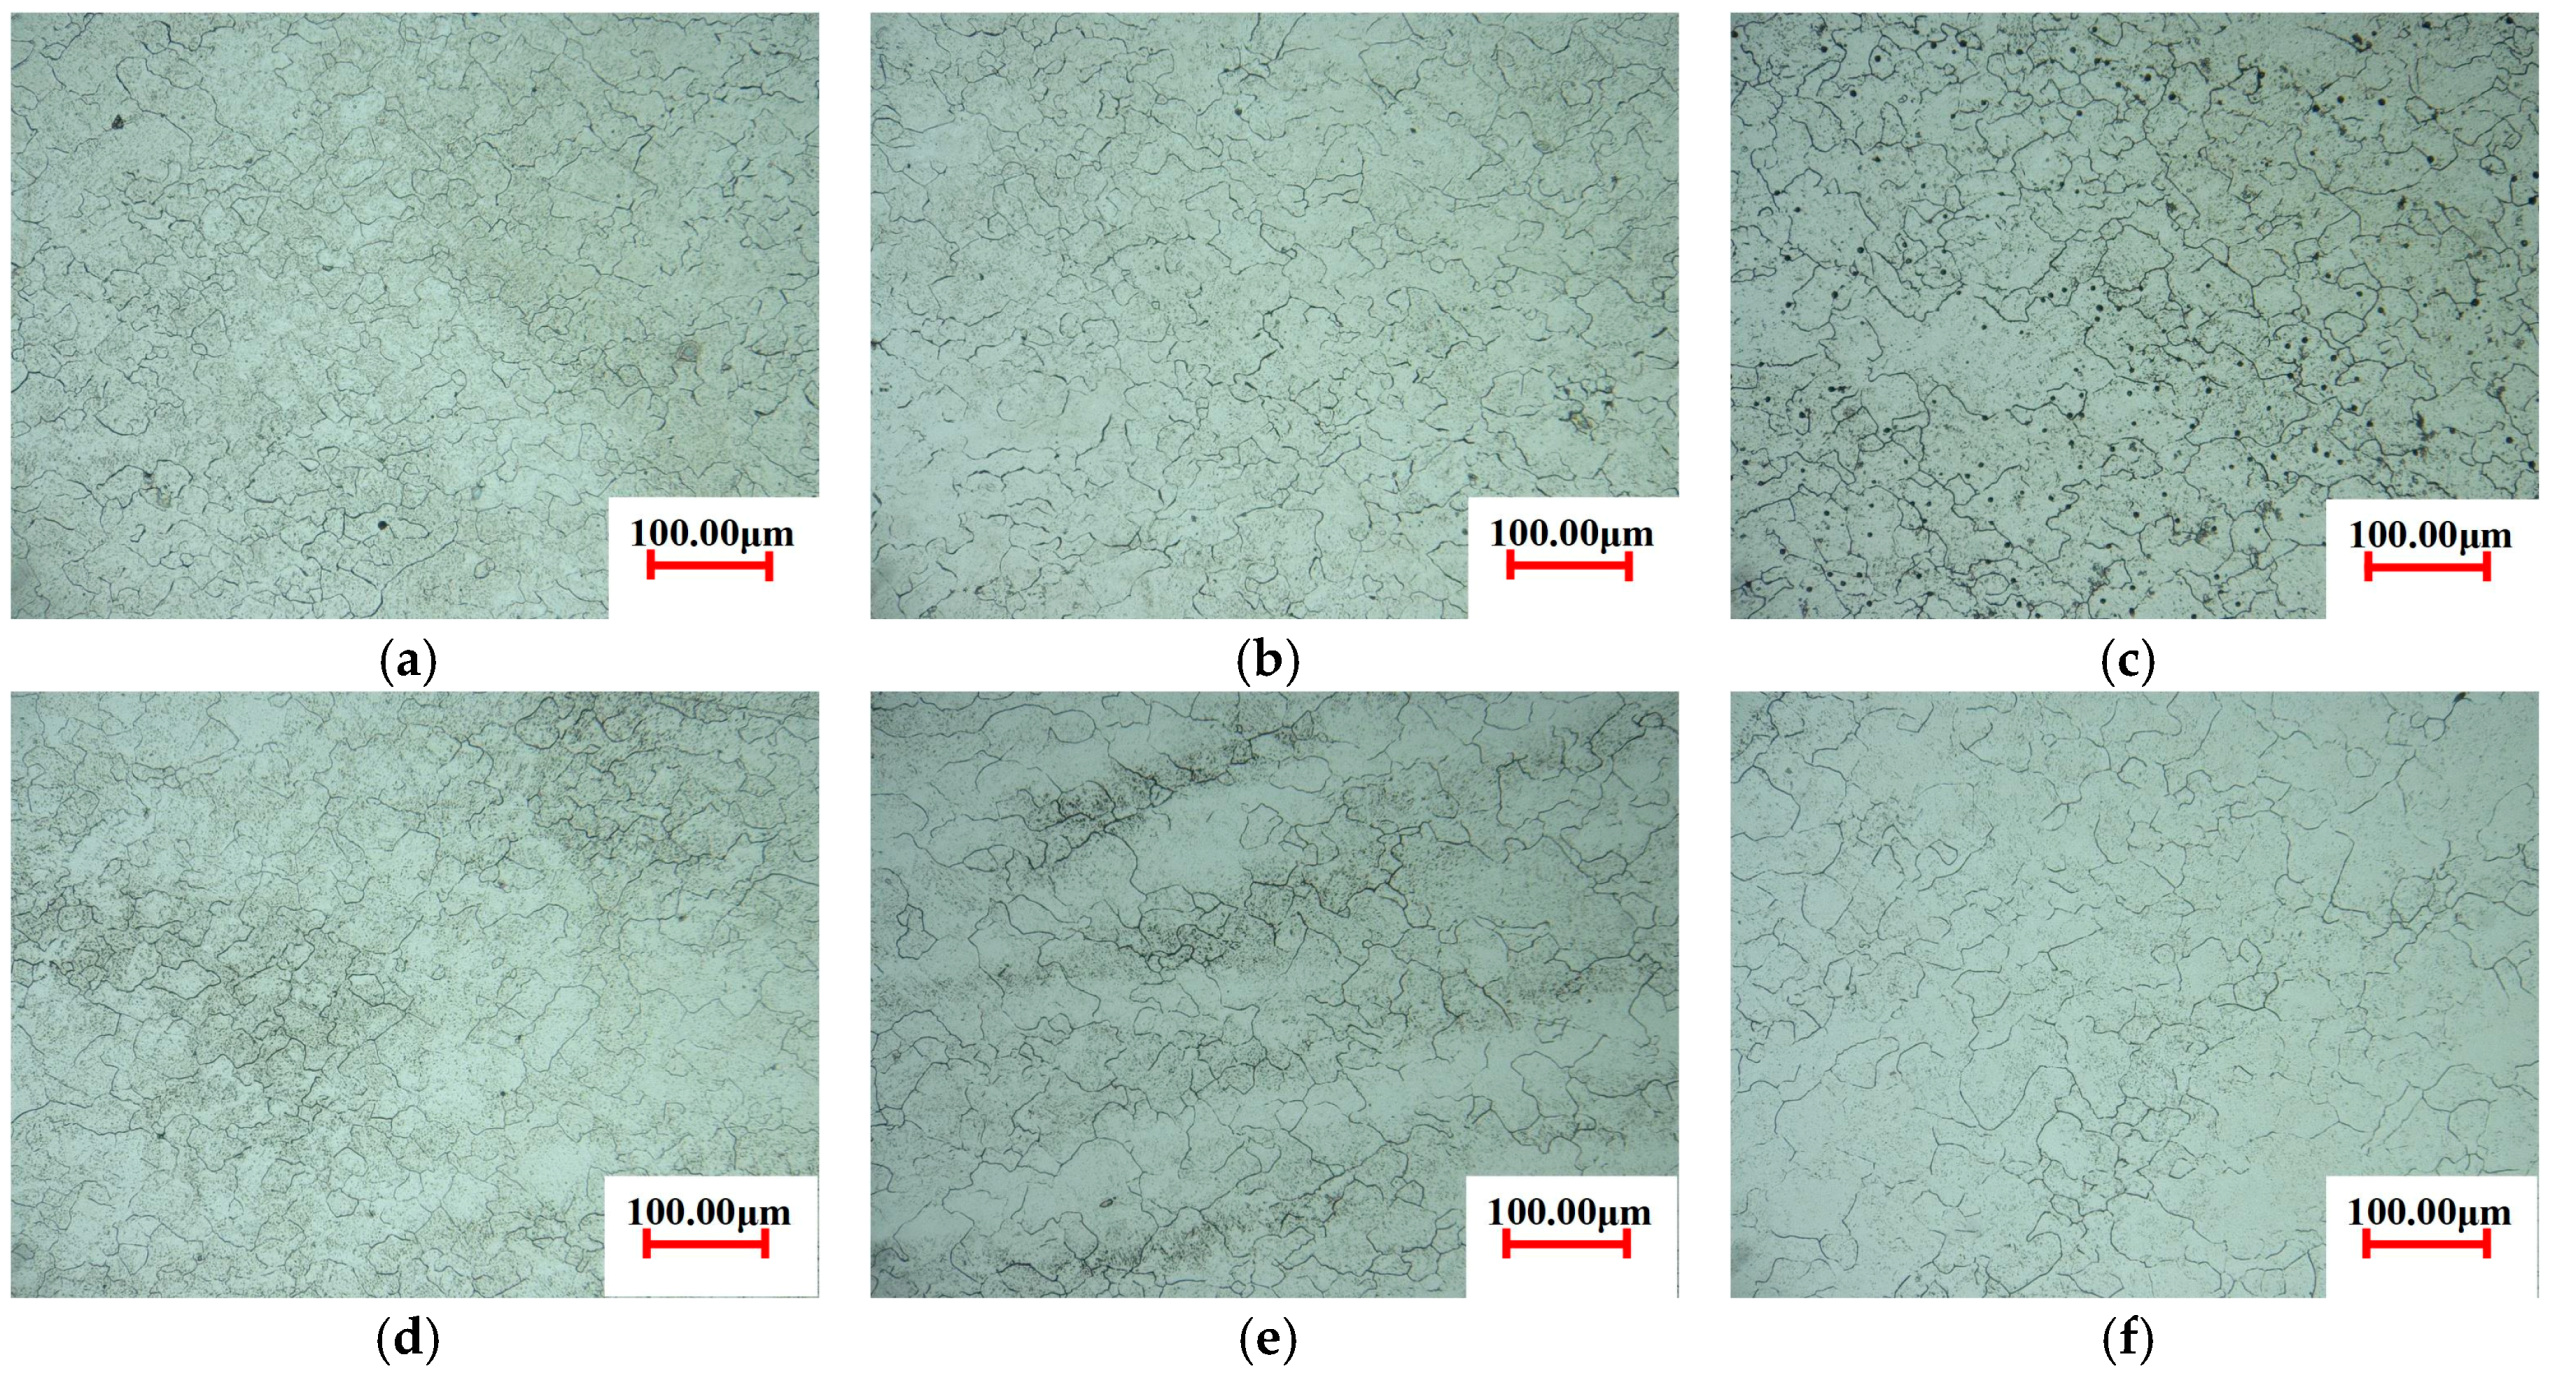
3.1. Microstructures during Post-Dynamic Recrystallization

Microstructures of sample A at the interruption strain of 0.151 and different holding times are shown in Figure 3. As shown in Figure 3a, the initial fraction of dynamically recrystallized grain was 0, which indicates the MDRX process did not occur during the subsequent annealing steps. During the initial holding time of 5 s, the microstructural evolution consisted largely of bulging phenomena at the grain boundaries of deformed grains. In Figure 3c, the static recrystallized grain firstly appeared at grain boundaries after an incubation time of approximately 50 s. The SRX process needs an incubation time to consume the dislocations (which comprise SSDs and GNDs) stored in the severely deformed grains for the transformation of the subgrains near grain boundaries into nuclei [11]. When the holding time was more than 50 s, additional static, recrystallized grains generated at the grain boundaries, where the local dislocation was relatively higher, as observed by Zouari et al. [16]. Therefore, SRX was the only recrystallized mechanism for sample A within the post-dynamic recrystallization regime.
Figure 4 illustrates the microstructures of sample B at the interruption strain of 0.511 at various holding times. The initial fraction of dynamically recrystallized grains was approximately 65% at a holding time of 0 s (see Figure 4a). In contrast to sample A (see Figure 3), the nucleation of new grains could not be observed in the selected regions of sample B, which may have been delineated by the boundaries of the deformed grains, old DRX grains, and newly formed MDRX grains. During the holding time of 3 s, a portion of dynamically recrystallized nuclei continued to grow by consuming the stored energy in the adjacent deformed grains. At the holding time of 8 s (Figure 4d), sample B was almost fully recrystallized. After the holding time of 8 s (Figure 4e,f), several MDRX grains continued to grow as a result of the grain growth regime. Although we were not able to distinguish the previous dynamically recrystallized grains from the newly formed MDRX grains at the early stage of the MDRX process, the total volume fraction of recrystallized grains could be utilized as a criterion for evaluating the progress of MDRX. The variations of the volume fraction of recrystallized grains in samples A and B according to various holding times are depicted in Figure 5. The fraction of SRX grains in sample A gradually increased with the holding time, which was in accordance with the S-type Avrami equation. On the other hand, a fraction of MDRX grains in sample B also increased during holding times which ranged from 0 s to 8 s and remained unchanged until 20 s. As shown in Figure 5, the complete SRX process was lengthy, approximately 400 s. In contrast to the SRX process, the completion time of the MDRX process was much shorter than that of the SRX. The exceptional increase at the end of recrystallized fraction curve corresponding to sample B can be attributed to the grain growth regime, which is controlled by the capillarity forces relative to the curvature of grain boundaries [5].

3.2. Microhardness and Young’s Modulus

The nanoindentation test is a nondestructive method to accurately determine mechanical properties including Young’s modulus and microhardness. On the basis of the dislocation model proposed by Nix and Gao [22], a schematic representation of nanoindentation tests is depicted in Figure 6. As shown in Figure 6a, the GNDs are homogeneously gathered within a localized region of gradient deformation, while the SSDs that contribute to the uniform deformation resistance are distributed in the whole testing sample. On the basis of the method proposed by Oliver and Pharr [23], Young’s modulus E m can be obtained by the following equation:
E m = ( 1 v 2 ) ( 1 v b 2 E r 1 E b ) 1 ,   where   E r = π 2 S A ,
where v is the Poisson’s ratio (0.28 for 300M steel), E b and v b are Young’s modulus and Poisson’ ratio of the Berkovich indenter, E r is the corresponding reduced modulus, A is the contact area which can be expressed by a function of diameter a and contact height h c (see Figure 6a), and S represents the unloading elastic contact stiffness (see Figure 6b), which is computed from a linear fit of the upper third of the unloading curve [23]. For the diamond Berkovich indenter, the two constants can be predetermined as E b = 1140 Gpa and v b = 0.07 . The contact area can be approximately determined by the Equation (3) [20]:
w = 24.56 h c 2 .
In contrast to the final height h f , the contact height h c [23] is computed from
h c = h m a x η P m a x S ,
where h m a x is the maximal height, η is a constant related to the shape of indenter (which is equal to 0.72 for the pyramidal Berkovich indenter), and P m a x is the maximal load as shown in Figure 6b.
In contrast to Young’s modulus which describes the stiffness of different regions, the microhardness can be used to characterize the complex softening process within the postdynamic recrystallization regime. The indentation hardness H i d [33] is given by
H i d = P m a x A .
To compare the Vickers hardness H V and the indentation hardness H i d , the unit of H V is converted to the unit of GPa as shown in Equation (6) [25]:
H m i c r o ( GPa ) = 9.8 1000 × sin 68 H V .
Figure 7 depicts the indentation load versus indentation depth (P–h) curves of samples A and B at conditions of different holding times (isothermal annealing times after deformation). To avoid overlap, some representative curves of indentations located at the deformed grains and recrystallized grains were analyzed. According to Equations (3)–(5), the indentation hardness H i d was inversely proportional to the contact height h c , which could be obtained visually. As shown in Figure 7a, h c increased with the holding time, not only in the static recrystallized grains but also in the deformed grains. It indicated that the SRX process plays an important role in the appearance of softening behaviors in both the deformed grains and SRX grains. With regard to sample B (see Figure 7b), H i d in the regions of recrystallized grains as well as deformed grains decreased rapidly with the holding time increases, implying a negative dependence of indentation hardness of each component in the same sample on the volume fraction of MDRX grains. The exceptional increase of indenter velocities at the end of unloading curves could be attributed to the effect of pile-up [34,35] and SSDs, which will be discussed subsequently. Figure 7c illustrates the P–h curves obtained from different regions in samples A and B at the same holding time of 50 s. As a result of the significant strain-hardening effect [19], the average value of H i d at the region of deformed grain in sample B was greater than that of the deformed grain in sample A. However, H i d of the MDRX grain was smaller than that of the SRX grain, which indicates that the MDRX process led to a more significant softening effect within the microstructural evolution regime of 300M steel.
Figure 8 presents the variation of average Vickers hardness and indentation hardness corresponding to samples A and B at different holding times. As shown in Figure 8a, the sudden reduction of H i d of deformed grains in sample A was attributed to the appearance of SRX grains, which need a long incubation time, around 50 s, for the transformation of the subgrains in the vicinity of grain boundaries into nuclei [11]. We assumed that a portion of DRX grains with a relatively low dislocation density would not induce MDRX process at an early annealing time. As a result of the difference of dislocation densities, the old “stubborn” DRX grains and MDRX grains could be distinguished by the value of indentation hardness (which is related to the average dislocation density [22]). Observations from Figure 8b indicated that the H i d value of deformed grains in sample B as always higher than that of both MDRX grains and old DRX grains, regardless of the holding time. The differences were ascribed to the inhomogeneous dislocation distribution during PDRX. In fact, H i d of deformed grains apparently reduced by as much as 24% at the completion time of the MDRX process, implying that the MDRX process consumed the stored dislocations gathered in the deformed grains to develop a more stable microstructure (see Figure 4d). In addition, the   H i d of MDRX grains were initially much higher than that of the old DRX grains; they subsequently decreased by approximately 17% before 8 s (which was the completion time of MDRX process) and finally converged to 4 GPa, which was the average indentation hardness of old DRX grains. The results validated the proposed hypothesis that the MDRX process induced by the DRX grains was thermally activated and the DRX grains with relative high dislocation density recrystallized preferentially. As an important, integrated softening feature, the average Vickers hardness of sample A remained largely constant before occurring SRX grains and decreased gradually with the increase of SRX volume fraction. Combined with Figure 5, a similar softening pattern can be summarized in the average Vickers hardness of sample B. The results from nanoindentation hardness and Vickers microhardness tests indicate that the softening fraction caused by MDRX and SRX process can be qualitatively described through the reduction of micro- and nano-hardness of both recrystallized grains and adjacent deformed grains, and the dependencies of the integrated softening effects on volume fractions of MDRX and SRX were clearly observed.
Additional conclusions as to the dependence of Young’s modulus on the volume fractions of MDRX and SRX can be seen in the modulus results (which were computed from Equations (2)–(4) of the nanoindentation tests) corresponding to different grains, as shown in Figure 9. In Figure 9, the volume fractions are represented by the areas of the spheres. The standard Young’s modulus of 300M steel at room temperature is 205 GPa (see the dotted line in Figure 9). As shown in Figure 9a, at an interruption strain of 0.151, the E m values of deformed grains remained nearly the same as the standard Young’s modulus of 300M steel before the holding time of 50 s; they subsequently decreased as the volume fraction of the SRX grains increased. In contrast to the deformed grains, E m values of SRX grains remained largely stable at about 197 GPa, regardless of the volume fractions. The former reduction was attributed to an increase in the level of crack damage within sample A during SRX process, which resulted from a formation of the nonequilibrium grain boundaries [19]. In contrast to the standard modulus, Young’s modulus of deformed grains and SRX grains were underestimated because of the sink-in phenomena [34]. At an interruption strain of 0.511, the MDRX process was the dominate microstructural evolution regime, as discussed above. The E m values of deformed grains were initially much higher than 205 GPa, as a consequence of lattice distortions reducing stiffness under large deformation conditions [23]. However, with the increase of volume fraction of the MDRX grains, the E m values of deformed grains as well as the MDRX grains decreased sharply before the holding time of 8 s. The E m values of deformed grains finally converged to 205 GPa, indicating that MDRX may have consumed the stored dislocations in the deformed grains and recovered the inner distortions associated with dislocations. Notably, as seen in Figure 9b, the E m values of MDRX grains decreased rapidly and then converged to a constant value, which as the same as the E m values of the old DRX grains. The interesting transformation phenomenon can be interpreted by the fact that some of the DRX grains with high dislocation density gradually recrystallized to consume the stored dislocation inside, while adjacent deformed grains formed more stable DRX grains with low dislocation density, which was similar to the old “stubborn” DRX grains. In summary, the softening characterization of the MDRX and SRX process could also be indicated by reductions of Young’s modulus at both the deformed and recrystallized grains.

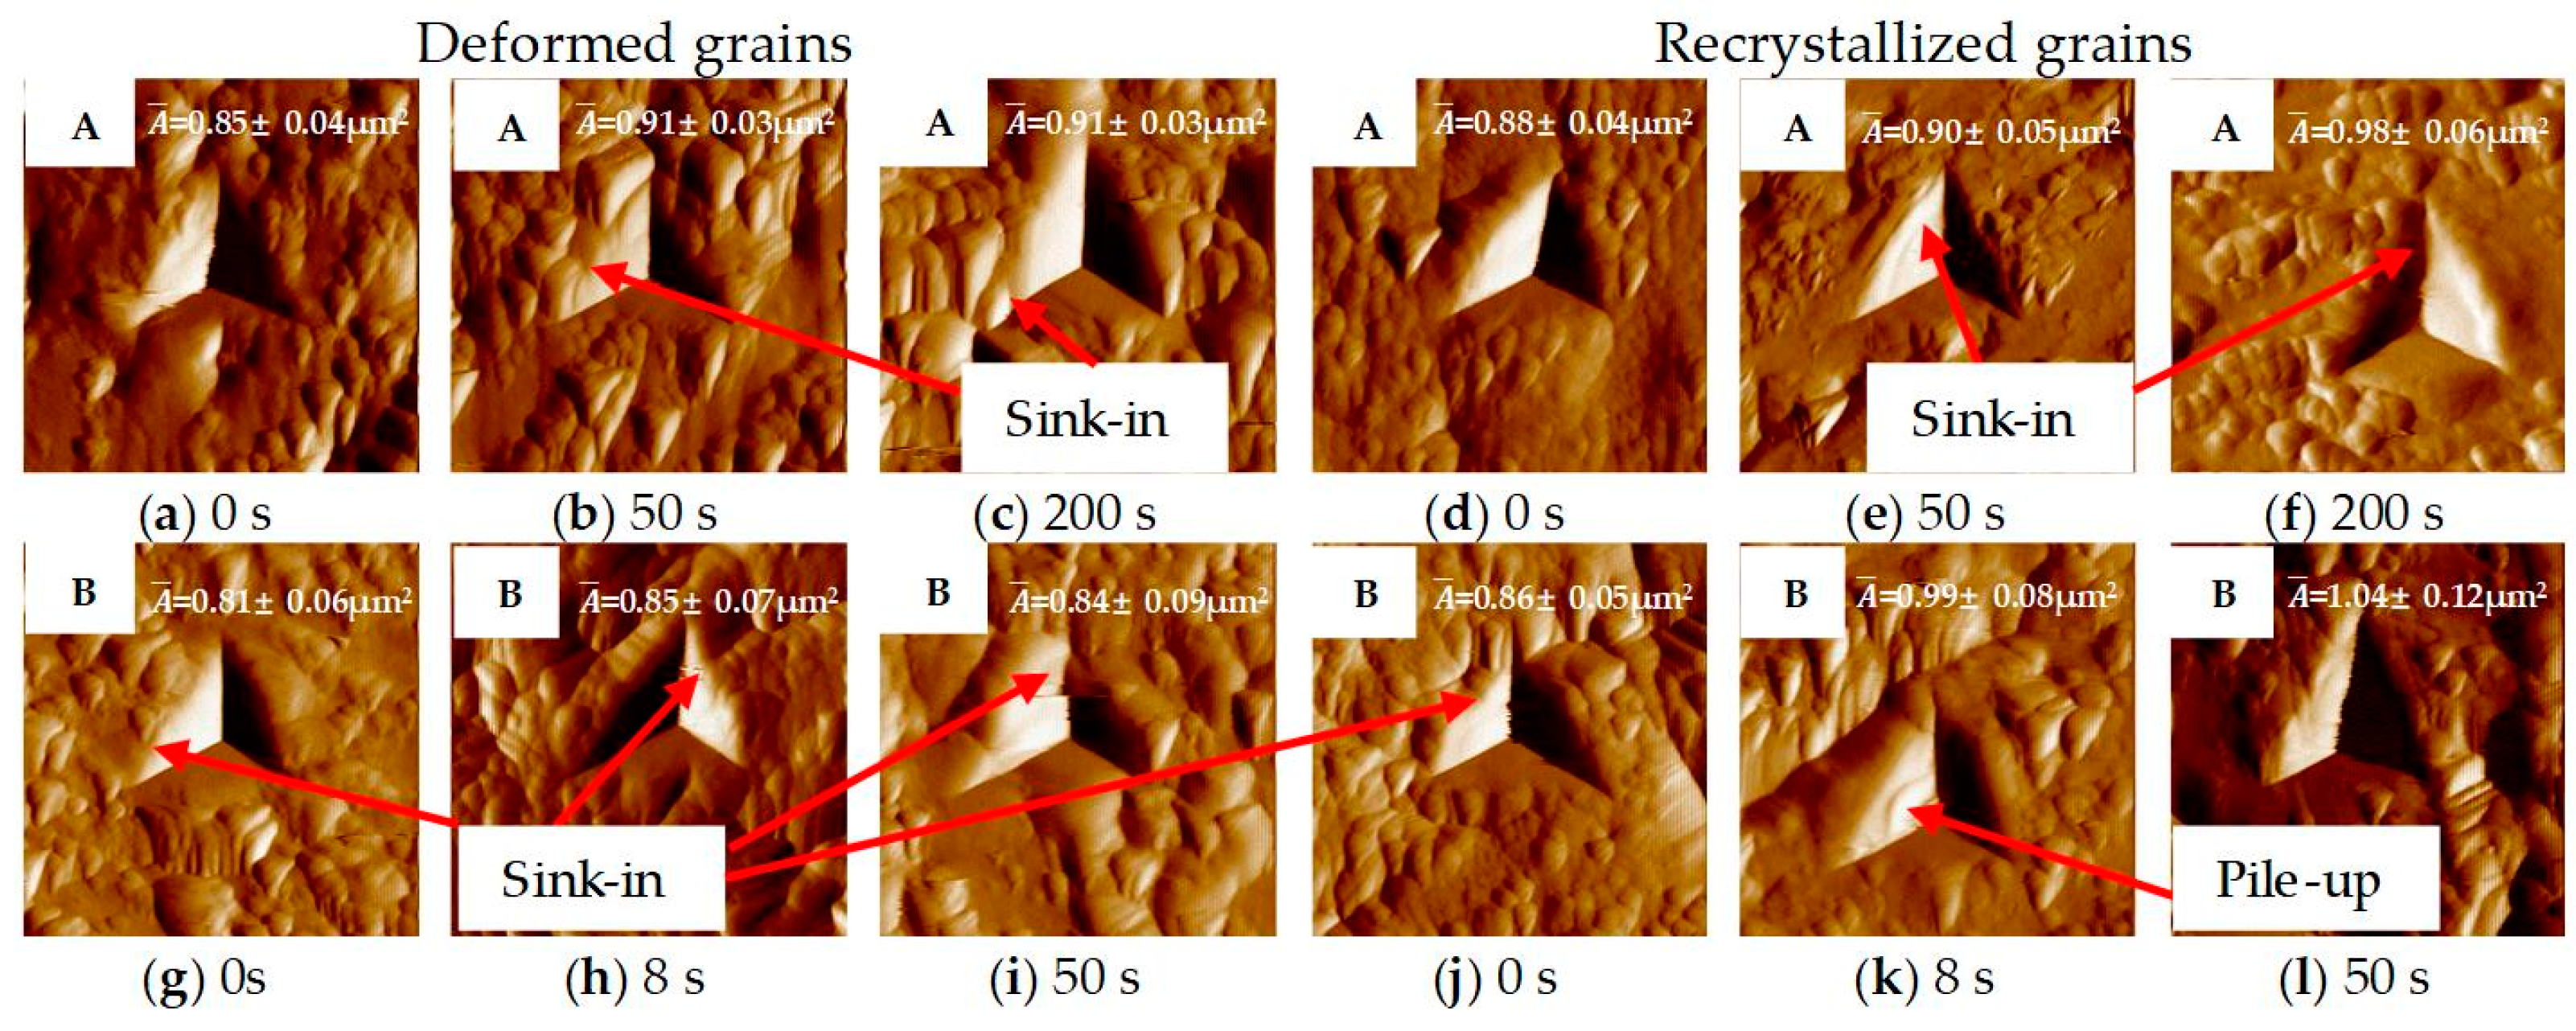
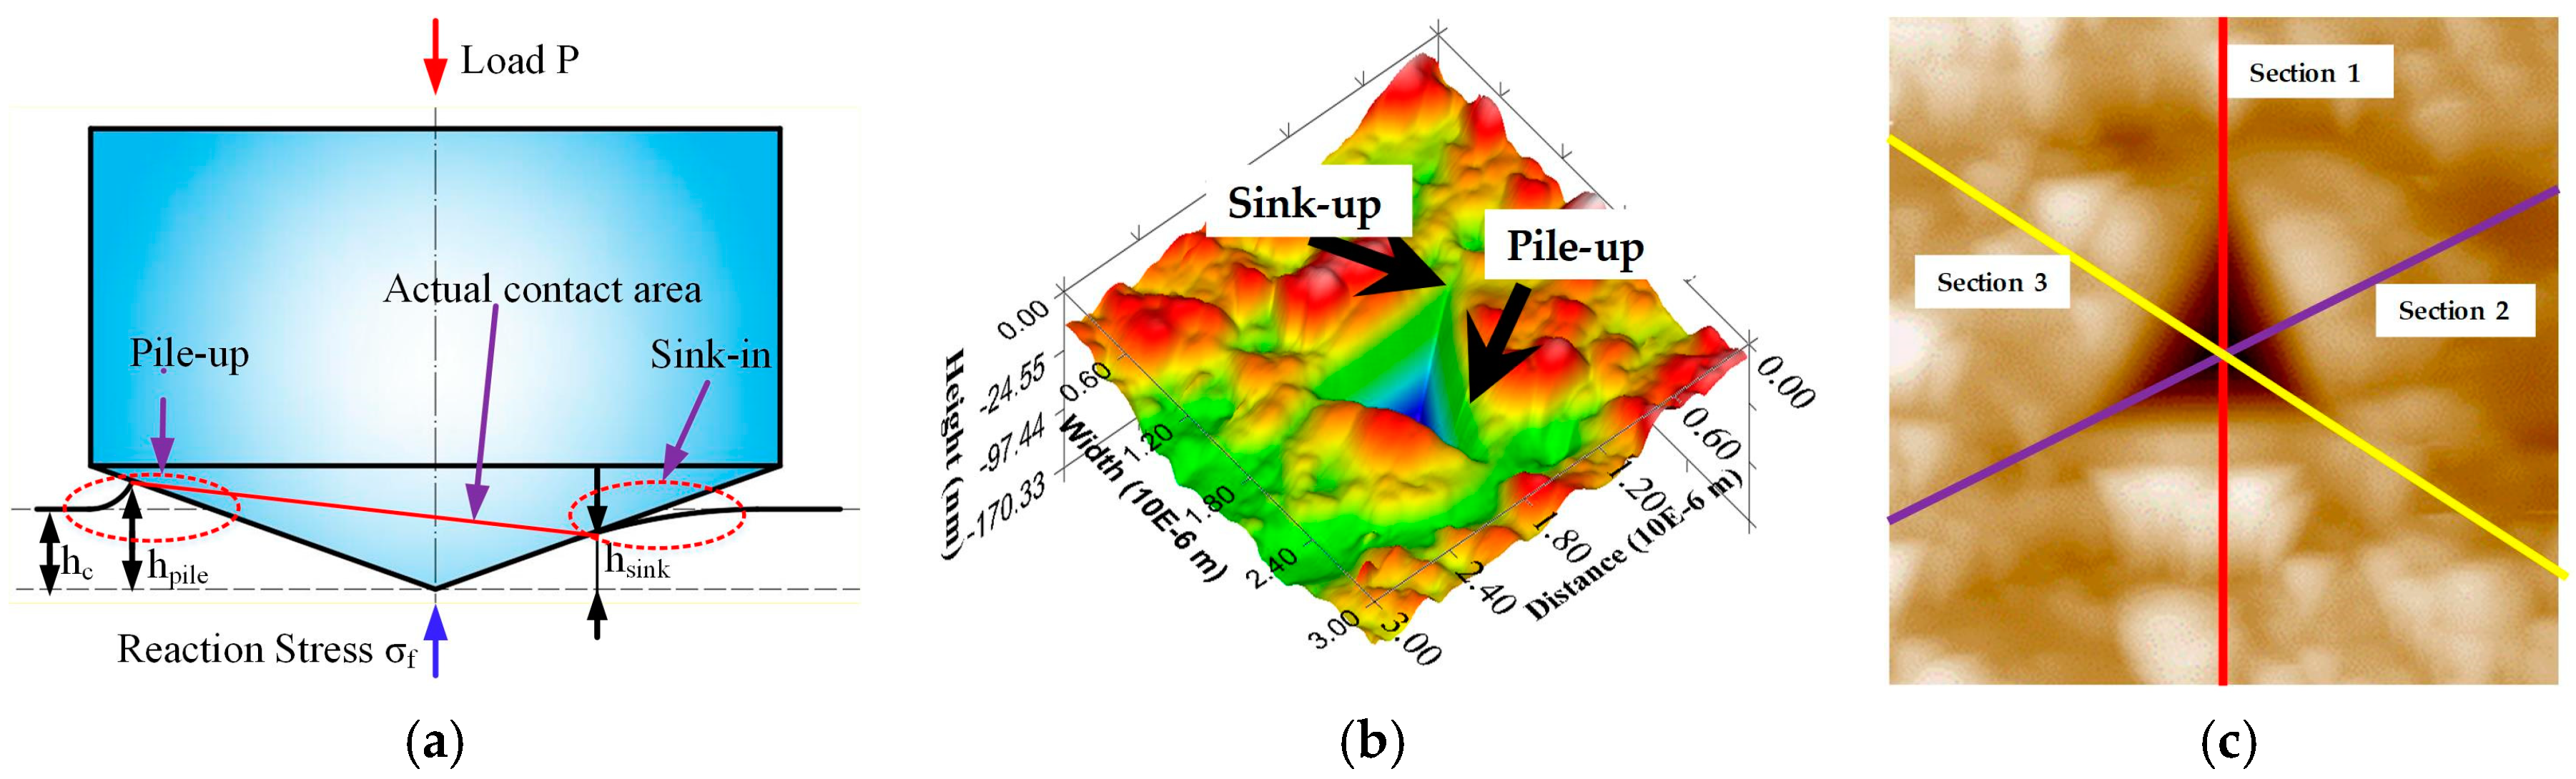
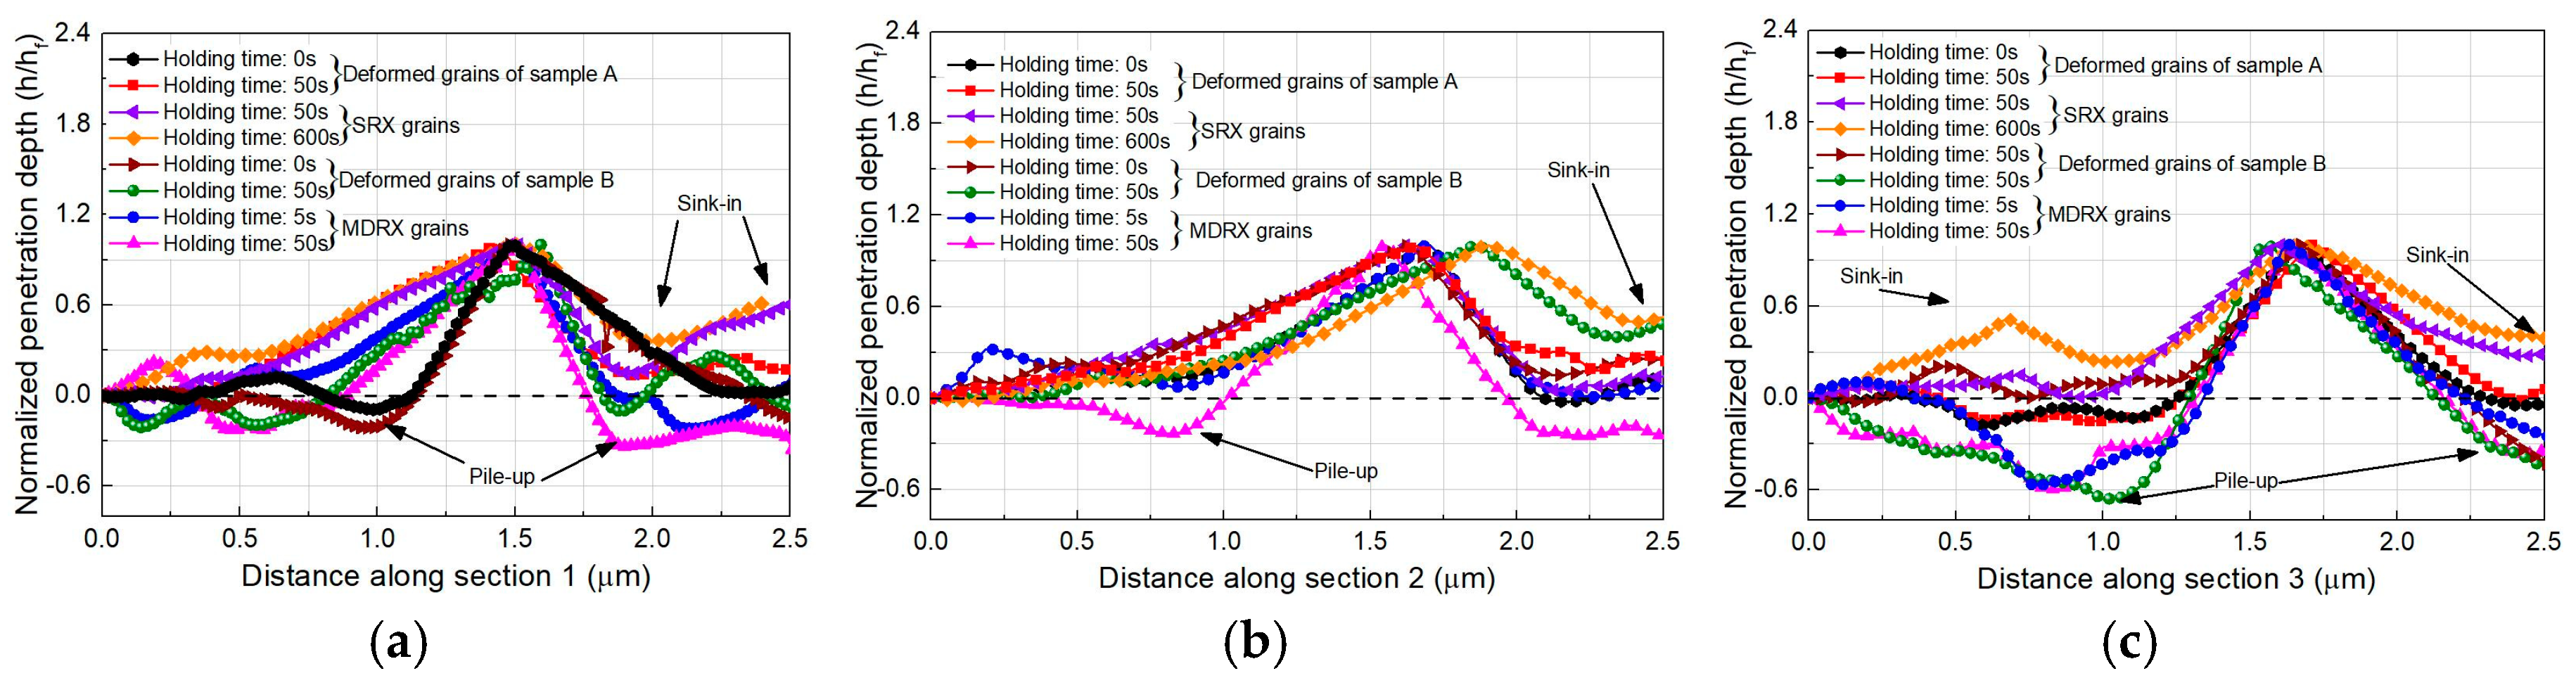
3.3. SPM Images of Indentation Morphology

It has been established that the softening process can be characterized by the size and shape of indentation morphology [22]. The SPM images of indentation morphology at representative holding times corresponding to samples A and B are depicted in Figure 10; the average sizes of indentation morphology A ¯ were computed from the software “Hysitron TriboView” (Hysitron, Minneapolis, MN, USA). The indentation size increased gradually with the increase of the holding time at the regions of deformed grains and SRX grains in sample A. The indentation sizes of SRX grains were larger than those of deformed grains at the same holding time, which indicated the SRX process resulted in a softer material component. With regard to sample B, the indentation sizes increased rapidly with the increase of holding time at the regions of deformed grains and MDRX grains. In contrast to the deformed grains in sample A, the reduction values of indentation size at the regions of recrystallized grains in sample B were much greater, implying that the MDRX process caused stronger softening effects on the deformed material.
According to the elastic contact theory [36], the surface of indentation location is often drawn into the samples during the loading process, which is referred to as the sink-in phenomena. In contrast to the sink-in phenomena, the surface around the Berkovich indenter may have piled up following the motion of indenter during the unloading process, as schematically shown in Figure 11a. The actual contact areas were heavily affected by the pile-up and sink-in phenomena [37]. Chen et al. [19] also proposed that the slip band is the essence of the pile-up and sink-in phenomena, which can additionally characterize material softening. During post-dynamic recrystallization process, the sink-in and pile-up phenomena could be observed intuitively, as shown in Figure 10. To obtain a three-dimensional perspective, a probe which scanned a 3 μm × 3 μm patch of the indentation surface corresponding to Figure 10k is depicted in Figure 11b. Results indicate that the pile-up and sink-in phenomena were activated at the indentation edge. Although the sink-in and pile-up phenomena were clearly evident on the surface of the indentation, an appropriate way to assess the extent of the sink-in and pile-up phenomena has not been reported thus far. In our work, three characteristic vertical sections across the center point were selected to analyze the indentation morphology comprehensively, as shown in Figure 11c. With regard to the section morphology, the sink-in and pile-up phenomena could be directly observed on the curves of the penetration depths versus distance along the three sections. In this case, the background subtraction technique was employed to eliminate the interference caused by the metallographic preservation.
Figure 12 illustrates the variation of normalized penetration depths ( h / h f ) with the distance along the three characteristic cross sections. As shown in Figure 12a, the sink-in phenomena are clearly observed on the surface of the SRX grains. This was predominantly attributed to the softening effect of the SRX regime. With regard to Section 2 and Section 3, the sink-in phenomena on the surface of SRX grains were significantly enhanced in relation to increases in holding time, implying a strong dependency of sink-in phenomena on the volume fraction of SRX grains. In contrast to sample A, both Figure 12a,c demonstrate that pile-up was prominent during indentation tests at both of the MDRX grains and deformed grains within sample B; additionally, the extent of pile-up phenomena gradually increased with additional holding time. This suggested that the MDRX process resulted in notable pile-up features during indentation tests. Therefore, the softening effects of MDRX and SRX on the overall mechanical properties of the 300M steel were reflected in the exceptional indentation morphology, including the sink-in and pile-up phenomena. Notably, the softening indentation morphology accounted for the exceptional decrease in P–h curves and underestimation of Young’s modulus. When the material of sample A sank in, the contact area was overestimated, leading to an underestimation of Young’s modulus during the SRX process (see Figure 9a). Once the material piled up, the contact area A will be underestimated, resulting in the underestimation of reaction force P f .
P f = A σ f
where σ f is the reactive stress related to the stored dislocations (including SSDs and GNDs densities). The sudden increase of P f was a cause for the exceptional increase of indenter velocities during the unloading process (see Figure 7b). Another reason for the exceptional softening phenomena in Figure 7b could be attributed to higher σ f in sample B with higher stored dislocations.

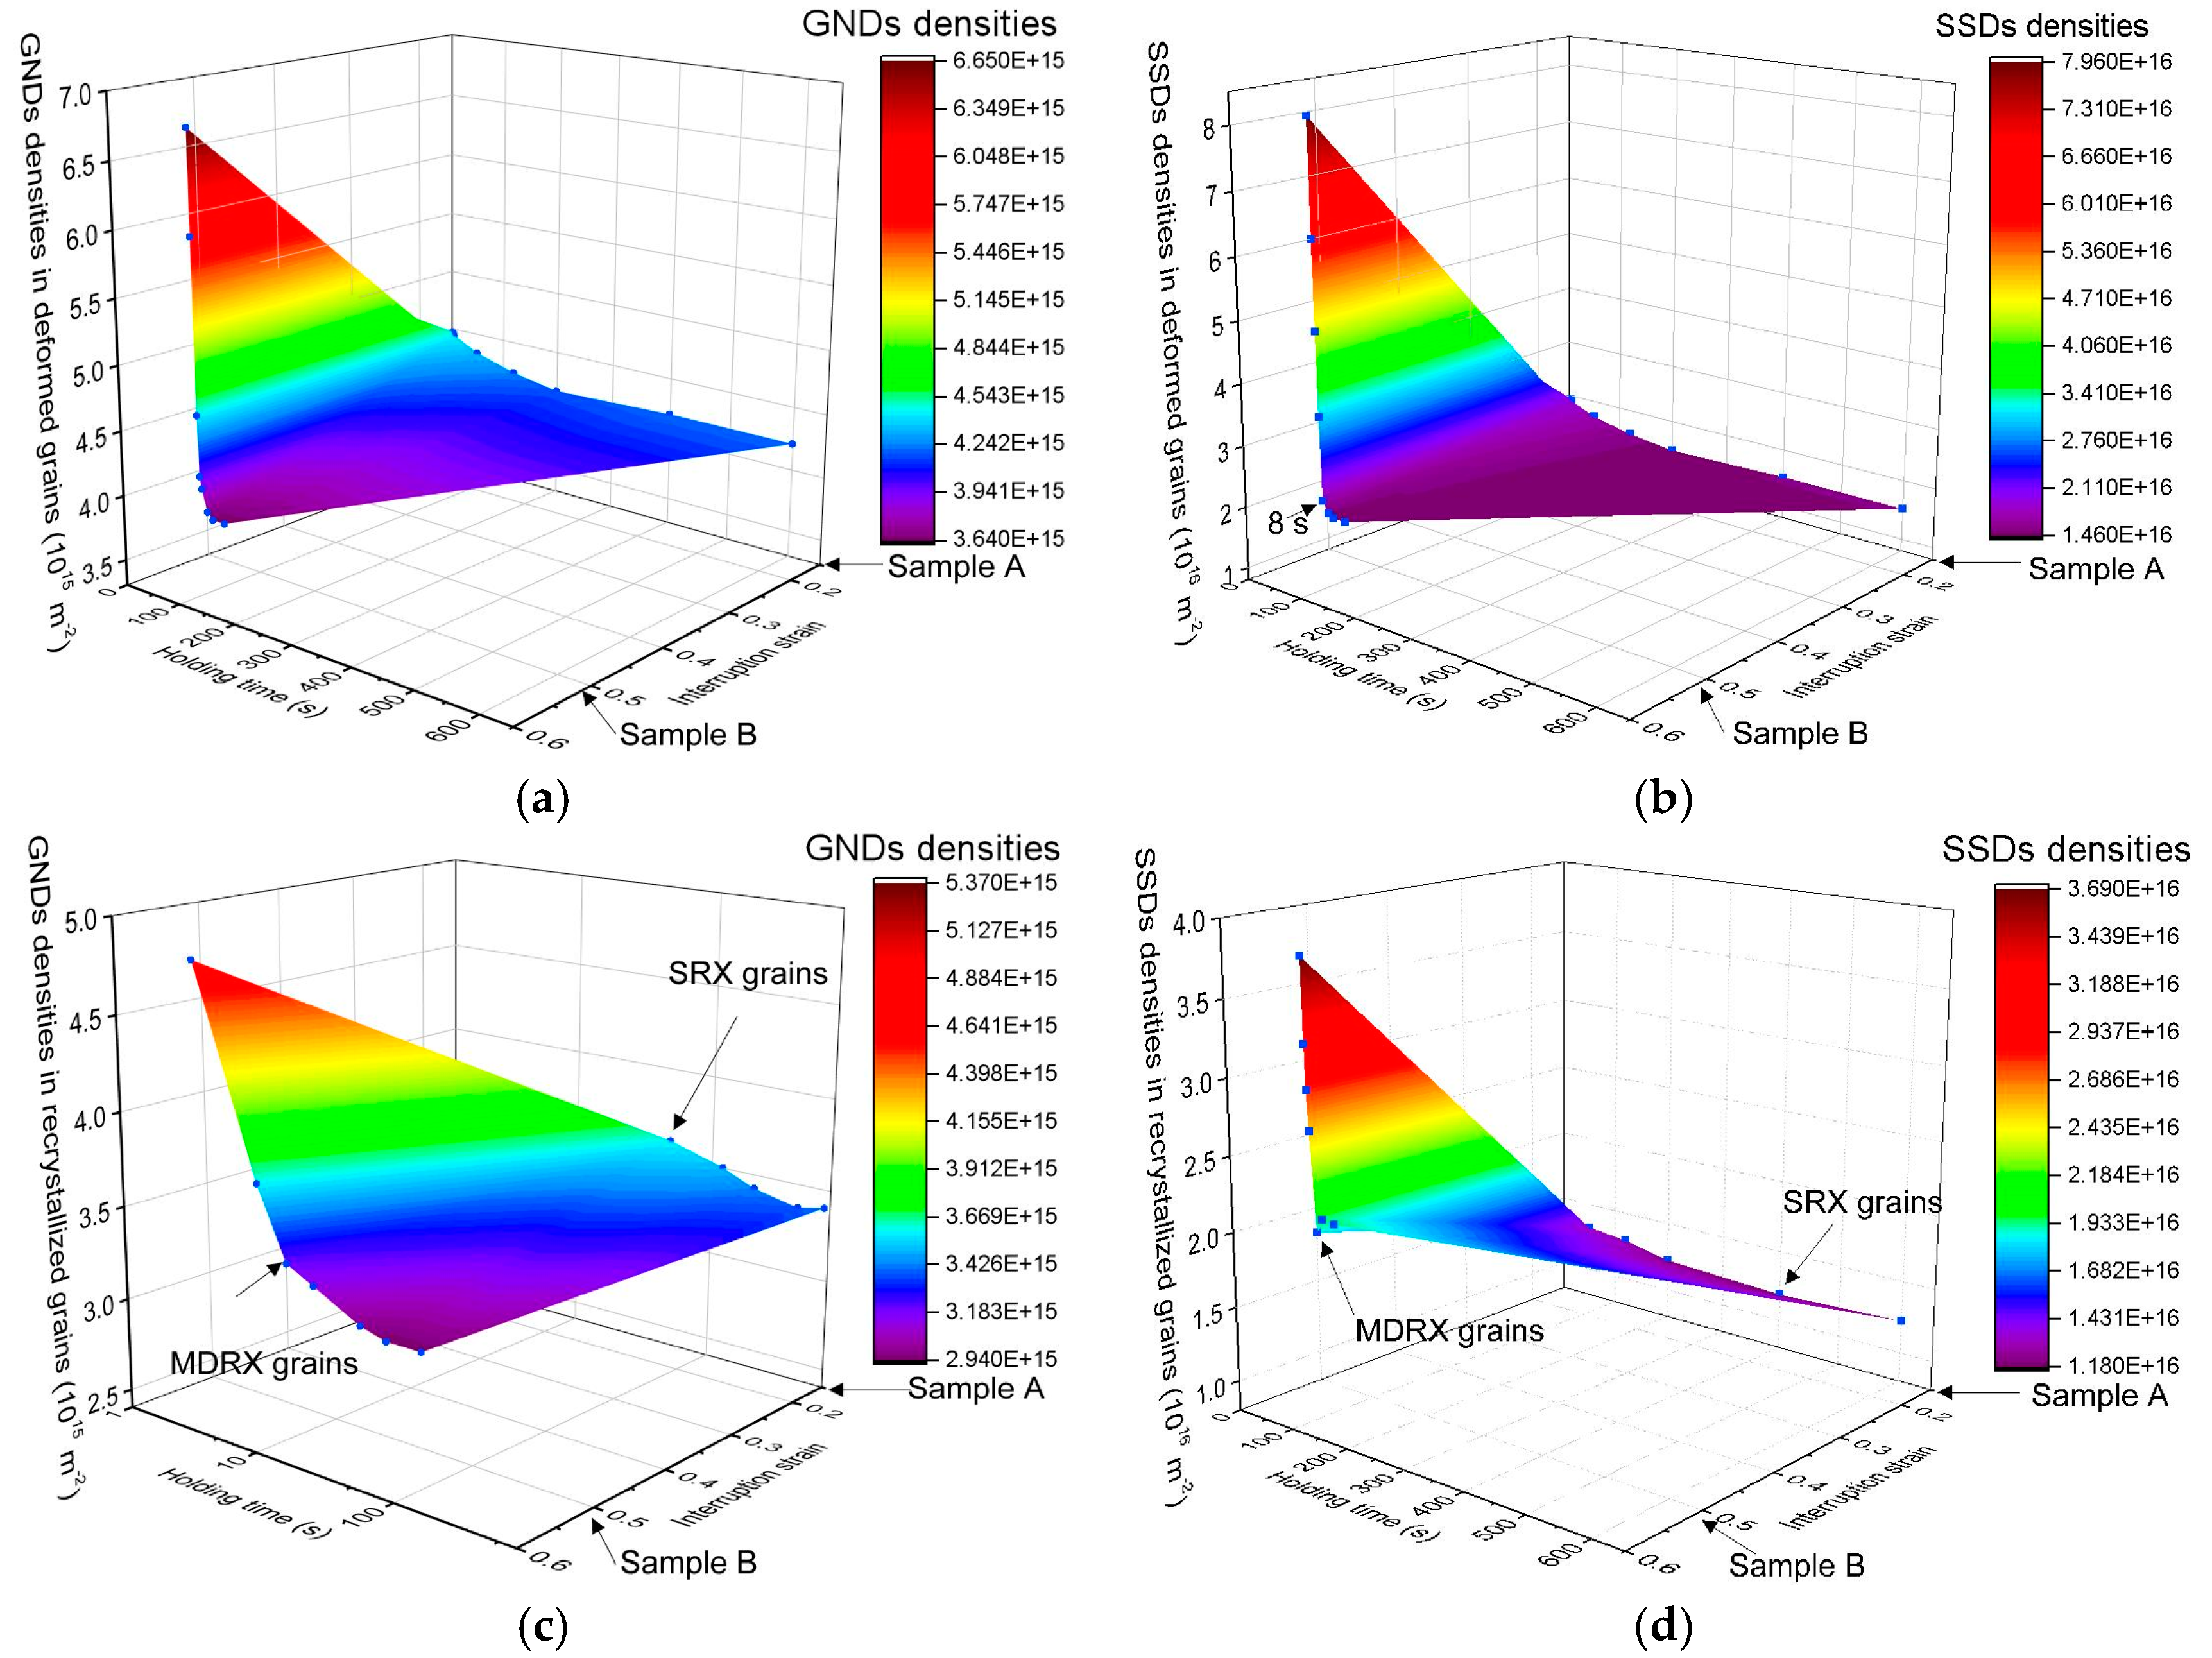
3.4. Densities of SSDs and GNDs

To clarify the difference between the softening behaviors caused by MDRX and SRX, the evolution of SSDs and GNDs densities are discussed. On the basis of the dislocation model proposed by Nix and Gao [22], the GNDs density ρ G N D can be determined as
ρ G N D = 3 2 b h c tan 2 θ ,
where θ is the angle between the indenter and surface of sample (19.7° for the Berkovich indenter), and b is the Burgers vector (2.5 × 10⁻¹⁰ m for the body-centred cubic crystal [38]). The SSDs density can be estimated by [22,35]
ρ S S D = H i d 2 27 α 2 μ 2 b 2 ρ G N D ,
where α is a constant related to the material (~0.4 for 4340 high-strength steel, similar to 300M steel [39]), and μ is the shear modulus (80 GPa for 300M steel). The variations of average SSDs and GNDs densities of different grains in sample A and B with the holding time are depicted in Figure 13. From the observation of Figure 13a, the initial value of average GNDs density corresponding to the deformed grain in sample A was 4.33 × 10¹⁵ m−2, which was significantly less than those of the deformed grain in sample B (6.64 × 10¹⁵ m−2). The difference may be attributable to the large plastic strain, which led to a greater gradient of plastic deformation on the surface of samples [19]. The average GNDs densities of deformed grains in sample A and B decreased with an increase in holding time. As shown in Figure 13b, the SSDs densities of deformed grains decreased more rapidly than the average GNDs densities during MDRX; they remained unchanged after 8 s, which was approximately the completion time of the MDRX process. The results from Figure 13a and b indicate that the softening behaviors of deformed grains during the MDRX process (see Figure 8 and Figure 9) can be mainly attributed to the reduction of average SSDs densities, while the SRX process resulted in an additional softening effect on mechanical properties of deformed grains through the consumption of both of the stored GNDs and SSDs densities. In Figure 13c, the average GNDs densities of SRX grains and MDRX grains decreased gradually in relation to holding time, until the completion of PDRX process. In addition to the deformed grains with higher dislocation density, the SRX grains and MDRX grains with relatively low GNDs densities were also softened during post-deformation annealing. As stated above, the GNDs are related to the gradient of plastic deformation, the MDRX and SRX process contributed significantly to weakening the residual effects of non-uniform plastic deformation. In contrast, in Figure 13d, the average SSDs densities of SRX grains remained nearly the same, while those of MDRX grains decreased gradually in relation to the increases in volume fraction of MDRX grain. In sample B, the reduction of average SSDs and GNDs densities in MDRX grains were significantly less than those of deformed grains. In summary, the MDRX softening process proceeded by consuming the average SSD densities stored inside of the deformed grains, while the SRX process contributed to the softening behaviors of different grains by decreasing the GNDs of SRX grains and SSDs of deformed grains. The average SSDs density decreased markedly during the MDRX process than that during SRX, which indicated that the MDRX process led to a more significant softening effect within the microstructural evolution regime of 300M steel.

4. Conclusions

The current study was conducted to qualitatively describe the softening characteristics of 300M high-strength steel during MDRX and SRX processes via isothermal, interrupted compression experiments. The softening behaviors during the SRX and MDRX were qualitatively characterized by the variations of mechanical properties including the microhardness, indentation hardness, Young’s modulus, and indentation morphology. The following conclusions can be drawn:
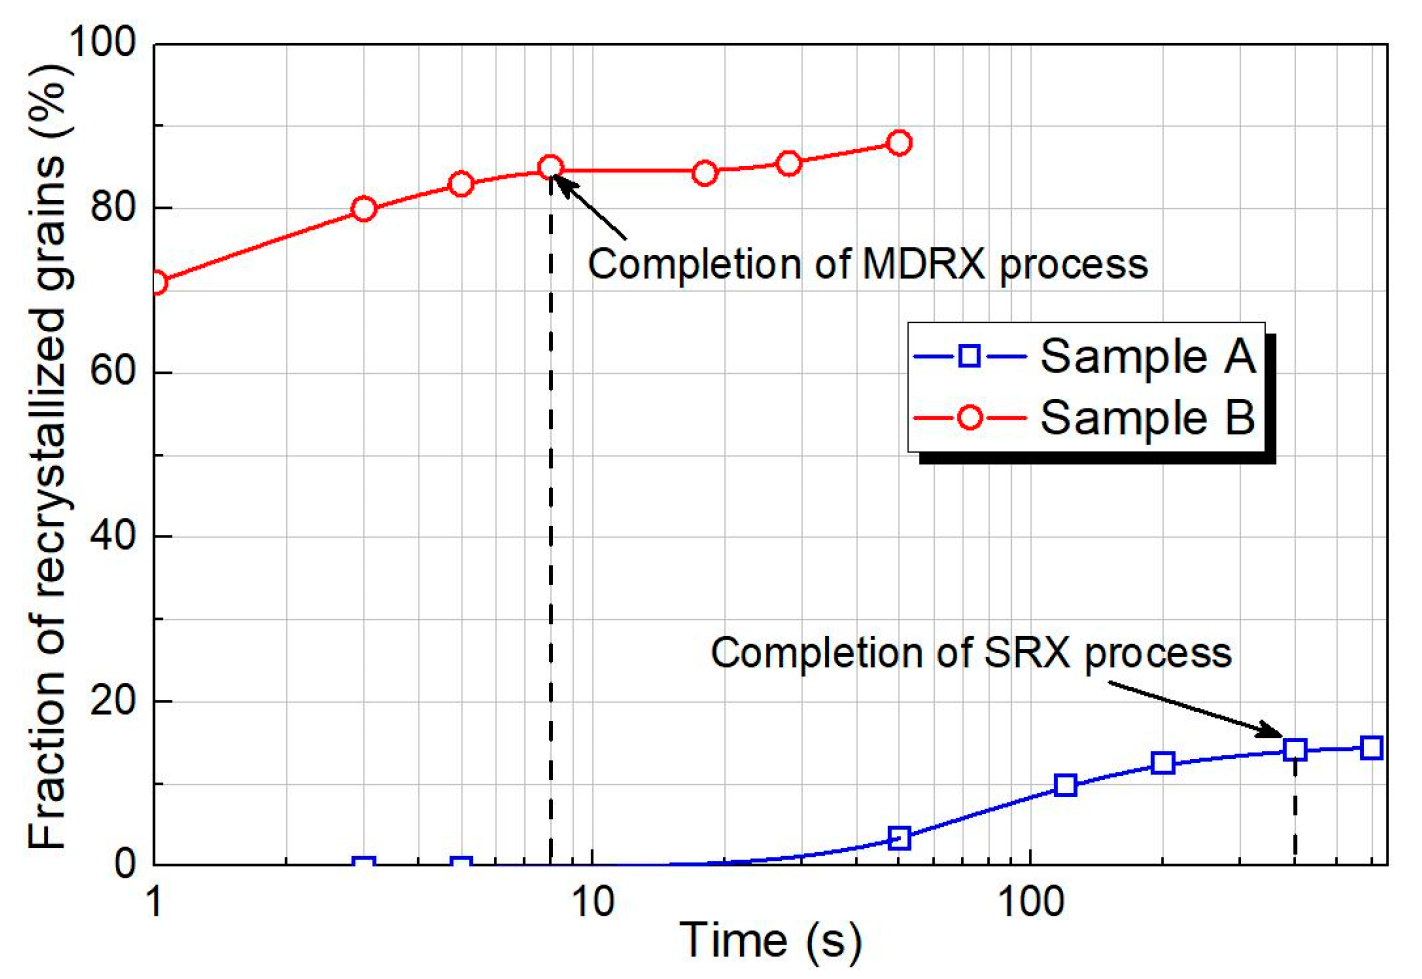
  • The SRX occurred alone in samples without initial DRX grains, after an incubation time around 50 s. In contrast, MDRX grain initially appeared within 1 s and completed at about 8 s in samples with a high initial volume fraction of DRX grains.
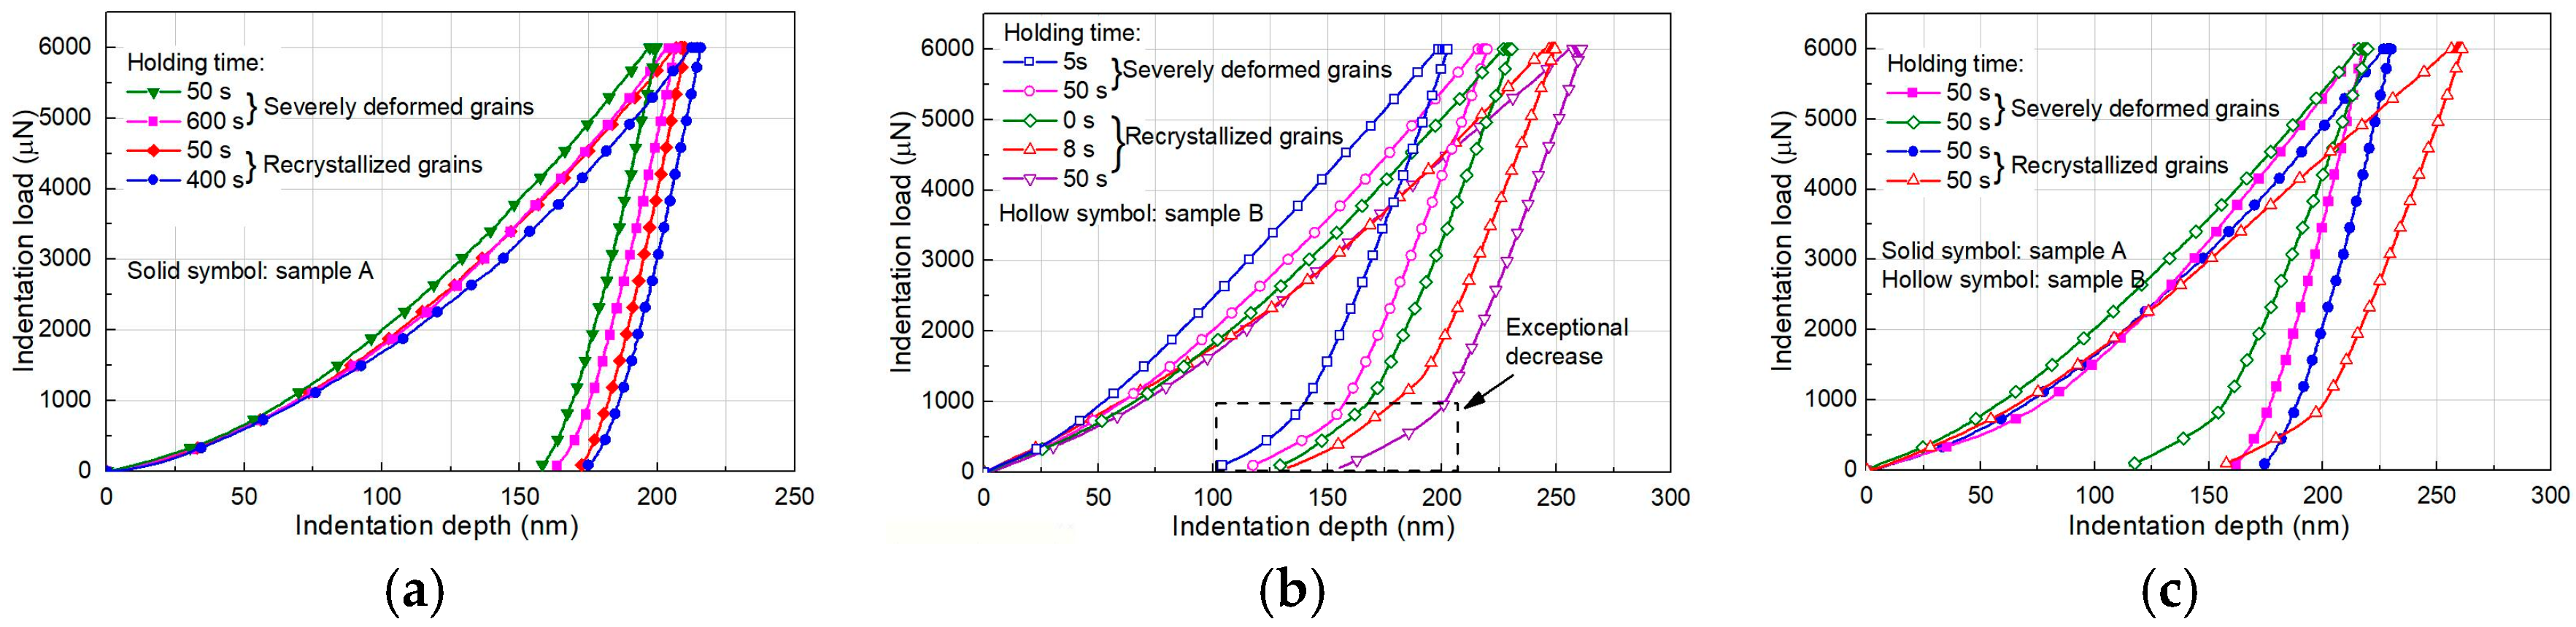
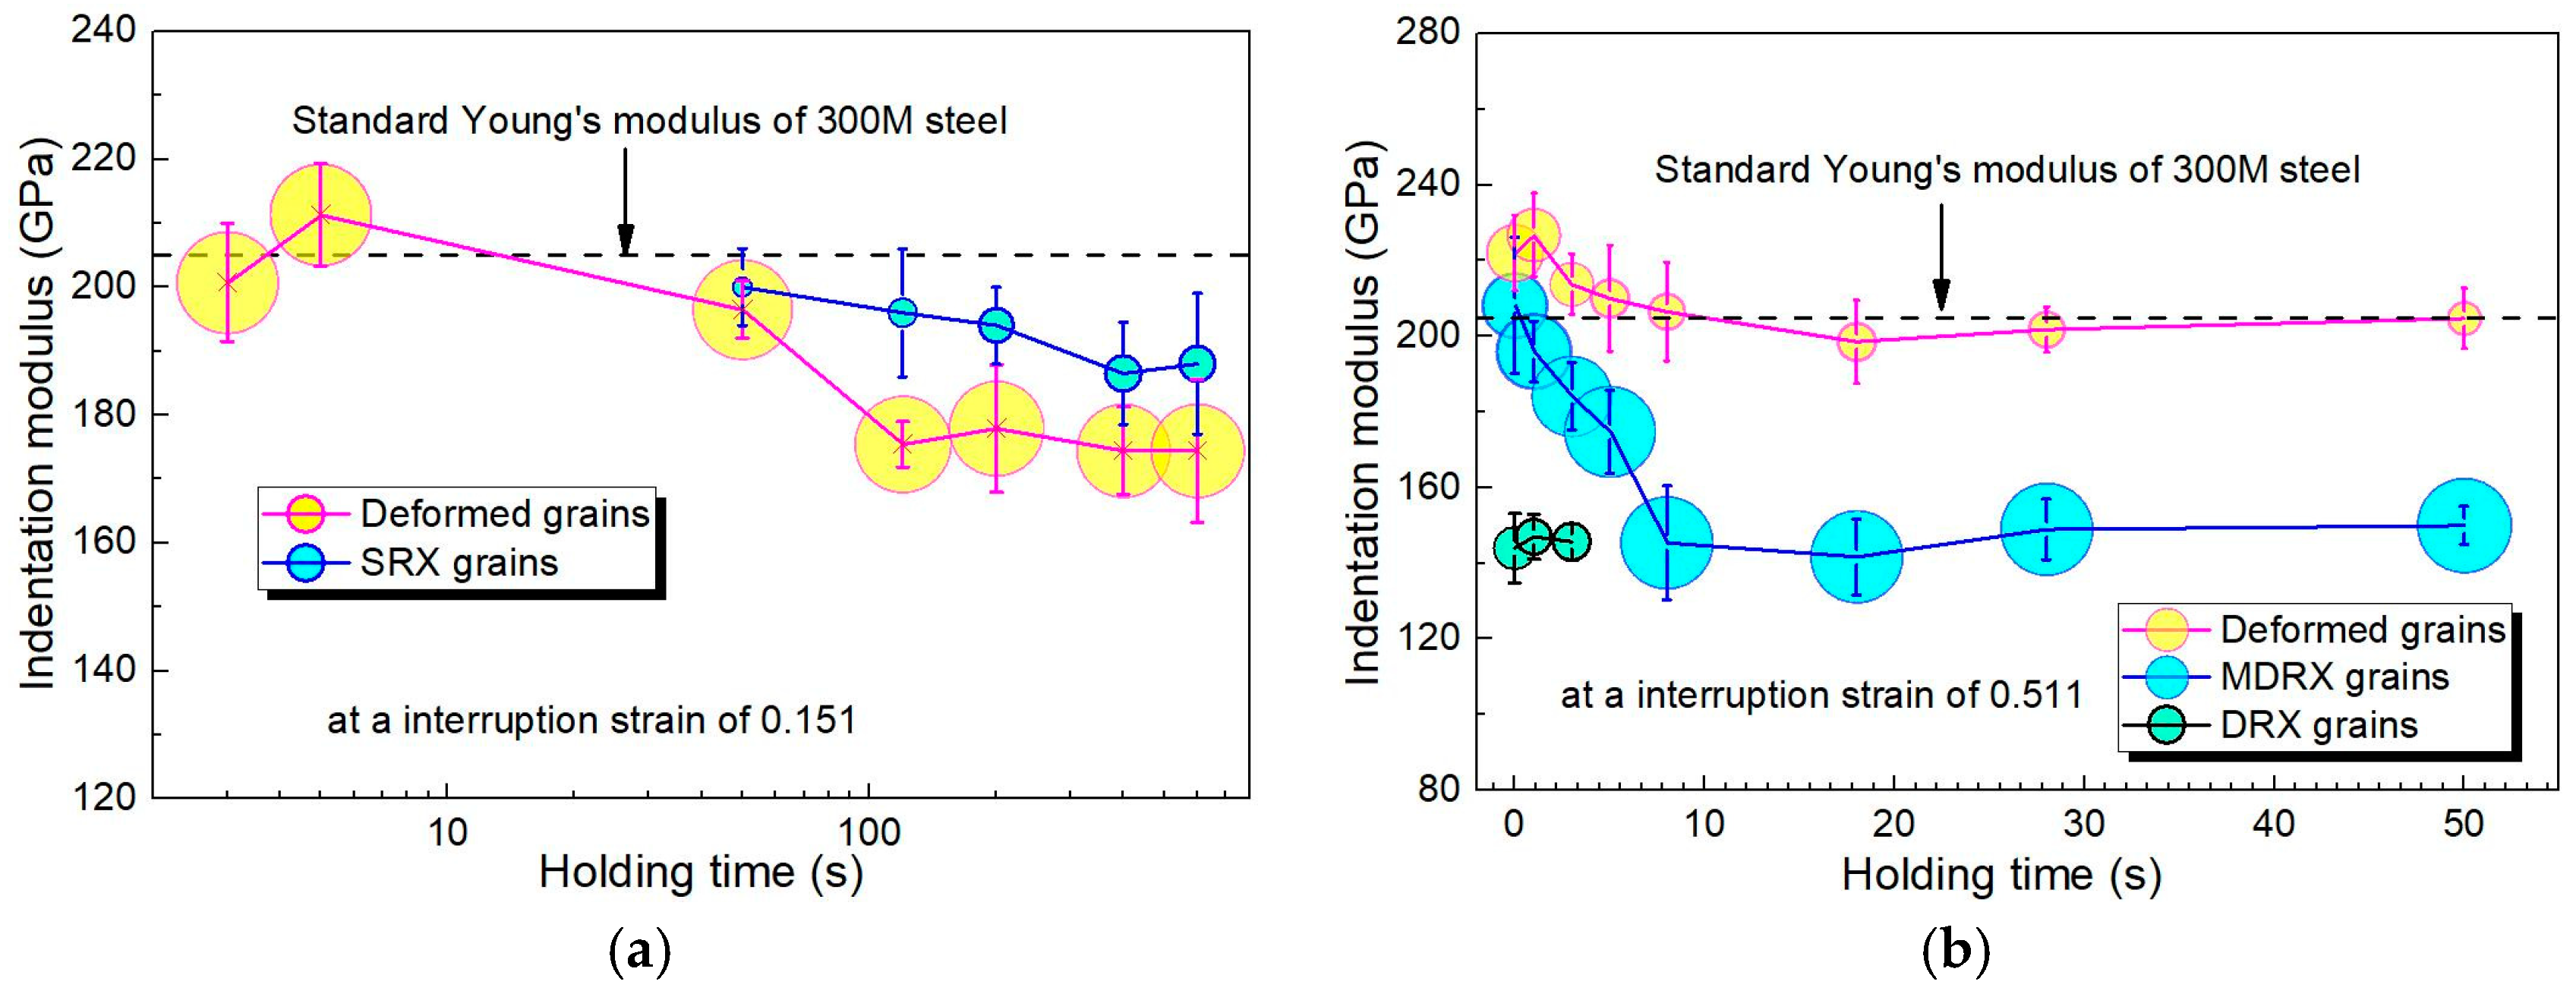
  • The microhardness, indentation hardness, and Young’s modulus at deformed grains and recrystallized grains decreased gradually with the increase of MDRX and SRX volume fractions. The dependencies of the integrated softening effects on volume fractions of MDRX and SRX were observed. Sink-in and pile-up phenomena were enhanced by the SRX and MDRX processes, respectively.
  • SSDs and GNDs densities decreased in relation to an increase in volume fraction of MDRX and SRX grains.
The MDRX softening process proceeded by consuming the average SSD densities stored inside deformed grains, while the SRX process contributed to the softening behaviors of different grains by decreasing the average GNDs of SRX grains and SSDs of deformed grains. The average SSDs density decreased more noticeably during the MDRX process than that during SRX, which indicated the MDRX process leads to a more significant softening effect within the microstructural evolution regime of 300M steel.

Author Contributions

R.Z., Y.M. designed and performed the experiments; R.Z. analyzed and discussed the data; J.L., H.S. and H.M. provided precious guidance for this research; R.Z. and L.H. wrote the paper.

Acknowledgments

The authors would like to thank the National Natural Science Foundation of China (No. 51435007) and International Research Staff Exchange Scheme (IRSES, MatProFuture project, 318968) within the 7th EC Framework Programme (FP7) for the support given to this research.

Conflicts of Interest

The authors declare no conflicts of interest.

References

  1. Luo, J.; Li, M.Q.; Liu, Y.G.; Sun, H.M. The deformation behavior in isothermal compression of 300M ultrahigh-strength steel. Mater. Sci. Eng. A 2012, 534, 314–322. [Google Scholar] [CrossRef]
  2. Sun, H.M.; Li, M.Q.; Liu, Y.G. Development of processing map coupling grain size for the isothermal compression of 300 M steel. Mater. Sci. Eng. A 2014, 595, 77–85. [Google Scholar] [CrossRef]
  3. Doherty, R.D.; Hughes, D.A.; Humphreys, F.J.; Jonas, J.J.; Jensen, D.J.; Kassner, M.E.; King, W.E.; McNelley, T.R.; McQueen, H.J.; Rollett, A.D. Current issues in recrystallization: A review. Mater. Sci. Eng. A 1997, 238, 219–274. [Google Scholar] [CrossRef]
  4. Humphreys, F.J.; Hatherly, M. Recrystallization and Related Annealing Phenomena; Elsevier: Amsterdam, The Netherlands, 2004. [Google Scholar]
  5. Huang, K.; Marthinsen, K.; Zhao, Q.; Logé, R.E. The double-edge effect of second-phase particles on the recrystallization behaviour and associated mechanical properties of metallic materials. Prog. Mater. Sci. 2018, 92, 284–359. [Google Scholar] [CrossRef]
  6. Beladi, H.; Cizek, P.; Hodgson, P.D. The mechanism of metadynamic softening in austenite after complete dynamic recrystallization. Scr. Mater. 2010, 62, 191–194. [Google Scholar] [CrossRef]
  7. Dehghan-Manshadi, A.; Barnett, M.R.; Hodgson, P.D. Recrystallization in AISI 304 austenitic stainless steel during and after hot deformation. Mater. Sci. Eng. A 2008, 485, 664–672. [Google Scholar] [CrossRef]
  8. Takayama, A.; Yang, X.; Miura, H.; Sakai, T. Continuous static recrystallization in ultrafine-grained copper processed by multi-directional forging. Mater. Sci. Eng. A 2008, 478, 221–228. [Google Scholar] [CrossRef]
  9. Tang, X.; Wang, B.; Ji, H.; Fu, X.; Xiao, W. Behavior and modeling of microstructure evolution during metadynamic recrystallization of a Ni-based superalloy. Mater. Sci. Eng. A 2016, 675, 192–203. [Google Scholar] [CrossRef]
  10. Cao, Y.; Di, H. Grain boundary character distribution during the post-deformation recrystallization of Incoloy 800H at elevated temperature. Mater. Lett. 2016, 163, 24–27. [Google Scholar] [CrossRef]
  11. Sakai, T.; Belyakov, A.; Kaibyshev, R.; Miura, H.; Jonas, J.J. Dynamic and post-dynamic recrystallization under hot, cold and severe plastic deformation conditions. Prog. Mater. Sci. 2014, 60, 130–207. [Google Scholar] [CrossRef]
  12. Djaic, R.A.P.; Jonas, J.J. Static recrystallization of austenite between intervals of hot working. J. Iron Steel Inst. 1972, 210, 256–261. [Google Scholar]
  13. Beladi, H.; Cizek, P.; Hodgson, P.D. New insight into the mechanism of metadynamic softening in austenite. Acta Mater. 2011, 59, 1482–1492. [Google Scholar] [CrossRef]
  14. Huang, K. Towards the Modelling of Recrystallization Phenomena in Multi-Pass Conditions: Application to 304L Steel. Ph.D. Dissertation, Ecole Nationale Superieure des Mines de, Paris, France, 2011. [Google Scholar]
  15. Zeng, R.; Huang, L.; Zhang, X.; Li, J.J.; Hu, J. Influence of strain induced grain boundary migration on grain growth of 300M during static and meta-dynamic recrystallization. Procedia Eng. 2017, 207, 460–465. [Google Scholar] [CrossRef]
  16. Zouari, M.; Logé, R.E.; Bozzolo, N. In Situ Characterization of Inconel 718 Post-Dynamic Recrystallization within a Scanning Electron Microscope. Metals 2017, 7, 476. [Google Scholar] [CrossRef]
  17. Huang, C.Q.; Deng, J.; Wang, S.X.; Liu, L. An investigation on the softening mechanism of 5754 aluminum alloy during multistage hot deformation. Metals 2017, 7, 107. [Google Scholar] [CrossRef]
  18. Ashby, M.F. The deformation of plastically non-homogeneous materials. Philos. Mag. 1970, 21, 399–424. [Google Scholar] [CrossRef]
  19. Chen, H.; Li, F.; Li, J.; Ma, X.; Li, J.; Wang, Q. Hardening and softening analysis of pure titanium based on the dislocation density during torsion deformation. Mater. Sci. Eng. A 2016, 671, 17–31. [Google Scholar] [CrossRef]
  20. Wang, C.; Li, F.; Wei, L.; Yang, Y.; Dong, J. Experimental microindentation of pure copper subjected to severe plastic deformation by combined tension–torsion. Mater. Sci. Eng. A 2013, 571, 95–102. [Google Scholar] [CrossRef]
  21. Zhang, M.; Li, F.; Chen, B.; Wang, S. Investigation of micro-indentation characteristics of P/M nickel-base superalloy FGH96 using dislocation-power theory. Mater. Sci. Eng. A 2012, 535, 170–181. [Google Scholar] [CrossRef]
  22. Nix, W.D.; Gao, H. Indentation size effects in crystalline materials: A law for strain gradient plasticity. J. Mech. Phys. Solids 1998, 46, 411–425. [Google Scholar] [CrossRef]
  23. Pharr, G.M.; Oliver, W.C. Measurement of thin film mechanical properties using nanoindentation. MRS Bull. 1992, 17, 28–33. [Google Scholar] [CrossRef]
  24. Taylor, G.I. The mechanism of plastic deformation of crystals. Part I. Theoretical. Proc. R. Soc. Lond. Ser. A 1934, 145, 362–387. [Google Scholar] [CrossRef]
  25. Lei, Z.; Gao, P.; Li, H.; Fan, X.; Cai, Y.; Zhan, M. Microstructure characterization and nano & micro hardness of tri-modal microstructure of titanium alloy under different hot working conditions. Mater. Charact. 2017, 134, 236–245. [Google Scholar]
  26. Carter, C.S. The effect of silicon on the stress corrosion resistance of low alloy high strength steels. Corrosion 1969, 25, 423–431. [Google Scholar] [CrossRef]
  27. Davis, J.R. ASM Specialty Handbook: Cast Irons; ASM International: Geauga County, OH, USA, 1996. [Google Scholar]
  28. Zhang, L.; Ohmura, T.; Tsuzaki, K. Nanoindentation in Materials Science, Chapter 5. In Application of Nanoindentation Technique in Martensitic Structures; InTech: Vienna, Austria, 2012. [Google Scholar]
  29. Levitas, V.I.; Javanbakht, M. Interaction between phase transformations and dislocations at the nanoscale. Part 1. General phase field approach. J. Mech. Phys. Solids 2015, 82, 287–319. [Google Scholar] [CrossRef]
  30. Du, C.; Hoefnagels, J.P.M.; Kölling, S.; Geers, M.G.D.; Sietsma, J.; Petrov, R.; Bliznuk, V.; Koenraad, P.M.; Schryvers, D.; Amin-Ahmadi, B. Martensite crystallography and chemistry in dual phase and fully martensitic steels. Mater. Charact. 2018, 139, 411–420. [Google Scholar] [CrossRef]
  31. Ramazani, A.; Mukherjee, K.; Schwedt, A.; Goravanchi, P.; Prahl, U.; Bleck, W. Quantification of the effect of transformation-induced geometrically necessary dislocations on the flow-curve modelling of dual-phase steels. Int. J. Plast. 2013, 43, 128–152. [Google Scholar] [CrossRef]
  32. Hossain, R.; Pahlevani, F.; Quadir, M.Z.; Sahajwalla, V. Stability of retained austenite in high carbon steel under compressive stress: An investigation from macro to nano scale. Sci. Rep. 2016, 6, 34958. [Google Scholar] [CrossRef] [PubMed]
  33. Li, J.; Li, F.; Xue, F.; Cai, J.; Chen, B. Micromechanical behavior study of forged 7050 aluminum alloy by microindentation. Mater. Des. 2012, 37, 491–499. [Google Scholar] [CrossRef]
  34. Hardiman, M.; Vaughan, T.J.; McCarthy, C.T. A review of key developments and pertinent issues in nanoindentation testing of fibre reinforced plastic microstructures. Compos. Struct. 2017, 180, 782–798. [Google Scholar] [CrossRef]
  35. Sneddon, I.N. The relation between load and penetration in the axisymmetric Boussinesq problem for a punch of arbitrary profile. Int. J. Eng. Sci. 1965, 3, 47–57. [Google Scholar] [CrossRef]
  36. Swadener, J.G.; George, E.P.; Pharr, G.M. The correlation of the indentation size effect measured with indenters of various shapes. J. Mech. Phys. Solids 2002, 50, 681–694. [Google Scholar] [CrossRef]
  37. Bolshakov, A.; Pharr, G.M. Influences of pileup on the measurement of mechanical properties by load and depth sensing indentation techniques. J. Mater. Res. 1998, 13, 1049–1058. [Google Scholar] [CrossRef]
  38. He, B.B.; Liang, Z.Y.; Huang, M.X. Nanoindentation investigation on the initiation of yield point phenomenon in a medium Mn steel. Scr. Mater. 2018, 150, 134–138. [Google Scholar] [CrossRef]
  39. Sankaran, K.K.; Mishra, R.S. Ultrahigh Strength Steels. In Metallurgy and Design of Alloys with Hierarchical Microstructures; Elsevier: Amsterdam, The Netherlands, 2017. [Google Scholar]
Figure 1. Detailed experimental design: (a) description of compression experimental procedure; (b) interrupted compression conditions.
Metals 08 00340 g001
Figure 2. Locations and parameters of nanoindentation tests: (a) examples of indentation locations including the interiors of deformed grains and recrystallized grains; (b) loading history of nanoindentation tests.
Metals 08 00340 g002
Figure 3. Microstructure of sample A at the interruption strain of 0.151 and different holding times: (a) 0 s; (b) 5 s; (c) 50 s; (d) 120 s; (e) 200 s; (f) 600 s.
Metals 08 00340 g003
Figure 4. Microstructure of sample B at the interruption strain of 0.511 and different holding times: (a) 0 s; (b) 3 s; (c) 5 s; (d) 8 s; (e) 20 s; (f) 50 s.
Metals 08 00340 g004
Figure 5. Variations of fraction of recrystallized grains in samples A and B with respect to holding time.
Metals 08 00340 g005
Figure 6. A schematic representation of nanoindentation tests: (a) a section through an indentation showing various parameters used for analysis; (b) relationship between load and indentation height.
Metals 08 00340 g006
Figure 7. Indentation load versus indentation depth curves of samples at different holding times: (a) sample A; (b) sample B; (c) sample A and sample B at the same holding time.
Metals 08 00340 g007
Figure 8. Variation of average Vickers hardness and indentation hardness with the holding time corresponding to: (a) sample A; (b) sample B. Data points corresponded to average values from 160 measurements for recrystallized grains and 48 measurements for deformed grains, and error bars corresponded to one standard deviation about the mean values.
Metals 08 00340 g008
Figure 9. Variation of Young’s modulus of different types of grains with the holding time corresponding to: (a) sample A; (b) sample B. Data points correspond to average values from 160 measurements for recrystallized grains and 48 measurements for deformed grains; error bars correspond to one standard deviation about the mean values.
Metals 08 00340 g009
Figure 10. The SPM images of indentation morphology on the deformed grains and recrystallized grains corresponding to: (af) sample A at the holding time of 0 s to 600 s; (gl) sample B at the holding time of 0 s to 50 s. Data points correspond to average values from 16 measurements for each indentation, and absolute errors correspond to one standard deviation about the mean values.
Metals 08 00340 g010
Figure 11. (a) Pile-up and sink-in behaviors during nanoindentation tests; (b) a 3D probe scanning of a 3 μm × 3 μm patch of the indentation surface corresponding to Figure 10k; (c) the three characteristic cross sections across the center point.
Metals 08 00340 g011
Figure 12. Variation of normalized penetration depths ( h / h f ) with the distance along the three characteristic cross sections of the center point (a) Section 1; (b) Section 2; (c) Section 3.
Metals 08 00340 g012
Figure 13. The variation of dislocation density with the holding times: (a) GNDs densities of deformed grains in sample A and B; (b) SSDs densities of deformed grains in samples A and B; (c) GNDs densities of MDRX grains and SRX grains in samples A and B; (d) SSDs densities of MDRX grains and SRX grains in samples A and B.
Metals 08 00340 g013
Table 1. Chemical composition of the hot-rolled 300M steel (wt. %).
CompositionCSiMnCrMoNiCuPFeV
Content0.391.600.700.890.401.800.060.0194.080.07

