Microstructural Evolution, Thermal Stability and Microhardness of the Nb–Ti–Si-Based Alloy during Mechanical Alloying


State Key Laboratory of Solidification Processing, Northwestern Polytechnical University, Xi’an 710072, China
*
Author to whom correspondence should be addressed.
Metals 2018, 8(6), 403; https://doi.org/10.3390/met8060403
Submission received: 9 April 2018
/
Revised: 26 May 2018
/
Accepted: 29 May 2018
/
Published: 31 May 2018
(This article belongs to the Special Issue Mechanical Alloying 2018)
Abstract
:Amorphization of the Nb–20Ti–15Si–5Cr–3Hf–3Al (at %) alloy is realized by mechanical alloying (MA). The amorphous phase formation and microstructural evolution are investigated using X-ray diffraction (XRD), transmission electron microscopy (TEM) and scanning electron microscopy (SEM). During ball milling, the phase constituent of the alloy powder exhibits a transition from most supersaturated Nb-based solid solutions (Nbss) and a small amount of amorphous phases (after 20 h of ball milling) to a completely amorphous state (after milling for 40 h), which is accompanied by evolution of the powder morphology from flakes to aggregates and eventually to refined granules. The thermal stability of the milled amorphous powders is studied using differential scanning calorimetry (DSC). With the increase of heating temperature, the distortion energy stored during ball milling is released, followed by a transformation from amorphous phase to Nbss and γ-Nb5Si3 phases. In addition, the Vickers microhardness remarkably increases, as a result of the amorphous phase formation in the matrix.
1. Introduction
Nb–Ti–Si-based alloys, as promising ultra-high-temperature structural materials due to their high melting point (>1700 °C), moderate density (~7 g/cm3), and excellent mechanical properties, have been widely investigated in recent years [1,2,3,4]. These kinds of alloys are generally composed of an Nb-based solid solution (Nbss) and intermetallic compounds (Nb, X)5Si3 and/or (Nb, X)3Si (with “X” denoting Ti, Hf, Cr, Mo, etc.). Intermetallic compounds provide excellent high-temperature strength, while Nbss guarantees sufficient room temperature fracture toughness [5].
Several methods, including electron beam melting [6], vacuum arc melting [5,7,8], directional solidification [9], powder metallurgy, etc., have been employed to prepare niobium and its derivative alloys. However, for Nb–Ti–Si-based alloys produced by the above mentioned casting methods, there exist some drawbacks such as serious compositional segregation, coarse microstructure, and distinct different microstructure in different regions, which would lead to poor mechanical properties. The powder metallurgy route, which generally consists of two procedures, i.e., powder preparation and subsequent consolidation, enables limited grain coarsening and uniform composition distribution/microstructure [10,11,12]. Thus it will be a potential candidate for the preparation of Nb–Ti–Si-based alloys without the abovementioned drawbacks.
The mechanical alloying (MA) process, a typical high-energy ball milling operation involving repeated fracturing and cold welding of the powder particles [13,14,15], is a common method to prepare powder blends, and has a significant influence on the subsequent consolidation of the powder mixtures [16,17]. We have recently investigated the evolutions of morphology and phase constituents of Nb–Ti–Si-based alloy powder blends (with the nominal composition of Nb–20Ti–15Si–5Cr–3Hf–3Al (at %)) during ball milling at low and moderate milling speeds [18]. We showed that a supersaturated Nb-based solid solution (Nbss) forms, rather than the as-solidified eutectic microstructure composed of equilibrium Nbss and intermetallic compounds.
It has been frequently demonstrated that, in some alloy systems, a transition from a crystalline phase to an amorphous phase may occur as the milling speed increases, due to the loss of stability of the ultrafine grains caused by the continuous formation of defects and disorder [19,20,21]. For Nb derivative alloys, the amorphous phase formation during ball milling has also been reported. For instance, Koch and Calvin successfully produced Ni60Nb40 amorphous particles by MA using pure crystalline Ni and Nb powders [22]. Nazareth and Bing et al. prepared amorphous powders of the Nb–Si binary system by employing the same technique [21,23,24]. Lee’s study showed [25] that the amorphous state can be obtained within a wide range of components (Nb70Si30~Nb95Si5) for the Nb–Si binary system prepared by MA. However, for Nb–Ti–Si-based multi-component alloys, there is no report regarding amorphization of the powder mixtures during ball milling. It is not yet known whether amorphous phases can appear in the Nb–Ti–Si-based alloy powders under more severe external milling conditions, especially when the milling speed is much higher. Taking into account the significantly different structures and properties between the amorphous phase and the crystalline phase, the presence of an amorphous phase in the as-milled powders is likely to have a pronounced effect on the subsequent consolidation process and the microstructure of the bulk materials. Based on the above analysis, the MA behavior of Nb–Ti–Si-based alloy powders at a higher milling speed will be well worth exploring to figure out the possibility of amorphization.
In this work, we investigate the MA behavior of Nb–Ti–Si-based alloy at a higher ball milling speed than those used in previous studies. The microstructural evolution, thermal stability and mechanical behavior of the powder mixtures are revealed. This study provides some basis and reference for the preparation of bulk Nb–Ti–Si-based materials by hot pressing. Moreover, the findings here are also of certain significance to the additive manufacturing of Nb–Ti–Si-based materials considering the importance of the pre-alloyed powders.
2. Materials and Methods
Elemental powders of Nb (Zhuzhou Cemented Carbide Group Co. Ltd, Zhuzhou, China) and Ti, Si, Cr, Hf, Al (Sinopharm Chemical Reagent Co. Ltd, Shanghai, China), with a purity higher than 99.9 wt %, were selected as the original materials, wherein the Hf powders and Ti powders were smaller than 45 μm and the rest smaller than 75 μm. The elemental powders, which were mixed to a nominal composition of Nb–20Ti–15Si–5Cr–3Hf–3Al (at %), were milled in a QM–1SP4–CL planetary ball milling machine (Nanjing NanDa Instrument Plant, Nanjing, China) with the use of four stainless-steel vacuum ball milling vials and stainless-steel milling balls. The ball-to-powder weight ratio was 15:1. The milling balls with 3 and 6 mm in radius were used. The milling balls with different sizes for more accidental collisions can provide more energy to powder particles [26] and can also give rise to less adhesion of particles on the surfaces of the milling vial and balls [27]. The MA process was carried out at a rotating speed of 500 rpm for milling time up to 70 h. This process was interrupted at the milling time of 2, 5, 10, 20 and 40 h for extracting a small amount of as-milled powder particles. The ball milling machine turned clockwise for 15 min and then counterclockwise for 15 min, alternatively. In order to prevent particle contamination by air, the vial was vacuumized and then filled with high-purity argon in the pressure of about 0.05 MPa. This operation was repeated three times [12,18].
The blend powders were characterized by X-ray diffractometer (XRD, Panalytical X’Pert PRO, Malvern Panalytical, Almelo, The Netherlands) with Cu Kα (λ = 0.15418 nm) radiation to analyze the changes of phase constituents. The normalized RIR (reference integrity rational) method was used to estimate the mass fraction changes of Nb, Ti, and Si phases during ball milling. We used JADE 6.5 XRD analysis software (Materials Data Inc., Livermore, CA, USA) with the PDF2 database, which used corundum as a reference material to determine the RIR value. The full width at half maximum of the X-ray diffractometer peak was calibrated by using the standard sample (Silicon-640). The lattice parameter was analyzed by JADE 6.5 software based on diffraction peak fitting. The crystallite sizes and internal strain were assessed by JADE 6.5 software based on full width at half maximum (FWHM) method.
The evolutions of powder morphology and microstructure were observed by scanning electron microscope (SEM, TESCAN MIRA3, TESCAN Company, Brno, Czech Republic). The compositional change of the blend powders was analyzed using Inca X-sight energy dispersive spectroscopy (EDS, TESCAN Company, Brno, Czech Republic). In order to prepare the specimen for SEM microstructural analysis, the ball-milled powders and the Bakelite powders were fully mixed first, then the mixed powders were hot-pressed into a bulk sample using a mounting machine at 150 °C for 5 min.
The refined microstructure of particles was examined by a transmission electron microscope (TEM, FEI Tecnai F30 G2, FEI Company, Hillsboro, OR, USA) equipped with an electron energy loss spectroscopy (EELS) system operating at 300 KV. In order to fully disperse the powder particles and clean their surfaces for TEM observation, we first put the powders in alcohol with ultrasonic vibration for 15 min. After the powders were settled, the excess alcohol solution was sucked out using a suction pipe, and then the powders were placed in a sealed drying box for 2 h. Thereafter, a layer of treated powder particles was laid between two aluminum foils, and then pressed in a press machine (with the pressure of 150 MPa and holding time of 10 min) so that the powder particles were embedded in the aluminum foils. This foil was further manually ground using 3000# sandpaper until its thickness was reduced to 30 μm and then made into the TEM specimen by ion thinning.
The thermal stability of the as-milled powders was investigated using a German STA 449C synchrotron differential scanning calorimetry (DSC, NETZSCH Group, Selb, Bavaria, Germany) with the temperature range of 300~1400 K and the heating rate of 20 K/min under the protection of Aratmosphere.XRD characterization was carried out for the sample quenched from the position immediately after the exothermic peak.
The hardness of the powders was tested using an HMV-2T micro Vickers indenter (Shimadzu Corp., Nakagyo-ku, Kyoto, Japan) with the loading pressure of 490.3 mN and holding time of 15 s. The preparation method of the specimen used for hardness test is consistent with that of the specimen used for the above SEM microstructure analysis. Vikers microhardness test was performed on mirror finished surface of the bulk sample. In order to avoid the influence of bakelite powders on the microhardness of powder particles, the hardness test was carefully carried out on individual particles within the hot-pressed bulk sample. Besides, to reduce the experimental error, the microhardness test of the same powder was performed 10 times, and then the average value was employed.
3. Results and Discussion
3.1. Microstructural and Morphological Evolution of the Powders during Milling
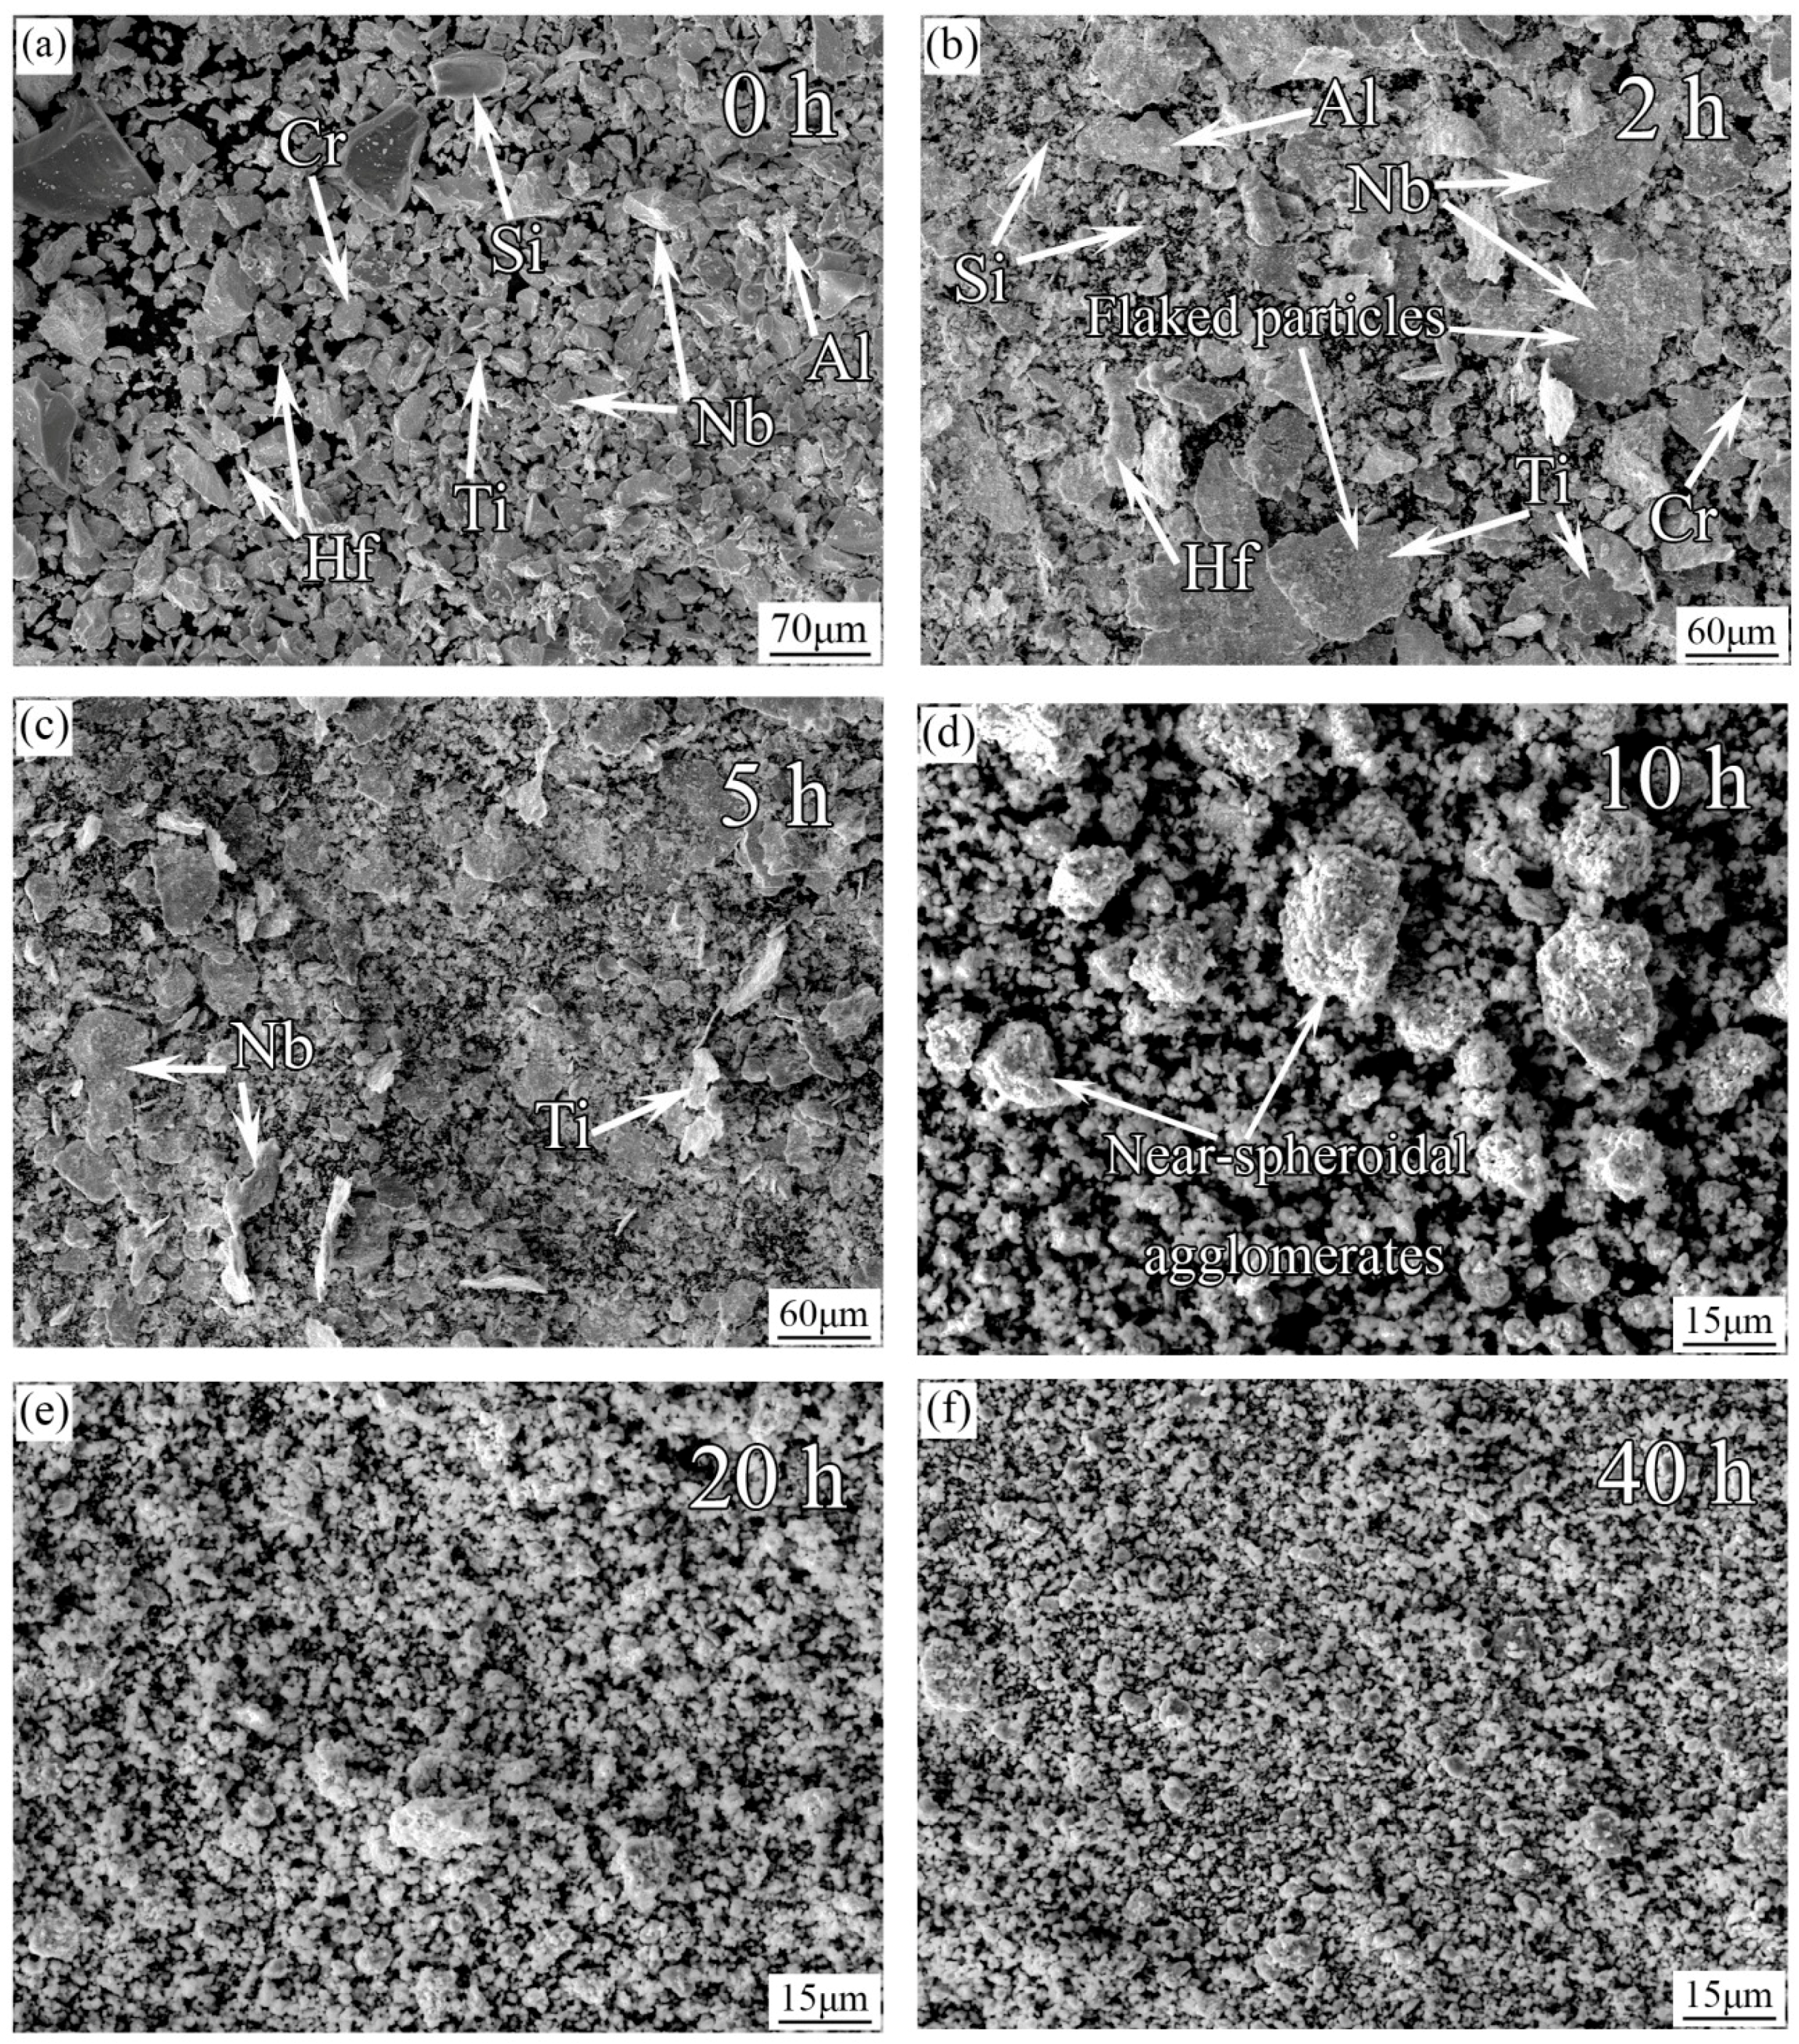
Figure 1 shows the SEM images of powder particles after ball milling for different times at 500 rpm. According to the EDS analysis, the particle types after different ball milling time are marked in Figure 1. Figure 1a presents the morphology of the original particle blends. After ball milling for 2 h (Figure 1b), some large flaked particles are observed, due to the fact that Nb, Ti and other ductile particles in the powder mixtures undergo micro-forging under the impact of milling balls. At the same time, a portion of brittle particles (such as Si) still maintain their original shape and size, while the other portion breaks up to form smaller particles, thereby resulting in a non-uniform particle size distribution at this stage, as shown in Figure 1b. After ball milling for 5 h (Figure 1c), the powder mixtures are still mainly composed of flaked particles and fine granular particles, but the size of the former is markedly reduced compared to the case of milling for only 2 h. This is because, under the continuous impact of milling balls perpendicular to the plane of the flaked particles, the thickness of these particles continuously decreases until they break into smaller-sized flaked particles or fine granular particles. When the milling time increases to 10 h, the powder particles still exhibit non-uniform size distribution, since the powders are continuously broken into fine granular particles meanwhile some fine particles aggregate due to cold welding to form nearly spherical large particles, as shown in Figure 1d. With further prolonging of the milling time to 20 h and 40 h (Figure 1e,f, respectively), the powder particles are further refined. Meanwhile, the agglomerated particles are broken into fine ones, resulting in a reduced amount of agglomerated particles and thus a more uniform and fine particle size distribution.
In order to obtain a better understanding of the effect of MA process on the evolution of particle microstructure, the cross-sectional microstructure of the powders after ball milling for different times was analyzed through back-scattered electron (BSE) images, as shown in Figure 2. It is obvious that the powders after 2 h ball milling mainly consist of elemental particles, in which the Nb, Ti, Cr and other ductile particles are flaked under the collision between powders and milling balls, as shown in Figure 2a. In addition, a small amount of typical lamellar microstructural composite particles are also observed in these powders. After 5 h ball milling (Figure 2b), the powders are in the form of composite particles with a significantly finer lamellar microstructure and some large-sized elemental particles (such as Nb, Ti, etc.) inside. As the ball milling time increases to 10 h, the composite particles still contain fine lamellar microstructure and some small elemental particles. However, the lamellae are too thin to identify their boundaries, as shown in Figure 2c. After ball milling for 20 h or more (Figure 2d,e), there is no contrast difference in the cross-sectional BSE images of the powder particles, and the typical lamellar microstructure disappears completely and a very uniform microstructure is formed. Further EDS analysis shows that the compositions of the frame selected areas in Figure 2d,e are Nb–18.9Ti–14.3Si–4.9Cr–2.9Hf–2.9Al and Nb–19.6Ti–15.1Si–5.3Cr–2.9Hf–3.1Al, respectively, which are close to the nominal value (Nb–20Ti–15Si–5Cr–3Hf–3Al) of the powder mixture composition. This means that after 20 h ball milling at 500 rpm, each component is uniformly mixed in the powder particles.
Figure 3 shows the XRD patterns of powders after different ball milling time. It is clear that all elemental phases are detected in the raw mixed powders. After 2 h ball milling, the diffraction peaks of Nb, Ti, Si, Cr, Hf, and Al still exist. As the ball milling time increases to 10 h, the diffraction peaks of Ti, Si, Cr, Hf, and Al have weakened or even disappeared, while those of Nb shift toward higher 2θ angles, indicating that the lattice parameters of Nb are reduced. This is due to the fact that the atomic size of elements such as Ti, Si and Cr are smaller than that of Nb, and therefore these atoms are dissolved in the Nb lattice during milling to form a substitutional solid solution, resulting in a decrease of Nb lattice parameters. After milling for 20 h, all the diffraction peaks except for those of Nb disappear, and those of Nb shift towards a higher 2θ angle, which means that more atoms of Ti, Si, Cr, etc. are dissolved in the Nb lattice to form the supersaturated Nbss with even smaller lattice parameters. Moreover, the diffraction peaks of Nb are widening and their intensity decreases continuously with increase in ball milling time, which is due to the refinement of Nb grains and the increase of microstrain inside the grains [28,29]. The mechanism of grain refinement and microstrain increase during milling was previously studied by Fecht [30] and Xun et al. [31]. It is concluded that, under the action of ball milling medium, local deformation initially occurs in shear bands with high dislocation densities. With further milling, these dislocations combine to form small-angle grain boundaries, which are then transformed into large-angle grain boundaries, further leading to grain refinement. At the same time, the milling balls and powder particles continuously collide and squeeze during ball milling, resulting in serious plastic deformation and thereby the increase of microstrain. When the milling time increases from 10 to 20 h, the widening of Nb diffraction peaks is the most obvious, which suggests that the grain refinement and microstrain increase of Nb mainly occur at this stage. With further increase of ball milling time to 40 h, the diffraction peaks of Nb (200), (211), and (220) crystal planes also disappear completely while in the diffraction position of Nb (110) crystal plane, only a single broad and a diffuse halo pattern is detected, indicating that the powder particles exist in the amorphous form.
Figure 4 shows the estimated mass fractions of Nb, Ti and Si phases as a function of milling time using the normalized RIR method. One can see that, during the initial milling stage, with prolonging the milling time, the mass fraction of Nb phase increases, while those of Ti and Si phases decrease. During milling for 10 to 20 h, the mass fraction of Nb phase exhibits a minor increase, while those of Ti and Si phases remain nearly invariable and are almost equal. When the milling time exceeds 20 h, amorphous phase appears in the powder, and the corresponding mass fractions of different phases are not calculated.
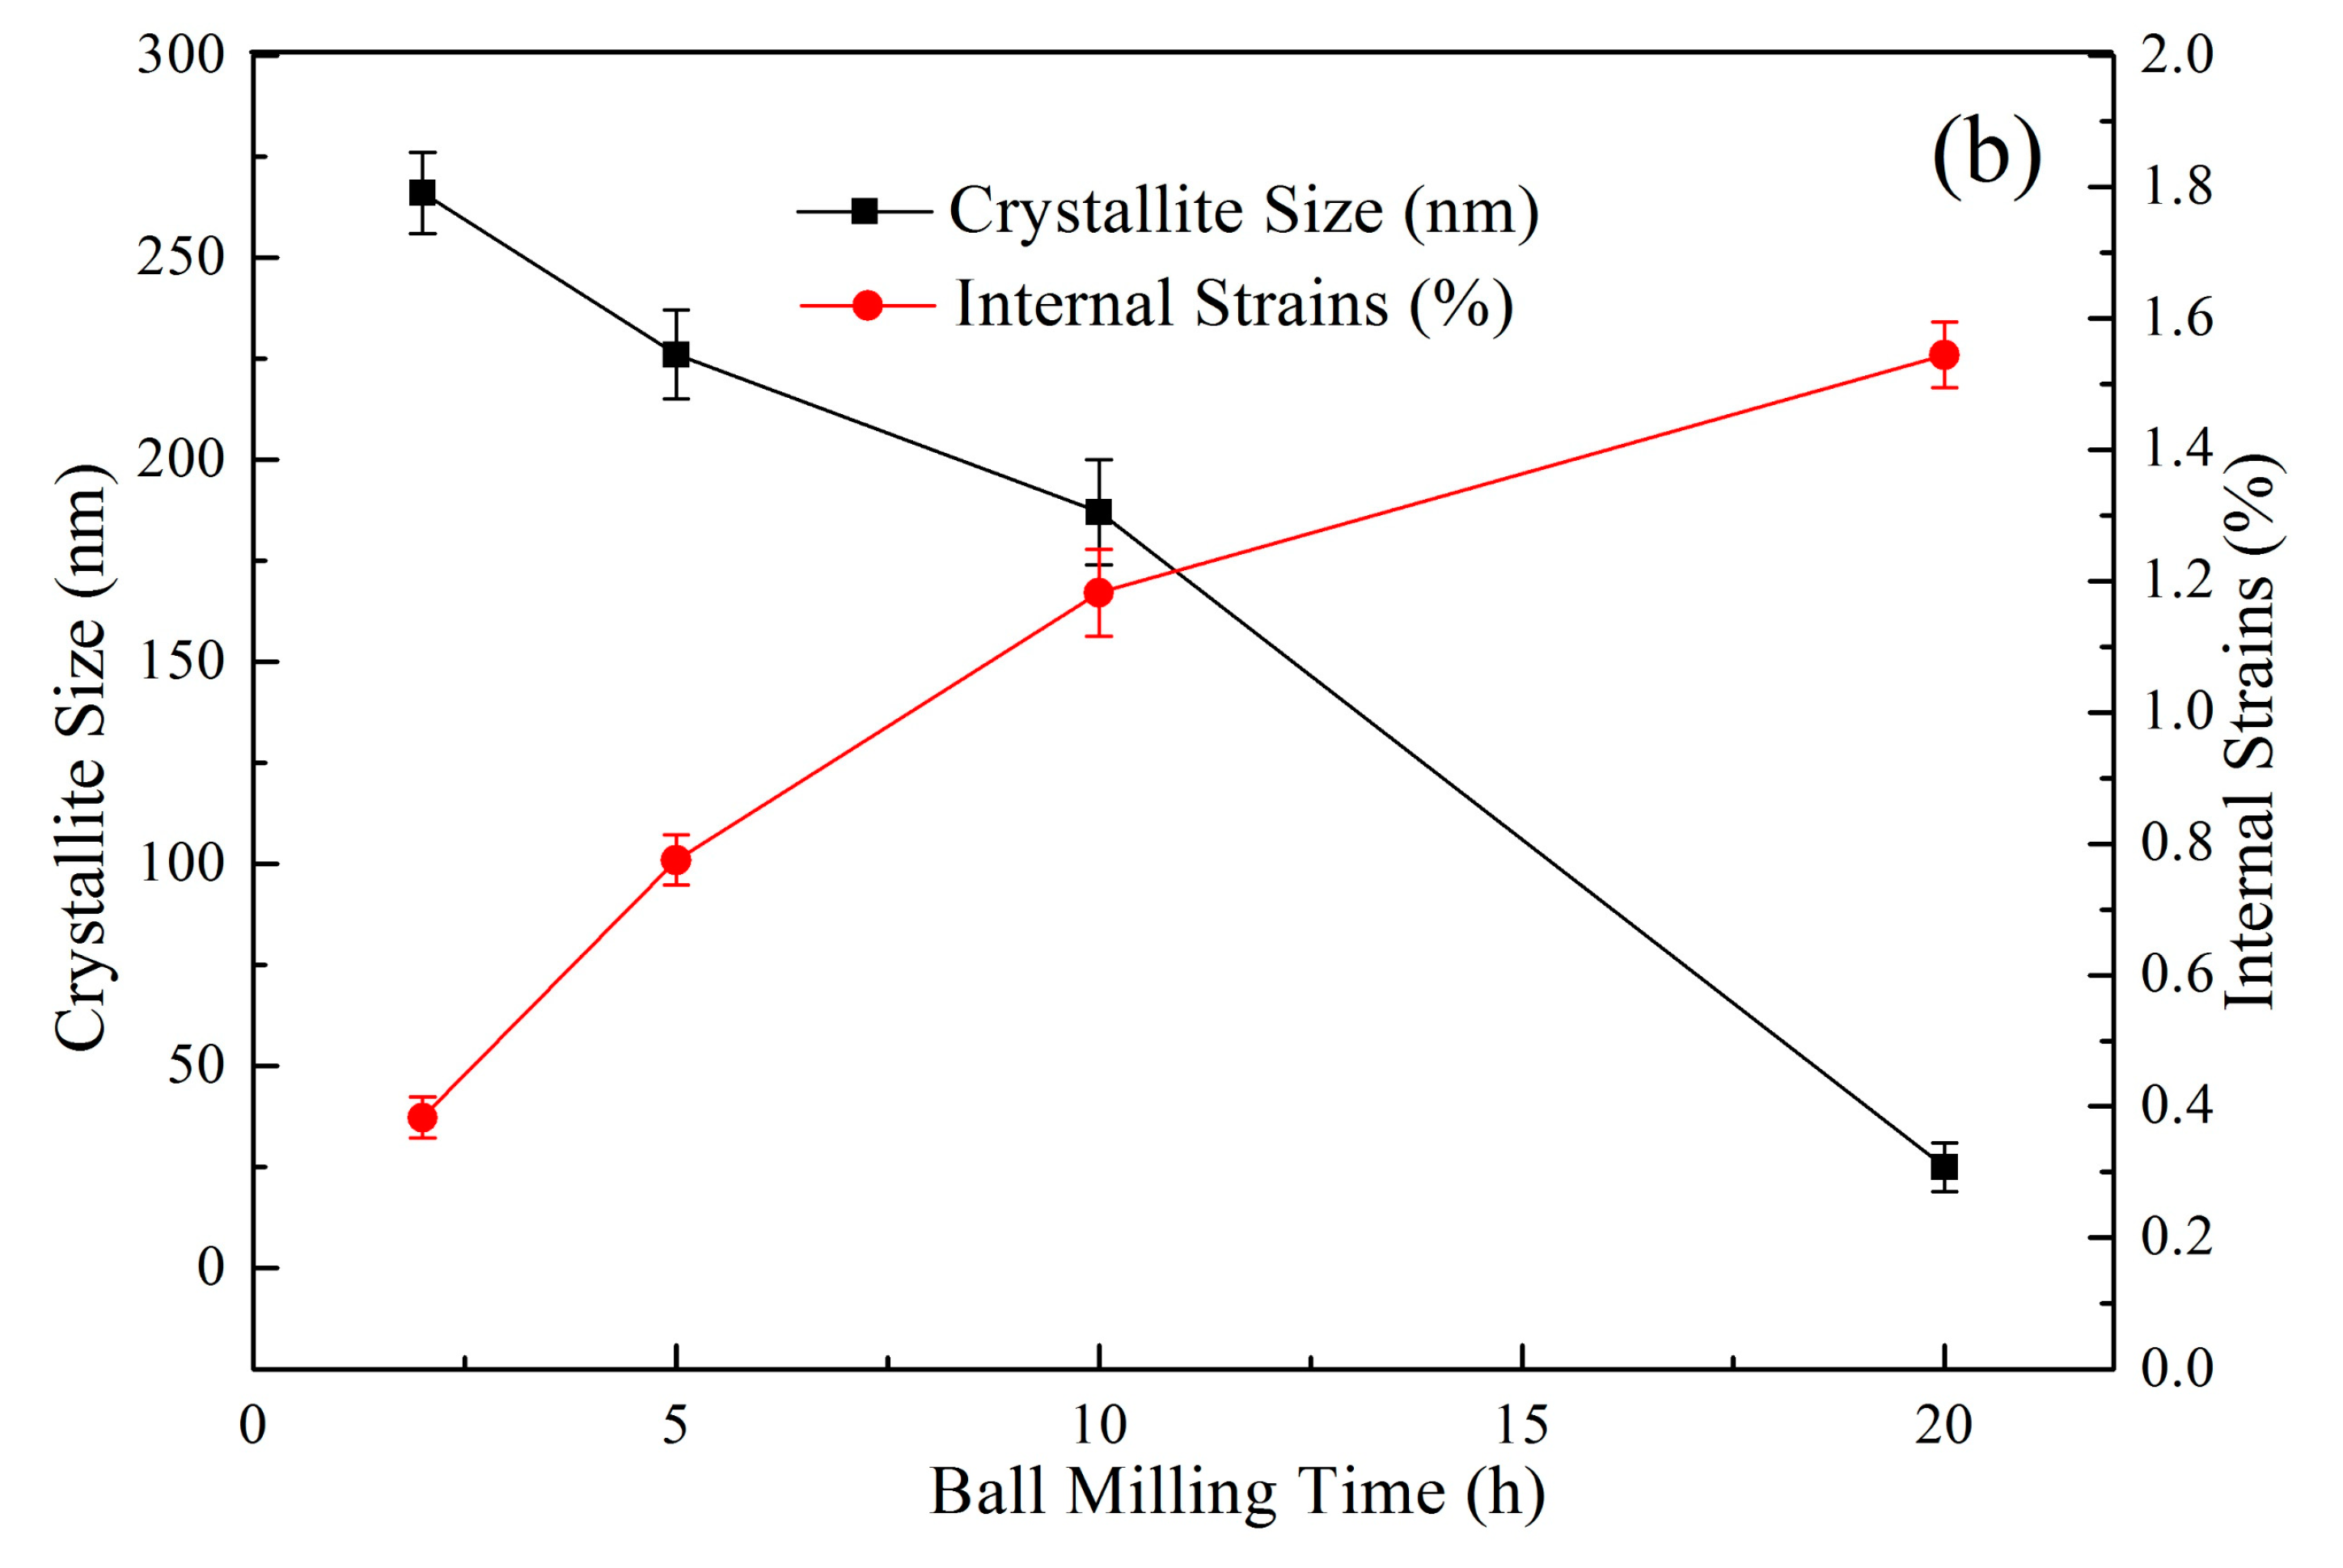
In order to manifest more intuitively the structural and microstructural information during ball milling, we calculated the lattice parameter, crystallite size and internal strain of Nbss after ball milling for different times based on the XRD data, as shown in Figure 5. Considering that amorphous phase formation occurs when the ball milling time exceeds 20 h, it is pretty hard to obtain the values of these three parameters from the XRD data. Therefore, only the situation before 20 h is concerned. Obviously, with the prolonging of milling time, both the lattice parameter (Figure 5a) and the crystallite size (Figure 5b) decrease while the internal strain (Figure 5b) increases. The evolution of these three parameters with milling time is consistent with the results directly observed according to the XRD diffraction peak changes described above.
In order to further confirm the XRD results and reveal the microstructure change of powder particles during ball milling, TEM analysis was carried out on the powders after ball milling for 20 h and 40 h, respectively. Figure 6a–c show the BF-TEM (bright field TEM) images, the corresponding selected area electron diffraction (SAED) image and HRTEM (high-resolution TEM) image, respectively, of the powders after ball milling for 20 h. The diffraction patterns obtained by fast Fourier transform (FFT) in different regions of HRTEM image are inserted in Figure 6c, as shown in Figure 6(c1,c2). The fine grains with typical characteristics of as-milled particles are displayed in the BF-TEM image (Figure 6a). The SAED pattern (Figure 6b) clearly demonstrates the polycrystalline characteristics of the powders. The diffraction rings of the Nb (110), (200), (211), (220), (310), (222), and (321) crystal planes are apparent. However, no diffraction rings or spots of other elements, such as Ti, Si, or Cr, are found, which further verifies that the supersaturated Nbss are formed in the powders after 20 h milling. Note that the interplanar spacing of the Nb (110) crystal plane (Figure 6c) is less than its standard value (0.233), which means Nb’s lattice parameter is reduced due to the formation of Nbss by dissolving Ti ,Si, and Cr atoms with smaller atomic radius in the Nb lattice. From Figure 6c,(c1), it can be seen that most of the regions within the powder particles have Nb diffraction spots, indicating that the powder particles still have a crystal structure. However, diffusion halos are shown in some regions of the powder particles (Figure 6c,(c2)), which means that the atoms in these regions are arranged in a disordered state, indicating that after 20 h of milling, the amorphous phase begins to form in the powders.
The BF-TEM, corresponding SAED and HRTEM images of the powders after ball milling for 40 h are shown in Figure 7a–c, respectively. From Figure 7a, it can be seen that the powder particles after 40 h milling did not demonstrate a typical crystal structure. The amorphous formation is further supported by the SAED image (Figure 7b) in which only diffusion halos are found without any electron diffraction spots or rings. The above viewpoint is further confirmed by the HRTEM image (Figure 7c). Therefore, it can be concluded that after 40 h milling, almost all the powder particles are presented in an amorphous state.
3.2. Thermal Stability of the As-Milled Powders
The thermodynamic stability of powder particles after different milling time (2, 20 and 40 h) was investigated respectively by DSC, which was performed under the protection of Ar atmosphere with the heating rate of 20 K/s, as shown in Figure 8. XRD characterization was carried out in the sample quenched from a position immediately after the exothermic peak, as shown in Figure 9. From the DSC curves (Figure 8), for all the above three powders, a broad exothermic peak with a large temperature span appears in the temperature range of 500–700 K, while being weakened with the decrease in ball milling time. XRD analysis of the samples quenched at 700 K shows that the powders retain their original phase constituent (Figure 9), suggesting that this exothermic process doesn’t involve phase transformation. Therefore, this exothermic peak should be solely due to the release of distortion energy stored in the as-milled particles that arises from the microstrain generated by the severe plastic deformation of powder particles during ball milling. This thermal phenomenon can be classified as a typical thermal reaction of as-milled powder particles. It is also noted that similar exothermic phenomena caused by distortion energy release are found in some other as-milled alloy powders [32,33,34].
As shown in Figure 8, when the temperature continues to rise, there is no other thermal phenomenon on the powder after 2 h milling, indicating that it still maintains the initial phase components after the DSC run, whereas for both those milled for 20 and 40 h, an extra exothermic peak is obvious. Further inspection shows that the powder after 40 h milling exhibits observable glass transition temperature Tg and amorphous-crystallization initial temperature Tx, and a relatively wide undercooled liquid region (ΔT = Tx − Tg ≈ 43 K), which were determined by the tangent method, as shown in the enlarged view of local area of the DSC curve in Figure 8. No such phenomena are found for the powders after milling for 20 h, which may be caused by the much lower amorphous content contained. According to Inoue’s empirical rule [35,36], the glass transformation capability of amorphous phases is dependent on the amount of alloying elements, the mismatch of atomic sizes, and the mixing enthalpy between alloying elements. In view of this, such a relatively large undercooled liquid region here is due to the numerous alloying elements (e.g., Ti, Cr, Si, etc.) and the large atomic size mismatch between these elements. For the powders after 40 h milling, according to the XRD pattern of its quenched sample at 1200 K (Figure 9), Nbss and γ-Nb5Si3 are formed after the amorphous crystallization. Taking into account that there is only one exothermic peak associated with amorphous crystallization in the DSC curve (Figure 8), these two phases should precipitate simultaneously, which is in line Furthermore the fact that the alloy composition used in this study is just at the eutectic point [5,37,38]. Besides, it is obvious that the exothermic peak at about 1100 K is broadening. This might be attributed to the low crystallization kinetics due to the reduction of the crystalline growth rate as well as the presence on Nb, which inhibits the grain growth. Analogously, the powders after ball milling for 20 h contain Nbss and γ-Nb5Si3 after undergoing the second-stage exotherm (Figure 9). Therein, the diffraction peak intensity of γ-Nb5Si3 is pretty weak, indicating that the powders are mainly composed of Nbss, due to the low amorphous phase content and the insufficient temperature at this stage to completely precipitate γ-Nb5Si3 from supersaturated Nbss. In addition, the diffraction peak of Nbss has no apparent widening but is still shifted to a higher angle by reference to the standard diffraction peak position (the dotted line in Figure 9); even so, a shifting to a lower angle is still displayed compared with the as-milled state. Based on the above analysis, for the powder after ball milling for 20 h, the second-stage exotherm during DSC should therefore be contributed by the grain growth of Nbss (as evidenced by the sharping of the corresponding peaks), the precipitation of a small amount of γ-Nb5Si3 from supersaturated Nbss or the amorphous crystallization.
3.3. Mechanical Behavior of the As-Milled Powders
The Vickers microhardness variation of powder particles during ball milling is depicted in Figure 10. Table 1 shows the calculated standard deviation (SD) and relative standard deviation (RSD) of the microhardness values. Obviously, with the increase in ball milling time, the dispersity of microhardness values measured at the same time gradually decreases.
In the initial stage of milling, the Vickers micro-hardness increases with the increase in ball milling time, which is mainly attributable to the work hardening of powders [39,40]. According to the mechanism of grain refinement during the ball milling process [30,31], the change of internal strain is prior to that of crystallite size. Therefore, in the initial stage of milling, the increase in internal strain (meaning work hardening) plays a more important role in improving microhardness compared to grain refinement (meaning grain boundary strengthening). As the milling proceeds, the effect of grain refinement is gradually enhanced, even comparable to the increase in internal strain. With further prolonging the ball milling time, the increasing rate of microhardness is reduced, as a result of the decrease in both grain refinement rate and internal strain increasing rate, as illustrated in the stage of milling for 10 to 20 h in Figure 10. When the milling time exceeds 20 h (Figure 10), the microhardness of the powder is again significantly increased, which is possibly caused by the large amount of amorphous phase formation at this stage.
4. Conclusions
When the powders are milled at 500 rpm, the alloying elements, including Ti, Si and Cr etc., continue to dissolve into the Nb lattice, resulting in the formation of the supersaturated Nbss after 20 h and then the full amorphization of this alloy after 40 h. Meanwhile, as the milling time increases, the morphology of the powder evolves from flakes to aggregates and finally to refined granules, accompanied with the change in the cross-sectional microstructure from lamellae to uniform structure. In the DSC process, the strain energy stored in the as-milled powders is released first; with increase in DSC heating temperature, the powders after milling for 40 h undergo crystallization of the amorphous phase to form Nbss and γ-Nb5Si3, while for those after 20 h milling, only small amount of γ-Nb5Si3 precipitates form in the matrix of Nbss but with significant grain coarsening of Nbss grains. A remarkable increase in Vickers microhardness is observed when large amount of amorphous phases are formed inside the Nb-Ti-Si based alloy powders during milling.
Author Contributions
X.G. conceived and designed the experiments and supervised the data analysis; L.Z. carried out the experiments and analysis of the experimental data. L.Z. wrote this manuscript; X.G. revised this manuscript.
Funding
This research was funded by the National Key R&D Program of China (No. 2017YFB0702903), the National Natural Science Foundation of China (Nos. 51431003 and U1435201), the Research Fund of the State Key Laboratory of Solidification Processing (NWPU), China (Grant No. 143-TZ-2016), and the Doctorate Foundation of Northwestern Polytechnical University (CX201229).
Conflicts of Interest
The authors declare no conflict of interest.
References
- Zhang, S.; Guo, X.P. Effects of Cr and Hf additions on the microstructure and properties of Nb silicide based ultrahigh temperature alloys. Mater. Sci. Eng. A 2015, 638, 121–131. [Google Scholar] [CrossRef]
- Bewlay, B.P.; Jackson, M.R.; Zhao, J.C.; Subramanian, P.R.; Mendiratta, M.G.; Lewandowski, J.J. Ultrahigh-temperature Nb-silicide-based composites. MRS Bull. 2003, 28, 646–653. [Google Scholar] [CrossRef]
- Bewlay, B.P.; Jackson, M.R.; Lipsitt, H.A. The balance of mechanical and environmental properties of a multielement niobium-niobium silicide-based in Situ composite. Metall. Mater. Trans. A 1996, 27, 3801–3808. [Google Scholar] [CrossRef]
- Schlesinger, M.E.; Okamoto, H.; Gokhale, A.B.; Abbaschian, R. The Nb-Si (niobium-silicon) System. J. Phase Equilib. 1993, 14, 502–509. [Google Scholar] [CrossRef]
- Zhang, S.; Guo, X.P. Effects of B addition on the microstructure and properties of Nb silicide based ultrahigh temperature alloys. Intermetallics 2015, 57, 83–92. [Google Scholar] [CrossRef]
- Bewlay, B.P.; Jackson, M.R.; Zhao, J.C.; Subramanian, P.R. A review of very-high-temperature Nb-silicide-based composites. Metall. Mater. Trans. A 2003, 34, 2043–2052. [Google Scholar] [CrossRef]
- Kim, W.Y.; Tanaka, H.; Hanada, S. Microstructure and high temperature strength at 1773 K of Nbss/Nb5Si3 composites alloyed with molybdenum. Intermetallics 2002, 10, 625–634. [Google Scholar] [CrossRef]
- Hong, Z.; Zhang, H.; Weng, J.F.; Su, L.F.; Li, Z.; Jia, L.N. Oxidation behavior of Nb-24Ti-18Si-2Al-2Hf-4Cr and Nb-24Ti-18Si-2Al-2Hf-8Cr hypereutectic alloys at 1250 °C. Rare Met. 2017, 36, 168–173. [Google Scholar] [CrossRef]
- Guo, H.S.; Guo, X.P. Microstructure evolution and room temperature fracture toughness of an integrally directionally solidified Nb-Ti-Si based ultrahigh temperature alloy. Scr. Mater. 2011, 64, 637–640. [Google Scholar] [CrossRef]
- Loginov, P.; Sidorenko, D.; Bychkova, M.; Petrzhik, M.; Levashov, E. Mechanical Alloying as an Effective Way to Achieve Superior Properties of Fe-Co-Ni Binder Alloy. Metals 2017, 7, 570. [Google Scholar] [CrossRef]
- Wang, X.L.; Zhang, K.F. Mechanical alloying, microstructure and properties of Nb-16Si alloy. J. Alloys Compd. 2010, 490, 677–683. [Google Scholar] [CrossRef]
- Wang, T.T.; Guo, X.P. Morphology and phase constituents of mechanically alloyed Nb-Ti-Si based ultrahigh temperature alloy powders. Rare Met. 2011, 30, 427–432. [Google Scholar] [CrossRef]
- Chaubey, A.K.; Scudino, S.; Khoshkhoo, M.S.; Prashanth, K.G.; Mukhopadhyay, N.K.; Mishra, B.K.; Eckert, J. Synthesis and Characterization of NanocrystallineMg-7.4%Al Powders Produced by Mechanical Alloying. Metals 2013, 3, 58–68. [Google Scholar] [CrossRef]
- Lei, R.S.; Wang, M.P.; Xu, S.Q.; Wang, H.P.; Chen, G.G. Microstructure, Hardness Evolution, and Thermal Stability Mechanism of Mechanical Alloyed Cu-Nb Alloy during Heat Treatment. Metals 2016, 6, 194. [Google Scholar] [CrossRef]
- Suryanarayana, C. Mechanical alloying and milling. Prog. Mater. Sci. 2001, 46, 1–184. [Google Scholar] [CrossRef]
- Dayani, D.; Shokuhfar, A.; Vaezi, M.R.; Rezaei, S.R.J.; Hosseinpour, S. Structural and Mechanical Evaluation of a Nanocrystalline Al-5 wt %Si Alloy Produced by Mechanical Alloying. Metals 2017, 7, 332. [Google Scholar] [CrossRef]
- Bertoli, I.R.; Ferreira, L.M.; de Freitas, B.X.; Nunes, C.A.; Ramos, A.S.; Filgueira, M.; dos Santos, C.; Ramos, E.C.T. Mechanical Alloying and Hot Pressing of Ti-Zr-Si-B Powder Mixtures. Metals 2018, 8, 82. [Google Scholar] [CrossRef]
- Zhang, L.J.; Guo, X.P. Mechanical alloying behavior of Nb-Ti-Si-based alloy made from elemental powders by ball milling process. Rare Met. 2017, 36, 174–182. [Google Scholar] [CrossRef]
- Schultz, L. Formation of amorphous metals by mechanical alloying. Mater. Sci. Eng. 1988, 97, 15–23. [Google Scholar] [CrossRef]
- Eleskandarany, M.S.; Aoki, K.; Suzuki, K. Calorimetric characterization of the amorphization process for rod milled Al50Nb50 alloy powders. Scr. Metall. Mater. 1991, 25, 1695–1700. [Google Scholar] [CrossRef]
- Perdigao, M.N.R.V.; Jordao, J.A.R.; Kiminami, C.S.; Botta, W.J. Phase transformation in Nb—16 at.% Si processed by high-energy ball milling. J. Non-Cryst. Solids 1997, 219, 170–175. [Google Scholar] [CrossRef]
- Koch, C.C.; Cavin, O.B.; Mckamey, C.G.; Scarbrough, J.O. Preparation of “amorphous” Ni60Nb40 by mechanical alloying. Appl. Phys. Lett. 1983, 43, 1017–1019. [Google Scholar] [CrossRef]
- Li, B.; Liu, L.; Ma, X.M. Amorphization in the Nb-Si system by mechanical alloying. J. Alloys Compd. 1993, 202, 161–163. [Google Scholar] [CrossRef]
- Li, B.; Ma, X.M.; Liu, L.; Qi, Z.Z.; Dong, Y.D. Investigation of amorphization of Nb-Si Alloys by mechanical alloying. Chin. Phys. Lett. 1994, 11, 681–684. [Google Scholar] [CrossRef]
- Lee, P.Y.; Lin, C.K.; Lin, H.M. Amorphization of transition meta-Si alloy powders by mechanical alloying. J. Appl. Phys. 1993, 74, 1362–1365. [Google Scholar] [CrossRef]
- Gavrilov, D.; Vinogradov, O.; Shaw, W.J.D. Simulation of mechanical alloying in a shaker ball mill with variable size particle. In Proceedings of the International Conference on Composite Materials, Whistler, BC, Canada, 14–18 August 1995. [Google Scholar]
- Takacs, L.; Pardavihorvath, M. Nanocomposite formation in the Fe3O4-Zn system by reaction milling. J. Appl. Phys. 1994, 75, 5864–5866. [Google Scholar] [CrossRef]
- Slama, C.; Abdellaoui, M. Microstructure characterization of nanocrystalline (Ti0.9W0.1) C prepared by mechanical alloying. Int. J. Refract. Met. Hard Mater. 2016, 54, 270–278. [Google Scholar] [CrossRef]
- Toor, I.U.H.; Ahmed, J.; Hussein, M.A.; Patel, F.; Al-Aqeeli, N. Phase evolution studies during mechanical alloying of Fe(82−x)-Cr18-Six (x = 0, 1, 2, 3) alloy. J. Alloys Compd. 2016, 683, 463–469. [Google Scholar] [CrossRef]
- Fecht, H.J. Nanostructure formation by mechanical attrition. Nanostruct. Mater. 1995, 6, 33–42. [Google Scholar] [CrossRef]
- Xun, Y.W.; Lavernia, E.J.; Mohamed, F.A. Synthesis of nanocrystalline Zn-22 Pct Al using cryomilling. Metall. Mater. Trans. A 2004, 35, 573–581. [Google Scholar] [CrossRef]
- Neamtu, B.V.; Isnard, O.; Chicinas, I.; Pop, V. Structural and magnetic properties of nanocrystalline NiFeCuMo powders produced by wet mechanical alloying. J. Alloys Compd. 2011, 509, 3632–3637. [Google Scholar] [CrossRef]
- Neamtu, B.V.; Marinca, T.F.; Chicinas, I.; Isnard, O.; Popa, F. Structural and magnetic characteristics of Co-based amorphous powders prepared by wet mechanical alloying. Adv. Powder Technol. 2015, 26, 323–328. [Google Scholar] [CrossRef]
- Neamtu, B.V.; Isnard, O.; Chicinas, I.; Vagner, C.; Jumate, N.; Plaindoux, P. Influence of benzene on the Ni3Fe nanocrystalline compound formation by wet mechanical alloying: An investigation combining DSC, X-ray diffraction, mass and IR spectrometries. Mater. Chem. Phys. 2011, 125, 364–369. [Google Scholar] [CrossRef]
- Inoue, A.; Zhang, T.; Masumoto, T. Glass-forming ability of alloys. J. Non-Cryst. Solids 1993, 156, 473–480. [Google Scholar] [CrossRef]
- Inoue, A. High strength bulk amorphous alloys with low critical cooling rates. Mater. Trans. JIM 1995, 36, 866–875. [Google Scholar] [CrossRef]
- Zhang, S.; Guo, X.P. Alloying effects on the microstructure and properties of Nb-Si based ultrahigh temperature alloys. Intermetallics 2016, 70, 33–44. [Google Scholar] [CrossRef]
- Zhang, S.; Guo, X.P. Microstructure, mechanical properties and oxidation resistance of Nb silicide based ultrahigh temperature alloys with Hf addition. Mater. Sci. Eng. A 2015, 645, 88–98. [Google Scholar] [CrossRef]
- Benjamin, J.S.; Volin, T.E. The mechanism of mechanical Alloying. Metall. Trans. 1974, 5, 1929–1934. [Google Scholar] [CrossRef]
- Suryanarayana, C.; Klassen, T.; Ivanov, E. Synthesis of nanocomposites and amorphous alloys by mechanical alloying. J. Mater. Sci. 2011, 46, 6301–6315. [Google Scholar] [CrossRef]
Figure 1.
SEM images of the powders after ball milling for different times at 500 rpm: (a) 0 h; (b) 2 h; (c) 5 h; (d) 10 h; (e) 20 h; and (f) 40 h.
Figure 1.
SEM images of the powders after ball milling for different times at 500 rpm: (a) 0 h; (b) 2 h; (c) 5 h; (d) 10 h; (e) 20 h; and (f) 40 h.

Figure 2.
Cross-sectional BSE images of the powders after ball milling for different times at 500 rpm: (a) 2 h; (b) 5 h; (c) 10 h; (d) 20 h; and (e) 40 h.
Figure 2.
Cross-sectional BSE images of the powders after ball milling for different times at 500 rpm: (a) 2 h; (b) 5 h; (c) 10 h; (d) 20 h; and (e) 40 h.

Figure 3.
XRD patterns of the powder particles after ball milling for different times at 500 rpm.
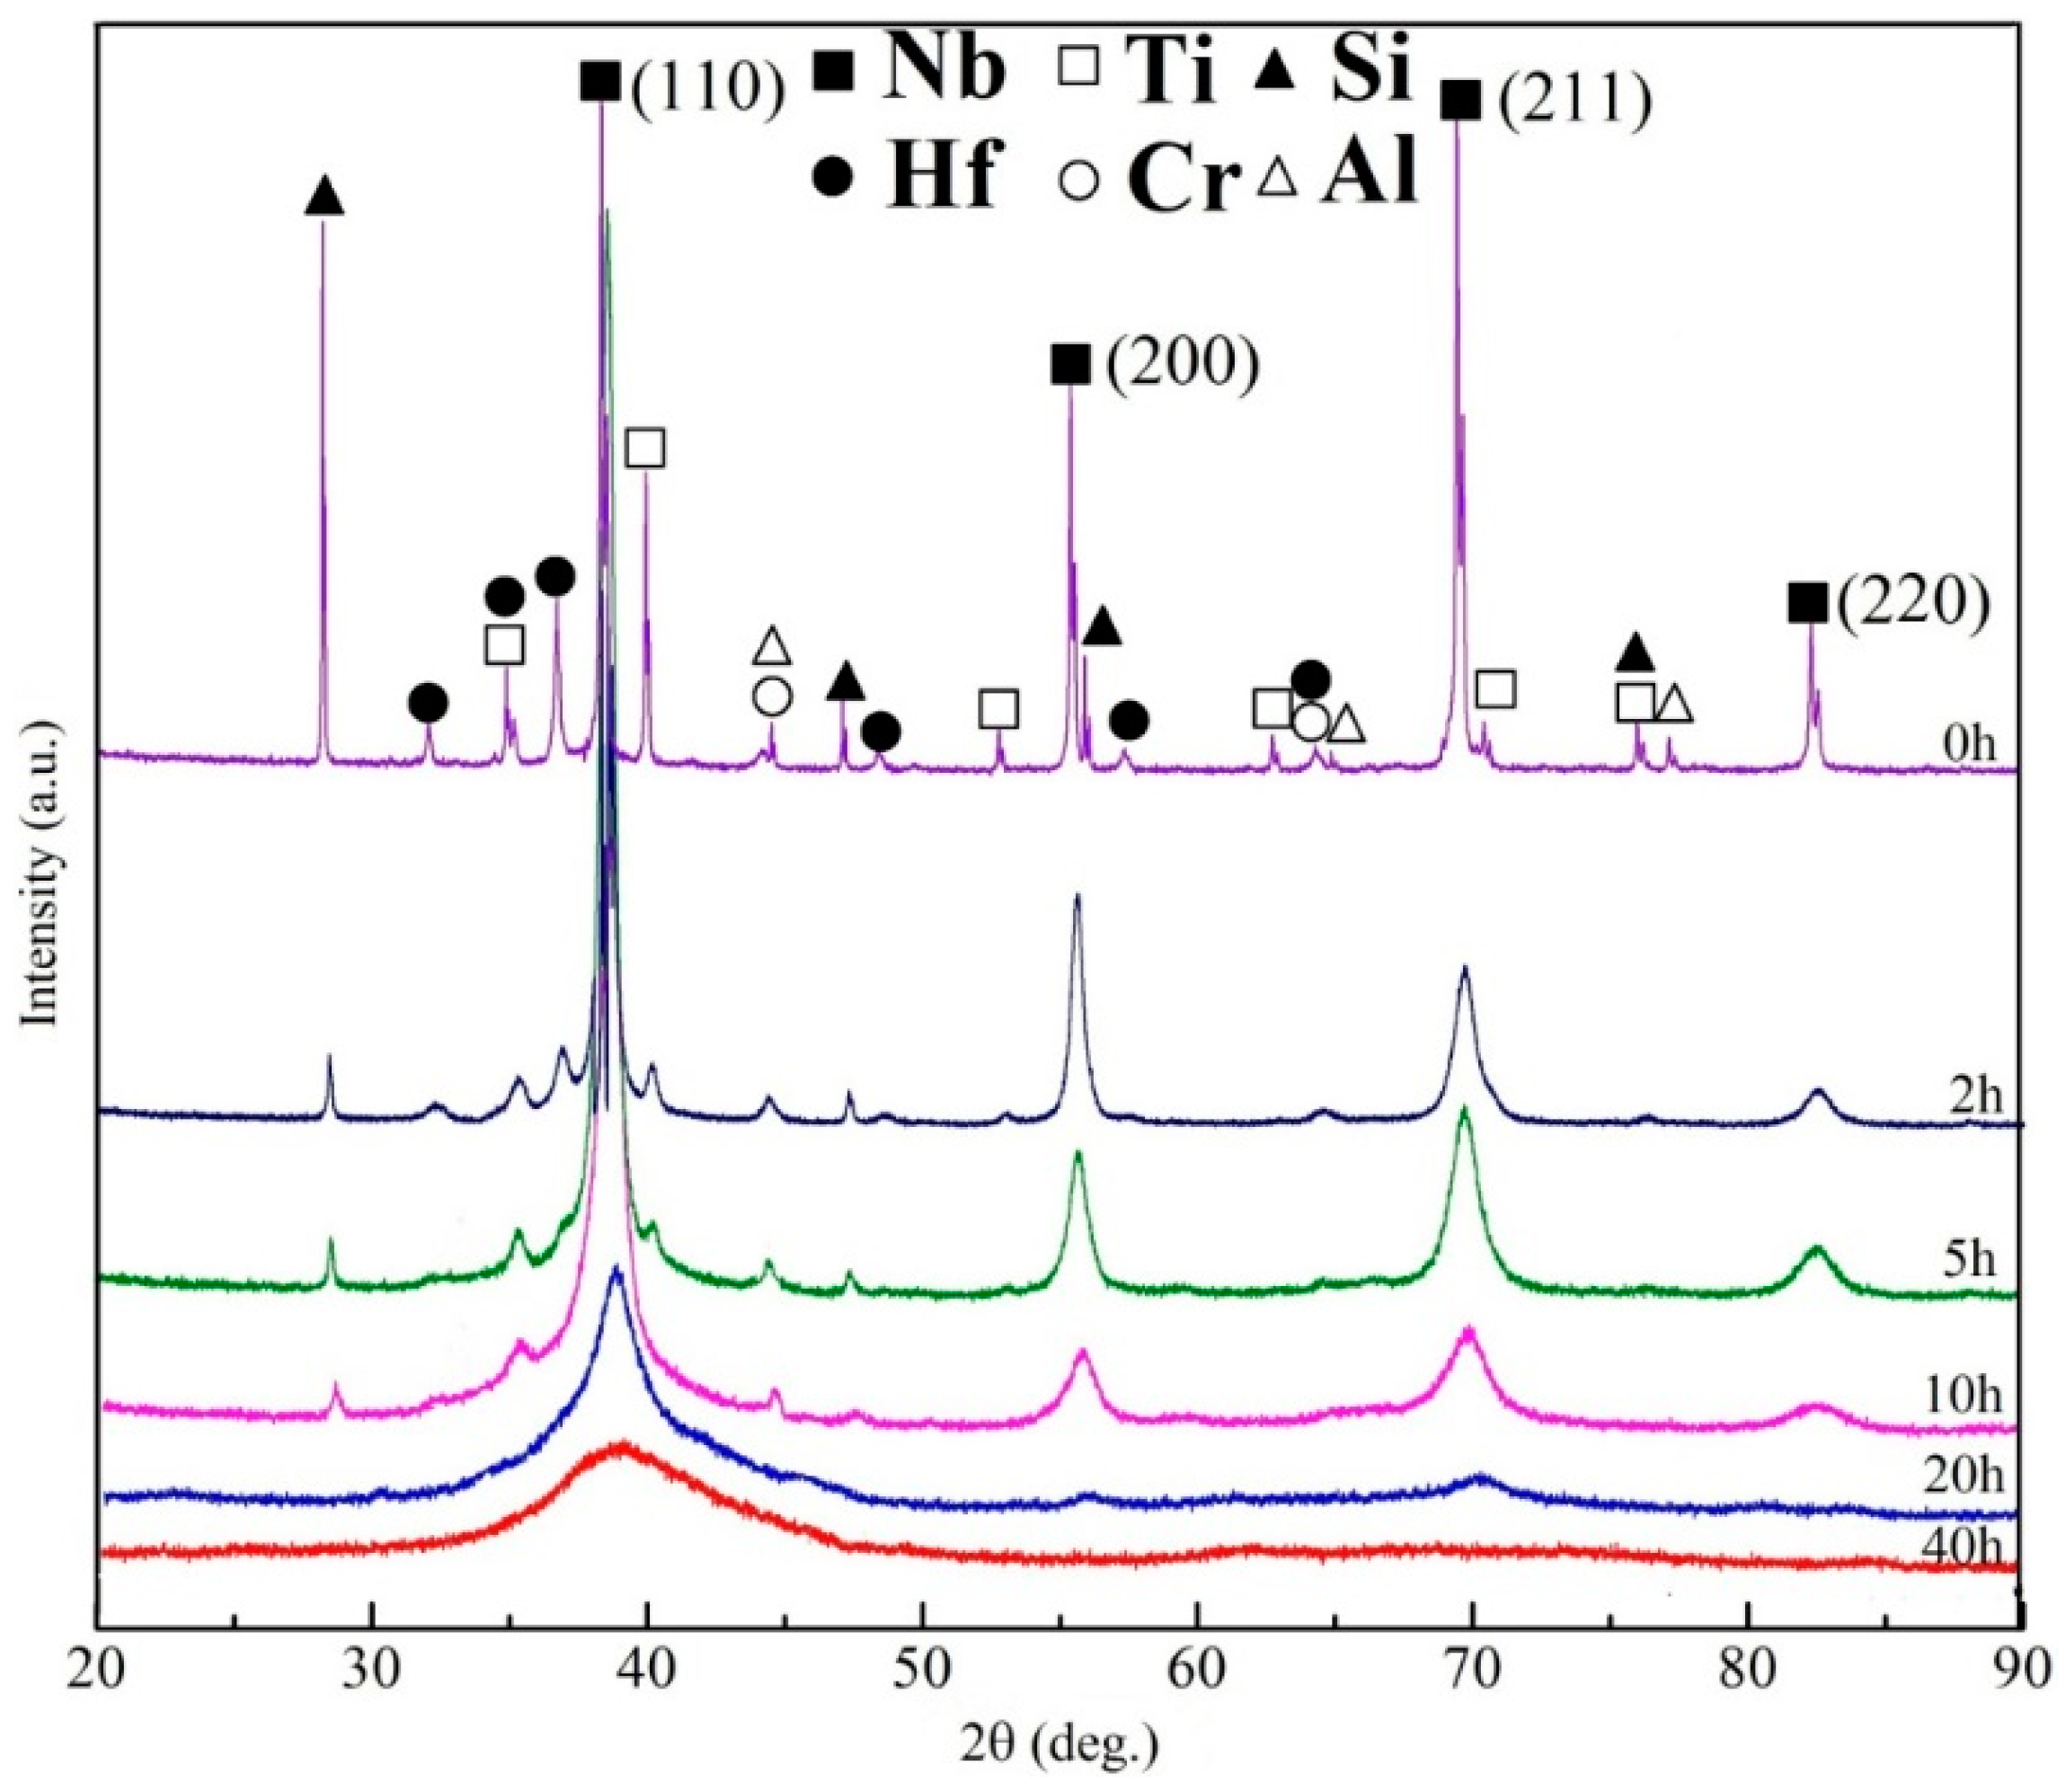
Figure 4.
Evolution of the mass fractions of Nb, Ti and Si phases during ball milling, estimated by the standard RIR method.
Figure 4.
Evolution of the mass fractions of Nb, Ti and Si phases during ball milling, estimated by the standard RIR method.
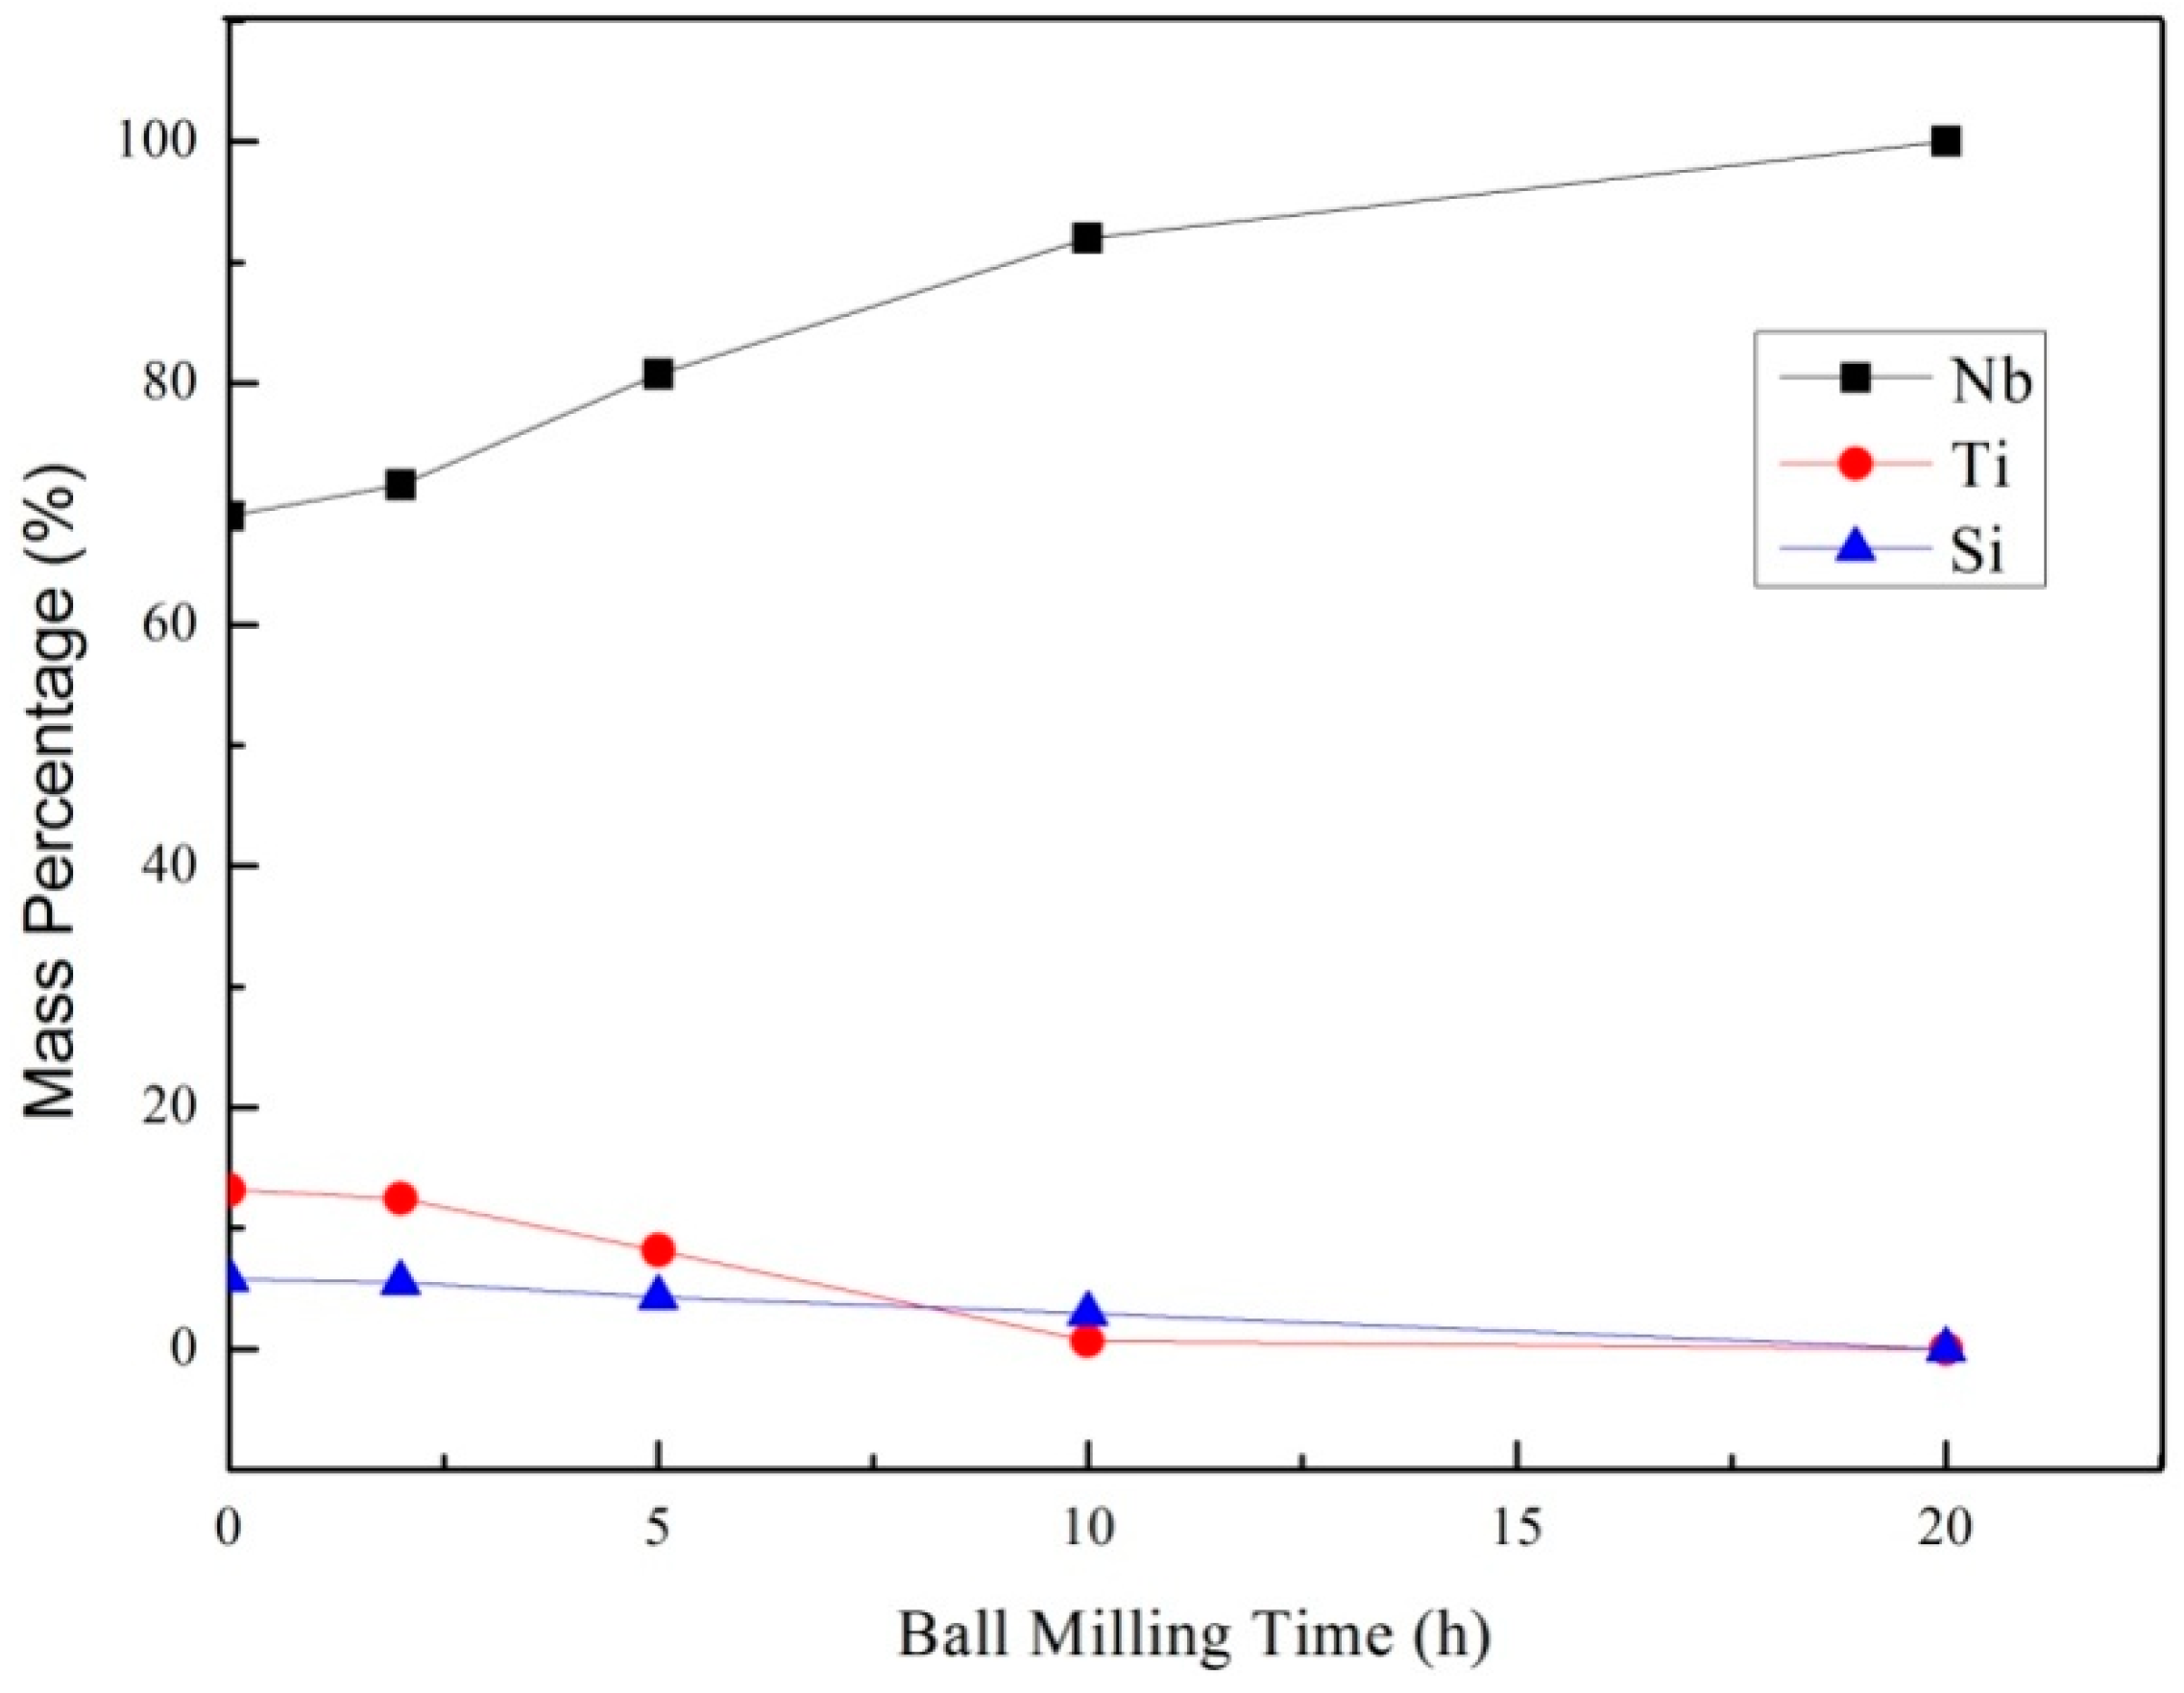
Figure 5.
Evolution of the (a) lattice parameter; (b) crystallite size and internal strain of Nbss grains with ball milling time, calculated based on the XRD data.
Figure 5.
Evolution of the (a) lattice parameter; (b) crystallite size and internal strain of Nbss grains with ball milling time, calculated based on the XRD data.


Figure 6.
(a) BF-TEM image; (b) corresponding SAED image; (c) HRTEM image, (c1,c2) FFT pattern in different regions of the HRTEM image for the powder particles after ball milling for 20 h at 500 rpm.
Figure 6.
(a) BF-TEM image; (b) corresponding SAED image; (c) HRTEM image, (c1,c2) FFT pattern in different regions of the HRTEM image for the powder particles after ball milling for 20 h at 500 rpm.
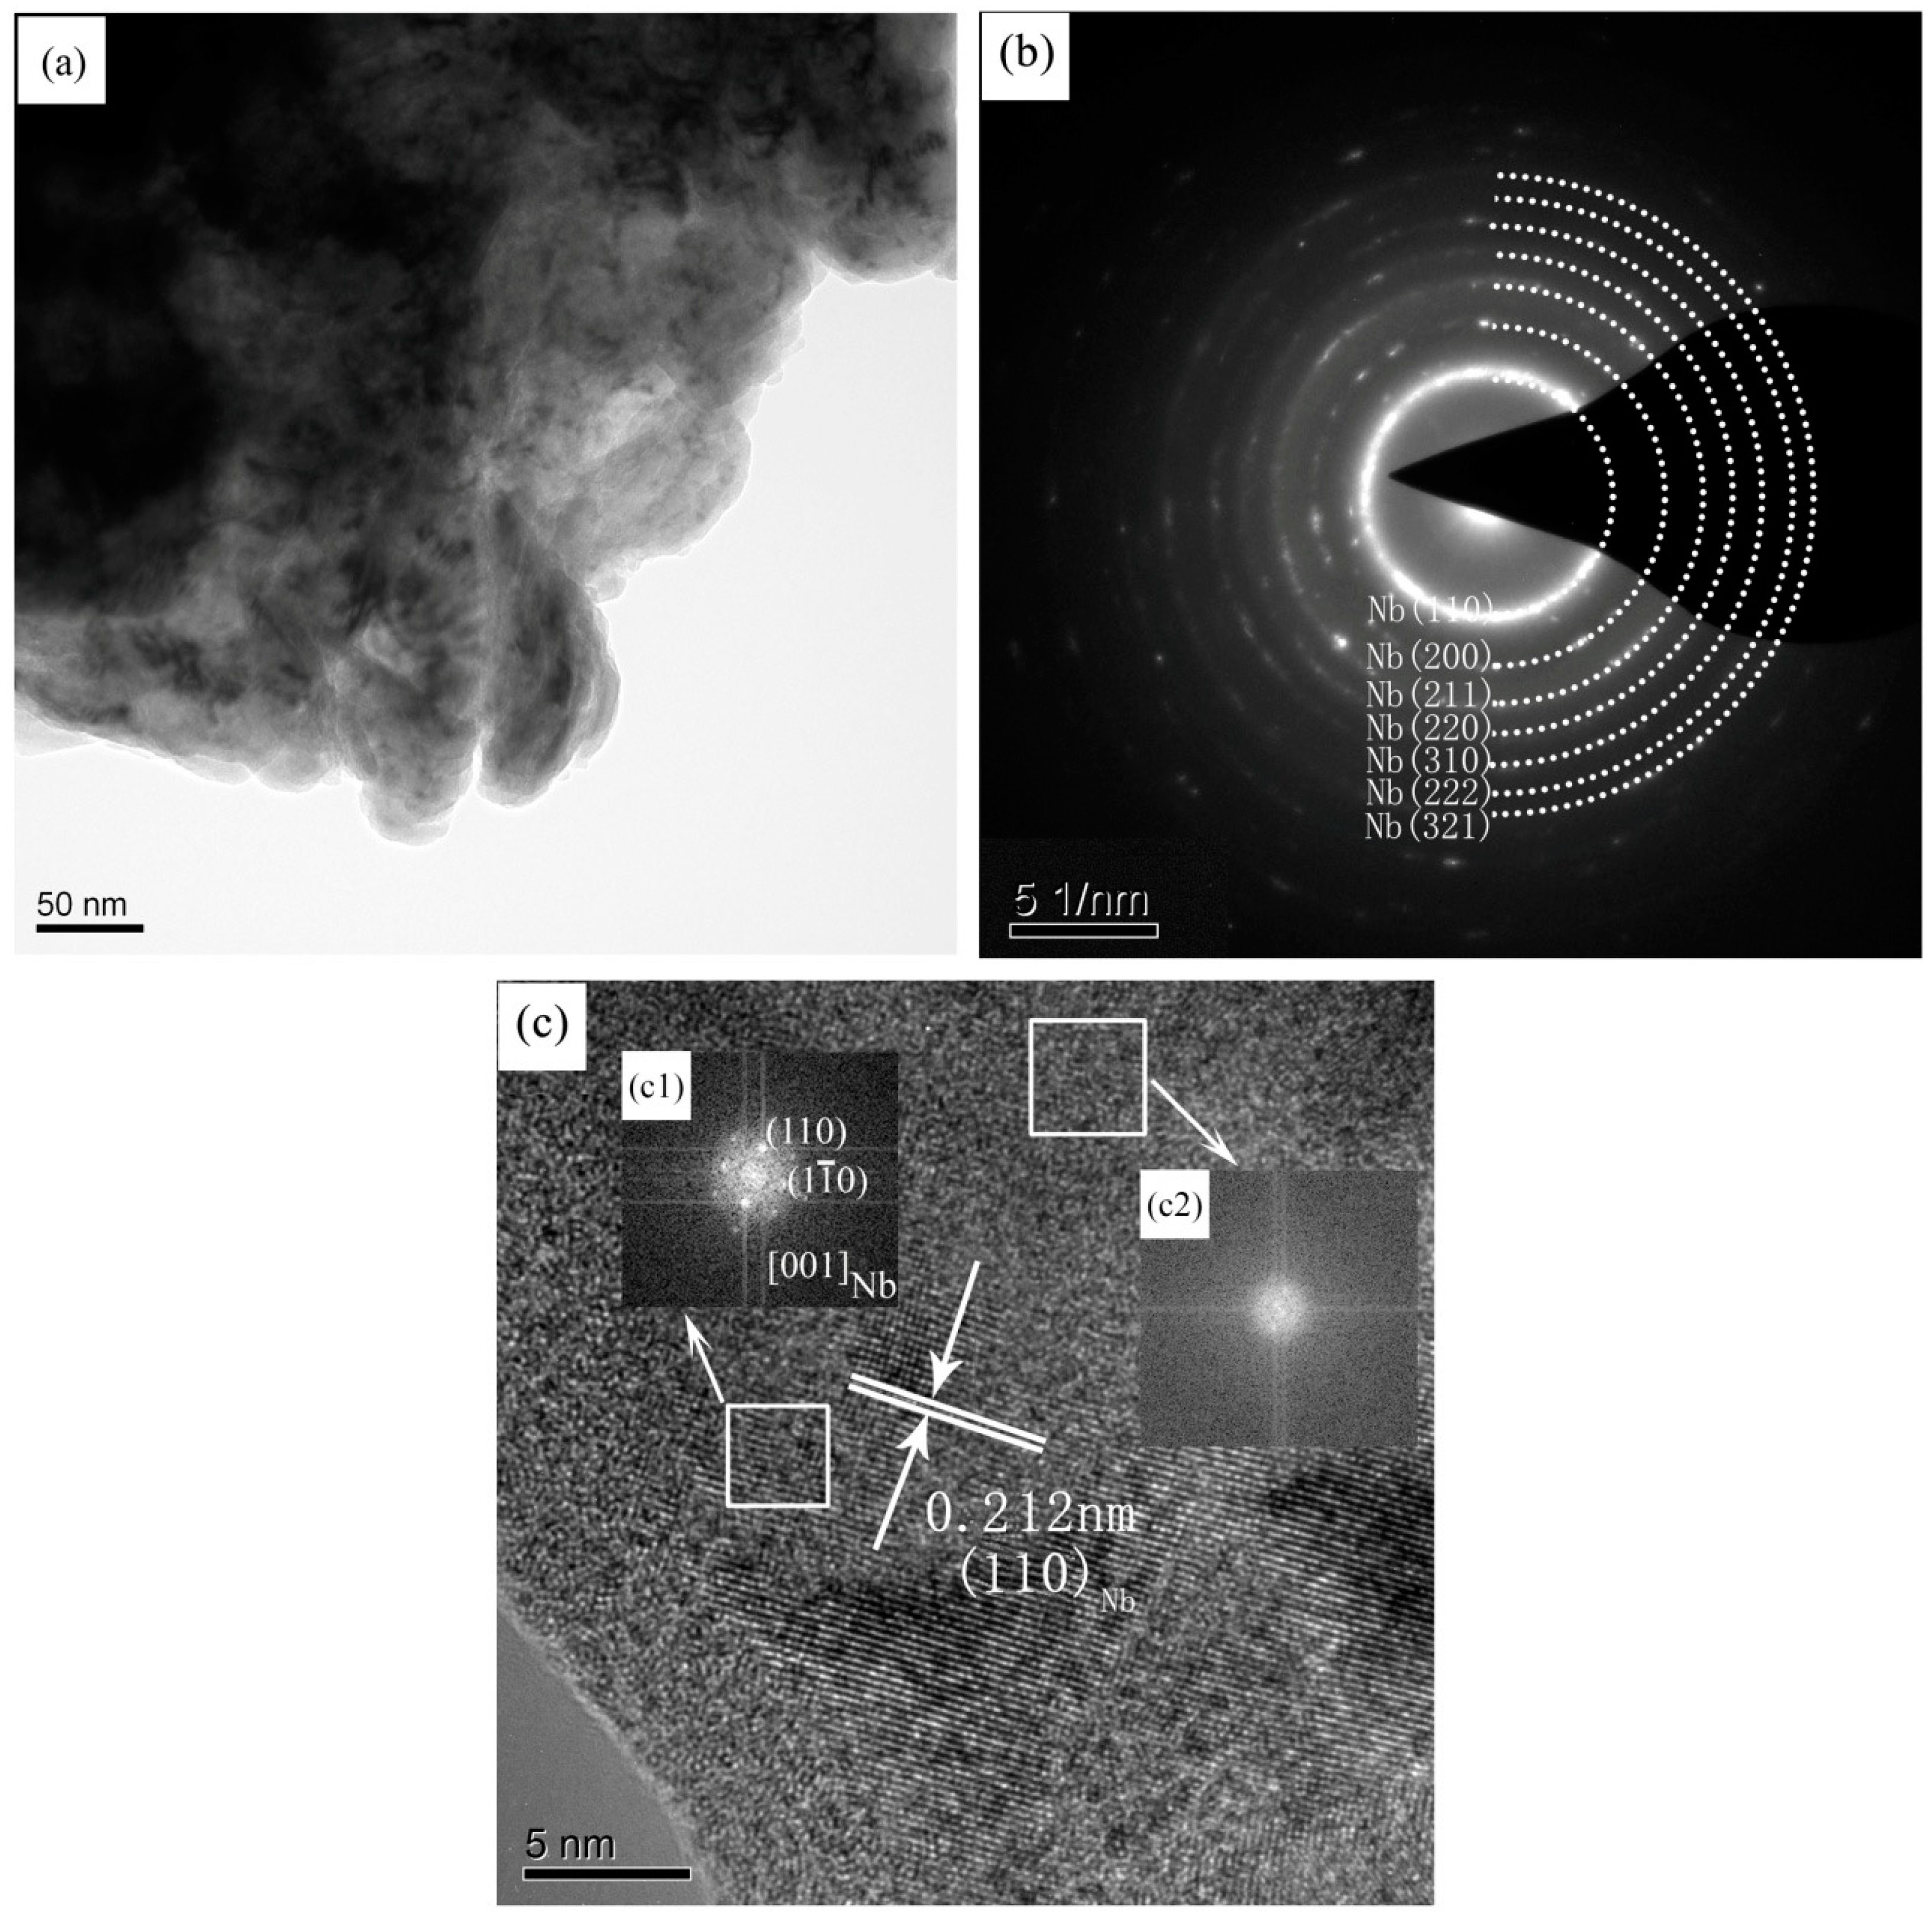
Figure 7.
(a) BF-TEM; (b) corresponding SAED; and (c) HRTEM images for the powder particles after ball milling for 40 h at 500 rpm.
Figure 7.
(a) BF-TEM; (b) corresponding SAED; and (c) HRTEM images for the powder particles after ball milling for 40 h at 500 rpm.
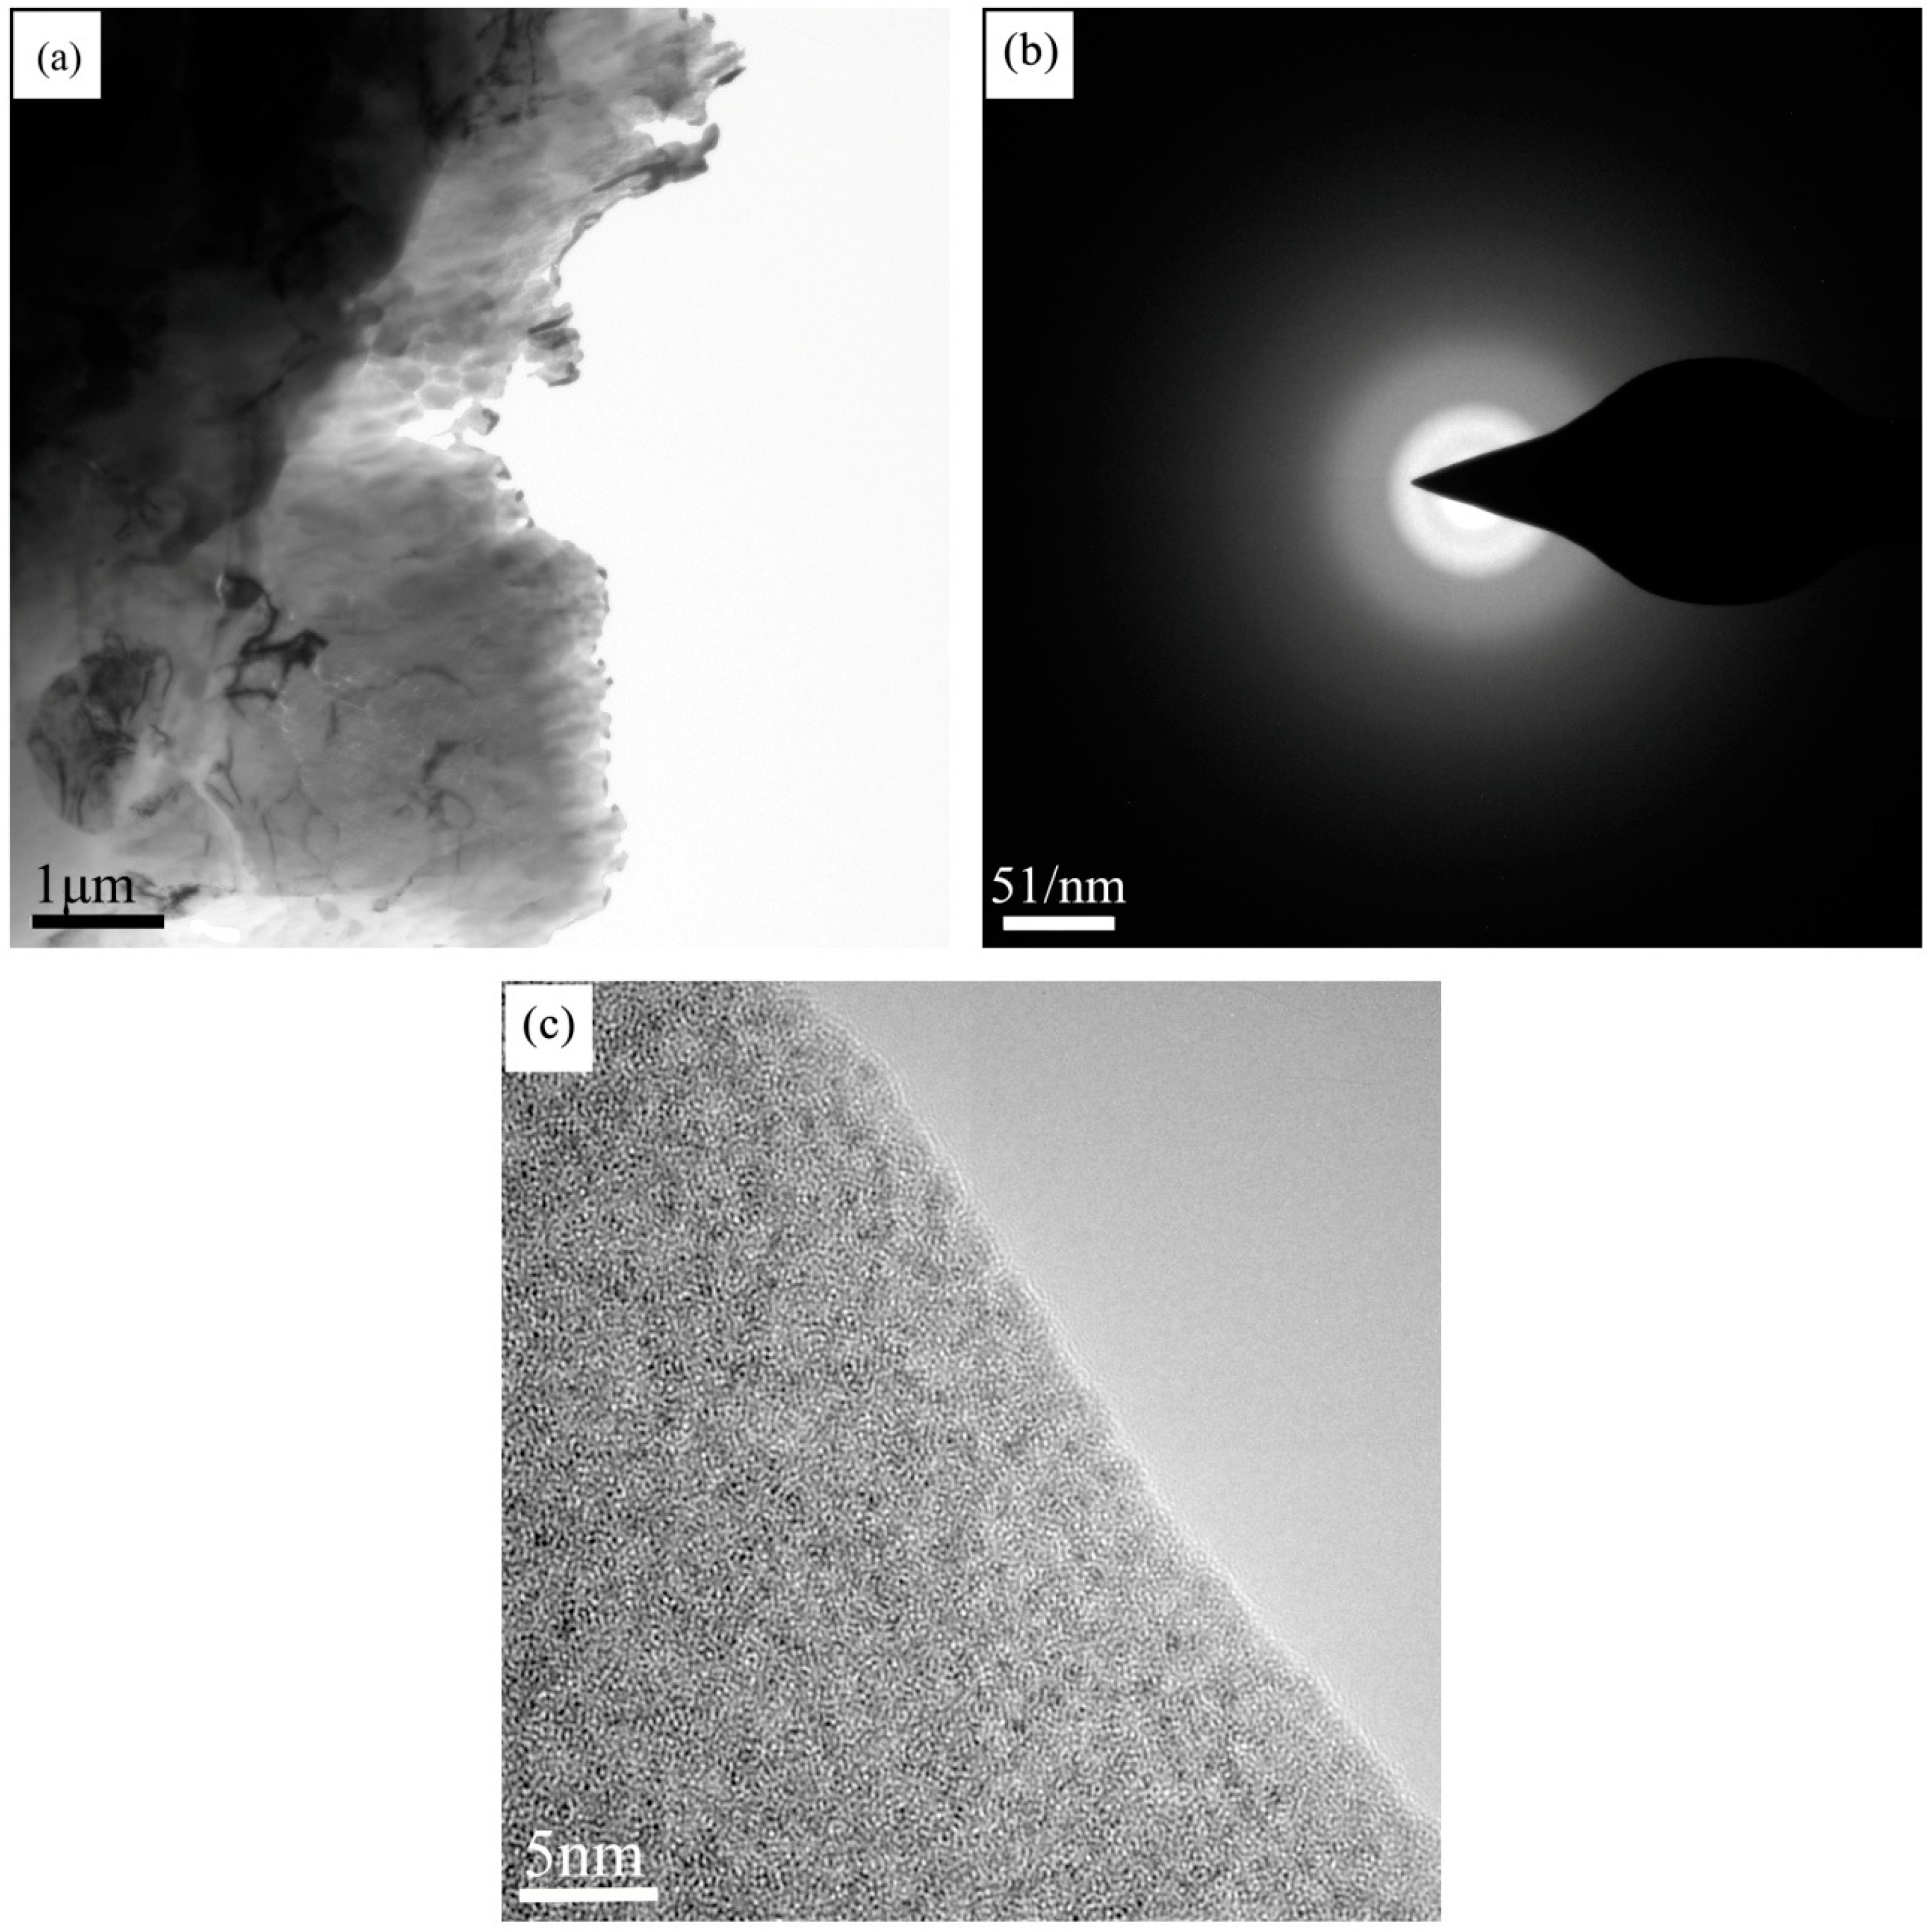
Figure 8.
DSC curves of the powder particles after ball milling for different times at 500 rpm; DSC curves of the powder particles after ball milling for different times at 500 rpm; the enlarged view of local area of the DSC curve for the sample after 40 h of ball milling clearly shows the determination of Tg (glass transition temperature) and Tx (amorphous-crystallization initial temperature) by the tangent method.

Figure 9.
XRD patterns of the quenching samples at 700 K and 1200 K during the DSC process for the powders after ball milling for 20 and 40 h.
Figure 9.
XRD patterns of the quenching samples at 700 K and 1200 K during the DSC process for the powders after ball milling for 20 and 40 h.
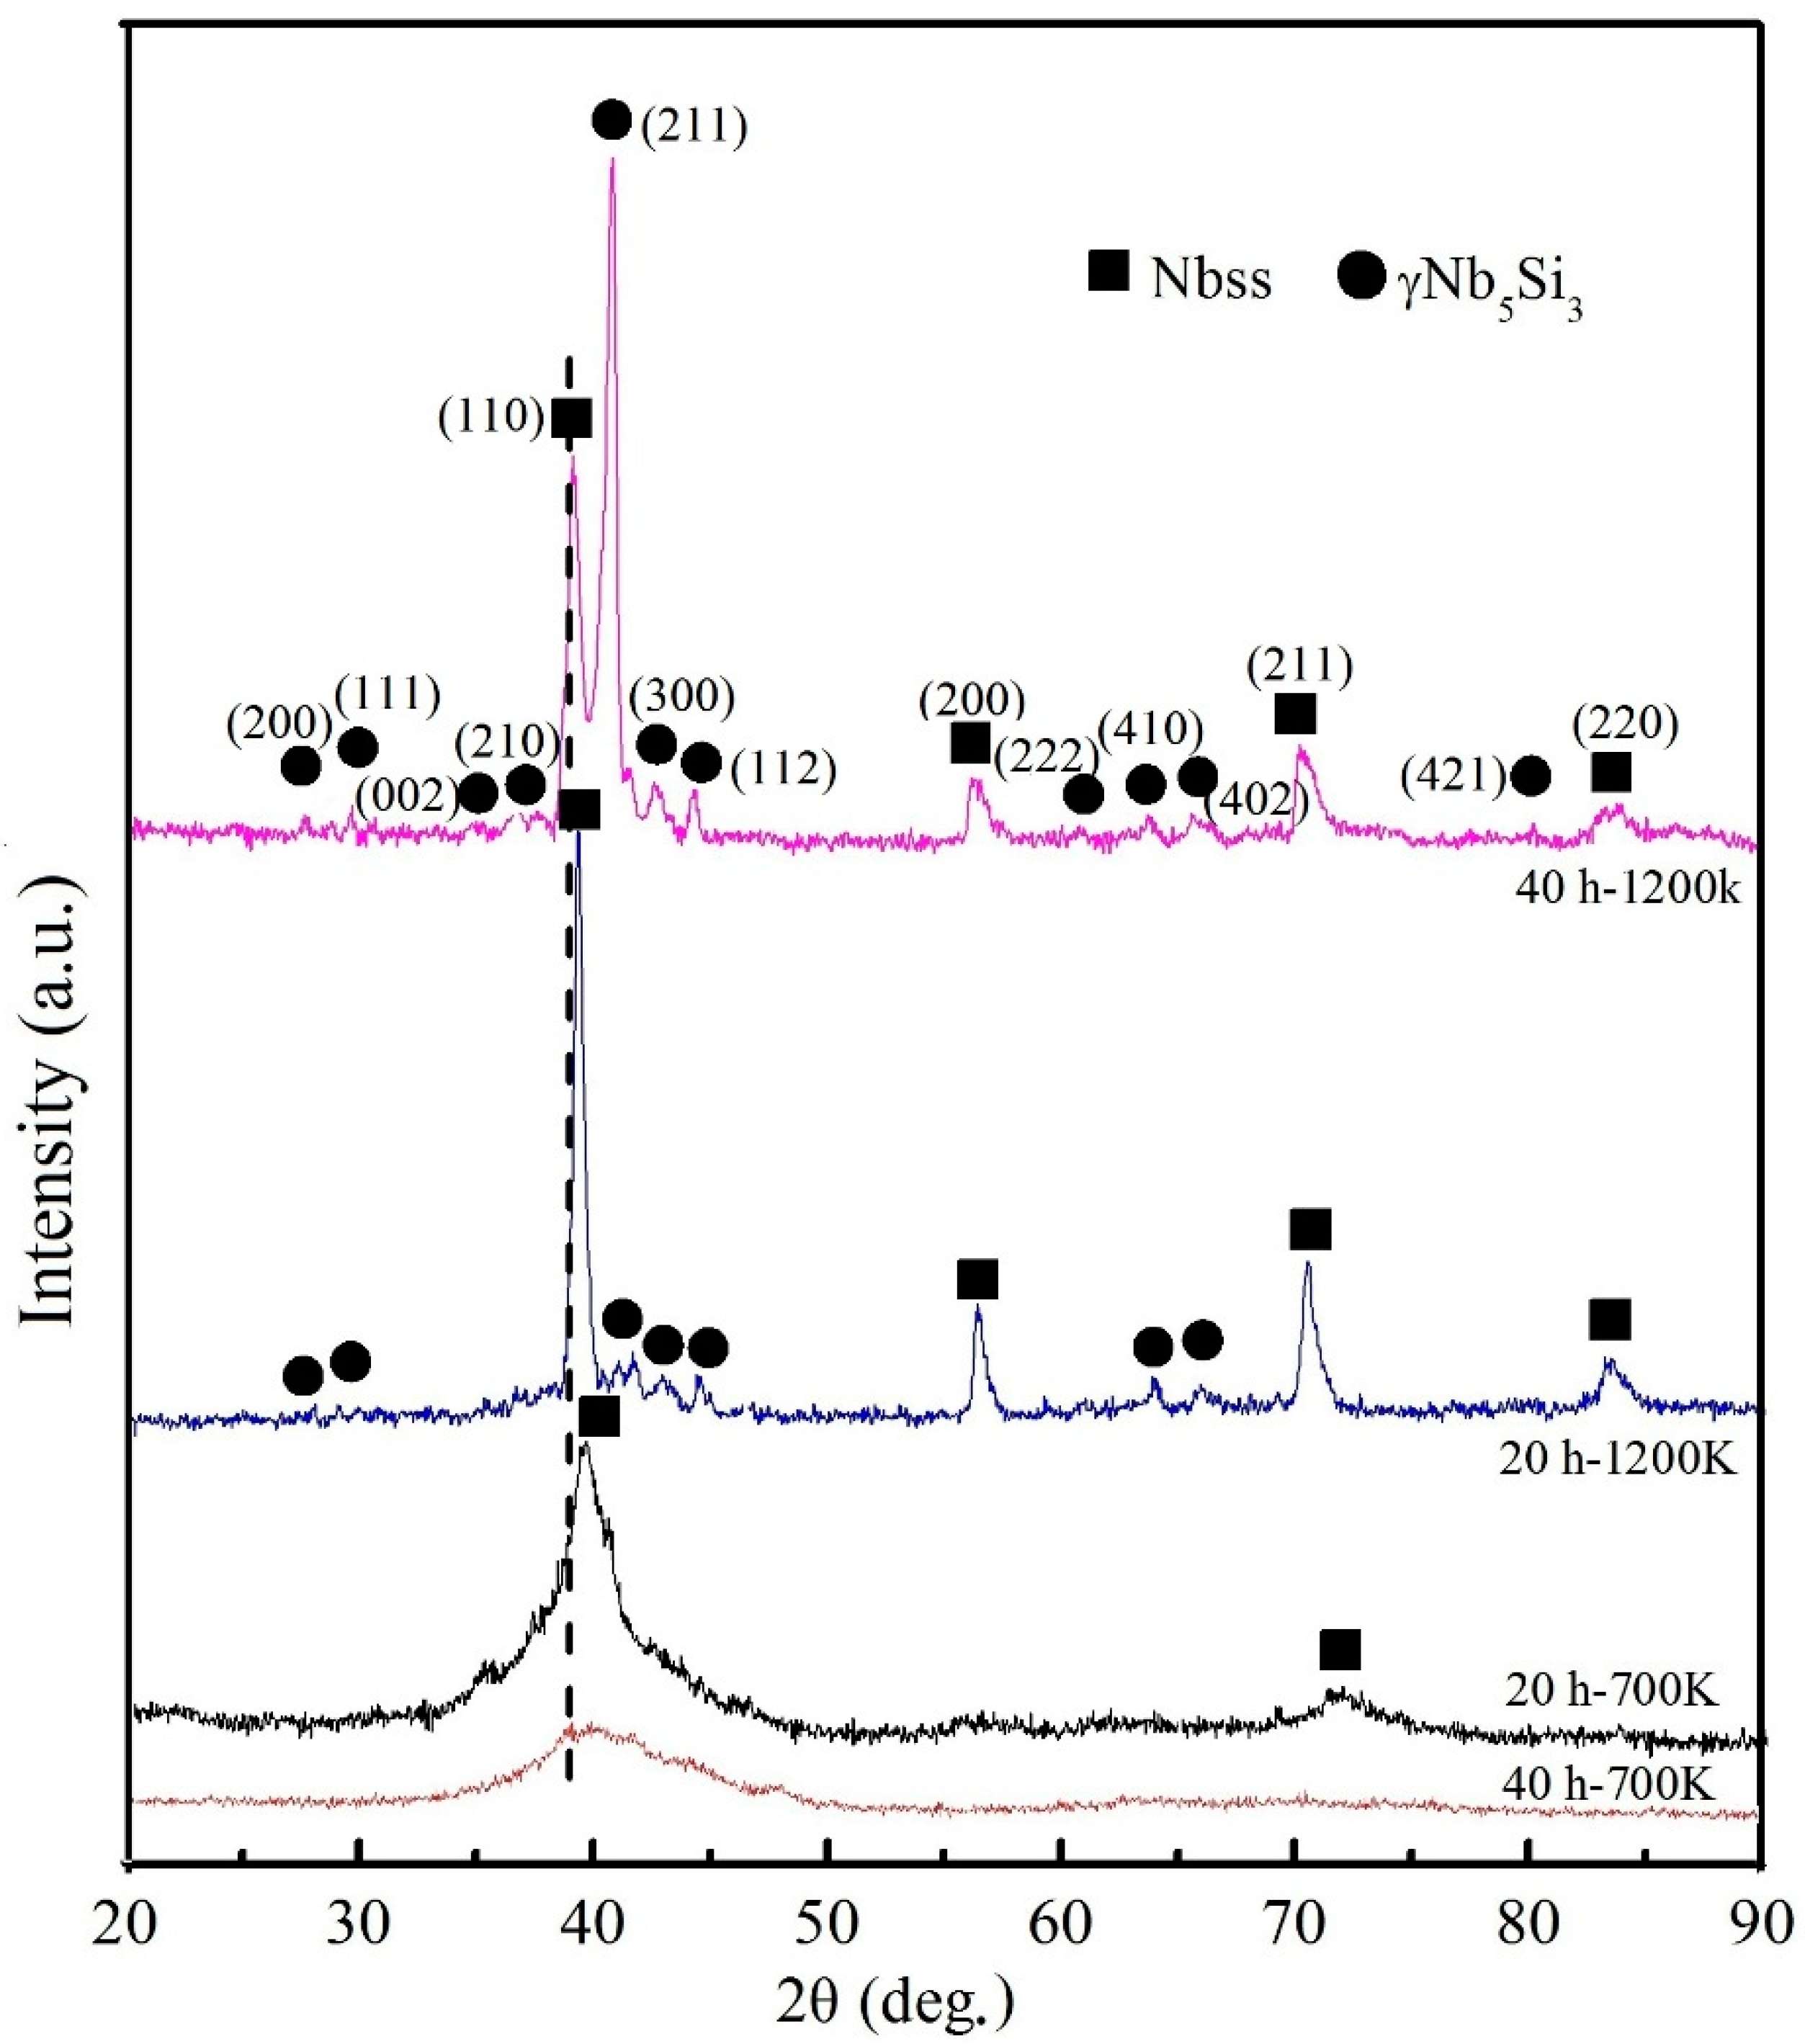
Figure 10.
Vickers microhardness of milled powder particles at 500 rpm as a function of milling time. Symbols of different types/colors at the same ball milling time in the figure mean that the same sample was measured several times to reduce experimental error.
Figure 10.
Vickers microhardness of milled powder particles at 500 rpm as a function of milling time. Symbols of different types/colors at the same ball milling time in the figure mean that the same sample was measured several times to reduce experimental error.


Table 1.
SD and RSD of the hardness value under different milling times.
| Ball Milling Time/h | SD/HV | RSD |
|---|---|---|
| 0 | 28.87 | 23.93% |
| 2 | 23.49 | 7.54% |
| 5 | 26.34 | 6.02% |
| 10 | 25.41 | 4.21% |
| 20 | 13.66 | 2.05% |
| 40 | 17.84 | 2.09% |
| 70 | 9.89 | 1.13% |
© 2018 by the authors. Licensee MDPI, Basel, Switzerland. This article is an open access article distributed under the terms and conditions of the Creative Commons Attribution (CC BY) license (http://creativecommons.org/licenses/by/4.0/).
Share and Cite
MDPI and ACS Style
Zhang, L.; Guo, X. Microstructural Evolution, Thermal Stability and Microhardness of the Nb–Ti–Si-Based Alloy during Mechanical Alloying. Metals 2018, 8, 403. https://doi.org/10.3390/met8060403
AMA Style
Zhang L, Guo X. Microstructural Evolution, Thermal Stability and Microhardness of the Nb–Ti–Si-Based Alloy during Mechanical Alloying. Metals. 2018; 8(6):403. https://doi.org/10.3390/met8060403
Chicago/Turabian StyleZhang, Lijing, and Xiping Guo. 2018. "Microstructural Evolution, Thermal Stability and Microhardness of the Nb–Ti–Si-Based Alloy during Mechanical Alloying" Metals 8, no. 6: 403. https://doi.org/10.3390/met8060403
Note that from the first issue of 2016, this journal uses article numbers instead of page numbers. See further details here.