Article

Surface Roughness Investigation and Stress Modeling by Finite Element on Orthogonal Cutting of Copper

1
Mechanical Engineering Department, Qassim University, Buraidah 51452, Saudi Arabia
2
Mechanical Design and Production Department, Faculty of Engineering, Cairo University, Giza 12613, Egypt
3
Mechanical Engineering Department, Beni Suef University, Beni-Suef 62764, Egypt
*
Author to whom correspondence should be addressed.
Metals 2018, 8(6), 418; https://doi.org/10.3390/met8060418
Submission received: 18 May 2018 / Revised: 31 May 2018 / Accepted: 1 June 2018 / Published: 4 June 2018

Abstract

:
In this paper, a modern non-contacting optical technique was used to study the surface roughness of commercially pure copper. Finite element (FE) method was applied to predict the stress during orthogonal cutting by simulating the machining process. The experimental work empathized mainly on the effect of cutting speed (N) and feed rate (f) on the surface roughness of copper. Scanning electron microscope (SEM) was utilized to evaluate the surface variations at different machining conditions. Johnson-Cook mathematical model was adopted and employed to determine the parameters of the material. Furthermore, the maximum Von-Mises stress was predicted as a function of machining conditions. A software package of code (ABAQUS/CAE) was used for the analysis and response surface methodology (RSM) was applied to visualize the results. The results showed a significant effect of the feed rate/cutting speed interaction on surface roughness and Von-Mises stress of copper. An enhancement of 14% in surface roughness was perceived with increasing the cutting speed. A good agreement was observed between experimental and analytical results.

Graphical Abstract

1. Introduction

The mechanical and surface properties are essential for the characterization of materials. The requirement of products with good quality in terms of high strength, good surface finish, lower cost and less environmental effects is the challenge of the manufacturing industries [1]. The roughness of surfaces is considered as an essential parameter in many industries because it is an indication of the surface quality of the machined parts [2]. The efficiency of the machining processes can be improved by controlling the machining conditions such as cutting speed, depth of cut, and feed rate. Moreover, surface roughness plays an important role in the appraisal of machining accuracy [3,4,5]. Many researchers studied the effects of the machining parameters on the surface quality of metals, alloys, and composites. Shoba et al. [6] studied the effect of cutting speed, feed, and depth of cut on surface roughness during the turning process of hybrid composites. The results showed the optimum parameters that give minimum surface roughness. Suresh et al. [7] proposed a prediction model for surface roughness after turning operation of mild steel. The response surface methodology was used to determine the factors affecting the process. Davim [8] reported that, the cutting speed has the most significant effect on roughness followed by the feed rate, while the depth of cut has a slight influence on surface roughness. Gouveiaet et al. [9] examined the machining process of duplex stainless steel. The results determined the advantages of various tools based on coating conditions and tool geometry. El-Gallab [10] investigated the effect of various machining parameters such as cutting speed, depth of cut, feed rate, cutting angles and cooling fluid on chip formation of aluminum composites. Shyha et al. [11] studied the surface variations and microstructure changes when machining Ti-6Al-4V by milling. The results revealed that the microstructure of the machined surfaces was mainly affected by cutting speed. Kumar et al. [12] studied the stimulus of speed, depth of cut, and feed rate on surface roughness during the machining process of 7075Al alloy samples on CNC turning machine. The obtained results showed that the surface roughness decreased in feed range of 0.1 to 0.3 mm/rev and depth of cut of 0.5 to 1.5 mm as compared to other studied process parameters. Ozben et al. [13] explored the mechanical and surface properties of SiC aluminum during turning operation. It was observed that the surface roughness increased significantly with increasing the feed rate. Thiele and Melkote [14] studied the effect of tool geometry on the surface roughness of AISI 5210 steel. The experiments were conducted using different machining conditions. The results revealed that the effect of cutting edge on surface roughness decreases with increasing the hardness of workpiece. Aouici H. et al. [15] evaluated the influence of the cutting parameters on cutting forces and surface roughness of AISI H11 hot work steel. It was observed that the surface roughness is very sensitive to the variation of feed rate. Shashi Kiran et al. [16] determined the optimum cutting parameters during turning operation of copper alloy. The effect of cutting speed, feed rate, and cooling conditions on surface finish and dimensional accuracy were examined and the cutting parameters were optimized. The conventional stylus contact method is widely used in measuring the surface roughness of materials. However, it is limited in measuring the large peaks features (macro scale). Recently, non-contact methods have been developed for more accurate measurement of surface roughness with micro scale. In the past few decades, several techniques have been innovated to characterize the surface properties of metals, alloys, and composites. Non-contacting (optical) devices are the most widely used for characterizing the surface features of machine components [17]. On the other hand, the reliable prediction of different parameters is very important for selecting the cutting conditions to save money, effort, and time [18,19]. An orthogonal cutting is common in research as a mean of simplification of the real cutting process. A 3D-simulation model of cutting is costly since the relatively sharp edge of the tool requires a very fine mesh. Therefore, the orthogonal cutting can be modeled as a plane stress problem and is more frequently investigated in literature [20,21,22,23].
Copper and its alloys are widely used in the production of several elements such as electrical components, water valves, and pipe-fittings [24]. However, the surface roughness of copper is significantly affected by the cutting parameters and it is difficult to machine [25]. Marshall [26] discussed the copper roughness measurements using a white light interferometry scanning optical profiler to image and measure the microstructure and topography of surfaces. However, the surface properties of copper and correlation between surface roughness and stresses during machining operations are still limited and needs further investigations. The main objectives of this paper is to study experimentally the effect of cutting parameters on surface roughness of commercial pure copper by using a modern non-contacting (optical) technique including both single acquisition and stitching measurements. The correlation of surface roughness and plane stress of copper was also investigated. A simulation model of plane stress was created for the orthogonal cutting at different cutting conditions.

2. Experimental Work

2.1. Materials and Methods

Cylindrical samples of commercially pure copper (99.5% purity) with an initial diameter of 30 mm and length of 200 mm were used. Each bar was cut into five samples for orthogonal machining by turning operation. The samples were classified according to the studying conditions into three groups A, B, and C. The turning operation was carried out at different conditions by using a center lathe machine. The tool geometry has the following specifications: nose radius 1.15 mm, approach angle 40°, clearance angle 7°, and back rake angle −5°. The longitudinal and face turning with similar conditions for each sample were conducted. Table 1 shows the cutting parameters and work piece samples used in the study.

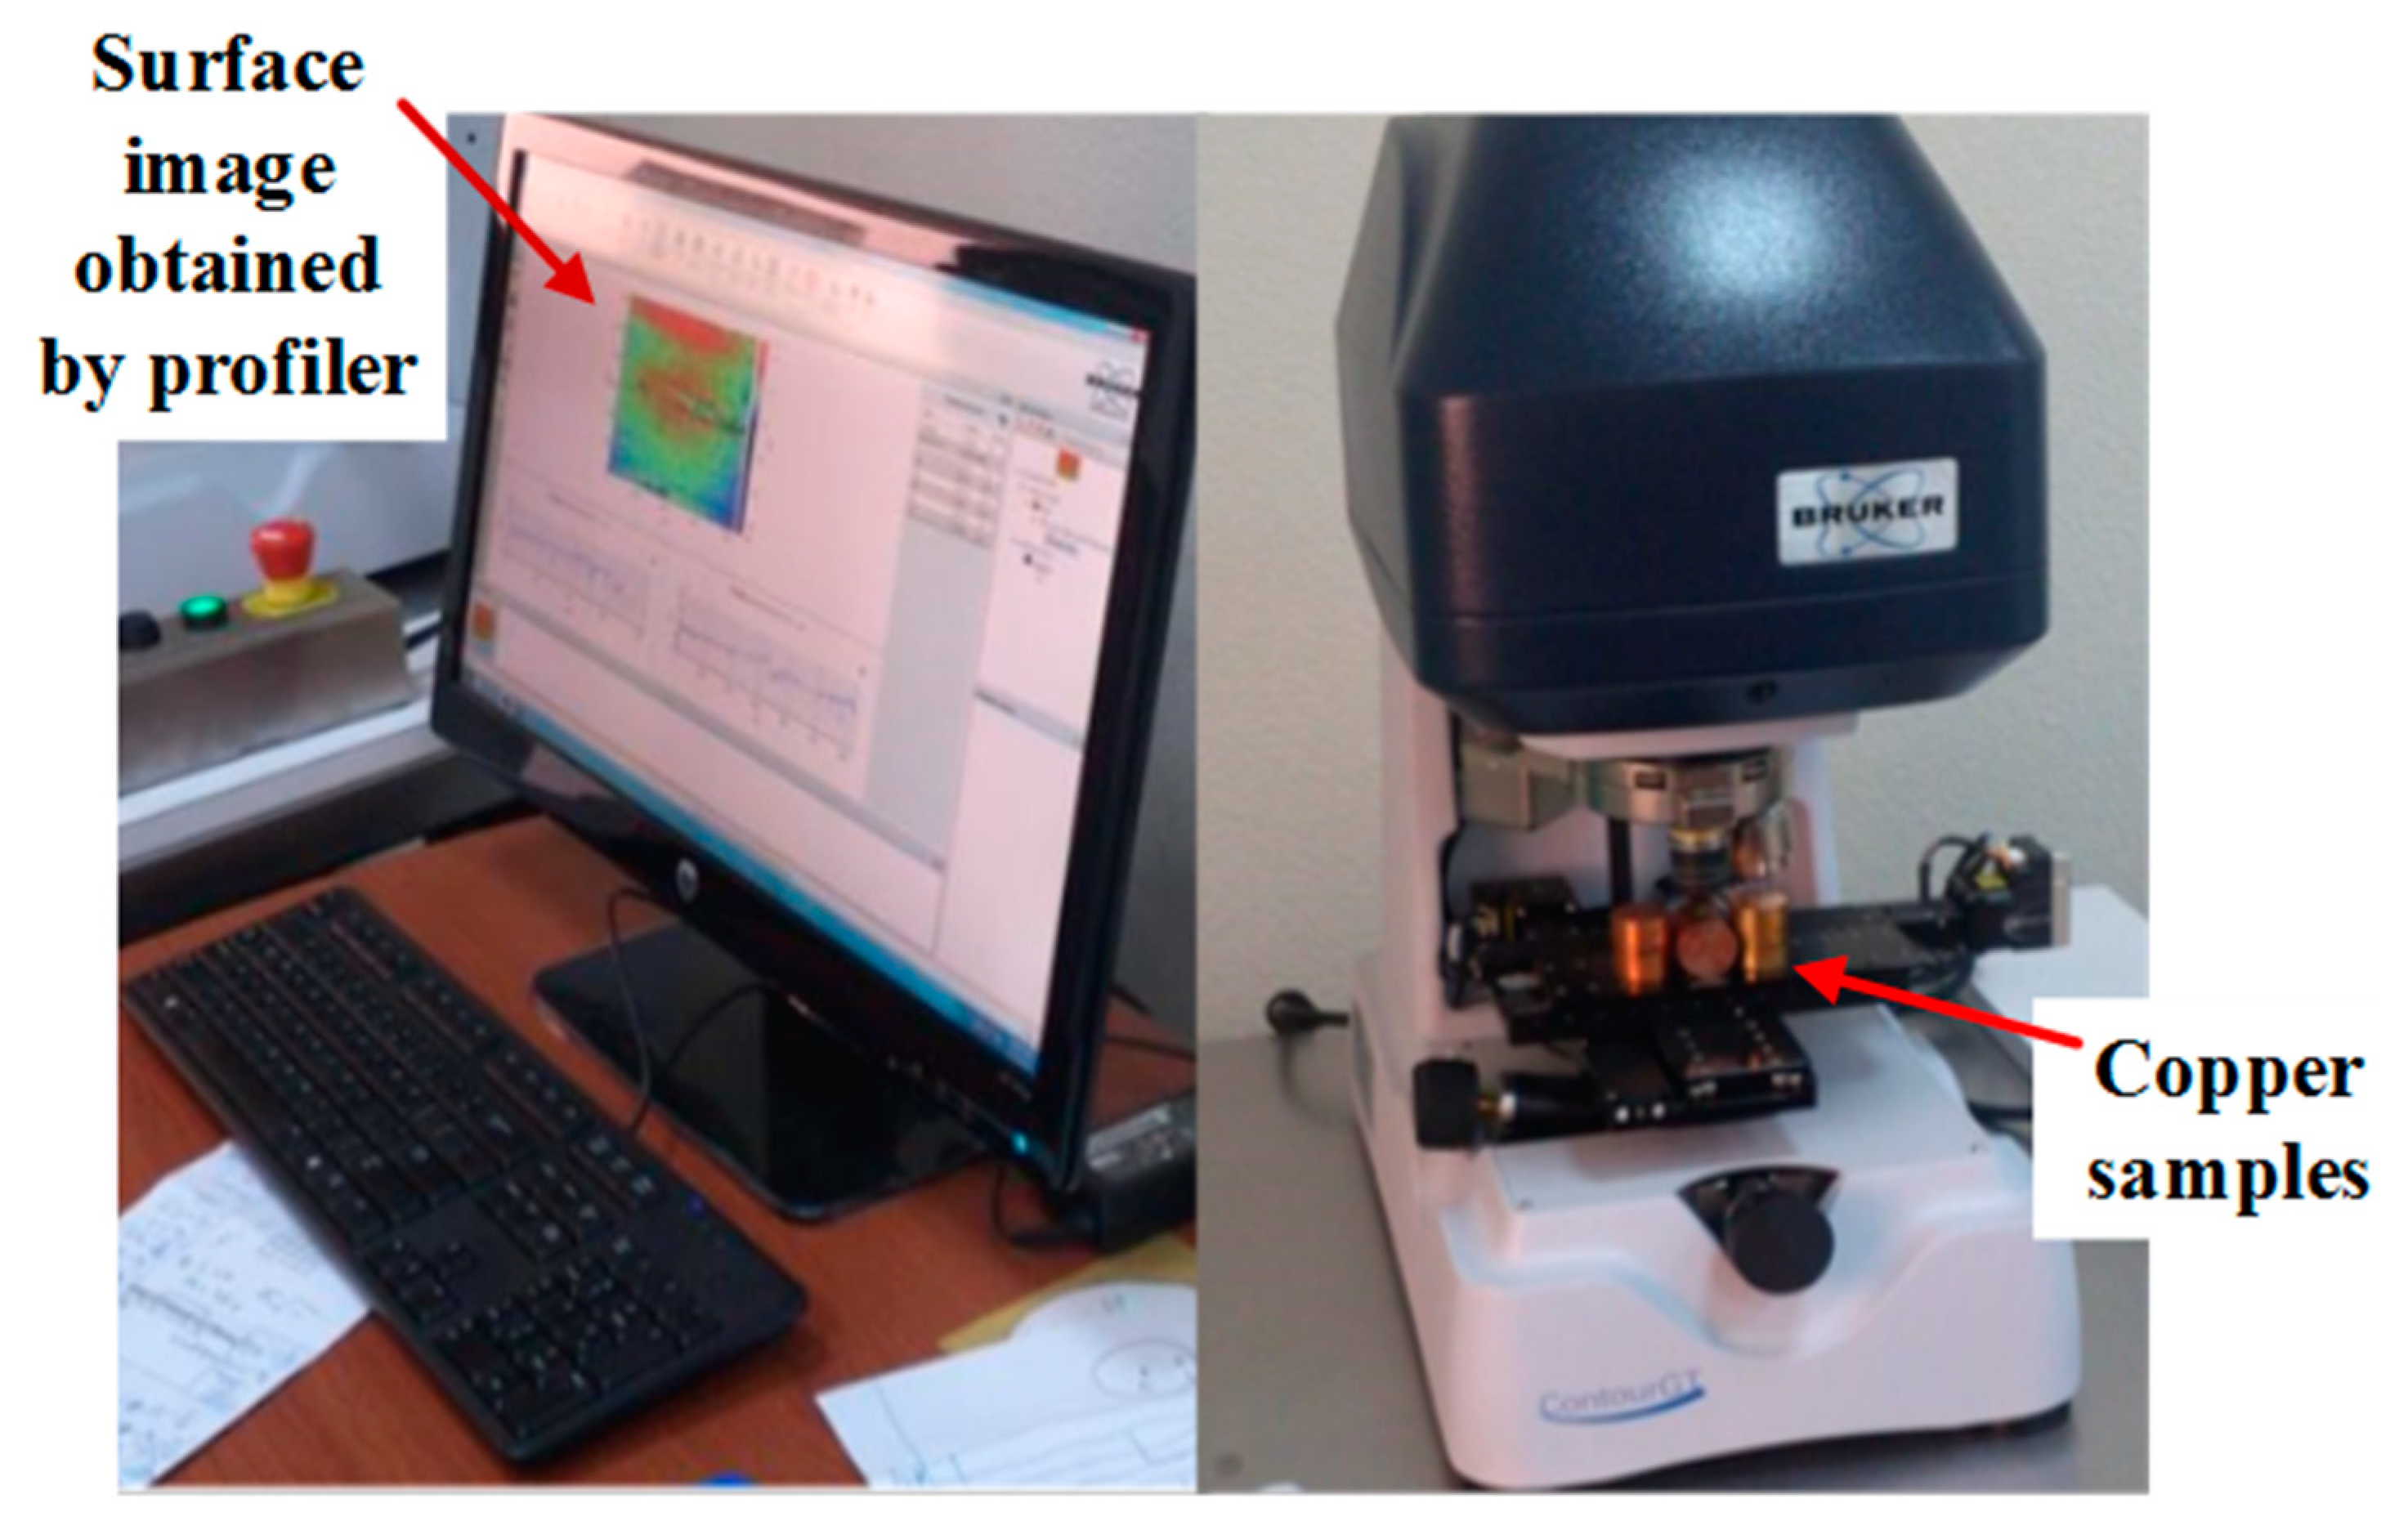
2.2. Surface Roughness Measurement

An optical profiling system made by (Contour GT-K1, Bruker, Billerica, MA, USA) working by interferometry technique was used to measure the surface roughness after turning operation. The setup of roughness measurement is shown in Figure 1.

3. Simulation Model

3.1. Finite Element Model

The correlation between the cutting parameters and stress was implemented through a simulation approach. The Von-Mises theory (maximum distortion energy theory) was applied to determine the maximum stress during turning operation at different cutting conditions. Von-Mises theory proposes for the ductile materials that the yield stress begins when the stress reaches a certain limit [27]. It is considered that the removal (separation) of the material during the machining operations behaves similarly. The finite element method (FE) was applied to simulate the process by using the software package (ABAQUS/Explicit). A discrete rigid form was proposed to model the cutting tool which movement was represented ‎by the movement of a single node, identified as a rigid body reference node. The cutting tool was meshed with (R3D4) elements. The number of elements and nodes of the cutting tool were 589 and 591 respectively. Consequently, the work piece of pure copper (12 mm in length and 4 mm in height) was modeled as a deformable solid extrude and meshed with 3D stress element type of reduced integration (C3D8R) elements [27,28]. The number of elements and nodes used for the workpiece were 4400 and 9246 respectively. The model for single point orthogonal cutting is shown in Figure 2. Coulomb friction was assumed between the cutting tool and workpiece, with a coefficient µ = 0.2.

3.2. Material Properties for Modeling

Throughout the study, the pure copper was considered as an elastoplastic object. The mechanical properties of the material are shown in Table 2.

3.3. Material Modeling

In metal cutting processes, the material undergoes rapid elastoplastic deformation under severe and harsh conditions. In order to give acceptable results the material model must be able to explain the deformation behavior such as hardening and softening over great ranges of strain, strain rate and temperature [30]. Johnson-Cook constitutive material model is the common model for describing the thermo-visco-plastic behavior of the material during the cutting process [31]. Johnson-Cook model [32] gives the flow stress as a function of strain, strain-rate, and temperature as shown in Equation (1):
σ =   [ A + B   p n ] [ 1 + l n ϵ ˙ * ] [ 1   T * m ]
where:
σ—flow stress, MPa
A—yield strength constant, MPa
B—work hardening coefficient, MPa
ϵp—equivalent plastic strain,
n—work hardening exponent,
C—strain rate coefficient,
T*—homologous temperature, °C
m—thermal softening exponent
Table 3 shows the values of the five constants of pure copper.
In ABAQUS/Explicit, the cumulative Johnson-Cook damage is considered the dynamic shear failure model. This was previously used by Agmell [33] and Zouhar [34] for the chip/workpiece separation in the orthogonal cutting simulation. For Johnson-Cook damage formula, the strain at failure is given as follows:
p f = [   D 1 + D 2   e x p   D 3   σ *   ] [ 1 + D 4   l n ϵ ˙ * ] [ 1 +   D 5   T * ]
Depending on the variables (σ* = σm/ σ ¯ , (έ*), T*), the dimensionless pressure-stress ratio is defined as σ* = σm/ σ ¯ . where:
σm—average of the three normal stresses,
σ ¯ —Von-Mises equivalent stress. The dimensionless strain rate, έ* and homologous temperature, T*, are identical to those used in Equation (1). Table 4 displays the values of the five material constants (D1, D2, D3, D4, and D5).
The failure model is based on the calculation of damage parameter D, which is defined by the following equation:
D = ϵ p ϵ p f
The damage parameter (D) is continuously updated in every FEA solving step. When (D) exceeds unity, the elements are supposed to fail and then discarded [35]. The tensile test data in a typical stress-strain curve with progressive damage degradation are shown in Figure 3. This curve consists of three zones. The first zone (oa) represents the linear elastic deformation stage. When the stress increased and exceeds the yield stress σo the material passes in the second zone (ab), at which material experiences stable plastic deformation. In this stage, the effect of strain hardening is dominated. When the damage parameter (D) equals to zero (at point b), the plastic instability starts and the material transfers to the third stage (bd). Afterward, the stage of failure (damage evolution region) initiates and the thermal effect softens the material. Therefore, the equivalent stress decreases. When the stress-strain curve approaches to point (d) the damage parameter (D) equals to unity. At that point, the stiffness of the material is completely degraded and the crack initiates as an indication of failure [35,36,37,38,39].

3.4. Von-Mises Stress Criterion

Generally, Von Mises stress (σV.M.) is used for ductile materials to estimate the yield criteria. Von-Mises stress formula in three dimensions is as follows [40]:
σ V . M . =   ( σ 1   σ 2 ) 2 +   ( σ 2   σ 3 ) 2 +   ( σ 3   σ 1 ) 2 2
where: σ1, σ2, and σ3—principal stresses.
In the case of plane stress, σ3 is zero and the equation can be defined in terms of two principle stresses as follows [35]:
σ V . M . =   σ 1 2     σ 1 σ 2 +   σ 2 2
A schematic illustration of the distortion energy in-plane stress is shown in Figure 4.

4. Results and Discussion

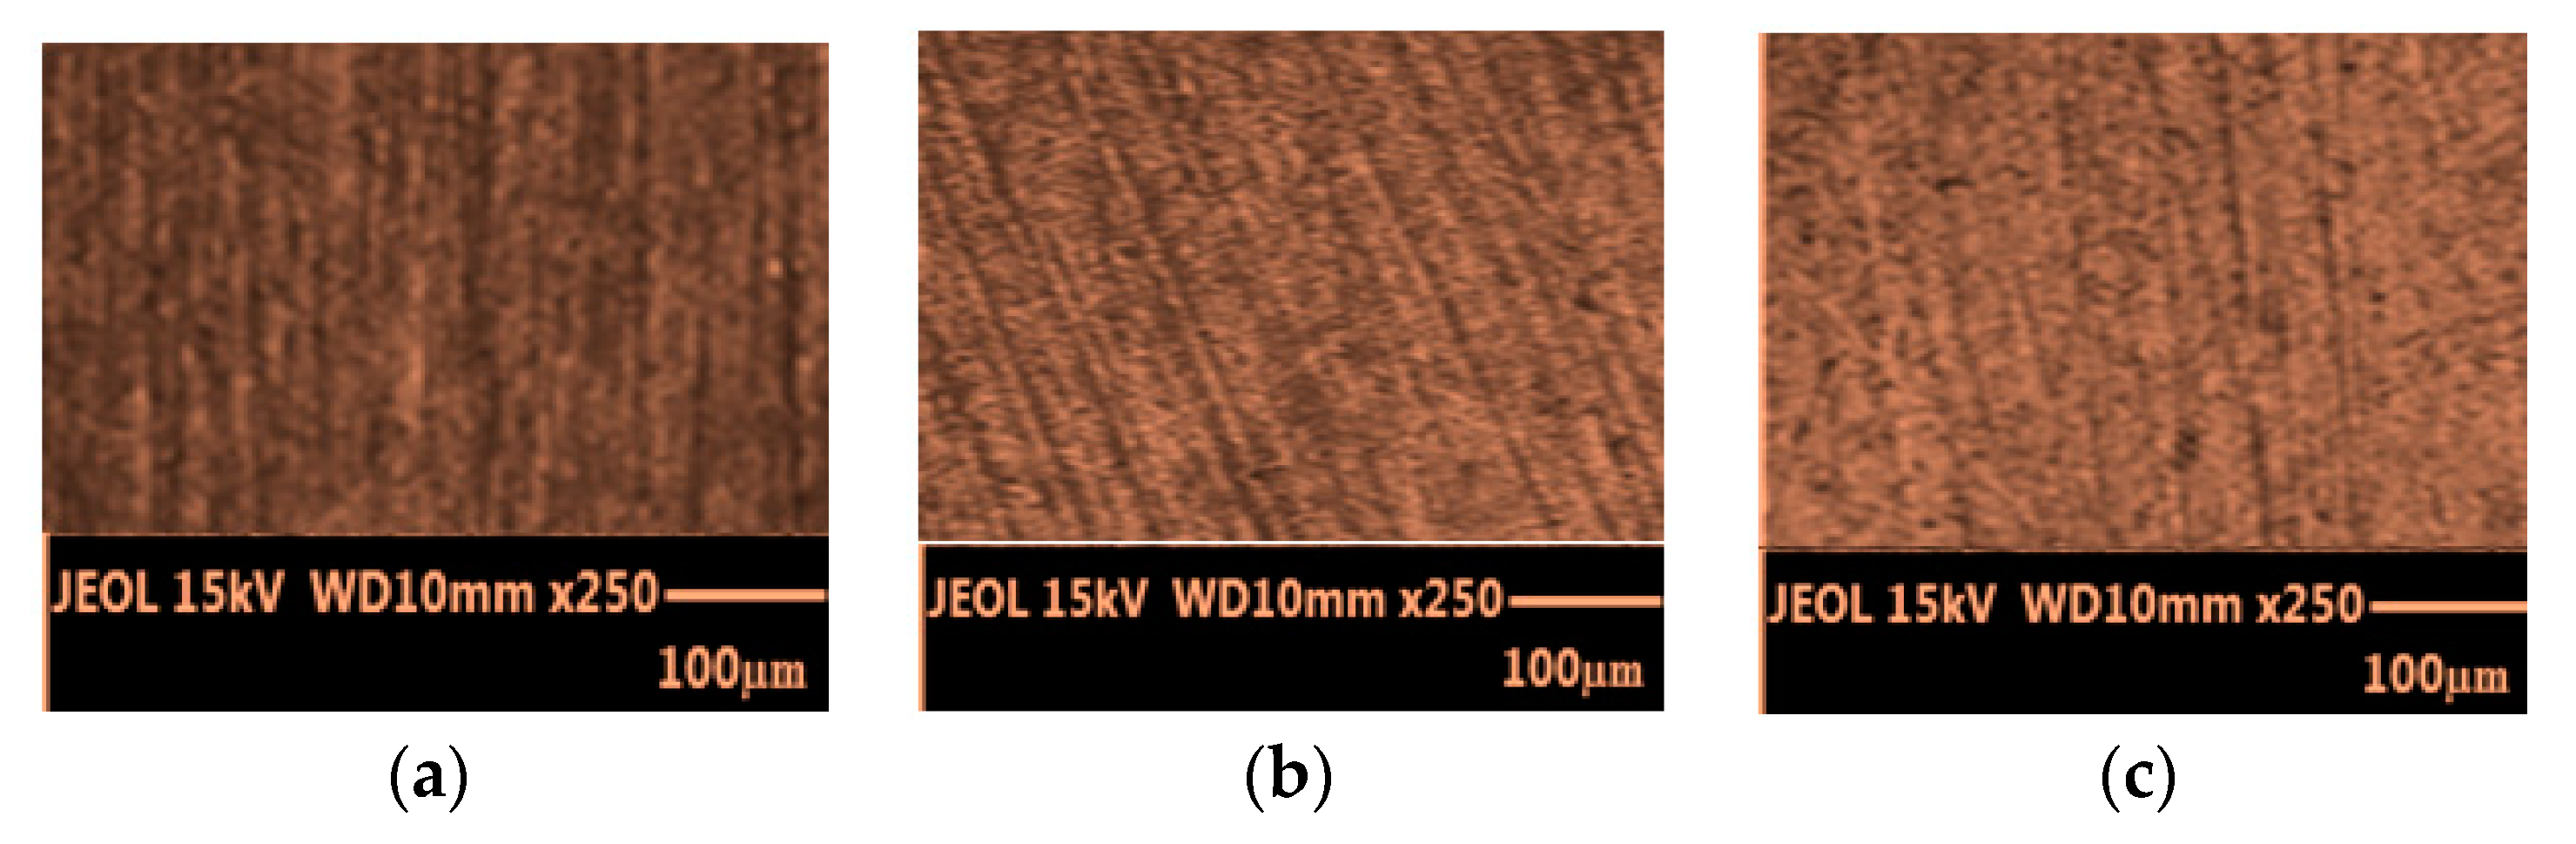
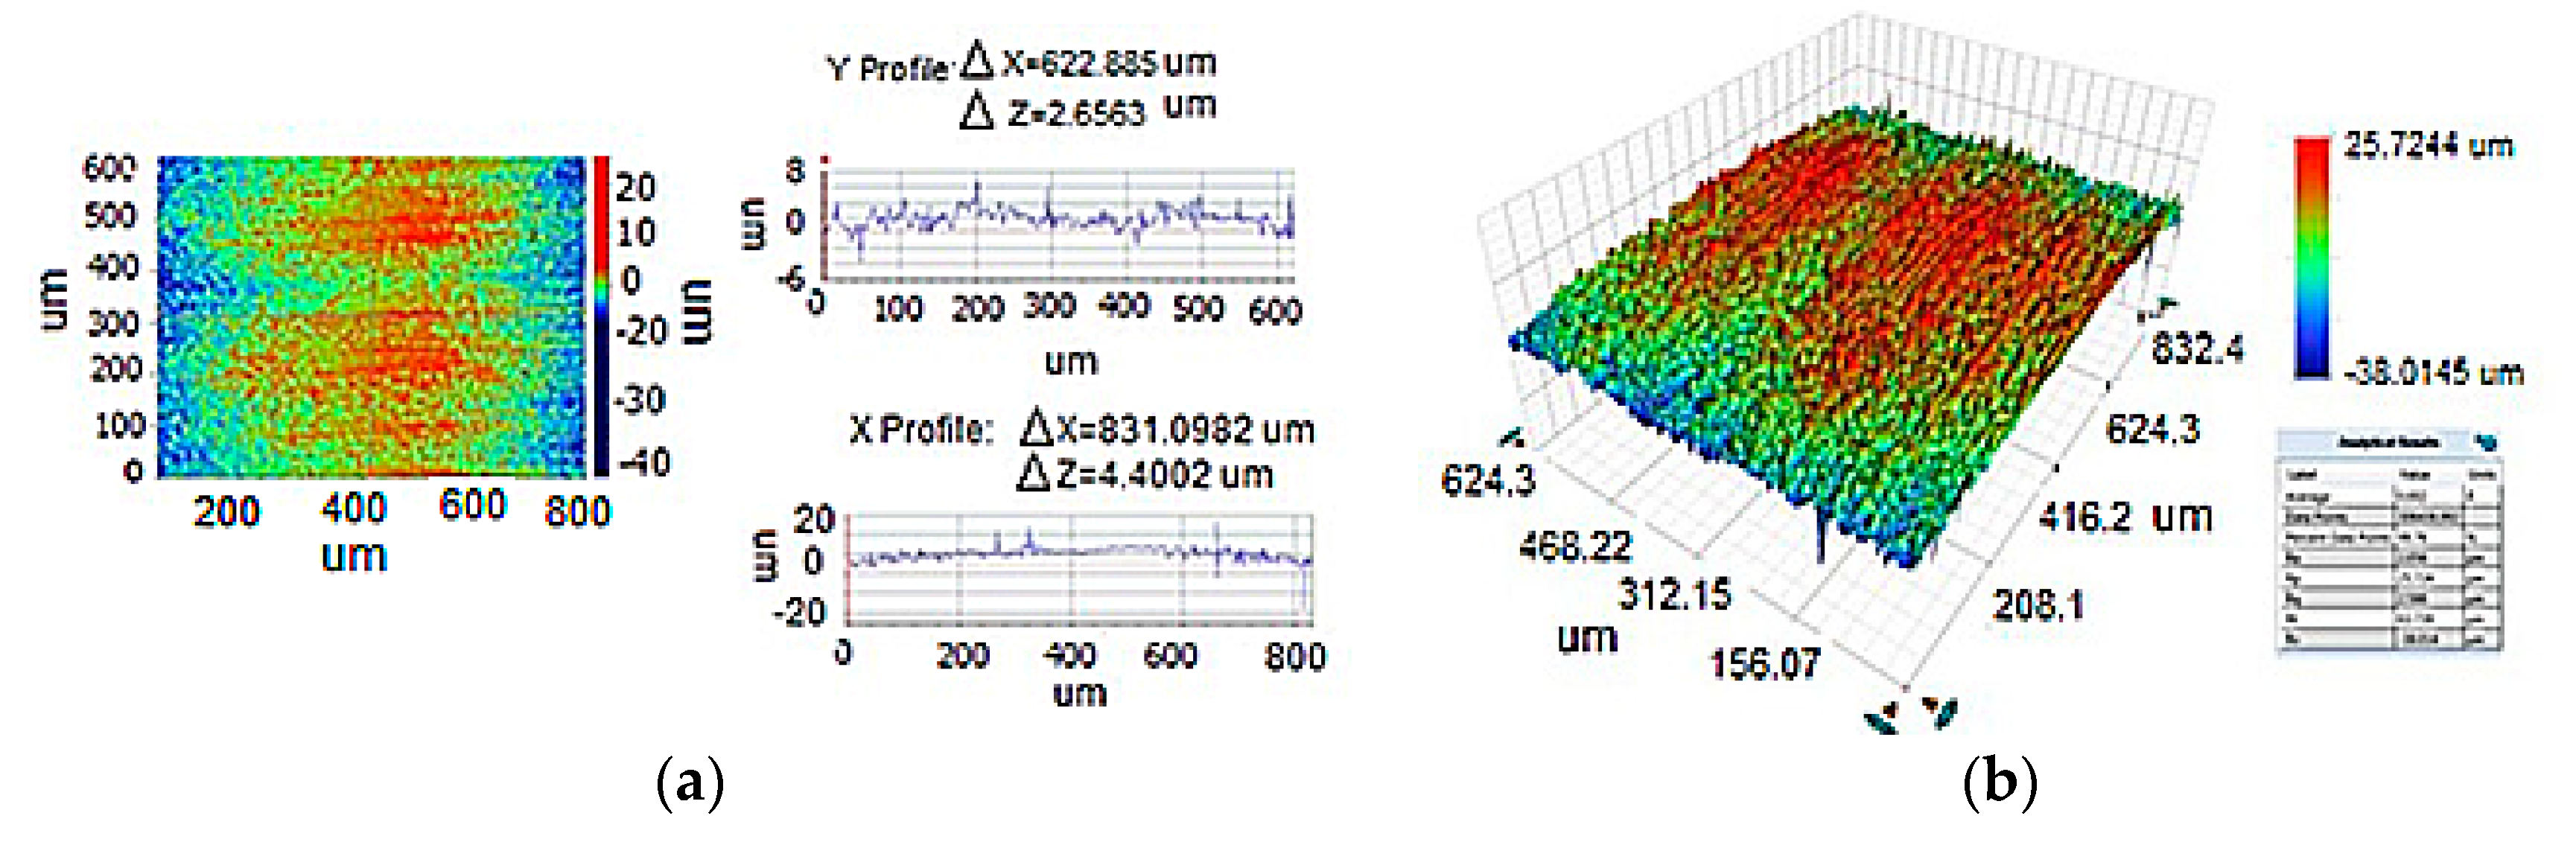
4.1. Microscopic Observations and Surface Roughness Results

Scanning Electron Microscope (SEM) was used to investigate the micrograph of the machined surface of copper samples. The surface variations at different cutting speeds are shown in Figure 5.
In Figure 5a, at a cutting speed of 500 rpm, the surface has grooves and ridges parallel to the machining direction. This indicates a high roughness of the surface. At the higher cutting speed of 1000 rpm, the ridges become narrower indicating an improvement of surface roughness as shown in Figure 5b. A smoother surface is observed in Figure 5c at a high cutting speed of 1500 rpm. The results are consistent with the previous researchers that showed better surface finish at higher cutting speeds. For more investigation, the surface roughness of copper samples was determined based on single acquisition and stitching measurement. Figure 6, Figure 7 and Figure 8 show the 2D and 3D surface textures of copper samples. The surface roughness parameters of at low, medium and high cutting speeds were also determined.
The roughness was also assessed in terms of Ra, Rp, Rq, Rt, and Rv parameters to evaluate the surface quality after orthogonal cutting by turning operation [41]. The variations of roughness parameters as a function of the cutting speed at constant feed rate and depth of cut are displayed in Figure 9.
It can be noticed that at a low cutting speed (500 rpm) the highest Ra and Rt values were 2.056 µm and 63.739 µm respectively. At the medium cutting speed of 1000 rpm, the highest Ra and Rt were 2.170 µm and 66.822 µm respectively. At the high cutting speed of 1500 rpm, the highest Ra value was 2.174 µm and the Rt was 54.893 µm. Hence, for the machined samples, both 2D and 3D surface textures gave a reasonable comparison and correlation between surface roughness and cutting speed. The values of Ra and Rq are almost constant for all cutting speeds. It can be interpreted that as the cutting speed increases, the temperature in the cutting zone increases and the diffusion rate of the material increases accordingly. The generated hardened chip due to the machining process slides on the tool surface. Then slight particles are detached from the tool and adhere to the machined surface making it rougher. This is consistent with the results of Biermann and Hollmann [42] who discussed the thermal influences in machining and cutting processes.

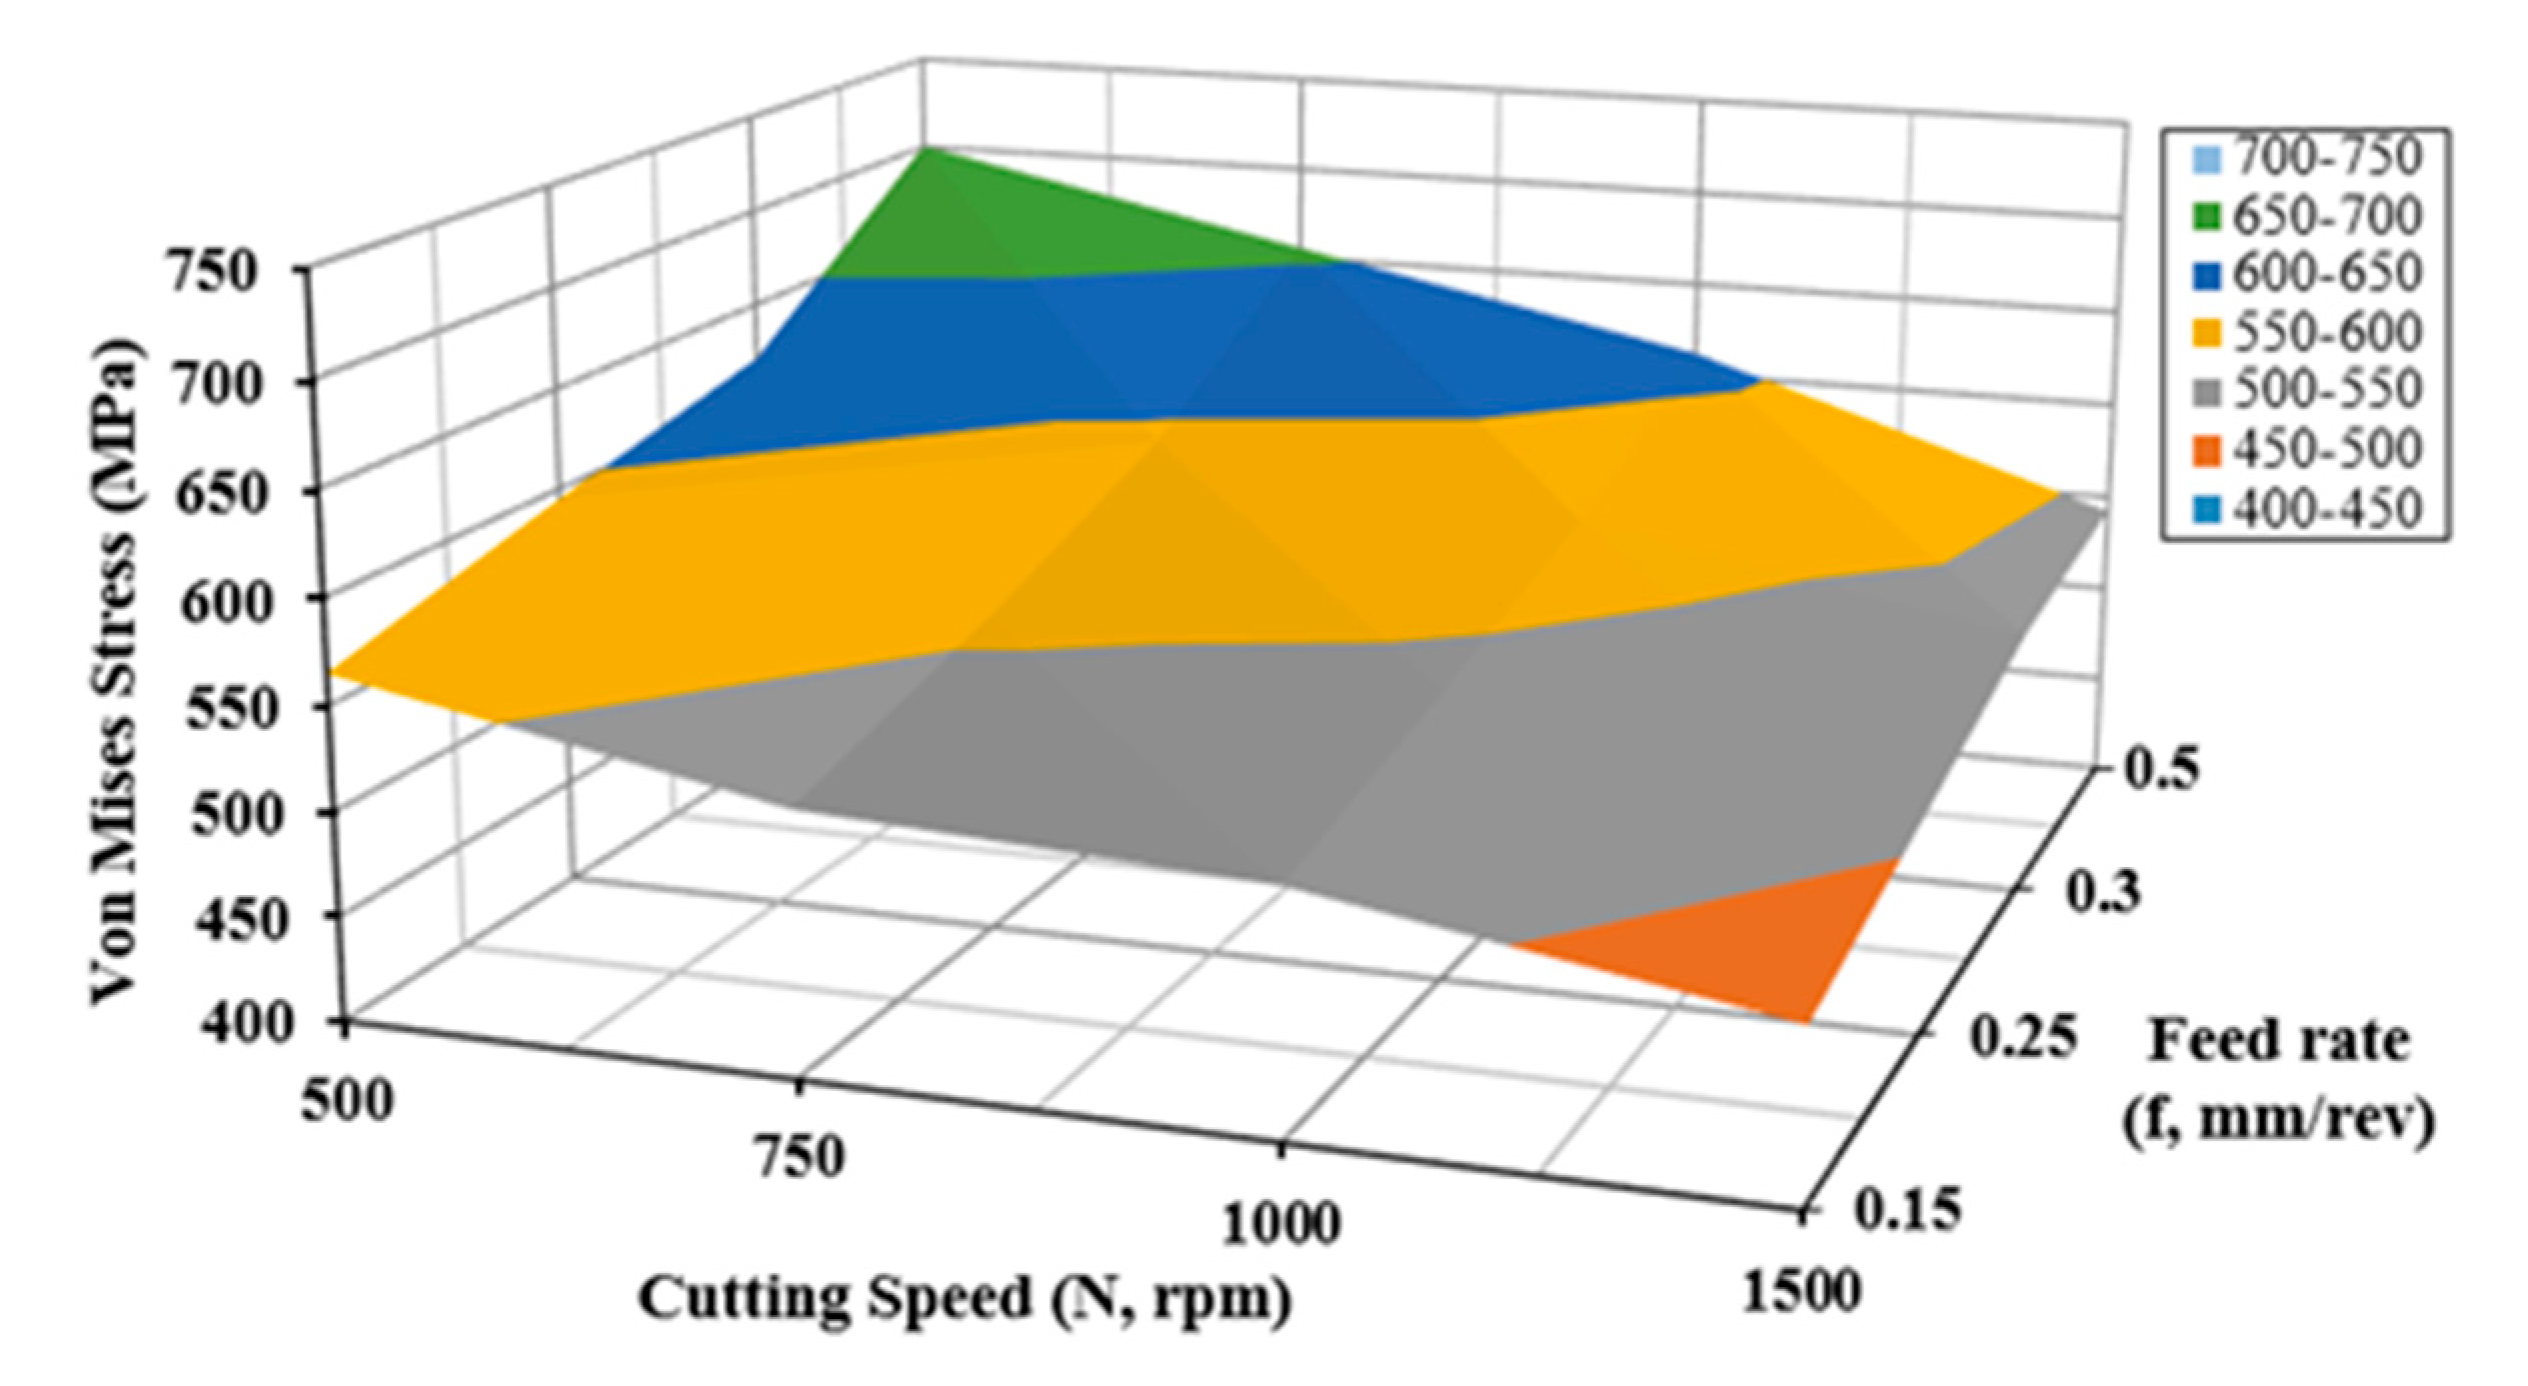
4.2. Results of Simulation Model

One of the most important objectives of the current work is to minimize the Von Mises stresses in terms of the cutting parameters. The simulation model that generated by finite element analysis was employed to evaluate the influence of machining conditions on Von-Mises plane stress (σV.M.). Here, the response surface method (RSM) was applied to visualize the simultaneous and interaction effects of both cutting speed and feed rate on Von-Mises stress as shown in Figure 10. Originally, RSM was established to model the experimental response. The application of RSM is aimed at reducing the cost of expensive analysis methods and giving accurate results. Furthermore, RSM reduces the effects of noise and allows using derivative-based algorithms. It can be noticed that Von-Mises stress (σV.M.) decreases with increasing the cutting speed for all feed rate values. This can be explained as follows: at higher cutting speed the temperature of work piece raises in the cutting region. Therefore, the material softening increases and lower stress value is observed [42,43]. It is also clear that Von-Mises stress (σV.M.) increases with increasing the feed rate. However, the combined effect of cutting speed and feed rate is more significant on the stress variation [44]. On the other hand, the tool-chip /tool workpiece interactions also affect the stress during the cutting process [45]. Increasing the feed rate means shorter contact period between the tool and workpiece. Consequently, the contact area decreases and this leads to an increase in the normal stress. Furthermore, a plastic deformation occurs in the deformation zone (shown in Figure 2a). This zone has an essential effect on the penetration depth of the plastic deformation of the workpiece due to the lack of strain hardening.
It became clear that Von-Mises stresses are affected by the interaction of both cutting speed and feed rate rather than the effect of the individual parameter. Table 5 summarizes the obtained optimum results for Von-Mises stress in terms of the cutting speed and feed rate.
Figure 11 displays an example of Von-Mises stress distribution along the work piece during orthogonal cutting for two selected conditions. Figure 11a shows the stress distribution at the low cutting speed of 500 rpm and high feed rate of 0.5 mm/rev, while Figure 11b shows the stress distribution at high cutting speed of 1500 rpm and low feed rate of 0.15 mm/rev. It is observed that the stress is higher at low cutting speed and high feed rate than that at high cutting speed and low feed rate. This result matches with the experimental results obtained by profiling system and shown in Figure 9.

5. Conclusions

In this work, the influence of machining parameters on the surface roughness of pure copper was investigated. Finite element analysis (FEA) was applied to simulate and determine a correlation between the roughness parameters and stress of the material by using Von-Mises theory. A modern non-contacting (optical) technique using light interferometry system was used successfully to measure and display the surface roughness and surface texture of pure copper after turning operation at various cutting conditions. The results provided the surface parameters in terms of Ra, Rq, Rt, and Rp. At higher cutting speed, the surface roughness enhanced in terms of some parameters. For Rt parameter, an enhancement of ~14% in surface roughness was observed. However, the Ra and Rq parameters remained constant with increasing the cutting speed. For good surface roughness, it can be recommended that turning operation on pure copper is to be conducted at cutting speed higher than 1000 rpm but at a feed rate up to 0.2 mm/rev and depth of cut less than 0.5 mm. The SEM images showed the better surface quality of copper at high cutting speed rather than lower speeds and this validates the obtained experimental and numerical results. The finite element (FE) model and surface roughness methodology are suitable and accurate for correlating and visualizing the machining conditions and the maximum value of Von-Mises stress and can be applied to similar materials. Furthermore, a good agreement was observed between experimental and analytical results.

Author Contributions

O.M.I. and H.Z. shared equally in all stages of this paper.

Funding

This research received no external funding.

Acknowledgments

The authors gratefully acknowledge Qassim University, represented by the Engineering College and Deanship of Scientific Research, for the material support for this research.

Conflicts of Interest

The authors declare no conflict of interest.

References

  1. Hatem, H. Study the Effect of Cutting Conditions for turning process on the Machined Surface. Nahrain Univ. Coll. Eng. J. 2011, 14, 61–66. [Google Scholar]
  2. Ashvin, J.; Nanavati, J.I. Optimization of machining parameters for turning operations based on response surface methodology. Measurement 2013, 46, 1521–1529. [Google Scholar]
  3. Sarosh, M.; Jahanzaib, M.; Mumtaz, J.; Sarfraz, S. Investigation of Electric Discharge Machining Parameters to Minimize Surface Roughness. Pak. J. Sci. 2016, 68, 315–325. [Google Scholar]
  4. Charles, S.; Arunachalam, V.P. Property Analysis and Mathematical modeling of machining properties of Aluminum alloy hybrid composites produced by liquid metallurgy techniques. Indian J. Eng. Mater. Sci. 2004, 11, 473–480. [Google Scholar]
  5. Shin, Y.C.; Coker, S.A. Surface Roughness Measure by Ultrasonic Sensing for in Process Monitoring. J. Eng. Ind. 1995, 117, 439–447. [Google Scholar] [CrossRef]
  6. Shoba, C.; Ramanaiah, N.; Rao, D.N. Optimizing the Machining Parameters for Minimum Surface Roughness in Turning Al/6% SiC/6% RHA Hybrid Composites. Procedia Mater. Sci. 2015, 10, 220–229. [Google Scholar] [CrossRef]
  7. Suresh, P.V.S.; Rao, P.V.; Deshmukh, S.G. A genetic algorithmic approach for optimization of surface roughness prediction model. Int. J. Mach. Tools Manuf. 2002, 42, 675–680. [Google Scholar] [CrossRef]
  8. Davim, J.P. A note on the determination of optimal cutting conditions for surface finish obtained in turning using design of experiments. J. Mater. Process. Technol. 2001, 116, 305–308. [Google Scholar] [CrossRef]
  9. Gouveia, R.M.; Silva, F.J.G.; Reis, P.; Baptista, A.P.M. Machining Duplex Stainless Steel: Comparative Study Regarding End Mill Coated Tools. Coatings 2016, 6, 51. [Google Scholar] [CrossRef]
  10. El-Gallab, M.; Sklad, M. Machining of Al/SiCp metal matrix composites, part 1. Tool performance. J. Mater. Process. Technol. 1998, 83, 151–158. [Google Scholar] [CrossRef]
  11. Shyha, I.; Gariani, S.; El-Sayed, M.A.; Huo, D. Analysis of Microstructure and Chip Formation When Machining Ti-6Al-4V. Metals 2018, 8, 185. [Google Scholar] [CrossRef]
  12. Bhushan, R.K.; Kumar, S.; Das, S. Effect of machining parameters on surface roughness and tool wear for 7075 Al alloy SiC composite. Int. J. Adv. Manuf. Technol. 2010, 50, 459–469. [Google Scholar] [CrossRef]
  13. Ozben, T.; Kilickap, E.; Cakir, O. Investigation of mechanical and machinability properties of SiC particle reinforced Al-MMC. J. Mater. Process. Technol. 2008, 198, 220–225. [Google Scholar] [CrossRef]
  14. Thiele, J.; Melkote, S. Effect of innovative geometry and workpiece hardness on surface generation in the finish hard turning of AISI 52100 Steel. J. Mater. Process. Technol. 1999, 94, 216–226. [Google Scholar] [CrossRef]
  15. Aouici, H.; Yallese, M.A.; Fnides, B.; Mabrouki, T. Machinability investigation in hard turning of AISI H11 hot work steel with CBN tool. Mechanika 2010, 6, 71–77. [Google Scholar]
  16. Shashi Kiran, G.; Prasanna, N.D. Machinability Studies on Copper Based Alloy Optimization of Control Parameters in Turning Operation Using Taguchi Method. Int. J. Eng. Res. Technol. 2013, 2, 1248–1255. [Google Scholar]
  17. Papanikolaou, M.; Frank, M.; Drikakis, D. Effects of surface roughness on shear viscosity. Phys. Rev. 2017, 95, 33108. [Google Scholar] [CrossRef] [PubMed]
  18. Fnides, B.; Aouici, H.; Yallese, M.A. Cutting forces and surface roughness in hard turning of hot work steel X38CrMoV5-1 using mixed ceramic. J. Mech. 2008, 2, 73–78. [Google Scholar]
  19. Sundara Murthy, K.; Rajendran, I. A study on optimization of cutting parameters and prediction of surface roughness in end milling of aluminum under MQL machining. Int. J. Mach. Mach. Mater. 2010, 7, 112–128. [Google Scholar]
  20. Bacaria, J.L.; Dalverny, O.; Pantale, O.; Rakotomalala, R.; Caperaa, S. 2D and 3D Numerical Models of Metal Cutting with Damage Effects. Comput. Methods Appl. Mech. Eng. 2004, 193, 4383–4399. [Google Scholar]
  21. Sivararnakrishnaiah, M.; Nanda, K.P. Effect of Cutting Speed in Turning Process using Finite Element Modeling. Int. J. Latest Trends Eng. Technol. 2016, 7, 32–36. [Google Scholar]
  22. Xuebin, L.; Xibin, W.; Chongning, L.; Sanpeng, D. Finite Element Simulation of the Orthogonal Cutting Based on Abaqus. Adv. Mater. Res. 2013, 821–822, 1410–1413. [Google Scholar]
  23. Kun, H.; Wenyu, Y.; Qilin, C. Analytical model of stress field in workpiece machined surface layer in orthogonal cutting. Int. J. Mech. Sci. 2015, 103, 127–140. [Google Scholar]
  24. Irfan, O.M.; Mukras, S.M.S.; Al-Mufadi, F.A.; Djavanroodi, F. Surface Modelling of Nanostructured Copper Subjected to Erosion-Corrosion. Metals 2017, 7, 155. [Google Scholar] [CrossRef]
  25. Mahajan, K.A.; Sadaiah, M.; Gawande, S.H. Experimental Investigations of Surface Roughness on OFHC Copper by Diamond Turning Machine. Int. J. Eng. Sci. Technol. 2010, 2, 5215–5220. [Google Scholar]
  26. Available online: http://www.circuitinsight.com/pdf/measuring_copper_surface_roughness_ipc.pdf (accessed on 20 February 2018).
  27. Simulia. Abaqus Analysis User’s Manual, Volume IV: Elements; Dassault Systèmes Simulia Corp.: Johnston, RI, USA, 2016; pp. 29.6.1–29.6.10. [Google Scholar]
  28. Feng, B. Effects of surface roughness on scratch resistance and stress-strain fields during scratch tests. AIP Adv. 2017, 7, 35217. [Google Scholar] [CrossRef] [Green Version]
  29. Kiener, D.; Motz, C.; Schoberl, T.; Jenko, M.; Dehm, G. Determination of Mechanical Properties of Copper at the Micron Scale. Adv. Eng. Mater. 2006, 8, 1119–1125. [Google Scholar] [CrossRef]
  30. Wedberg, D.; Svoboda, A.; Lindgren, L.-E. Modelling high strain rate phenomena in metal cutting simulation. Model. Simul. Mater. Sci. Eng. 2012, 20, 1–19. [Google Scholar] [CrossRef]
  31. Arrazola, P.J.; Villar, A.; Ugarte, D.; Marya, S. Serrated chip prediction in Finite Element modeling of the chip formation process. Mach. Sci. Technol. 2007, 11, 367–390. [Google Scholar]
  32. Johnson, G.R.; Cook, W.H. Fracture Characteristics of Three Metals Subjected to Various Strains, strain Rates, Temperature, and Pressures. Eng. Fract. Mech. J. 1985, 21, 31–48. [Google Scholar] [CrossRef]
  33. Agmell, M.; Ahadi, A.; Stahl, J.E. The Link between Plasticity Parameters and Process Parameters in Orthogonal Cutting. Procedia CIRP 2013, 8, 224–229. [Google Scholar] [CrossRef]
  34. Zouhar, J.; Piska, M. Modelling the orthogonal machining process using cutting tools with different geometry. MM Sci. J. 2008, 48/49, 1–4. [Google Scholar] [CrossRef]
  35. Liu, J.; Bai, Y.; Xu, C. Evaluation of ductile fracture models in finite element simulation of metal cutting processes. J. Manuf. Sci. Eng. 2014, 136, 1–14. [Google Scholar] [CrossRef]
  36. Wang, B.; Liu, Z. Shear localization sensitivity analysis for Johnson–Cook constitutive parameters on serrated chips in high speed machining of Ti6Al4V. Simul. Model. Pract. Theory 2015, 55, 63–76. [Google Scholar] [CrossRef]
  37. Wang, K. Calibration of the Johnson-Cook Failure Parameters as the Chip Separation Criterion in the Modeling of the Orthogonal Metal Cutting Process. Master’s Thesis, McMaster University, Hamilton, ON, Canada, 2016; pp. 47–50. [Google Scholar]
  38. Bendarma, A.; Jankowiak, T.; Rusinek, A.; Klosak, M. Experimental and numerical analysis of aluminum alloy AW5005 behavior subjected to tension and perforation under dynamic loading. J. Theor. Appl. Mech. 2017, 55, 1219–1233. [Google Scholar] [CrossRef]
  39. ABAQUS. Abaqus/Explicit User’s Manuals; Version 6.11; Dassault Systèmes Simulia Corp.: Providence, RI, USA, 2011. [Google Scholar]
  40. Barber, J.R. Intermediate Mechanics of Materials, 2nd ed.; Springer: New York, NY, USA, 2011. [Google Scholar]
  41. Irfan, O.M.; Al-Mufadi, F.; Al-Shataif, Y.; Djavanroodi, F. Effect of Equal Channel Angular Pressing (ECAP) on Erosion-Corrosion of Pure Copper. Appl. Sci. 2017, 7, 1250. [Google Scholar] [CrossRef]
  42. Biermann, D.; Hollmann, F. Thermal Effects in Complex Machining Processes; Springer International Publishing AG: Basel, Switzerland, 2018; p. 127. [Google Scholar]
  43. Biermann, D.; Liedschulte, M. Plasma-assisted turning of hard alloys on an iron base with PKB. Ind. Diam. Rundsch. 1994, 28, 71–77. [Google Scholar]
  44. Astakhov, V.P. Effects of the cutting feed, depth of cut, and work piece (bore) diameter on the tool wear rate. Int. J. Adv. Manuf. Technol. 2007, 34, 631–640. [Google Scholar] [CrossRef]
  45. Agmell, M.; Ahadi, A.; Gutnichenko, O.; Stahl, J. The influence of tool micro-geometry on stress distribution in turning operations of AISI 4140 by FE analysis. Int. J. Adv. Manuf. Technol. 2017, 89, 3109–3122. [Google Scholar] [CrossRef]
Figure 1. Optical profiler system used in the current study for surface roughness measurement.
Metals 08 00418 g001
Figure 2. Finite element modeling for single point orthogonal cutting.
Metals 08 00418 g002
Figure 3. Illustration of tensile test data in a stress-strain curve with progressive damage degradation [35,36,37,38,39].
Metals 08 00418 g003
Figure 4. Schematic illustration of the material failure mode in distortion energy theory.
Metals 08 00418 g004
Figure 5. SEM images of the machined surface at different cutting speeds (f = 0.5 mm/rev, dc = 0.5 mm). (a) 500 rpm; (b) 1000 rpm; (c) 1500 rpm.
Metals 08 00418 g005
Figure 6. Surface texture and roughness parameters of the machined surface at cutting speed =500 rpm. (a) 2D image; (b) 3D image.
Metals 08 00418 g006
Figure 7. Surface texture and roughness parameters of the machined surface at cutting speed =1000 rpm. (a) 2D image; (b) 3D image.
Metals 08 00418 g007
Figure 8. Surface texture and roughness parameters of the machined surface at cutting speed =1500 rpm. (a) 2D image; (b) 3D image.
Metals 08 00418 g008
Figure 9. Effect of cutting speed on the surface roughness parameters of copper.
Metals 08 00418 g009
Figure 10. Interaction effect of cutting speed and feed rate on Von-Mises stress.
Metals 08 00418 g010
Figure 11. Von-Mises stress distribution in orthogonal cutting at two cutting conditions.
Metals 08 00418 g011
Table 1. Cutting Conditions applied in this study.
GroupConstant Cutting ConditionSamplesChanged Cutting Condition
Sample No.
1 Metals 08 00418 i0012 Metals 08 00418 i0023 Metals 08 00418 i0034 Metals 08 00418 i0045 Metals 08 00418 i005
AN = 750, dc = 0.5f, (mm/rev)0.050.100.150.250.35
Bƒ = 0.5, dc = 0.5N, (rpm)500750100012501500
Cƒ = 0.5, N = 750dc, (mm)0.100.150.250.51.0
Table 2. Properties of workpiece material [29].
PropertyValue
Young’s modulus (E)117 GPa
Poisson’s ratio (ν)0.33
Density (ρ)8950 Kg/m3
Yield stress (σyo)112 MPa
Table 3. Parameters used in the Johnson-Cook model for pure copper [32].
ABCnm
90 MPa292 MPa0.0250.311.09
Table 4. Johnson-Cook damage model parameters for copper [32].
D1D2D3D4D5
0.544.89−3.030.0141.12
Table 5. Optimum cutting parameters for minimum Von Mises stress of copper.
ParameterObjectiveOptimum Cutting Conditions
Von Mises (σV.M.) stressMinimumN, (rpm)f, (mm/rev)dc, (mm)
15000.150.5

