Article

Characteristics of Welding and Arc Pressure in the Plasma–TIG Coupled Arc Welding Process

1
State Key Laboratory of Advanced Welding and Joining, Harbin Institute of Technology, Harbin 150001, China
2
Institute for Shipwelding Technology, Shandong Institute of Shipbuilding Technology, Weihai 264209, China
3
Weihai Wanfeng Magnesium Science and Technology Development Co., Ltd., Weihai 264209, China
4
Department of Electrical Engineering, Harbin University of Science and Technology, Rongcheng, 264300, China
*
Authors to whom correspondence should be addressed.
Metals 2018, 8(7), 512; https://doi.org/10.3390/met8070512
Submission received: 25 May 2018 / Revised: 27 June 2018 / Accepted: 29 June 2018 / Published: 3 July 2018
(This article belongs to the Special Issue Science, Characterization and Technology of Joining and Welding)

Abstract

:
In this article, a novel hybrid welding process called plasma-TIG (Tungsten Inert Gas welding) coupled arc welding was proposed to improve the efficiency and quality of welding by utilizing the full advantage of plasma and TIG welding processes. The two arcs of plasma and TIG were pulled into each other into one coupled arc under the effect of Lorentz force and plasma flow force during welding experiments. The arc behavior of coupled arc was studied by means of its arc profile, arc pressure and arc force conditions. The coupled arc pressure distribution measurements were performed. The effects of welding conditions on coupled arc pressure were evaluated and the maximum coupled arc pressure was improved compared with single-plasma arc and single-TIG arc. It was found that the maximum arc pressure was mainly determined by plasma arc current and plasma gas flow. Compared with traditional hybrid welding method, the efficiency was obviously higher and the welding heat-input was lower. The epitaxial solidification of the weld was inhibited, the tensile strength of the welded joints was higher. According to the results, the proposed coupled arc welding process has both advantages of plasma arc and TIG method, and it has a broad application prospect.

1. Introduction

Given the continuous development of processing and manufacturing technologies, traditional arc welding techniques such as plasma arc welding (PAW) [1] and tungsten inert gas (TIG) [2,3] welding process, have been improved to meet the requirements of enterprises for high-quality and low-consumption welding technology [4]. Based on the situation above, the hybrid welding methods with multiple heat sources are proposed. In recent years, hybrid welding methods have also been successfully applied in shipbuilding and spacecraft. Certain hybrid welding processes, including plasma–gas metal arc welding [5,6,7], plasma–TIG [8,9], laser–GMAW [10], laser–TIG [11] and TIG–MIG [12], have been successfully used in the manufacturing industry. In comparison with ordinary single-arc welding, hybrid welding technology can significantly improve welding efficiency and joint quality because it is simultaneously provided with multiple heat sources that complement one another [5].
PAW produces arc plasma with high energy density and high arc pressure under the thermal pinch effect of the water-cooled copper nozzle; thus, PAW has strong fusion and penetration abilities [13,14]. However, identifying the appropriate parameters in PAW process is difficult and the process is prone to undercutting [15]. The gas tungsten arc welding with DCEN (Direct Current Electrode Negative Epolarity) is a high efficiency welding process [16,17], and has a good surface forming ability and remarkably stable welding process, but its penetration capacity is poor. Therefore, researchers also proposed several hybrid welding processes that utilize the PAW and TIG arcs, which mainly include the double-sided arc welding (DSAW) and PAW–TIG welding processes [9]. The DSAW process can increase penetration and significantly improve welding productivity [18], in this process, a TIG torch is placed on the opposite side of welds to guide the PAW arc into the keyhole, thereby permitting the current to flow from the PAW torch through the welds to the TIG torch directly instead of the conventional welding current loop [8,19]. However, the welding accessibility of DSAW is poor compared with PAW welding process. The PAW–TIG welding method is realized by the PAW and the subsequent TIG on the movable slide rail, no correlation exists between the plasma and TIG arcs. This process can also enhance the welding productivity. However, the heat-affected zone is large and the grain is coarse because the weld is reheated by the TIG arc. The plasma–TIG coupled arc welding (PTCAW) process is a novel hybrid welding method for overcoming the above deficiencies in order to achieve efficient welding process and high-quality welds.
In this study, the PTCAW process was initially constructed and the coupled arc profile was then analyzed by a charge-coupled device (CCD) camera. The effects of welding conditions on the coupled arc pressure distribution was also studied to reveal the characteristics of the coupled arc welding process. The results provided the basis to recognize the PTCAW process and expanded the application range of PAW and TIG welding processes.

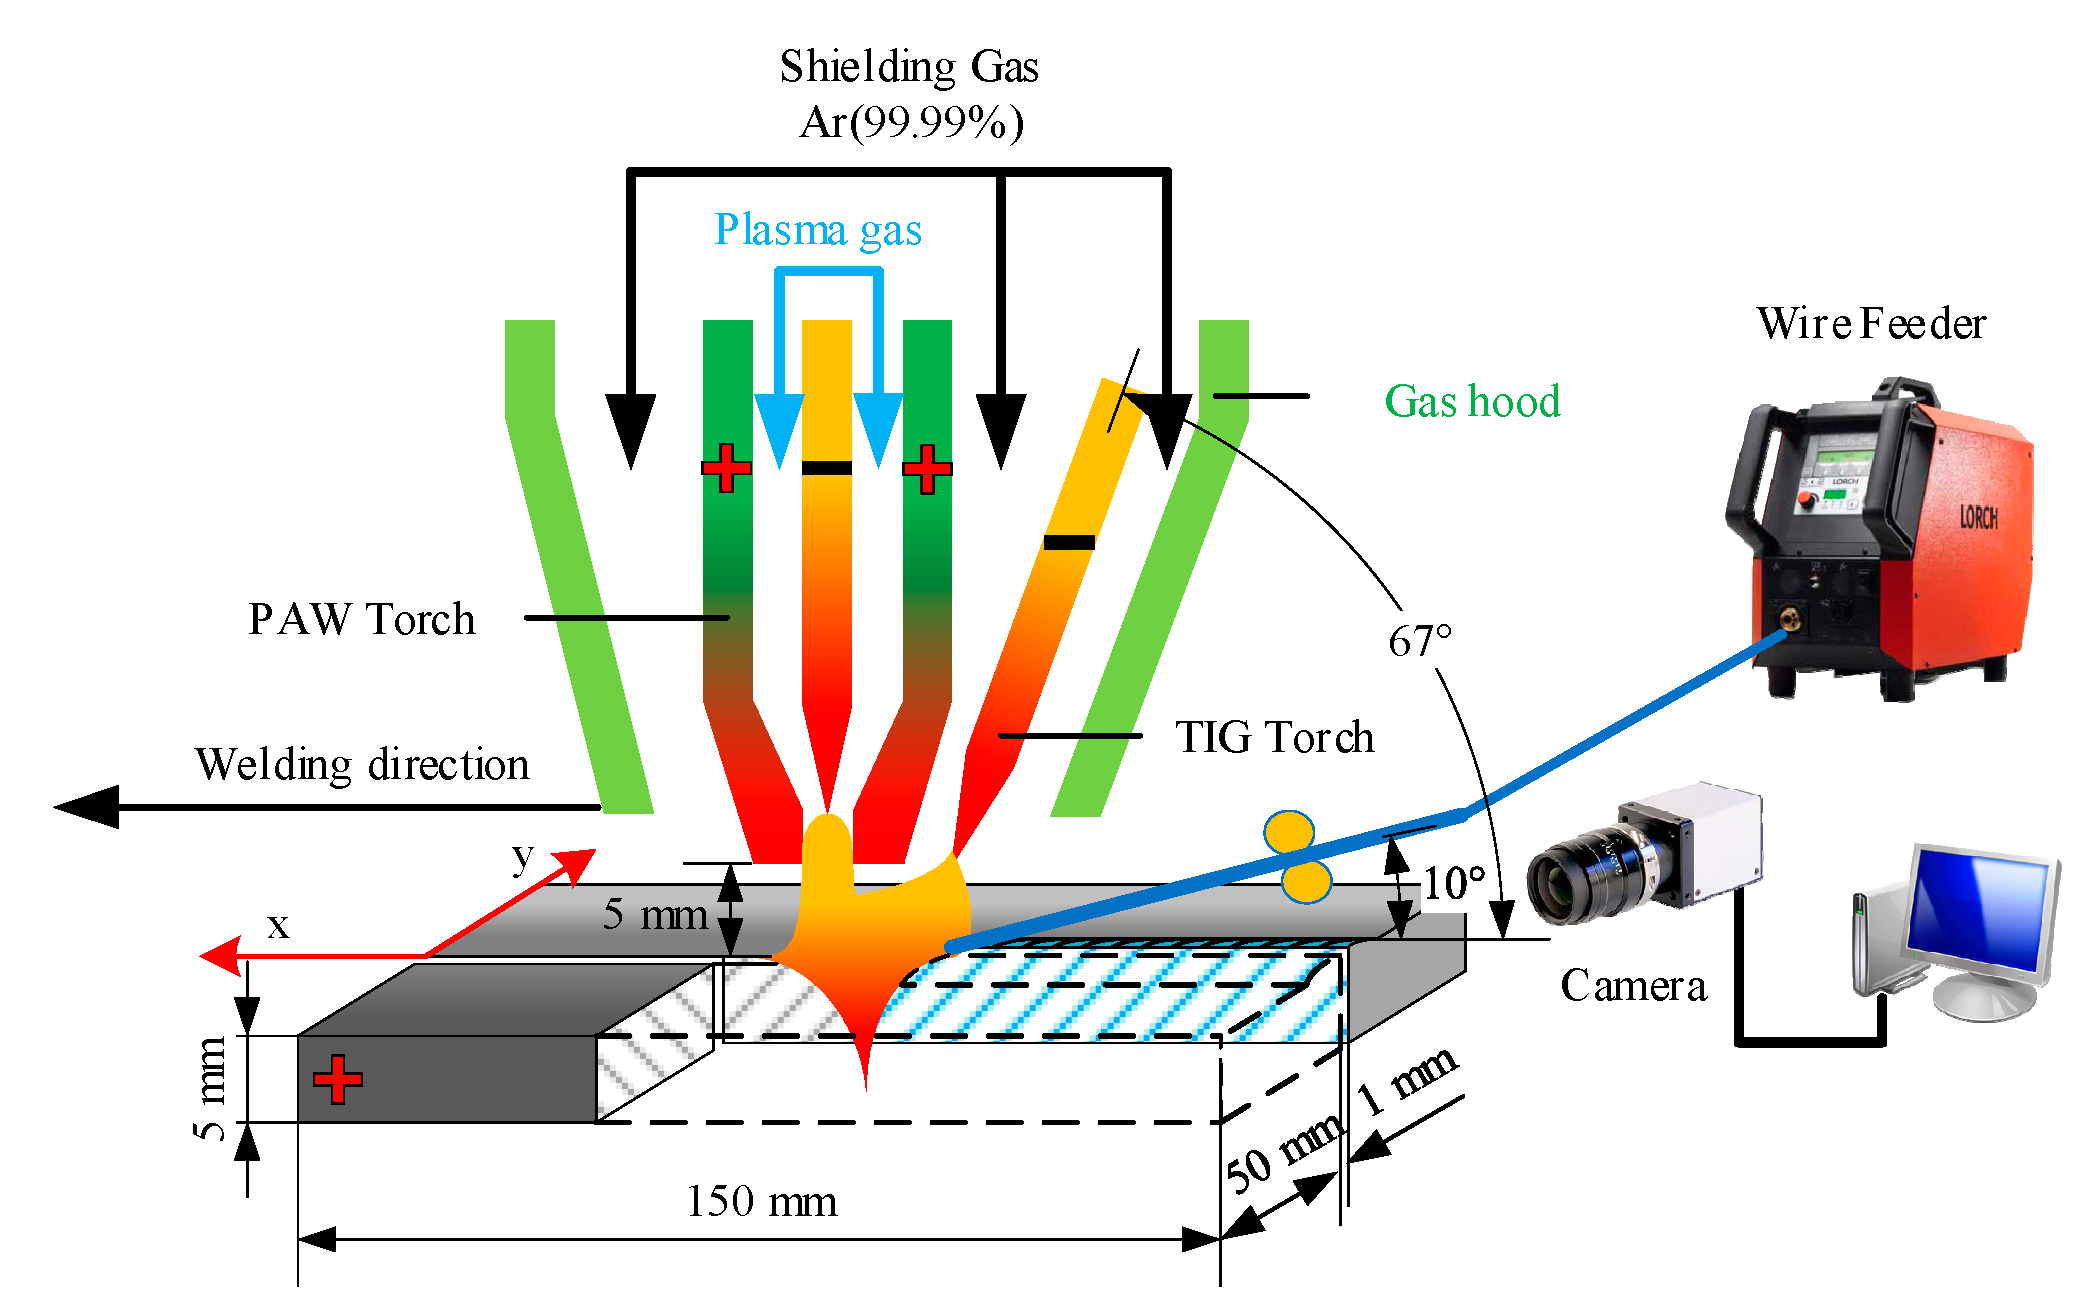
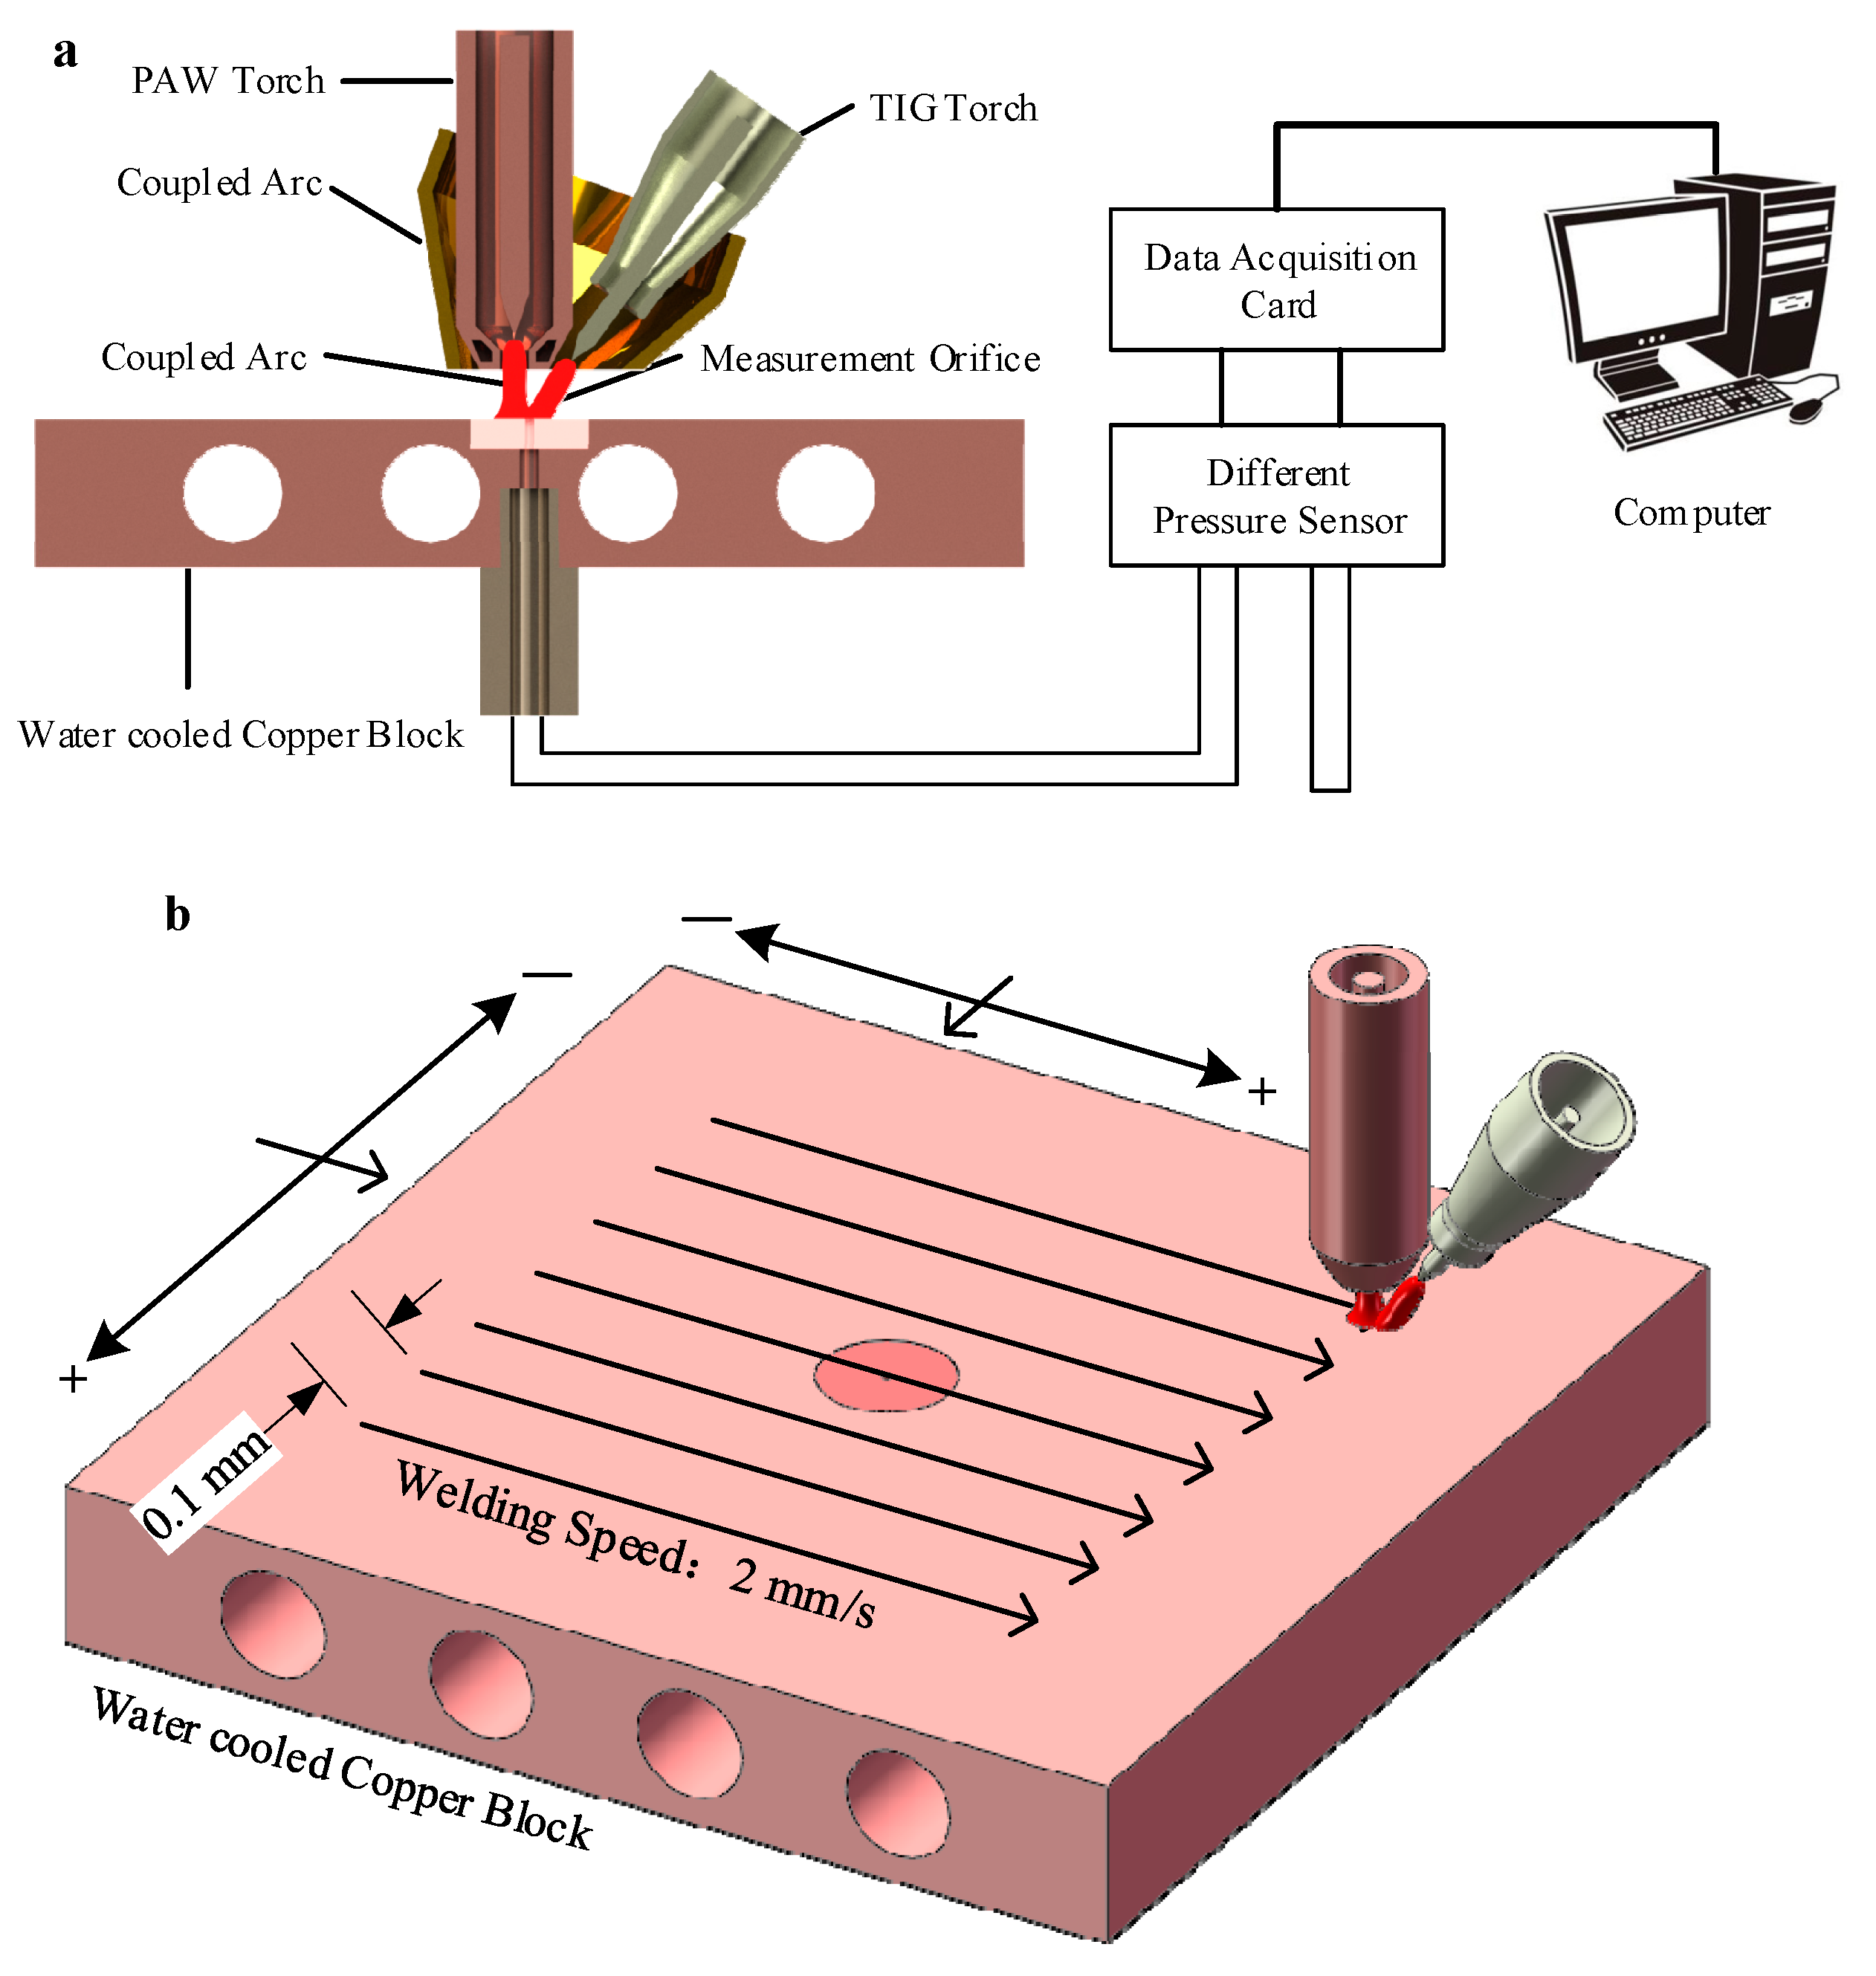
2. Materials and Methods

The schematic diagram of our experimental set-up is shown in Figure 1. The PAW and TIG torches were fixed on one fixture to realize the interaction between the two processes (i.e., PTCAW process). An experimental system was established according to the above designed principle. In the present system, the TIG arc was established by using a direct current–constant current (DC–CC) power supply (REHM InverTIG.Pro digital 240 AC/DC, Blaubeuren, Germany) under the direct current electrode negative (DCEN) condition. The PAW arcs were established by using an alternating current–direct current AC/DC (LORCH V50 AC/DV) and DC–CC (LORCH Handy TIG 180 DC, Auenwald, Germany) power supplies. The Xiris XVC-1000 weld camera (55 frames/s, Burlington, ON, Canada) was applied to observe and capture the arc profile and behavior under the different welding condition in real time [20]. The anode constricting nozzle of PAW made of red cooper with excellent thermal conductivity is cooled by forced recirculation cooling water to prevent the nozzle from being burned.
In all experiments, the PAW torch nozzle has a 3-mm orifice diameter, 3.2-mm tungsten diameter, and 3-mm tungsten setback. Pure argon (99.99%) was used as the plasma gas and shielding gas. The platform diameter of the TIG terminal electrode is 1.25 mm, and the shielding gas flow rate is 15 L/min. The electrode spacing is 7 mm, that is the distance from the plasma nozzle axis to the electrode tip of TIG. The nozzle height is the distance from the end of PAW nozzle to the workpiece surface. The detailed parameters for the designed experiments are shown in Table 1.

3. Results and Discussions

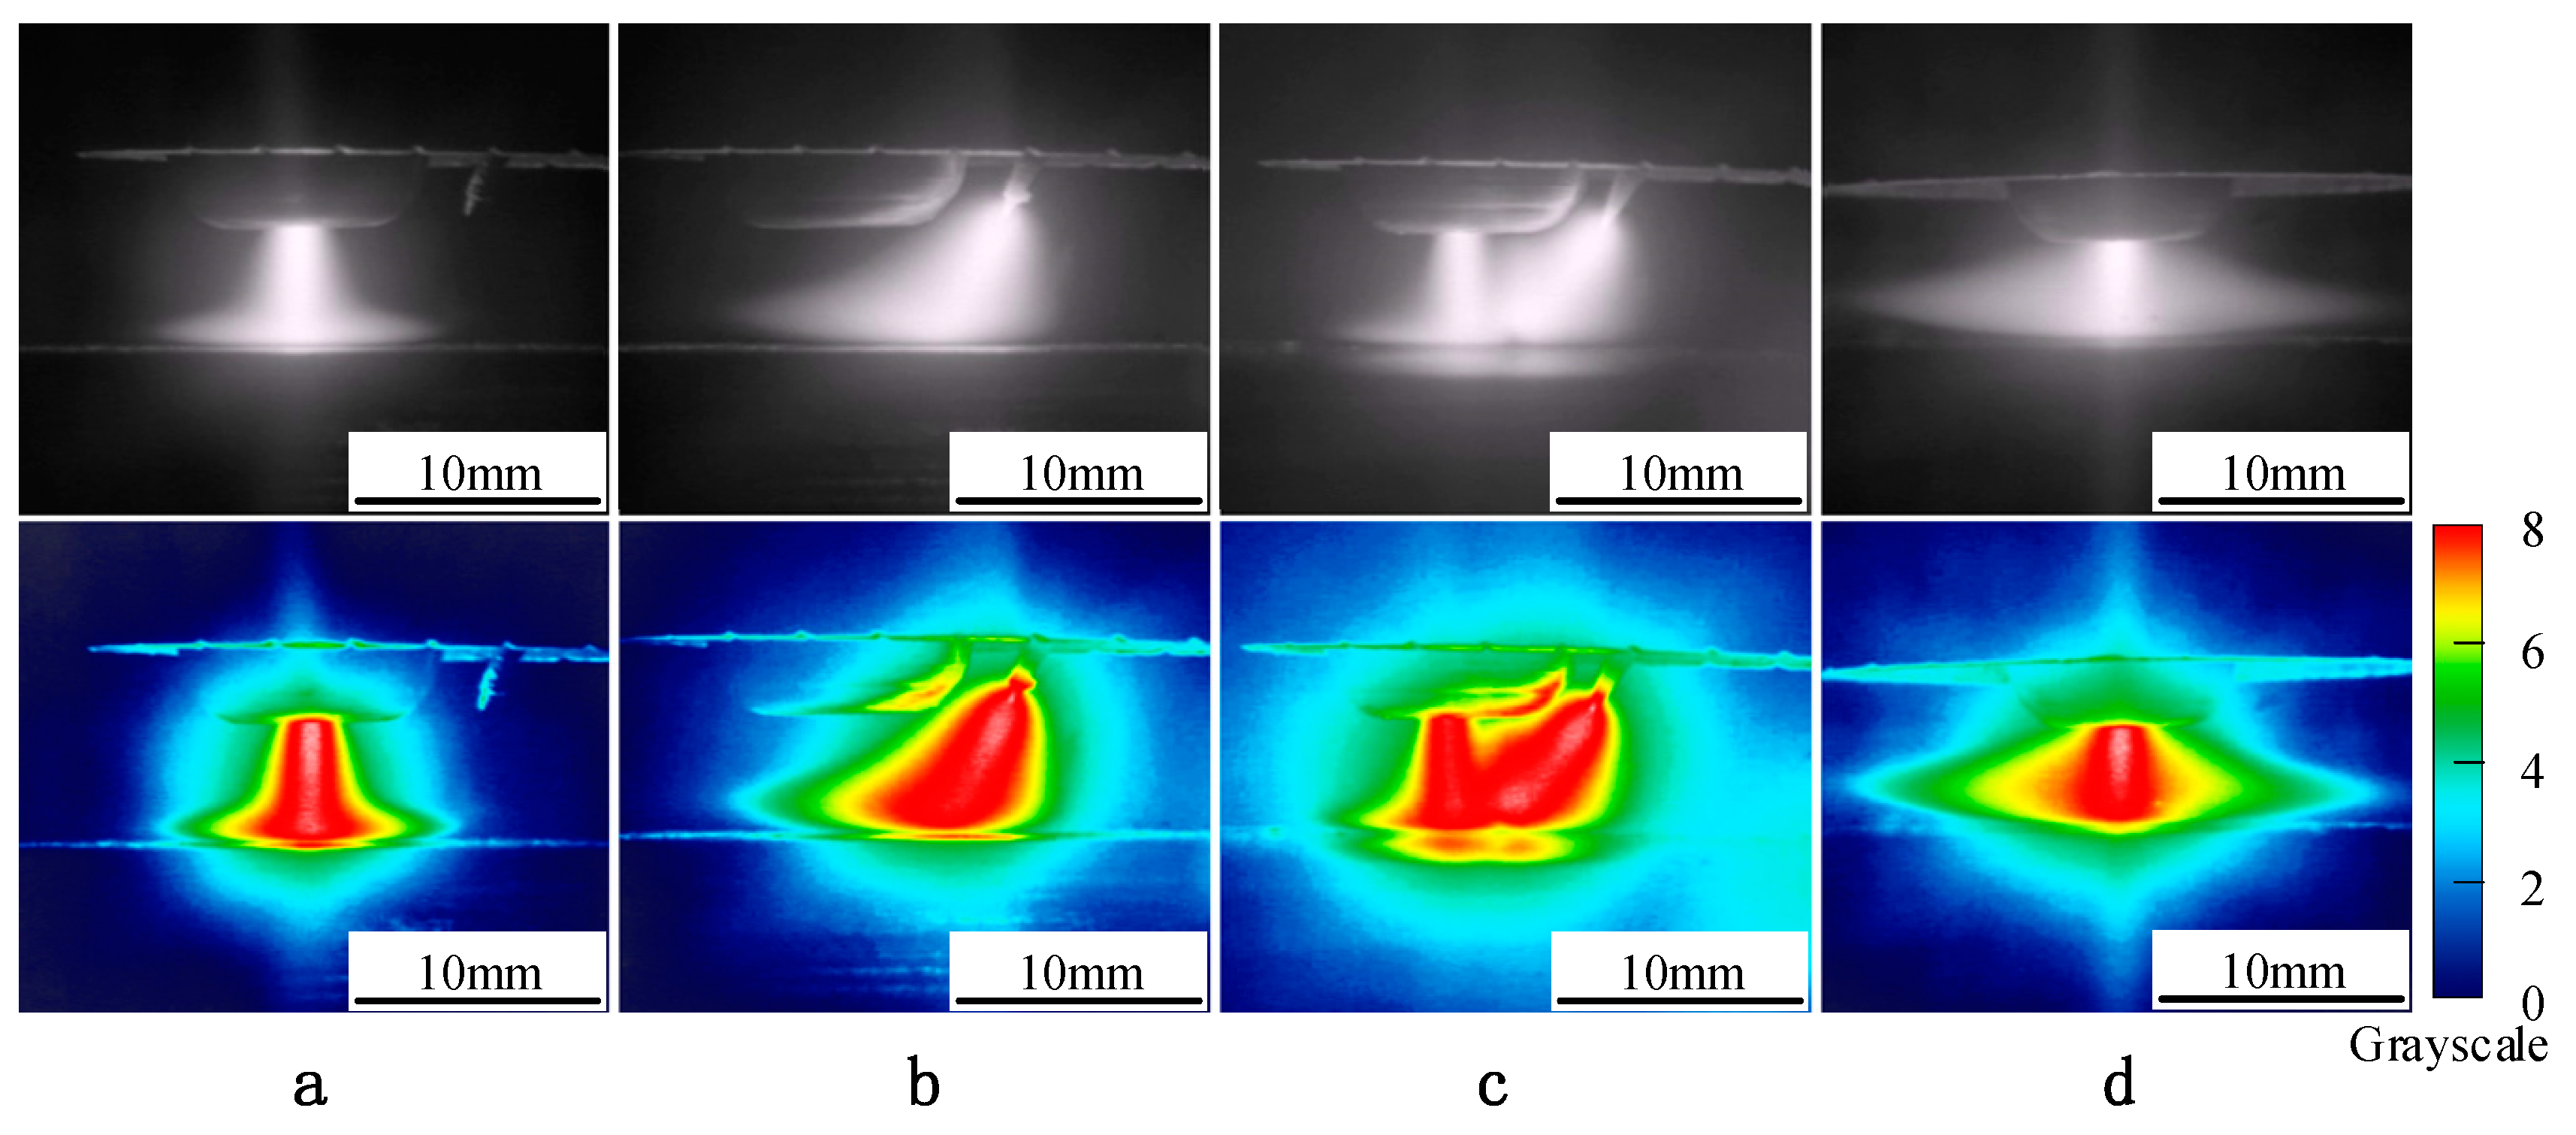
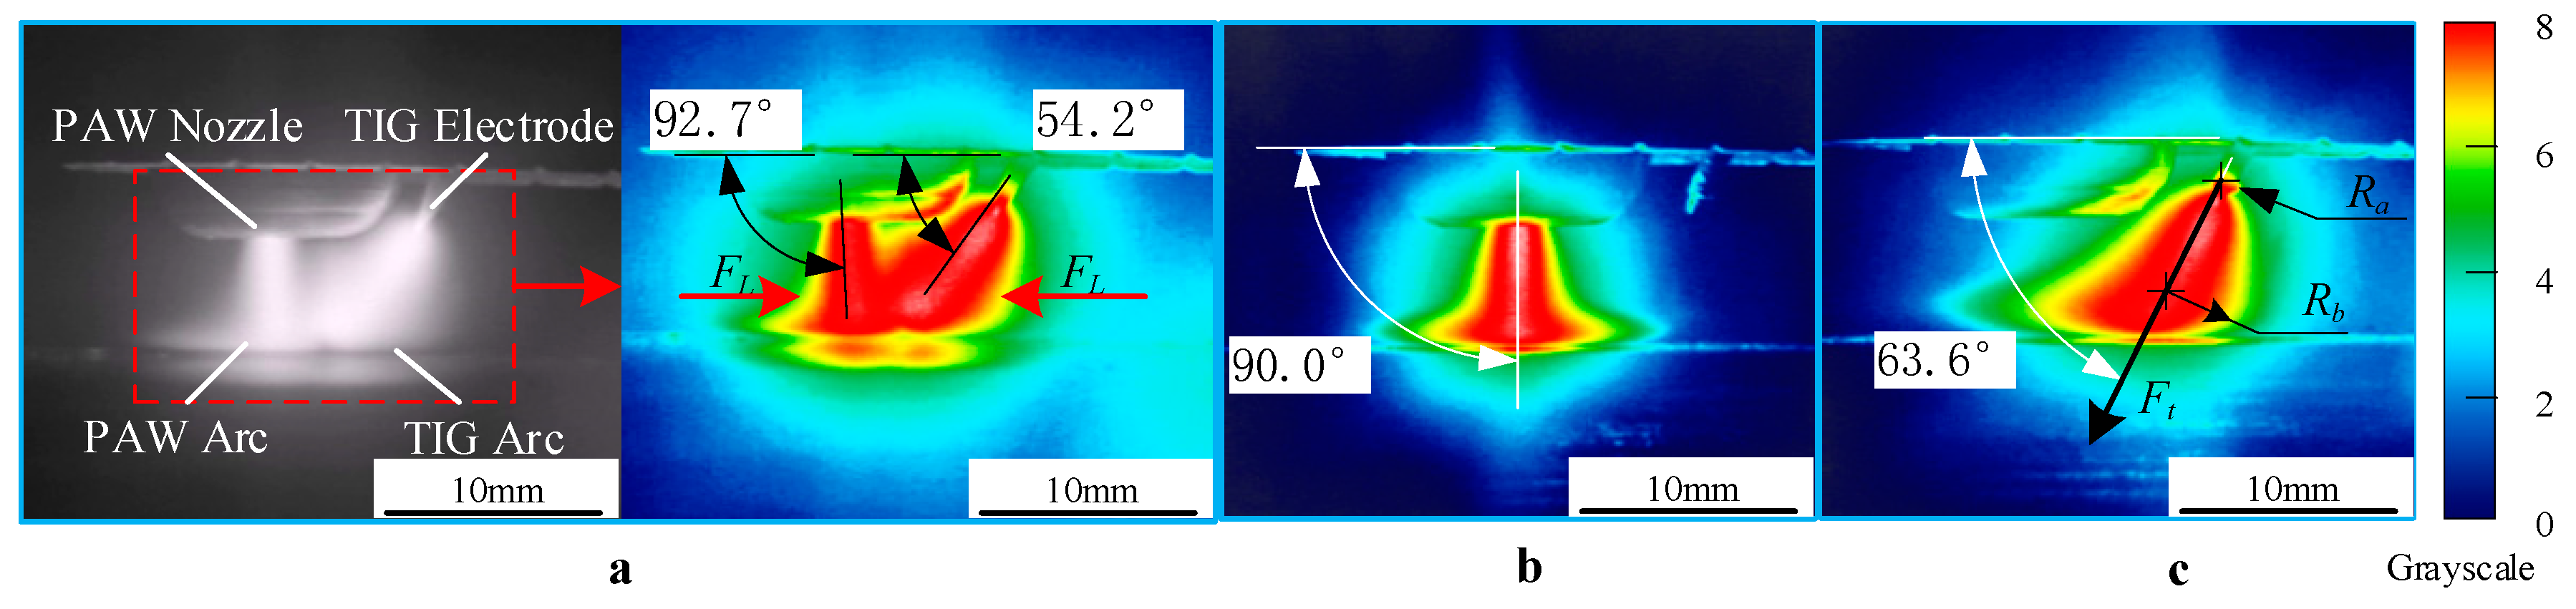
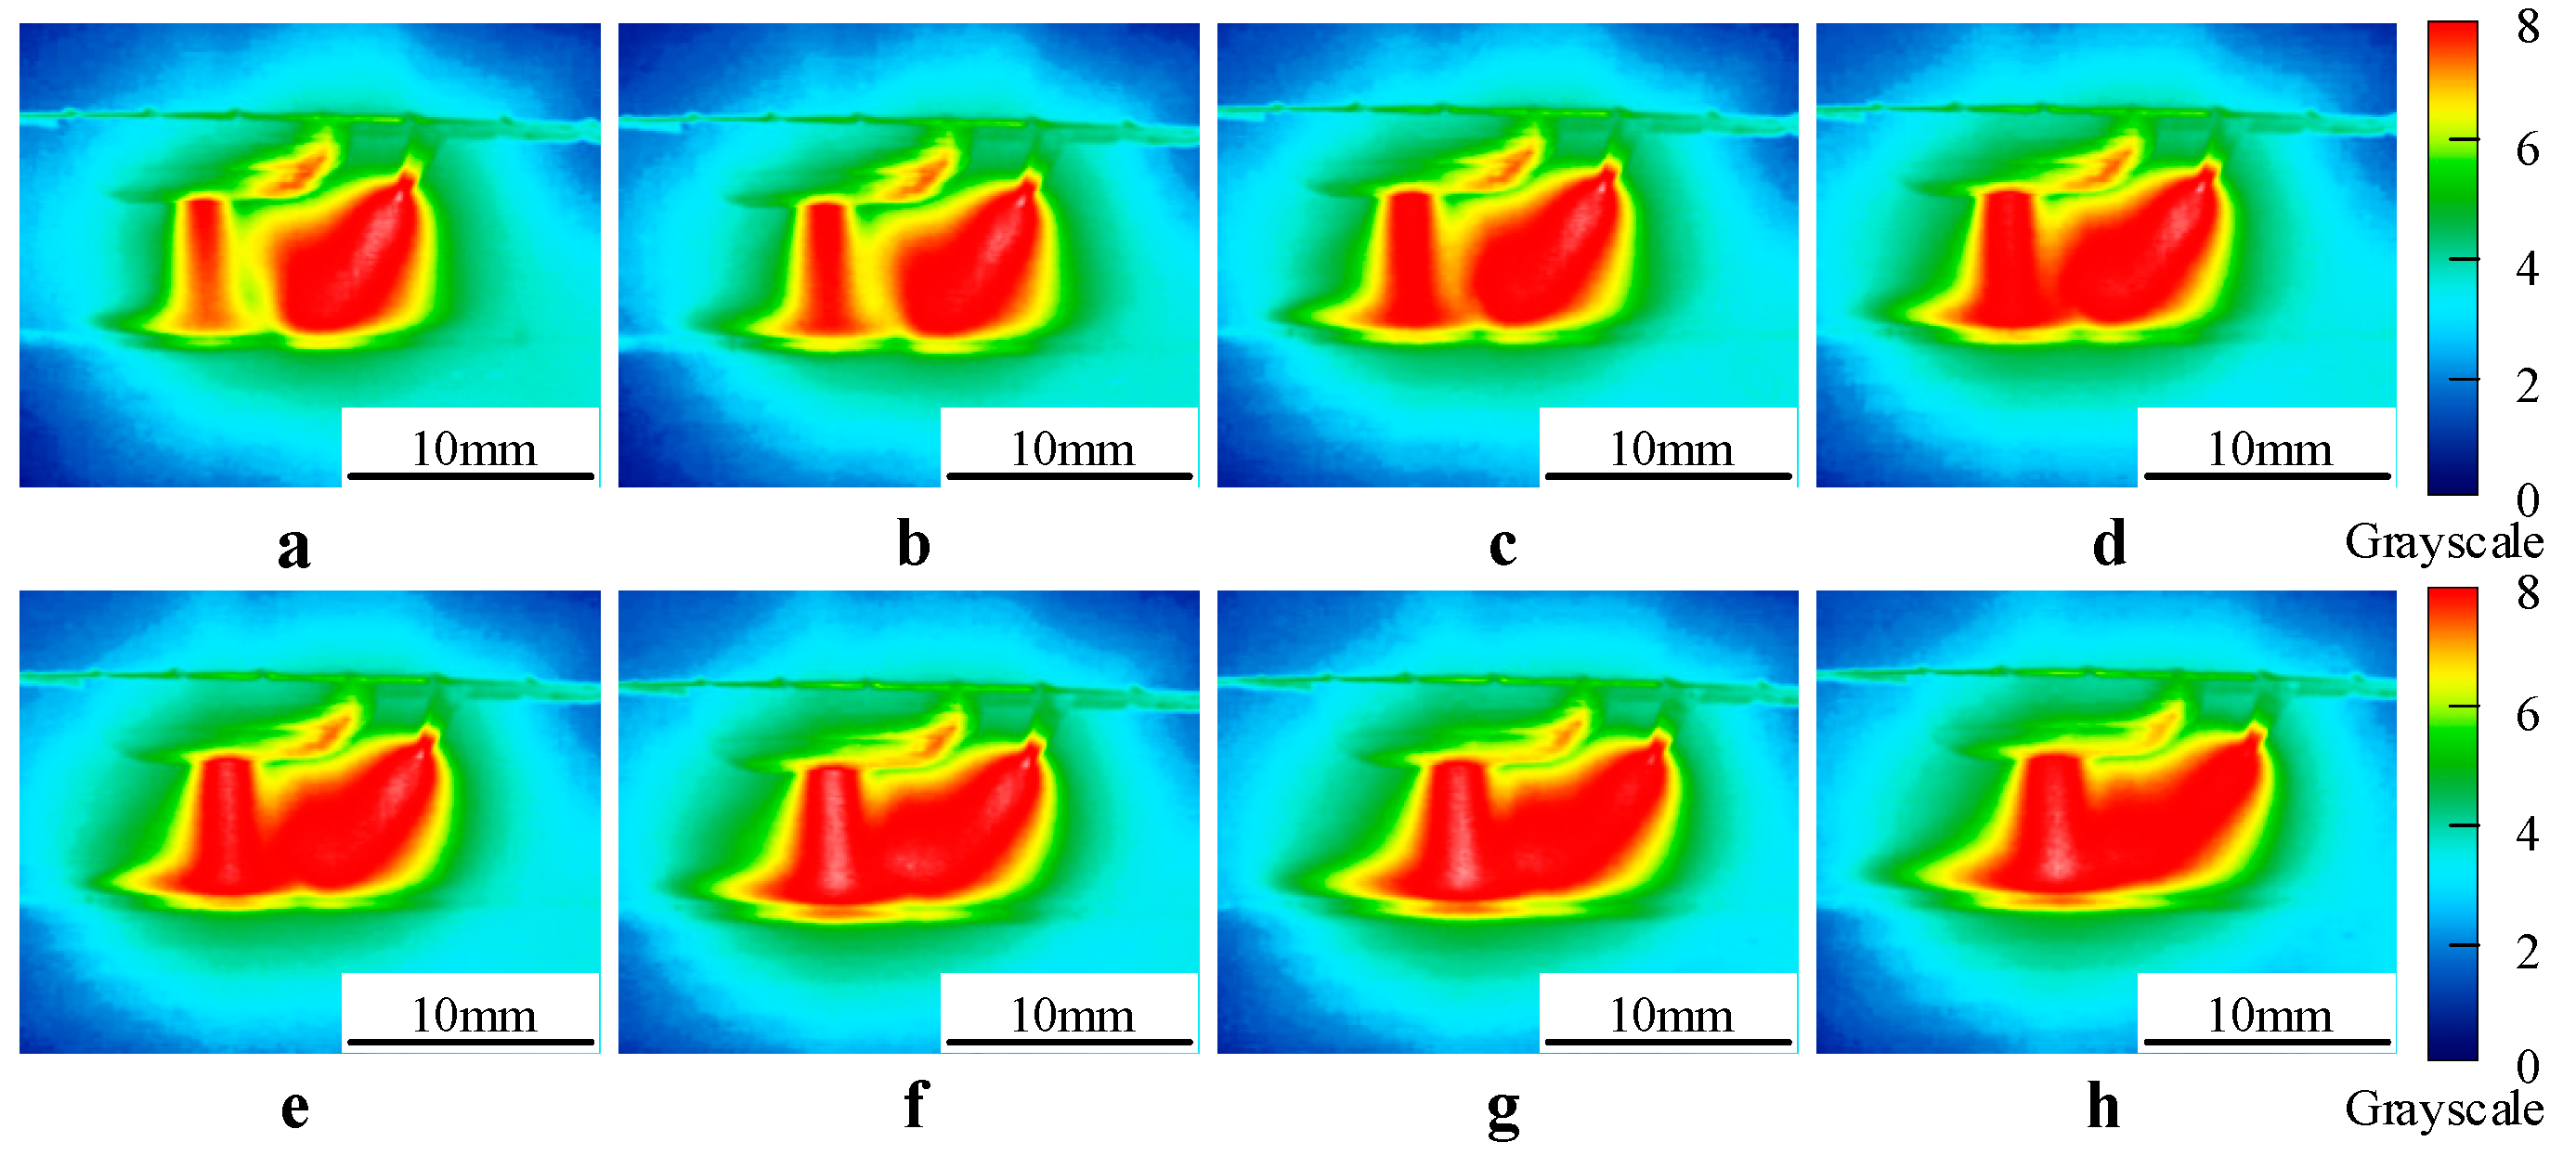
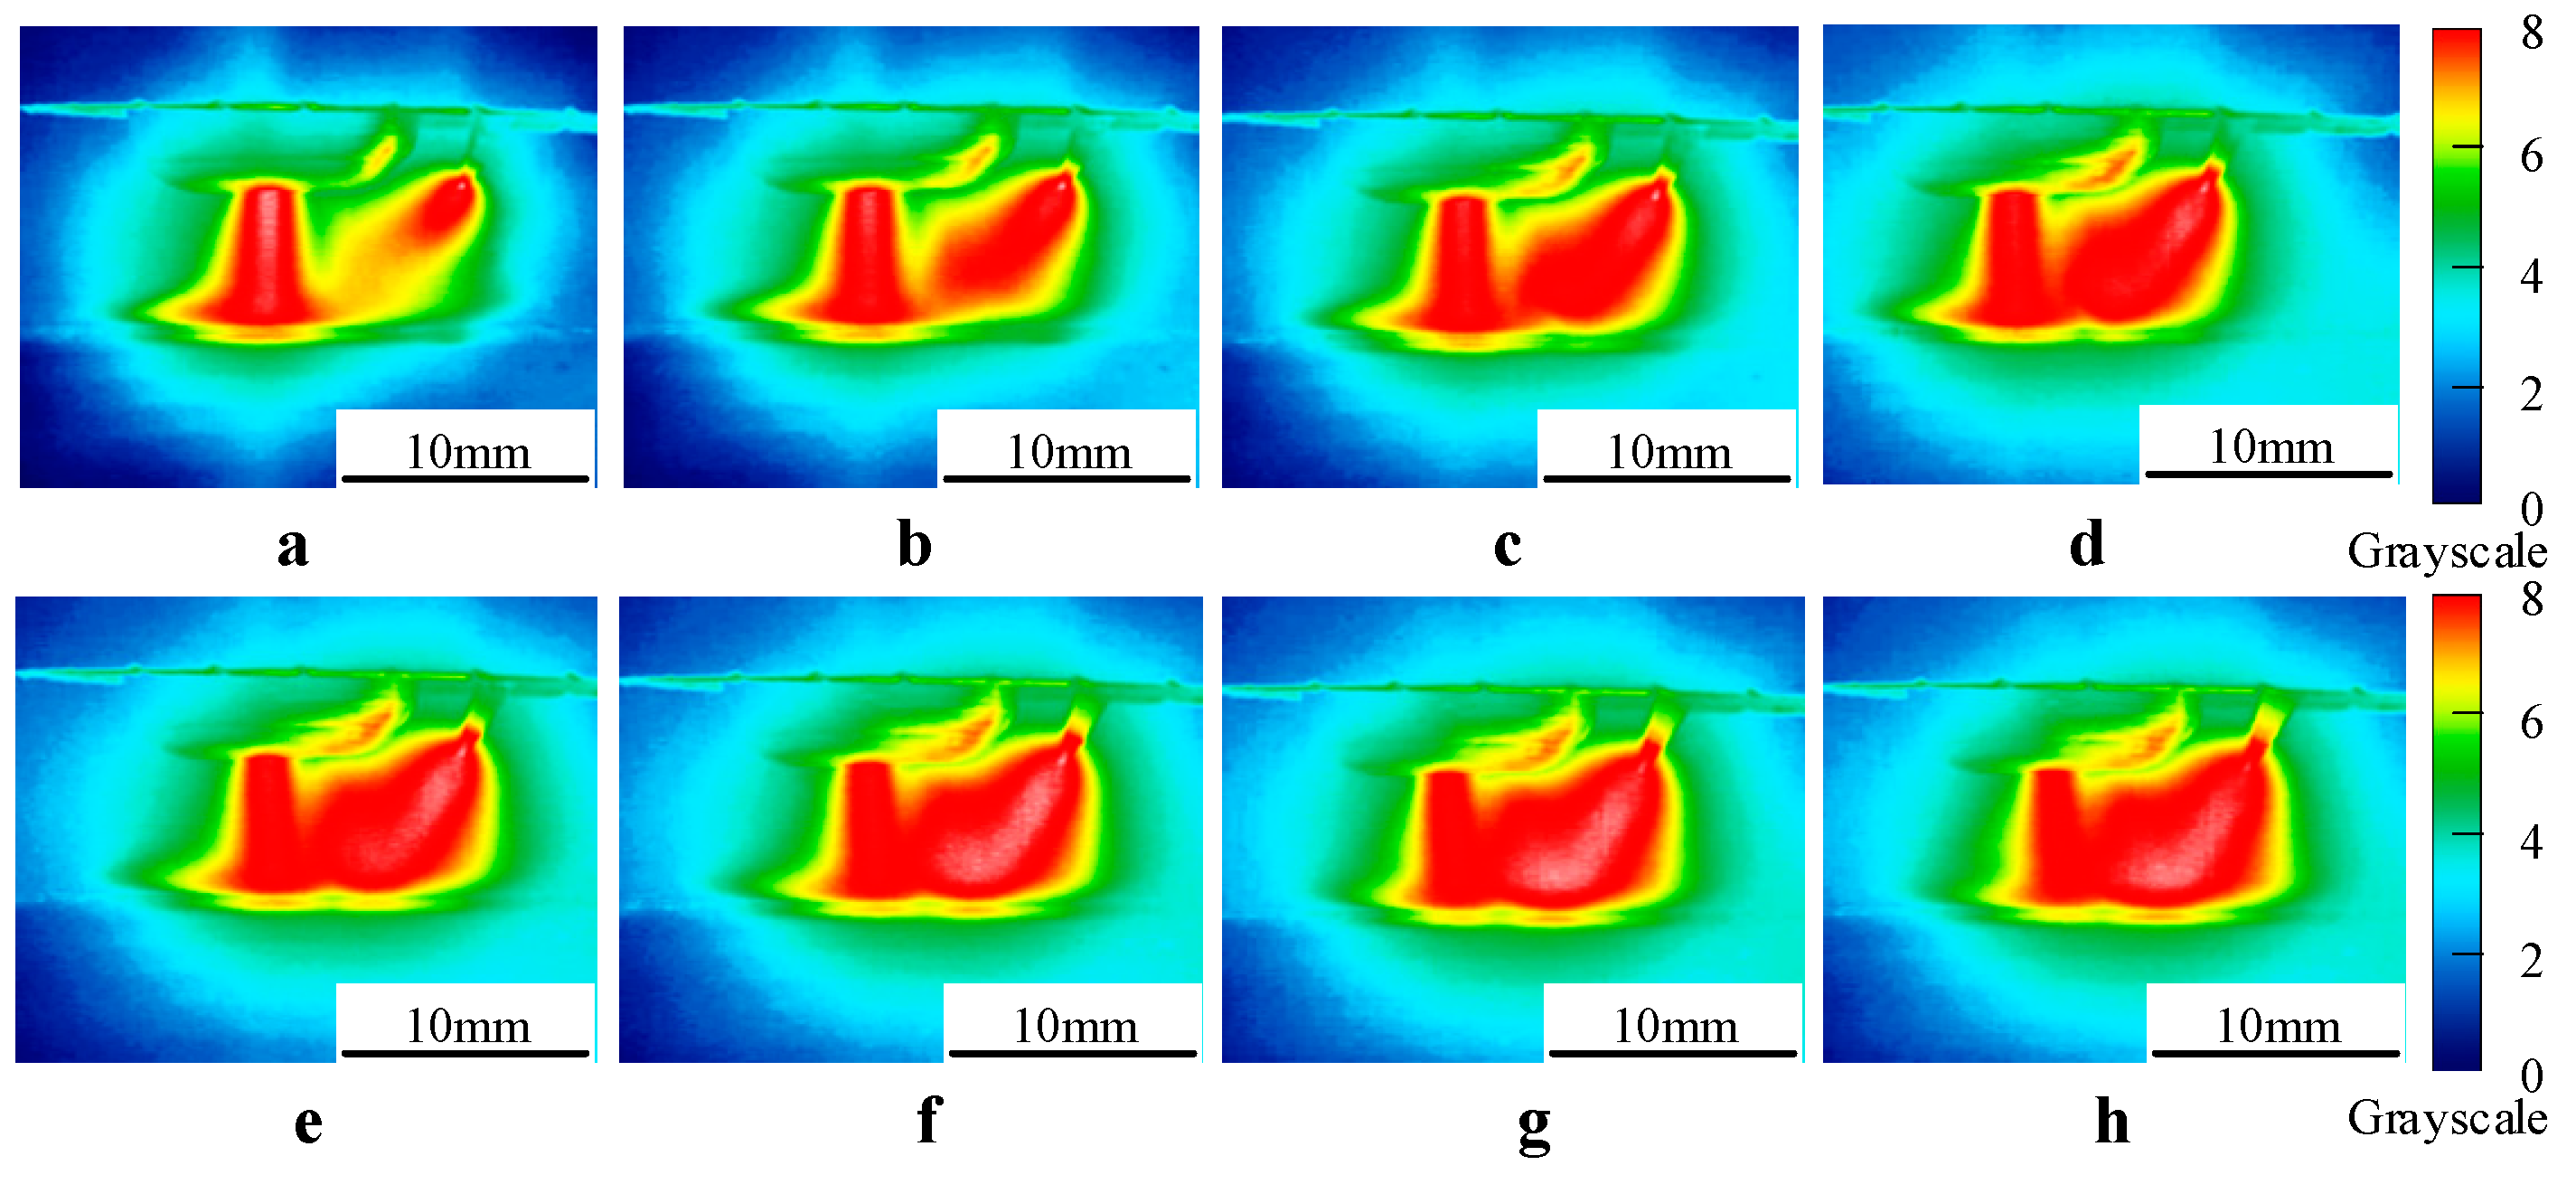
3.1. TPTCAW Coupled Arc Profile

A notable characteristic of the plasma-TIG welding method is the physical coupling effect between the two arcs, which results in penetration increased and welding spatter reduced effectively compared with traditional GMAW (gas metal arc welding) hybrid welding technology. The detailed images of the plasma, TIG, and coupled arcs were acquired as shown in Figure 2. Furthermore, pseudo-color processing is implemented for converting the acquired Gray-scale images to pseudo-color images using Xiris WeldStudioTM® software (2.0.3, Xiris Automation, Burlington, ON, Canada), which will assists in analyzing the detailed information of arc profile. The base plate is made of red copper with forced recirculation cooling water and the welding experiment was carried out under the following conditions: a plasma welding current of 60 A while TIG current of 100 A, nozzle height of 5 mm and plasma gas flow of 15 L/min.
Figure 2 illustrates typical arc profile under different welding methods. Welding arcs is steady and plasma arc seems to be trumpet-shaped while TIG arc is similar to broom-shaped during single arc welding because of the tungsten axis and the base plate have a 67 degrees angle, as shown in Figure 2a,b. When the TIG arc is applied to plasma welding arc, it is observed that a novel coupled arc is produced between the two arcs and the arc profile has a significant change from the previous. TIG arc can be deflected to plasma arc from the view of perpendicular to welding direction, and part of TIG arc is pushed to the side of plasma arc root, as shown in Figure 2c. At the same time, the coupled arc profile seems to be bell-shaped similar to the conventional TIG arc from the view of parallel to the welding direction, as shown in Figure 2d. The reason for this behavior can be explained as follows.
Previous studies have suggested the forces play a major role in determining the arc profile [21]. Therefore, it is necessary to analyze coupled arc force condition in order to explore the interaction mechanism on coupled arc profile. It should be noted that the electromagnetic axial pressure and plasma gas flow axial pressure are recognized as the key factor of PAW arc pressure [22]. The electromagnetic axial pressure on the arc axis can be expressed as the following Equation (1):
p e = μ 0 I P 2 4 π 2 ( 1 r 2 2 1 r 1 2 )
The plasma gas flow axis pressure towards to the molten pool surface can be expressed as the following Equation (2):
p g = 1 2 ρ μ 1 2
The plasma arc total pressure Pt on the arc axis can be expressed as the following Equation (3):
p t = p e + p g = μ 0 I P 2 4 π 2 ( 1 r 2 2 1 r 1 2 ) + 1 2 ρ μ 1 2
where Pe = electromagnetic axial pressure, and it is the function of IP. Pg = plasma gas flow axial pressure, and it is the function of ρ and µ1, simultaneously µ1 is the function of temperature. Hence, the resultant force on the arc axis from electrode tip to the surface of base plate can be expressed as the following Equation (4):
F r = p t S = μ 0 I P 2 4 π ( r 1 2 r 2 2 1 ) + 1 2 π ρ μ 1 2 r 1 2
Compared with the arc force condition during the single TIG welding, the Lorentz force (FL) has a significant effect on TIG arc owing to plasma arc generates additional magnetic field acts on the welding arc, and FL can be expressed as the following Equation (5):
F L = B I L
The schematic of the arc force condition as shown in Figure 3. Considering the difference of arc force conditions on either side of TIG arc axis, it is necessary to specify four particles (location A, B, C and D) as the research objects. On the side of the TIG arc, the plasma flow force is considered as the main arc force of TIG welding arc, the plasma flow force can be expressed as the following Equation (6):
F P = K I 2 log ( R b R a )
where Ft = the plasma flow force of TIG arc at location B, C and D. and Rb are the radius of arc root surface and undersurface respectively as shown in Figure 4c.
As seen in Figure 3 and Figure 4a, the direction of plasma flow force (FP) on the arc axis can be deflected to plasma arc at the location B. Furthermore, the plasma flow force acts as the major driver force of the arc shift and has important influence on the weld surface forming. According to right-hand grip rule at the location A, the direction of magnetic field generated by plasma arc current is perpendicular to the paper inward on the side of TIG arc. Hence the particles on the right side of plasma arc axis move towards plasma arc along the base plate under Lorentz force (FL1 and FL2), the motion of TIG arc can be seen in Figure 4a,c. At the same time, the plasma arc is also deflected slightly towards the location B owing to the Lorentz force (FL3), as shown in Figure 4a,b. In addition, part of particles of TIG arc have a potential of coupling with that of plasma arc root, which result in transformation of TIG arc trajectory. These results indicate that the above analysis of the coupled arc force conditions is consistent with the acquired experimental results in Figure 2. It can be concluded that the TIG arc is deflected under the combination effect of plasma flow force and Lorentz force generated by the magnetic field of plasma arc column.
Therefore, according to the aforementioned analysis, another interesting finding has caught our attention. It is important to highlight that the coupling of two arcs and plasma flow force of arc are proportional to the welding current, this phenomenon is in good consistent with Equations (4) and (6). As can be seen from Figure 5, the coupled arc is generated only when the plasma arc current is bigger than 60 A, at the same time, the arc climbing height on plasma arc column increases with welding current (IP) when the TIG welding current (IT) is constant at 100 A. However, as plasma arc current is constant at 60 A, the plasma flow force (FP) has a marked effect on welding arc profile acting on the base plate, the heat transfer area of coupled arc acting on the workpiece is apparently increased with increase of welding current (IT), as shown in Figure 6. Therefore, it is indicated that the coupled arc profile depends on combination effect of these arcs, especially IT and IP, it is consistent with the above analysis of coupled arc force.

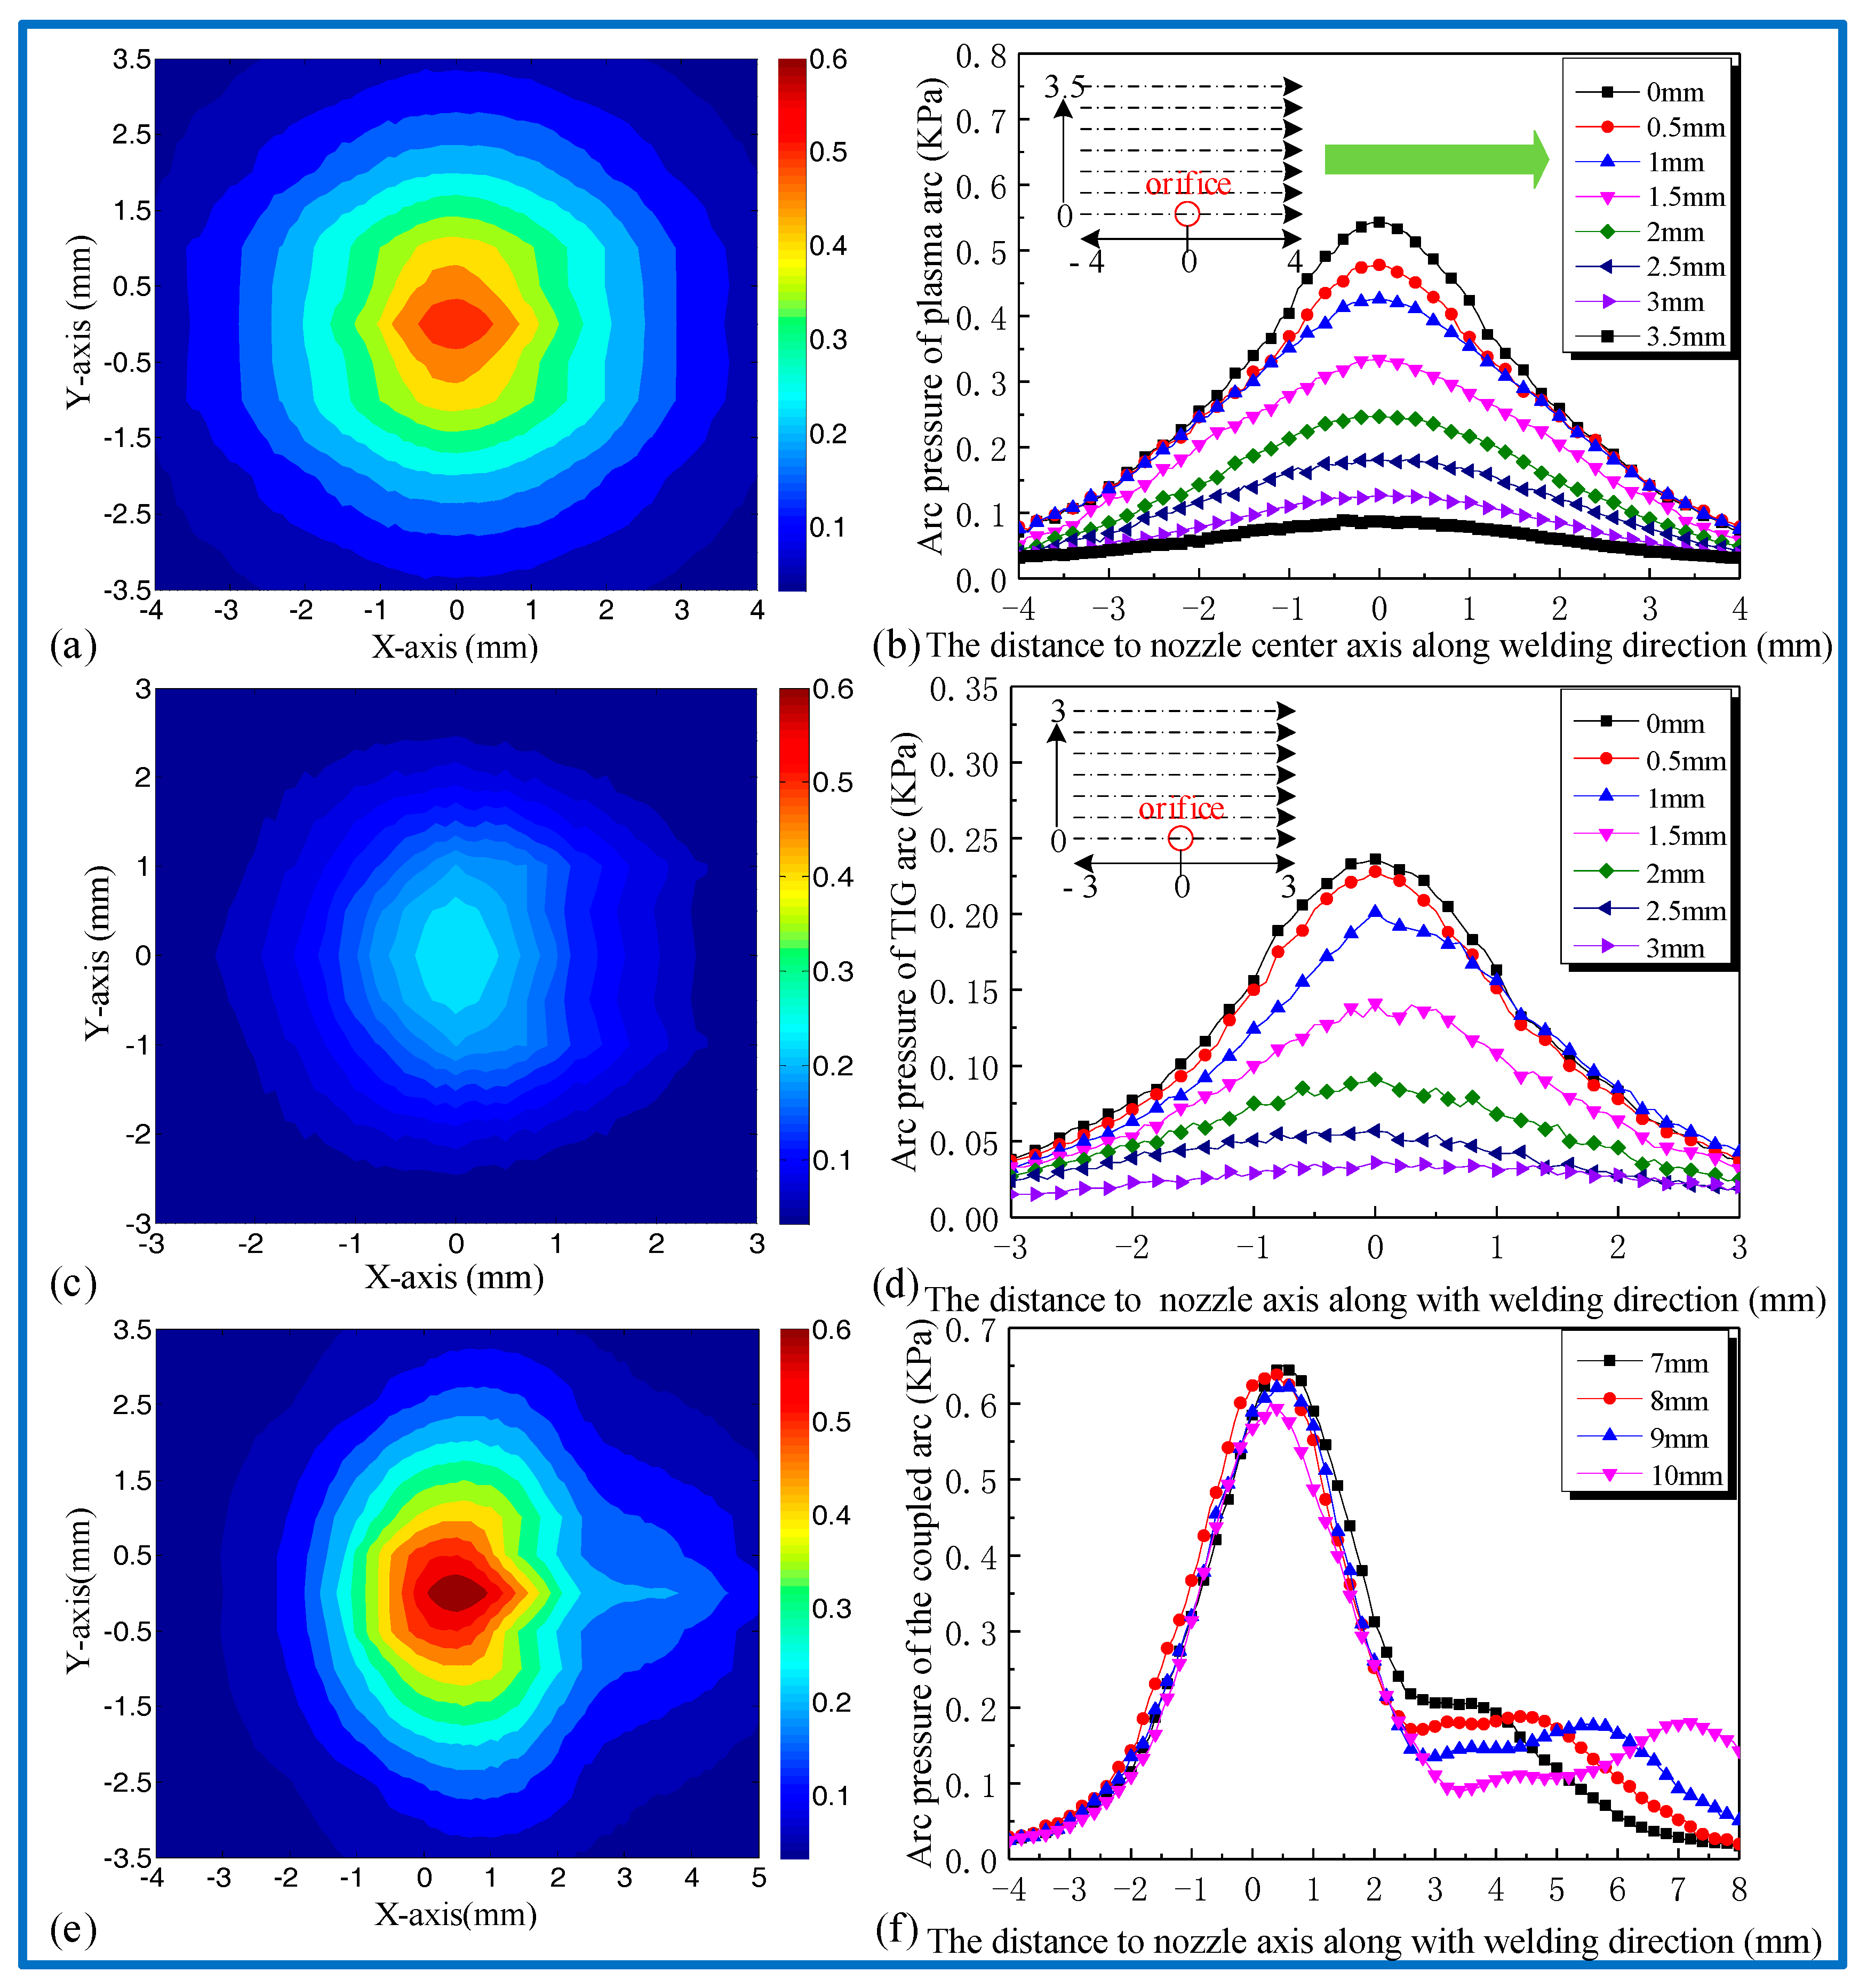
3.2. Arc Pressure Distribution of the Coupled Arc

The arc pressure distribution on the workpiece allows the characterization of the coupled arc force on the molten pool surface and identification of arc physical properties, especially its effect on the penetration [23,24]. A differential pressure sensor (DPS: HSTL-FY01, Beijing, China) was utilized to detect the arc pressure on the surface of base metal as shown in Figure 7a. A measuring bore hole with a diameter of 0.8 mm is installed in the center of the plate, which was fixed on another water-cooled copperplate with a geometry size of 200 × 400 × 3 mm3 [25]. The real-time data acquisition of the sensor can be realized by the data acquisition card (YAV-USB2AD, Wuhan Yawei Electronic Technolgy CO., Ltd., Wuhan, China) using the technology of Labview®(National Instruments, Austin, TX, USA). The system is adjusted and calibrated through the software. To ensure accuracy of the results, the measurement point spacing is 0.1 mm and the torch moves at a constant velocity of 2 mm/s. The details of the measurement system are shown in Figure 7.
The two-dimensional pressure distribution and pressure variation along with the welding direction for each welding arc are shown in Figure 8. The surface charts for individual stagnation pressure of three welding method are drawn using Matlab® (8.3, MathWorks, Natick, MA, USA) software in order to illustrate the difference in magnitude between the values of arc pressure. According to the following experimental results, there is another interesting finding that catches our attention. It is worthwhile mentioning that the coupled arc pressure is mainly determined by plasma arc and proportion to the welding current, and the welding conditions are listed in Table 2. The contour cloud image of the coupled arc pressure distribution is shown in Figure 8e, notably, it is similar to a gourd shape and the maximum arc pressure appears between the two arcs near the side of plasma arc compared with conventional plasma arc welding method. It can be seen that the maximum value of the coupled arc is approximately 650 Pa and the maximum arc pressure decreased gradually with the increasing electrode spacing, as shown in Figure 8f. This result is significantly higher than that of plasma arc and TIG arc under the same conditions, as shown in Figure 8b,d. Therefore, it is indicated that the total arc pressure of coupled arc depends on combination effect of these arcs, and it is consistent with the above analysis of coupled arc profile.

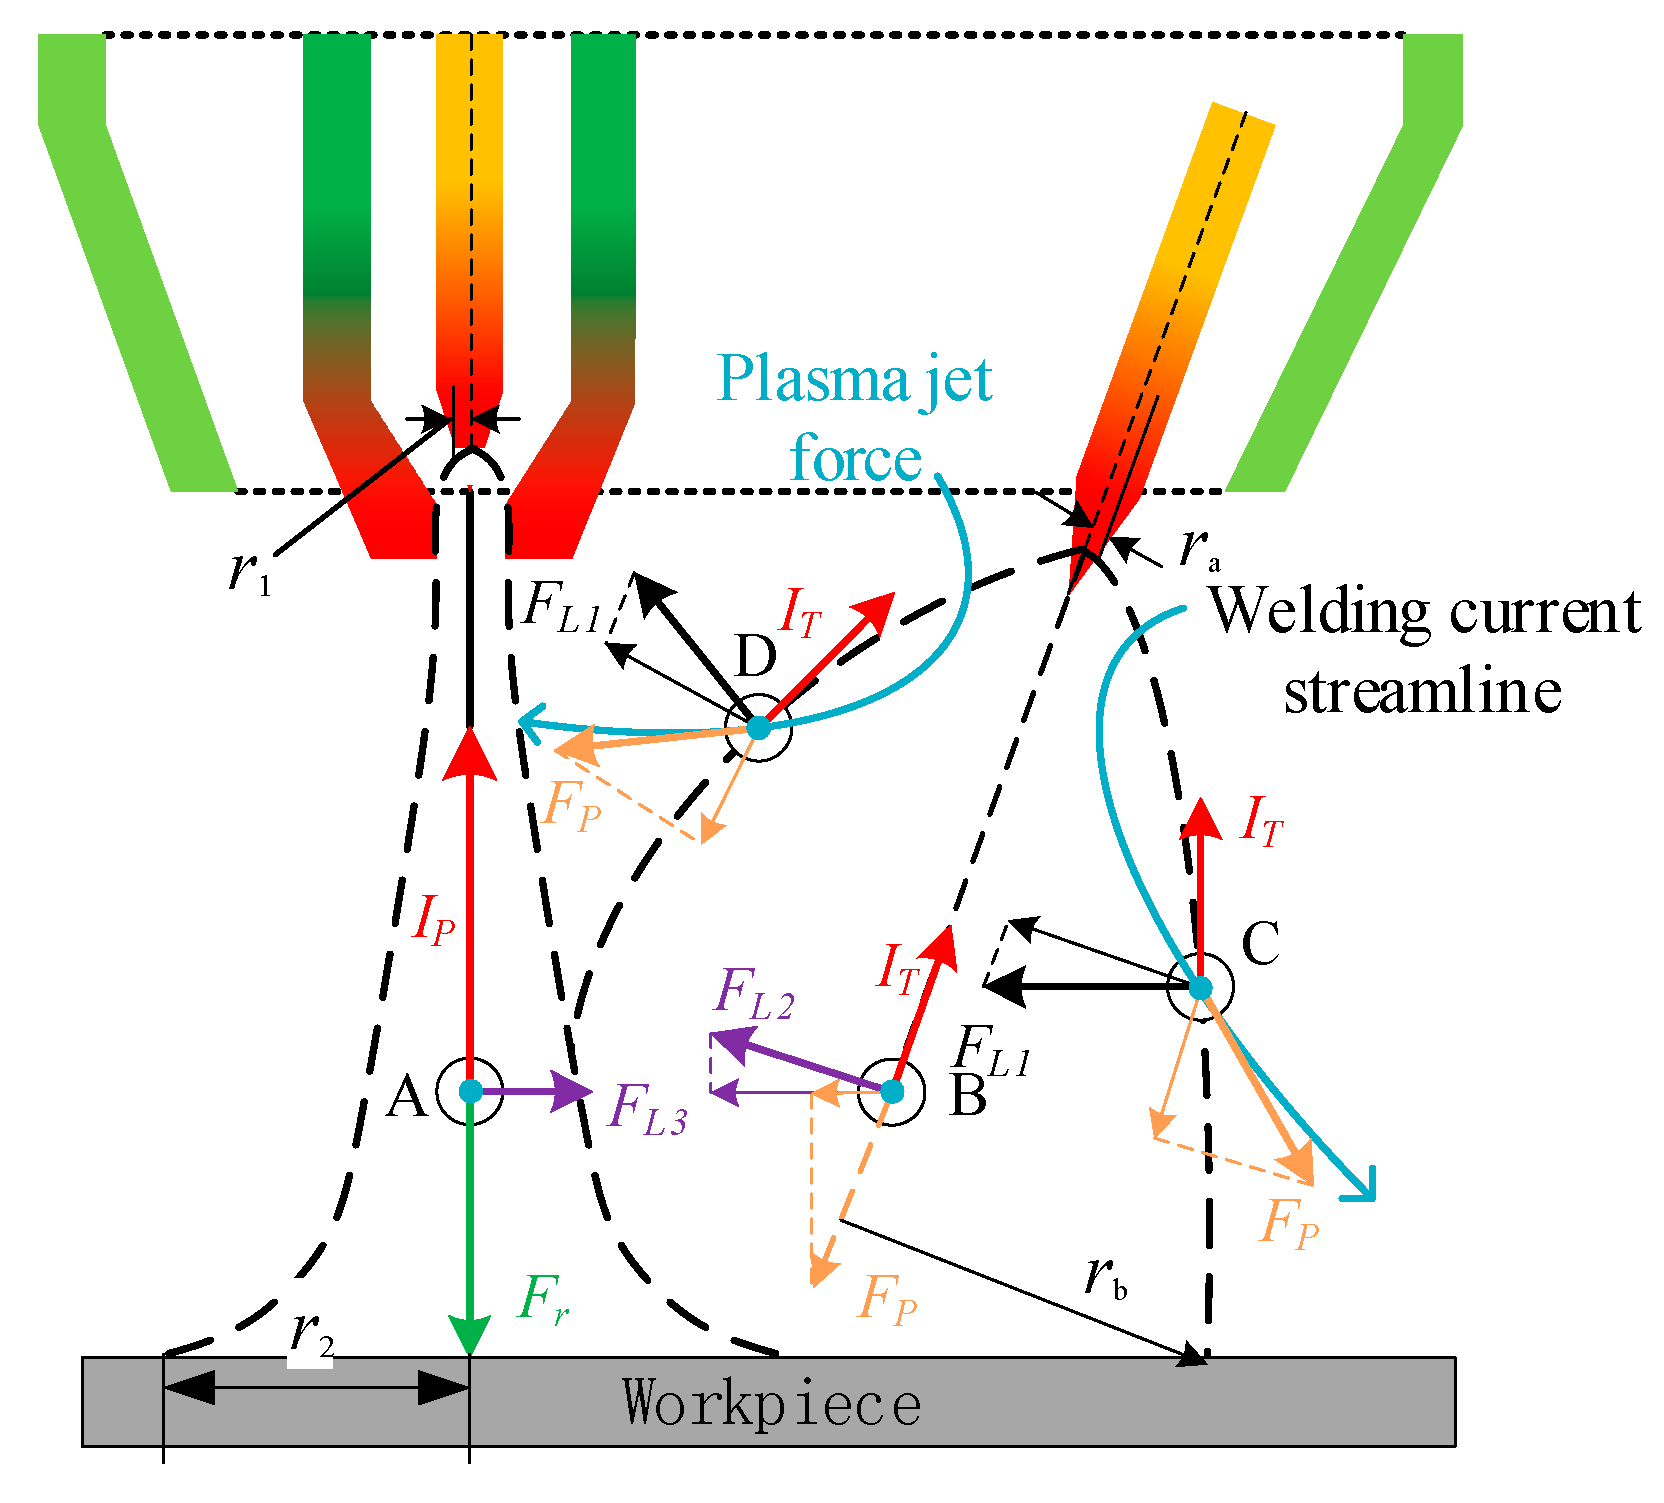
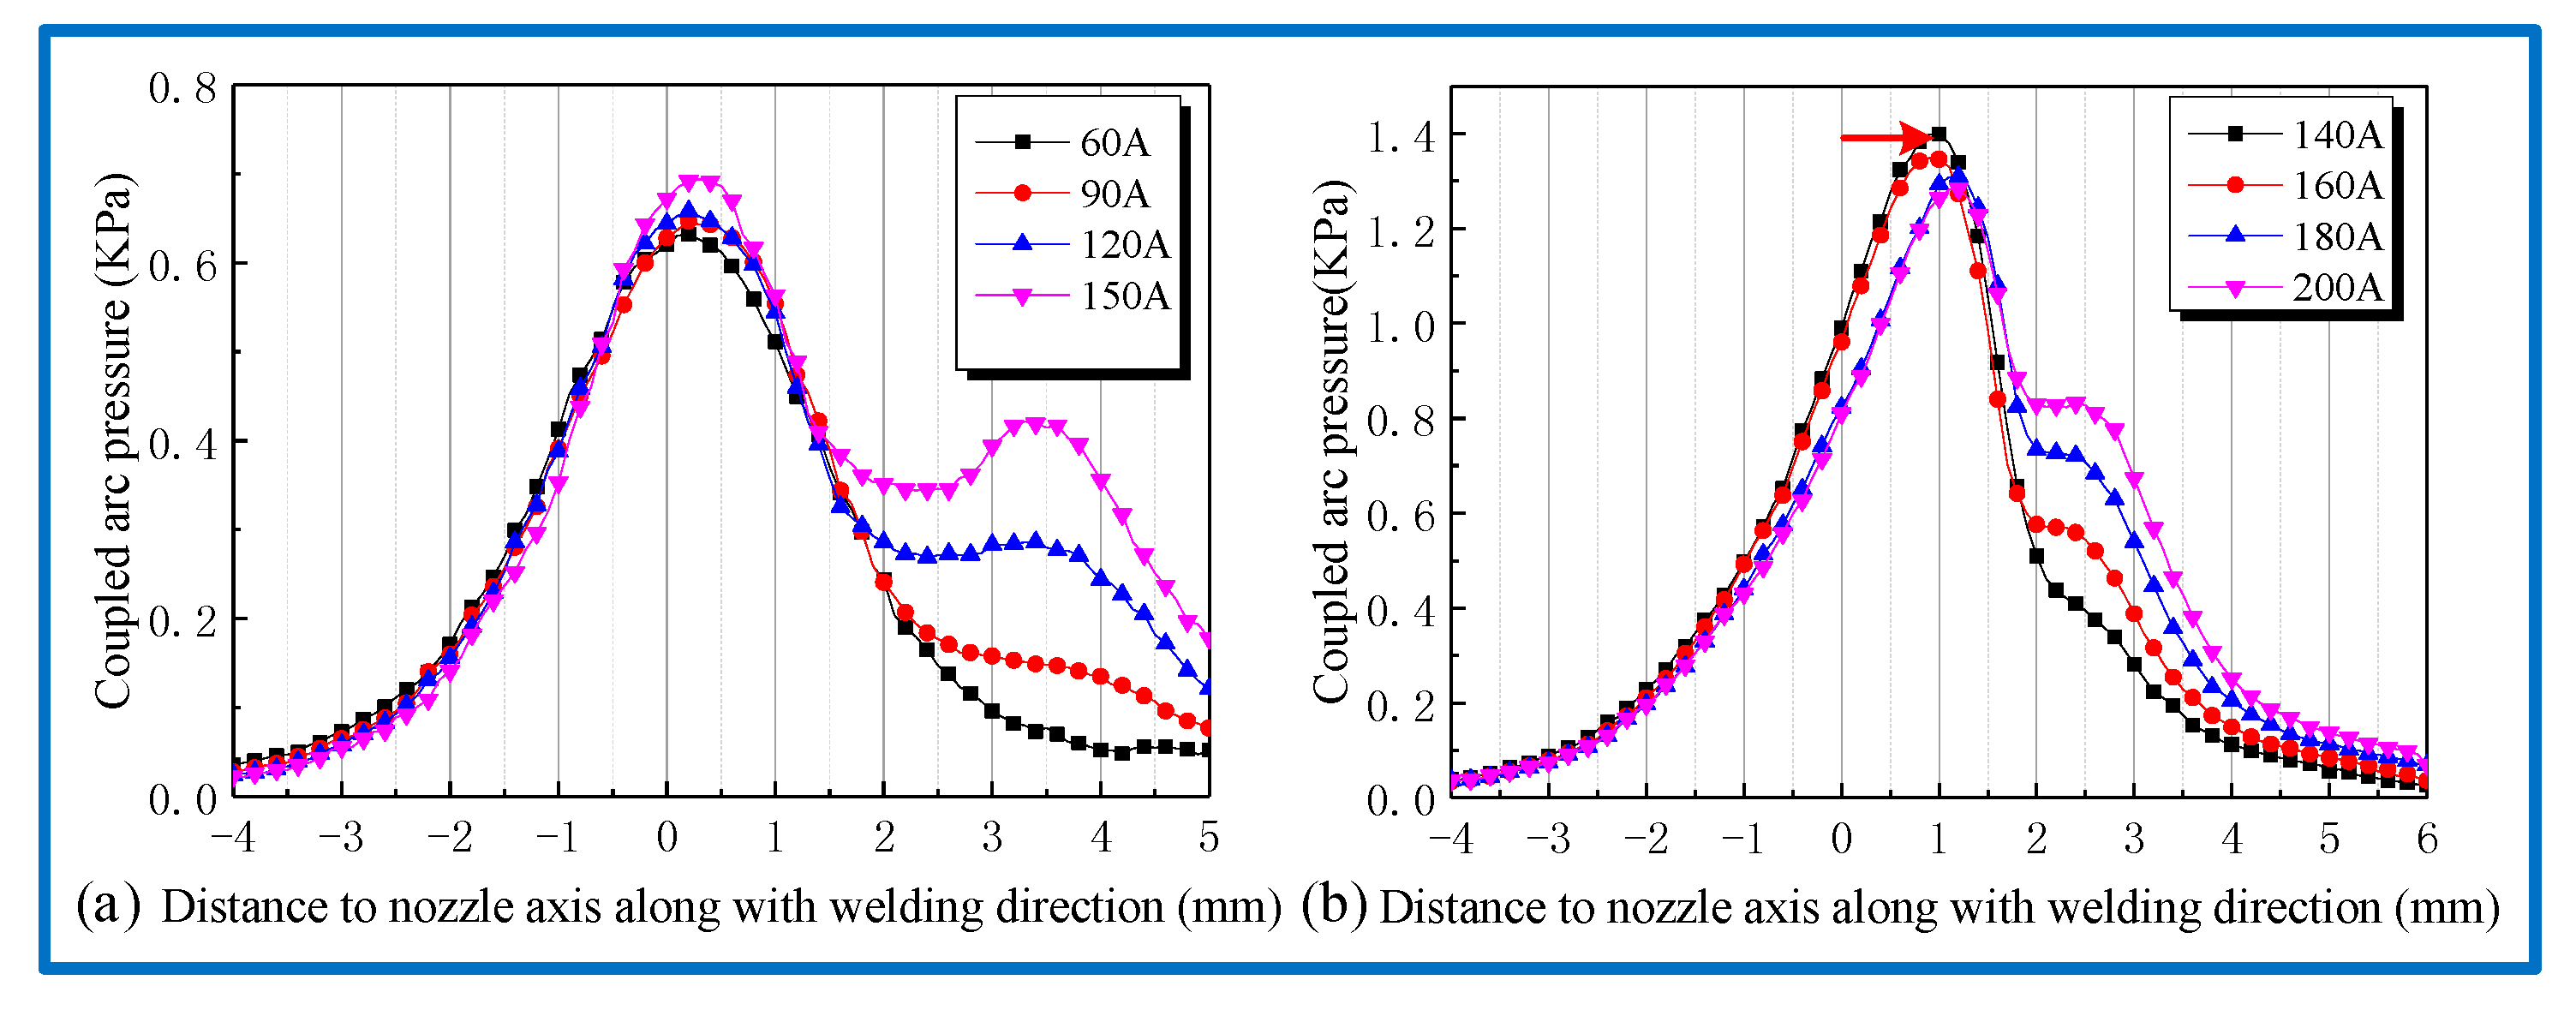
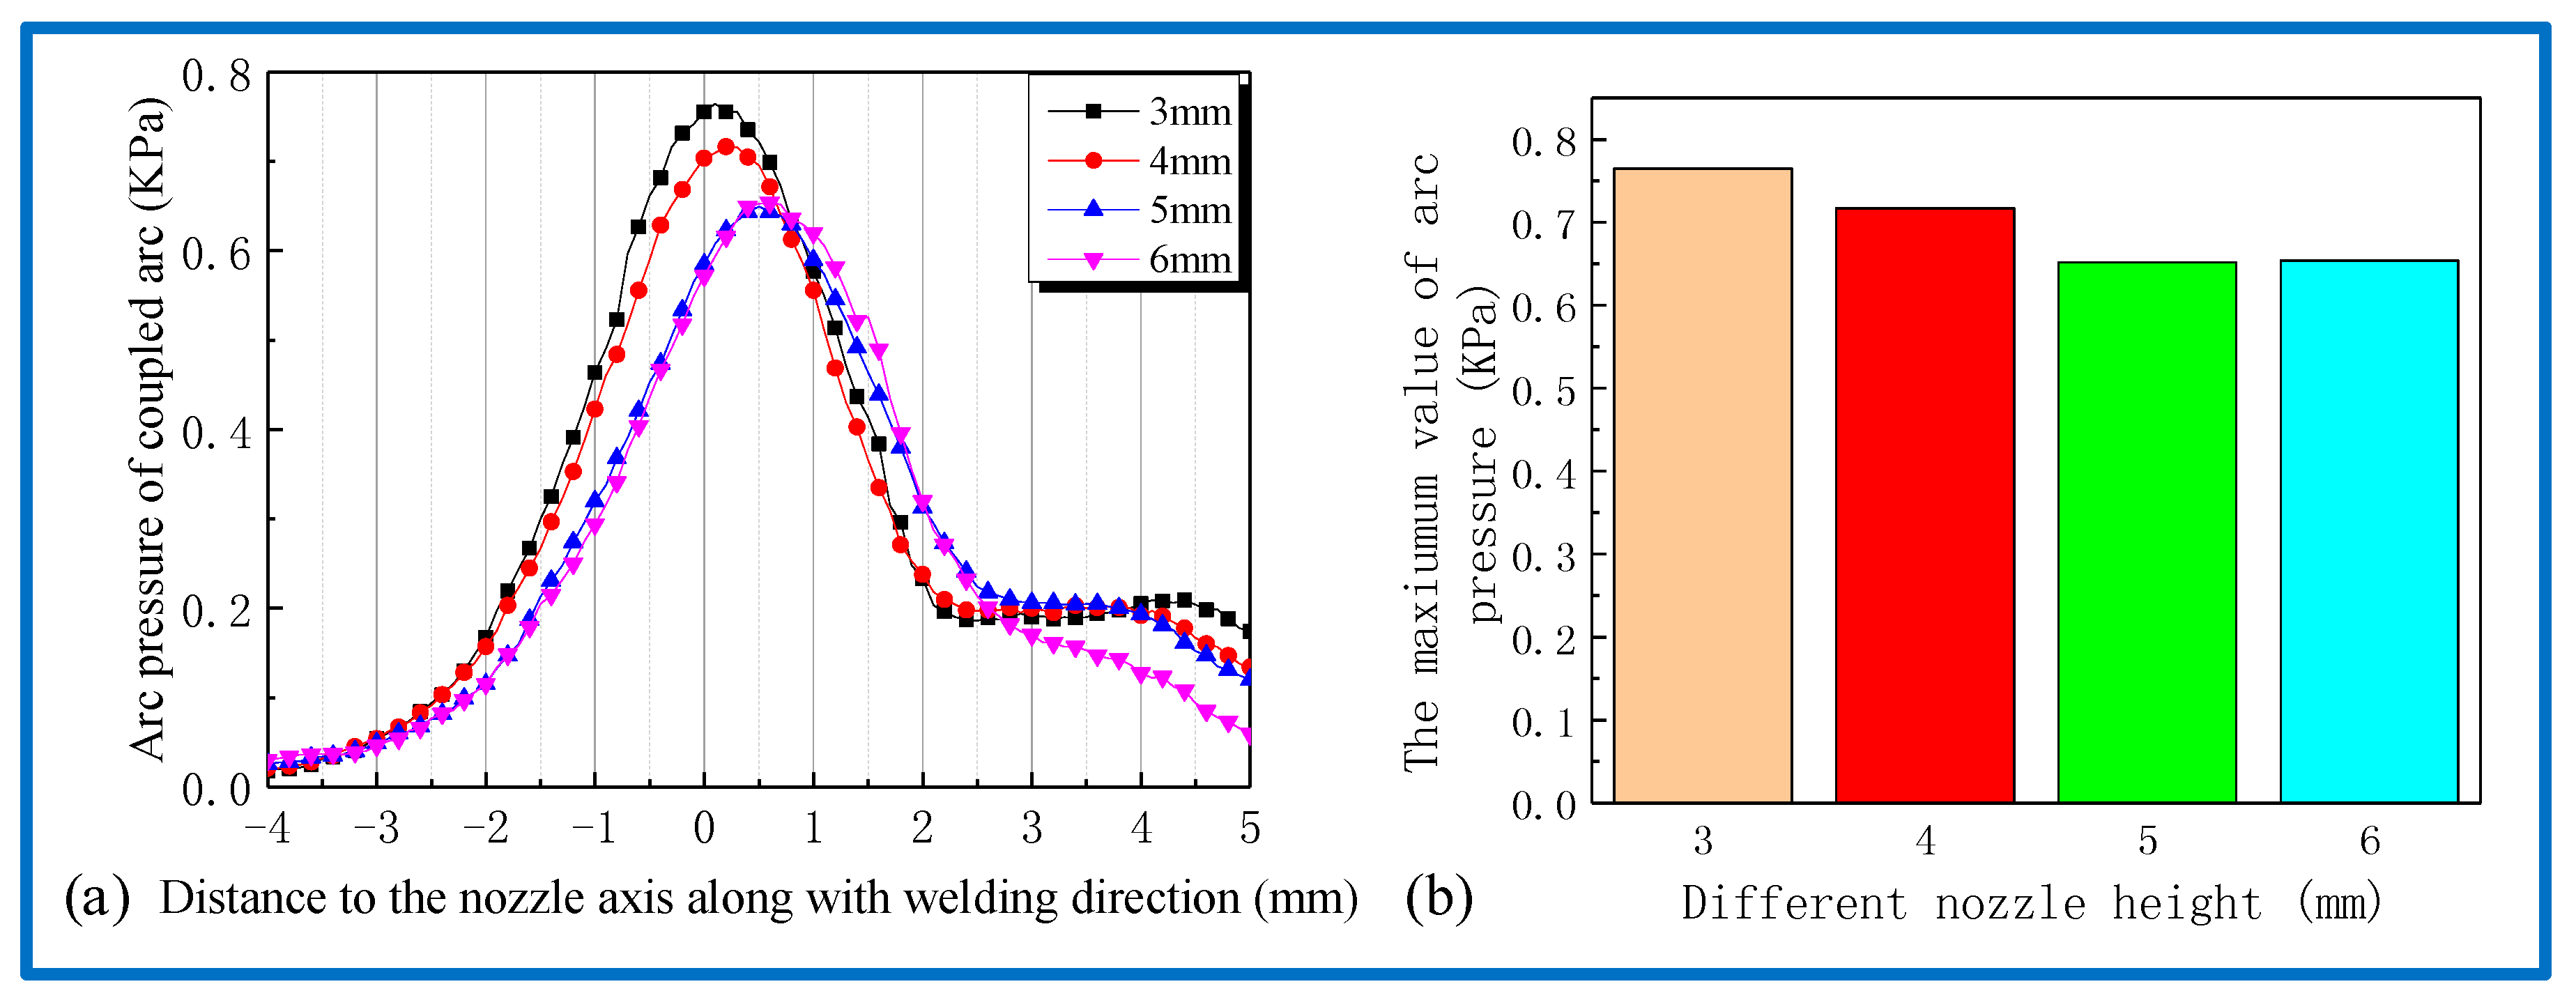
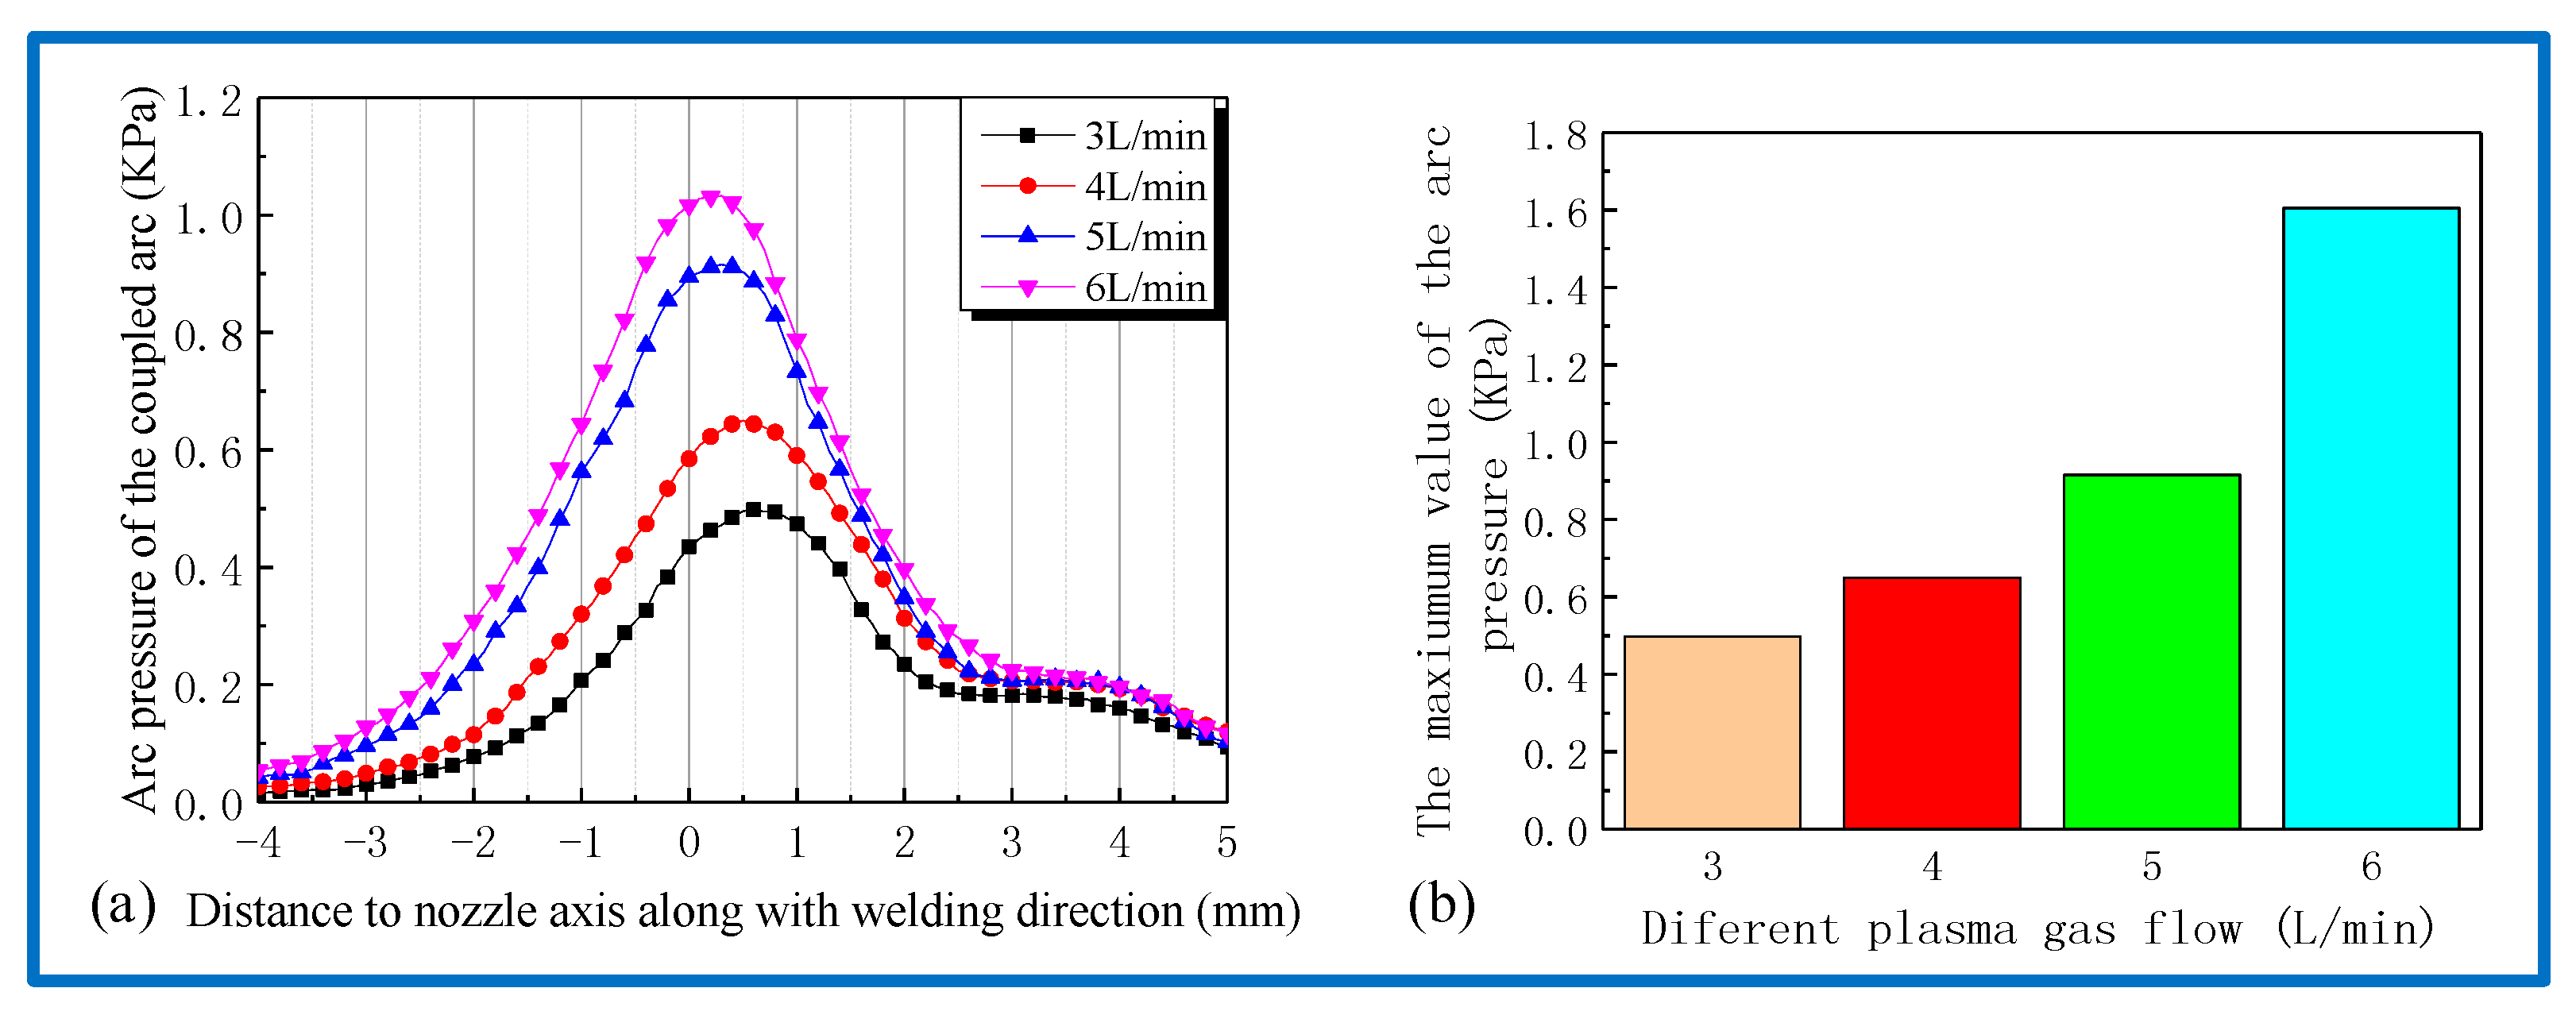
3.3. The Influence Factor of Coupled Arc Pressure

Group #1 is the single-factor experiment to examine the effects of plasma current on the coupled arc pressure distribution. The plasma arc as an important part of the coupled arc [26], the variation in the current value has a significant influence on plasma flow force and mainly determines the maximum arc pressure of the coupled arc. The histogram of the coupled arc pressure is acquired by means of extracting the maximum value of distributed line type, as shown in Figure 9b. As can be seen from part a and b of Figure 9, the maximum arc pressure increases gradually with the rise in plasma current and reaches 1600 Pa as plasma current is 120 A. In addition, according to the changes of arc pressure curves at point a, it can be illustrated that the TIG arc pressure peak is overlapped with that of plasma gradually with increase of plasma current, that is due to increase in Lorentz force during the process. This result suggest that the coupling effect is strengthened between the two arcs with the increase of plasma current.
Groups #2 and #3 are the single-factor experiments to examine the effect of TIG current on the coupled arc pressure distribution. As previously mentioned, the change in TIG arc would has different effects on the coupled arc pressure. It is necessary to analysis the arc pressure in two situation, when the plasma arc current is 60 A, as shown in Figure 10a, as the TIG current increases, the maximum arc pressure of the coupled arc gets deviated to the side of TIG arc within a small scale. This condition was mainly attributed to plasma flow force increases with welding current, it results in a good TIG arc stiffness. On the contrary, when the plasma current increases to 120 A, as shown in Figure 10b, the maximum arc pressure of the coupled arc gets deviated to TIG arc by a large margin, the results indicate that the Lorentz force acting on plasma arc increases enough to deflect the plasma as the TIG current increases. This is consistent with the observation from the coupled arc profile.
Group #4 is the single-factor experiment to examine the effect of the coupled arc length on the coupled arc pressure distribution. The histogram of coupled arc along with the welding direction is acquired by means of extracting the maximum value of distributed line type, as shown in Figure 11b. The maximum arc pressure initially decreased rapidly with the increase of nozzle height and then plateaued; meanwhile, another interesting finding is that the coupled arc no longer decreases as the nozzle height exceeds 5 mm. The results suggest that the horizontal component of the Lorentz force and plasma flow force cancels each other and reach equilibrium state along with welding direction, as shown in Equation (5).
Group #5 is the single-factor experiment to examine the effect of plasma gas flow rates on the coupled arc pressure distribution. Plasma gas flow rates (QP) has a significant effect on plasma movement during welding process [27]. As shown in Figure 12, the maximum arc pressure of the coupled arc evidently increased with the increase of the plasma gas flow, it can be inferred the increased plasma gas flow has led to the increase in axial component of plasma velocity and plasma gas density, as shown in Equation (2).

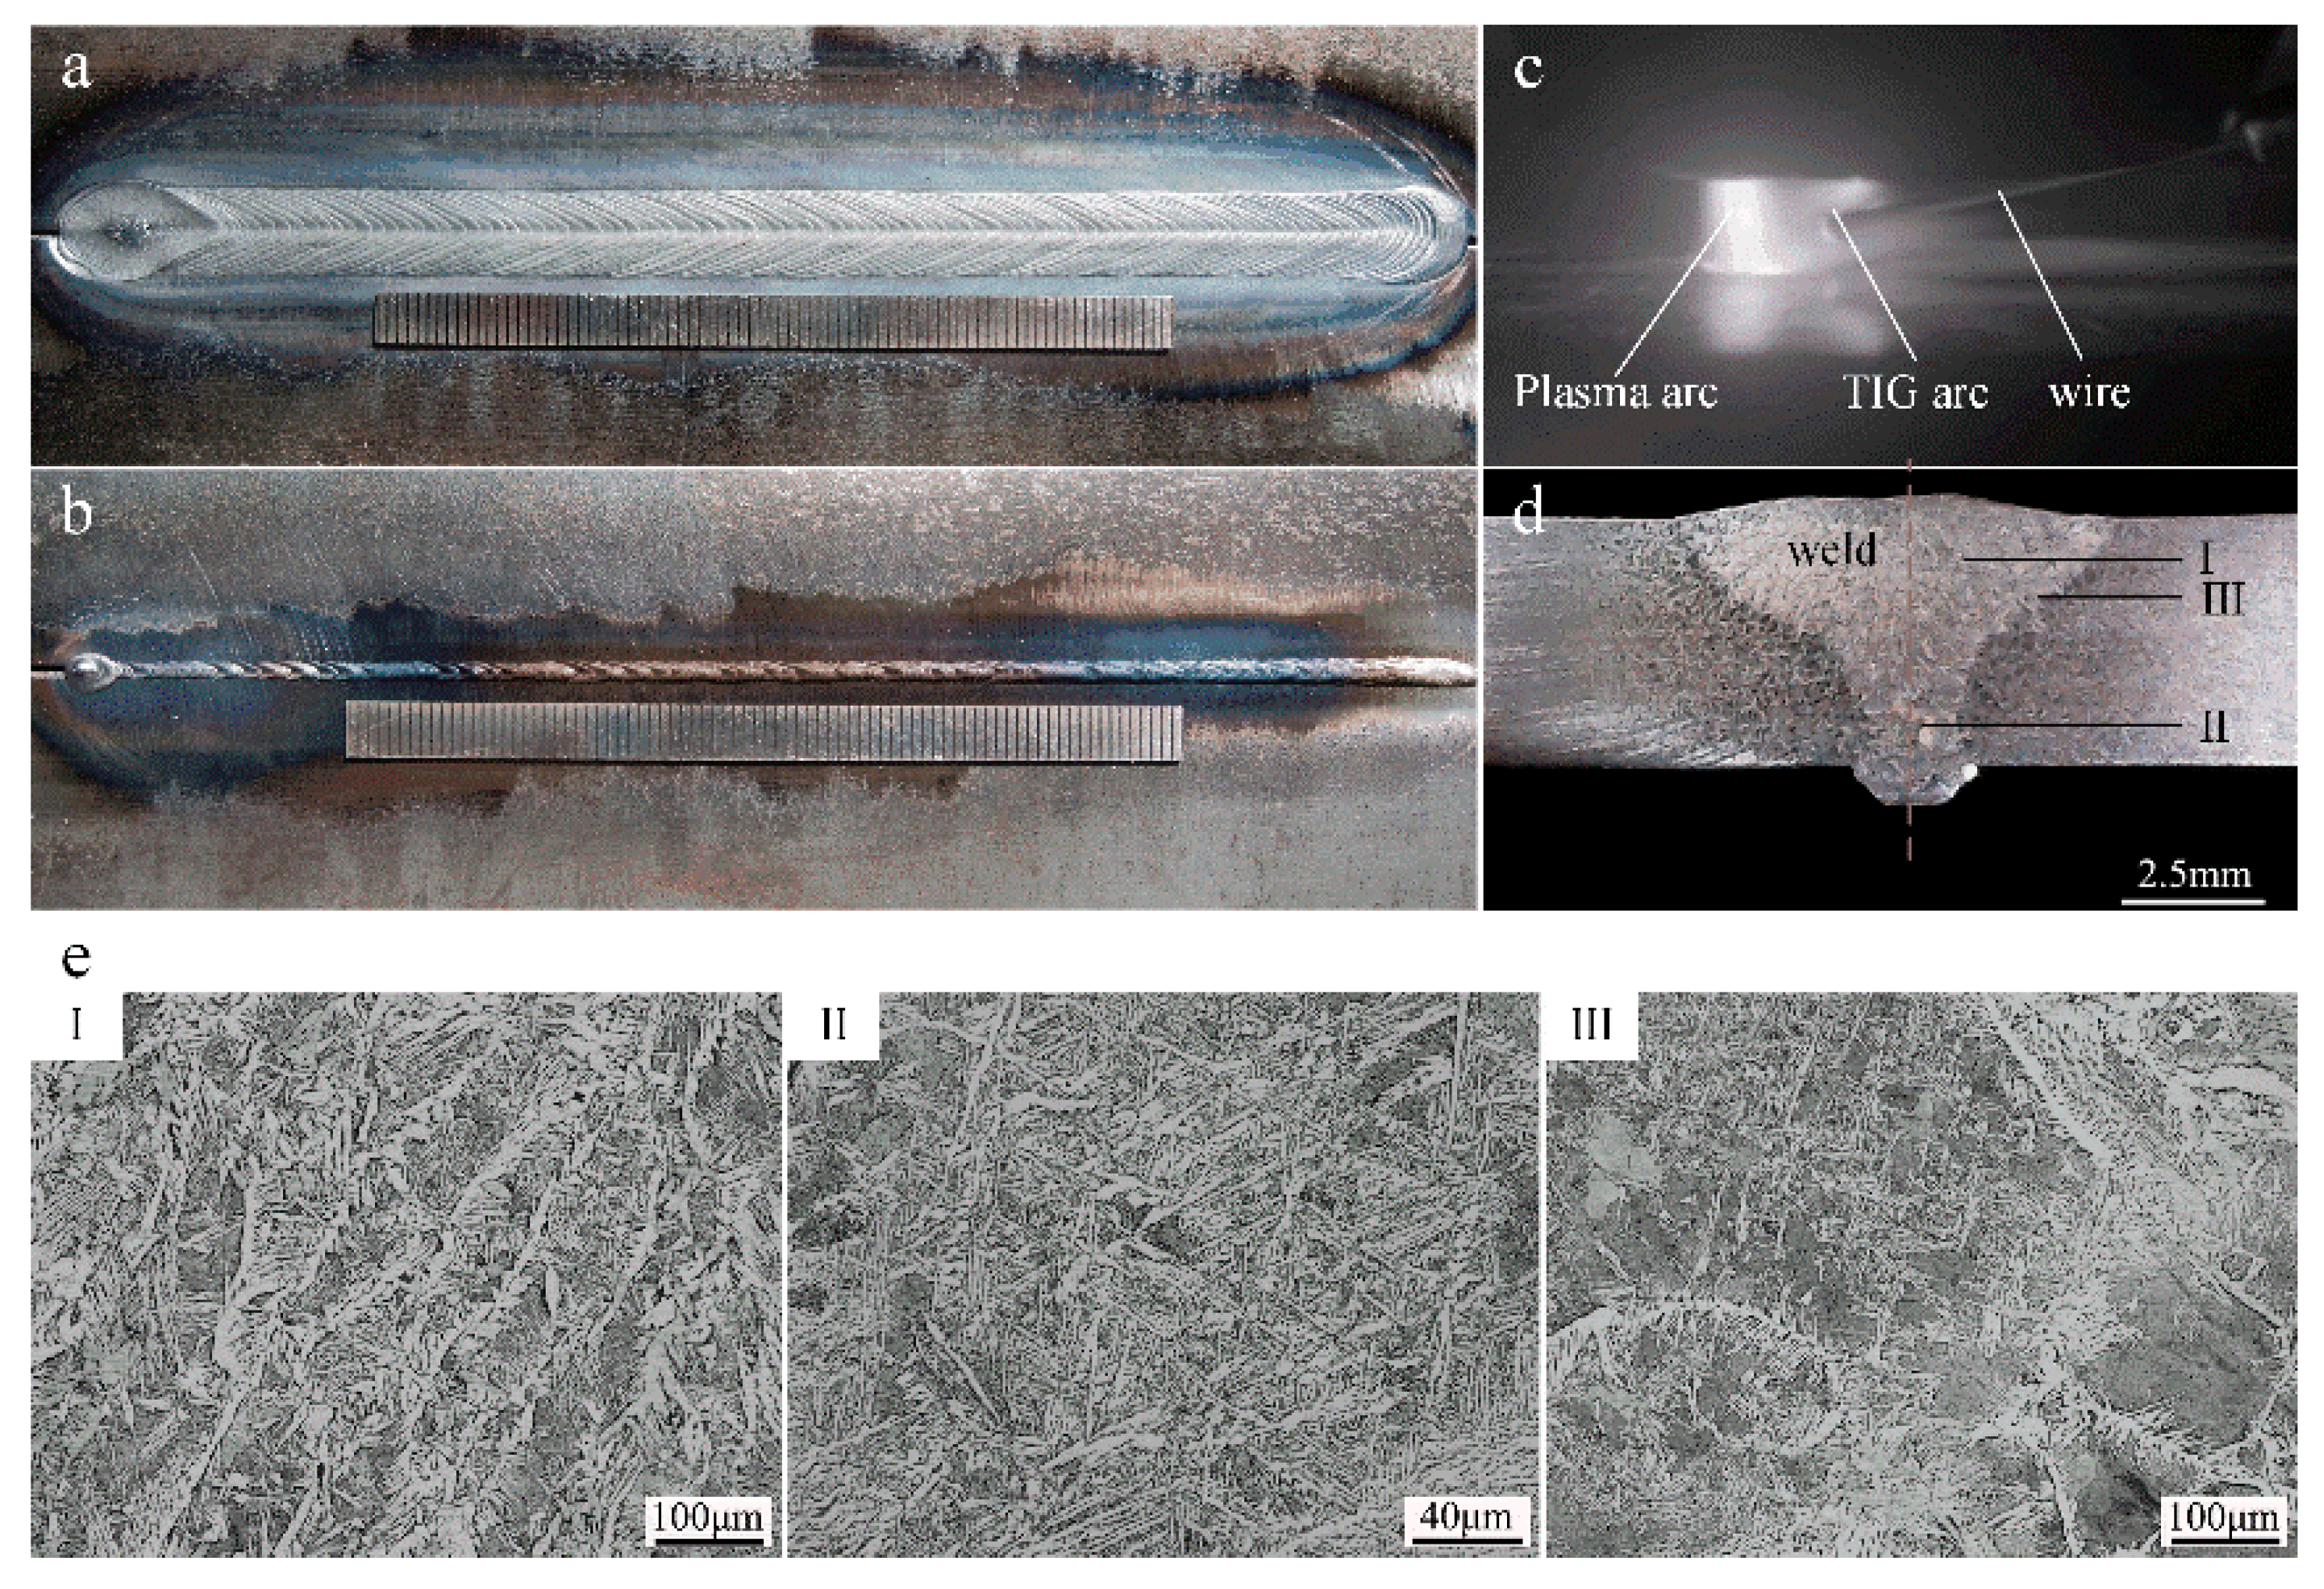
3.4. Formation and Microstructure of the Weld

The base metal is Q235B low carbon steel (with nominal chemical compositions of C-0.15, Mn-0.4, Si-0.2, S-0.03, P-0.035, balance Fe in wt.%) with dimensions of 200 × 80 × 5 mm3. MG70S-6 (with nominal chemical compositions of Cu-0.5, Mn-1.85, Si-1.15, C-0.15, Ni-0.15, Cr-0.15, Mo-0.15, S-0.025, P-0.025, balance Fe in wt %) with 1.2 mm diameter is used as the filler metal. The square groove is 1.0 mm (± 0.1 mm). The welding positions of base metal are prepared by the conventional grinding method and then cleaned with acetone. The appearance of the surface and back of the weld using a plasma current of 150 A and a TIG current of 70 A, as shown in Figure 13. As can be seen from Figure 13a,b, a smooth and uniform weld seam with one side welding and both sides formation was successfully produced by P/TCAW. As illustrated in Figure 13c,d, a Charge Coupled Device (CCD) camera is used to acquire a clear image of the coupled arc during the welding process, the coupled arc burns stably and no obvious welding defects can be found, the weld section looks like the goblet profile and has a smaller the section dimensions. It can be suggested that the welding heat input on the base metals is limited. Therefore, P/TCAW is suitable for completing high speed and efficiency welding of mild steel plate.
The joining strength of the weld is determined by the microstructure and the typical metallurgical structure as shown in Figure 13e. The microstructure represented in the following sub-figure is consistent with the position presented in Figure 13d. The microstructure of fusion zone is finer and the upper part mainly consists of pro-eutectoid ferrite and acicular ferrite in the columnar grains, however, the lower part mainly consists of acicular ferrite. This is due to the upper part is welding under the welding heat input of the coupled arc and the lower part mainly determined by the plasma arc. Moreover, a narrow heat affected zone can be achieved using the coupled arc and the microstructure consists of fine pearlite and a small amount of acicular ferrite.

4. Conclusions

From the current study, a novel hybrid welding method has been proposed, and the coupled arc behavior has been explored. The coupled arc profile and coupled arc pressure have been considered as ascertaining the mechanics circumstance of coupled arc behavior. The following conclusions could be obtained:
  • Under the function of Lorentz force and plasma flow force, TIG arc is deflected and couples with plasma arc. A coupled arc is generated and simultaneously involves the arc characteristics of plasma and TIG.
  • The coupled arc profile is mainly determined by the combination effect of plasma flow force and Lorentz force generated by the magnetic field of plasma arc column, which is affected by the welding current from plasma and TIG.
  • The coupled arc pressure distribution in two-dimensional surface is similar to gourd shape. The maximum arc pressure appears between plasma arc and TIG arc and it is mainly determined by the plasma current. The welding conditions that affect the coupled arc distribution and the maximum pressure could be ranked according to their effects on the experimental results, namely, plasma current, plasma gas flow, TIG current and electrode spacing.
  • The high-efficiency welding process of mild steel can be achieved without obvious defects. A smooth and uniform weld seam with on side welding both side formation was acquired at a plasma current of 150 A, a TIG current of 70 A and a welding speed of 240 mm/min.

Author Contributions

H.-T.Z. and B.W. conceived and designed the experiment; H.-C.Z. performed the experiments and contributed to the data analysis; B.W. analysed the data and wrote the article; X.-M.Z. and J.-C.F. contributed to the data analysis and discussion.

Funding

This research received no external funding.

Acknowledgments

The research was sponsored by Shandong Provincial Natural Science Foundation (ZR2018MEE027), Shandong Key research and development plan (2017GGX30132), Shandong Key research and development plan (GG201709250277), Natural Scientific Research Foundation in Harbin Institute of Technology (HIT.NSRIF.201707) and Young Taishan Scholars Program of Shandong Province (tsqn20161062).

Conflicts of Interest

The authors declare no conflict of interest.

Nomenclatures

r1The plasma arc radius at the place of the tungsten cathode top (mm)
r2The plasma arc radius of arc column on the base metal surface (mm)
µ0Permeability of free space (T*m/A)
IPPlasma arc welding current (A)
pPlasma gas density (kg/m3)
µ1Axial component of the plasma velocity (m/s)
PeElectromagnetic axial pressure (Pa)
PgPlasma gas flow axial pressure (Pa)
FrThe plasma arc axis resultant force
SThe arc sectional area at the place of base plate on the arc radial and S = πr12
BMagnetic induction of magnetic field generated by plasma arc (T)
LDisplacement of particle per unit
FtThe plasma flow force of TIG arc
KA constant that equals µ/4π
µMedium magnetic conductivity (T*m/A)
RaThe radius of TIG arc root surface (mm)
RbThe radius of TIG arc root undersurface (mm)

References

  1. Liu, Z.M.; Cui, S.; Luo, Z.; Zhang, C.; Wang, Z.; Zhang, Y. Plasma arc welding: Process variants and its recent developments of sensing, controlling and modeling. J. Manuf. Process. 2016, 23, 315–327. [Google Scholar] [CrossRef]
  2. Tanaka, M.; Terasaki, H.; Ushio, M.; Lowke, J.J. A unified numerical modeling of stationary tungsten-inert-gas welding process. Metall. Mater. Trans. A 2002, 33, 2043–2052. [Google Scholar] [CrossRef]
  3. Wu, C.S.; Ushio, M.; Tanaka, M. Analysis of the tig welding arc behavior. Comput. Mater. Sci. 1997, 7, 308–314. [Google Scholar] [CrossRef]
  4. Huang, J.; He, X.; Guo, Y.; Zhang, Z.; Shi, Y.; Fan, D. Joining of aluminum alloys to galvanized mild steel by the pulsed de-gmaw with the alternation of droplet transfer. J. Manuf. Process. 2017, 25, 16–25. [Google Scholar] [CrossRef]
  5. Asai, M.S.; Ogawa, M.T.; Ishizaki, M.Y.; Minemura, M.T.; Minami, M.H.; Iyazaki, M.S.M. Application of plasma mig hybrid welding to dissimilar joints between copper and steel. Weld. World 2013, 56, 37–42. [Google Scholar] [CrossRef]
  6. Yurtisik, K.; Tirkes, S.; Dykhno, I.; Gur, C.H.; Gurbuz, R. Characterization of duplex stainless steel weld metals obtained by hybrid plasma-gas metal arc welding. Soldag. Insp. 2013, 18, 207–216. [Google Scholar] [CrossRef] [Green Version]
  7. Ton, H. Physical properties of the plasma-mig welding arc. J. Phys. D Appl. Phys. 1975, 8, 922. [Google Scholar] [CrossRef]
  8. Zhang, Y.M.; Zhang, S.B. Double-sided arc welding increases weld joint penetration. Weld. J. 2000, 77, 57–61. [Google Scholar]
  9. Taban, E. Joining of duplex stainless steel by plasma arc, tig, and plasma arc+tig welding processes. Mater. Manuf. Process. 2008, 23, 871–878. [Google Scholar] [CrossRef]
  10. Acherjee, B. Hybrid laser arc welding: State-of-art review. Opt. Laser Technol. 2018, 99, 60–71. [Google Scholar] [CrossRef]
  11. Liming, L.; Jifeng, W.; Gang, S. Hybrid laser–tig welding, laser beam welding and gas tungsten arc welding of az31b magnesium alloy. Mater. Sci. Eng. A 2004, 381, 129–133. [Google Scholar] [CrossRef]
  12. Chen, J.; Wu, C.S.; Chen, M.A. Improvement of welding heat source models for tig-mig hybrid welding process. J. Manuf. Process. 2014, 16, 485–493. [Google Scholar] [CrossRef]
  13. Hsu, Y.F.; Rubinsky, B. Two-dimensional heat transfer study on the keyhole plasma arc welding process. Int. J. Heat Mass Transf. 1988, 31, 1409–1421. [Google Scholar] [CrossRef]
  14. Wu, C.S.; Wang, L.; Ren, W.J.; Zhang, X.Y. Plasma arc welding: Process, sensing, control and modeling. J. Manuf. Process. 2014, 16, 74–85. [Google Scholar] [CrossRef]
  15. Tashiro, S.; Miyata, M.; Tanaka, M.; Shin, K.; Takahashi, K. Numerical analysis of basic property of keyhole welding with plasma arc. Trans. Mater. Res. Soc. Jpn. 2010, 35, 589–592. [Google Scholar] [CrossRef] [Green Version]
  16. Stenbacka, N. On arc efficiency in gas tungsten arc welding. Soldag. Insp. 2013, 18, 380–390. [Google Scholar] [CrossRef] [Green Version]
  17. Fuerschbach, P.W.; Knorovsky, G.A. A study of melting efficiency in plasma arc and gas tungsten arc welding. Weld. J. 1991, 70, 287. [Google Scholar]
  18. Sun, J.S.; Wu, C.S.; Zhang, Y.M. Heat transfer modeling of double-side arc welding. Acta Phys. Sin. 2002, 51, 286–290. [Google Scholar]
  19. Zhang, Y. Keyhole double-sided arc welding process. J. Mater. Sci. Technol. 2001, 17, 159–160. [Google Scholar] [CrossRef]
  20. Wang, J.; Sun, Q.; Feng, J.; Wang, S.; Zhao, H. Characteristics of welding and arc pressure in tig narrow gap welding using novel magnetic arc oscillation. Int. J. Adv. Manuf. Technol. 2017, 90, 413–420. [Google Scholar] [CrossRef]
  21. Qi, B.J.; Yang, M.X.; Cong, B.Q.; Liu, F.J. The effect of arc behavior on weld geometry by high-frequency pulse gtaw process with 0cr18ni9ti stainless steel. Int. J. Adv. Manuf. Technol. 2013, 66, 1545–1553. [Google Scholar] [CrossRef]
  22. Dai, D.S.; Song, Y.L.; Zhang, L.P. Study on the pressure in plasma arc. Chin. J. Mech. Eng. 2003, 34–36. [Google Scholar] [CrossRef]
  23. Cheng, L.; Hu, S.; Wang, Z. Arc pressure analysis in variable polarity tig welding. Trans. China Weld. Inst. 2014, 35, 101–104. [Google Scholar]
  24. Huang, Y.; Huaiyu, Q.U.; Fan, D.; Liu, R.; Kang, Z.; Wang, X. Arc pressure measurement and analysis of coupling arc aa-tig. Trans. China Weld. Inst. 2013, 34, 33–36. [Google Scholar]
  25. Ham, H.S.; Oh, D.S.; Cho, S.M. Measurement of arc pressure and shield gas pressure effect on surface of molten pool in tig welding. Sci. Technol. Weld. Join. 2013, 17, 594–600. [Google Scholar] [CrossRef]
  26. Murphy, A.B.; Tanaka, M.; Yamamoto, K.; Tashiro, S.; Sato, T.; Lowke, J.J. Modelling of thermal plasmas for arc welding: The role of the shielding gas properties and of metal vapour. J. Phys. D Appl. Phys. 2009, 42, 194006. [Google Scholar] [CrossRef]
  27. Murphy, A.B. Thermal plasmas in gas mixtures. J. Phys. D Appl. Phys. 2001, 34, R151–R173. [Google Scholar] [CrossRef]
Figure 1. Proposed PTCAW processing system.
Metals 08 00512 g001
Figure 2. Arc profile under different welding methods. (a) Single plasma arc. (b) Single TIG arc. (c) Coupled arc perpendicular to the welding direction. (d) Coupled arc parallel to the welding direction.
Metals 08 00512 g002
Figure 3. Schematic of the forces acting on the coupled arcs.
Metals 08 00512 g003
Figure 4. Schematic of the behavior on the plasma arc images of arc profile of different welding method. (a) Coupled arc welding. (b) Plasma arc welding. (c) TIG arc welding.
Metals 08 00512 g004
Figure 5. Acquired images of coupled arc profile with different TIG welding current: (a) 30 A; (b) 40 A; (c) 50 A; (d) 60 A; (e) 70 A; (f) 80 A; (g) 90 A; (h) 100 A.
Metals 08 00512 g005
Figure 6. Acquired images of coupled arc profile with different plasma welding current. (a) 40 A; (b) 60 A; (c) 80 A; (d) 100 A; (e) 120 A; (f) 140 A; (g) 160 A; (h) 180 A.
Metals 08 00512 g006
Figure 7. Measurement system of the arc pressure. (a) The schematic diagram of the arc pressure data acquisition system. (b) The schematic diagram of the acquisition methods for coupled arc pressure.
Metals 08 00512 g007
Figure 8. Stagnation pressure distribution of welding arc with the different method. (a) Top view of two-dimensional distribution of the plasma arc. (b) The plasma arc pressure along with welding direction with different distance to measurement orifice axis. (c) Top view of two-dimensional distribution of the TIG arc. (d) The TIG arc pressure along with welding direction with different distance to measurement orifice axis. (e) Top view of two-dimensional distribution of the coupled arc. (f) The coupled arc pressure along with welding direction with different electrode spacing.
Metals 08 00512 g008
Figure 9. Coupled arc pressure with different plasma current. (a) Coupled arc pressure along with welding direction. (b) Max value of coupled arc pressure.
Metals 08 00512 g009
Figure 10. Coupled arc pressure along with welding direction with different current. (a) The plasma current is 60 A. (b) The plasma current is 120 A.
Metals 08 00512 g010
Figure 11. Coupled arc pressure with different nozzle height. (a) Coupled arc pressure along with welding direction. (b) Max value of coupled arc pressure.
Metals 08 00512 g011
Figure 12. Coupled arc pressure with different plasma gas flow. (a) coupled arc pressure along with welding direction. (b) Max value of coupled arc pressure.
Metals 08 00512 g012
Figure 13. Appearance and microstructure of the weld. (a) The surface of the weld. (b) The back of the weld. (c) The coupled arc welding process with filler wire. (d) The cross-section of the weld. (e) The microstructure of the cross section.
Metals 08 00512 g013
Table 1. Welding parameters for designed experiments.
GroupPlasma Arc Current (A)TIG Arc Current (A)Nozzle Height (mm)Plasma Gas Flow (L/min)
#160, 80, 100, 12010054
#26060, 90, 120, 15054
#3120140, 160, 180, 20054
#4601003, 4, 5, 64
#56010053, 4, 5, 6
Table 2. Experimental conditions for arc pressure measurement.
IP (A)IT (A)DPT (mm)L (mm)D (mm)Qp (L/min)Qs (L/min)
60100751.25415

