Effect of Mg Treatment on Refining the Microstructure and Improving the Toughness of the Heat-Affected Zone in Shipbuilding Steel


1
Hebei High Quality Steel Continuous Casting Engineering Technology Research Center, College of Metallurgy and Energy, North China University of Science and Technology, Tangshan 063009, China
2
Analysis and Testing Center, North China University of Science and Technology, Tangshan 063009, China
*
Author to whom correspondence should be addressed.
Metals 2018, 8(8), 616; https://doi.org/10.3390/met8080616
Submission received: 12 July 2018
/
Revised: 30 July 2018
/
Accepted: 2 August 2018
/
Published: 6 August 2018
(This article belongs to the Special Issue 5th UK-China Steel Research Forum)
Abstract
:The effect of Mg treatment on the microstructure and toughness of the heat-affected zone (HAZ) of shipbuilding steel after high-heat-input welding was investigated via laboratory and industrial testing. The welding process and Charpy impact tests were also carried out to evaluate the HAZ toughness of steel plates. First, typical inclusion characteristics were characterised with an ASPEX PSEM Explorer. Then, confocal laser scanning microscopy (CLSM) was used to observe the diameters of austenite grains under different holding times. The results showed that when the addition of microalloy elements were in the order of Al–Mg–Ti, this had an effect on dispersing inclusions, the largest proportion of which were micro-inclusions that had a particle size range of 1.0–1.5 μm. This accounted for 25.4% of the total inclusions, which was the highest amount. The micro inclusion particle size that was mainly distributed in the range of 0.5–3.5 μm accounted for 82.8% of all the micro-inclusions. The inclusion structure induced intragranular acicular ferrite (IAF) in austenite as follows: MgO and Al2O3 formed the core and Ti2O3 adhered to the Al–Mg complex inclusions to produce smaller particle sizes and dispersions of Al, Mg, and Ti complex inclusions. The 40-mm-thick plate obtained in the industrial test after welding had an average impact absorbed energy 2 mm from the weld joint in the heat-affected zone of 198.9 J at −20 °C, while the welding heat input was 150 kJ/cm, compared with the parent material’s low-temperature performance, which exceeded 88%.
1. Introduction
Shipbuilding applications require high-energy-input welding. In recent years, as productivity has increased, the toughness of the heat-affected zone (HAZ) in welded steel plates has seriously deteriorated. Thus, developing shipbuilding plate steel with greater strength and toughness has been proposed. Oxide metallurgy [1] is an effective way to improve the toughness of HAZ welding by utilizing non-metallic inclusions to nucleate an intragranular acicular ferrite (IAF) structure, thereby refining the microstructure and increasing the strength of the HAZ [2,3,4]. Research on IAFs induced by inclusions is still in its nascent stage [5,6,7]. The exact mechanism of the nucleation process by which inclusions induce intragranular acicular ferrite has not yet been elucidated. At present, the nucleation of acicular ferrite is generally stimulated by: (i) solute depletion from austenite in the vicinity of nonmetallic inclusion [8,9]; (ii) the availability of an inert surface for reduction in activation energy [10,11]; (iii) the thermal strain energy associated with different expansion coefficients of inclusion and matrix [12,13] and (iv) the reduction of interfacial energy between the ferrite and the inclusions due to good lattice matching [14,15].
In recent decades, studies have increasingly concentrated on the development of IAF by inclusions, such as Ti-enriched inclusions (e.g., TixOy [16,17,18] or TiN [19,20]). Several researchers have investigated the positive roles of these inclusions in microstructure refinement, either individually or together with other inclusions in complex deoxidized steel [21,22,23]. Magnesium has an even stronger affinity for oxygen and sulphur than titanium, meaning that adding Mg to steel can easily distribute fine oxide inclusions, such as MgO, MgO·Al2O3, and MgO·TiOx, which various researchers have recognized as the most effective nuclei for IAF [24,25,26]. Strength is further increased through precipitation hardening and the refinement of grain size by microalloying with Nb, V, and Ti, either individually or in combination. Moreover, Nb is added during controlled rolling to inhibit austenite recrystallization, and Ti is added to avoid extensive austenite grain coarsening during welding [27,28].
Results from laboratory tests are easily found in the literature; however, industrial experiments are rare. Therefore, in this study, laboratory and industrial-scale experiments have been performed with good replicability. Shipbuilding steel was treated with Mg and produced inclusions that had an effect on the formation of acicular ferrite in the microstructure. These inclusions were small, highly dispersed particles that acted as heterogeneous nucleation sites for new phases and facilitated the formation of acicular ferrite to divide the austenite, while the refined microstructure effectively improved the toughness of the steel.
2. Experimental Section
2.1. Laboratory Experiments
As-received shipbuilding steel ingots (90-mm thick) were produced with various microalloy elements using a 100-kg vacuum induction furnace in a laboratory. The 90-mm-thick ingots were heated to 1200 °C and kept at this temperature for 2 h, rolled to 12 mm over nine passes by a ∅400 × 350-mm hot rolling mill with the finishing temperature controlled to 800 °C, and air-cooled to room temperature. Two plates were welded with a heat input of 50 kJ/cm along the length of the plates. The average absorbed energy in the weld was determined using a V notch specimen with an HVT2 Charpy test at −20 °C. The compound microalloy testing was performed using DH36 shipbuilding steel. The compositions of the test steels are shown in Table 1.
2.2. Industrial Experiments
An industrial test on the high-heat-input welding shipbuilding structural steel DH36 was performed at a factory in North China. The industrial production experimental process contained a 120 t converter, a 120 t LF, and a 220-mm-thick slab caster. During steel tapping, Mo, Mn, Si, Nb, and Al were added. During LF refining, aluminium wire, calcium lime, magnesium wire, and titanium wire were added. The normalizing rolling process was adopted. For an accumulated total reduction greater than 42%, each pass deformation rate was greater than 12%, and the deformation rate of the last pass was greater than 10%. The accelerated controlled cooling (ACC) process was adopted to control the cooling process. The initial rolling temperature was 1050–1120 °C, and the final rolling temperature was 700 °C in order to generate a 40-mm-thick plate. The welding heat input was 150 kJ/cm, and the welding speed was 22.7 m/h. The welding was performed along the length of the steel plate, and the average absorbed energy for the V notch in the Charpy impact test was obtained at −20 °C, with impact specimens taken 2 mm transverse from the weld joint in the HAZ according to GB/T 229–2007.
2.3. Laboratory Detection
Scanning electron microscopy (SEM, S-4800, Hitachi Limited, Tokyo, Japan) was carried out to analyse the chemical composition and size distribution of the inclusions after all the specimens were treated using standard grinding and polishing techniques. The microstructure of the specimens was examined with an optical microscope after etching in a 4% (volume fraction) initial solution. The size distributions and chemical compositions of numerous inclusions were analysed automatically using an ASPEX PSEM Explorer (Aspex Corp., Delmont, PA, USA) equipped with an energy-dispersive spectroscopy (EDS, S-4800, Hitachi Limited, Tokyo, Japan) unit.
The inclusion precipitation, growth, and microstructural evolution were observed in situ using confocal laser scanning microscopy (CLSM, VL2000DX, YONEKURA, Osaka, Japan) to obtain detailed information. The samples were processed into a size of 7 × 3 mm, placed into the microscope, heated at a rate of 200 °C/min to 1100 °C, held at this temperature for 300, 600, and 900 s, respectively, cooled at a rate of 300–690 °C/min, held at this new temperature for 600 s, and then cooled at a rate of 300 °C/min to room temperature.
3. Results and Discussion
3.1. Effect of the Microalloy Element Mo on the Microstructure
The test steel for the HAZ microstructures with and without the Mo microalloy added is shown in Figure 1.
The compositions of test steels in Table 1 are denoted as steel 1 and steel 2. As shown in Figure 1a, coarse proeutectoid ferrite on the austenite grain boundaries and pearlite in the austenite. Figure 1b shows blocky ferrite, acicular ferrite, and pearlite; the grain in HAZ is small, as Mo can shrink the austenitic phase zone and induce ferrite effectively, which will promote the precipitation of microalloy carbonitride in ferrite, and improve the stability of microalloy carbonitride. Mo cannot be segregated easily while the distribution in austenite is relatively greater than that in the grain boundary, thus, it can inhibit the transformation of proeutectoid ferrite. Thus, Mo could inhibit the transformation of proeutectoid ferrite and improve the toughness, the average impact absorbed energy results of the low-temperature impact tests on steel 1 and steel 2 plates after welding is shown in Table 2, were 10.3 J and 74 J at −20 °C, respectively.
3.2. Effect of Microalloy Elements V and Nb on the Microstructure
The compositions of the tested steels in Table 1 are labelled steel 3 and steel 4 for comparing the effects on microalloy V and microalloy Nb. Microalloy V was added to steel 3, while microalloy Nb was added to steel 4. Microstructures containing V and Nb are shown in Figure 2.
As shown in Figure 2, the microalloy elements promote IAF in the ingots microstructure, but the results of the ingots microstructure by V is less than that by Nb.
The performance of the HAZ microstructure containing V is worse than that of the HAZ microstructure containing Nb.
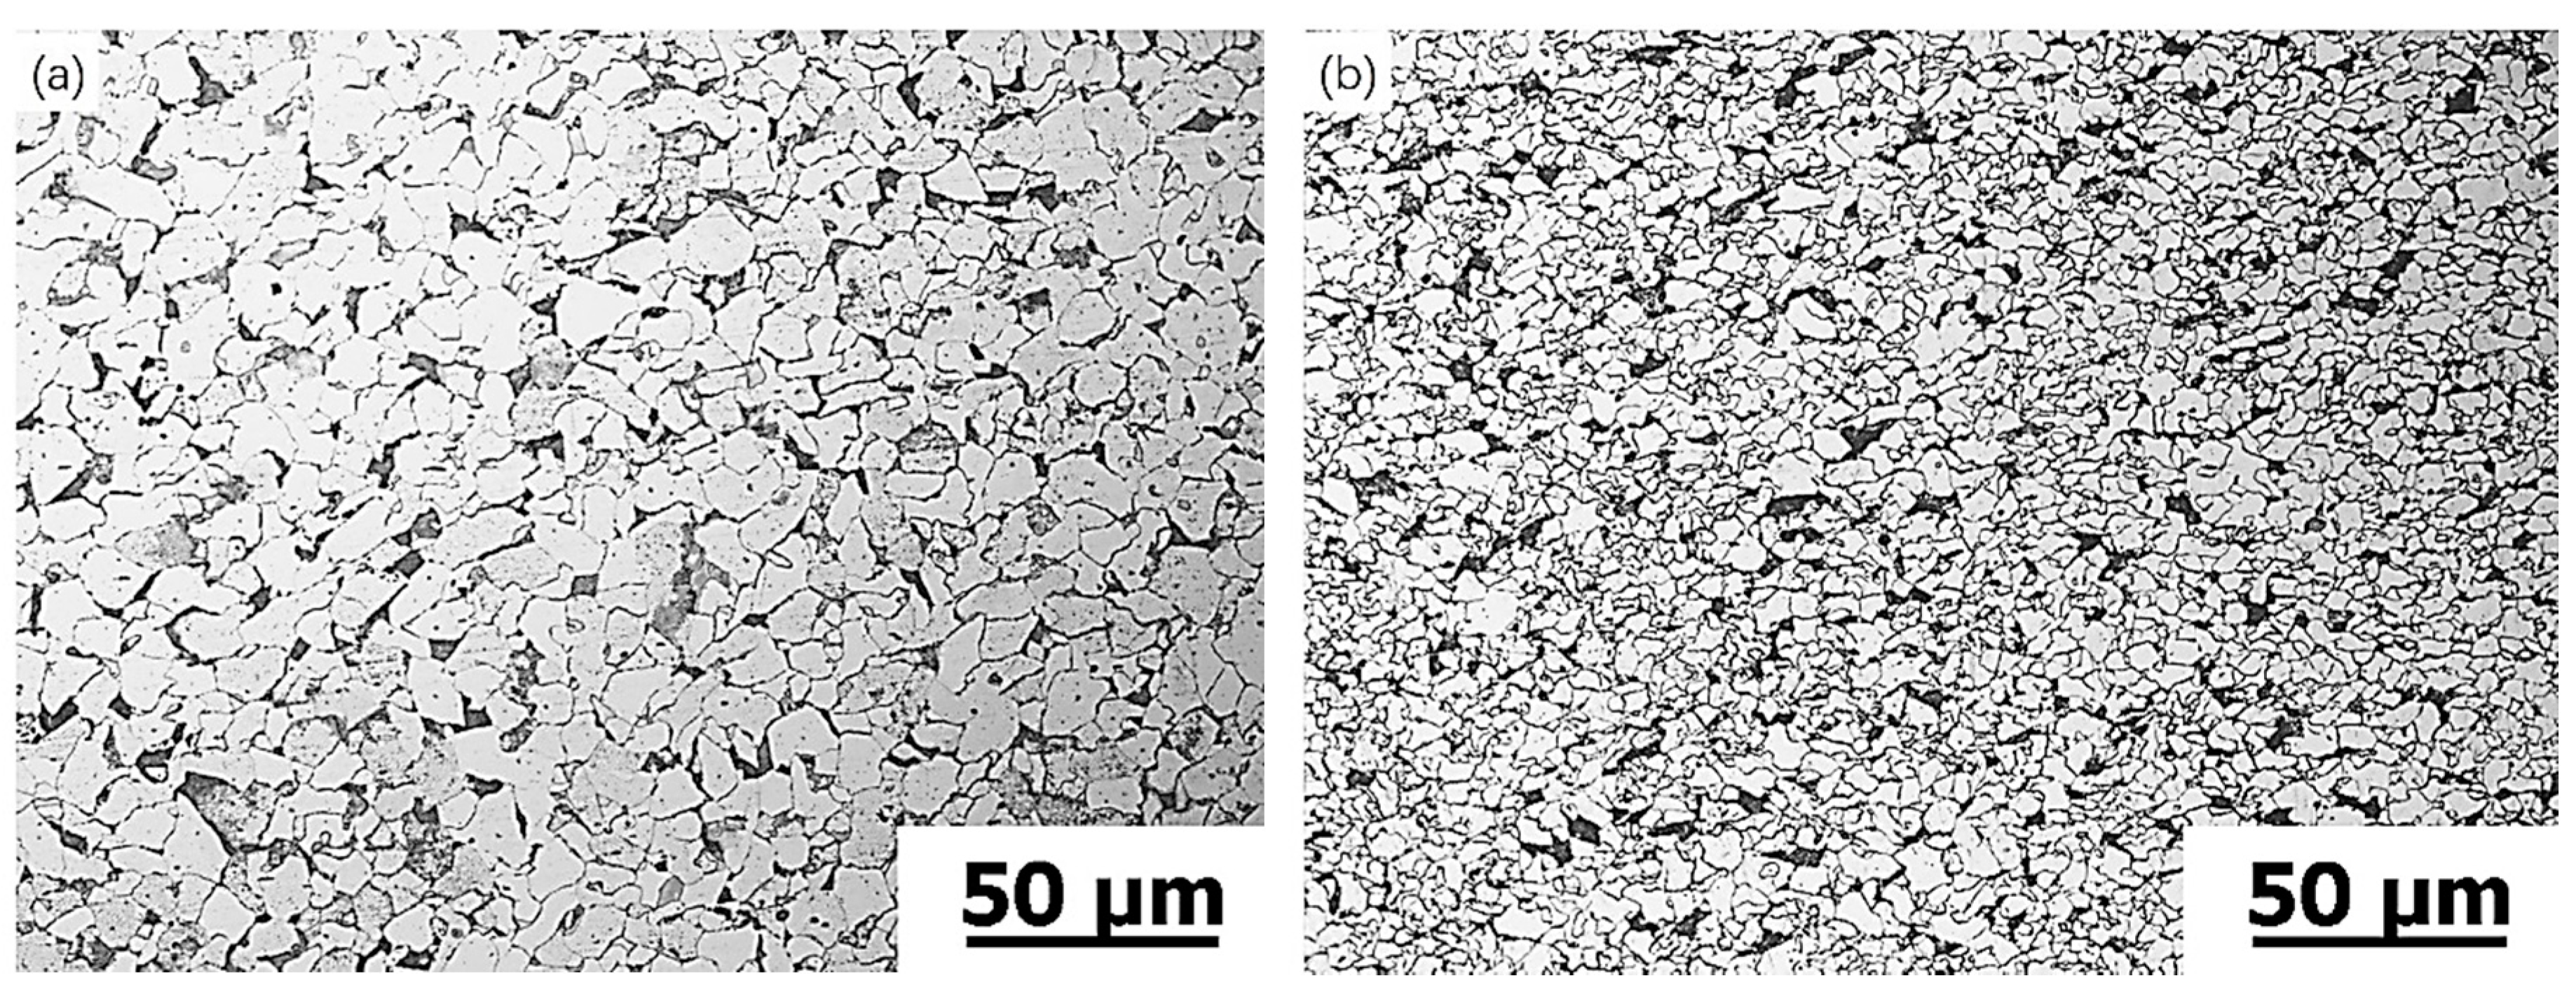
The microstructure of the rolled samples are shown in Figure 3. The microstructures primarily contain polygonal ferrite and pearlite. The ferrite was uniformly distributed as multilateral- or lath-shaped particles, with fine ferrite strip bundles and distinct grain boundaries. However, the grains were smaller when the microalloy Nb was added.
The HAZ microstructures after welding are shown in Figure 4. The test steel with V had granular bainite, pearlite, and ferrite in the coarse austenite grains, whereas the test steel with Nb had considerably smaller grains in the HAZ.
Both V and Nb had an effect on refining the grains. NbN and NbC precipitated from the austenite and the grain boundary at nearly 900 °C [29], whereas the temperatures of VN and VC which precipitated from ferrite were 770 °C and 630 °C, respectively. In this composition range, nitrides or carbon nitride precipitated in the molten steel. The content of N sharply decreased during the transformation from austenite to ferrite, whereas for AlN, rapid precipitation occurred in the grain boundary. As a result of the composite microalloy, composite inclusions in austenite, which induced IAF nucleation, were more dispersed and smaller. In the process of austenite transformation, the initially formed IAFs grew in size rapidly and divided the original austenitic grains into small areas. The IAFs later grew only in these limited small areas, such that the grains were divided into smaller sizes. Therefore, the average effective grain size was several times smaller than the original austenitic grains, thus refining the grains. The ferrite grains were greatly refined, and the composite inclusions and ferrite interface greatly increased. The microalloy Ti produced coarser nanoscale AlN particles, and the continuity of the AlN distribution was destroyed. NbN and NbC attached to the complex inclusions, effectively induced IAFs in austenite, then divided the austenitic grains into small areas, and refined the HAZ microstructure, which improved the low-temperature impact toughness. These findings were consistent with the tests results.
The average impact absorbed energy results of the low-temperature impact tests on the steel plates after welding with microalloy elements V and Nb were 22 J and 83.6 J, respectively, as shown in Table 2.
3.3. Effect of the Microalloy Mg Addition Sequence on the Microstructure
3.3.1. Inclusions Size in Different Microalloy Addition Sequence
Different sequences of microalloy additions, namely, Al–Ti–Mg and Al–Mg–Ti, were tested based on the two-dimensional disregistry theory of lattice growth proposed by Bramfitt. The calculated results that were reported by the previous paper [30] indicate that the lattice disregistry value between Al2O3 and Ti2O3 was 5.91 at 1400 °C, signifying that aggregation was facile, the size of the composite inclusions was large, and dispersity was poor. The lattice disregistry between MgO and either Al2O3 or Ti2O3 was 12.06 or 13.01, respectively. These composite inclusions did not easily aggregate, and they appeared as small and dispersed particles. Therefore, Mg plays a role in sufficiently dispersing inclusions. Due to the isolation of MgO at high temperatures, Al2O3 and Ti2O3 do not aggregate, and they form smaller and more dispersed composite inclusions, which induce the formation of IAF and refine the structure. The particle size distribution of the inclusions for different microalloy addition sequences from the ingot samples is shown in Figure 5. For regular-shaped inclusions, the particle size was the diameter, while for irregular-shaped ones, the particle size was the equivalent circle diameter.
Figure 5 shows that the inclusions were smaller for the Al–Mg–Ti microalloy addition sequence (the red line) than the Al-Ti-Mg microalloy addition sequence (the black line). For the Al-Ti-Mg microalloy addition sequence, 0.5–2.5 μm inclusions accounted for 37.7% of the distribution, among which 2–2.5 μm inclusions accounted for 13.9% (the highest amount), 0.5–1 μm inclusions accounted for 4.9%, 1–1.5 μm inclusions accounted for 7.1%, and 1.5–2 μm inclusions accounted for 11.8%.
For the Al–Mg–Ti microalloy addition sequence, inclusions with a size of 0.5–2.5 µm accounted for 71.3% of the total inclusions. Within this range, 1–1.5 µm inclusions accounted for 25.4%, which was the greatest contribution, while 0.5–1 µm inclusions accounted for 19.0%, 1.5–2 µm inclusions accounted for 16.6%, and 2–2.5 µm inclusions accounted for 10.1%.
After deoxidation with aluminum, the quantity of Al2O3 inclusions are 1017 to 1014 in every ton of steel, the corresponding inclusion size is 0.1–1 µm, thus, Al2O3 formed abundant heterogeneous nuclei. Mg was easily removed by boiling and evaporation, and when the microalloy addition sequences is Al–Mg–Ti, MgO adheres to Al2O3 at high temperatures and increases the utilisation rate of Mg, followed by heterogeneous nucleation of Ti2O3, and Mg plays a role in sufficiently dispersing Al2O3 and Ti2O3 inclusions, so the largest inclusion size is smaller than Al–Ti–Mg. In a word, aggregated inclusions formed heterogeneous nucleation, so the inclusions’ size distribution increased first, with the effect of Mg on dispersing composite inclusions, resulting in fewer and fewer large-sized inclusions, and the inclusions’ distribution trend decreased.
3.3.2. Chemical Compositions of Inclusions in Different Microalloy Addition Sequence
The chemical compositions of the inclusions corresponding to the different microalloy addition sequences are shown in Figure 6. Figure 6a,b show the microalloy addition sequences of Al–Ti–Mg and Al–Mg–Ti, respectively. In Figure 6a, the composite inclusions contained more Al–Ti and less Mg, while in Figure 6b, the composite inclusions exhibited more Mg than those in Figure 6a, indicating that the utilization of Mg was increased and the composition inclusions were smaller, more dispersed, and more abundant.
3.3.3. Microstructures in Different Microalloy Addtion Sequences
The ingot microstructures containing the microalloy addition sequences Al–Ti–Mg and Al–Mg–Ti are shown in Figure 7a,b, respectively. Figure 7a reveals ferrite and pearlite in coarse austenite grains. Figure 7b shows significant amounts of IAF induced by the inclusions, with mainly ferrite and pearlite in the microstructure.
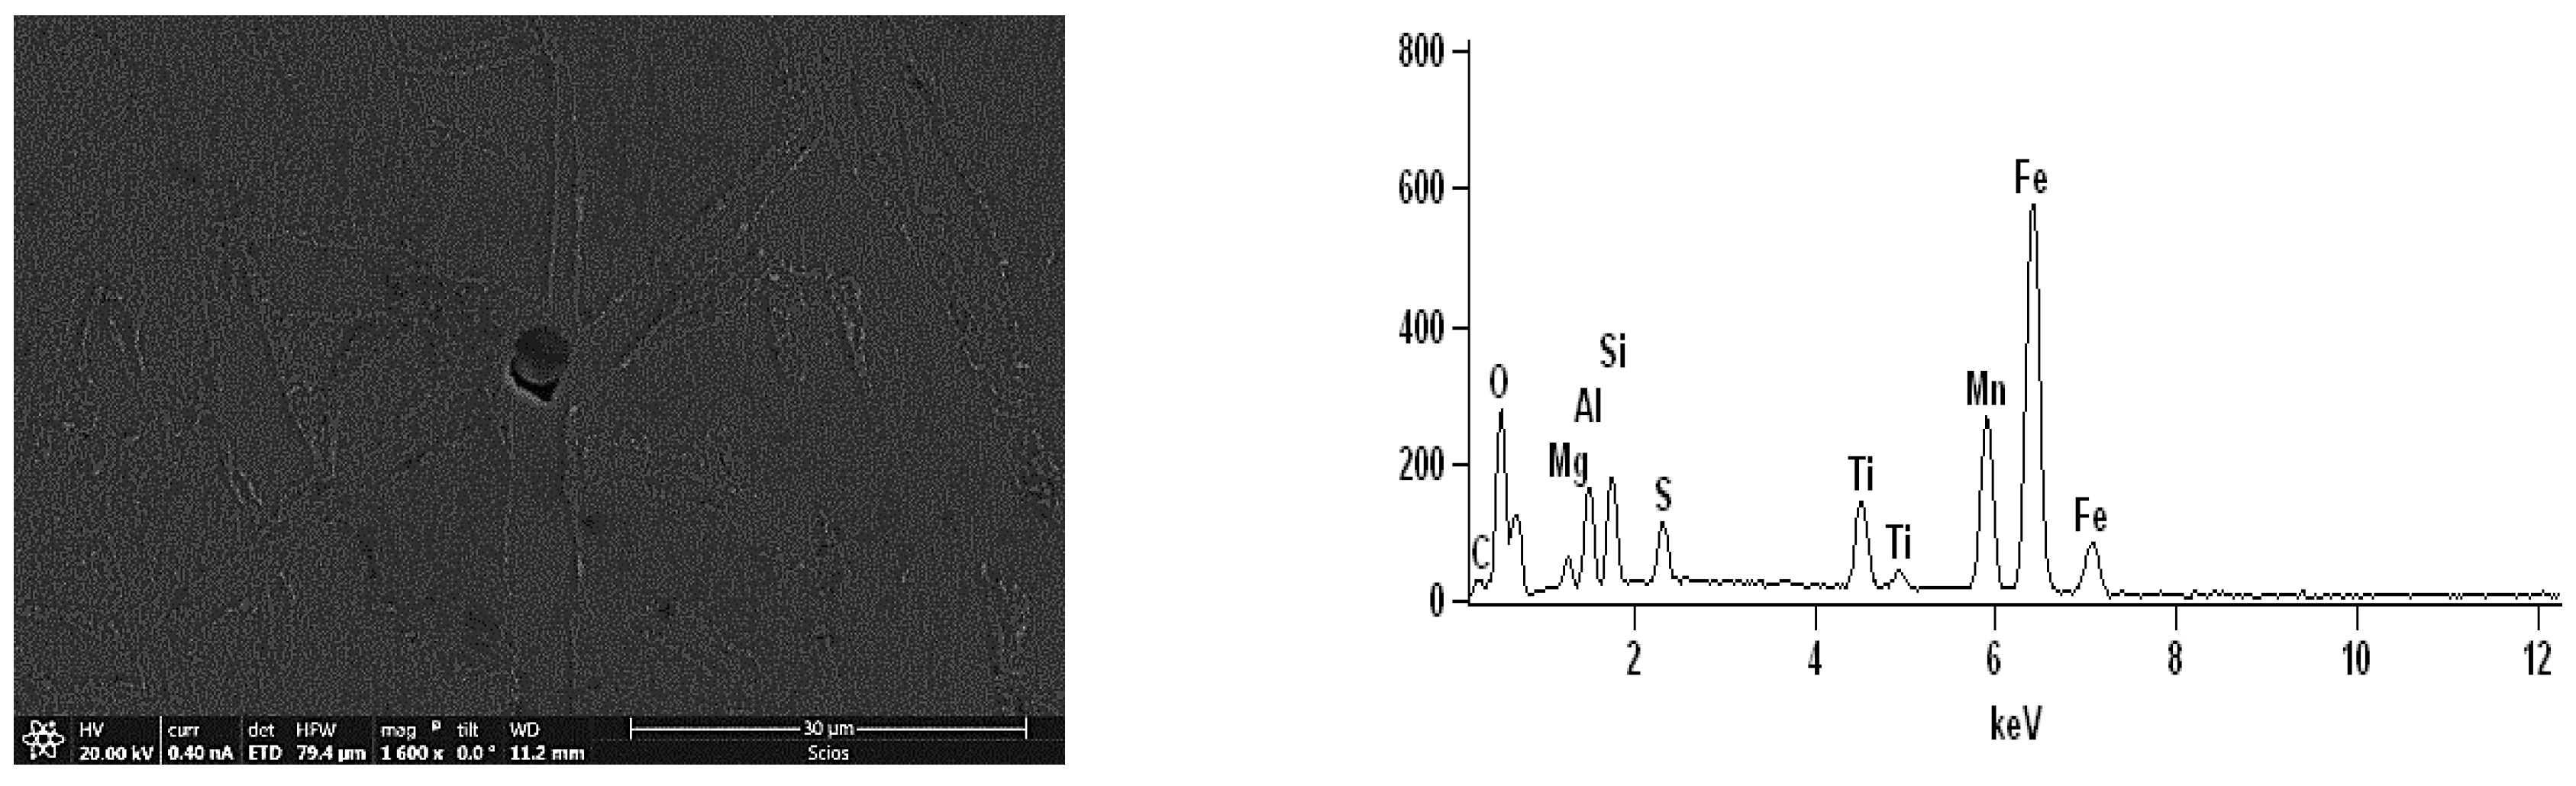
The SEM micrographs, EDS spectra, and mapping images of typical composite inclusion particles from the steel with the microalloy addition sequence of Al–Mg–Ti that induced IAF are shown in Figure 8 and Figure 9. Al2O3 formed the particle cores, with MgO heterogeneous surface nucleation, followed by Ti2O3 heterogeneous nucleation on the MgO·Al2O3 complex inclusions. The MgO·Al2O3 complex inclusions had a relatively high melting point in the earlier precipitated steel. Upon lowering the temperature, during the phase change from austenite to ferrite, carbonitrides were precipitated on the outermost layer of the complex inclusions and had a small disregistry, which could induce IAF most effectively.
Figure 10 shows the microstructure of the samples after hot rolling, where the main microstructural components were ferrite and pearlite, and the grain size was substantially smaller when the alloy addition sequence was Al–Mg–Ti.
The microstructures of the HAZ are shown in Figure 11. Figure 11a presents the ferrite and pearlite in coarse austenite grains. Figure 11b exhibits smaller grains containing IAF induced by inclusions that crossed each other to form a netlike ferrite organization. They were independent and did not grow in fascicles in the microstructure of mainly ferrite and pearlite. The results of the average impact absorbed energy of the low-temperature impact tests on the steel plates after welding with the microalloy addition sequences Al–Ti–Mg and Al–Mg–Ti were 8.9 J and 75.6 J, respectively, as shown in Table 2.
3.4. Industrial Testing
The target composition of the steel for industrial testing, named steel GY, was determined based on the laboratory results, as shown in Table 1.
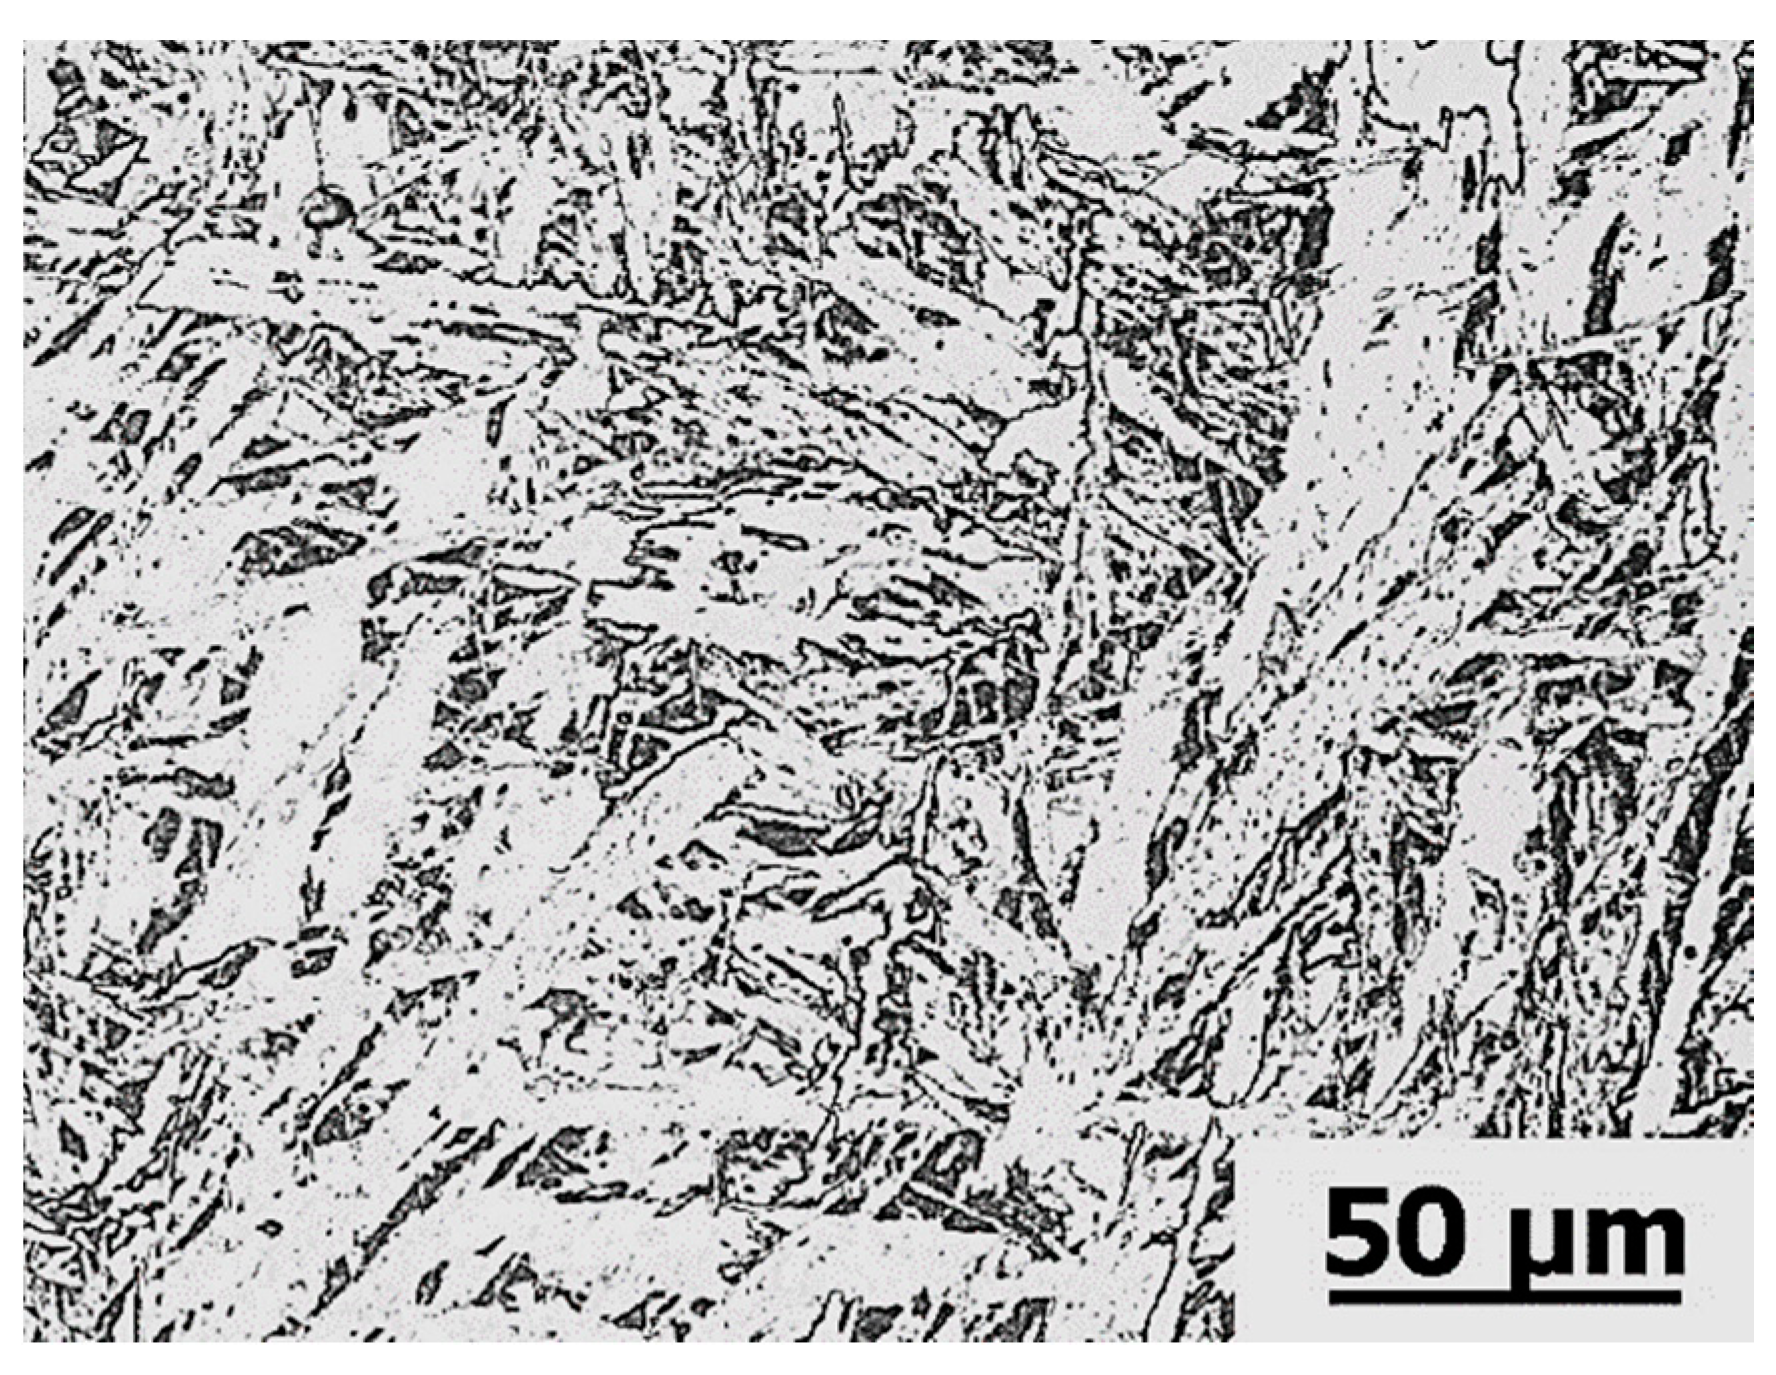
The microstructure of the industrial steel ingots is shown in Figure 12. It has large amounts of IAF crossing each other, while the IAF particles ranged from 5 to 10 µm in width. Varying orientations caused the IAF to exhibit an interwoven appearance, and the high dislocation density of IAF significantly refined the structure.
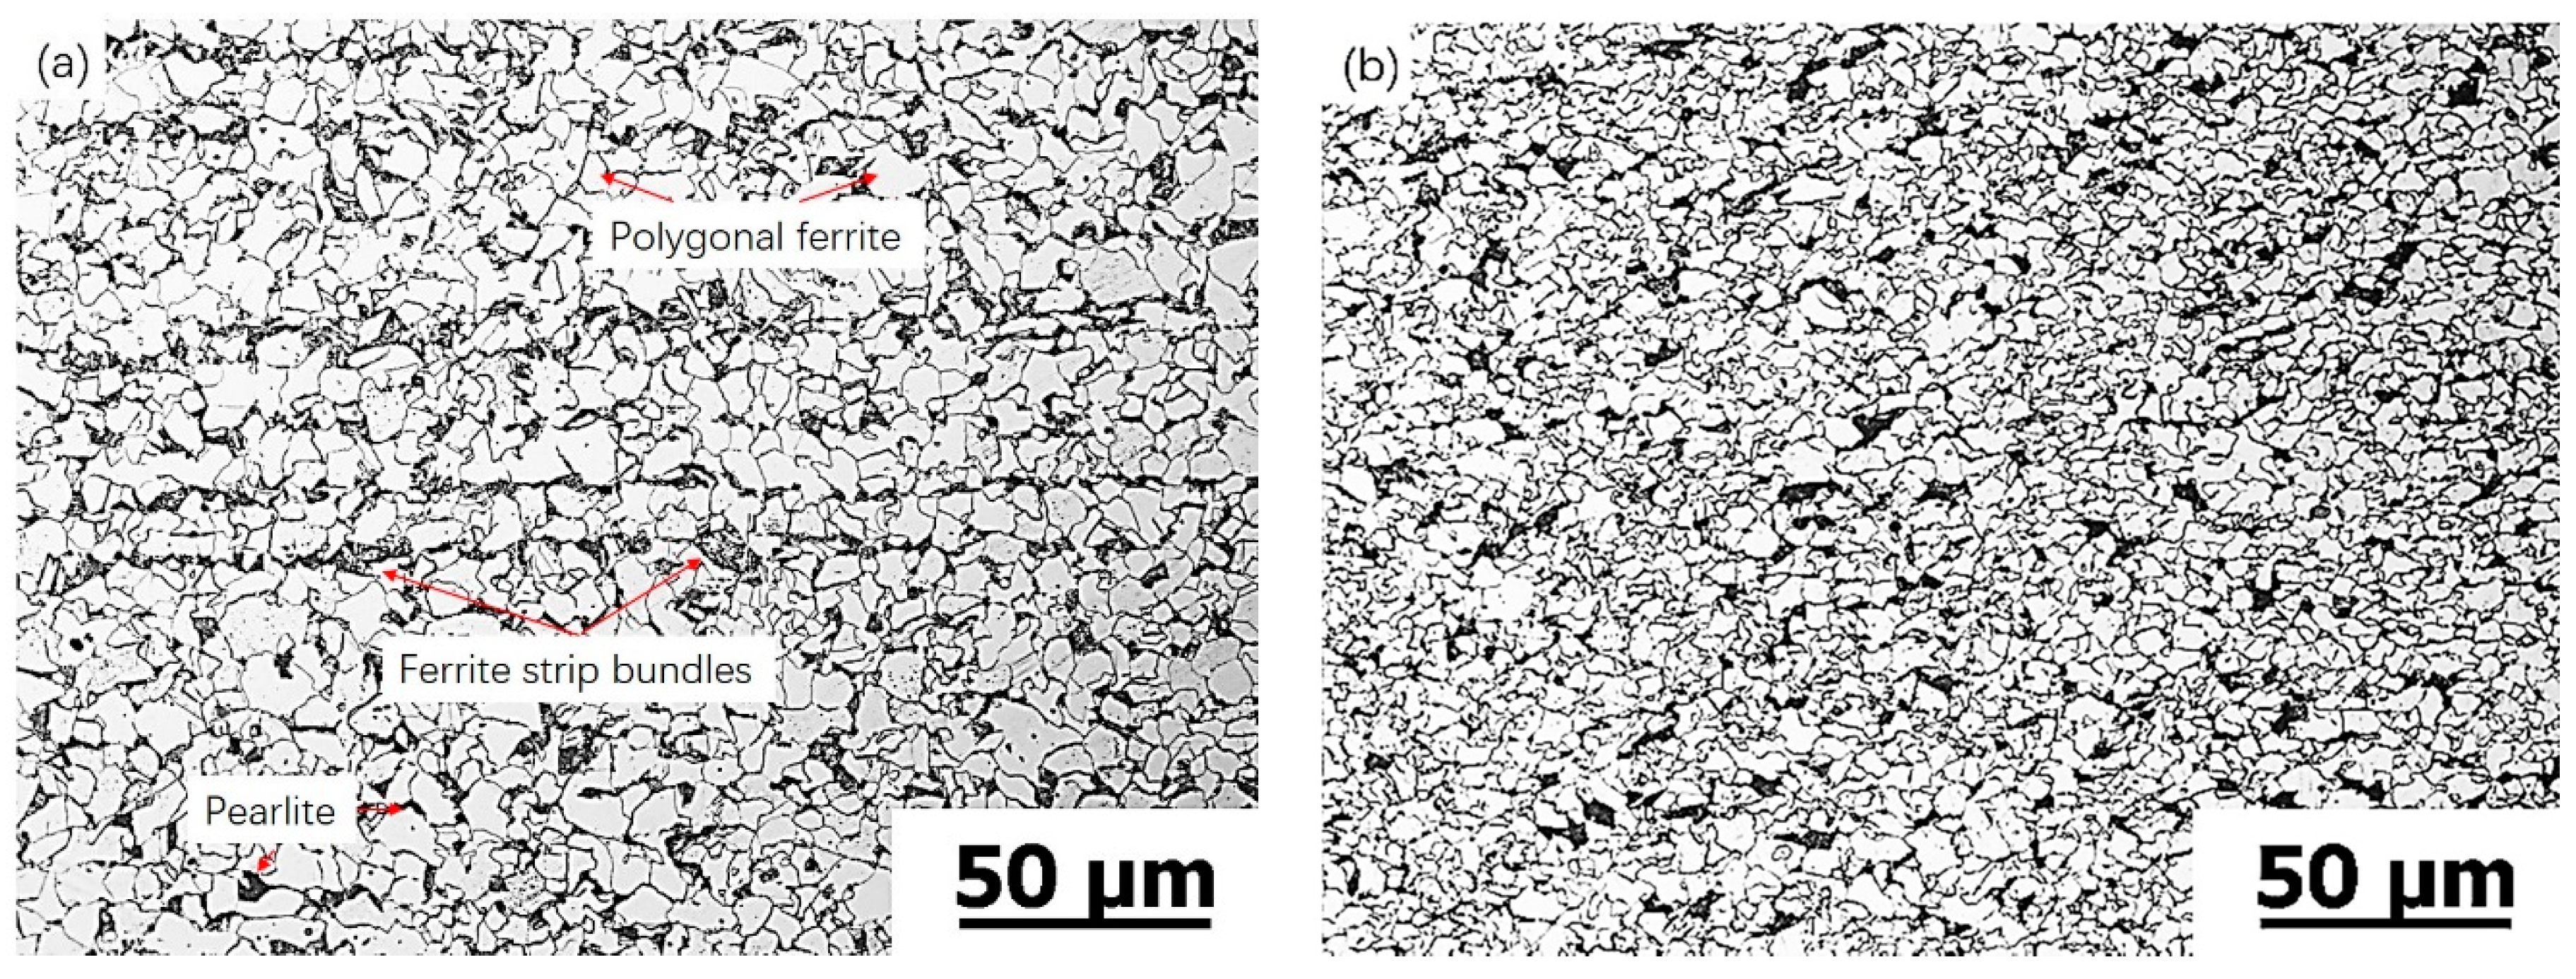
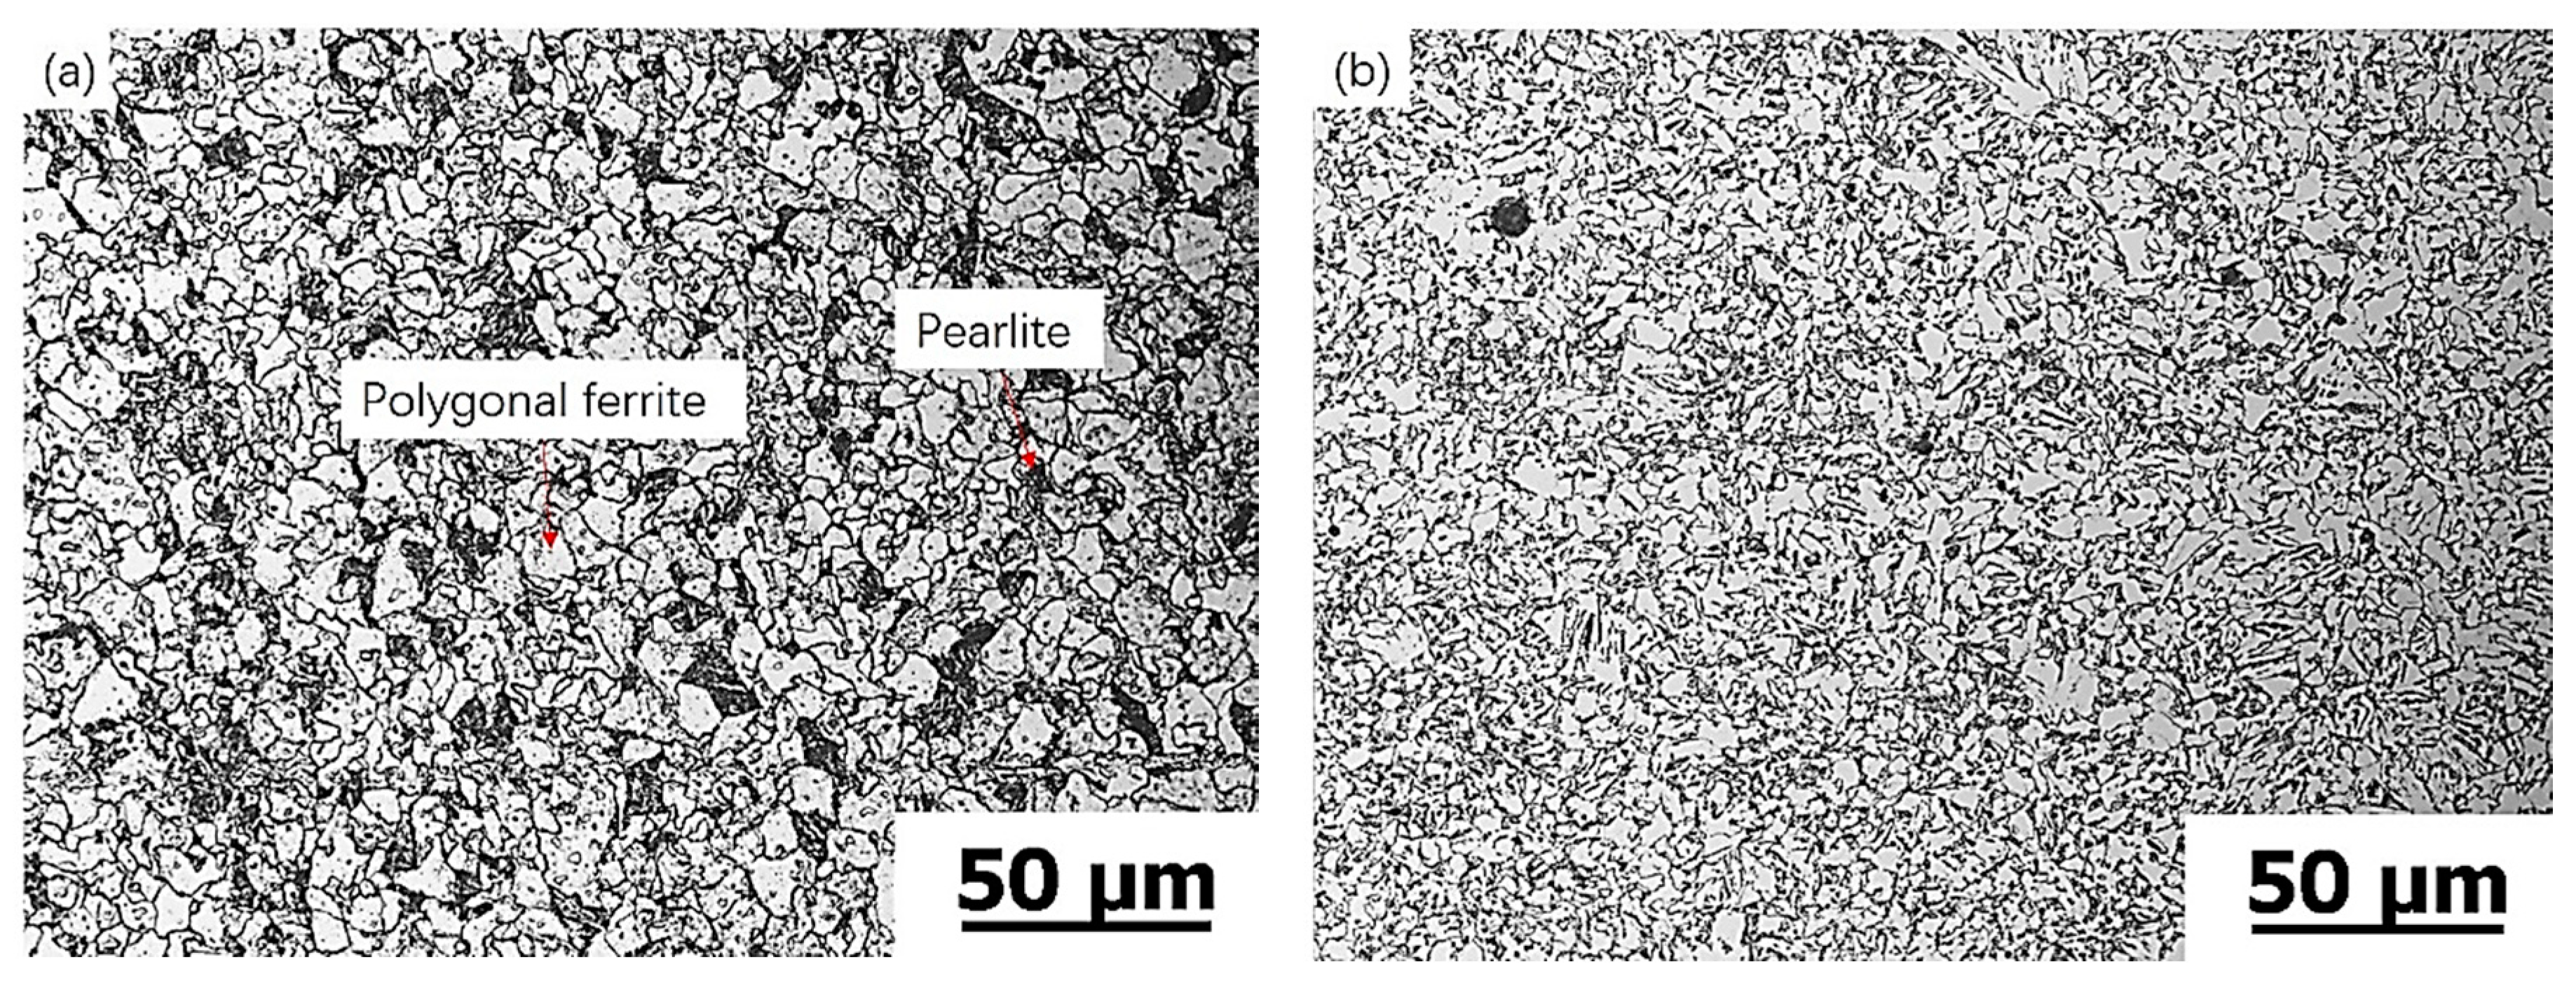
The microstructure of the 40-mm plate after hot rolling is shown in Figure 13a. The grains were small, and the microstructure consisted mainly of ferrite and pearlite. The results of impact testing the weld at −20 °C showed that the average impact energy absorbed 2 mm from the fusion line was 198 J, whereas the welding heat input was 150 kJ/cm compared with the parent material’s low-temperature performance, which was greater than 88%. According to the microstructure shown in Figure 13b, the grains in the HAZ are slightly larger than those in the rolling state. At this location, for high-temperature welding, all grains in the range of 1–5 mm from the fusion line were small and homogeneous and did not become coarser, which revealed that the complex inclusion particles had a significant role in improving the HAZ microstructure, while oxide metallurgy had a critical role in improving the HAZ toughness.
The welded joint macrostructure is shown in Figure 14 and the microstructure of the 40-mm plate after welding is shown in Figure 15. It can be seen in Figure 14 that the grain sizes in the three zones were different. In Figure 15a, the base metal zone had many IAFs, and in Figure 15b, a boundary between the base metal and the fusion zone could be seen where the grains in the fusion zone were smaller than those in the base metal. Figure 15c shows that the fusion and welding zones were distinguished from the boundary, while the grains in the welding zone were smaller than in the fusion zone. The microstructure shown in Figure 15d is symmetric with that in Figure 15c, which corresponds to Figure 14. At this location, for high-temperature welding, all grains in the range of 2–5 mm from the fusion line were small and homogeneous and did not become coarser, which revealed that the complex inclusion particles had a significant role in improving the HAZ microstructure. The average grains size in HAZ is 7.3 µm and provided by the calculation of Image Pro plus.
The morphology of austenite grains in the industrial steel at different holding times is shown in Figure 16a–c. It shows the austenite grain behaviour at a typical temperature at 1100 °C, for which the morphology and average size of the austenite grains were obtained, compared with the grains in HAZ, the original austenite grains 43.07 μm is six times larger, as shown in Table 3. After heating up to 1100 °C, this temperature was held for 300, 600, and 900 s, respectively. The austenite grains austenitized sufficiently and the diameters of the austenite grains did not increase. After the in situ observation experiments, the average diameters of the austenite grains were measured at the room temperature and were found to be 43.92, 45.74, and 54.56 μm, respectively. This result indicates that as the holding time increased, the average austenite grain diameter increased under these experimental conditions.
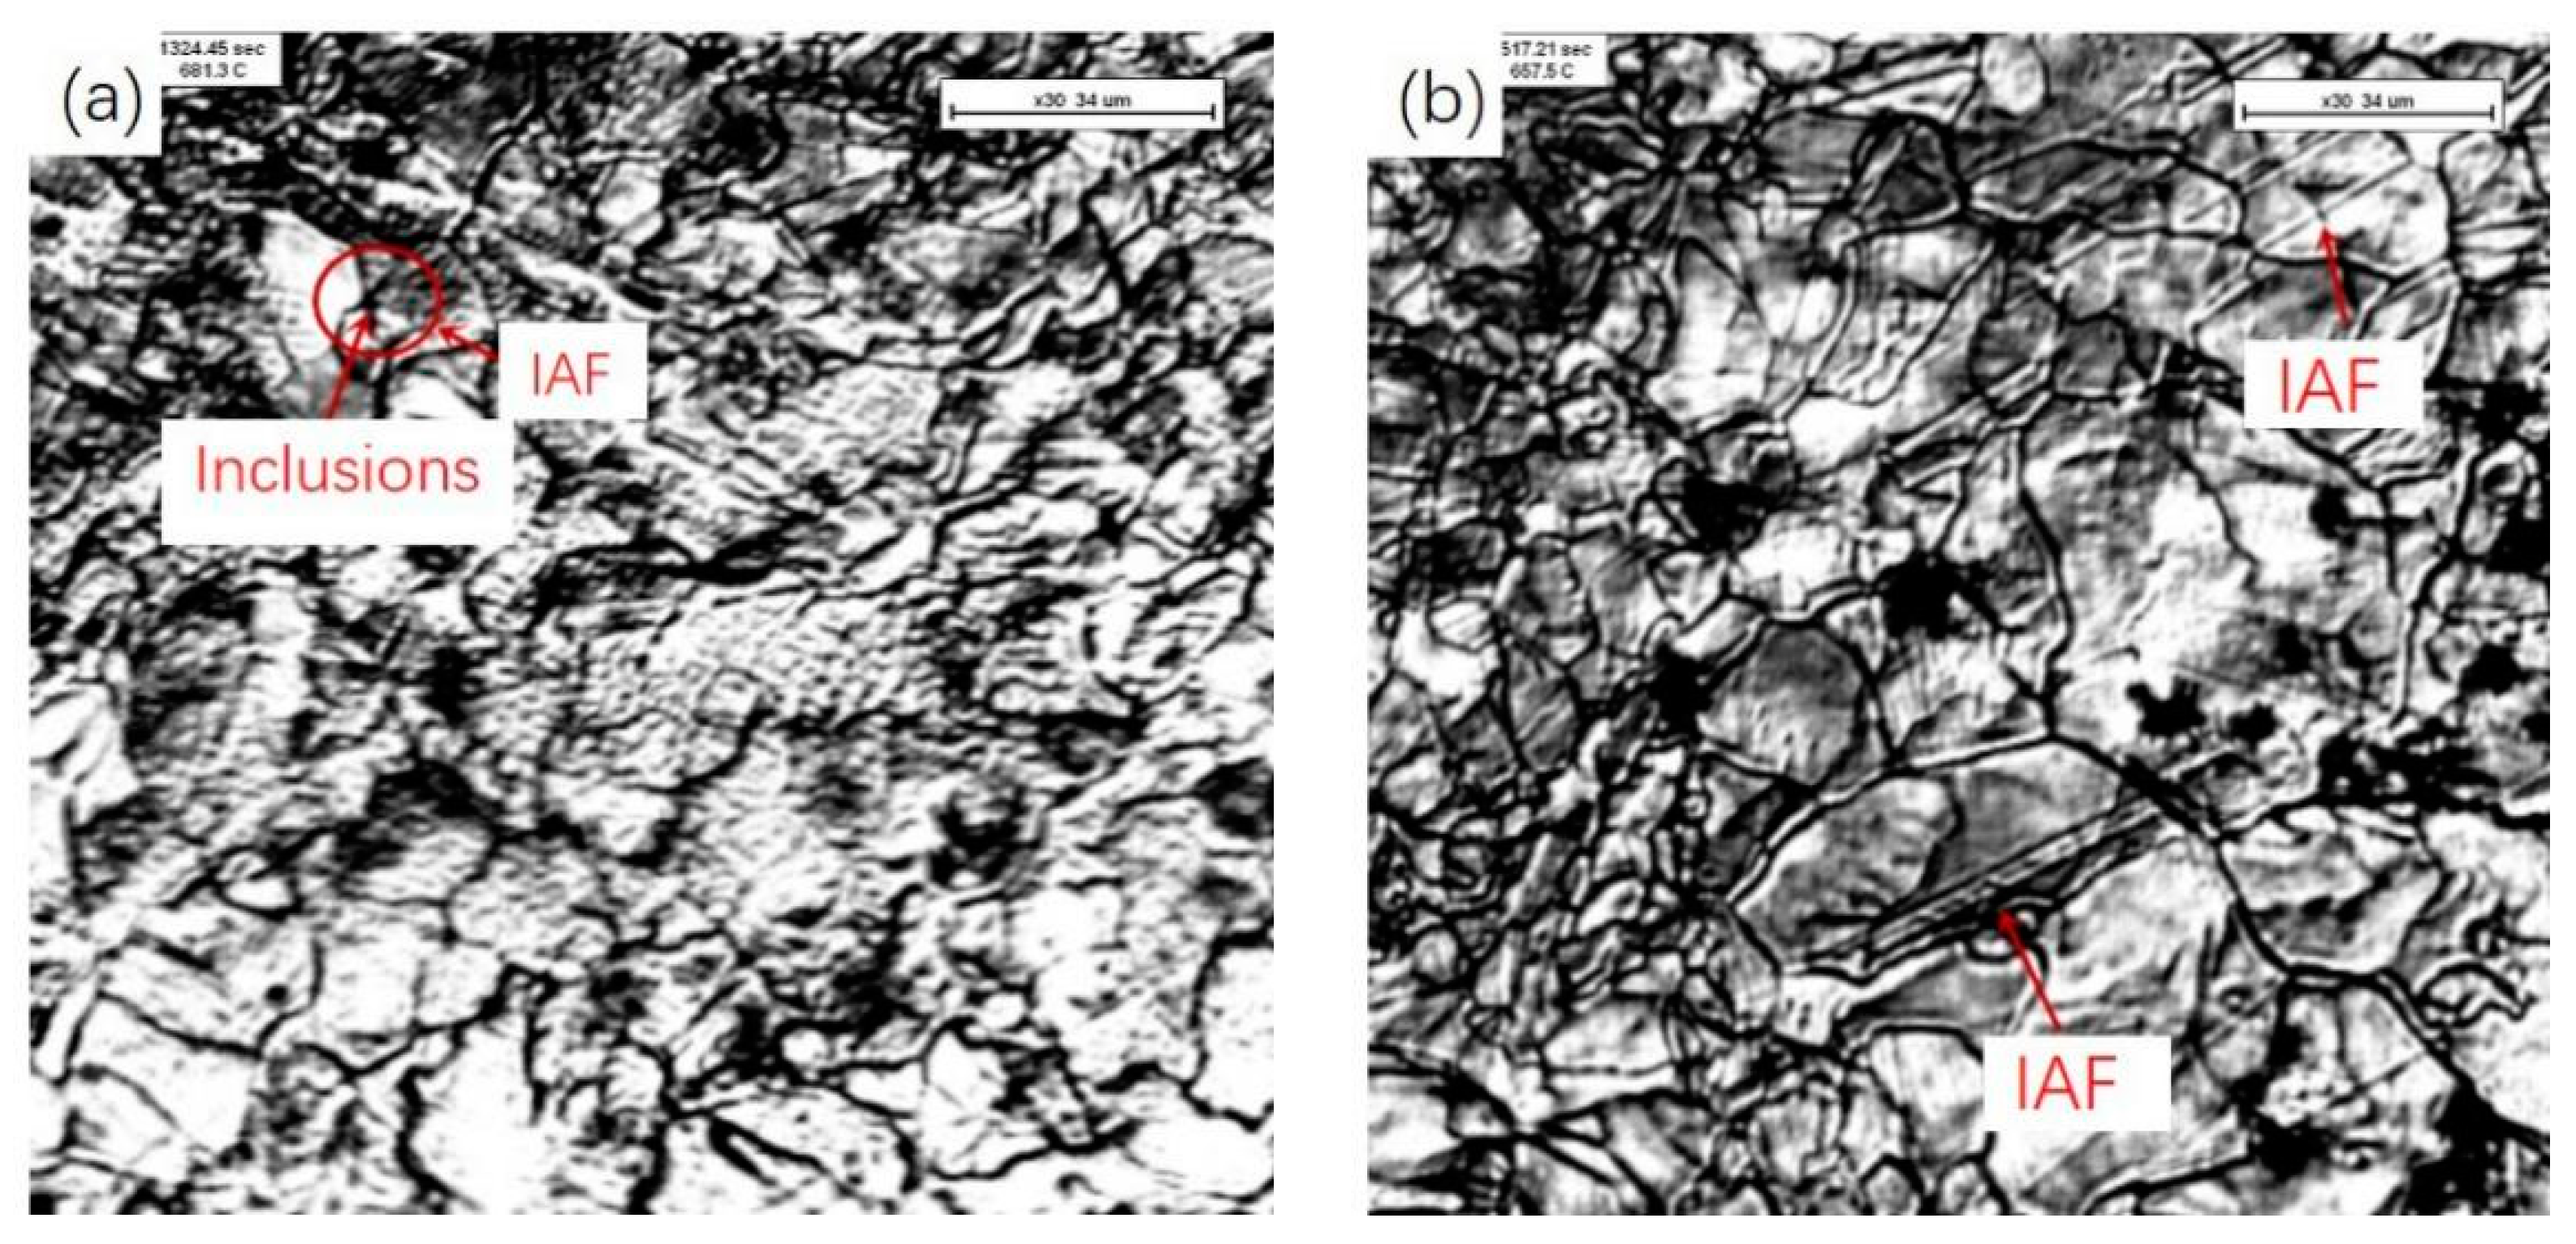
Based on the observations of the austenite grain boundaries, the positions of IAF formations can be determined. As shown in Figure 17a, there was acicular ferrite at the edge of the two boundaries, which was induced by an inclusion. In Figure 17b, IAFs can be observed to crossover all the austenite grains and are divided between two grains. The induced interlocking IAF particles are sufficiently abundant to refine the microstructure and improve the toughness.
4. Conclusions
Mo added for high-heat input welding shipbuilding steel can shrink the austenitic phase zone and induce intra-granular ferrite effectively, which will promote the ferrite transformation and inhibit the transformation of proeutectoid ferrite to improve the HAZ toughness.
When the alloy addition order was Al–Mg–Ti for high-heat-input welding, shipbuilding steel obtained dispersed, small, and abundant particles that effectively induced interlocking IAFs in austenite, for which Al2O3 and MgO served as the core, TixOy attached to the complex inclusions, and carbonitrides of Nb precipitated at the complex inclusions, which have a small two-dimensional disregistry with α-Fe, and induce IAF effectively, thus refining the HAZ microstructure, and inclusions with a size of 0.5–2.5 μm accounted for 71.3% of the total inclusions.
The 12-mm-thick plate obtained in the laboratory experiment after welding had an average impact absorbed energy of 83.6 J at −20 °C when 2 mm from the weld joint in the HAZ for a welding heat input of 50 kJ/cm. The 40-mm-thick plate obtained in the industrial test after welding had an average impact absorbed energy of 198.9 J at the same position as the laboratory steel and the same test temperature for a welding heat input of 150 kJ/cm, compared with the parent material’s low-temperature performance, which exceeded 88%.
Author Contributions
Conceptualization, Y.W.; Methodology, L.Z.; Supervision, S.W.; Writing—review & editing, Y.W., Funding Acquisition, L.Z., C.Z. and Q.Z.
Funding
This research was funded by National Natural Science Fund Project of China, grant number 51574106 and 51474089, Hebei Province Natural Science Foundation of Key Funds, grant number E2016209396 and Hebei Province Natural Science Fund project, grant number E2017209223.
Acknowledgments
This work gratefully acknowledge Professor Liguang Zhu, Professor Shuoming Wang and Professor Zengxun Liu providing guidance in research.
Conflicts of Interest
The authors declare no conflict of interest.
References
- Takamura, J.I.; Mizoguchi, S. Role of Oxides in Steels Performance, Metallurgy of Oxides in Steels. In Proceedings of the 6th International Iron and Steel Congress, Nagoya, Japan, 21–26 October 1990; pp. 591–597. [Google Scholar]
- Johason, M.Q.; Evans, G.M.; Edwards, G.R. The Influence of Titanium Additions and Interpass Temperature on the Microstructures and Mechanical Properties of High Strength SMA Weld Metals. ISIJ Int. 1995, 35, 1222–1231. [Google Scholar] [CrossRef]
- Lee, J.L.; Pan, Y.T. Effect of sulfur content on the microstructure and toughness of simulated Heat-Affected zone in Ti-Killed steels. Metall. Mater. Trans. A 1993, 24, 1399–1408. [Google Scholar] [CrossRef]
- Wang, C.; Misra, R.D.K.; Shi, M.H.; Zhang, P.Y.; Wang, Z.D.; Zhu, F.X.; Wang, G.D. Transformation behavior of a Ti–Zr deoxidized steel: Microstructure and toughness of simulated coarse grain heat affected zone. Mater. Sci. Eng. A 2014, 594, 218–228. [Google Scholar] [CrossRef]
- Jiang, G.C.; Zhu, Y.R.; Guo, S.Q.; Xu, J.L.; Wang, Y.Q.; Pan, L.Y.; Yu, D.W. The existence of intragranular ferrite plates and nucleating inclusions in the heat affected zone of X-60 pipe steel. J. Mater. Sci. 1997, 32, 2985–2989. [Google Scholar] [CrossRef]
- Kang, Y.J.; Jang, J.H.; Park, J.H. Influence of Ti on Non-Metallic Inclusion Formation and Acicular Ferrite Nucleation in High-Strength Low-Alloy Steel Weld Metals. Met. Mater. Int. 2014, 20, 119–127. [Google Scholar] [CrossRef]
- Zhang, D.; Terasaki, H.; Komizo, Y.I. In situ observation of the formation of intragranular acicular ferrite at non-metallic inclusions in C-Mn steel. Acta Mater. 2010, 58, 1369–1378. [Google Scholar] [CrossRef]
- Kang, Y.J.; Jang, J.H.; Park, J.H.; Lee, C.H. Mn-Depleted Zone Formation in Rapidly Cooled High-Strength Low-Alloy Steel Welds. Metall. Mater. Trans. A 2014, 45, 4753–4757. [Google Scholar] [CrossRef]
- Koseki, T. A Review on Inclusion-assisted Microstructure Control in C-Mn and Low-alloy Steel Welds. Weld. World 2005, 49, 22–28. [Google Scholar] [CrossRef]
- Zhang, S.; Hattori, N.; Enomoto, M.; Tarui, T. Ferrite nucleation at ceramic/austenite interfaces. ISIJ Int. 1996, 36, 1301–1309. [Google Scholar] [CrossRef]
- Byun, J.S.; Shim, J.H.; Cho, Y.W.; Lee, D.N. Non-metallic inclusion and intragranular nucleation of ferrite in Ti-killed C-Mn steel. Acta Mater. 2003, 51, 1593–1606. [Google Scholar] [CrossRef]
- Madariaga, I.; Gutiérrez, I. Role of the particle–matrix interface on the nucleation of acicular ferrite in a medium carbon microalloyed steel. Acta Mater. 1999, 47, 951–960. [Google Scholar] [CrossRef]
- Suito, H.; Karasev, A.V.; Hamada, M.; Inoue, R.; Nakajima, K. Influence of Oxide Particles and Residual Elements on Microstructure and Toughness in the Heat-Affected Zone of Low-Carbon Steel Deoxidized with Ti and Zr. ISIJ Int. 2011, 51, 1151–1162. [Google Scholar] [CrossRef] [Green Version]
- Li, Y.; Crowther, D.N.; Green, M.J.W.; Mitchell, P.S.; Baker, T.N. The effect of vanadium and niobium on the properties and microstructure of the intercritically reheated coarse grained heat affected zone in low carbon microalloyed steels. ISIJ Int. 2001, 41, 46–55. [Google Scholar] [CrossRef]
- Bramfitt, B.L. The effect of carbide and nitride additions on the heterogeneous nucleation behavior of liquid iron. Metall. Mater. Trans. B 1970, 7, 1987–1995. [Google Scholar] [CrossRef]
- Shim, J.H.; Cho, Y.W.; Chung, S.H.; Shim, J.D.; Lee, D.N. Nucleation of Intragranular Ferrite at Ti2O3 Particle in Low Carbon Steel. Acta Mater. 1999, 47, 2751–2760. [Google Scholar] [CrossRef]
- Lee, J.L.; Pan, Y.T. Effect of killing time on the microstructure and toughness of the heat-affected zone in Ti-killed steels. Metall. Mater. Trans. A 1991, 22, 2818–2822. [Google Scholar] [CrossRef]
- Jin, H.H.; Shim, J.H.; Cho, Y.W.; Lee, H.C. Formation of Intragranular Acicular Ferrite Grains in a Ti-containing Low Carbon Steel. ISIJ Int. 2003, 43, 1111–1113. [Google Scholar] [CrossRef] [Green Version]
- Ohta, H.; Suito, H. Effects of N, C and Si Contents and MgO on Dispersion of TiN Particles in Fe-1.5%Mn-0.05(0.15) %C Alloy. ISIJ Int. 2007, 47, 197–206. [Google Scholar] [CrossRef]
- Kim, S.K.; Suito, H.; Inoue, R. Effect of Multi-phase Oxide Particles on TiN Crystallization and Solidification Structure in Ti-Added Ferritic Stainless Steel. ISIJ Int. 2012, 52, 1935–1944. [Google Scholar] [CrossRef] [Green Version]
- Wen, B.; Song, B.; Pan, N.; Mao, J.H. Effect of SiMg alloy on inclusions and microstructures of 16Mn steel. Ironmak. Steelmak. 2011, 38, 577–583. [Google Scholar] [CrossRef]
- Xu, L.Y.; Yang, J.; Wang, R.Z.; Wang, Y.N.; Wang, W.L. Effect of Mg Content on the Microstructure and Toughness of Heat-Affected Zone of Steel Plate after High Heat Input Welding. Metall. Mater. Trans. A 2016, 47, 3354–3364. [Google Scholar] [CrossRef]
- Park, J.S.; Park, J.H. Effect of Mg-Ti Deoxidation on the Formation Behavior of Equiaxed Crystals during Rapid Solidification of Iron Alloys. Steel Res. Int. 2014, 85, 1303–1309. [Google Scholar] [CrossRef]
- Yang, J.; Xu, L.Y.; Zhu, K.; Wang, R.Z.; Zhou, L.J.; Wang, W.L. Improvement of HAZ Toughness of Steel Plate for High Heat Input Welding by Inclusion Control with Mg Deoxidation. Steel Res. Int. 2015, 86, 619–625. [Google Scholar] [CrossRef]
- Song, M.M.; Song, B.; Hu, C.L.; Xin, W.B.; Song, G.Y. Formation of Acicular Ferrite in Mg Treated Ti-bearing C-Mn Steel. ISIJ Int. 2015, 55, 1468–1473. [Google Scholar] [CrossRef]
- Li, X.B.; Zhang, T.S.; Yin, M.; Liu, C.J.; Jiang, M.F. Effect of magnesium addition in low-carbon steel part 1: Behaviour of austenite grain growth. Ironmak. Steelmak. 2017. [Google Scholar] [CrossRef]
- Babakhani, A.; Ziaei, S.M.R.; Kiani-Rashid, A.R. Investigation on the effects of hot forging parameters on the austenie grain size of vanadium microalloyed forging steel (30MSV6). J. Alloys Compd. 2010, 490, 572–575. [Google Scholar] [CrossRef]
- Morrison, W.B. Microalloy steels-the beginning. Mater. Sci. Technol. 2009, 25, 1066–1073. [Google Scholar] [CrossRef]
- Turkdogan, E.T. Cause and Effects on Nitride and Carbonitride Precipitation in HSLA Steel in Relation to Continuous Casting. Steelmak. Conf. Proc. 1987, 70, 399–403. [Google Scholar]
- Zhu, L.G.; Wang, Y.; Wang, S.M.; Zhang, Q.J.; Zhang, C.J. Research of microalloy elemens to induce intragranular acicular ferrite in shipbuilding steel. Ironmak. Steelmak. 2017. [Google Scholar] [CrossRef]
Figure 1.
Heat-affected zone (HAZ) microstructure of testing steel: (a) without Mo; and (b) with Mo.
Figure 1.
Heat-affected zone (HAZ) microstructure of testing steel: (a) without Mo; and (b) with Mo.

Figure 2.
Ingots microstructure of testing steel: (a) with V; and (b) with Nb.

Figure 3.
Rolling microstructure of testing steel: (a) with V; and (b) with Nb.

Figure 4.
HAZ microstructure of testing steel: (a) with V; and (b) with Nb.
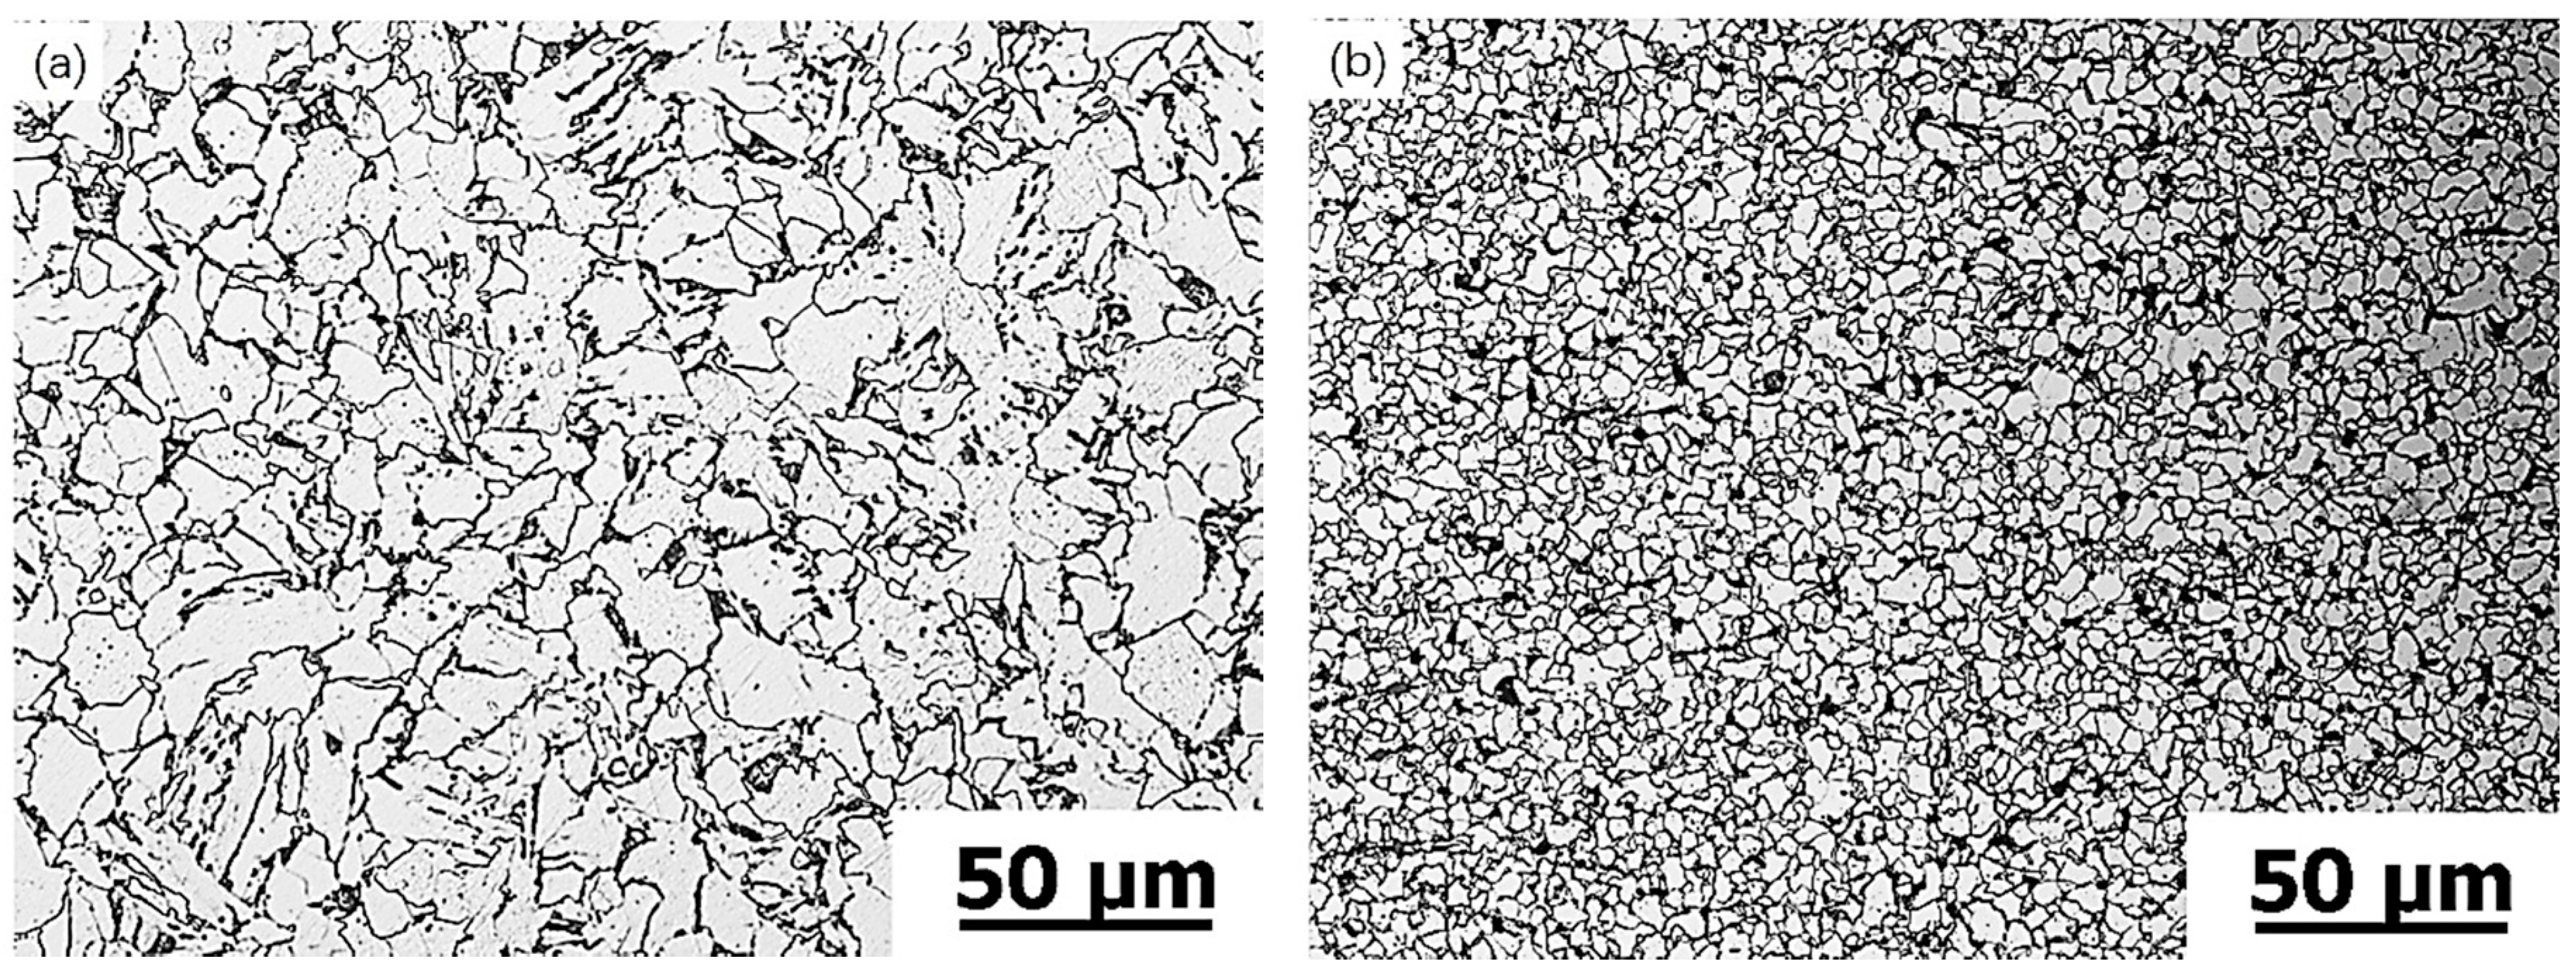
Figure 5.
Micro-inclusion particle size distribution.

Figure 6.
Chemical composition distributions of inclusions in all specimens: (a) Al–Ti–Mg; and (b) Al–Mg–Ti.
Figure 6.
Chemical composition distributions of inclusions in all specimens: (a) Al–Ti–Mg; and (b) Al–Mg–Ti.
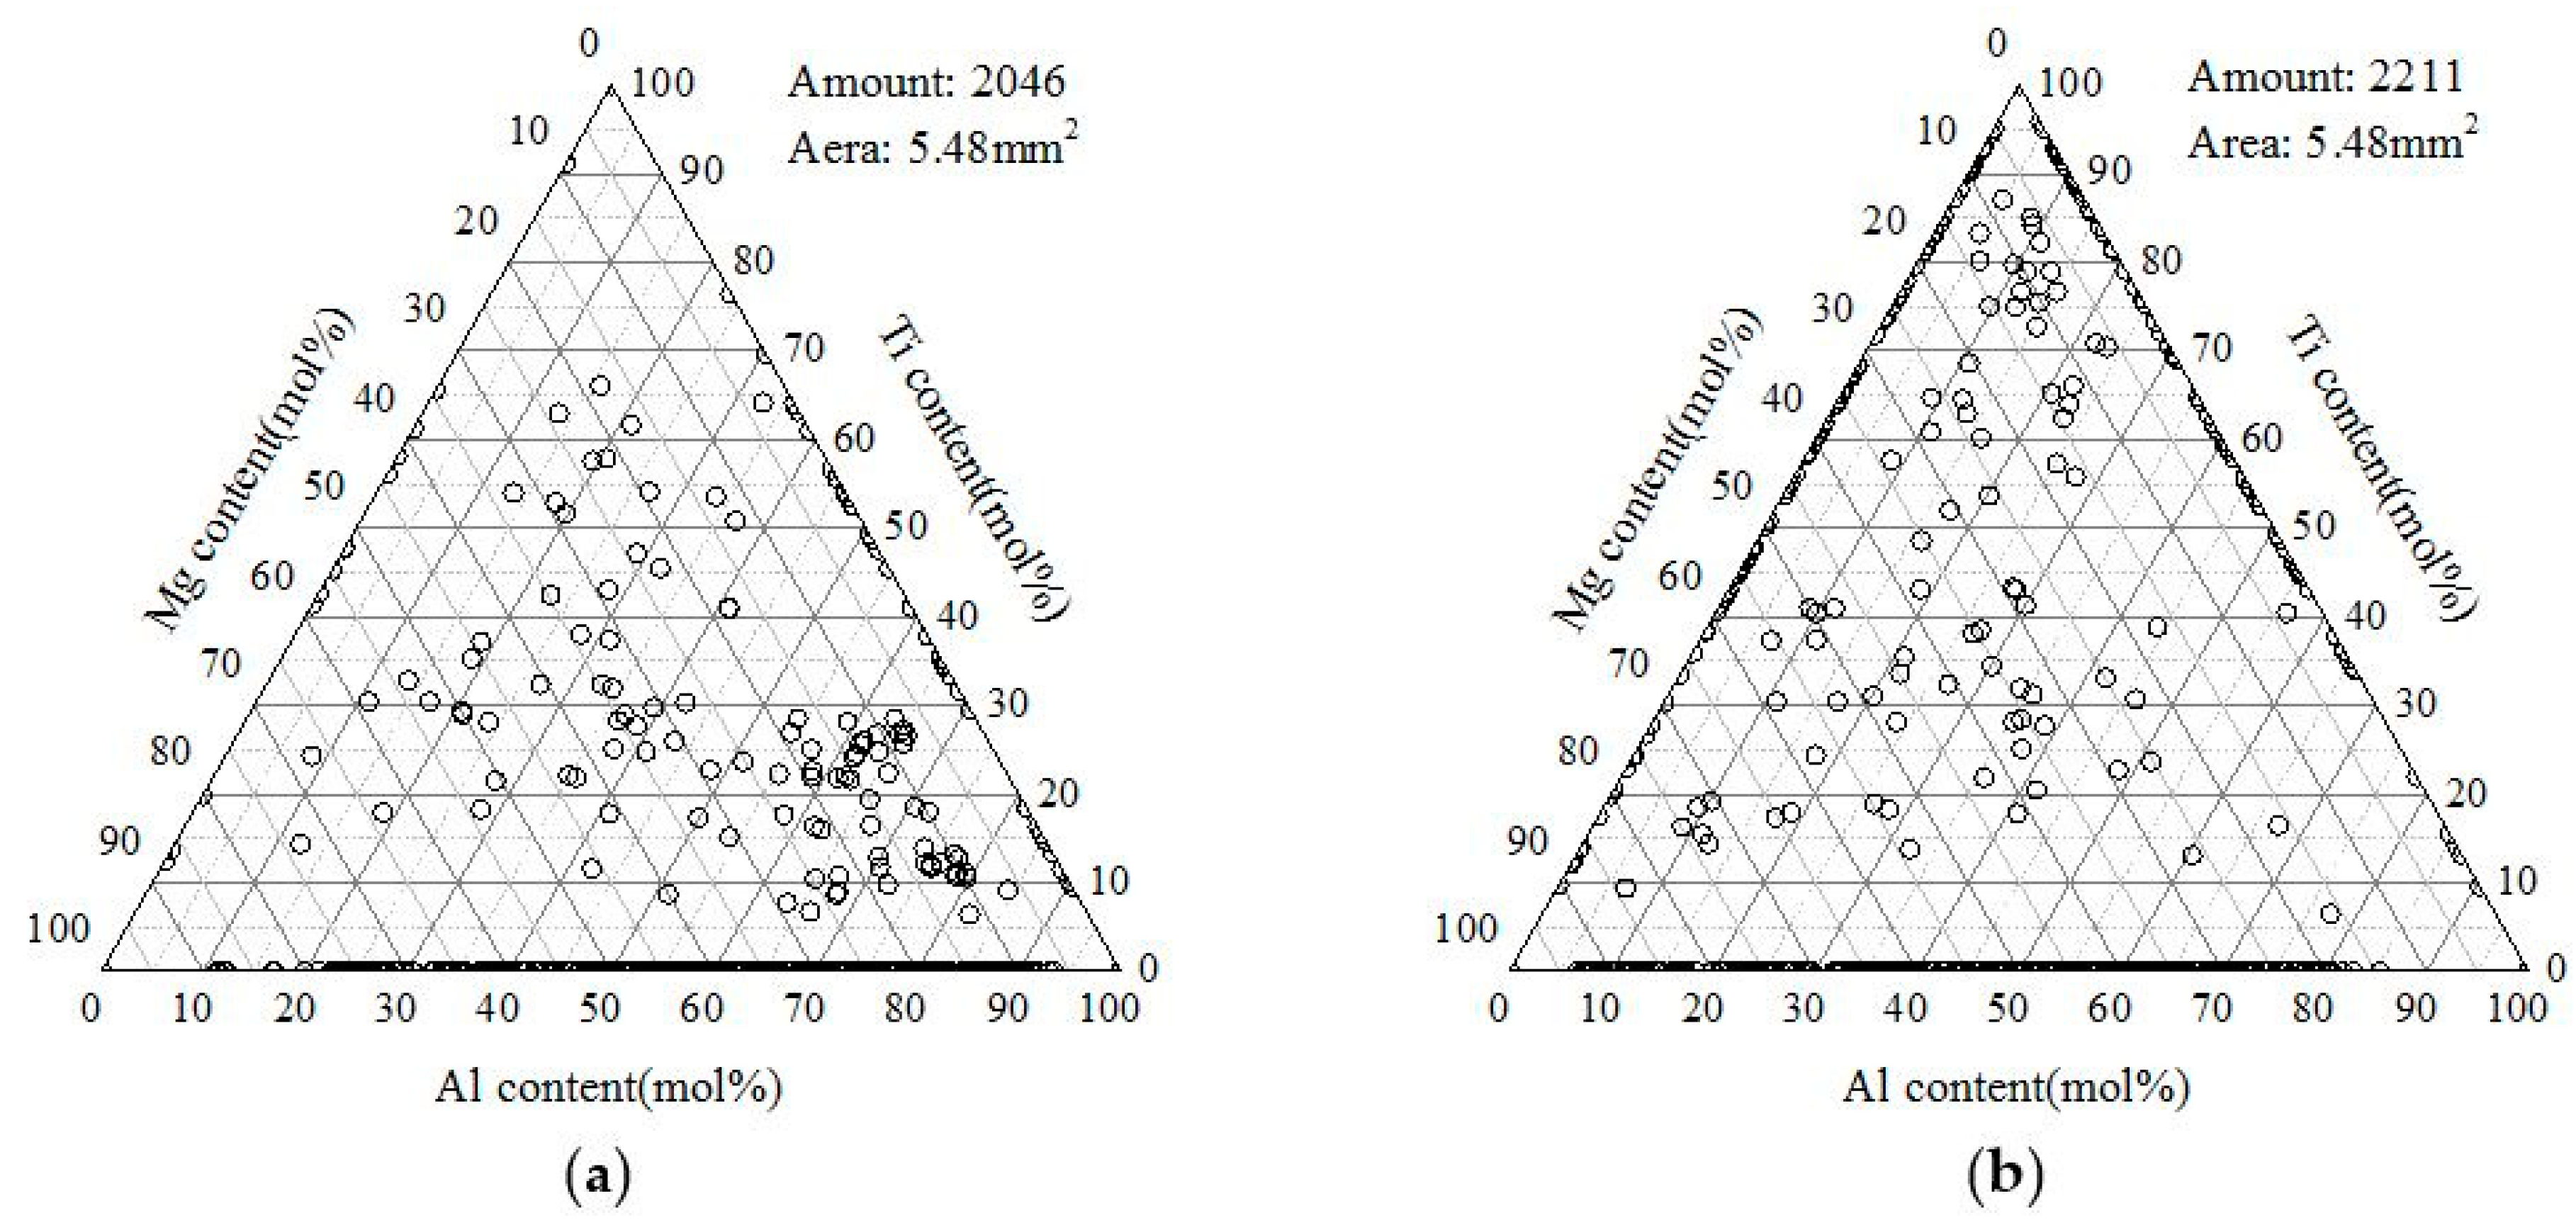
Figure 7.
Optical micrographs of ingot samples with different alloy adding sequences: (a) Al–Ti–Mg; and (b) Al–Mg–Ti.
Figure 7.
Optical micrographs of ingot samples with different alloy adding sequences: (a) Al–Ti–Mg; and (b) Al–Mg–Ti.

Figure 8.
EDS (energy-dispersive spectroscopy) spectra of the typical complex inclusions in testing steel with the Al–Mg–Ti microalloy addition sequence.
Figure 8.
EDS (energy-dispersive spectroscopy) spectra of the typical complex inclusions in testing steel with the Al–Mg–Ti microalloy addition sequence.

Figure 9.
Mapping images of typical inclusions in testing steel with the Al–Mg–Ti microalloy addition sequence.
Figure 9.
Mapping images of typical inclusions in testing steel with the Al–Mg–Ti microalloy addition sequence.
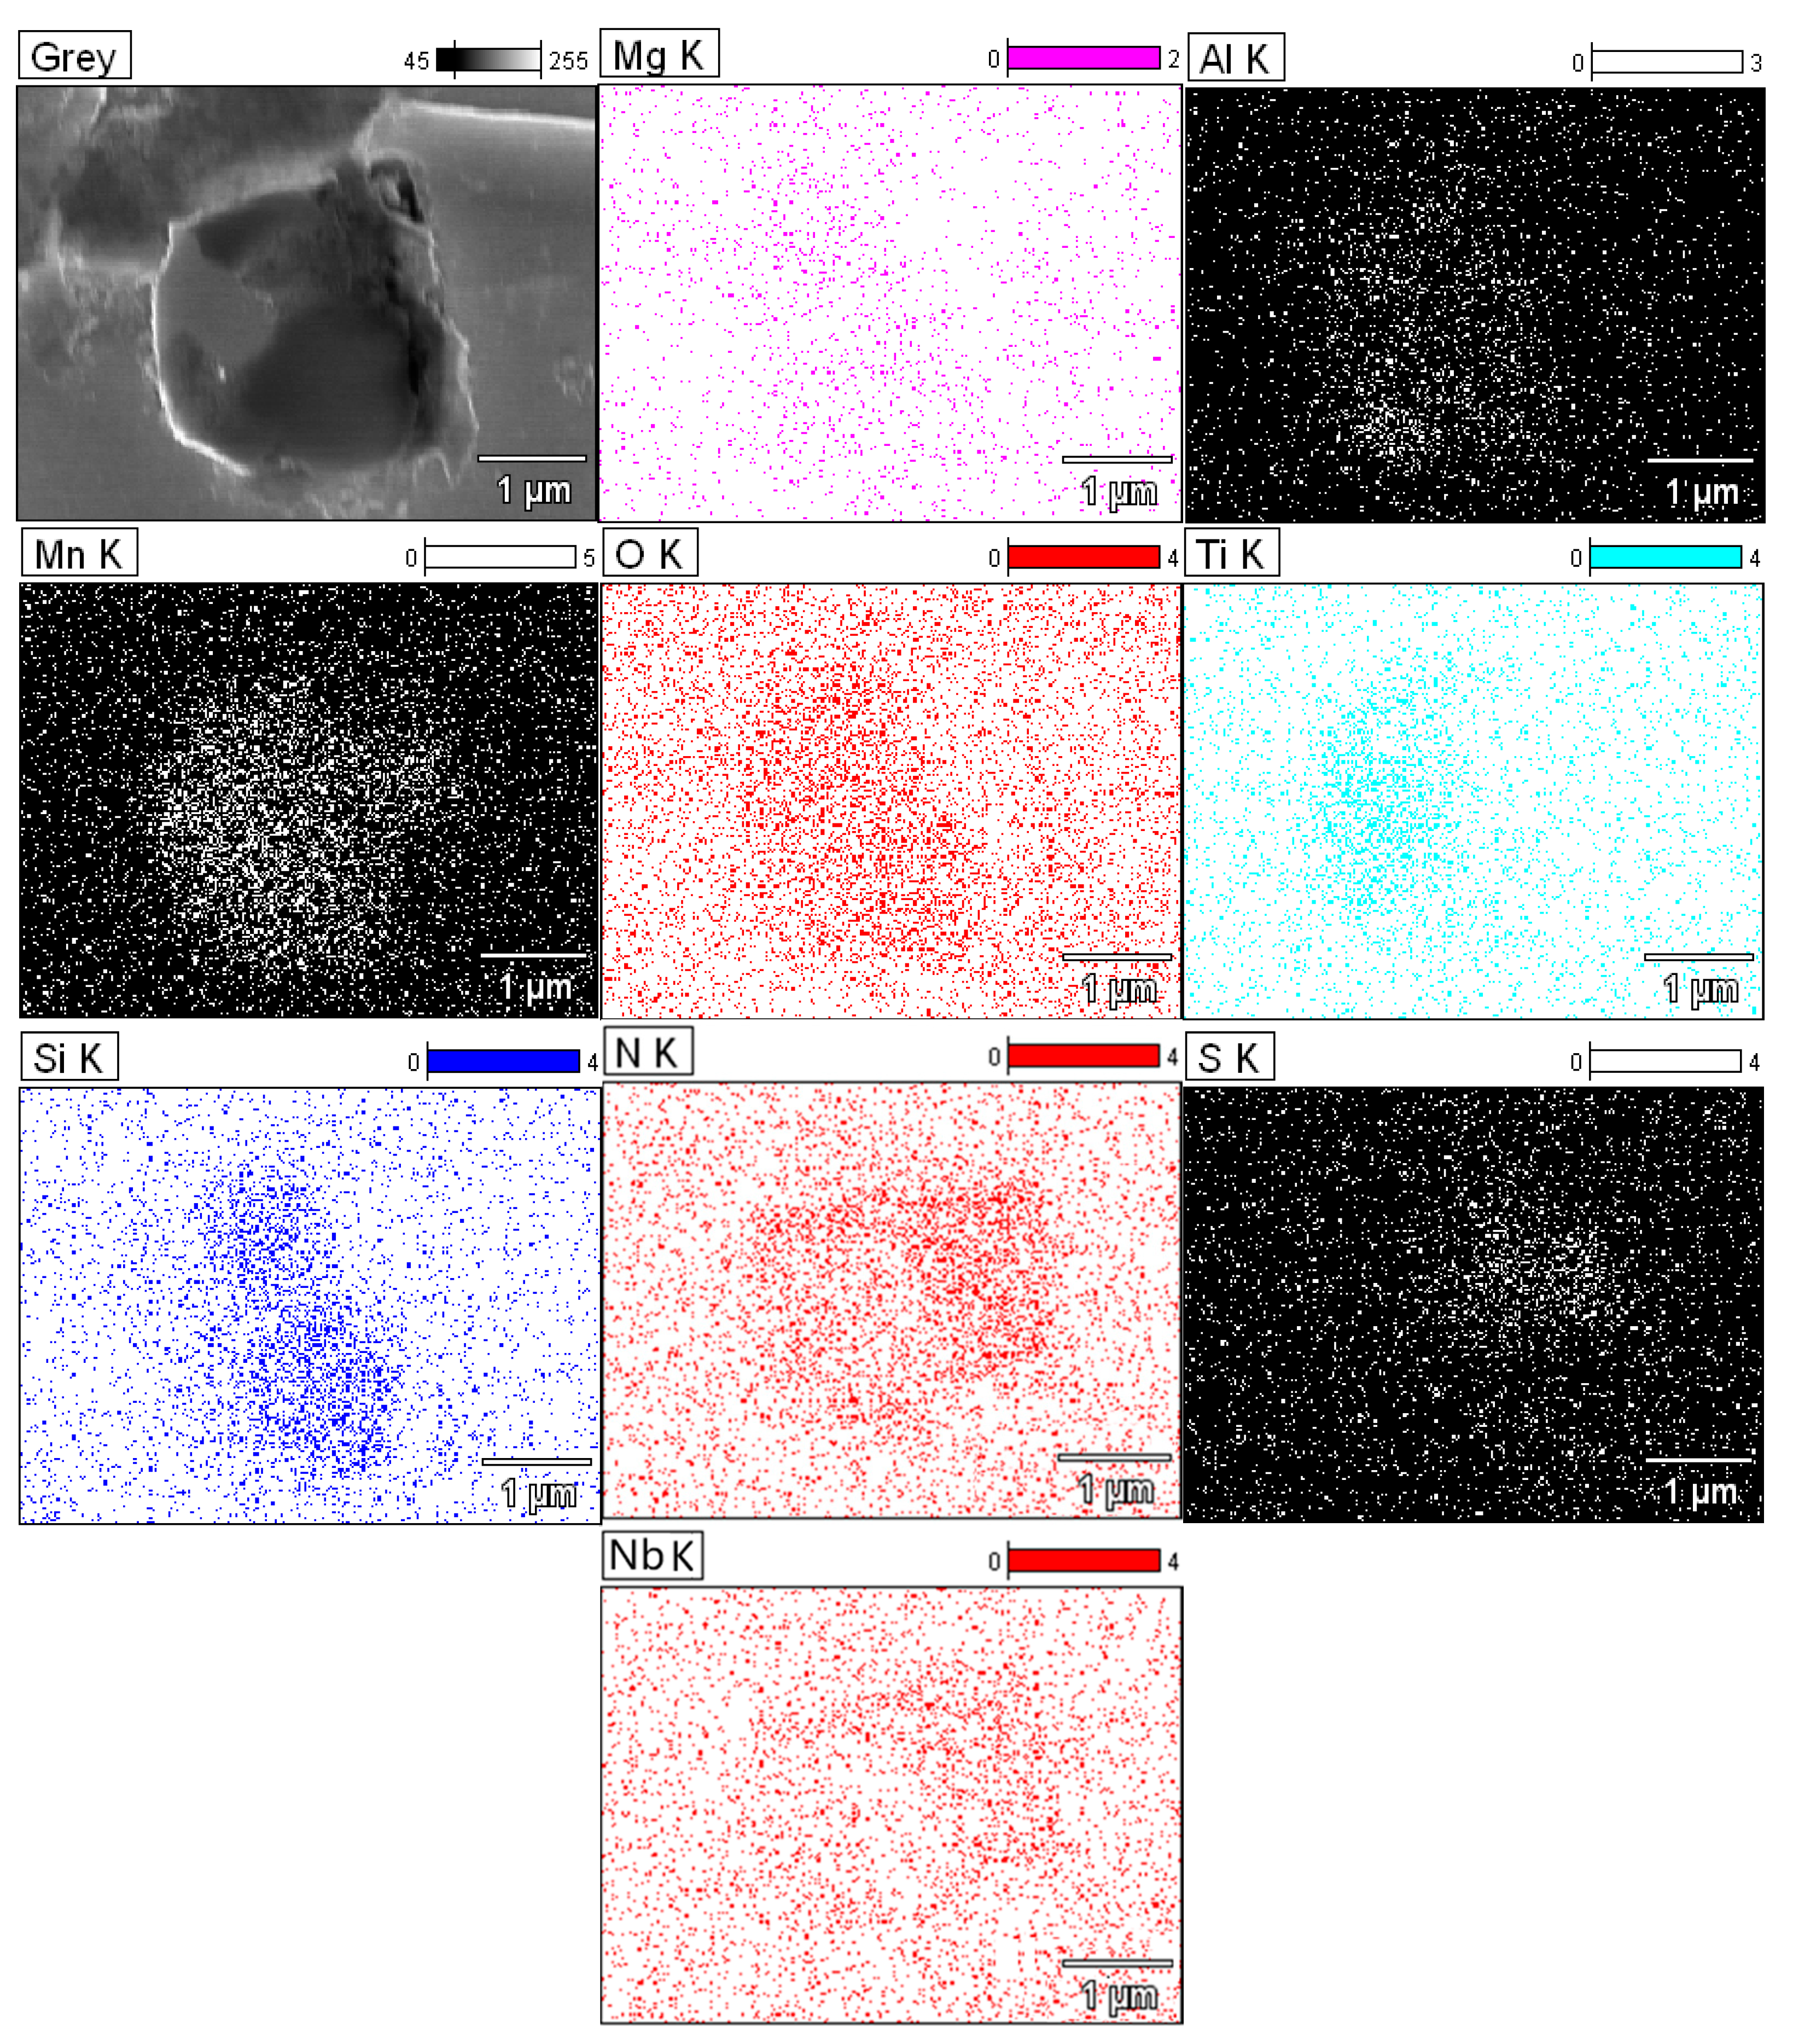
Figure 10.
Optical micrographs of rolling samples with different alloy addition sequences: (a) Al–Ti–Mg; and (b) Al–Mg–Ti.
Figure 10.
Optical micrographs of rolling samples with different alloy addition sequences: (a) Al–Ti–Mg; and (b) Al–Mg–Ti.

Figure 11.
Optical micrographs of the HAZ with different alloy addition sequences: (a) Al–Ti–Mg; and (b) Al–Mg–Ti.
Figure 11.
Optical micrographs of the HAZ with different alloy addition sequences: (a) Al–Ti–Mg; and (b) Al–Mg–Ti.
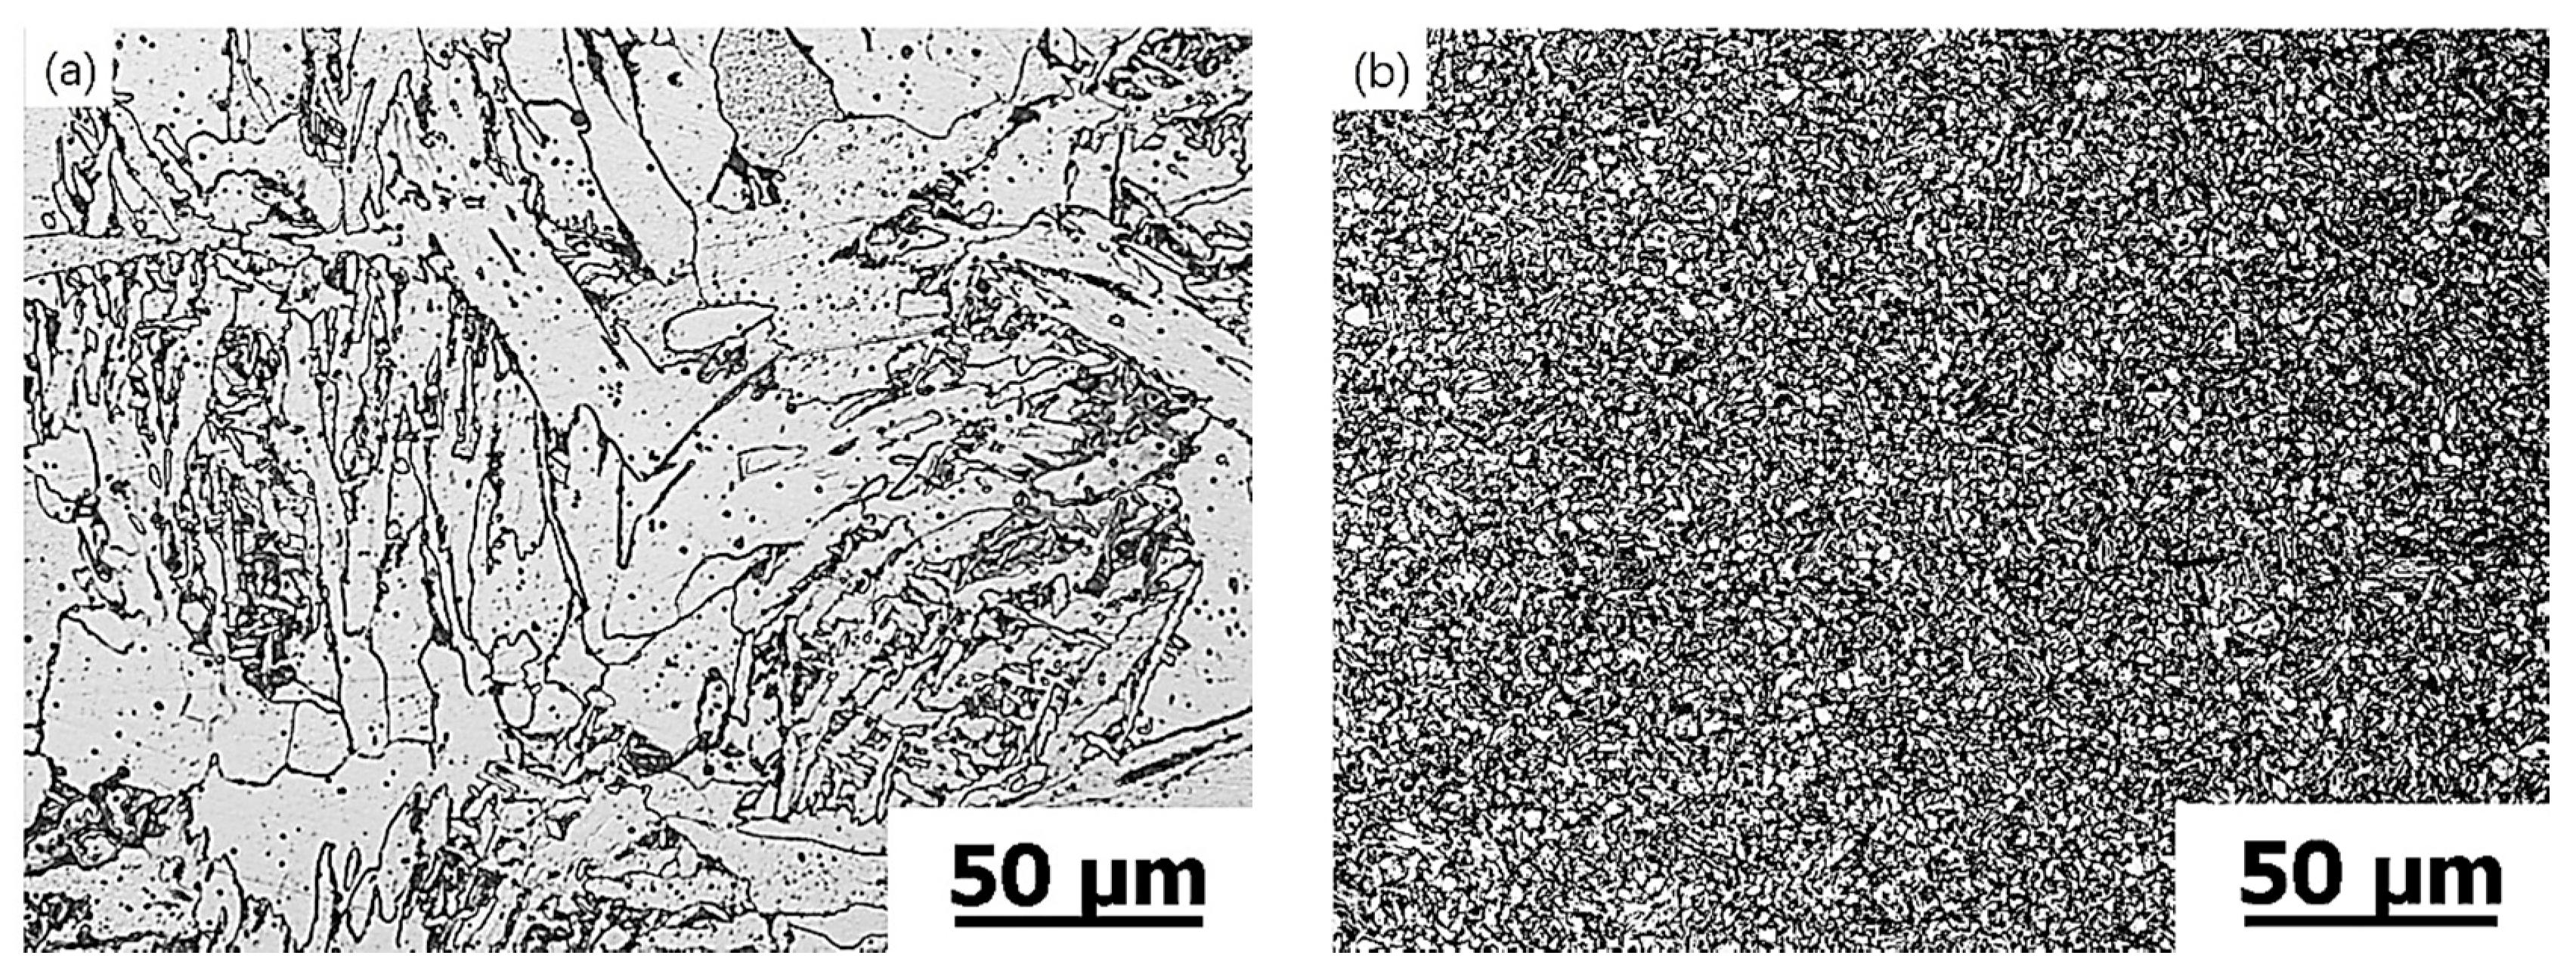
Figure 12.
Ingot microstructure of industrial test steel.

Figure 13.
Forty-millimetre plate microstructure of industrial test steel: (a) rolling state; and (b) HAZ.
Figure 13.
Forty-millimetre plate microstructure of industrial test steel: (a) rolling state; and (b) HAZ.

Figure 14.
Welded joint macrostructure.
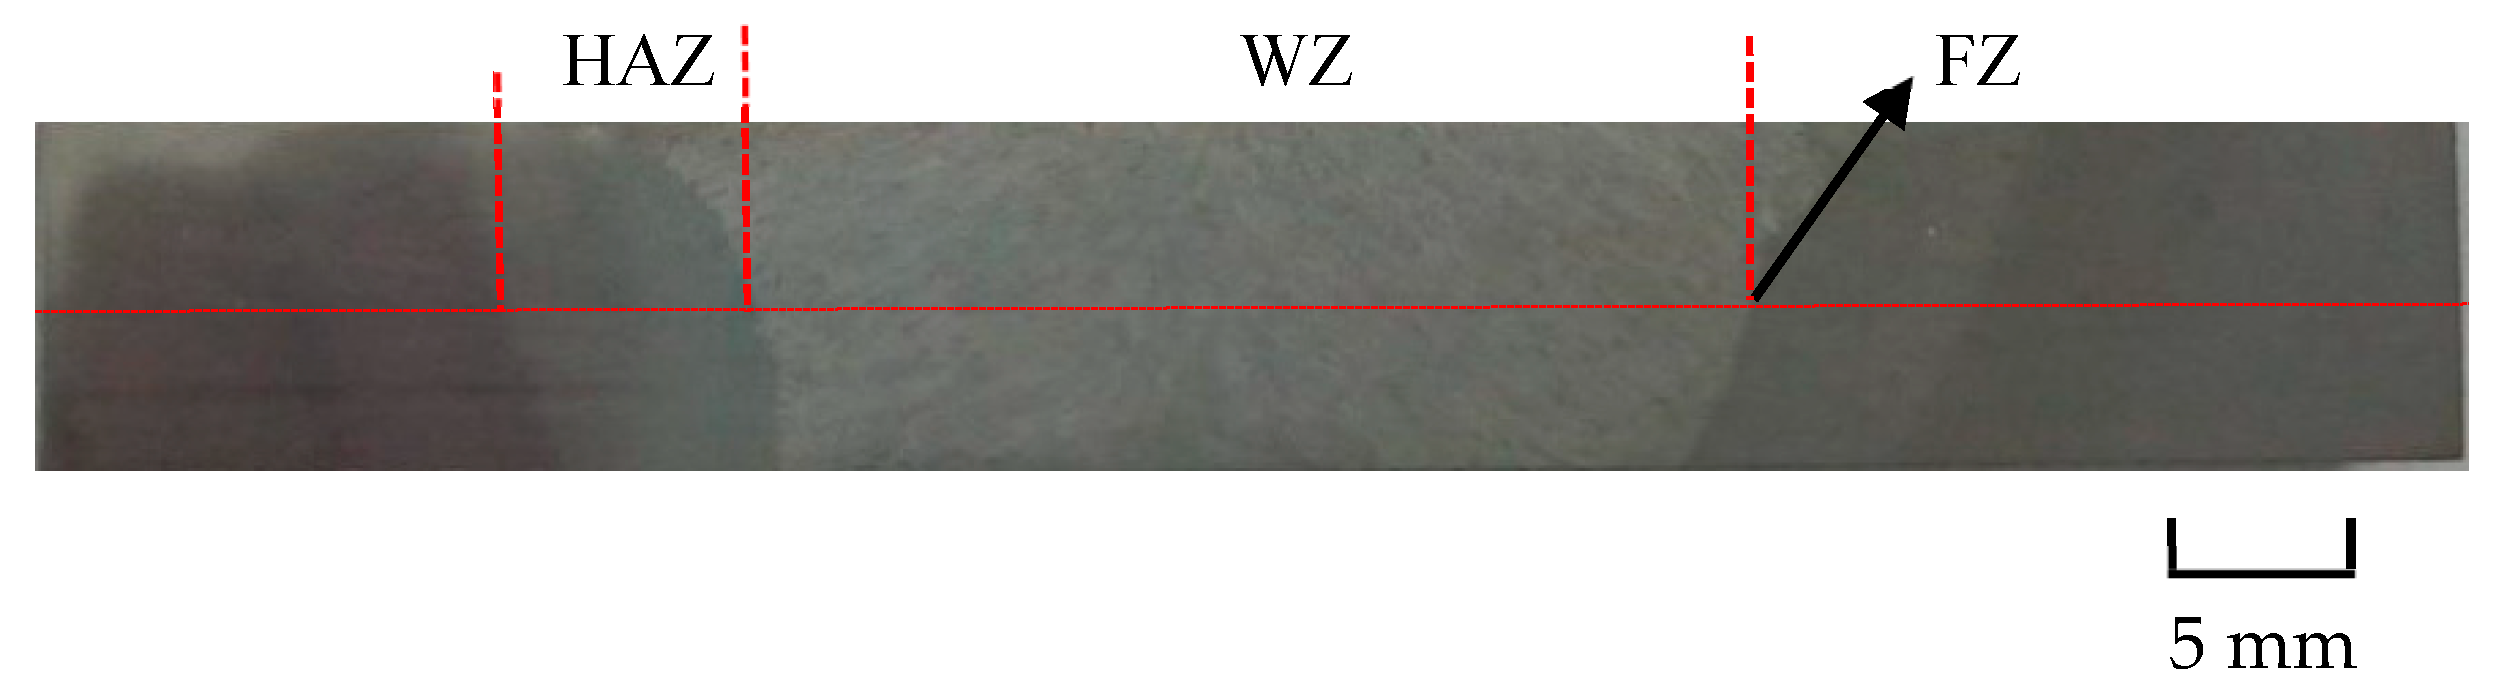
Figure 15.
HAZ microstructure observation: (a) base metal; (b) base metal and HAZ; (c) HAZ and welding zone; (d) welding zone and HAZ.
Figure 15.
HAZ microstructure observation: (a) base metal; (b) base metal and HAZ; (c) HAZ and welding zone; (d) welding zone and HAZ.
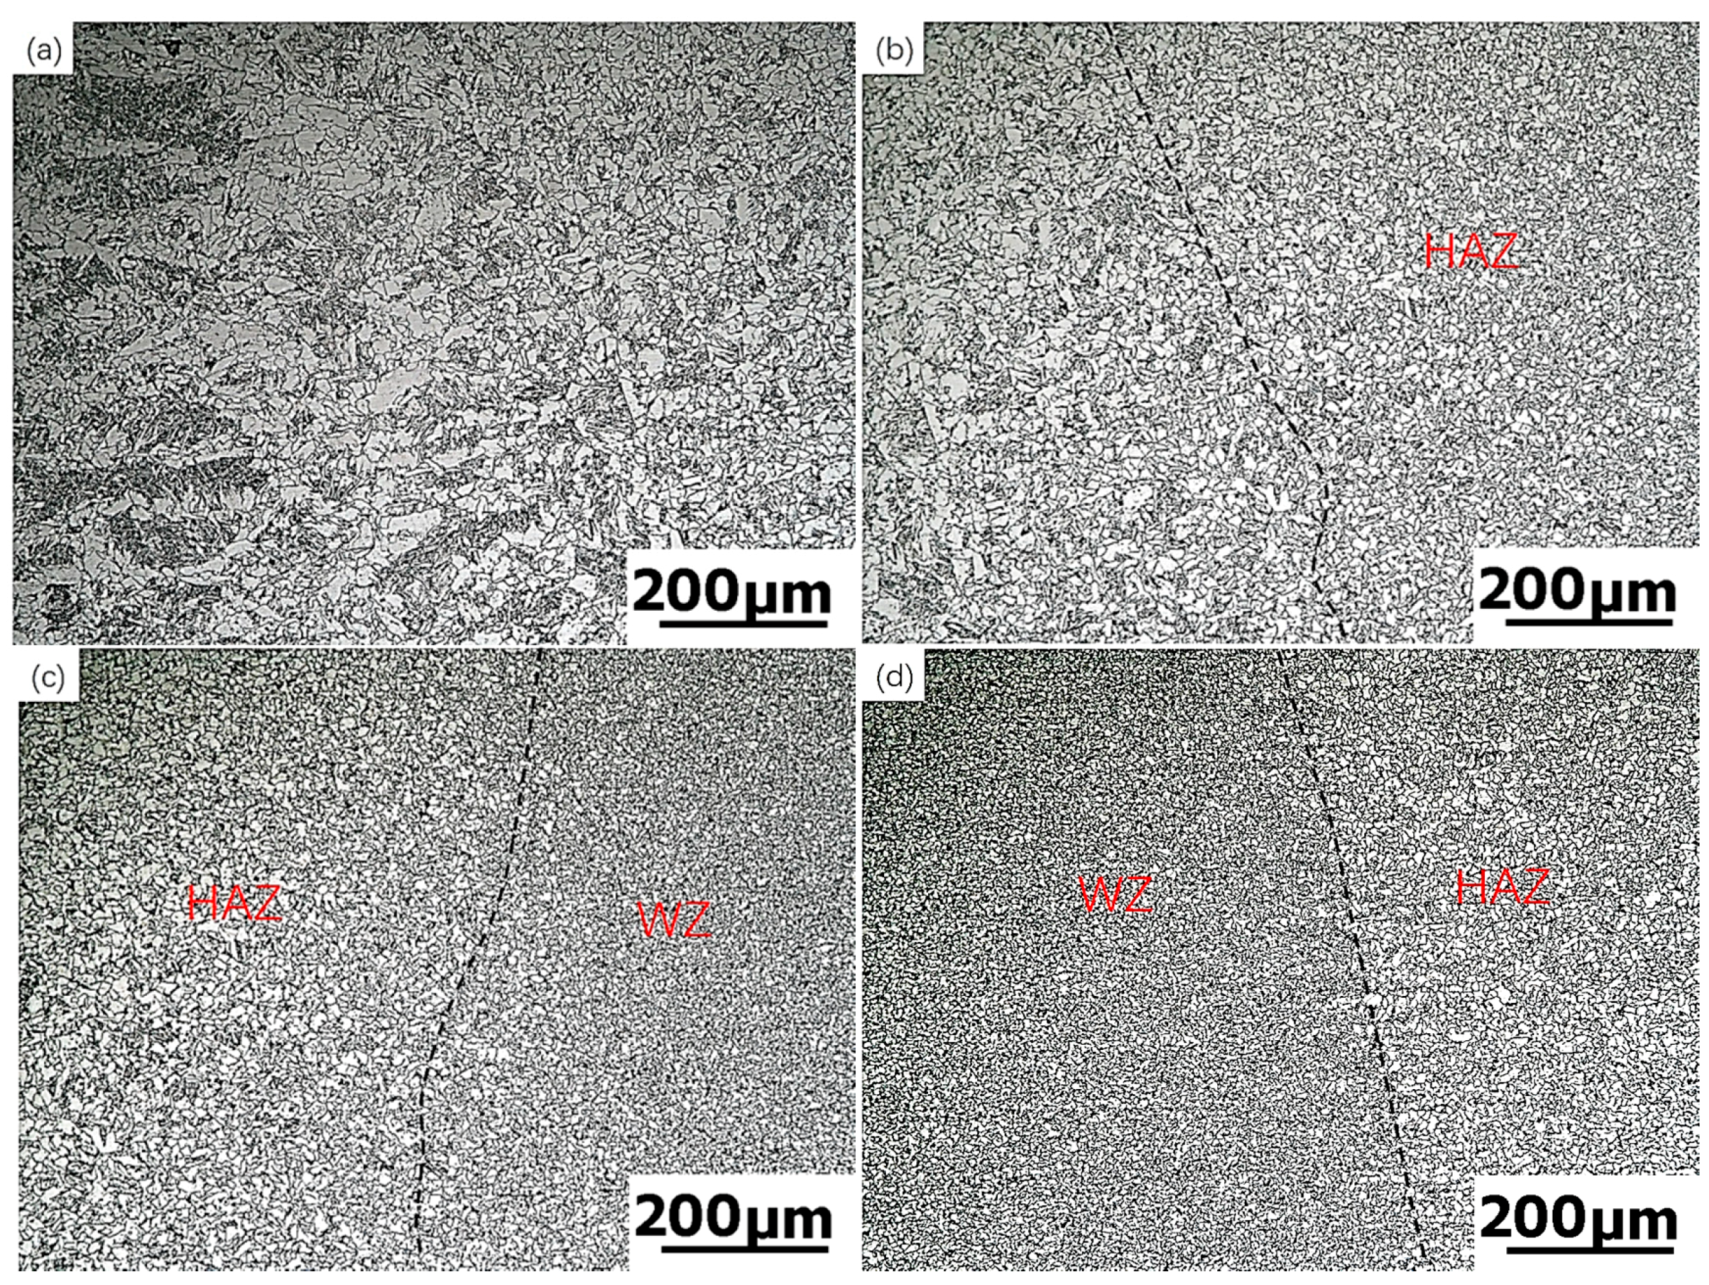
Figure 16.
Austenite grains morphology at different holding times: (a) 300 s; (b) 600 s; and (c) 900 s.
Figure 16.
Austenite grains morphology at different holding times: (a) 300 s; (b) 600 s; and (c) 900 s.
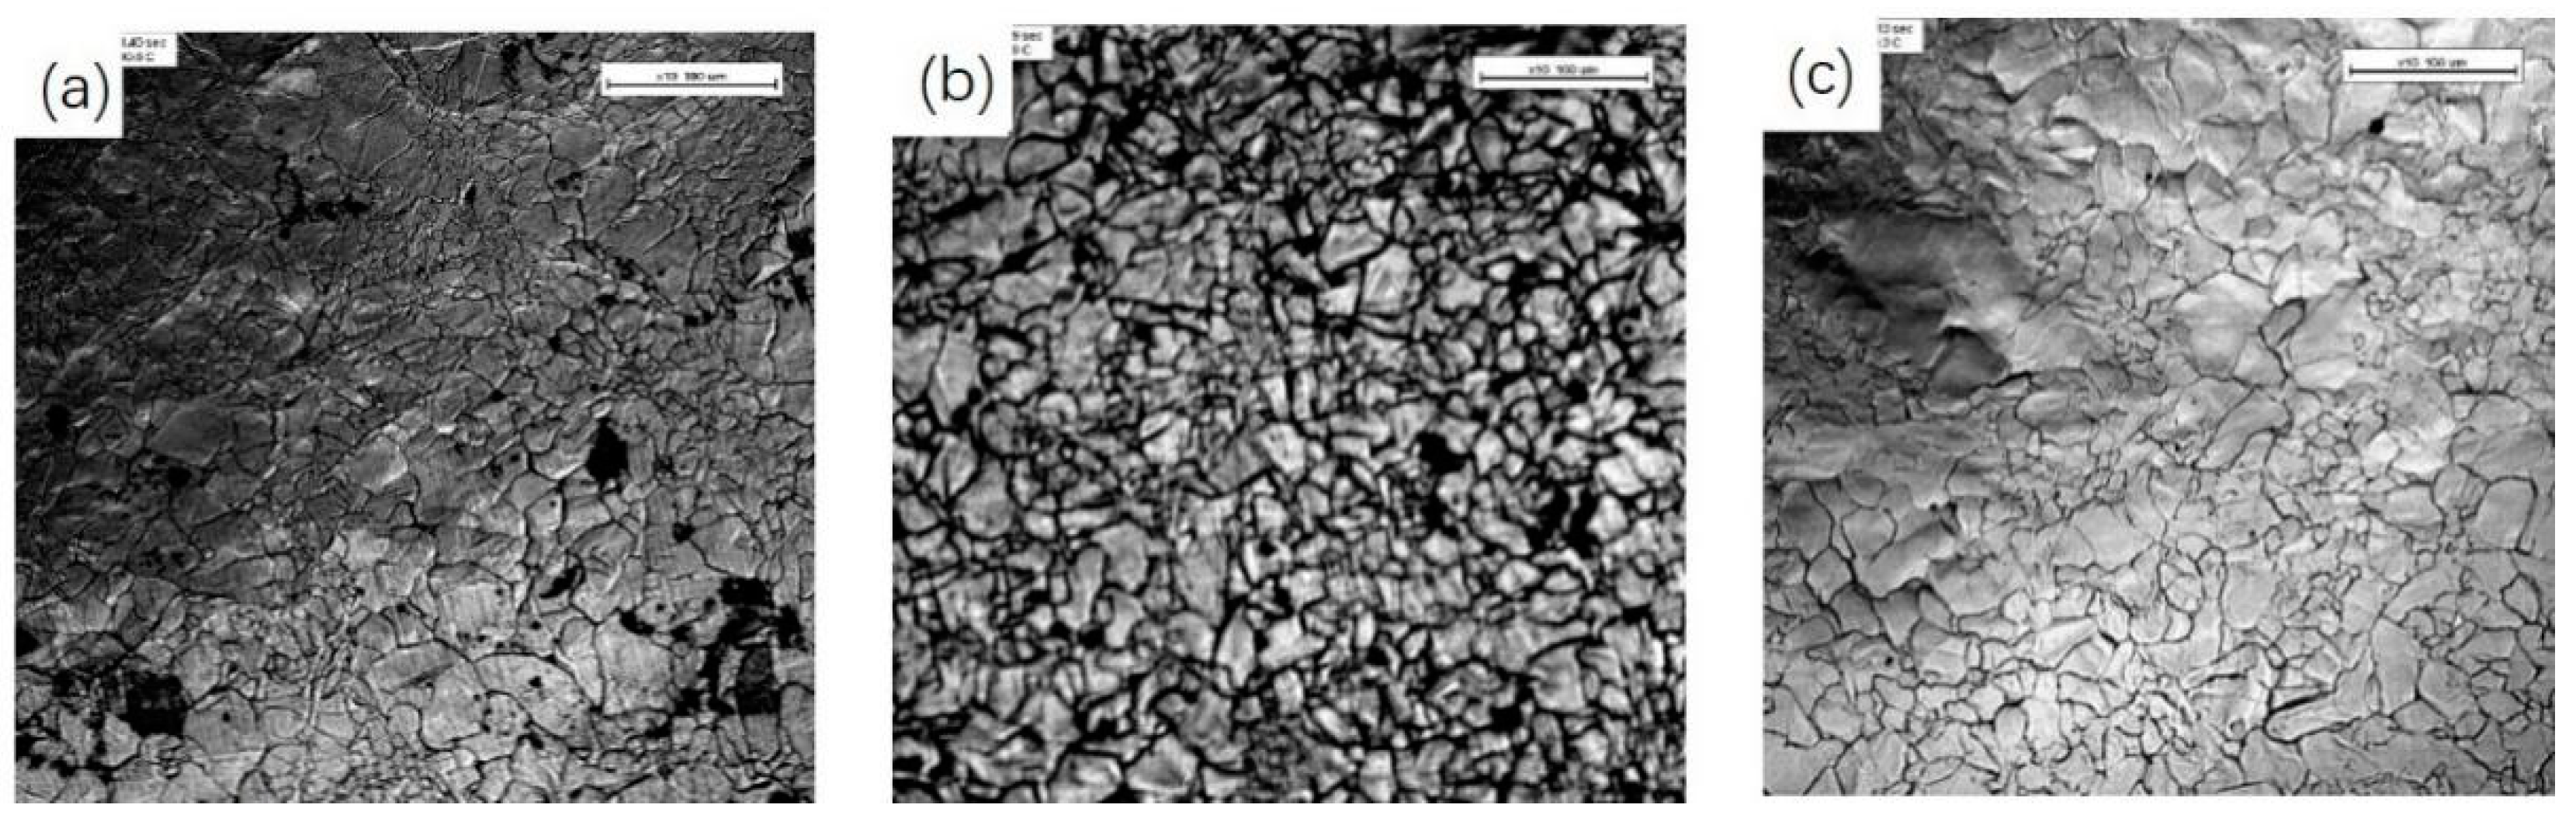
Figure 17.
Observation of intragranular acicular ferrite (IAF) in industrial test steel by confocal laser scanning microscopy (CLSM): (a) IAF at boundaries; (b) IAF in austenite.
Figure 17.
Observation of intragranular acicular ferrite (IAF) in industrial test steel by confocal laser scanning microscopy (CLSM): (a) IAF at boundaries; (b) IAF in austenite.


Table 1.
The composition of test steel (wt %).
| Composition | C | Mn | S | P | Si | Al | Ti | Mo | Mg | V | Nb | Ca |
|---|---|---|---|---|---|---|---|---|---|---|---|---|
| Steel 1 | 0.07 | 1.43 | 0.004 | 0.016 | 0.19 | 0.01 | 0.019 | - | 0.005 | - | - | - |
| Steel 2 | 0.07 | 1.44 | 0.004 | 0.023 | 0.20 | 0.01 | 0.019 | 0.07 | 0.006 | - | - | |
| Steel 3 | 0.07 | 1.44 | 0.004 | 0.016 | 0.20 | 0.01 | 0.019 | 0.07 | 0.005 | 0.040 | - | - |
| Steel 4 | 0.07 | 1.46 | 0.004 | 0.026 | 0.20 | 0.01 | 0.020 | 0.07 | 0.006 | - | 0.040 | - |
| Steel GY | 0.08 | 1.63 | 0.004 | 0.01 | 0.25 | 0.03 | 0.018 | 0.07 | 0.004 | - | 0.039 | 0.002 |
Table 2.
The low-temperature impact of test steel (J).
| Test steel | The Low-Temperature Impact | ||
|---|---|---|---|
| Value (J) | Average (J) | Deviations | |
| Without Mo | 9.8 | 10.3 | 0.455 |
| 10.9 | |||
| 10.2 | |||
| With Mo | 79 | 74 | 12.356 |
| 86 | |||
| 57 | |||
| With V | 19 | 22 | 2.449 |
| 25 | |||
| 22 | |||
| With Nb | 81.2 | 83.6 | 4.877 |
| 90.4 | |||
| 79.2 | |||
| With Al–Ti–Mg | 10.2 | 8.9 | 1.435 |
| 6.9 | |||
| 9.6 | |||
| With Al–Mg–Ti | 74.9 | 75.6 | 3.910 |
| 80.7 | |||
| 71.2 | |||
Table 3.
The average grain size in HAZ and original austenite.
| Location | The Average Size | ||
|---|---|---|---|
| Value (μm) | Average (μm) | Deviations | |
| HAZ | 6.8 | 7.3 | 0.356 |
| 7.5 | |||
| 7.6 | |||
| Original austenite | 45.06 | 43.07 | 1.408 |
| 42.13 | |||
| 42.02 | |||
© 2018 by the authors. Licensee MDPI, Basel, Switzerland. This article is an open access article distributed under the terms and conditions of the Creative Commons Attribution (CC BY) license (http://creativecommons.org/licenses/by/4.0/).
Share and Cite
MDPI and ACS Style
Wang, Y.; Zhu, L.; Zhang, Q.; Zhang, C.; Wang, S. Effect of Mg Treatment on Refining the Microstructure and Improving the Toughness of the Heat-Affected Zone in Shipbuilding Steel. Metals 2018, 8, 616. https://doi.org/10.3390/met8080616
AMA Style
Wang Y, Zhu L, Zhang Q, Zhang C, Wang S. Effect of Mg Treatment on Refining the Microstructure and Improving the Toughness of the Heat-Affected Zone in Shipbuilding Steel. Metals. 2018; 8(8):616. https://doi.org/10.3390/met8080616
Chicago/Turabian StyleWang, Yan, Liguang Zhu, Qingjun Zhang, Caijun Zhang, and Shuoming Wang. 2018. "Effect of Mg Treatment on Refining the Microstructure and Improving the Toughness of the Heat-Affected Zone in Shipbuilding Steel" Metals 8, no. 8: 616. https://doi.org/10.3390/met8080616
Note that from the first issue of 2016, this journal uses article numbers instead of page numbers. See further details here.