Creep-Ductility of High Temperature Steels: A Review


1
Inspire Centre for Mechanical Integrity, 8600 Dübendorf, Switzerland
2
Empa: Swiss Federal Laboratories for Materials Science & Technology, 8600 Dübendorf, Switzerland
Metals 2019, 9(3), 342; https://doi.org/10.3390/met9030342
Submission received: 27 February 2019
/
Accepted: 14 March 2019
/
Published: 18 March 2019
(This article belongs to the Special Issue Creep and High Temperature Deformation of Metals and Alloys)
Abstract
:A number of measures of the creep-ductility of high temperature steels are reviewed with an ultimate focus on intrinsic creep-ductility. It is assumed that there will be a future requirement for the determination of long duration creep ductility values for design and product standards in the same way as there is currently for creep strength values. The determination of such information will require specialist modelling techniques to be applied to the complex nature of multi-temperature, multi-heat (multi-cast) data collations, and possible solutions are considered. In service, the exhaustion of creep-ductility is most likely to occur at stress concentrations, and for this, a knowledge of the multiaxial creep-ductility is required, and its relationship to uniaxial creep-ductility. Some practical applications requiring a knowledge of creep-ductility are reviewed.
1. Introduction
The following review concerns the creep ductility of high temperature steels. At elevated temperatures, metallic structures deform with time under load. Ultimately, the accumulation of such plastic deformation leads to fracture by a creep-rupture mechanism (Figure 1). A list of the symbols and terminology adopted in this paper is given in the Nomenclature section.
Creep strain is typically accumulated in three stages. During the primary creep stage, creep rates decrease with time due to strain hardening until a minimum (, or steady secondary) creep rate is achieved [1,2]. During the secondary creep stage, there is a balance between strain hardening and thermal softening (dynamic recovery) [3,4], and the creep rate remains approximately constant (). During the tertiary stage, creep rates increase due to thermal softening (microstructural change), damage accumulation, and/or associated net section reduction, until rupture occurs [5]. Creep curve profiles during the three stages are determined by the respective magnitudes of temperature and stress, and can be strongly influenced by relatively small differences in chemical composition, e.g., Reference [6].
Above Tc, dislocations can more readily cross-slip and climb, the latter being a diffusion controlled mechanism. With increasing temperature, more slip systems become operative, resulting in easier cross-slip and climb responsible for dislocation rearrangement into sub-boundaries by polygonisation. Damage accumulation during tertiary creep may be a consequence of plastic hole growth [7], diffusion controlled cavity growth [8,9], or constrained cavity growth [10], as the magnitude of stress decreases. In general, creep ductility is determined by the superposition of strains accumulated due to void nucleation and growth [11].
Traditionally, creep ductility is defined in terms of rupture elongation, Au (Equation (1a)) or reduction of area at rupture, Zu (Equation (1b)) [12].
In practice, rupture elongation and reduction of area at rupture are the most widely reported creep ductility parameters, although their magnitudes are known to be dependent on specimen geometry. In such circumstances, like-with-like comparisons should only strictly be made when Au and Zu are determined using proportional specimens with specific dimensional configurations, i.e., in terms of Lr,o = k√So, where k is usually ≥5 (often 5.65) for stress-rupture specimens and ideally ~11 for high precision creep strain specimens [12,13].
It is important to recognize that constant load tests of the type depicted in Figure 1 may actually be conducted with or without strain measurement (i.e., respectively in creep-rupture or stress-rupture tests). As a generality (and in particular for lower cost medium-to-long duration power generation industry material characterization in the mid-to-late 1900s), stress-rupture tests were mainly conducted without strain measurement to only give tu (σo), Au and Zu. There was therefore no intermediate strain (or strain rate) data for the majority of creep tests performed for industry in this era (e.g., Reference [14]). For low alloy ferritic and higher alloy martensitic steels, for which the instantaneous plastic strain on loading (εo) is negligible in creep tests typically conducted for engineering assessments, Au and creep strain at rupture (εcu) are identical. This is not necessarily the case for austenitic steels in higher load tests at lower temperatures for which the accumulated instantaneous plastic strain on loading can be significant, and Au comprises both εo and εcu.
Of the two most common direct measures of creep ductility, Zu is often the preferred quantity because its magnitude is considered to be less dependent on specimen geometry (k), although this may be more related to the method of determination being more repeatable and reproducible. Zu may be alternatively expressed as a local strain to rupture in the region of necking, i.e.,
With all their limitations Au and Zu are the most widely reported (and sometimes the only available) measures of creep ductility in large international data collations (e.g., Reference [14]), and therefore cannot be ignored.
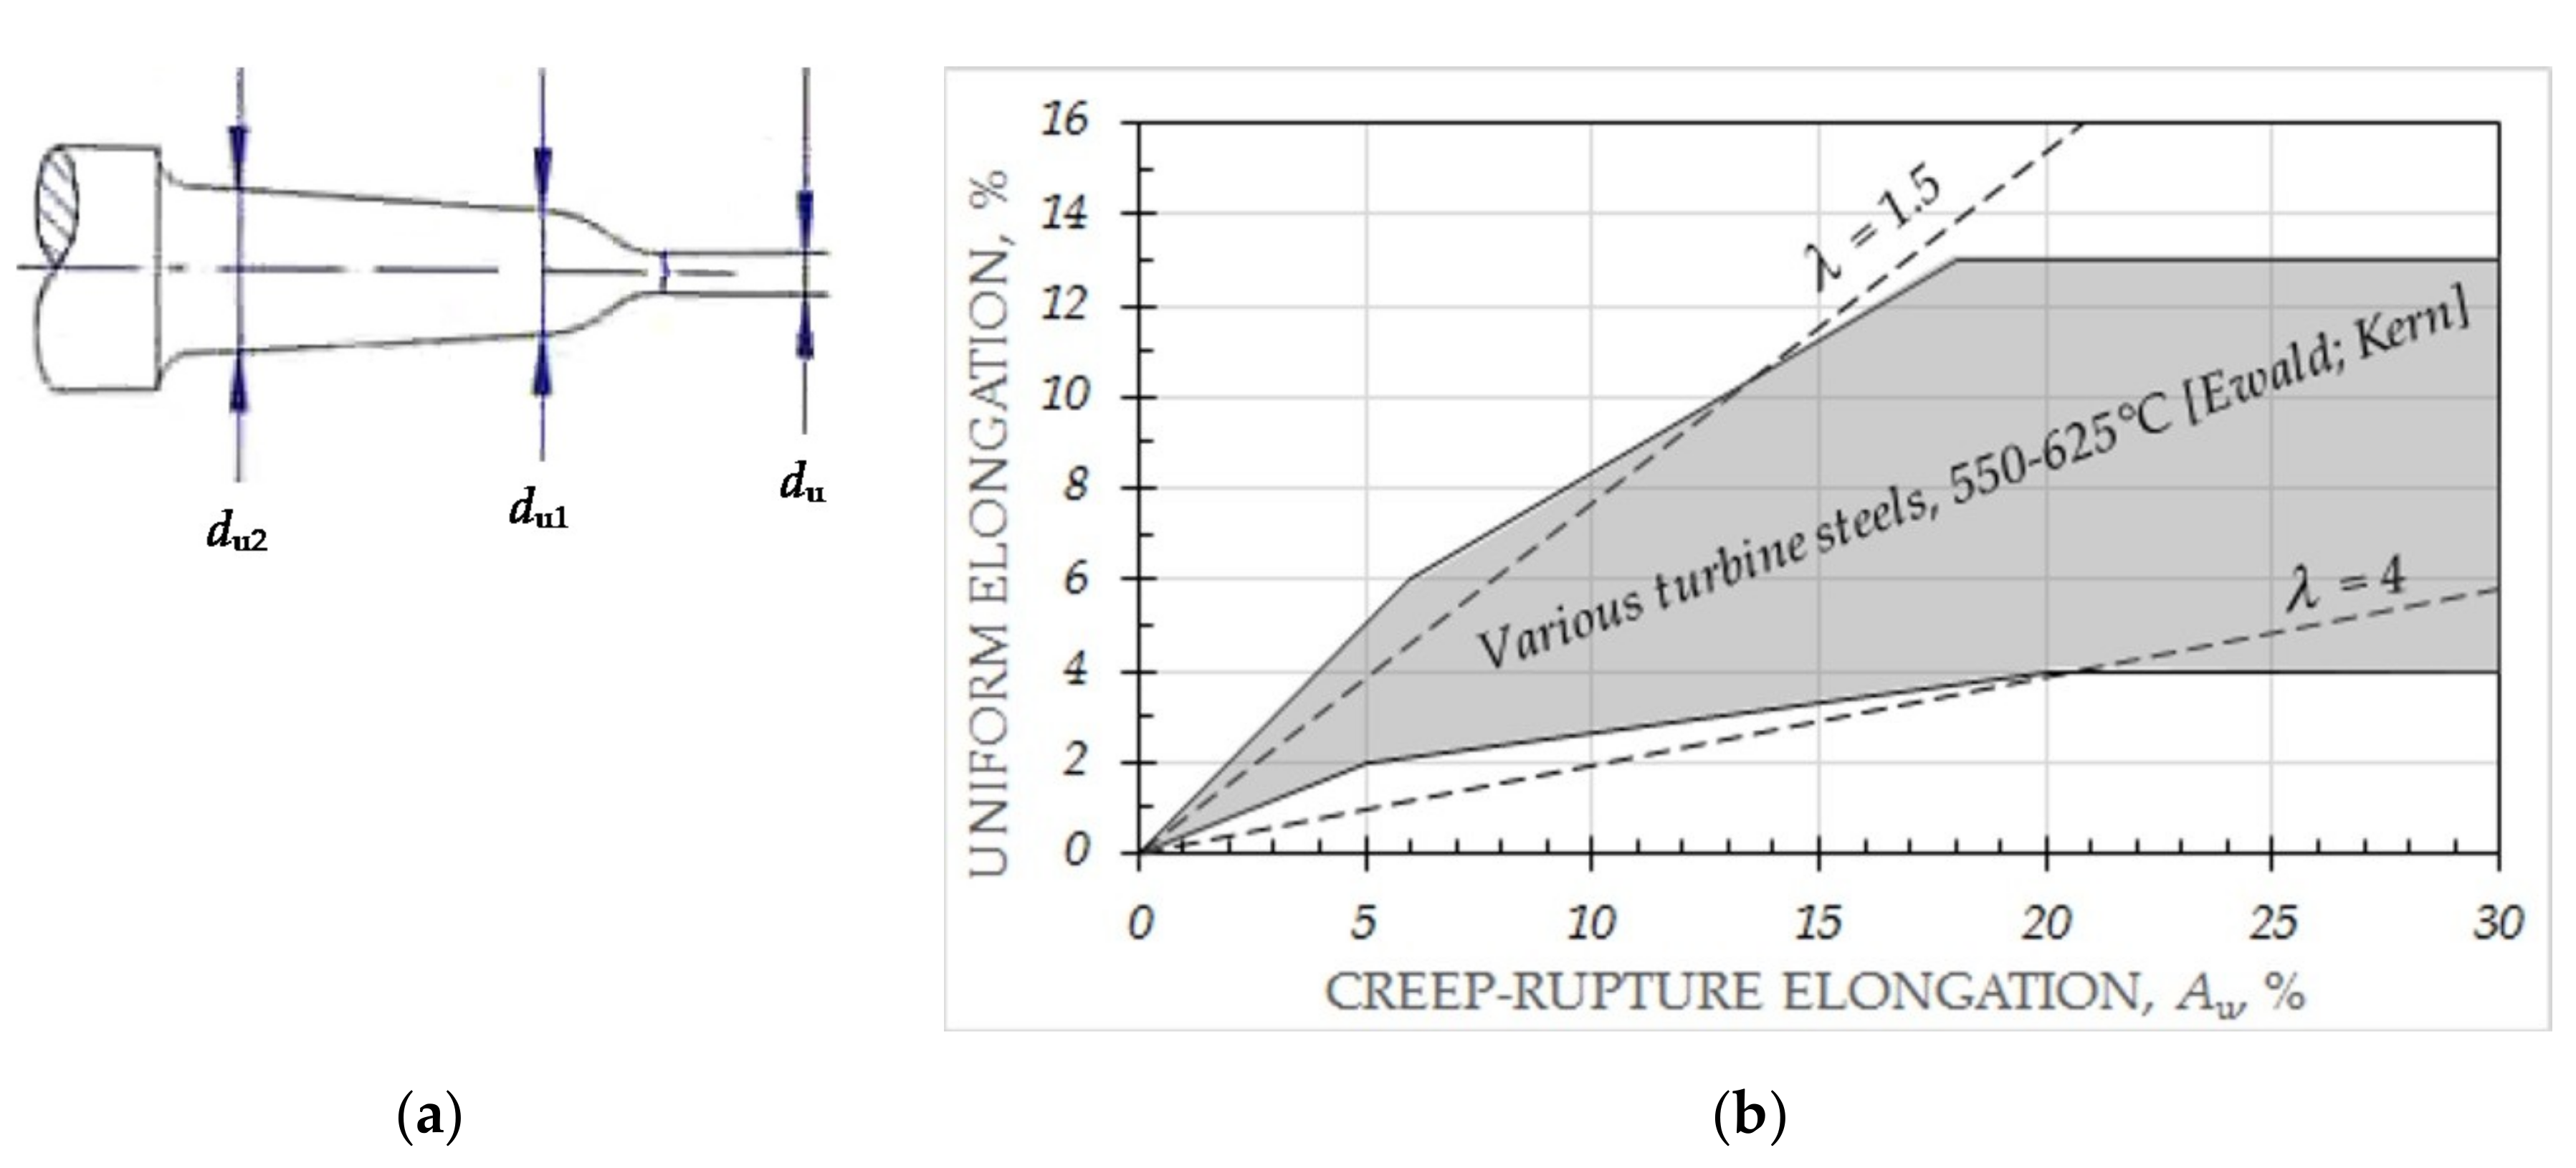
Increasingly, there is a tendency to determine the uniform elongation at rupture, εcu,u, as a means of eliminating the geometry dependent component of creep ductility associated with necking (e.g., Reference [15]), Equation (3), with the meaning of the symbols shown in Figure 2a.
The evidence for a number of engineering steels indicates that the magnitude of Au,u is comparable with Au for Au ≤ ~5%, and approximately constant at Au,u ≥ ~10% for Au ≥ ~20% [15], Figure 2b.
Other creep ductility concepts are introduced later in the paper, most notably intrinsic creep ductility. The intrinsic ductility, ε′cu, in Figure 1, is regarded by many (e.g., References [16,17]) as being the most practical indicator of creep ductility.
In the following text, the uniform elongation at rupture (Au,u) is assumed to provide a reasonable approximation of the intrinsic creep ductility (ε′cu, assuming insignificant instantaneous plastic strain on loading). This is the basis for the λ line constructions in Figure 2b (i.e., λ ~ Au/Au,u ~ εcu/εcu,u).
Values of creep ductility are increasingly being used to form the basis of high temperature component long time creep strain limits, in particular those with stress concentrating features, the interest being in service duty involving both steady and cyclic loading. As will be seen, there is a requirement for multi-temperature creep ductility models for a given alloy based on observations for a number of heats (or casts), and typically from a number of sources) [18]. While there are models becoming available for this purpose, their implementation is complicated by the inherent variability in the source experimental observations and heat (or cast) sensitive variations in underlying mechanism changes after long times.
2. Creep Ductility
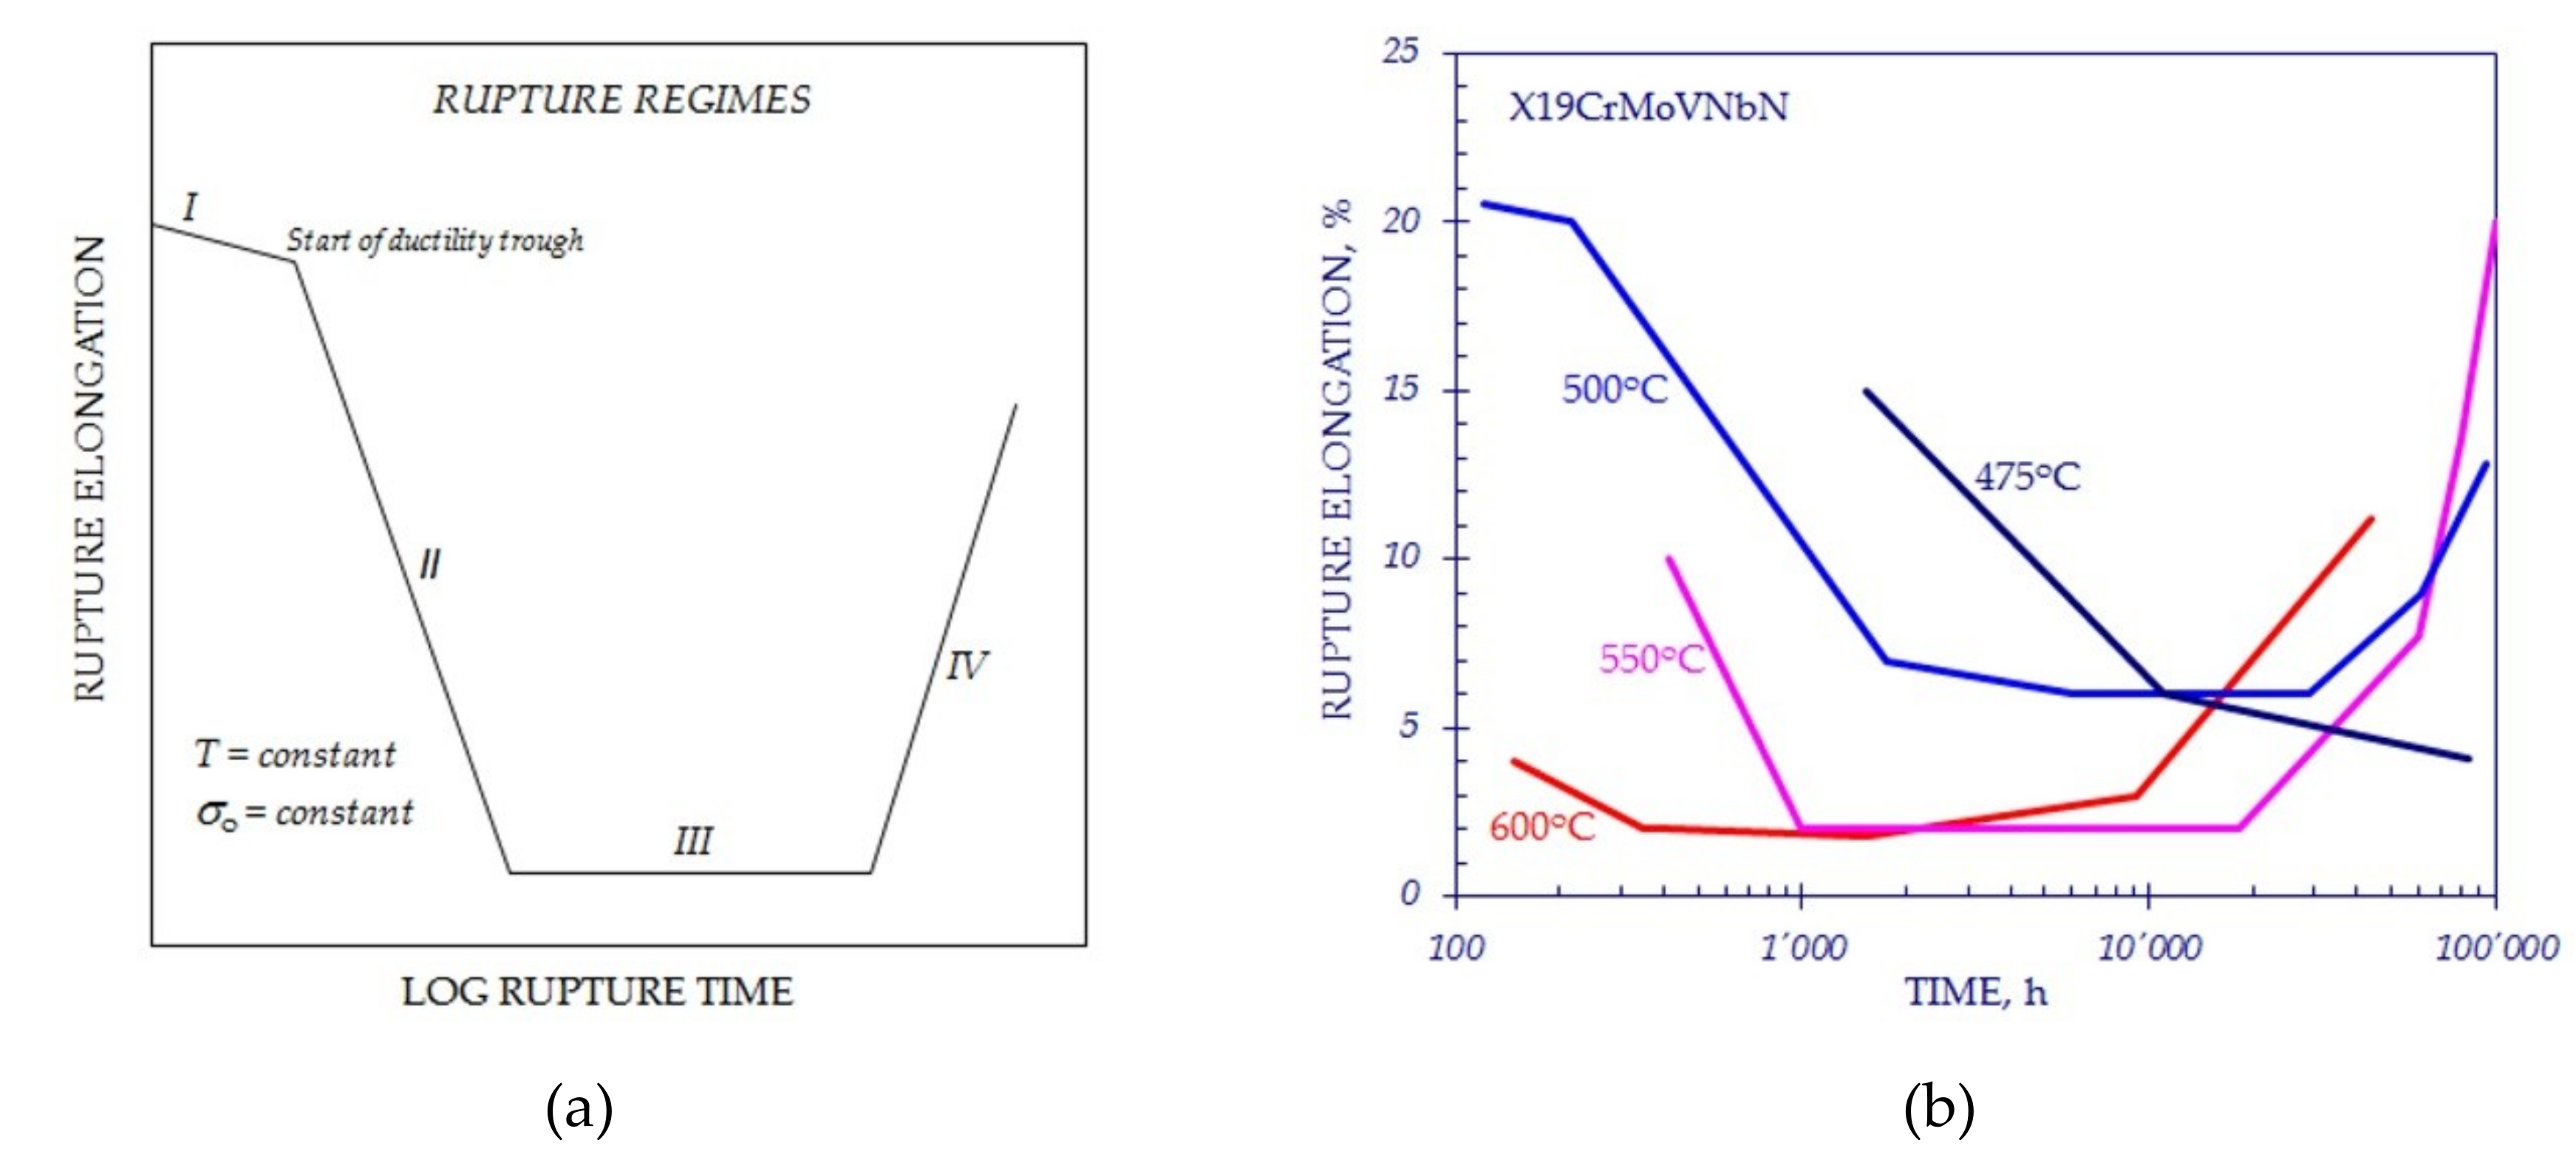
For many high temperature steels, the variation of creep ductility with time and temperature can be complex, due in part to associated mechanism changes (e.g., Figure 3a). For example, for ferritic steels at a constant temperature above Tc, four creep regimes can be exhibited. In Regime-I (at high stresses), ductility is high, with ductile-transgranular rupture resulting from the formation of voids due to particle/matrix decohesion (and plastic hole growth) [19]. Regime-II is a transition region in which the ductility drops due to the increasing incidence of grain boundary cavitation, but still accompanied by relatively high levels of matrix deformation (and diffusion controlled cavity growth). In Regime-III, rupture is by the nucleation and subsequent diffusive growth of grain boundary cavities (constrained cavity growth). Ultimately, in Regime-IV, over-ageing of the microstructure reduces the rate of cavity nucleation and/or growth leading to a progressive increase in ductility. In practice, times to the start and end of each mechanism regime typically vary with temperature (e.g., Figure 3b).
The multi-temperature creep ductility characteristics of alloys exhibiting a number of mechanism regimes is clear, although the evidence in Figure 3b does not reflect the within-heat (within-cast) test-to-test variability typically experienced with creep ductility observations. Consequently, the level of complexity increases yet again for multi-heat, multi-temperature creep ductility data collations, further complicating the process of model fitting.
A number of models have already been evaluated for predicting the behaviour depicted in Figure 3b (e.g., Reference [20]). These include adaptations of the algebraic models used to represent creep-rupture strength (e.g., Reference [21]):
and the stress modified ductility exhaustion model [22], i.e.,
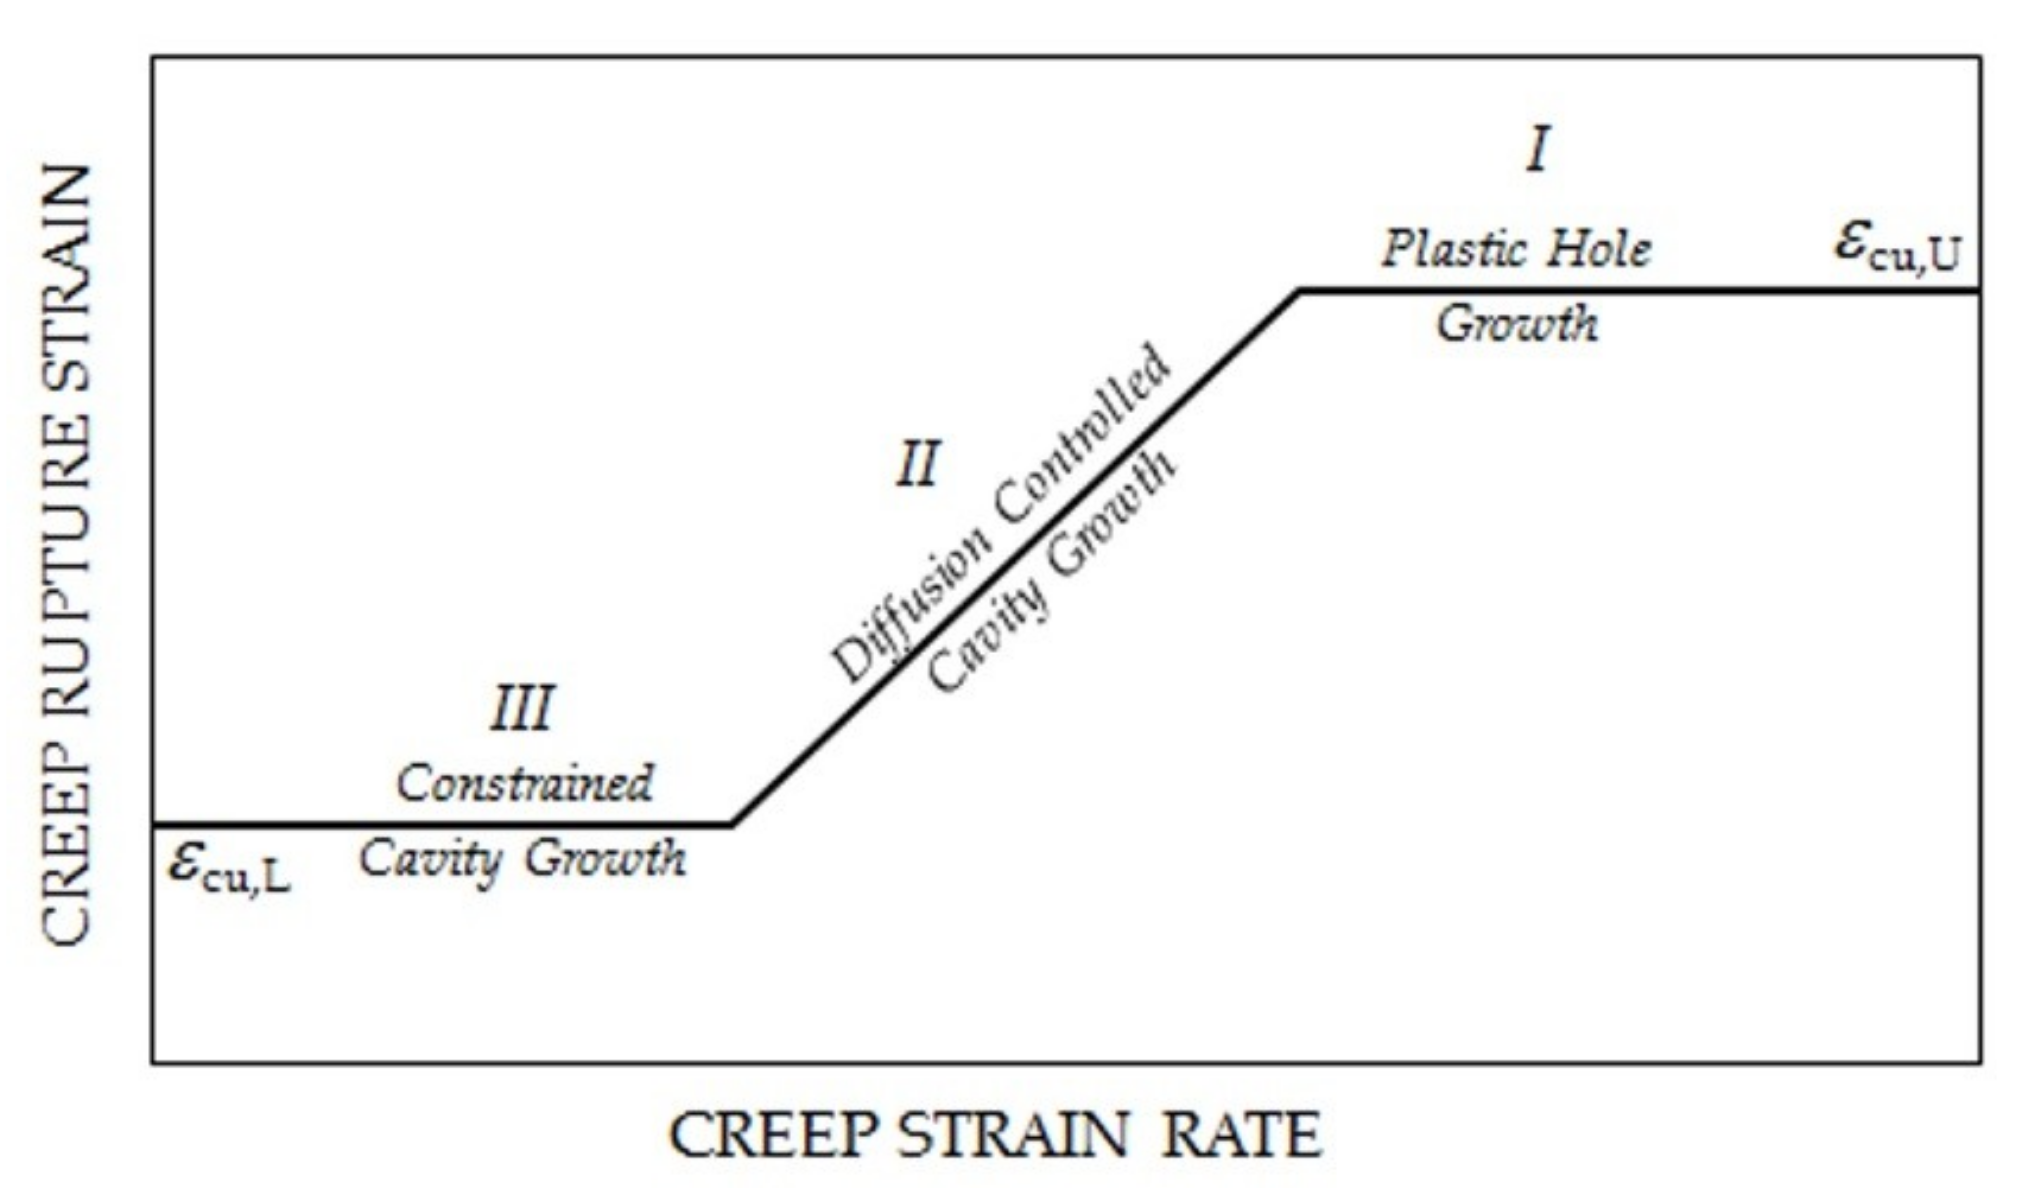
Regimes I, II and III of the ductility (time) diagram in Figure 3a may be alternatively expressed in terms of creep ductility as a function of creep strain rate (Figure 4). This provides a graphical representation of Equation (5) (for a given stress), and the plastic hole growth, diffusion controlled cavity growth and constrained cavity growth damage accumulation regimes referred to earlier.
Figure 4 indicates creep ductility responses associated with two types of cavity growth mechanism. In regime II where cavity growth is diffusion controlled [8], creep ductility reduces with reducing strain rate, whereas, in regime III where cavity growth is constrained [10], creep ductility is independent of creep strain rate.
While Equation (5) can effectively model the multi-temperature creep ductility behavior of a single heat (cast) of material, its effectiveness is more limited when the multi-temperature data collation to be assessed is comprised of observations from a number of heats. In order to account for heat-to-heat variability, Binda modified Equation (5) to include a material pedigree parameter, i.e., f(MP) [23]. For 1CrMoV rotor steel, Binda first derived a number of independent and simple-interaction f(mp) functions to represent the influences of individual chemical elements and heat treatment procedures on creep ductility. These were then combined into the single f(MP) parameter contained in Equation (6), i.e.,
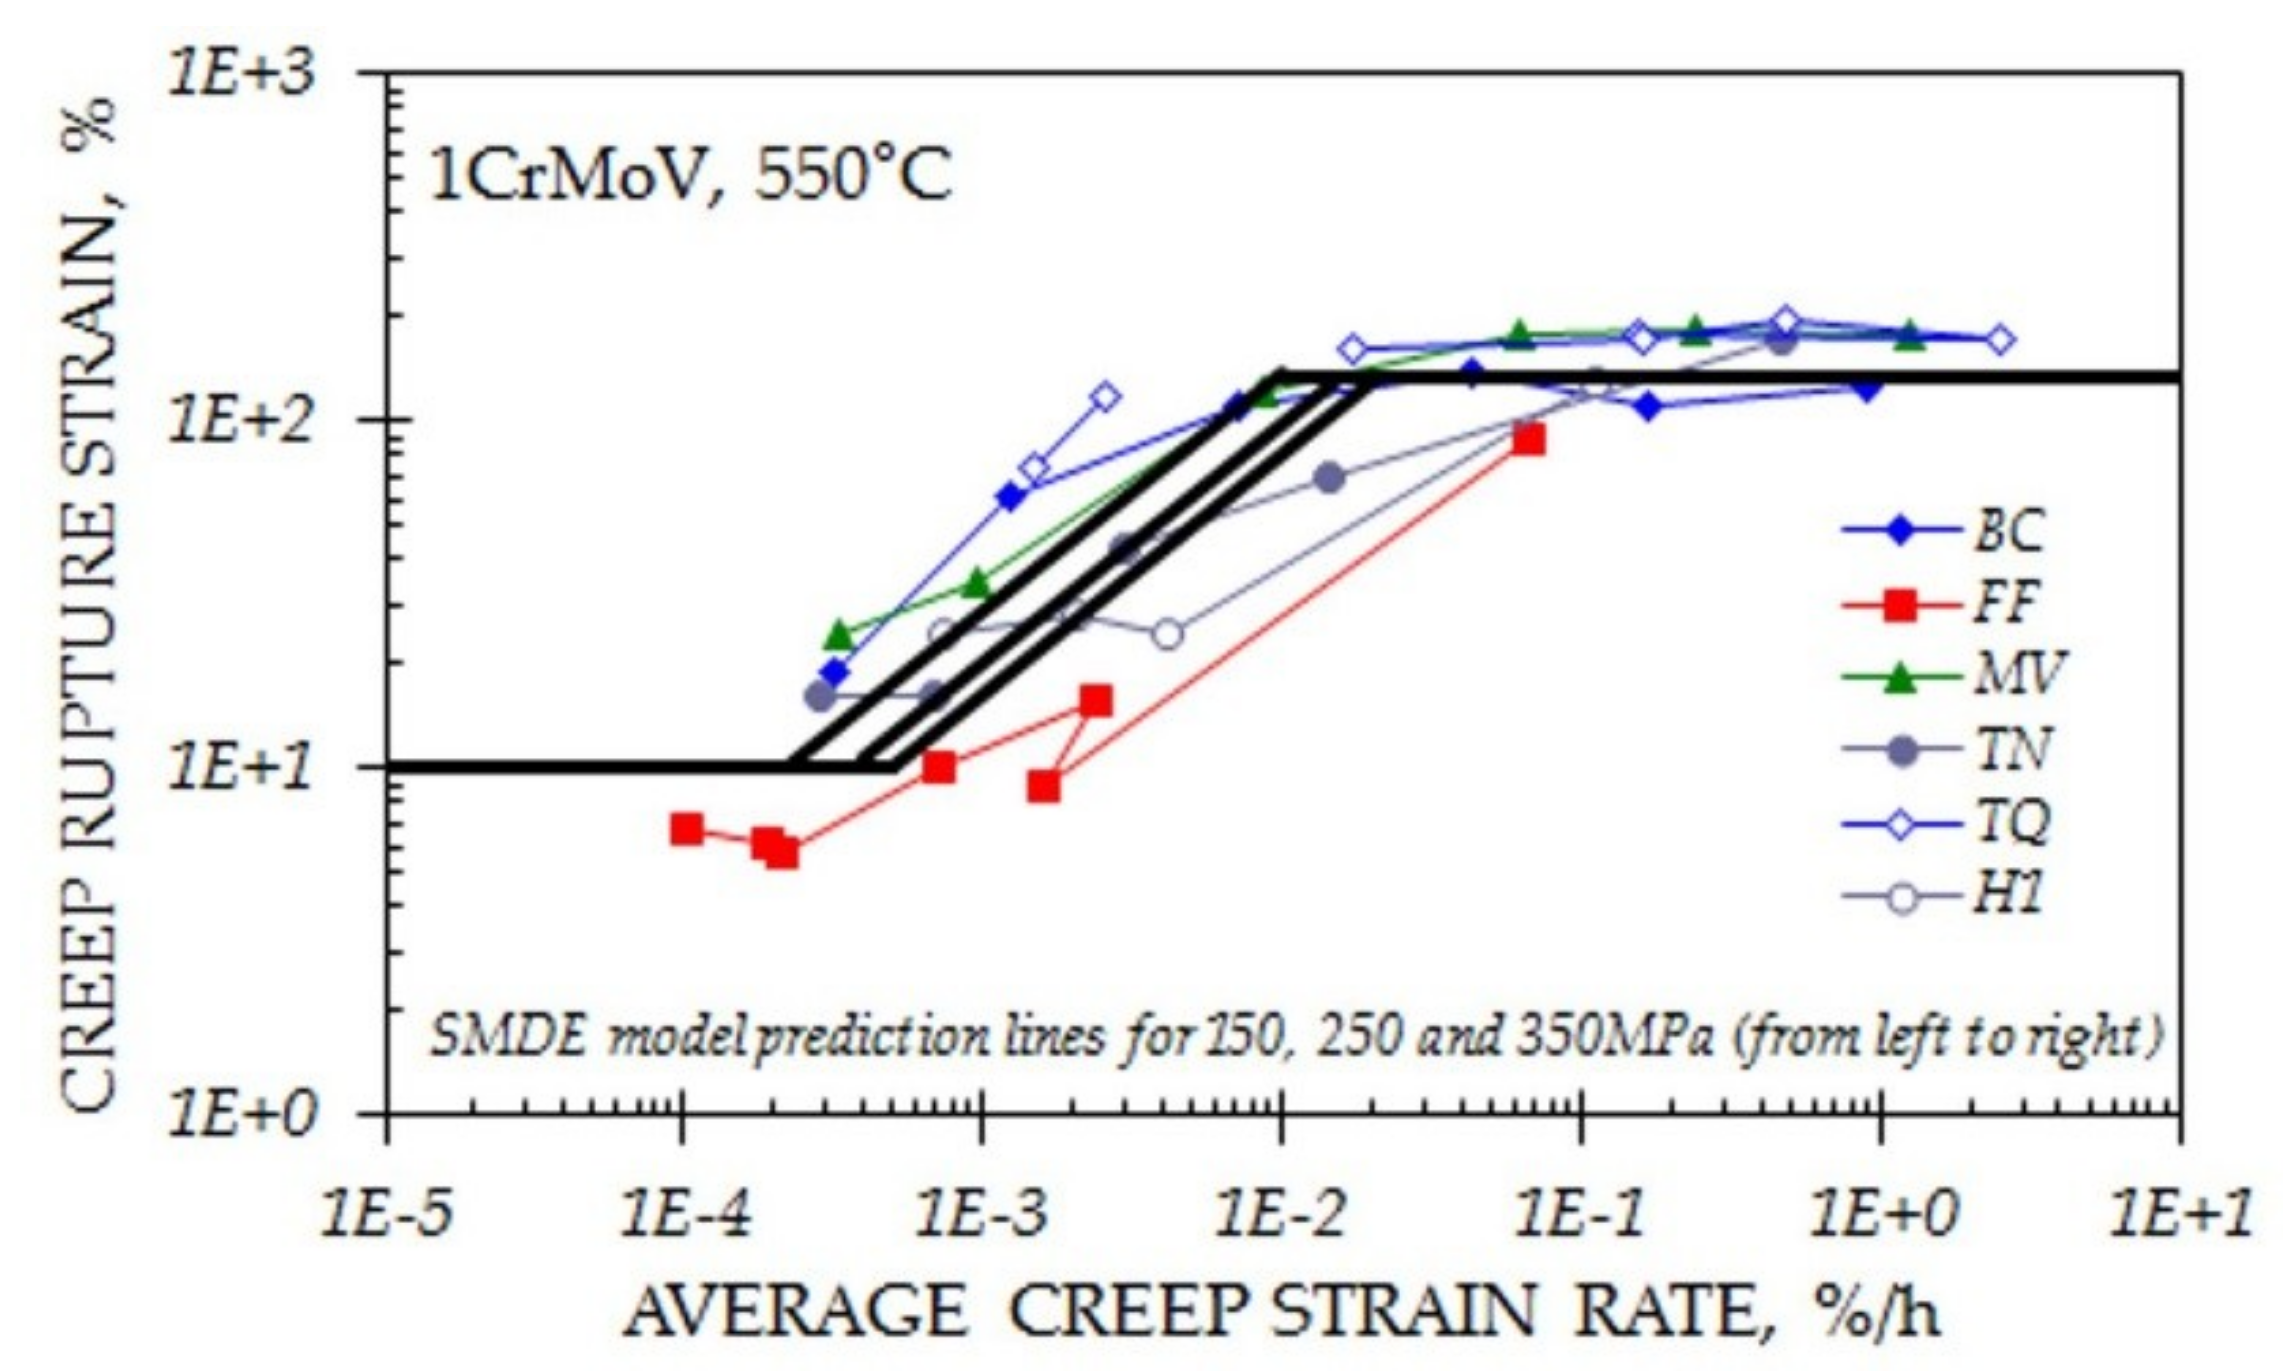
The ability of Equation (6) to predict creep rupture strains for 1CrMoV steel heats with different material pedigree characteristics is demonstrated by the black lines for the stresses indicated in Figure 5 [13].
In the original study, Binda indicated a more than 50% reduction in ductility prediction variance by the adoption of an f(MP) material pedigree parameter [23].
3. Intrinsic Ductility
3.1. General
It has already been acknowledged that intrinsic ductility, as defined by ε′cu in Figure 1, is regarded by many (e.g., [16,17]) as being the most practical indicator of creep ductility, with λ = Au/ε′cu, (or εcu/ε′cu) reflecting the capacity of a steel to redistribute stresses in structural components. As defined, the determination of ε′cu requires the measurement of creep strain development during the course of test. However, it has been postulated that uniform elongation at rupture could provide an indication of intrinsic ductility. If this can be shown to be true, there would be a means of defining ε′cu from tests without continuous strain measurement, i.e., through the measurement of Au,u.
By assuming that λ ~ Au/Au,u, indicative upper and lower-bound loci represent λ for various turbine steels at 550–625 °C and have been included in Figure 2a. These compare with actual λ values of ~5–7 for ½CrMoV steels at 565 °C [24] and for Monkman-Grant based λ values of ~3–9 for 18Cr8Ni steels at 600 °C (and ~13–30 for 18Cr8Ni steels at 650 °C) [25].
In the following sections, other quantities representing intrinsic ductility are examined, i.e., those due to Monkman-Grant and to Woodward.
3.2. Monkman-Grant
The sensitivity of the tertiary strain component of Au (and Zu) to specimen geometry has at least in part been responsible for the consideration of other creep ductility parameters, such as the Monkman-Grant ductility, εcu,mg [26]. The Monkman-Grant ductility is not universally accepted, not least because it can ignore a significant component of primary creep strain (Figure 1). Primary creep can be as high as ~0.5% in some steels. Nevertheless, εcu,mg is importantly not dominated by a specimen dependent tertiary creep strain component, and the ratio λ = Au/εcu,mg (or εcu/εcu,mg) is regarded as being a reasonable approximation of λ = Au/ε′cu, (or εcu/ε′cu) [25].
While there is currently no known evidence to directly relate εcu,mg to εcu,u, it is postulated that the results of future investigations will confirm the two quantities to be similar, in particular in circumstances for which instantaneous plastic strain accumulation is negligible and primary creep strain is small.
In terms of the Monkman-Grant ductility, ε′cu (as defined in Figure 1) comprises two components, i.e.,
where εcu,mg is defined by a relationship proposed by Monkman-Grant [26], i.e.,
from which εcu,mg may be derived by the substitution of , i.e.,
with υ often regarded as being equal to unity, although this has been shown to be not always the case in practice [25].
It is not uncommon for ε′cP in Equation (7) to be ignored (either for simplicity, or when the extent of primary creep is relatively low). In such circumstances, ε′cu is simply defined by Equation (9).
3.3. Woodford
Woodford has developed an alternative concept of intrinsic ductility which is the strain rate sensitivity determined by differentiating log stress versus log strain rate curves determined from the results of stress relaxation tests (e.g., Reference [27]). Originally, the concept was based on a microstructurally independent experimental correlation between strain rate sensitivity and elongation at creep rupture for a wide range of metals and alloys [28], but is more recently regarded by Woodford as being verified by a theoretical treatment [29].
The advantage of the concept is said to be that intrinsic ductility minima for a range of engineering materials can be reliably identified in short duration stress relaxation tests [27,30]. Inherently, this claim is regarded as dubious since ductility troughs are entered not only because of mechanism changes associated with reducing stress (and strain rate), but also as a consequence of long-time thermally induced metallurgical changes that cannot possibly be reproduced in short duration stress relaxation tests (<~100 h) at the same temperature.
4. Multiaxial Ductility
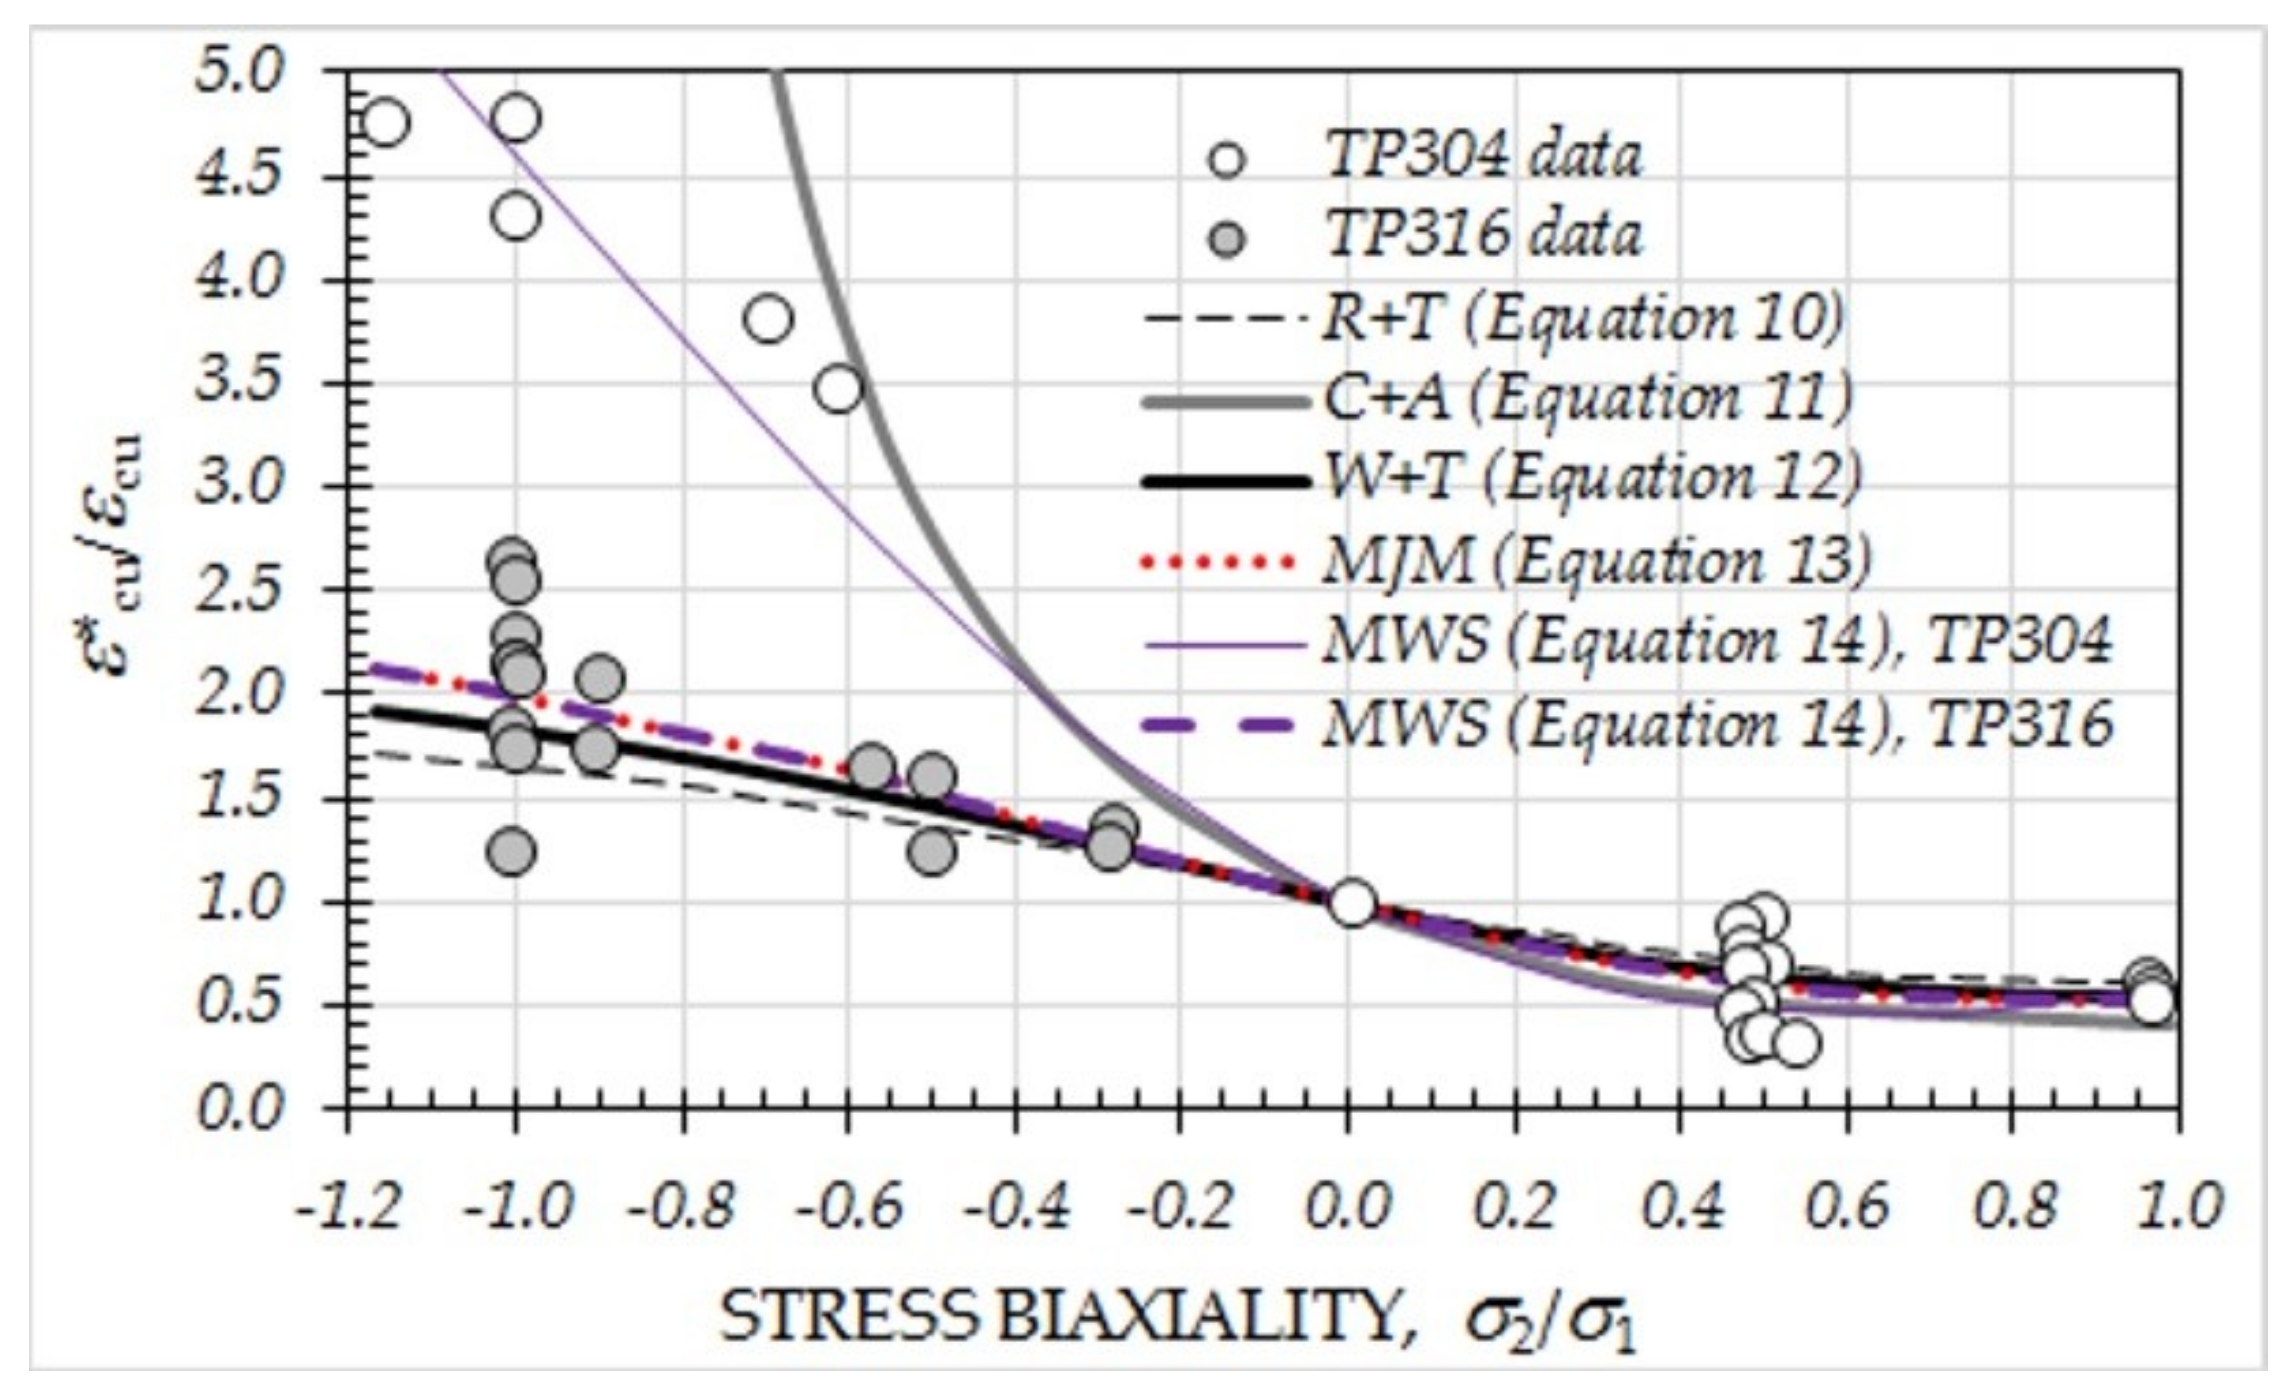
In practice, the generation of creep damage typically occurs at stress concentrations, due to the local exhaustion of multiaxial ductility. Various models are available to predict the magnitude of multiaxial ductility relative to uniaxial ductility, and are invariably a function of the hydrostatic to equivalent stress ratio (σm/σeq). A number of these are reviewed below in terms of , while recognizing that the multiaxial ductility ratio should ideally be expressed in terms of intrinsic ductility, i.e., .
The model due to Rice & Tracey is based on their observations relating to the exponential amplification of plastic void growth rate as a consequence of stress triaxiality [7], i.e.,
An alternative physically based multiaxial ductility model is that proposed by Cocks & Ashby, which assumes that grain boundary cavities develop due to power law creep of the surrounding matrix [32], i.e.,
It has been demonstrated that Equation (11) can strongly overestimate ε*cu in some circumstances, and has been modified with the intention of overcoming this problem [33], i.e., by:
These physically based relationships compare with empirical models of the type proposed by Manjoine [34], the latest of which is given by:
Based on the Rice & Tracey model, Spindler proposed [31]
with p and q as fitting parameters, being respectively 0.15 and 1.25 for TP316, and 2.38 and 1.04 for TP304.
The effectiveness of the cited multiaxial ductility models to represent available experimental observations for TP304 and TP316 stainless steels is given in Figure 6.
5. Practical Implications
5.1. Notch Sensitivity
Creep notch sensitivity is typically defined in terms of a ratio of the strength determined using a standard notched specimen relative to that measured in an un-notched specimen in the same time (usually in a time <<~10 kh). When this ratio is less than unity, the material is regarded as notch sensitive (or notch weakening). The duration at which a material becomes notch sensitive according to this definition relates to the time to the start of the ductility trough (as depicted in Figure 3).
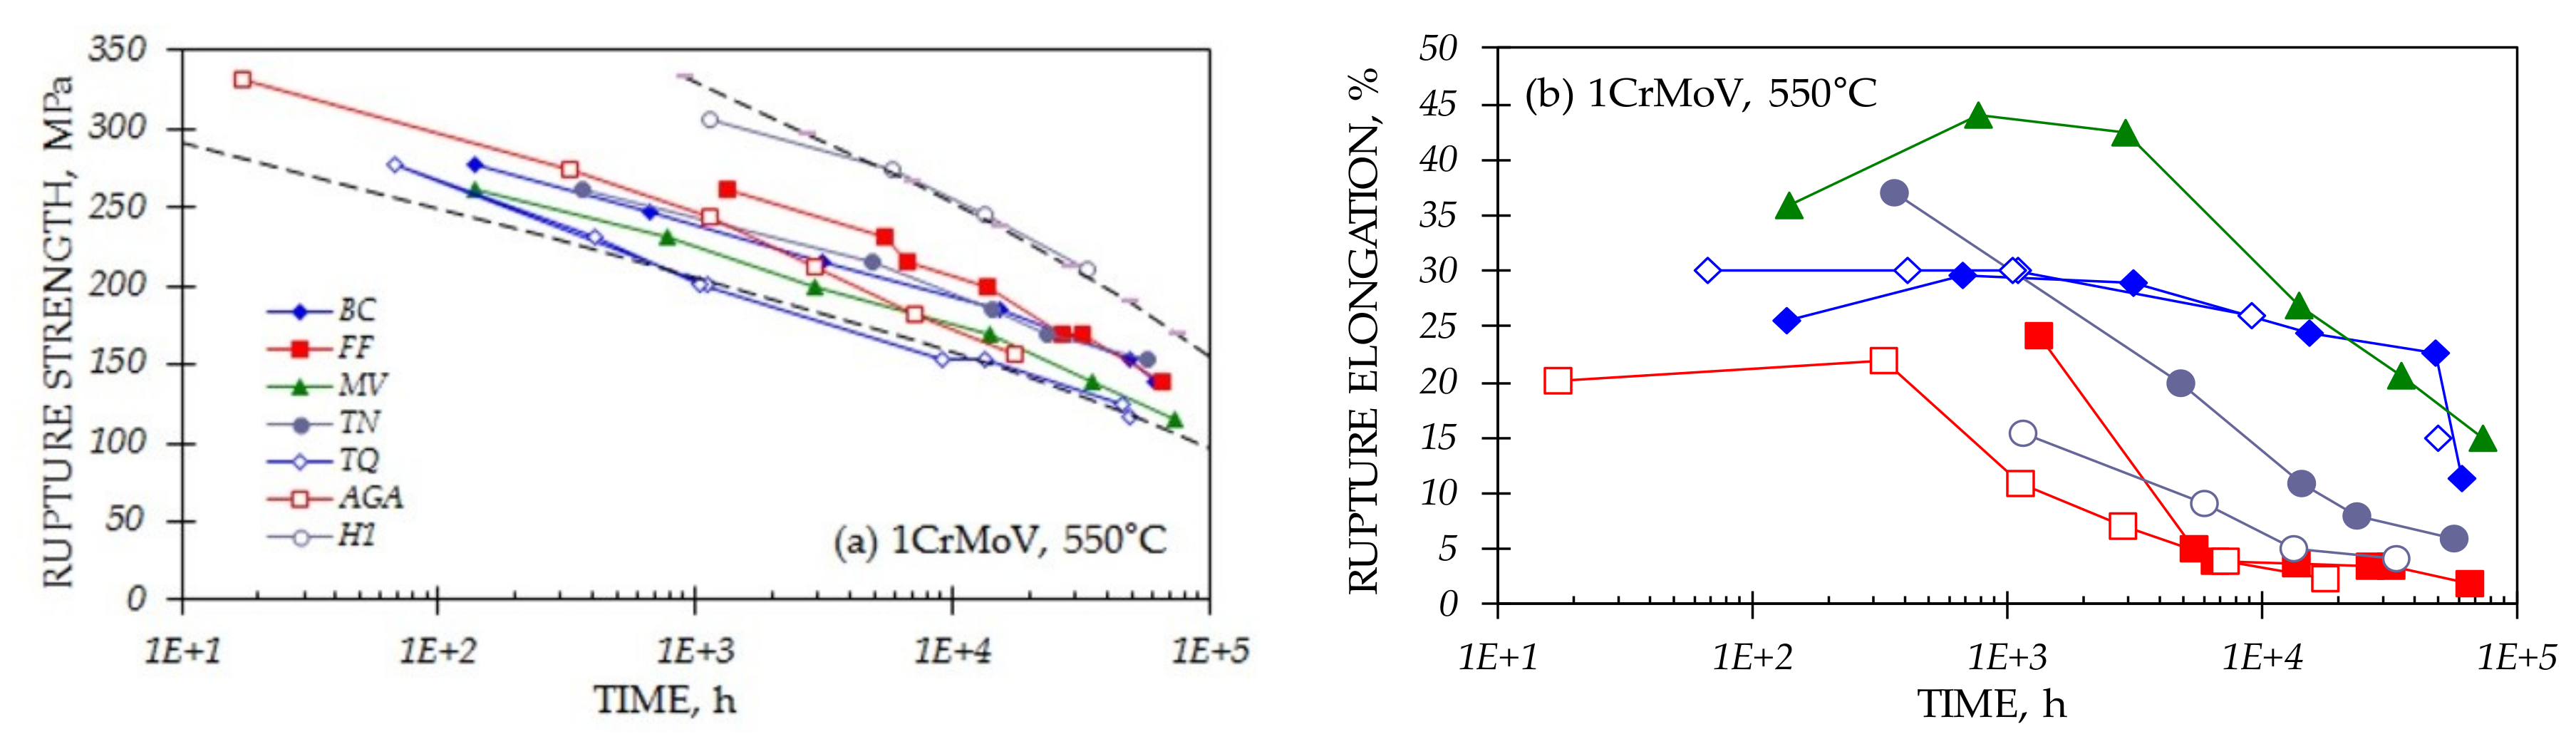
Most engineering steels exhibit a creep-rupture strength scatterband reflecting the range of chemical compositions and heat treatment conditions permitted by the alloy specification (e.g., [13]). High strength materials in such scatterbands tend to be more susceptible to notch weakening, often this being because the time to entering the ductility trough is relatively short (≤~1 kh). Bottom of the strength scatterband heats (casts) are often regarded as being notch insensitive because the time to enter the ductility trough for these materials is much greater than ~10 kh (e.g., Figure 7).
High temperature plant designers should be careful. Critical component lifetimes are typically well in excess of ~100 kh, and the assessment of notch sensitivity should be based on the time to the start of the ductility trough with respect to such design lifetimes.
5.2. Creep Crack Incubation and Growth
Low creep ductility can influence creep crack incubation and creep crack growth times in power plant components containing pre-existing defects at high temperatures [38]. Typically, there is an incubation period prior to the onset of creep crack extension, during which time damage accumulates at the crack tip of the pre-existing defect, and the crack tip opens until a critical condition is exceeded in terms of damage accumulated (local ductility exhaustion of ε*cu) and the opening displacement (δi,x), Figure 8. Creep crack incubation models reflect this through the inclusion of (or better ) in Equation (15) [5].
where and x is typically 0.2–0.5 mm (for engineering calculations).
There is also long standing experience of the influence of creep-ductility on creep crack growth rate (i.e., Equation (16)) [39], i.e.,
It therefore appears that the overall creep lives of high temperature components containing pre-existing defects are directly influenced by the magnitude of creep ductility, i.e., tu = ti,x + tg. In particular, low creep ductility is responsible for reductions in both creep crack incubation and creep crack growth times.
5.3. Creep-Fatigue
Increasingly, high temperature plant components are expected to operate at higher temperatures (to improve efficiency) and with greater operational flexibility. In such circumstances, the integrity of high temperature power plant components is strongly influenced by their resistance to creep-fatigue loading. The creep damage at critical locations, which are largely subjected to secondary self-equilibrating (thermal) loading, typically accumulates at the operating temperature later during steady running periods when creep strain rates and creep ductility are low (e.g., Figure 5). Here, the determination of accumulated creep damage using a ductility exhaustion model in conjunction with Equation (17) is a logical option [41,42].
where and where the summed ductility is represented by the creep elements consumed during the respective stress relaxation phase of each cycle.
There is strong experimental evidence to indicate that creep-fatigue crack initiation endurances, for example for 1CrMoV rotor steel, are significantly influenced by creep ductility at 550 °C (Figure 9). Creep ductility is strain rate sensitive for a number of engineering materials, and tends to the minimum value for the material heat (cast) at the lower relaxation rates experienced towards the end of longer hold (operating) times [43,44]. Creep ductility is exhausted earlier in lower ductility alloy heats (casts), these therefore being more susceptible to creep-fatigue damage accumulation and consequent crack initiation.
6. Concluding Remarks
Creep ductility is an important outcome of creep-rupture tests on high temperature steels, although there are a number of possible quantities which could be adopted and there is no consensus about which is the most appropriate parameter to be used to quantify this property. The candidates are reviewed. It is concluded that intrinsic ductility (as defined by Ainsworth and Goodall) is probably the most useful indicator of creep ductility, but acknowledged that, currently, this can only be determined from the results of tests with strain measurement. Unfortunately, there are many existing creep-rupture test results that do not include intermediate strain values (i.e., the results of stress-rupture tests).
Other indicators of intrinsic ductility are examined.
The way in which creep ductility varies with temperature and stress (and the underlying mechanisms) is relatively well known for many engineering alloys. The effective modelling of this parameter from the results of multi-temperature, multi-heat (multi-cast) data collations, in a comparable way to that of creep strength modelling, is currently a topic of on-going R&D. The complexity of large alloy creep ductility data collations is far greater than that of the equivalent creep strength data collations used to determine long time creep strength values for Design and Product Standards, and modelling therefore provides a challenge.
It is recognized that, in service, the exhaustion of creep ductility is most likely to occur at stress concentrations. This being the case, the important material property is not the creep ductility determined from uniaxial specimens, but multiaxial creep ductility. Models available to convert uniaxial ductility to multiaxial ductility are considered.
The assessment of creep notch sensitivity, creep crack incubation and growth, and creep damage accumulation during creep-fatigue transients, are practical examples requiring a knowledge of creep-ductility.
Funding
This research received no external funding.
Conflicts of Interest
The author declares no conflict of interest.
Nomenclature
| a | Crack depth |
| a1…e1 | Material constants (Equation (4)) |
| Au | Creep-rupture elongation (εo + εcu) |
| Au,loc | Local creep rupture strain in region of necking (εo + εcu,loc) |
| Au,u | Uniform creep rupture elongation (εo + εu,u) |
| B | Constant in steady state creep law |
| C1 | Constant in SMDE model |
| C* | Parameter characterising crack tip stress and strain rate fields |
| do, du1 | Initial net section diameter of gauge section, Net section diameter at rupture adjacent to necking |
| du2 | Net section diameter at rupture at end of parallel length (Figure 2a) |
| Dc | Creep damage fraction |
| Dmg | Monkman-Grant constant |
| E | Elastic modulus |
| f(mp) | Individual condition (independent or simple interaction) material pedigree function |
| f(MP) | Overall material pedigree parameter (included in Equation (6)) |
| In | Tabulated geometrical function [5] (Equation (15)) |
| k | Original specimen dimension proportionality (Lr,o/√So) factor |
| Lr, Lr,o, Lr,u | Reference length, Initial reference length, Reference length at rupture |
| LPD | Load point displacement |
| m1 | Stress exponent in SMDE model (Equations (5) and (6)) |
| n | Stress exponent for steady state creep |
| n1 | Strain rate exponent in SMDE model (Equations (5) and (6)) |
| p | Material constant in Spindler multiaxial ductility model (Equation (14)) |
| P, S, T | Primary, Secondary, Tertiary (creep) |
| q | Material constant in Spindler multiaxial ductility model (Equation (14)) |
| Q* | Constant relating to activation energy for diffusion creep |
| So, Su | Initial cross sectional area of gauge section, Cross sectional area at rupture |
| SMDE | Stress modified ductility exhaustion |
| t, tu | Time, Time to rupture |
| ti,x, tg | Creep crack incubation time (to crack initiation criterion, x), Creep crack growth time |
| T, TK | Temperature (in °C), Temperature (in K) |
| Tc | Insignificant creep temperature |
| x | Crack initiation criterion |
| Zu | Reduction of area at creep-rupture |
| α′ | Creep crack growth constant in Equation (16) |
| β | C* exponent in Equation (16) |
| δ, δi,x | Crack tip opening displacement, Critical crack tip opening displacement (at the onset of creep crack extension, Δa = x) |
| ε, εc | Strain, Creep strain |
| εcu | Creep rupture strain (equivalent to Au, when there is insignificant instantaneous plastic strain on loading) |
| Multiaxial creep rupture strain | |
| ε′cu | Intrinsic creep-rupture strain (Figure 1) |
| εcu,L, εcu,U | Lower shelf creep rupture strain, Upper shelf creep rupture strain |
| εcu,loc | Local creep-rupture strain in region of necking (equivalent to Au,loc, when there is insignificant instantaneous plastic strain on loading) |
| εcu,mg | Monkman-Grant ductility |
| εcu,u | Uniform creep rupture strain (equivalent to Au,u, when there is insignificant instantaneous plastic strain on loading) |
| Minimum (steady secondary) creep rate, also referred to as dεc,min/dt (in Figure 1) | |
| ε′cP | Fraction of primary creep not accommodated by Monkman-Grant ductility (see Figure 1) |
| εo | Instantaneous plastic strain |
| λ | Creep ductility ratio (Au/ε′cu or εcu/ε′cu) |
| v | Monkman-Grant strain rate exponent |
| σ, σo | Stress, Initial stress in constant load creep test |
| σeq, σm | Equivalent stress, Hydrostatic stress |
| σref, σ1 | Reference stress, Maximum principal stress |
References
- Bailey, R.W. Note on the softening of strain hardened metals and its relation to creep. J. Inst. Met. 1926, 35, 27–40. [Google Scholar]
- Orowan, E. The creep of metals. J. West Scotl. Iron Steel Inst. 1946, 54, 45–53. [Google Scholar]
- Norton, F.H. Creep of Steel at High Temperatures; McGraw-Hill: New York, NY, USA, 1929. [Google Scholar]
- Weertman, J. Theory of steady-state creep based on dislocation climb. J. Appl. Phys. 1955, 26, 1213–1217. [Google Scholar] [CrossRef]
- Riedel, H. Fracture at High Temperatures; Springer: Berlin/Heidelberg, Germany, 1987. [Google Scholar]
- Pickering, F.B. Some aspects of creep deformation and fracture in steels. In Proceedings of the IOM Conference on Rupture Ductility of Creep Resistant Steels, York, UK, December 1990; The Institute of Metals: London, UK, 1990; pp. 17–48. [Google Scholar]
- Rice, J.R.; Tracey, D.M. On the ductile enlargement of voids in triaxial stress fields. J. Mech. Phys. Solids 1969, 17, 201–217. [Google Scholar] [CrossRef]
- Hull, D.; Rimmer, D.E. The growth of grain boundary voids under stress. Philos. Mag. 1959, 4, 673–687. [Google Scholar] [CrossRef]
- Beere, W. Mechanism maps. In Cavities and Crack in Creep and Fatigue; Gittus, J., Ed.; Applied Science: London, UK, 1981; pp. 29–57. [Google Scholar]
- Dyson, B.F. Constrained cavity growth, its use in quantifying recent creep fracture results. Can. Metall. Q. 1979, 18, 31–38. [Google Scholar] [CrossRef]
- Ashby, M.F.; Gandhi, C.; Taplin, D.M.R. Fracture mechanism maps and their construction for FCC metals and alloys. Acta Met. 1979, 27, 699–729. [Google Scholar] [CrossRef]
- ISO 204. Metallic Materials—Uniaxial Creep Testing in Tension—Method of Test; International Organisation for Standardisation: Geneva, Switzerland, 2018. [Google Scholar]
- Holdsworth, S. Creep ductility of 1CrMoV rotor steel. Mater. High Temp. 2017, 34, 99–108. [Google Scholar] [CrossRef]
- NIMS Creep Data Sheets. Japan National Institute for Materials Science. Available online: https://smds.nims.go.jp/creep/index_en.html (accessed on 31 January 2019).
- Ewald, J.; Kern, T.-U. The role of the material parameter uniform elongation. In Proceedings of the 4th International ECCC Conference, Düsseldorf, Germany, 10–14 September 2017. [Google Scholar]
- Goodall, I.V.; Ainsworth, R.A. Failure of structures by creep. In Proceedings of the 3rd International Conference on Pressure Vessel Technology, Tokyo, Japan, 19–22 April 1977; Volume II, pp. 871–885. [Google Scholar]
- Hayhurst, D.R.; Webster, G.A. An overview on studies of stress state effects during creep of circumferentially notched bars. In Proceedings of the Symposium on Techniques for Multiaxial Creep Testing, Leatherhead, UK, 25–26 September 1985; pp. 137–175. [Google Scholar]
- Holdsworth, S.R. The ECCC approach to creep data assessment. In Proceedings of the CREEP8 8th International Conference on Creep and Fatigue at Elevated Temperatures, San Antonio, TX, USA, 22–26 July 2007; pp. 661–667. [Google Scholar]
- Holdsworth, S.R.; Beech, S.M. Microstructural factors affecting notch creep-rupture behaviour in high temperature power plant steels. In Proceedings of the IOM Conference on Rupture Ductility of Creep Resistant Steels, York, UK, December 1990; pp. 320–333. [Google Scholar]
- Holdsworth, S.R.; Merckling, G. ECCC developments in the assessment of creep-rupture properties. In Proceedings of the 6th International Charles Parsons Turbine Conference on Engineering Issues in Turbine Machinery, Power Plant and Renewables, Trinity College, Dublin, Ireland, 16–18 September 2003; pp. 411–426. [Google Scholar]
- Trunin, I.I.; Golobova, N.G.; Loginov, E.A. New method of extrapolation of creep test and long time strength results. In Proceedings of the 4th International Symposium on Heat Resistant Metallic Materials, Mala Fatra, Slovakia, 1971; p. 168. [Google Scholar]
- Spindler, M.W. The multiaxial and uniaxial creep rupture ductility of Type 304 steel as a function of stress and strain rate. Mater. High Temp. 2004, 21, 47–52. [Google Scholar] [CrossRef]
- Binda, L. Advanced Creep Damage and Deformation Assessment of Materials Subject to Steady and Cyclic Loading Conditions at High Temperatures. Ph.D. Thesis, ETH Zürich, Zürich, Switzerland, 2010. [Google Scholar]
- Cane, B.J.; Browne, R.J. Representative stresses for creep deformation and failure of presurised tubes and pipes. Int. J. Press. Vessel. Pip. 1982, 10, 119–128. [Google Scholar] [CrossRef]
- Skelton, R.P. Deformation, diffusion and ductility during creep—Continuous void nucleation and creep-fatigue damage. Mater. High Temp. 2017, 34, 121–133. [Google Scholar] [CrossRef]
- Monkman, F.C.; Grant, N.J. An empirical relationship between rupture life and minimum creep rate in creep-rupture tests. Proc. Am. Soc. Test. Mater. 1956, 56, 593–620. [Google Scholar]
- Woodford, D.A. Intrinsic ductility for structural materials as a function of stress and temperature. Mater. High Temp. 2017, 34, 134–139. [Google Scholar] [CrossRef]
- Woodford, D.A. Strain rate sensitivity as a measure of ductility. Trans. ASM 1969, 69, 291–293. [Google Scholar]
- Nichols, F.A. Plastic instabilities and uniaxial tensile ductilities. Acta Metall. 1980, 28, 663–673. [Google Scholar] [CrossRef]
- Woodford, D.A. Performance-based creep strength and intrinsic ductility for a cast nickel-based superalloy. Mater. High Temp. 2018, 35, 399–409. [Google Scholar] [CrossRef]
- Spindler, M.W. The multiaxial creep ductility of austenitic stainless steels. Fatigue Fract. Eng. Mater. Struct. 2004, 27, 273–281. [Google Scholar] [CrossRef]
- Cocks, A.F.; Ashby, M.F. Intergranular fracture during power law creep under multiaxial stress. Met. Sci. 1980, 8, 395–402. [Google Scholar] [CrossRef]
- Wen, J.-F.; Tu, S.-T.; Xuan, F.Z.; Zhang, X.W.; Gao, X.L. Effects of stress level and stress state on creep ductility: Evaluation of different models. J. Mater. Sci. Technol. 2016, 32, 695–704. [Google Scholar] [CrossRef]
- Manjoine, M.J. Creep-rupture behaviour of weldments. Weld. J. Res. Suppl. 1982, 61, 50s–57s. [Google Scholar]
- Branch, G.D.; Marriot, J.B.; Murphy, M.C. The creep and creep-rupture properties of six CrMoV rotor forgings for high temperature steam turbines. In Proceedings of the International Conference on Properties of Creep Resistant Steels, Dusseldorf, Germany, 1972. [Google Scholar]
- Gooch, D.J.; Holdsworth, S.R.; McCarthy, P.R. The influence of net section area on the notched bar creep rupture lives of three power plant steels. In Proceedings of the Conference on Creep and Fracture of Engineering Materials and Structures, Swansea, UK, 5–10 April 1987; pp. 441–457. [Google Scholar]
- Holdsworth, S.R.; Mazza, E. Using the results of crack incubation tests on 1CrMoV steel for predicting long-time creep-rupture properties. Int. J. Press. Vessel. Pip. 2009, 86, 838–844. [Google Scholar] [CrossRef]
- Holdsworth, S.R. Initiation and early growth of creep cracks from pre-existing defects. Mater. High Temp. 1992, 10, 127–137. [Google Scholar] [CrossRef]
- Neate, G.J. Creep crack growth behaviour in 0.5CrMoV steel at 838K. Mater. Sci. Eng. 1986, 82. Part I: Behaviour at a constant load, 59–76; Part II: Behaviour under displacement controlled loading, 77–84. [Google Scholar]
- Holdsworth, S.R. Creep crack growth in low alloy steel weldments. Mater. High Temp. 1998, 15, 203–209. [Google Scholar] [CrossRef]
- R5. Assessment Procedure for the High Temperature Response of Structures; EDF Energy Nuclear Generation Ltd.: Barnwood, UK, 2003. [Google Scholar]
- Priest, R.H.; Ellison, E.G. A combined deformation map-ductility exhaustion approach to creep-fatigue analysis. Mater. Sci. Eng. 1981, 49, 7–17. [Google Scholar] [CrossRef]
- Hales, R. A method of creep damage summation based on accumulated strain for the assessment of creep-fatigue analysis. Fatigue Eng. Mater. Struct. 1983, 6, 121–135. [Google Scholar] [CrossRef]
- Holdsworth, S.R. Prediction of creep-fatigue behaviour at stress concentrations in 1CrMoV rotor steel. In Proceedings of the Conference on Life Assessment and Life Extension of Engineering Plant, Structures and Components, Churchill College, Cambridge, UK, 1996; pp. 137–146. [Google Scholar]
Figure 1.
Variation of creep strain with time to rupture in constant load tests (creep rupture strain and elongation at rupture are only the same when there is insignificant instantaneous plastic strain on loading).
Figure 1.
Variation of creep strain with time to rupture in constant load tests (creep rupture strain and elongation at rupture are only the same when there is insignificant instantaneous plastic strain on loading).

Figure 2.
(a) Quantities required for the determination of uniform elongation at rupture, (b) Schematic of relationship between uniform elongation (Au,u) and rupture elongation (Au, εcu) for various turbine steels at temperatures in the range of 550–625 °C [15] (the significance of the λ lines is discussed later).

Figure 3.
(a) Schematic representation of sequence of creep-rupture regimes for ferritic steels, and (b) experimental evidence of the influence of temperature on kinetics of creep-rupture regime development (data mainly available for regimes II, III and IV).
Figure 3.
(a) Schematic representation of sequence of creep-rupture regimes for ferritic steels, and (b) experimental evidence of the influence of temperature on kinetics of creep-rupture regime development (data mainly available for regimes II, III and IV).

Figure 4.
Variation of creep rupture strain with creep strain rate and the influence of damage mechanism on creep ductility (the indicated regime numbers coincide with those in Figure 3a).
Figure 4.
Variation of creep rupture strain with creep strain rate and the influence of damage mechanism on creep ductility (the indicated regime numbers coincide with those in Figure 3a).

Figure 5.
Comparisons of observed variations in creep rupture strain as a function of average creep strain rate for a number of heats of 1CrMoV rotor steel at 550 °C with Binda modified SMDE predicted behaviour (for f(MP) = 1, with the identifiers in the legend referring to different heats of the steel [13]).

Figure 6.
Comparison of multiaxial ductility model predictions with experimental observations for TP304 and TP316 stainless steels (data from [31]).
Figure 6.
Comparison of multiaxial ductility model predictions with experimental observations for TP304 and TP316 stainless steels (data from [31]).

Figure 7.
Variation of (a) rupture strength, and (b) rupture ductility, for different heats (casts) of 1CrMoV at 550 °C (only a small number of heats (casts) are shown from a much greater database to illustrate the variability trends [35,36,37]).

Figure 8.
Crack incubation and crack growth contributions to lifetime of components with pre-existing defect subject to steady loading (σo) at high temperature, for steels with: (a) Low creep ductility, and (b) high creep ductility [38,40].

Figure 9.
Influence of creep ductility on cyclic/hold creep-fatigue crack initiation endurance.

© 2019 by the author. Licensee MDPI, Basel, Switzerland. This article is an open access article distributed under the terms and conditions of the Creative Commons Attribution (CC BY) license (http://creativecommons.org/licenses/by/4.0/).
Share and Cite
MDPI and ACS Style
Holdsworth, S. Creep-Ductility of High Temperature Steels: A Review. Metals 2019, 9, 342. https://doi.org/10.3390/met9030342
AMA Style
Holdsworth S. Creep-Ductility of High Temperature Steels: A Review. Metals. 2019; 9(3):342. https://doi.org/10.3390/met9030342
Chicago/Turabian StyleHoldsworth, Stuart. 2019. "Creep-Ductility of High Temperature Steels: A Review" Metals 9, no. 3: 342. https://doi.org/10.3390/met9030342
Note that from the first issue of 2016, this journal uses article numbers instead of page numbers. See further details here.