Article

Phase Formation and Magnetic Properties of Melt Spun and Annealed Nd-Fe-B Based Alloys with Ga Additions

National University of Science and Technology «MISiS», Leninskiy pr. 4, Moscow 119049, Russia
*
Author to whom correspondence should be addressed.
Metals 2019, 9(5), 497; https://doi.org/10.3390/met9050497
Submission received: 20 March 2019 / Revised: 19 April 2019 / Accepted: 26 April 2019 / Published: 28 April 2019
(This article belongs to the Special Issue Advanced Non-Equilibrium Metallic Materials)

Abstract

:
The structural transformations and magnetic property changes of the Nd16.2FebalCo9.9Ga0.5B7.5 (SG1, SG2) and Nd15.0FebalGa2.0B7.3 (SG3) nanocomposite alloys obtained by melt spinning in the as-quenched state and after annealing at a temperature range of 560–650 °C for 30 min were studied. The methods used were X-ray diffraction analysis, magnetic property measurements, TEM studies, X-ray fluorescence analysis and Mössbauer spectroscopy. Amorphous phase and crystalline phase Nd2Fe14B (P42/mnm) were observed in the alloy after melt spinning. The content of the amorphous phase ranged from 20% to 50% and depended on the cooling rate. Annealing of the alloys resulted in amorphous phase crystallization into Nd2Fe14B and led to the increased coercivity of the alloys up to 1840 kA/m (23.1 kOe) at 600 °C annealing for 30 min. The alloy with the maximum coercivity had a grain size of the Nd2Fe14B phase ≈50–70 nm with an Nd-rich phase between grains.

1. Introduction

Permanent magnets have found their application in various engines, generators, recording and storage devices, etc. Industry needs require a steady increase in the density of magnetic energy and production volumes of permanent magnets [1,2,3]. At present, the maximum magnetic energy (BH)max obtained for a Nd-Dy-Fe-B system of alloys is produced by a powder technology method using sintering dispersed powders with a grain size of about 1 µm. This grain size provides high values of coercivity at a level of about 1600 kA/m (20 kOe) [3]. However, due to low natural reserves and the high cost of Dy, there is significant demand for permanent magnets without Dy.
In this regard, particular interest is shown in nanocrystalline or nanocomposite permanent magnets obtained by high-energy methods: high-energy milling, severe plastic deformation, quenching from liquid state, etc. In these systems, exchange coupling effects [4,5,6,7,8,9] or the formation of intergranular phases changing the exchange interaction between the grains and increasing the coercivity can be observed. According to Murakami et al. [10], such phases can be ferromagnetic and non-ferromagnetic [1,11] and can have completely different compositions. In the binary Nd-Fe system, metastable phases can be encountered when quenching from the liquid state into the alloy enriched with neodymium [12]. However, the effect on the formation of a highly coercive state and composition has not been fully studied in these materials. Thus, in nanocrystalline or nanocomposite alloys obtained by the extreme effects methods, the magnetic properties are determined not only by the fundamental parameters of the phases but mainly by the parameters of the structure and morphology of these phases.
Another important question linked to the formation of a highly coercive state is the alloying of the Nd-Fe-B system. For the last 30 years or more of the investigation of the Nd2Fe14B compound, the influence of a large number of alloying components has been studied, but the most interesting effect can be observed with Ga addition [13,14,15,16,17]. The influence of Ga on the formation of the texture during the quenching process from the liquid state was studied by Nguyen et al. [13]. Since the main drawback of materials obtained by the extreme effects methods is the isotropy of their properties, the formation of the texture could greatly increase (BH)max and surpass the sintered magnets in terms of properties.
According to Cui et al. [18], a partial substitution of 1.1 at.% Fe for Ga of mechanically alloyed Nd8.4Fe87.1B4.5 helped to control the morphology, particularly the grain sizes of both the α-Fe and Nd2Fe14B phases. In [19] it was reported by Pan, that Ga exists in the matrix phase, in grain boundaries, also forms a Ga-rich phase in the Nd15Co16Ga2B7 alloy. The amount of Ga for the replacement of Fe should be 1–2% (at.). The existing form of Ga in the grain boundaries is the same as in the matrix phases, which inhibits the formation of soft magnetic phases. The addition of Ga can decrease the grain size and increase the grain boundary area, resulting in the domain walls pinning effect and in an increase of the coercivity of the alloys. Ga additions are often used in sintered magnets to form the required parameters of the structure and intergrain phases by Kaihong [20]. According to Sasaki [21], the influence of Ga in the structure formation of sintered magnets is not fully understood. There are works by Hu et al. [22] and Dahal et al. [23] devoted to the investigation of the effect of Ga on Gd2Fe17 compound, as well as Mössbauer studies of the effect of Ga on its magnetic properties. Nevertheless, the study of the effect of gallium in alloys obtained by extreme methods, in particular quenching from a liquid state, is an actual task.
In this paper, we focused on the structural transformations and magnetic properties of the Nd-Fe-B-Ga nanocrystalline alloy, with the goal of clarifying an understanding of the relationship between the structure and properties of this system in the initial state and after the heat treatment.

2. Materials and Methods

The near single-phase alloy ingots Nd16.2FebalCo9.9Ga0.5B7.5 (SG1, SG2) and Nd15.0FebalGa2.0B7.3 (SG3) were prepared by induction melting from the pure constituent elements under a high-purity Ar atmosphere. The ingots were re-melted to ensure homogeneity. The chemical composition of the samples, namely SG1, SG2 and SG3 was discovered using X-ray fluorescent analysis on Primus II (Rigaku, Japan, Tokyo) spectrometer. The flakes were made by melt spinning in an argon atmosphere onto a copper wheel rotating at different linear speeds Vs; SG1: Vs = 10 m/s, SG2: Vs = 20 m/s and SG3: Vs = 10 m/s. The thermal analysis of the flakes was carried out using the STA 449 F3 Jupiter differential scanning calorimeter (NETZSCH, Germany, Selb) at a heating rate of 15 °C/min to determine the crystallization temperature of the samples. These flakes were then annealed under a vacuum of 10−4 Pa to crystallize and develop the desired microstructure and optimize the magnetic properties. The phase analysis, crystallite sizes and lattice parameters were characterized by X-ray diffraction analysis (XRD) with the help of the Ultima IV (Rigaku, Japan, Tokyo) diffractometer with Co radiation (λ = 0.17902 nm). X-ray data analysis was carried out using software based on Rietveld’s method released in PDXL (Rigaku, Japan, Tokyo)) software. Crystallite size was determined by the XRD peaks broadening method using PDXL (Rigaku, Japan, Tokyo)) software. The quantitative analysis of the amorphous phase was performed according to the procedure described by Savchenko in [24]. The microstructure of the flakes was characterized by JEM 1400 (JEOL, Japan, Tokyo) and Technai T20 (Thermo Fisher Scientific, Hillsboro, OR, USA, with EDX) transmission electron microscopes (TEM). Hysteresis loops of the flakes were measured using the physical property measurement system PPMS Ever Cool II (Quantum Design Inc., San Diego, CA, USA) vibrating sample magnetometer (VSM) with an applied field of up to 7200 kA/m (90 kOe). A Mössbauer spectrometer MS-1104Em (Research Institute of Physics SFU, Russia, Rostov-on-Don) of the electromechanical type with a 50 mCi 57Co source in an Rh matrix was used.

3. Results

Table 1 shows the chemical composition of the samples, namely SG1, SG2 and SG3. The alloys SG1 and SG2 were similar in chemical composition. The difference between them was their individual cooling rates: SG1—10 m/s, SG2—20 m/s.
The amount of Nd for all samples was also higher than the stoichiometric amount necessary for the formation of the Nd2Fe14B phase. SG3 had the highest amount of Ga. Figure 1 shows XRD patterns of SG1, SG2 and SG3 alloys in the as-quenched state.
The SG1, SG2 and SG3 alloys in the initial state after melt spinning were characterized by the presence of a crystalline Nd2Fe14B (P42/mnm) phase and amorphous phase (see Figure 1a) in an amount of 20 to 50 vol.%. In the SG1 and SG2 alloys, obtained at different cooling rates, the amount of amorphous phase was larger in the SG2 sample obtained with a higher cooling rate. In alloy SG3, the lattice spacings were found to increase in comparison with the SG1 and SG2 alloys and the pure phase of Nd2Fe14B. It can be assumed that this was due to the diffusion effect of Ga in the solid solution. The magnetic properties of the investigated alloys are presented in Table 1. The coercivity values were correlated with the amount of amorphous phase. It should be mentioned that the magnetic loops had a stretched shape. According to the TEM data, the grain size of the Nd2Fe14B phase was about 11 ± 2 nm (Figure 1b).
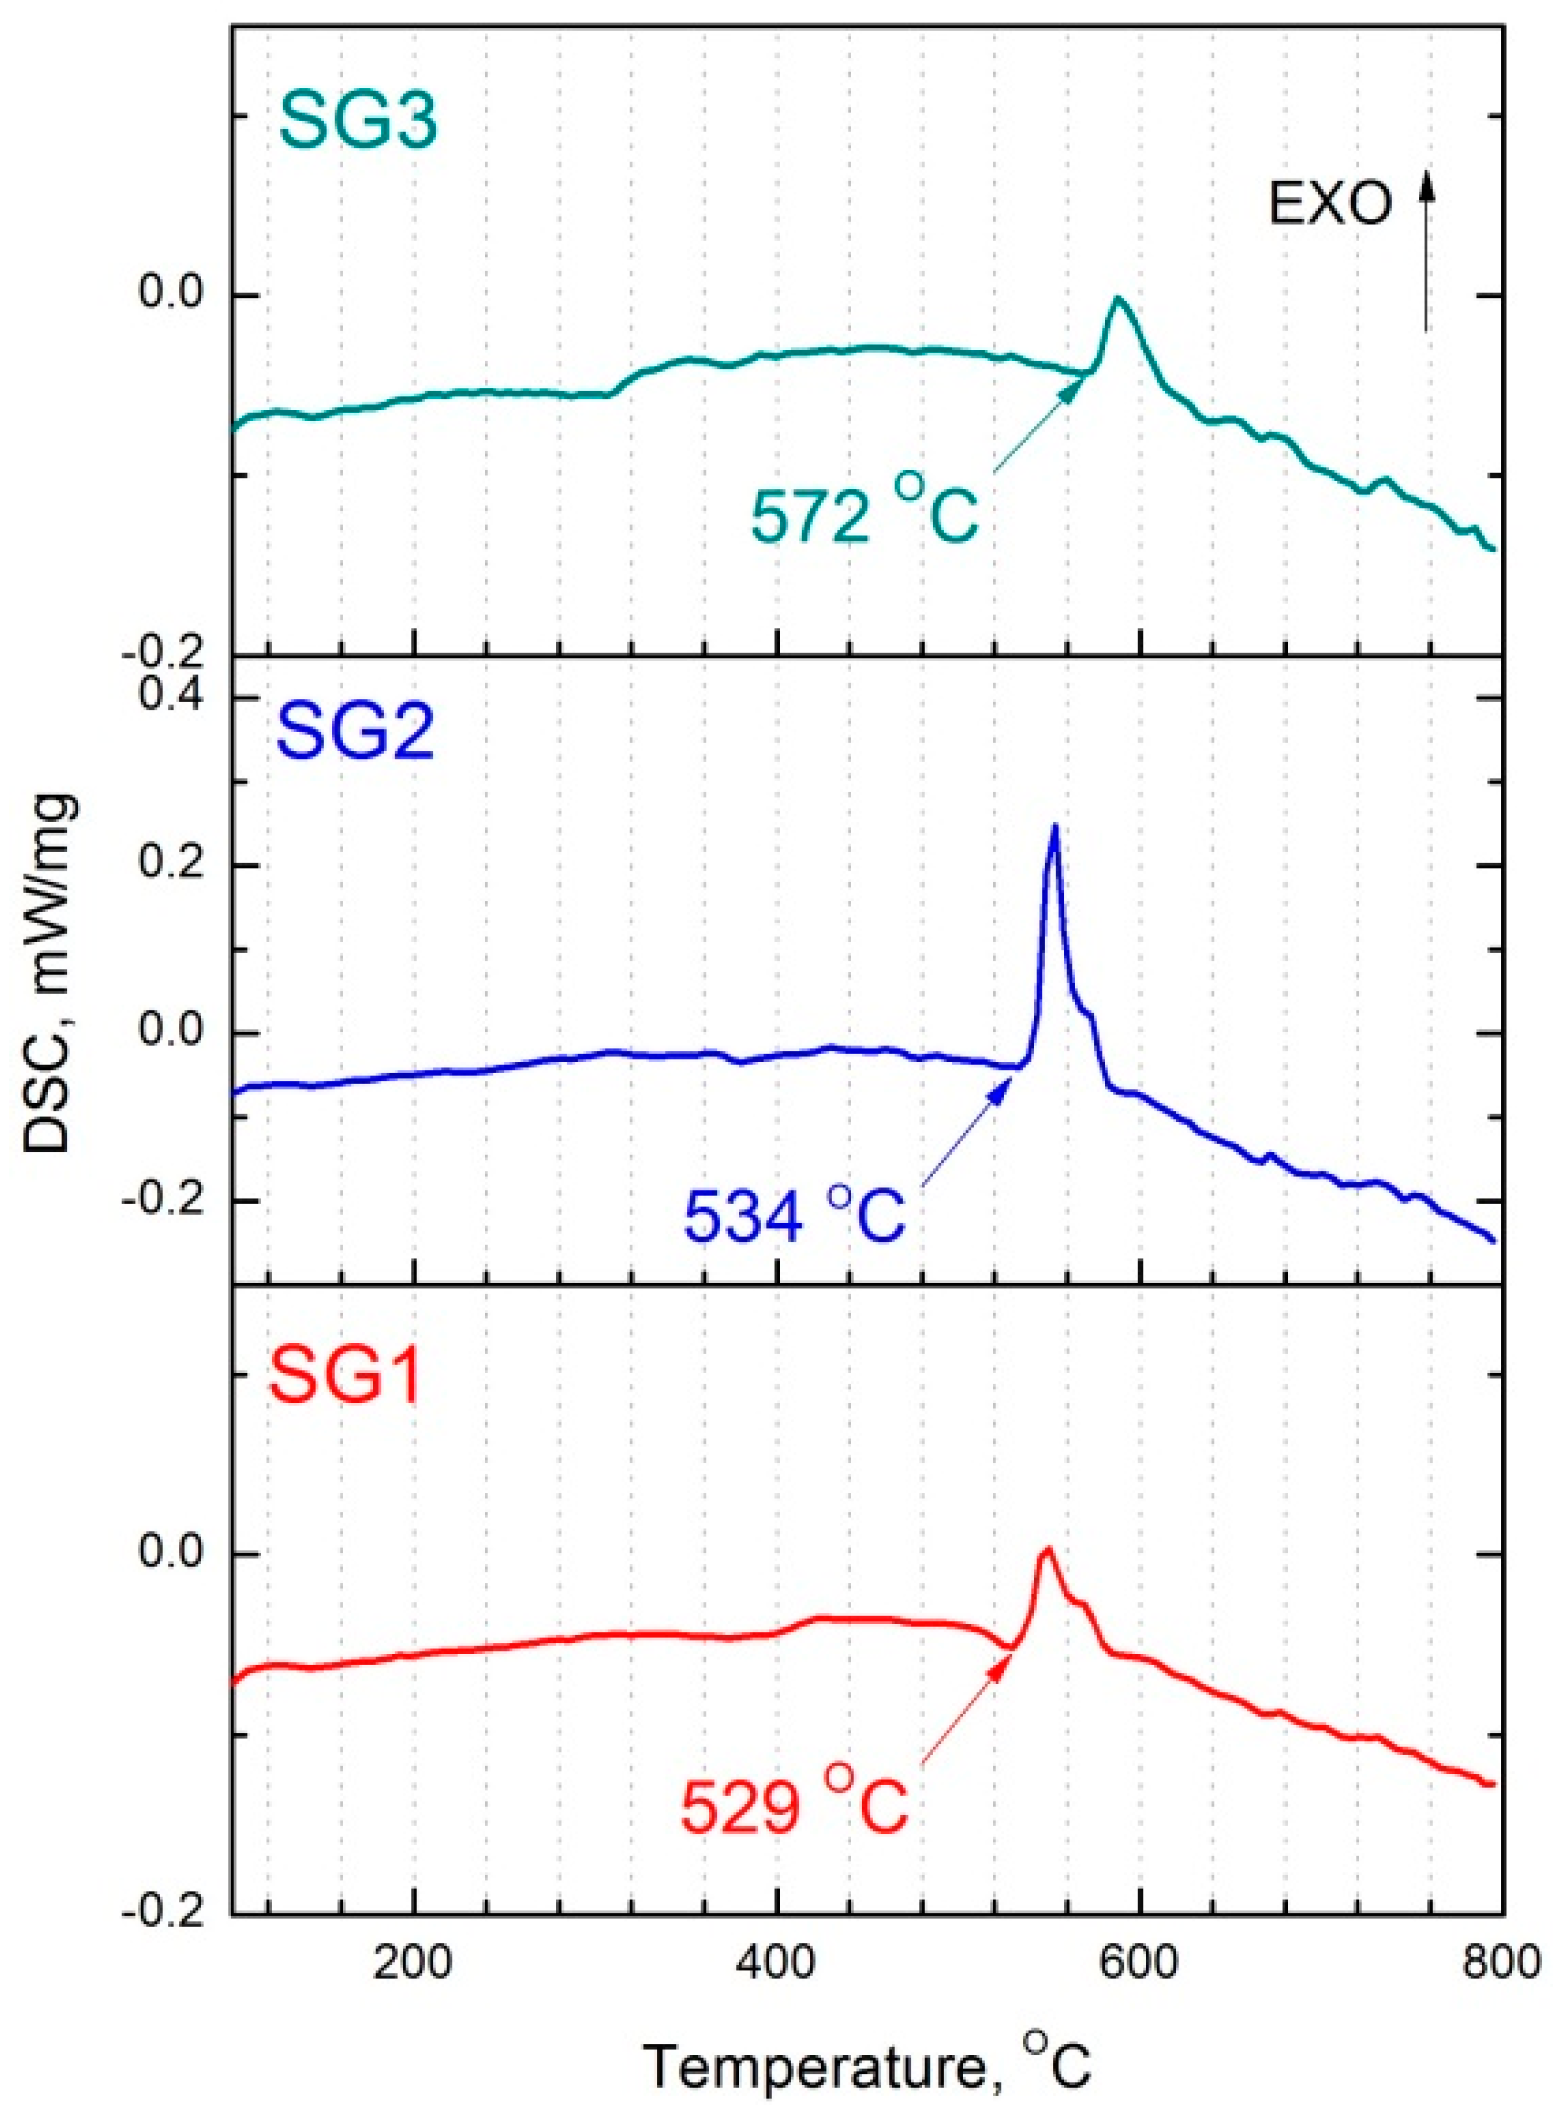
To determine the crystallization temperatures of the amorphous phase, Differential scanning calorimetry (DSC) studies were carried out and presented in Figure 2.
From the DSC curves, it can be seen that all the samples had exothermic peaks linked with the crystallization of the amorphous phase. In addition, the peak area was connected to the amorphous phase volume fraction. The SG2 sample had the highest peak area with the maximum amorphous phase volume fraction (50 ± 5%). The SG1 and SG3 samples showed a smaller peak area, with a smaller amorphous phase volume fraction (35 ± 5% and 20 ± 5%, respectively). For samples SG1 and SG2, crystallization temperatures of the amorphous phase were very close to 529 and 534 °C, respectively, and the SG3 alloy had a crystallization start temperature of 572 °C, due to the higher Ga content.
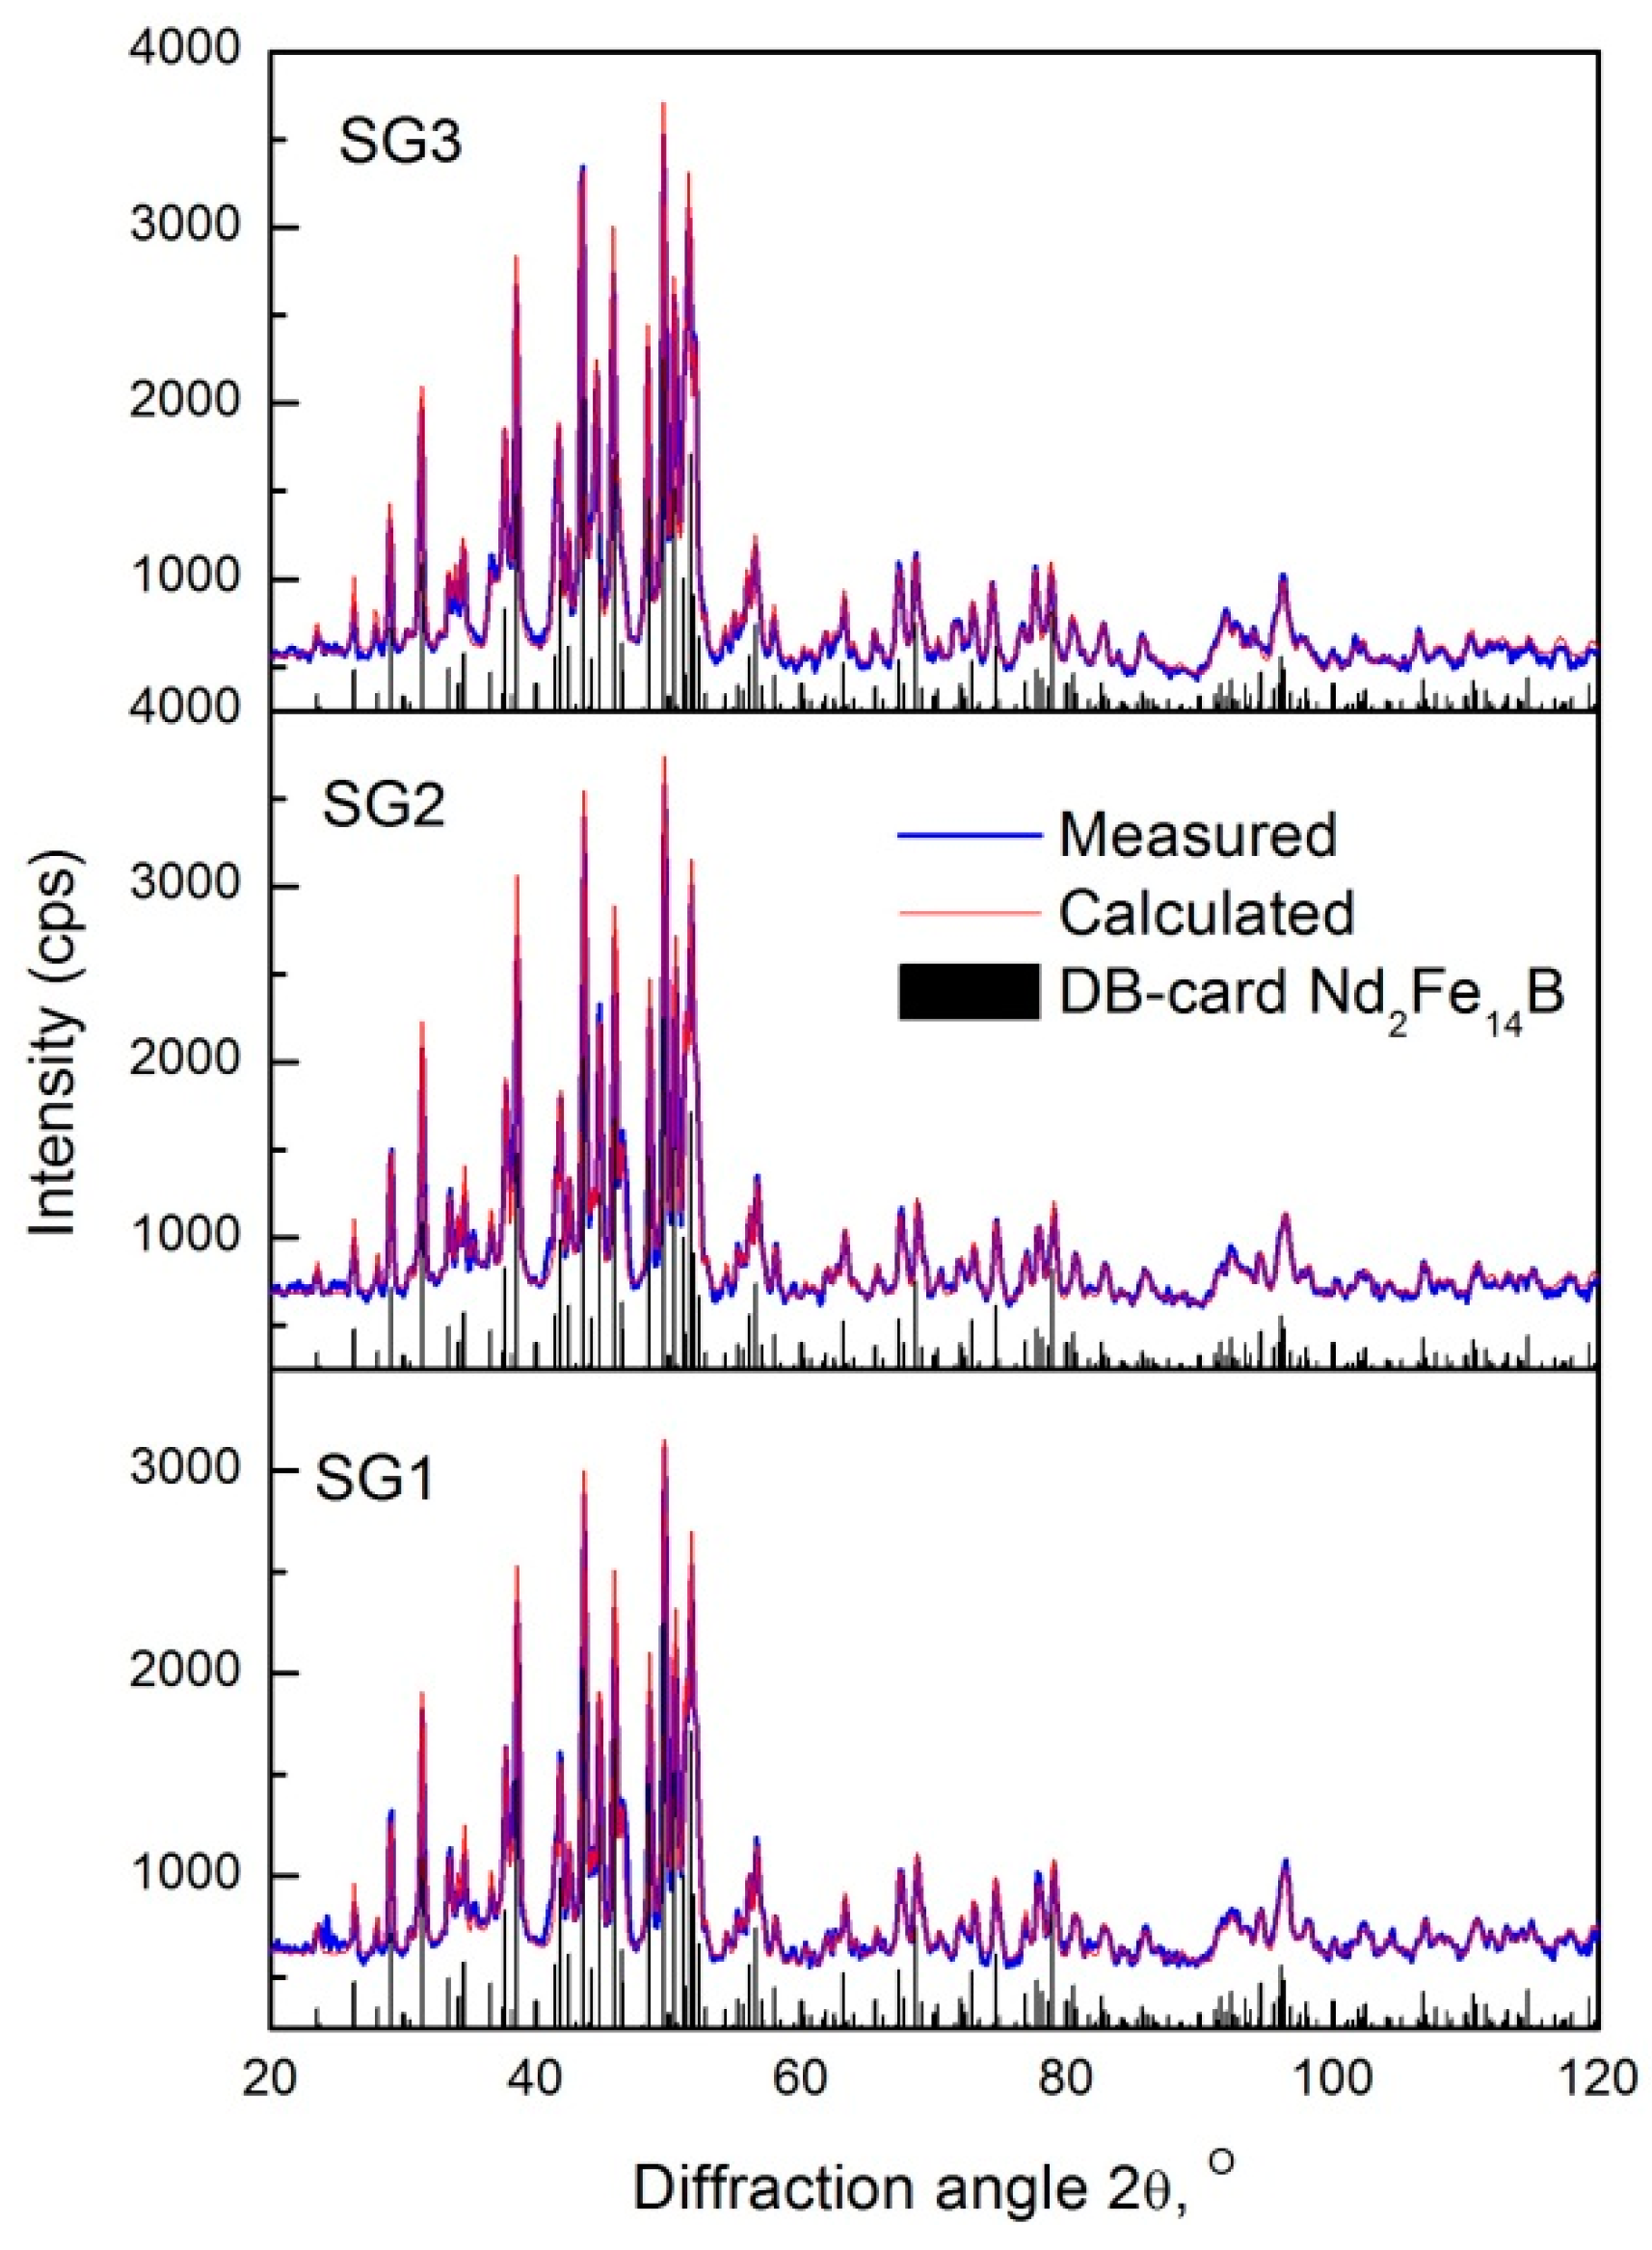
Annealing of the alloys was carried out in a temperature range of 560–650 °C for 30 min. During the annealing of the sample SG1, the crystallization of the amorphous phase took place with the formation of Nd2Fe14B. As the amorphous phase is soft and the Nd2Fe14B phase is hard magnetic, the crystallization process is accompanied by drastic coercivity growth. A phase with the hexagonal crystal structure (P63/mmc), which we described as a Nd-rich phase also appeared. The maximum volume fraction of the Nd-rich phase was reached at 560 °C. With an increase of the annealing temperature, the volume fraction decreased (Table 2 and Figure 3).
According to the TEM data (Figure 4), the grain size of the Nd2Fe14B phase after annealing at 600 °C increased to 50–70 nm. Furthermore, a secondary phase that was located between the grains and in the triangular grain boundaries of the main Nd2Fe14B phase can be seen on the microstructure images (Figure 4). An increase in the annealing temperature led to a change in the morphology of the Nd-rich phase.
According to the XRD data, with the increase of the annealing temperature the amount of Nd-rich phase decreased, possibly due to a change in the phase morphology. Detailed analysis of the chemical composition of this boundary phase with the help of analytical transmission microscopy is presented in Figure 5.
Figure 5 shows that the composition of the boundary phase changed with an increased Nd concentration up to 30 at.% during scanning along the red line. Unfortunately, due to the low Ga content, the variation of the concentration in the boundary region was not possible to register. In the XRD and TEM data, similar patterns were observed in the case of sample SG2 (Table 2).
In the case of SG3, similar patterns were observed as for SG1 and SG2. However, at all temperatures, the lattice spacing on all alloys was noticeably overestimated for the Nd2Fe14B phase, which can indicate the dissolution of Ga in the Nd2Fe14B phase and the formation of a solid solution. The Ga radius (rGa = 0.139 nm) was larger than that of the Fe (rFe = 0.126 nm), but smaller than the Nd radius (rNd = 0.182 nm), and we assume that the Ga dissolves predominantly at Fe positions. Otherwise, the Nd2Fe14B phase lattice spacing would decrease.
Changes in the magnetic properties of the alloys after annealing are shown in Figure 6b and in Table 2.
For all alloys, the dependence of the coercivity on the annealing temperature was the highest for samples SG1, SG2, SG3 at 600, 600, 580 °C, respectively. The growth of the coercivity of all samples was linked to the decrease of the amorphous phase amount and to the formation of the Nd-rich phase between Nd2Fe14B grains. The drop of the coercivity was due to a change in the morphology of the Nd-enriched phase and due to a change in the exchange interaction between the grains, as well as the growth of the Nd2Fe14B phase grains, causing an excess in the size of the single-domain state. The maximum coercivity achieved for sample SG3 was noticeably lower than for samples SG1 and SG2, which can be related to the formation of a Ga solid solution based on the Nd2Fe14B phase and a decrease in the anisotropy field, according to Hu [14] and, consequently, a decrease in coercivity. The saturation magnetization did not practically depend on the annealing temperature for all samples, although according to the XRD data, as the annealing temperature increased, the fraction of the neodymium phase decreased. This fact confirmed that the shape and distribution of the Nd-rich phase began to change after high temperature annealing. The remanence magnetization of samples SG2 and SG3 increased slightly, and then remained almost the same due to the decay of the amorphous phase. At temperatures above 600 °C the remanence was approximately half of the saturation magnetization, which indicates the isotropy of the samples and the absence of texture. The maximum properties were achieved for sample SG2 annealed at 600 °C: Hci = 1840 kA/m (23.1 kOe), σr = 65.8 A × m2/kg, σs = 130.6 A × m2/kg. Typical loops of samples annealed at 600 °C are shown in Figure 6b.
The Mössbauer spectra of samples SG1 and SG3 are shown in Figure 7, with the calculated results presented in Table 3.
The spectra clearly show doublets that belong to the Nd-rich phase paramagnetic phase. According to the Mössbauer spectrum there was a slight increase of ultrafine magnetic fields in SG2 sample. To describe the Nd2Fe14B phase, six sextets with the parameters from the Manivel paper [25] were used. Analysis of the Mössbauer spectra allows us to conclude that the parameters of the doublet and the sextets of samples SG1 and SG3 were different, which means that the Ga formed solid solutions in both Nd2Fe14B- and Nd-rich phases. The low values of the areas of component (c) and (e) (see Table 3) suggest a possible preferential occupation of these positions by Ga atoms.

4. Conclusions

The melt spinning of Nd-Fe-B-Ga alloys—Nd16.2FebalCo9.9Ga0.5B7.5 (SG1, SG2) and Nd15.0FebalGa2.0B7.3 (SG3)—resulted in their partially amorphization, with the formation of a crystalline Nd2Fe14B phase and an amorphous phase ranging from 20 to 50%. The amount of amorphous phase grew as the cooling rate increased. After quenching from the liquid state, the researched alloy with a high Ga content was characterized by increased lattice spacing values, which was linked to the dissolution of Ga in the Nd2Fe14B phase and the formation of the solid solution. The annealing of the alloys in the temperature range 560–650 °C for 30 min resulted in the crystallization of the amorphous phase and the formation of a nanocomposite structure that consisted of a Nd2Fe14B phase grain size of about 50–70 nm and an intergranular Nd-rich phase. The Nd-rich phase had 30 at.% Nd. This nanocomposite structure provided a highly coercive state. The crystallization process was accompanied by an extreme dependence of coercivity on the annealing temperature, with a maximum at 600 °C for alloys SG1 and SG2 and 580 °C for the SG3 alloy. The saturation magnetization and remanence did not depend on the annealing temperature due to the isotropic state of the alloys. The maximum properties were achieved on the SG2 alloy after annealing at 600 °C for 30 min (Hci = 1840 kA/m (23.1 kOe), σr = 65.8 A × m2/kg, σs = 130.6 A × m2/kg). The SG3 alloy with the maximum Ga content had lower properties compared to the SG1 and SG2 allows, due to the Ga dissolution resulting in a decrease of the anisotropy field in the Nd2Fe14B phase. According to Mössbauer studies, the Ga dissolved both in the Nd2Fe14B phase and in the Nd-rich phase. High Ga addition (~ 2 at. %) in the NdFeB alloy led to a decrease in magnetocrystalline anisotropy that resulted in a reduction of the coercivity of the alloys.

Author Contributions

Conceptualization, I.S.; Methodology I.S. and V.M.; Software, I.S.; Validation, V.M.; Formal Analysis, P.A., M.G. and M.Z.; Investigation, I.S., P.A., M.G., M.Z., P.M. and I.B.; Resources, I.S.; Data Curation, I.B.; Writing—Original Draft Preparation I.S.; Writing—Review & Editing, I.S., I.B. and V.M.; Visualization, I.S.; Supervision, A.S.; Project Administration, I.S.; Funding Acquisition, I.S.

Funding

This research was funded by the Russian Science Foundation (RSF), grant number 18-72-00249.

Conflicts of Interest

The authors declare no conflict of interest.

References

  1. Sasaki, T.T.; Ohkuboa, T.; Takada, Y.; Sato, T.; Kato, A.; Kaneko, Y.; Hono, K. Formation of non-ferromagnetic grain boundary phase in a Ga-doped Nd-rich Nd–Fe–B sintered magnet. Scripta Mat. 2016, 113, 218–221. [Google Scholar] [CrossRef]
  2. Hono, K. High-coercivity Dy-free Nd-Fe-B permanent magnets. In Proceedings of the 24th International Workshop on Rare Earth and Future Permanent Magnets and Their Applications (REPM 2016), Darmstadt, Germany, 28 August–1 September 2016; p. 74. [Google Scholar]
  3. Hao, Z.; Zhang, S.; Bao, D.; Han, X. Investigation of High Coercivity Dy-/Tb-free Sintered NdFeB Magnet Microstructure and Mass Production. In Proceedings of the 24th International Workshop on Rare Earth and Future Permanent Magnets and Their Applications (REPM 2016), Darmstadt, Germany, 28 August–1 September 2016; pp. 56–62. [Google Scholar]
  4. Schrefl, T.; Fidler, J.; Kronmüller, H. Remanence and coercivity in isotropic nanocrystalline permanent magnets. Phys. Rev. B 1994, 49, 6100. [Google Scholar] [CrossRef]
  5. Skomski, R.; Coey, J.M.D. Giant energy product in nanostructured two-phase magnets. Phys. Rev. B 1993, 21, 15812. [Google Scholar] [CrossRef]
  6. Schrefl, T.; Kronmüller, H.; Fidler, J. Exchange hardening in nano-structured two-phase permanent magnets. J. Magn. Magn. Mater. 1993, 127, 273–277. [Google Scholar] [CrossRef]
  7. Wang, Z.; Zhou, S.; Zhang, M.; Qiao, Y. High-performance alpha-Fe/Pr2Fe14B-type nanocomposite magnets produced by hot compaction under high pressure. J. Appl. Phys. 2000, 88, 591–593. [Google Scholar] [CrossRef]
  8. Li, X.H.; Gao, Z.S.; Li, W.; Zhang, K.W.; Zhang, J.W.; Zhang, X.Y. Study of the microstructure of α-Fe/Nd2Fe14B nanocomposites prepared by electropulsing heating amorphous NdFeCoB. Mater. Lett. 2005, 59, 2782–2785. [Google Scholar] [CrossRef]
  9. Fukunaga, H.; Tagawa, A.; Nakano, M. Preparation of high-performance PrFeB/α-Fe nanocomposite magnets by direct Joule heating. J. Magn. Magn. Mater. 2004, 272, 1901–1903. [Google Scholar] [CrossRef]
  10. Murakami, Y.; Tanigaki, T.; Sasaki, T.T.; Takeno, Y.; Park, H.S.; Matsuda, T.; Ohkubo, T.; Hono, K.; Shindo, D. Magnetism of ultrathin intergranular boundary regions in Nd–Fe–B permanent magnets. Acta Mater. 2014, 71, 370–379. [Google Scholar] [CrossRef]
  11. Gutfleisch, O. Controlling the properties of high energy density permanent magnetic materials by different processing routes. J. Phys. D 2000, 33, 157–172. [Google Scholar] [CrossRef]
  12. Menushenkov, V.P.; Shchetinin, I.V.; Gorshenkov, M.V.; Savchenko, A.G.; Ketov, S.V. Microstructure and Magnetic Properties of Melt-Spun Nd-Rich Nd-Fe Alloys. IEEE Magn. Lett. 2016, 7, 5201304. [Google Scholar] [CrossRef]
  13. Nguyen, H.D.; Nguyen, H.Y.; Pham, T.T.; Hguen, T.T.H.; Hguen, H.D.; Duong, D.T.; Dinh, H.L.; Nguen, V.D.; Tran, D.T.; Vu, H.K.; Do, K.T.; Luu, T.H. Nd–Fe–B-based anisotropic nanocrystalline hard magnetic alloys. Adv. Nat. Sci: Nanosci. Nanotechnol. 2012, 3, 015016. [Google Scholar] [CrossRef]
  14. Hu, J.; Wang, Y.; Li, X.; Yin, L.; Feng, M.; Dai, D.; Wand, T.; Zhao, J.; Wang, Z. The effects of addition of Nb, Mo and Ga on the magnetic properties of Nd-Fe-B alloys. J. Phys. Coll. 1988, 49, C8-601–C8-602. [Google Scholar] [CrossRef]
  15. Ahmad, I.; Davies, H.A.; Buckley, R.A. Ultra high coercivity Nd-Fe-B permanent magnet alloy with small addition of Ga. Mater. Lett. 1994, 20, 139–142. [Google Scholar] [CrossRef]
  16. Kanekiyo, H.; Uehara, M.; Hirosawa, S. Microstructure and magnetic properties of high-remanence Nd5Fe71.5Co5B18.5 M (M = Al, Si, Ga, Ag, Au) rapidly solidified and crystallized alloys for resin-bonded magnets. IEEE Trans. Magn. 1993, 29, 2863–2865. [Google Scholar] [CrossRef]
  17. Shiyan, Z.; Hui, X.; Jiansen, N.; Hailong, W.; Qin, B.; Yuanda, D. Effect of Gallium Addition on Magnetic Properties of Nd2Fe14B-Based/α-Fe Nanocomposite Magnets. J. Rare Earths 2007, 25, 74–78. [Google Scholar] [CrossRef]
  18. Cui, B.Z.; Sun, X.K.; Liu, W.; Zhang, Z.D.; Geng, D.Y.; Zhao, X.G.; Sellmyer, D.J. Effects of Ga substitution for Fe on the structure and magnetic properties of Nd8.4Fe87.1−xGaxB4.5 (x = 0–2.2) alloys prepared by mechanical alloying. J. Appl. Phys. 2000, 87, 5335–5337. [Google Scholar] [CrossRef]
  19. Pan, S. The Third Generation Rare Earth Permanent Magnet. In Rare Earth Permanent-Magnet Alloys’ High Temperature Phase Transformation; Springer: Heidelberg, Germany; Dordrecht, The Netherland; London, UK; New York, NY, USA, 2013; pp. 129–229. [Google Scholar]
  20. Kaihong, D.; Zhongjie, P.; Zhanji, D.; Xiulei, C. Sintered R-T-B based permanent magnet and a method of making the sintered R-T-B based permanent magnet. U.S. Patent US2019/0051435A1, 14 February 2019. [Google Scholar]
  21. Sasaki, T.T.; Takada, Y.; Okazaki, H.; Ohkubo, T.; Nakamura, T.; Sato, T.; Kato, A.; Kaneko, Y.; Hono, K. Role of Ga on the high coercivity of Nd-rich Ga-doped Nd-Fe-B sintered magnet. J. Alloy. Compd. 2019, 790, 750–759. [Google Scholar] [CrossRef]
  22. Hu, B.-P.; Li, H.-S.; Shen, B.-G.; Wang, F.-W.; Cadogan, J.M.; Zhan, W.-H. A 57Fe Mössbauer study of Gd2Fe17−xGaxC2 (x = 0–6). J. Appl. Phys. 1996, 79, 5713. [Google Scholar] [CrossRef]
  23. Dahal, J.N.; Syed Ali, K.S.; Mishra, S.R.; Alam, J. Structural, Magnetic, and Mössbauer Studies of Transition Metal-Doped Gd2Fe16Ga0.5TM0.5 Intermetallic Compounds (TM = Cr, Mn, Co, Ni, Cu, and Zn). Magnetochemistry 2018, 4, 54. [Google Scholar] [CrossRef]
  24. Savchenko, A.G.; Medvedeva, T.M.; Shchetinin, I.V.; Menushenkov, V.P.; Gorshenkov, M.V.; Savchenko, E.S.; Bordyuzhin, I.G. Phase-structural state diagrams and hysteresis properties of rapidly solidified alloy Nd10.4Zr4.0Fe75.1Co4.1B6.4 after heat treatment. J. Alloy. Compd. 2017, 707, 205–209. [Google Scholar] [CrossRef]
  25. Manivel Raja, M.; Narayanasamy, A.; Ravichandran, V. 57Fe Mössbauer effect and X-ray studies od Nd-Fe-Sn-B permanent magnetic materials. J. Magn. Magn. Mater. 1996, 159, 345–351. [Google Scholar] [CrossRef]
Figure 1. X-ray diffraction (XRD) patterns of melt spun samples (a) and dark-field TEM image of the SG1 sample after quenching (b).
Metals 09 00497 g001
Figure 2. Differential scanning calorimetry (DSC) curves of samples after melt quenching.
Metals 09 00497 g002
Figure 3. X-ray diffraction (XRD) patterns of samples after annealing.
Metals 09 00497 g003
Figure 4. Bright field image of the microstructure with diffraction (a) and a high resolution (b) image (Nd-rich phase marked with arrows) of the SG1 sample after annealing at 625 °C for 30 min.
Metals 09 00497 g004
Figure 5. Bright field image (a) and result of chemical composition along the red line (b) of the SG1 sample after annealing at 625 °C for 30 min.
Metals 09 00497 g005
Figure 6. Hysteresis loops of samples annealed at 600 °C for 30 min (a) and the dependence of coercivity on the annealing temperature (b).
Metals 09 00497 g006
Figure 7. Mössbauer spectra of the SG1 (a), SG2 (b) and SG3 (c) samples after annealing at 600 °C for 30 min with a paramagnetic doublet marked.
Metals 09 00497 g007
Table 1. Chemical composition, results of the quantitative phase analysis and magnetic properties of the melt quenched samples.
Sample, ConditionsChemical Composition (Fe-Basis), %Phase Composition, %Lattice Spacing Nd2Fe14B, nmMagnetic Properties
NdCoGaBDyNiCuNd2Fe14BAmorphousHci, kA/m (Oe)σr,
A × m2/kg
σs,
A × m2/kg
SG1 Vs = 10 m/s34.7 ± 0.58.7 ± 0.30.5 ± 0.11.2 ± 0.10.11 ± 0.050.10 ± 0.050.09 ± 0.0565 ± 535 ± 5a = 0.8782
c = 1.2192
137.2 (1720)19.979.2
SG2 Vs = 20 m/s34.6 ± 0.58.7 ± 0.30.4 ± 0.11.3 ± 0.10.10 ± 0.050.11 ± 0.050.08 ± 0.0550 ± 550 ± 5a = 0.8782
c = 1.2192
14.4 (180)12.7106.1
SG3 Vs = 10 m/s32.8 ± 0.50.10 ± 0.052.1 ± 0.21.2 ± 0.1-0.10 ± 0.050.10 ± 0.0580 ± 520 ± 5a = 0.8823
c = 1.2251
253.3 (3176)27.793.8
Table 2. Results of the quantitative phase analysis and magnetic properties of the samples after annealing.
Annealing Temperature, °CPhase Composition, %Parameters of Nd2Fe14B PhaseMagnetic Properties
Nd2Fe14BNd-richCrystalline Size, nma, nmc, nmHci, kA/m (kOe)σr,
A × m2/kg
σs,
A × m2/kg
SG1
56090 ± 210 ± 139 ± 30.87731.2194238.7 (3.0)65.5130.3
58089 ± 211 ± 139 ± 30.87741.21851161.8 (14.6)65.4127.5
60097 ± 23 ± 137 ± 30.87791.21991559.7 (19.6)64.9130.3
625100 ± 3<340 ± 20.87911.22011313.0 (16.5)65.5129.5
650100 ± 3<347 ± 20.87841.2186222.8 (2.8)65.5128.7
SG2
56094 ± 36 ± 235 ± 20.87741.2187326.3 (4.1)52.0130.2
58092 ± 38 ± 237 ± 20.87741.2186867.4 (10.9)65.2129.8
60097 ± 33 ± 137 ± 20.87791.21991838.2 (23.1)65.8130.6
625100 ± 3<340 ± 20.87911.22011297.1 (16.3)67.2129.7
650100 ± 3<347 ± 20.87841.21861090.2 (13.7)66.6130.9
SG3
56095 ± 15 ± 237 ± 30.87871.2251191.0 (2.4)50.3127.7
58097 ± 23 ± 136 ± 20.87861.2242891.3 (11.2)64.9130.6
600100 ± 3<342 ± 30.87931.2250779.9 (9.8)58.9133.3
625100 ± 3<347 ± 30.88041.2242549.1 (6.9)62.3133.3
650100 ± 3<344 ± 30.87991.2249135.3 (1.7)63.9131.2
Table 3. Mössbauer spectra parameters of SG1, SG2 and SG3 samples annealed at 600 °C for 30 min.
Mössbauer ParametersFe Site
k1k2j1j2ceDoublet
Hhf, kOeSG1284.4304.0272.1334.9249.4231.0-
SG2285.2305.8273.2333.9250.1246.0-
SG3260.7293.3269.0321.6324.0218.5-
Isomer shift (IS), mm/sSG1−0.06−0.111−0.1040.074−0.061−0.0400.112
SG2−0.062−0.107−0.0830.063−0.087−0.0670.08
SG3−0.12−0.1730.0850.237−0.009−0.0700.055
Quadrupole splitting (QS), mm/sSG10.2430.1900.1410.5600.0820.5880.687
SG20.2360.1840.1520.5970.1060.4490.649
SG3−0.002−0.0140.6850.7300.3590.1660.801
Relative intensity, %SG130.7822.5811.1612.8716.272.074.27
SG226.1222.915.411.84.216.84.7
SG329.1524.4117.038.395.511.913.6