Article

Microstructure and Martensitic Transformation Behavior in Thermal Cycled Equiatomic CuZr Shape Memory Alloy

1
Department of Materials Science and Engineering, Kumamoto University, Kumamoto 860-8555, Japan
2
Division of Materials Science and Chemistry, Faculty of Advanced Science and Technology, Kumamoto University, Kumamoto 860-8555, Japan
3
Department of Advanced Materials Science and Engineering, Faculty of Engineering Sciences, Kyushu University, Fukuoka 816-8580, Japan
4
National Research Council of Italy, Institute of Condensed Matter Chemistry and Technologies for Energy, CNR ICMATE Lecco, Via G. Previati, 23900 1/E Lecco, Italy
*
Author to whom correspondence should be addressed.
Metals 2019, 9(5), 580; https://doi.org/10.3390/met9050580
Submission received: 30 April 2019 / Revised: 14 May 2019 / Accepted: 16 May 2019 / Published: 18 May 2019
(This article belongs to the Special Issue Intermetallic Alloys)

Abstract

:
Equiatomic CuZr alloy undergoes a martensitic transformation from the B2 parent phase to martensitic phases (P21/m and Cm) below 150 °C. We clarified the effect of the thermal cycling on the morphology and crystallography of martensite in equiatomic CuZr alloy using a transmission electron microscopy. The 10th cycled specimens consisted of different multiple structures at the maximum temperature of differential scanning calorimetry (DSC) measurement −400 °C and 500 °C, respectively. At the maximum temperature 400 °C of DSC measurement, it is composed of the fine plate-like variants, and a lamellar eutectoid structure consisting of Cu10Zr7 and CuZr2 phases on the martensitic variant. Concerning the maximum temperature of 500 °C of DSC measurement, it is observed the martensitic structure and the lamellar structure in which the martensitic phase was completely eutectoid transformed. The formation of this lamellar eutectoid structure, due to thermal cycling leads to the shift of forward and reverse transformation peaks to low and high temperature side. In addition, new forward and reverse transformation peaks indicating a new transformation appeared by thermal cycling, and the peaks remained around −20 °C. This new martensitic transformation behavior is also discussed.

1. Introduction

Near equiatomic Ti-Ni alloys are widely used as a shape memory alloy in the industrial and the medical fields. However, Ti-Ni alloy has a martensitic transformation near room temperature, the usable range is limited. In recent years, development of a new shape memory alloy that can be used even in a high temperature range is desired. Equiatomic CuZr alloy is expected as a high temperature shape memory material, since it undergoes martensitic transformation point over 100 °C [1,2,3,4,5,6,7,8,9,10,11]. This alloy shows a martensitic transformation from the B2 matrix (space group: Pm 3 ¯ m) to the two martensitic phases (space group: P21/m and Cm) at about 150 °C, and its reverse transformation temperature is around 265 °C [3,4,5]. One of the important characteristics required for practical application of shape memory alloy is a thermal cycling property. Koval et al. [3] reported the thermal cycling behavior of equiatomic CuZr alloy is what the transformation peaks shifted significantly, and additional peaks meaning new martensitic transformation appeared by electrical resistivity measurements. In addition, Biffi et al. [12] also investigated the thermal cycling property in detail on equiatomic CuZr alloy by differential scanning calorimetry (DSC) measurement as follows. The thermal cycling of equiatomic CuZr alloy provides that the reverse transformation start (As) temperature and the martensitic transformation start-temperature (Ms) shifted to the high and low temperature sides, respectively. It was also confirmed that the reverse transformation peak A and the martensitic transformation peak M disappear in the 7th cycle [12]. Alternatively, at the 4th cycle, new peaks A* and M* different from peaks A and M appeared, and then these new peaks remained around −20 °C at the 50th cycle. Although the changes in the macroscopic features and crystal structure accompanying these peaks have been investigated by scanning electron microscopy (SEM) observation and X-ray diffraction (XRD) measurement at varying the temperature, a detail microstructural characterization is not performed in nanoscopic scale. In this study, we aimed to clarify the effect of the thermal cycling on the morphology and crystallography of martensite in equiatomic CuZr alloy using a transmission electron microscopy (TEM).

2. Materials and Methods

Equiatomic CuZr alloy was prepared from pure copper (99.99%) and zirconium (99.2%) by arc melting in an argon atmosphere. The button ingots with 25 mm in diameter and about 8 mm in thickness were re-melted for eight times. The samples were homogenized in an argon quartz tube at 850 °C for 10 h, and annealed at 800 °C for 1h, followed by water-quenching. After that, the disc-shaped samples with a thickness of 500 μm to 1 mm were processed to a diameter of 3 mm by ultrasound machining (SBT380, meiwafosis, Osaka, Japan), and DSC measurement was performed ten times using a calorimeter (DSC 3500 Sirius, NETZSCH, Selb, Germany). The heating and cooling rates were 20 °C/min, and the ranges of measurement temperature were −100 °C to 550 °C. The constituent phases were examined by using an X-ray diffractometer (XRD, Smart Lab, Rigaku, Japan) with Ni-filtered Cu Kα radiation (a combination of Kα1 and Kα2, removing Kβ). For TEM studies, the samples ground to a thickness of 50 µm, were dimpled with a GATAN Model 656, and Ar-ion milled with a GATAN model 695 PIPSII. TEM observation was carried out with a JEM- 2100 PLUS (JEOL, Akishima, Japan), which was operated at 200 kV. The selected area diffraction patterns were taken through normal diffraction modes using the aperture with a physical diameter of 10 μm.

3. Results and Discussions

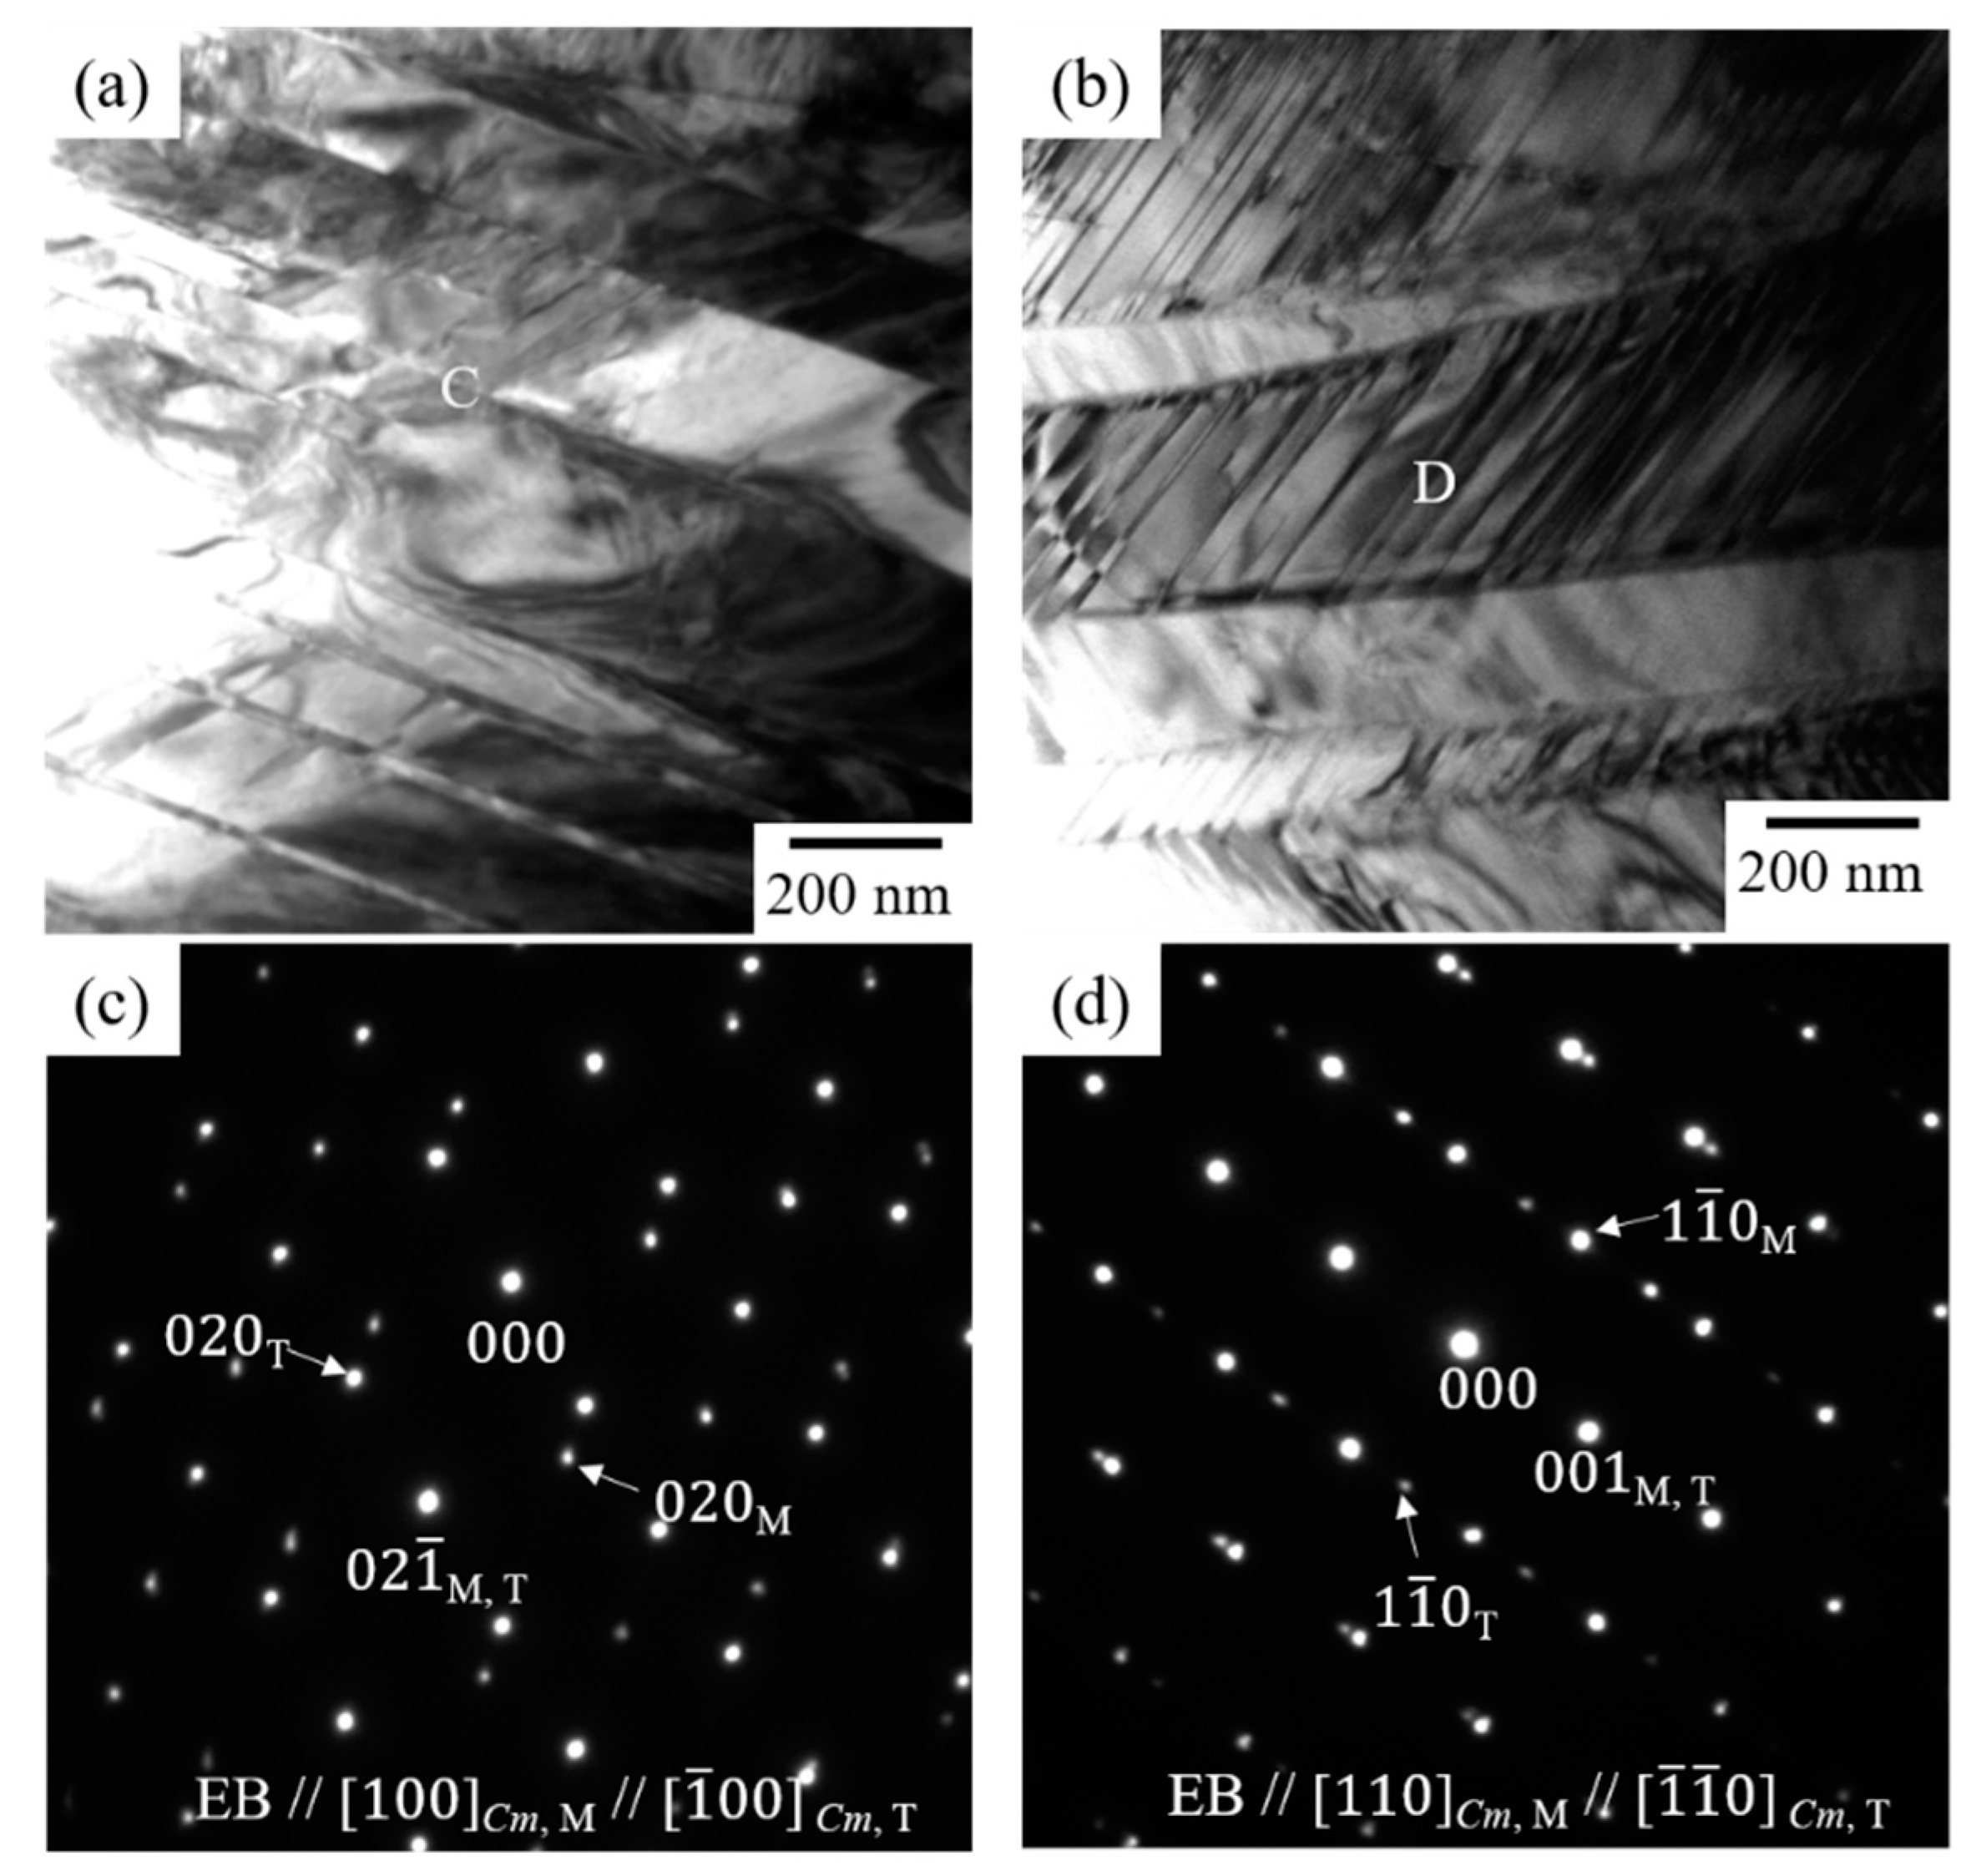
3.1. The Crystal Structure and Microstructural Feature of the Water-Quenched Equiatomic CuZr Alloy

In order to determine the lattice constants and the constituent phases in the water-quenched equiatomic CuZr alloy, we performed XRD measurements. The analysis by Reference intensity ratio method [13] using the results of XRD measurement showed that the volume fraction of each phase in water-quenched equiatomic CuZr alloy is CuZr: 84% (Cm: 64%, P21/m: 20%), Cu10Zr7: 8%, CuZr2: 1%, and Cu2Zr4O: 7%. The quantitative ratio of CuZr Cm: P21/m is about 3:1, being almost consistent with the previous research [9,14]. In addition, the refinement of the lattice constants by Pawley method [15] using the results of XRD measurement provides that the lattice constants of CuZr Cm and P21/m is a = 0.6336 nm, b = 0.8589 nm, c = 0.5311 nm, β = 105.1°, and a = 0.3309 nm, b = 0.4209 nm, c = 0.5253 nm, β = 104.2°. It showed good agreement with the previous study [3,4,5].
TEM observations were performed to investigate the microstructural feature and the crystal structure. Figure 1a,b shows the typical bright field images of the water-quenched equiatomic CuZr alloy. Martensitic variants with the plate-like morphology of 250 nm in average width are clearly observed in Figure 1a. The electron diffraction pattern in Figure 1c taken from the boundary C between martensitic variants in (a) consists of two sets of reflections from the [100]Cm zone axis that are in mirror symmetry with respect to the ( 02 1 ¯ )Cm plane, which is parallel to the interface of alternate plates in (a). This fact indicates that those plates are in ( 02 1 ¯ )Cm twin relations. In Figure 1b, there were also the fine martensitic variants having the width of about 30 nm within the plate-like morphology. The electron diffraction pattern in Figure 1d taken from the fine martensitic variant boundary D in (b) consists of two sets of reflections from the [110]Cm zone axis that are in mirror symmetry with respect to the (001)Cm plane, which is parallel to the interface of alternate plates in (b). This indicates that those plates are in (001)Cm twin relations. Those ( 02 1 ¯ )Cm and (001)Cm twins are defined as the Type I and compound twins, respectively [4,5,9]. The lattice constant estimated by electron diffraction patterns showed a value close to the one calculated by XRD. In the TEM observation of the water-quenched equiatomic CuZr alloy, the amount of P21/m structure was small and was not recognized in this study.

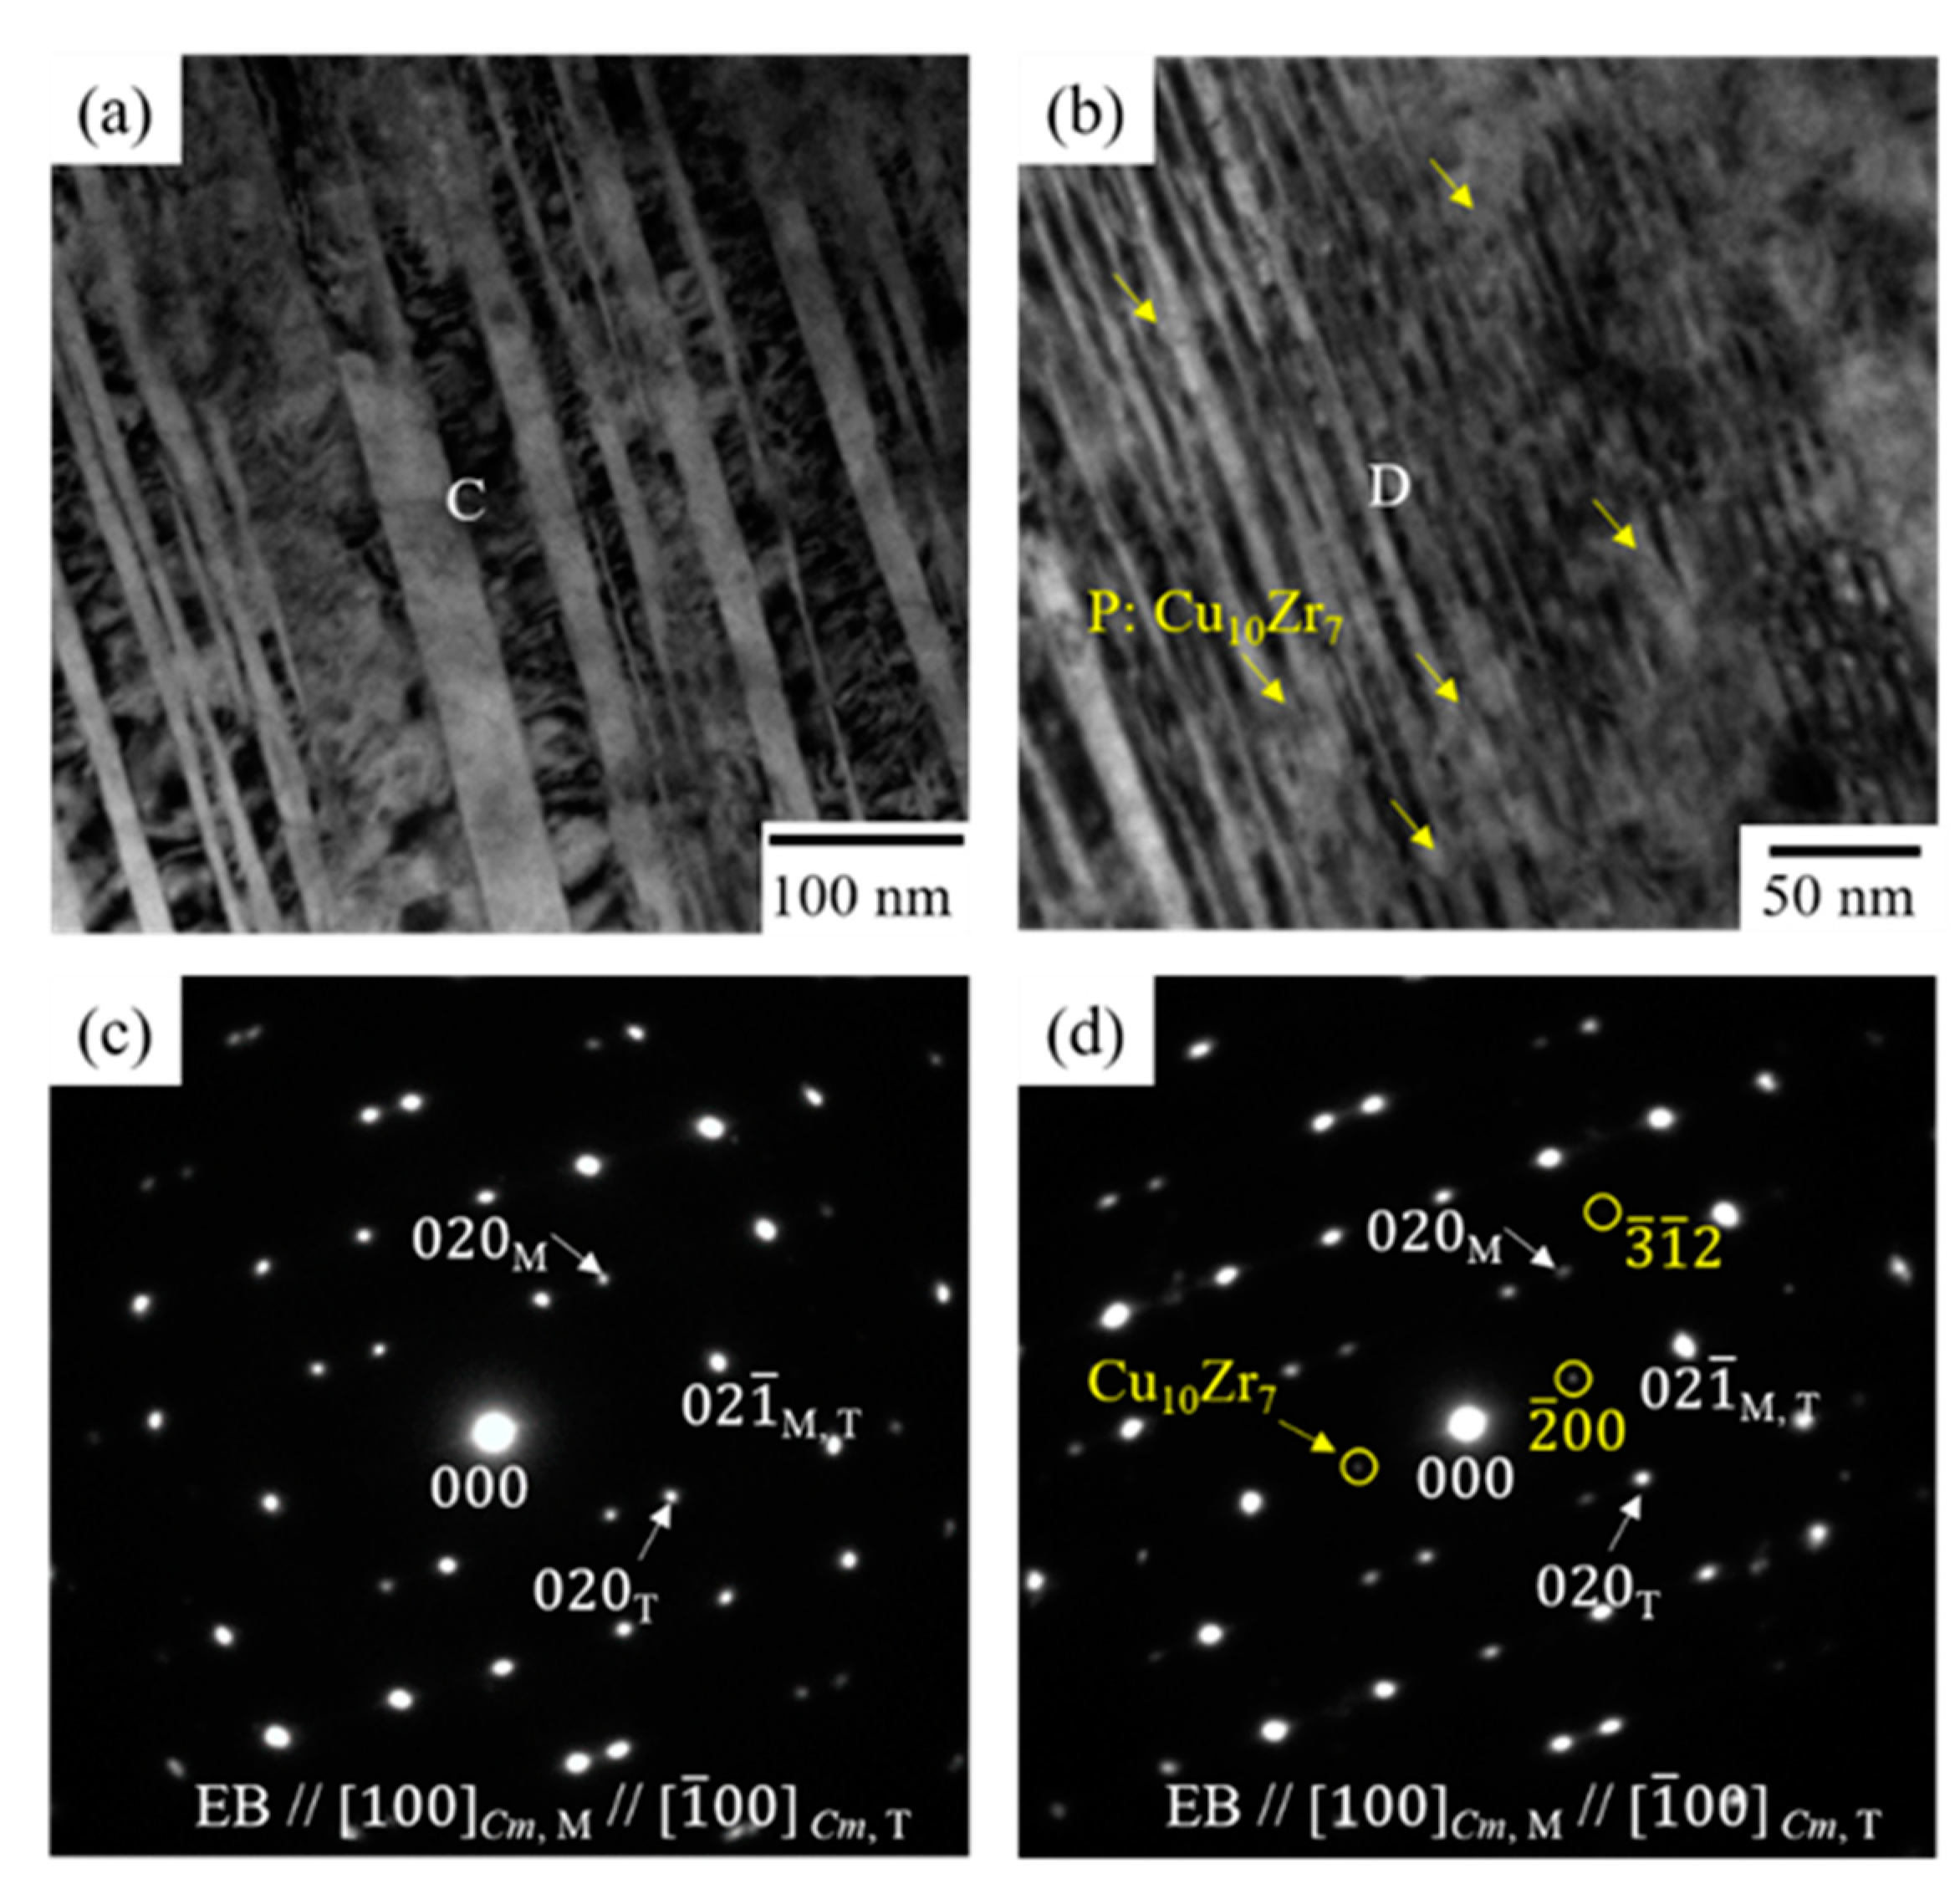
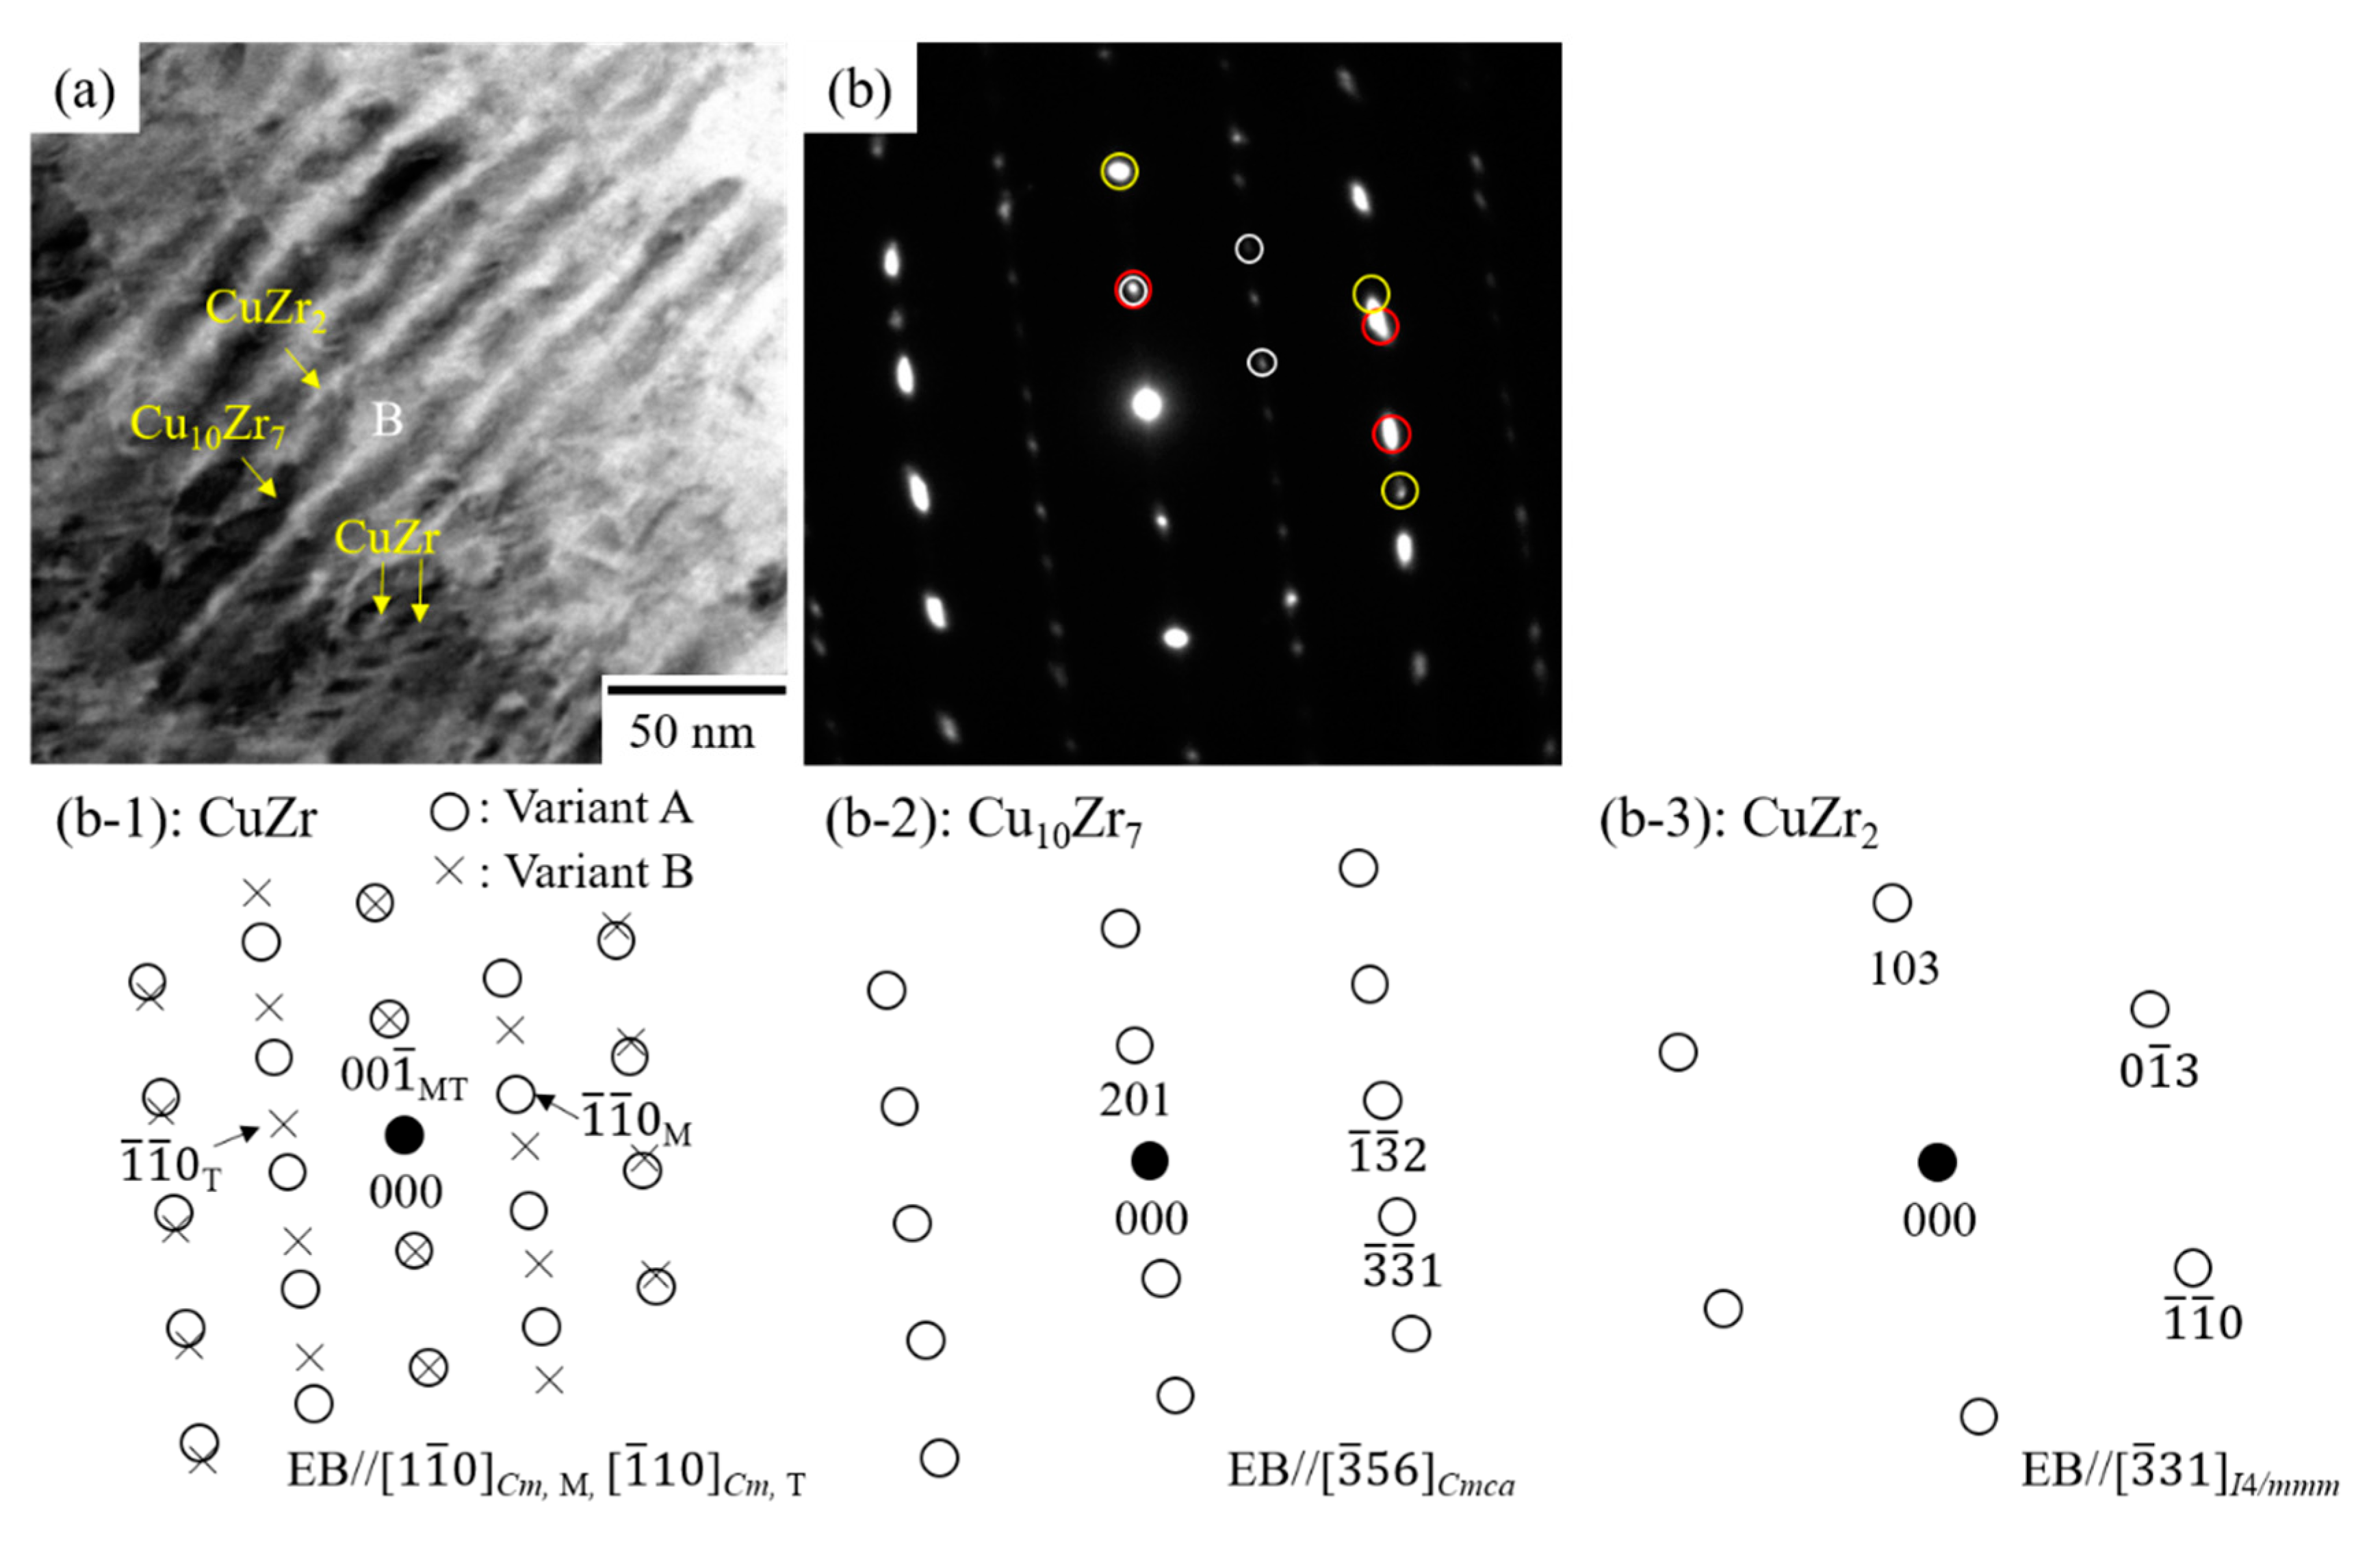
3.2. Effect of Thermal Cycling on the Microstructure in Equiatomic CuZr Alloy

Figure 2 shows the results of thermal cycling test in the water-quenched equiatomic CuZr alloy by using DSC measurement. The ranges of measurement temperature were −100 °C to 400 °C. The transformation start-temperature and the finish-temperature were both defined based on the intersection points of the baseline and the tangent at the inflection point. In Figure 2, there is an exothermic peak during cooling and an endothermic peak during heating. These peaks indicate that Ms and As are 135 °C and 261 °C in the water-quenched equiatomic CuZr alloy, which are almost the same as in the previous reports [3,12]. As the number of cycles increases, the peaks A and M shifted toward the high and low temperature side, respectively, as shown in Figure 2. Also, the areas of both peaks became smaller. At the 6th cycle in Figure 2, a pair of new endothermic A* and exothermic M* peaks appeared that would indicate reverse transformation and normal transformation, respectively. As the number of cycles increased, the areas of the new peaks increased, and the areas of A* and M* in the 10th cycle were estimated to be −3.01 J/g, and 2.01 J/g, respectively. In the previous study [12], the new peaks appeared at the 4th cycle, and the areas of both peaks A* and M* were 3.5 J/g, resulting in slightly different from this study. This should be due to slight differences in the ranges of measured temperature and rates; previous study: −100 to 450 °C, 10 °C/min, present study: −100 to 400 °C, 20 °C/min. There was no significant difference compared with a shift of the peaks A and M, and the appearance of new peaks A* and M*, due to the thermal cycling in the previous study.
Figure 3 and Figure 4 show the TEM observation results of the 10th cycled equiatomic CuZr alloy. In the bright field image of Figure 3a, many narrow variants with 7–40 nm in width are observed. The electron diffraction pattern in Figure 3c taken from the boundary C between martensitic variants in (a) indicates ( 02 1 ¯ )Cm type I twins along the [100]Cm zone axis. A large number of hazy contrasts crossing those variants exist in addition to fine elongated variants in the width of about 7 nm, as indicated by the yellow arrows in Figure 3b. The electron diffraction patterns in Figure 3d taken from the area D in (b) indicated additional spots to those associated with the ( 02 1 ¯ )Cm type I twins along the [100]Cm zone axis. This corresponds to the diffraction spots taken along [021]Cmca direction of Cu10Zr7 compound, meaning the presence of Cu10Zr7 precipitates. The lattice constant of Cu10Zr7 shows good agreement with the values described in the reference [16,17]: Space group: Cmca, lattice constant: a = 1.269 nm, b = 0.9314 nm, c = 0.9347 nm. Subsequently, the bright field image of another region in Figure 4a shows the complex contrasts; the lamellar structure with black and white contrasts and almost horizontal linear contrasts indicated by the arrows. The electron diffraction pattern of Figure 4b taken from area B in Figure 4a consists of four sets of reflections. A pair of reflections indicated by the white circles of Figure 4b is composed of a pattern of (001)Cm compound twins along the [1 1 ¯ 0]Cm zone axis in CuZr martensite, as shown in Figure 4(b-1). The remaining diffraction patterns indicated by the red and yellow circles of Figure 4b correspond to the patterns along the [ 3 ¯ 56]Cmca direction of Cu10Zr7 and [ 3 ¯ 31]I4/mmm along the CuZr2 compounds (space group: I4/mmm, lattice constant: a = 0.3220 nm, b = 0.3220 nm, c = 1.118 nm [18,19]), as shown in Figure 4(b-2,b-3), respectively. Based on the diffraction intensity of each phase and combination of the various dark-field imaging using diffraction spots originated from each phase, the lamellar structure with black and white contrasts indicates the Cu10Zr7 and CuZr2 phases, and almost horizontal linear contrasts indicate the CuZr martensite. This lamellar structure is considered that CuZr matrix experienced eutectoid decomposition into Cu10Zr7 and CuZr2 phases on the basis of binary Cu-Zr phase diagram [20]. This supports that thermal cycling causes the precipitate of Cu10Zr7 compounds and the eutectoid reaction. Therefore, a shift of the peaks A and M toward the high and low temperature side according to the thermal cycling is originated from the precipitate of Cu10Zr7 compounds and the eutectoid reaction.

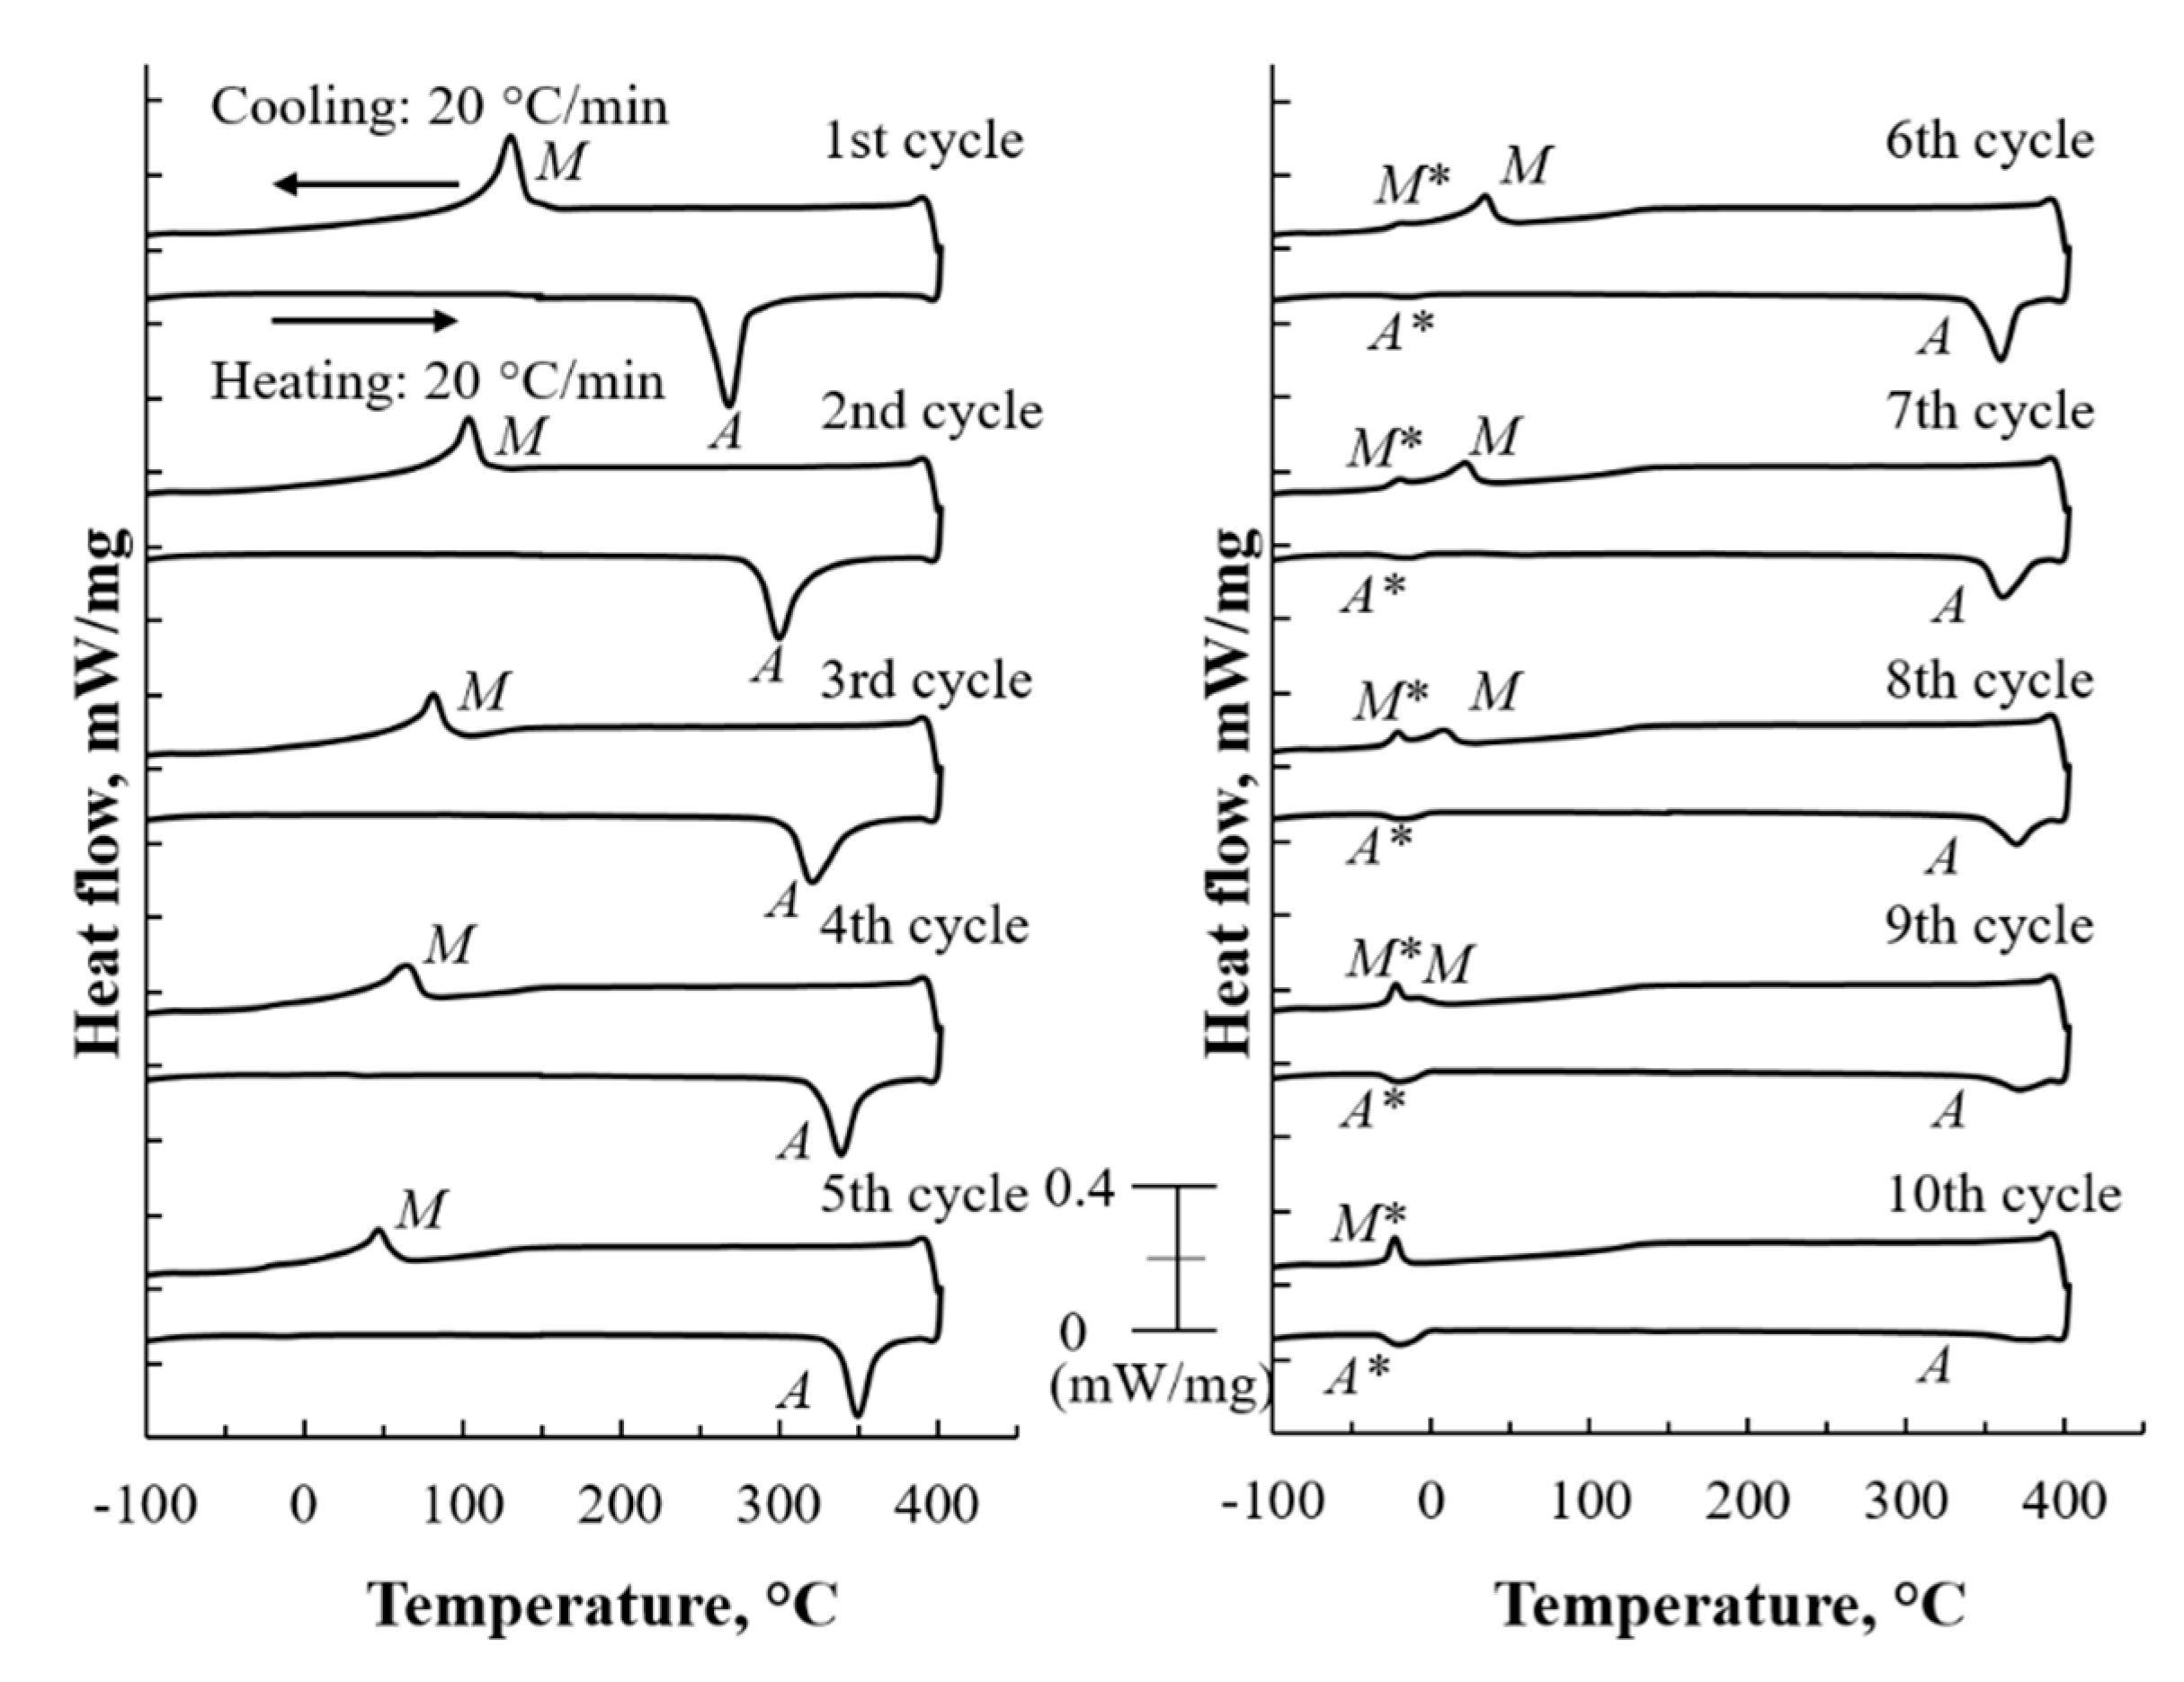
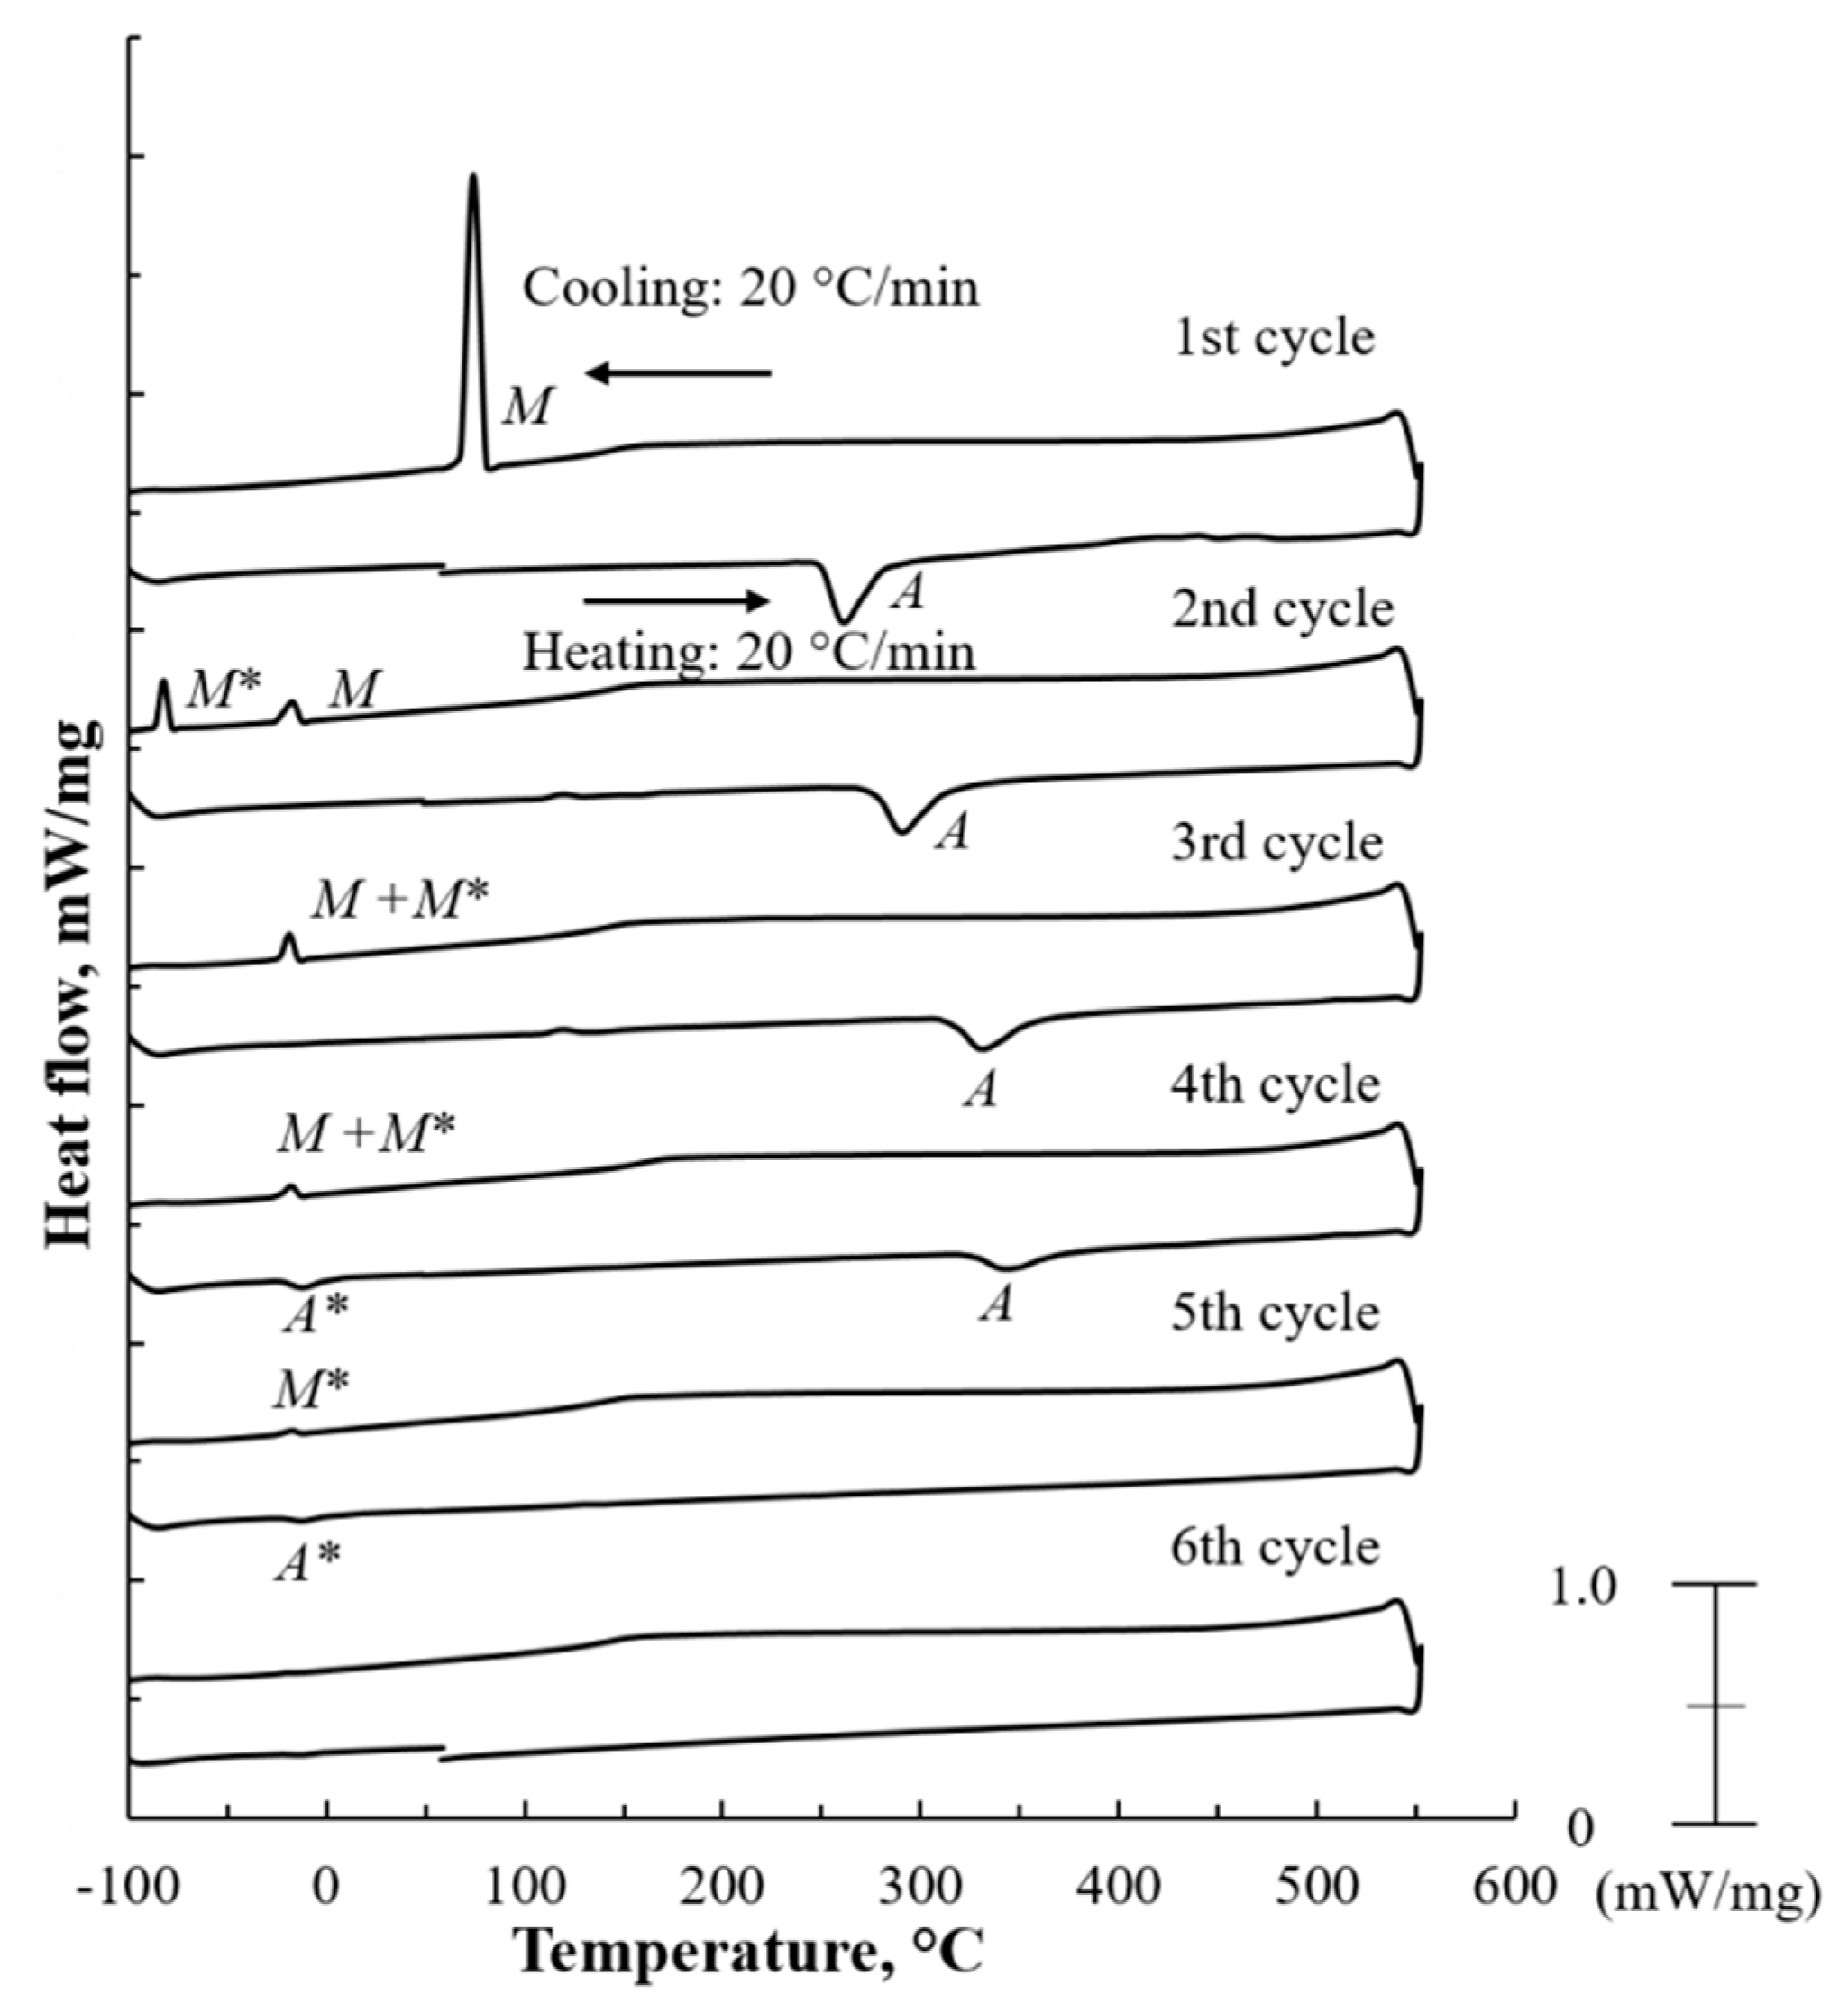
3.3. The Martensitic Transformation Behavior in Equiatomic CuZr Alloy Subjected to Thermal Cycling

The effects of new peaks A* and M* on the microstructural feature and crystal structure were investigated. First, a thermal cycling test was performed on the 10th cycled equiatomic CuZr alloy according to the following procedure by DSC measurement; R. T. → −100 °C → R. T. As a result, the transformation of M* to A* similar to the 10th cycle in Figure 2 was confirmed, and it was found that there was at least no relationship between the new peaks M* and M which shows from the B2 matrix (space group: Pm 3 ¯ m) to the two martensitic phases (space group: P21/m and Cm). From this, it is considered that the peak M* is generated by the transformation from the martensitic phases with Cm and P21/m structure. Firstly, in order to confirm whether Cm structure is transformed by new peak M*, in-situ cooling TEM observation was performed at the regions which combined with both the precipitates and martensitic structure or existed only martensitic structure. As a result, it was found that there was no difference between the observation at room temperature and −150 °C meaning that the region having the Cm structure was not transformed. From these results, although it has become clear that the precipitates affect the transformation behavior, the new phase cannot be clearly distinguished by the mixture with the precipitate. Therefore, by changing the temperature range of the thermal cycling test by DSC measurement, the amount of precipitates is increased, and we tried to make the microstructure where precipitates and martensite phase were mixed become perfect eutectoid structure.
Figure 5 shows the DSC curves of 10th cycled equiatomic CuZr alloy with the ranges of measurement temperature were −100 °C to 500 °C. It is apparent that peak A and M disappears completely, and new peak A* and M* exists around −20 °C. Furthermore, Figure 6 shows the DSC curves until 6th thermal cycles. It is noted that a new peak corresponding to M* appeared at 2nd cycle, followed by the combination with the peak M at the 3rd cycle, and then those peaks disappeared at the 6th cycle. These results support the contention that martensitic transformation related to each peak A, M, A* and M* are finally inhibited as a eutectoid reaction, due to thermal cycling proceeds. That is, the remaininng martensite with Cm and P21/m structure except for the precipitated and lamellared regions formed by thermal cycling is considered to be closely associated with the new peak A* and M*, and it was found that the new peak of M* was kept to around −20 ° C, due to the formation of precipitates accompanying the thermal cycling test.
In order to investigate the effect of the thermal cycling test shown in Figure 5 and Figure 6 on the structure, TEM observation was performed. As a result, there were the structures where eutectoid decomposition of CuZr phase proceeded and did not. Figure 7 and Figure 8 show the results of TEM observation after 10 thermal cycling tests in equiatomic CuZr alloy by DSC measurement at a maximum temperature of 500 °C. In the bright-field images in Figure 7a and Figure 8a, the only lamellar structure and the only martensitic structure were observed, respectively. The electron diffraction pattern in Figure 7b taken from the lamellar structure in (a) consists of three sets of reflections. Two sets of reflection shown in Figure 7(b-1) indicates the patterns stemming from two variants along the [100]Cmca zone axis in Cu10Zr7 phase. The remaining pattern is composed of the diffraction pattern from the [ 0 1 ¯ 0 ]I4/mmm zone axis in CuZr2, as shown in Figure 7(b-2). The orientation relationship between Cu10Zr7 and CuZr2 was [100]Cmca // [ 010 ]I4/mmm; (011)Cmca // ( 001 )I4/mmm. In-situ cooling TEM observation was performed in this fully lamellered structure, providing that no microstructural changes were observed by cooling to −150 °C below peak M* as expected. In addition, TEM observation after the thermal cycling test in Figure 6 shows that the eutectoid structure is totally formed. Therefore, we focused on the remaining martensitic regions after 10th thermal cycling.
Figure 8 shows the TEM images of in-situ cooling observation from room temperature to −150 °C. The electron diffraction patterns in Figure 8(c-1,c-2) taken from the martensitic variant in (a) indicated the [010]P21/m and [101]P21/m zone axes in CuZr. The lattice constants of P21/m in 10th thermal cycled specimen is estimated as a = 0.334 nm, b = 0.415 nm, c = 0.516 nm, β = 107.1° from electron diffraction patterns. Compared with those of the water-quenched specimen, which are a = 0.331 nm, b = 0.421 nm, c = 0.525 nm, β = 104.2°, these values are a little difference. This should be due to the difference in the alloy composition of matrix accompanying eutectoid decomposition by thermal cycling test. Figure 8b shows the bright field image in the same location as (a) in the specimen cooled until −150 °C. No change of morphology of martensitic variant was observed between R. T. and −150 °C. However, it is noted that d values and the angle between planes shown in Figure 8(d-1,d-2) are much different from those of Figure 8(c-1,c-2). Based on the electron diffraction patterns taken from another martensitic variant at −150 °C, the lattice constants of martensite at −150 °C are a’ = 0.338 nm, b′ = 0.422 nm, c’ = 0.530 nm, β′ = 109.1°. Comparing the change of the lattice constant at room temperature and −150 °C, the results are a’ = a + 0.004 nm, b′ = b + 0.007 nm, c’ = c + 0.014 nm, β′ = β + 2.0°. These results indicate that c-axis and β angle move largely, and a- and b- axes hardly move. Figure 9 shows the schematic illustration of a unit cell showing change of the lattice constant accompanying with heating and cooling. Usually, the metals are known to shrink during cooling. However, the change of the lattice constant obtained from present in-situ cooling observation was not shrinking but expanding of a unit cell. From the above results, the change of the lattice constant, due to cooling is associated with the new peak M*, that is, new martensitic transformation around −20 °C. From the change of the lattice constant, it is clear that the c-axis and β angle largely moved compared to a- and b-axes through the new martensitic transformation, and it is predicted that the atoms existed in the (110)B2 plane in B2 parent phase have moved further, as indicated by the arrows of the schematic diagram at −150 °C in Figure 9. Ti-Ni and Ti-Pt alloys [21,22] which is one of shape memory alloys have the shear-shuffling mechanism of (110) [ 1 1 ¯ 0 ]B2 in general, supporting that this new martensitic transformation is caused by the further movement of the (110)B2 plane in B2 parent phase; that is, the significant change of c-axis and β angle. Furthermore, small transformation strain evaluated from the change of lattice constants seen in Figure 9 provides the small thermal hysteresis of the new peaks M* and A*, leading to the no change of morphology in the whole variants compared with Figure 8a,b. This new martensitic transformation at low temperature is considered to be closely related to the strain and stress caused by thermal cycling. During this new martensitic transformation, the P21/m structure was transformed instead of the Cm structure. Concerning the crystal structure of new martensite at low temperature, P2 or P21 which is a subgroup of P21/m is mentioned as an option of the space group. Otherwise, it might indicate a tendency to further transformation from the P21/m structure to Cm structure by strain and stress, due to thermal cycling. Although the amount of deformation of this new martensite caused by thermal cycling is so small, the transformation temperature keeps constant below room temperature, and the thermal hysteresis is much small. Materials design for controlling this new martensitic transformation behavior accompanied by thermal cycling and training treatment could be possible to lead to the shape memory alloy of low temperature type in the future.

4. Conclusions

In this study, we investigated the microstructure and martensitic transformation behavior in thermal cycled equiatomic CuZr shape memory alloy using TEM. The obtained results are summarized as follows.
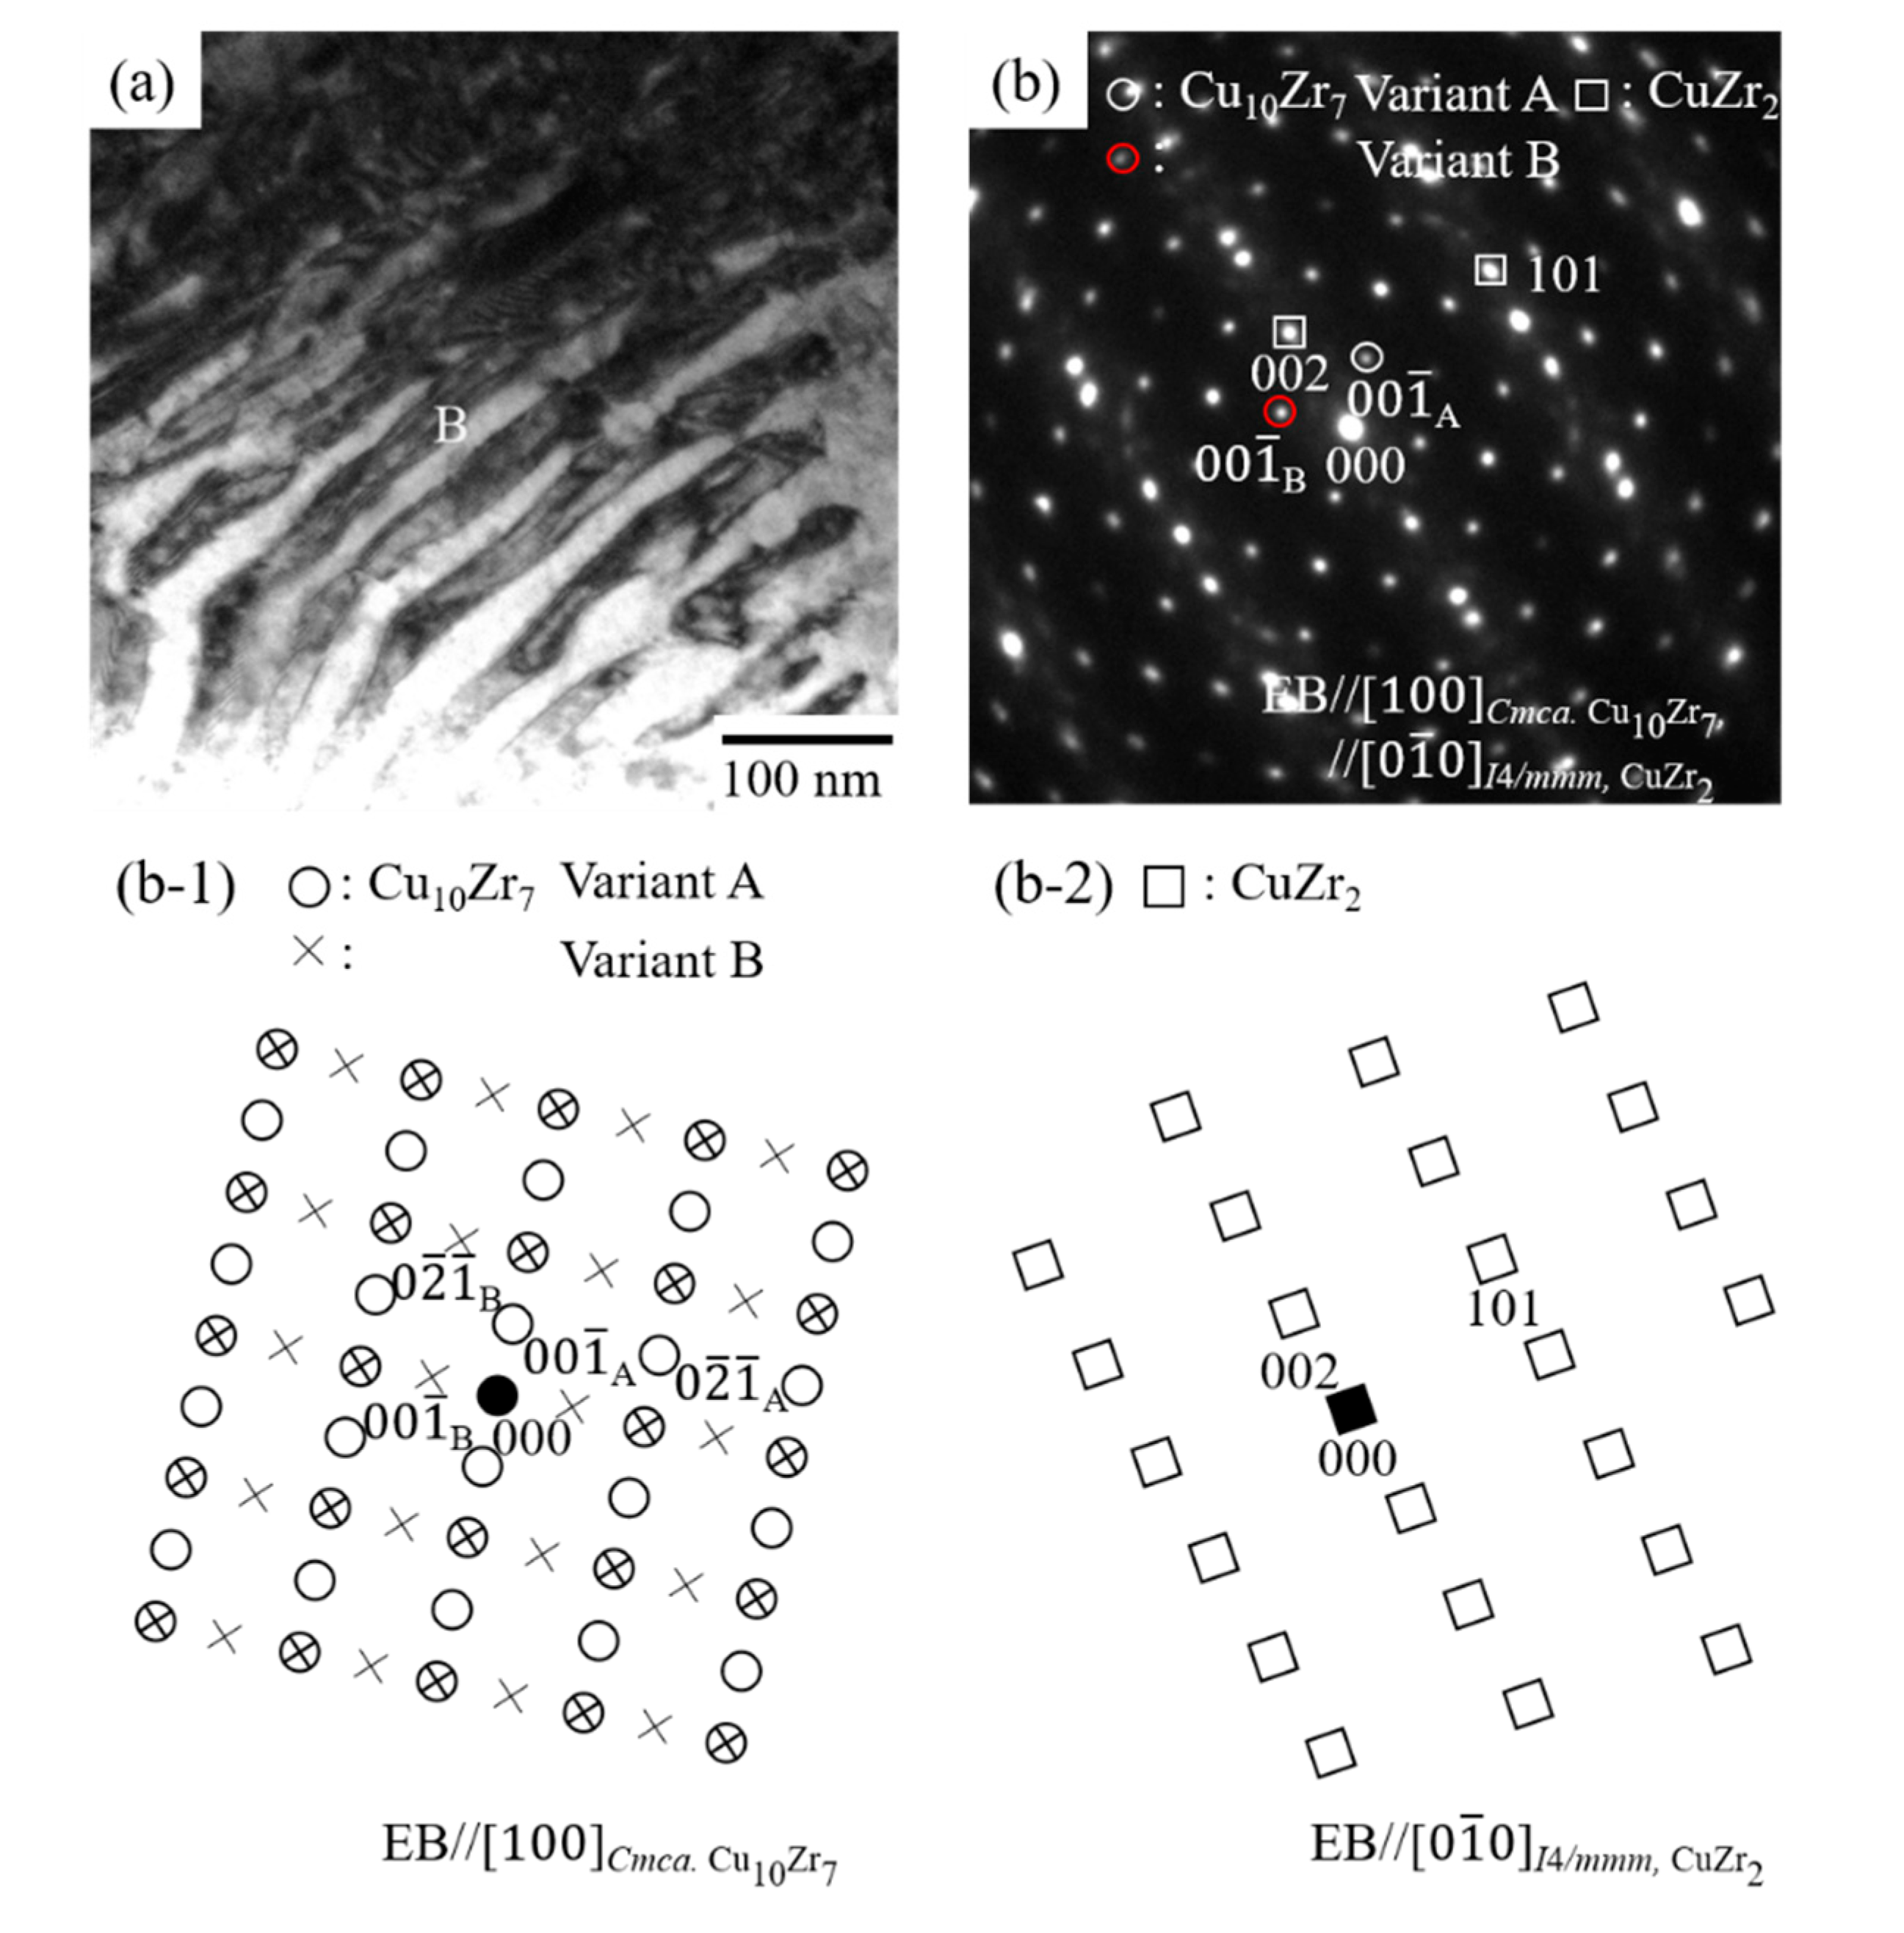
  • In the 10th cycled equiatomic CuZr alloy (the temperature range of DSC measurement: −100 °C to 400 °C), three structures were observed by TEM; I: The martensitic variant, II: The structure in which Cu10Zr7 precipitates exist inside the martensitic variant, III: The structure in which the lamellar consisting of Cu10Zr7 and CuZr2 phases and martensitic variants are mixed. TEM observation of the 10th cycled equiatomic CuZr alloy (the temperature range of DSC measurement: −100 °C to 500 °C) showed two structures; I: The martensitic variant, II: The lamellar structure in which the CuZr martensitic phase was completely eutectoid transformed. This fact indicated that the eutectoid decomposition occurred in equiatomic CuZr alloy during the thermal cycling.
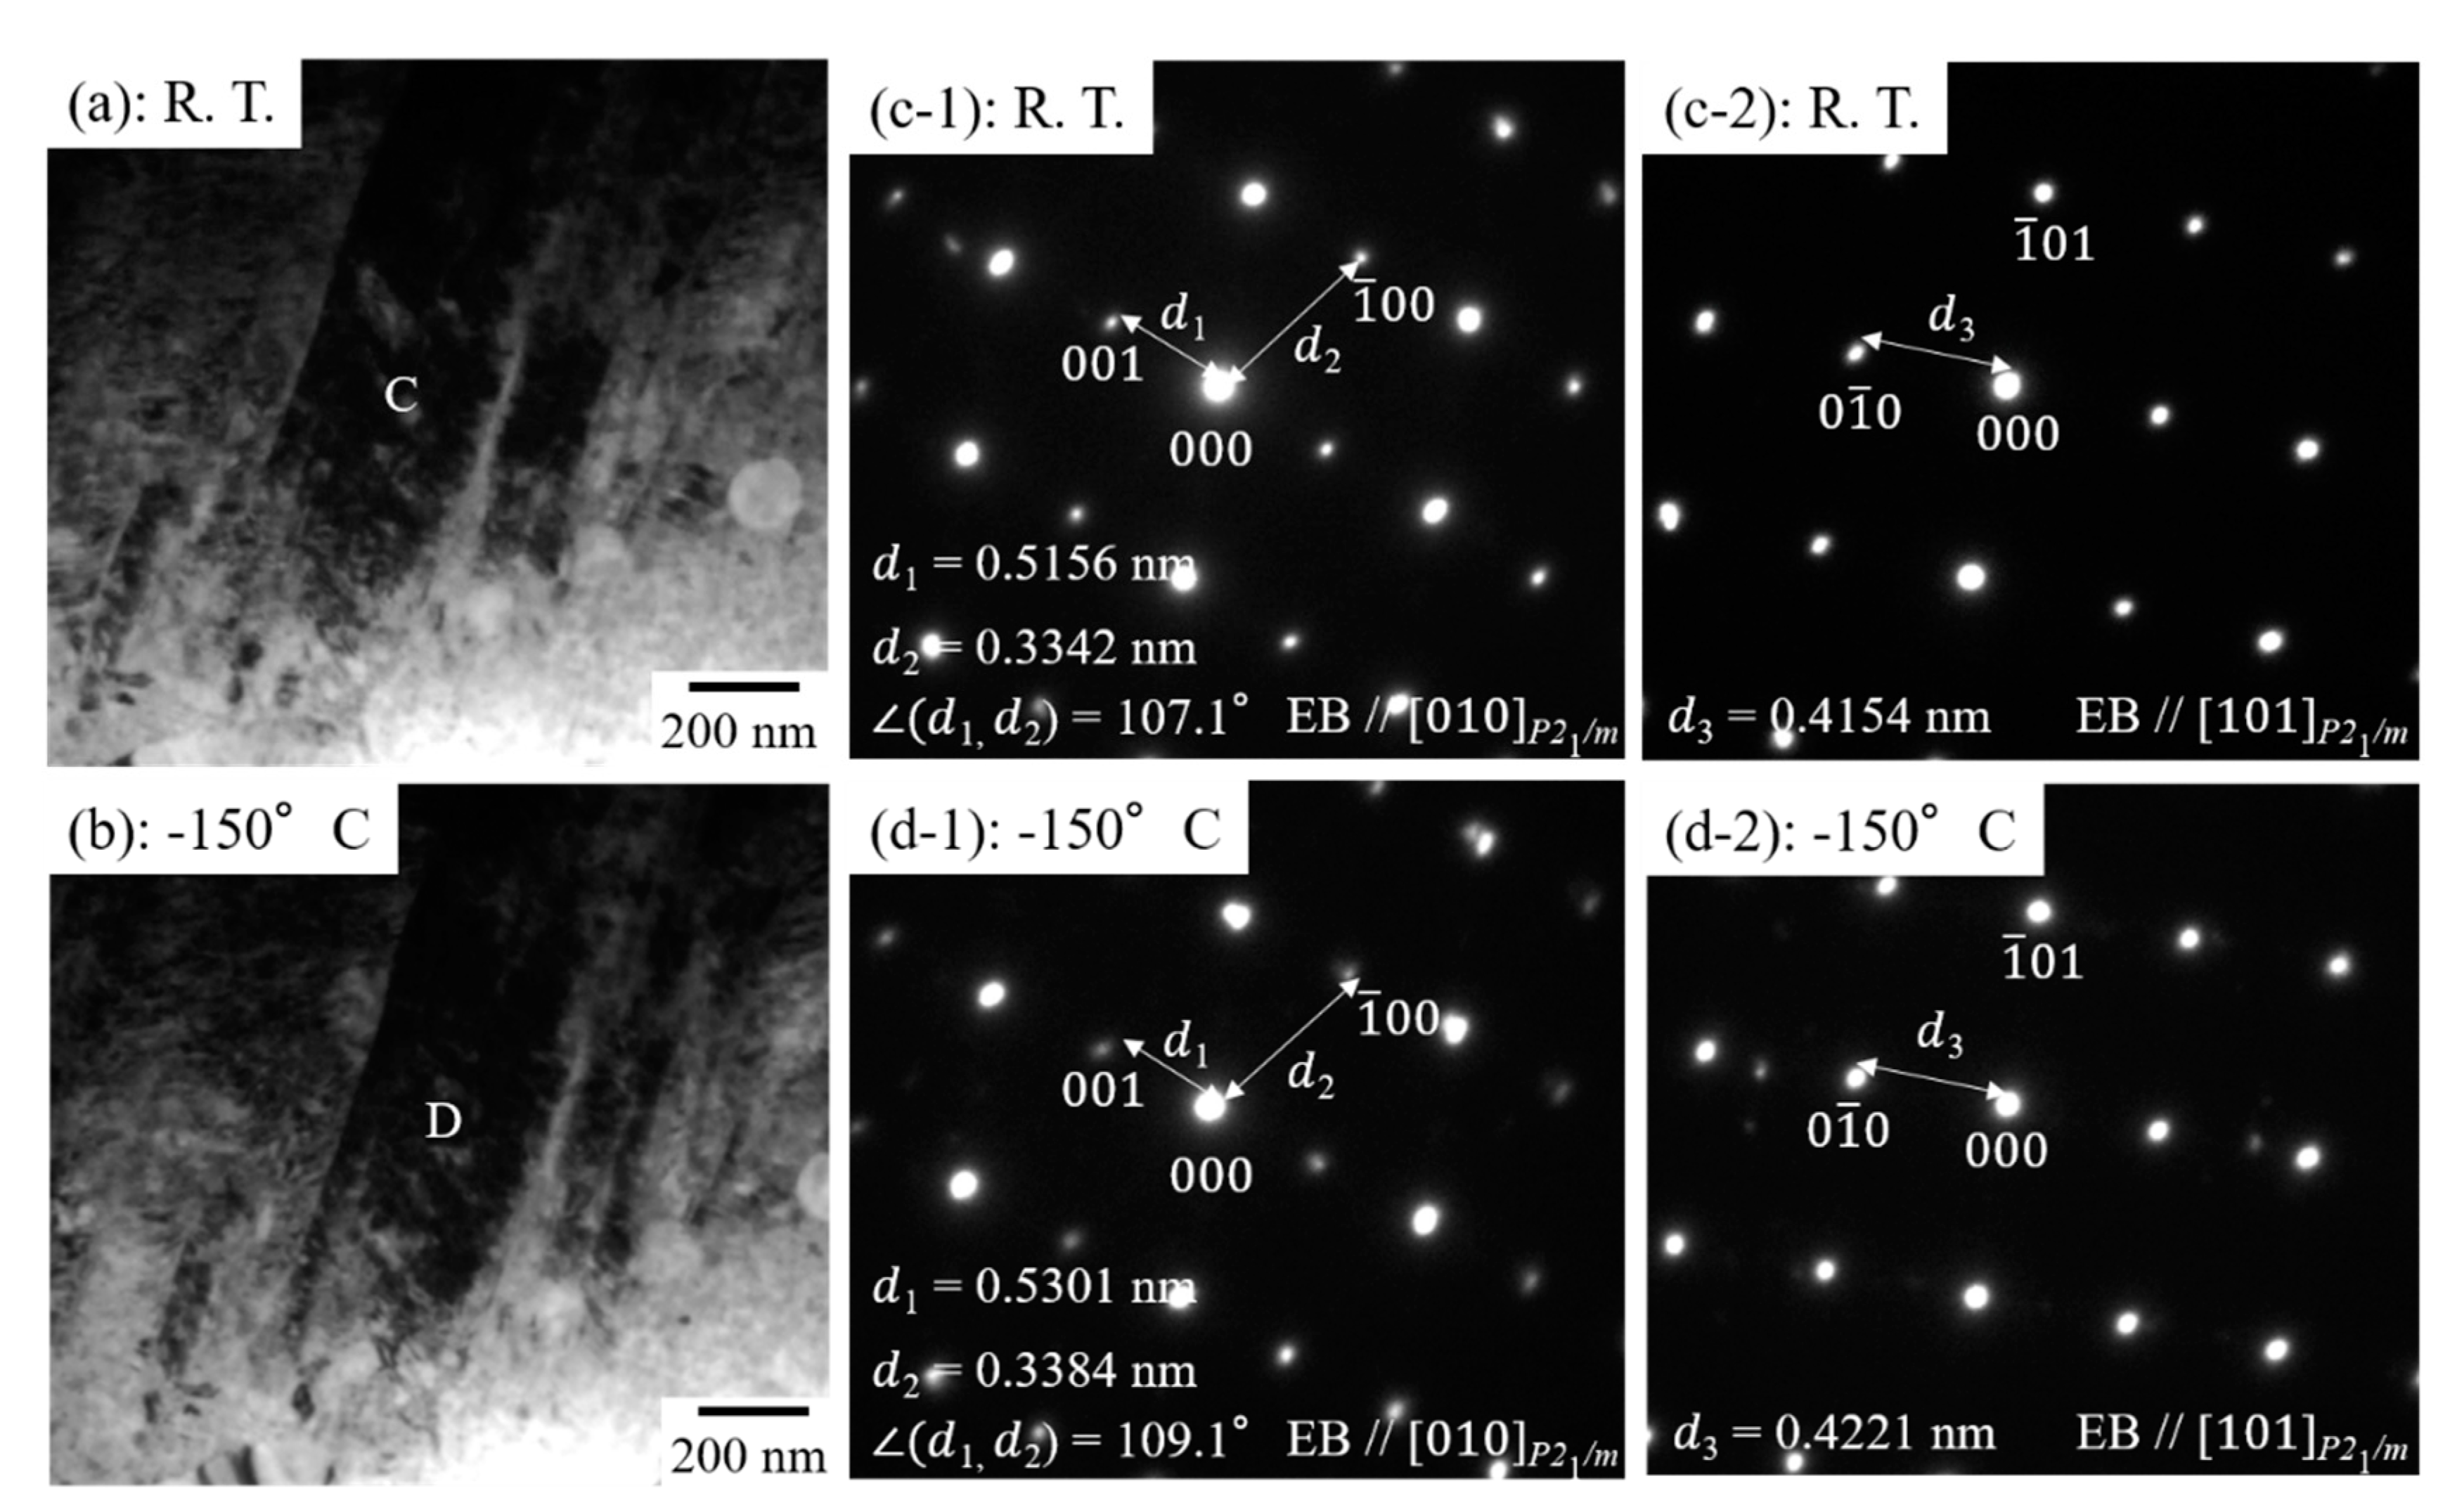
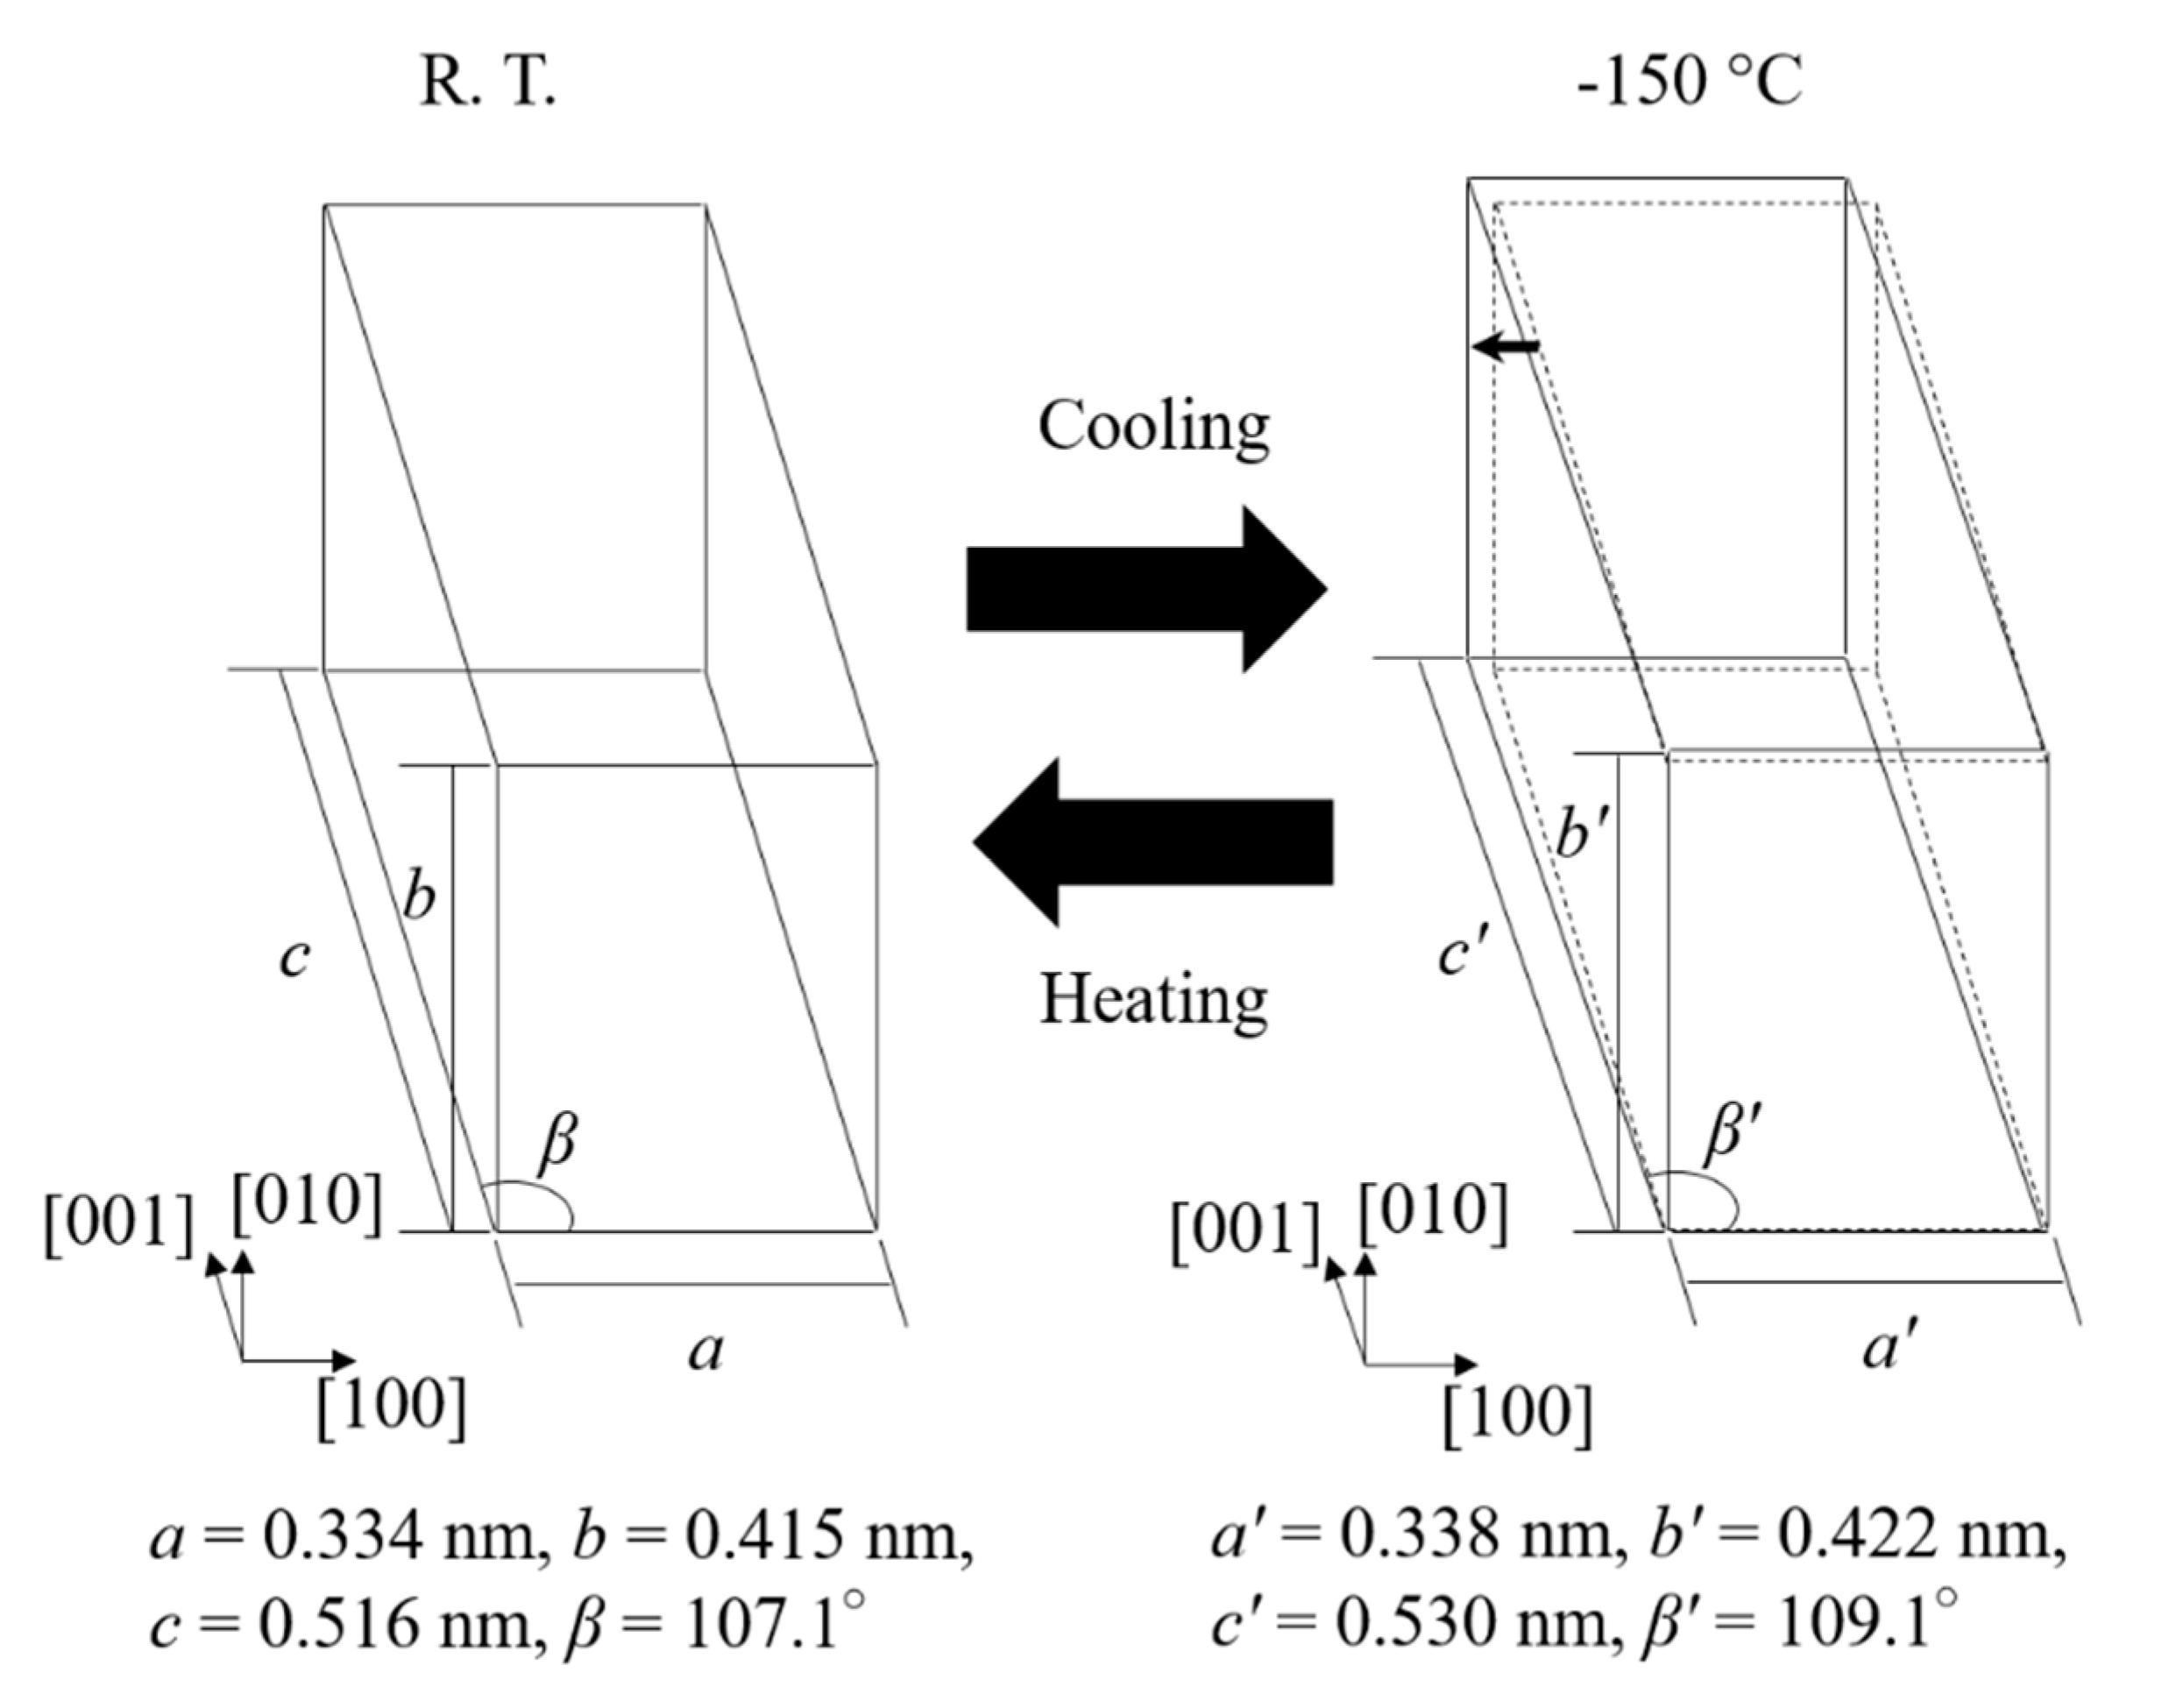
  • When the martensitic variant having P21/m (lattice constant: a = 0.334 nm, b = 0.415 nm, c = 0.516 nm, β = 107.1°) of 10th cycled equiatomic CuZr alloy was cooled from room temperature to −150 °C, the change in the crystal structure corresponding to the new peak M* occurred, and the lattice constant was a’ = 0.338 nm, b′ = 0.422 nm, c’ = 0.530 nm, β′ = 109.1°. This new martensitic transformation at low temperature is considered to be closely related to the strain and stress caused by thermal cycling.

Author Contributions

S.H., M.M., and M.N. conceived and designed the experiments; S.H and M.M. performed the experiments, analyzed the data, wrote original draft preparation; M.N., C.A.B., and A.T. wrote review and editing.

Conflicts of Interest

The authors declare no conflict of interest.

References

  1. Carvalho, E.M.; Harris, I.R. Constitutional and structural studies of the intermetallic phase, ZrCu. J. Mater. Sci. 1980, 15, 1224–1230. [Google Scholar] [CrossRef]
  2. Koval, Y.N.; Firstov, G.S.; Kotko, A.V. Martensitic transformation and shape memory effect in ZrCu intermetallic compound. Scr. Metall. Mater. 1992, 27, 1611–1616. [Google Scholar] [CrossRef]
  3. Schryvers, D.; Firstov, G.S.; Seo, J.W.; Van Humbeeck, J.; Koval, Y.N. Unit cell determination in CuZr martensite by electron microscopy and X-ray diffraction. Scr. Mater. 1997, 36, 1119–1125. [Google Scholar] [CrossRef]
  4. Seo, J.W.; Schryvers, D. TEM investigation of the microstructure and defects of CuZr martensite. Part I: Morphology and twin systems. Acta Mater. 1998, 46, 1165–1175. [Google Scholar] [CrossRef]
  5. Seo, J.W.; Schryvers, D. TEM investigation of the microstructure and defects of CuZr martensite. Part II: Planar defects. Acta Mater. 1998, 46, 1177–1183. [Google Scholar] [CrossRef]
  6. Firstov, G.S.; Van Humbeeck, J.; Koval, Y.N. High-temperature shape memory alloys some recent developments. Mater. Sci. Eng. A 2004, 378, 2–10. [Google Scholar] [CrossRef]
  7. Zhou, S.H.; Napolitano, R.E. Identification of the B33 martensite phase in Cu-Zr using first-principles and X-ray diffraction. Scr. Mater. 2008, 59, 1143–1146. [Google Scholar] [CrossRef]
  8. Song, K.K.; Pauly, S.; Zhang, Y.; Gargarella, P.; Li, R.; Barekar, N.S.; Kühn, U.; Eckert, J. Strategy for pinpointing the formation of B2 CuZr in metastable CuZr-based shape memory alloys. Acta Mater. 2011, 59, 6620–6630. [Google Scholar] [CrossRef]
  9. Meng, X.; Gao, W.; Gao, Z.; Cai, W.; Zhao, L. Substructure and interface of the superstructure martensite in Zr50Cu50 High temperature shape memory alloy. Mater. Lett. 2014, 117, 221–224. [Google Scholar] [CrossRef]
  10. Biffi, C.A.; Figini, A.; Tuissi, A. Influence of compositional ratio on microstructure and martensitic transformation of CuZr shape memory alloys. Intermetallics 2014, 46, 4–11. [Google Scholar] [CrossRef]
  11. Gao, W.; Yi, X.; Sun, B.; Meng, X.; Cai, W.; Zhao, L. Microstructural evolution of martensite during deformation in Zr50Cu50 shape memory alloy. Acta Mater. 2017, 132, 405–415. [Google Scholar] [CrossRef]
  12. Biffi, C.A.; Coduri, M.; Yoshida, H.; Soejima, Y.; Nishida, M.; Tuissi, A. The effect of thermal cycling on the martensitic transformation in equiatomic CuZr shape memory alloy. J. Alloy. Compd. 2015, 653, 591–595. [Google Scholar] [CrossRef]
  13. Hubbard, C.R.; Evans, E.H.; Smith, D.K. The reference intensity ratio, I/Ic, for computer simulated powder patterns. J. Appl. Cryst. 2002, 9, 169–174. [Google Scholar] [CrossRef]
  14. Kosorukova, T.; Firstov, G.; Koval, Y.; Verhovlyuk, P.; Van Humbeeck, J.; Noel, H. Structural phase transformations and shape memory effect in ZrCu along with Ni and Hf additions. MATEC Web Conf. 2015, 33, 06005. [Google Scholar] [CrossRef] [Green Version]
  15. Pawley, G.S. Unit-cell refinement from powder diffraction scans. J. Appl. Crystallogr. 1981, 14, 357–361. [Google Scholar] [CrossRef] [Green Version]
  16. Glimois, J.L.; Forey, P.; Feron, J.; Becle, C. Structural investigations of the pseudo-binary compounds Ni10−xCuxZr7. J. Less Common Met. 1981, 78, 45–50. [Google Scholar] [CrossRef]
  17. Biffi, C.A.; Figini, A.; Tuissi, A. Synthesis and structural analysis of Cu10Zr7. J. Alloy. Compd. 2012, 544, 42–45. [Google Scholar]
  18. Du, J.; Wen, B.; Melnik, R.; Kawazoe, Y. Phase stability, elastic and electronic properties of Cu-Zr binary system intermetallic compounds: A first-principles study. J. Alloy. Compd. 2014, 588, 96–102. [Google Scholar] [CrossRef]
  19. Bykov, V.A.; Kulikova, T.V.; Yagodin, D.A.; Filippov, V.V.; Shunyaev, K.Y. Thermophysical and electrical properties of equiatomic CuZr alloy. Phys. Met. Metallogr. 2015, 116, 1067–1072. [Google Scholar] [CrossRef]
  20. Zhao, Y.; Pang, T.; He, J.; Tao, X.; Chen, H.; Ouyang, Y.; Du, Y. Interdiffusion behaviors and mechanical properties of Cu-Zr system. Calphad 2018, 61, 92–97. [Google Scholar] [CrossRef]
  21. Otsuka, K.; Ren, X. Recent developments in the research of shape memory alloys. Intermetallics 1999, 7, 511–528. [Google Scholar] [CrossRef]
  22. Rotaru, G.M.; Tirry, W.; Sittner, P.; Van Humbeeck, J.; Schryvers, D. Microstructural study of equiatomic PtTi martensite and the discovery of a new long-period structure. Acta Mater. 2007, 55, 4447–4454. [Google Scholar] [CrossRef]
Figure 1. (a,b) Bright field images of water-quenched equiatomic CuZr alloy, and (c,d) electron diffraction patterns taken from the boundary C between martensitic variants in (a), and from the fine martensitic variants boundary D within the plate-like morphology in (b), respectively.
Metals 09 00580 g001
Figure 2. DSC cooling and heating curves of water-quenched equiatomic CuZr alloy from the first to 10th thermal cycles. (Measured max temperature—400 °C).
Metals 09 00580 g002
Figure 3. (a,b) Bright field images of 10th cycled equiatomic CuZr alloy, and (c,d) electron diffraction patterns taken from the boundary between martensitic variants in (a) and (b).
Metals 09 00580 g003
Figure 4. (a) Bright field images of 10th cycled equiatomic CuZr alloy, (b) electron diffraction patterns taken from the (a), and (b-1)–(b-3) schematic of electron diffraction patterns in (c).
Metals 09 00580 g004
Figure 5. DSC cooling and heating curves of 10th cycled equiatomic CuZr alloy with maximum temperature of 500 °C.
Metals 09 00580 g005
Figure 6. DSC cooling and heating curves of water-quenched equiatomic CuZr alloy from the first to 6th thermal cycles (Measured max temperature—550 °C).
Metals 09 00580 g006
Figure 7. (a) Bright field image of 10th cycled equiatomic CuZr alloy, (b) electron diffraction pattern is taken from the (a), and (b-1)–(b-2) schematic of electron diffraction patterns in (b). (The measured maximum temperature at DSC measurement is 500 °C.).
Metals 09 00580 g007
Figure 8. (a,b) Bright field images of 10th cycled equiatomic CuZr alloy at R. T., and −150 °C, and (c-1,2)–(d-1,2) electron diffraction patterns taken from the martensitic variants C in (a), and D in (b), respectively. (The measured maximum temperature at DSC measurement is 500 °C).
Metals 09 00580 g008
Figure 9. The change of lattice constant in the martensitic phase (R. T.) to the new phase (−150 °C) of 10th cycled CuZr alloy.
Metals 09 00580 g009

