CMT Additive Manufacturing of a High Strength Steel Alloy for Application in Crane Construction


1
Institute of Materials Science, Joining and Forming, Graz University of Technology, Graz 8010, Austria
2
Head of Corporate Welding Technology, Palfinger AG, Bergheim 5101, Austria
3
Faculty of Mechanical Engineering, University of Maribor, Maribor 2000, Slovenia
*
Author to whom correspondence should be addressed.
Metals 2019, 9(6), 650; https://doi.org/10.3390/met9060650
Submission received: 29 April 2019
/
Revised: 19 May 2019
/
Accepted: 23 May 2019
/
Published: 4 June 2019
(This article belongs to the Special Issue Arc-based Additive Manufacturing)
Abstract
:This work investigates the feasibility of manufacturing a near net shape structural part directly on a subassembly for application in crane construction without post-machining. Single- and multi-pass welding experiments, using the Cold Metal Transfer process (CMT), were executed to identify and verify suitable process parameters. The obtained parameters were then used to manufacture a wall structure and an optical measurement of the resulting geometry was performed. Mechanical properties of the all-weld metal in the as-built condition in different directions were determined. The results for tensile testing showed similar values to the filler material specifications and fracture toughness matched literature values, but a decrease of impact toughness was obtained. Although mechanical testing showed no significant anisotropy, hardness measurements showed the influence of the local temperature profile. Finally, strategies to manufacture a complex structural part were investigated. It was possible to establish a stable process to manufacture a section of the specified geometry in a first attempt. However, results indicate that there is still further work necessary to optimize this process and to investigate the influences on the mechanical properties of the final component.
1. Introduction
High strength steel alloys are the key for lightweight structures. Mobile cranes utilize their properties quite well, using mainly structural components that are manufactured as welding assemblies [1]. The use of high strength steel alloy plates in combination with a highly automated manufacturing process that includes techniques such as cutting, cold forming and welding, guarantee a competitive product regarding key figures like lifting capacity, payload, reach and overall weight of the crane [2,3]. Lightweight constructions enable an improvement in the ratio between lifting capacity and deadweight of the crane. However, to meet requirements regarding stability and fatigue, more complex constructions may be needed [4], which leads to elaborate welding assemblies. The fabrication of welding assemblies deals with limitations due to formability of the high strength steel plates in combination with welding heat or limited accessibility of the weld beads. Recent developments in additive manufacturing of metals using a gas metal arc welding process (GMAW) raised the question of whether this technology might be suitable for applications in crane construction to realize parts that are optimized regarding weight and stability.
Deposition of weld metal to create functional surfaces or structures is not new. Build-up welding is a common technique for surfacing or repair applications. The fundamental concept of creating specific shaped objects by arc-welding was first mentioned back in 1925 [5]. The combination of numerical controlled motion systems and modern welding processes led to the first use in a commercial application almost 30 years ago [6]. Recent developments in additive manufacturing of metals and new arc processes like the CMT process helped to attain widespread attention for the process, now widely referred to as Wire + arc additive manufacturing (WAAM) [7].
The CMT process [8] is an innovative GMAW process that was introduced by Fronius in 2004. It features digital process control and a special weld torch with integrated servomotor that allows it to withdraw the wire every time it contacts the melt pool. This movement supports the transfer of the metal droplet mechanically and thus reduces the heat input. The process provides various advantages, e.g., improved process stability, stable arc length, and reduced dilution. Furthermore, it is almost spatter free and it facilitates the droplet transfer for horizontal and out-of-position welds. These characteristics make it highly suitable for the WAAM process and it is therefore widely used in research projects [7] and also commercially applied [9].
WAAM is a near net shape process and usually requires post processing to achieve the required dimensional accuracy and surface finish to maintain the requested corrosion or fatigue behavior. To reduce the need for subtractive manufacturing even further, it is necessary to improve the accuracy of wire arc manufactured parts. For some geometry features, like hollow or partly closed structures, surface finishing might not be applicable at all due to limited accessibility. The combination of the additive and subtractive manufacturing steps is called “hybrid manufacturing” and can overcome some of these issues [10,11]. However, the term hybrid manufacturing may also refer to the additive manufacturing of structures onto preexisting conventional manufactured parts. An example for this approach is the MicroGussTM technology used for manufacturing buckets for Pelton Runners [6]. In the present work, the additive manufactured part is likewise manufactured directly on the surface of a subassembly instead of using sacrificial substrate plates. The part under consideration in the paper is built on prefabricated high strength steel components and includes features like corners, crossings, overhangs and inclined walls, which allow the investigation of the possibilities and limitations of the process.
2. Materials and Methods
An exemplary part was chosen to evaluate the feasibility of a wire arc additive manufactured component for crane construction. Figure 1 shows the structure that was manufactured by WAAM in yellow (referred to as AM-part) and the preexisting weld assembly that served as the substrate in grey. This weld assembly was made of the high-strength low-alloy steel S700MC according to ÖNORM EN 10149-2.
The filler material used to produce the WAAM-structure was Boehler X 90-IG, a micro alloyed solid wire for welding fine grained steels with a yield strength of 890 MPa [12]. This filler material is classified as G 89 6 M21 Mn4Ni2CrMo according to ÖNORM EN ISO 16834:2012. Table 1 and Table 2 show the reference analysis of the solid wire and the mechanical properties of the all-weld metal.
As a shielding gas, M21-ArC-18 according to ISO 14175:2008 with 18 vol. % CO2 and 82 vol. % Argon was used.
The used CMT system (Fronius International GmbH, Wels, Austria) consists of the welding power source Fronius TPS 400i with the push-pull torch set-up WF 60i Robacta Drive CMT and a wire buffer. The motion control system consists of a six-axis articulated robot ABB IRB 140, a positioner ABB IRBP A and the control system IRC5. The programming was performed with RAPID, a high-level programming language for controlling ABB industrial robots. The program runs on the ABB controller, which not only controls the robot movements but also communicates with the welding power source via a bus interface. While the programming for the preliminary tests and the wall structure was achieved using for-loops, the programming for the final part was done by exporting point-coordinates of the CAD-File. After creating the program, the tool path was double-checked via a visualization in MATLAB (R2017b, The MathWorks Inc., Natick, MA, USA), before starting the additive manufacturing process.
Five wall structures were created to determine the mechanical properties of the all-weld metal. Figure 2a shows a schematic of the set-up including build orientation and main influence parameters travel speed () and wire feed speed (). The real shape of the test walls and its deviation from the designed geometry was determined using the optical measurement system GOM ATOS (GOM GmbH, Braunschweig, Germany). Samples were taken from the walls to perform the following tests:
- Tensile Testing according to ÖNORM EN ISO 6892-1 in longitudinal and height direction. The samples were pre-stressed with 200 N and testing speed was set to 1 mm/min.
- Impact testing at room temperature according to ÖNORM EN ISO 148-1 with notch orientation in xy, xz, zx and zy-configuration.
- Hardness testing of the cross section according to ÖNORM EN ISO 6507. Measurements were performed using a load of 1 kp (HV1) and an indentation time of 15 s. The spacing between single indentations was 0.3 mm (exemplary Vickers diagonal: 0.065 mm–0.092 mm).
- Microstructure: light microscopy imaging of the etched cross section.
- Fracture toughness according to ASTM E1820-11 with notch orientation xy, xz, zx and zy.
3. Results
3.1. Parameter Study
To find suitable parameters, the following relationships were considered.
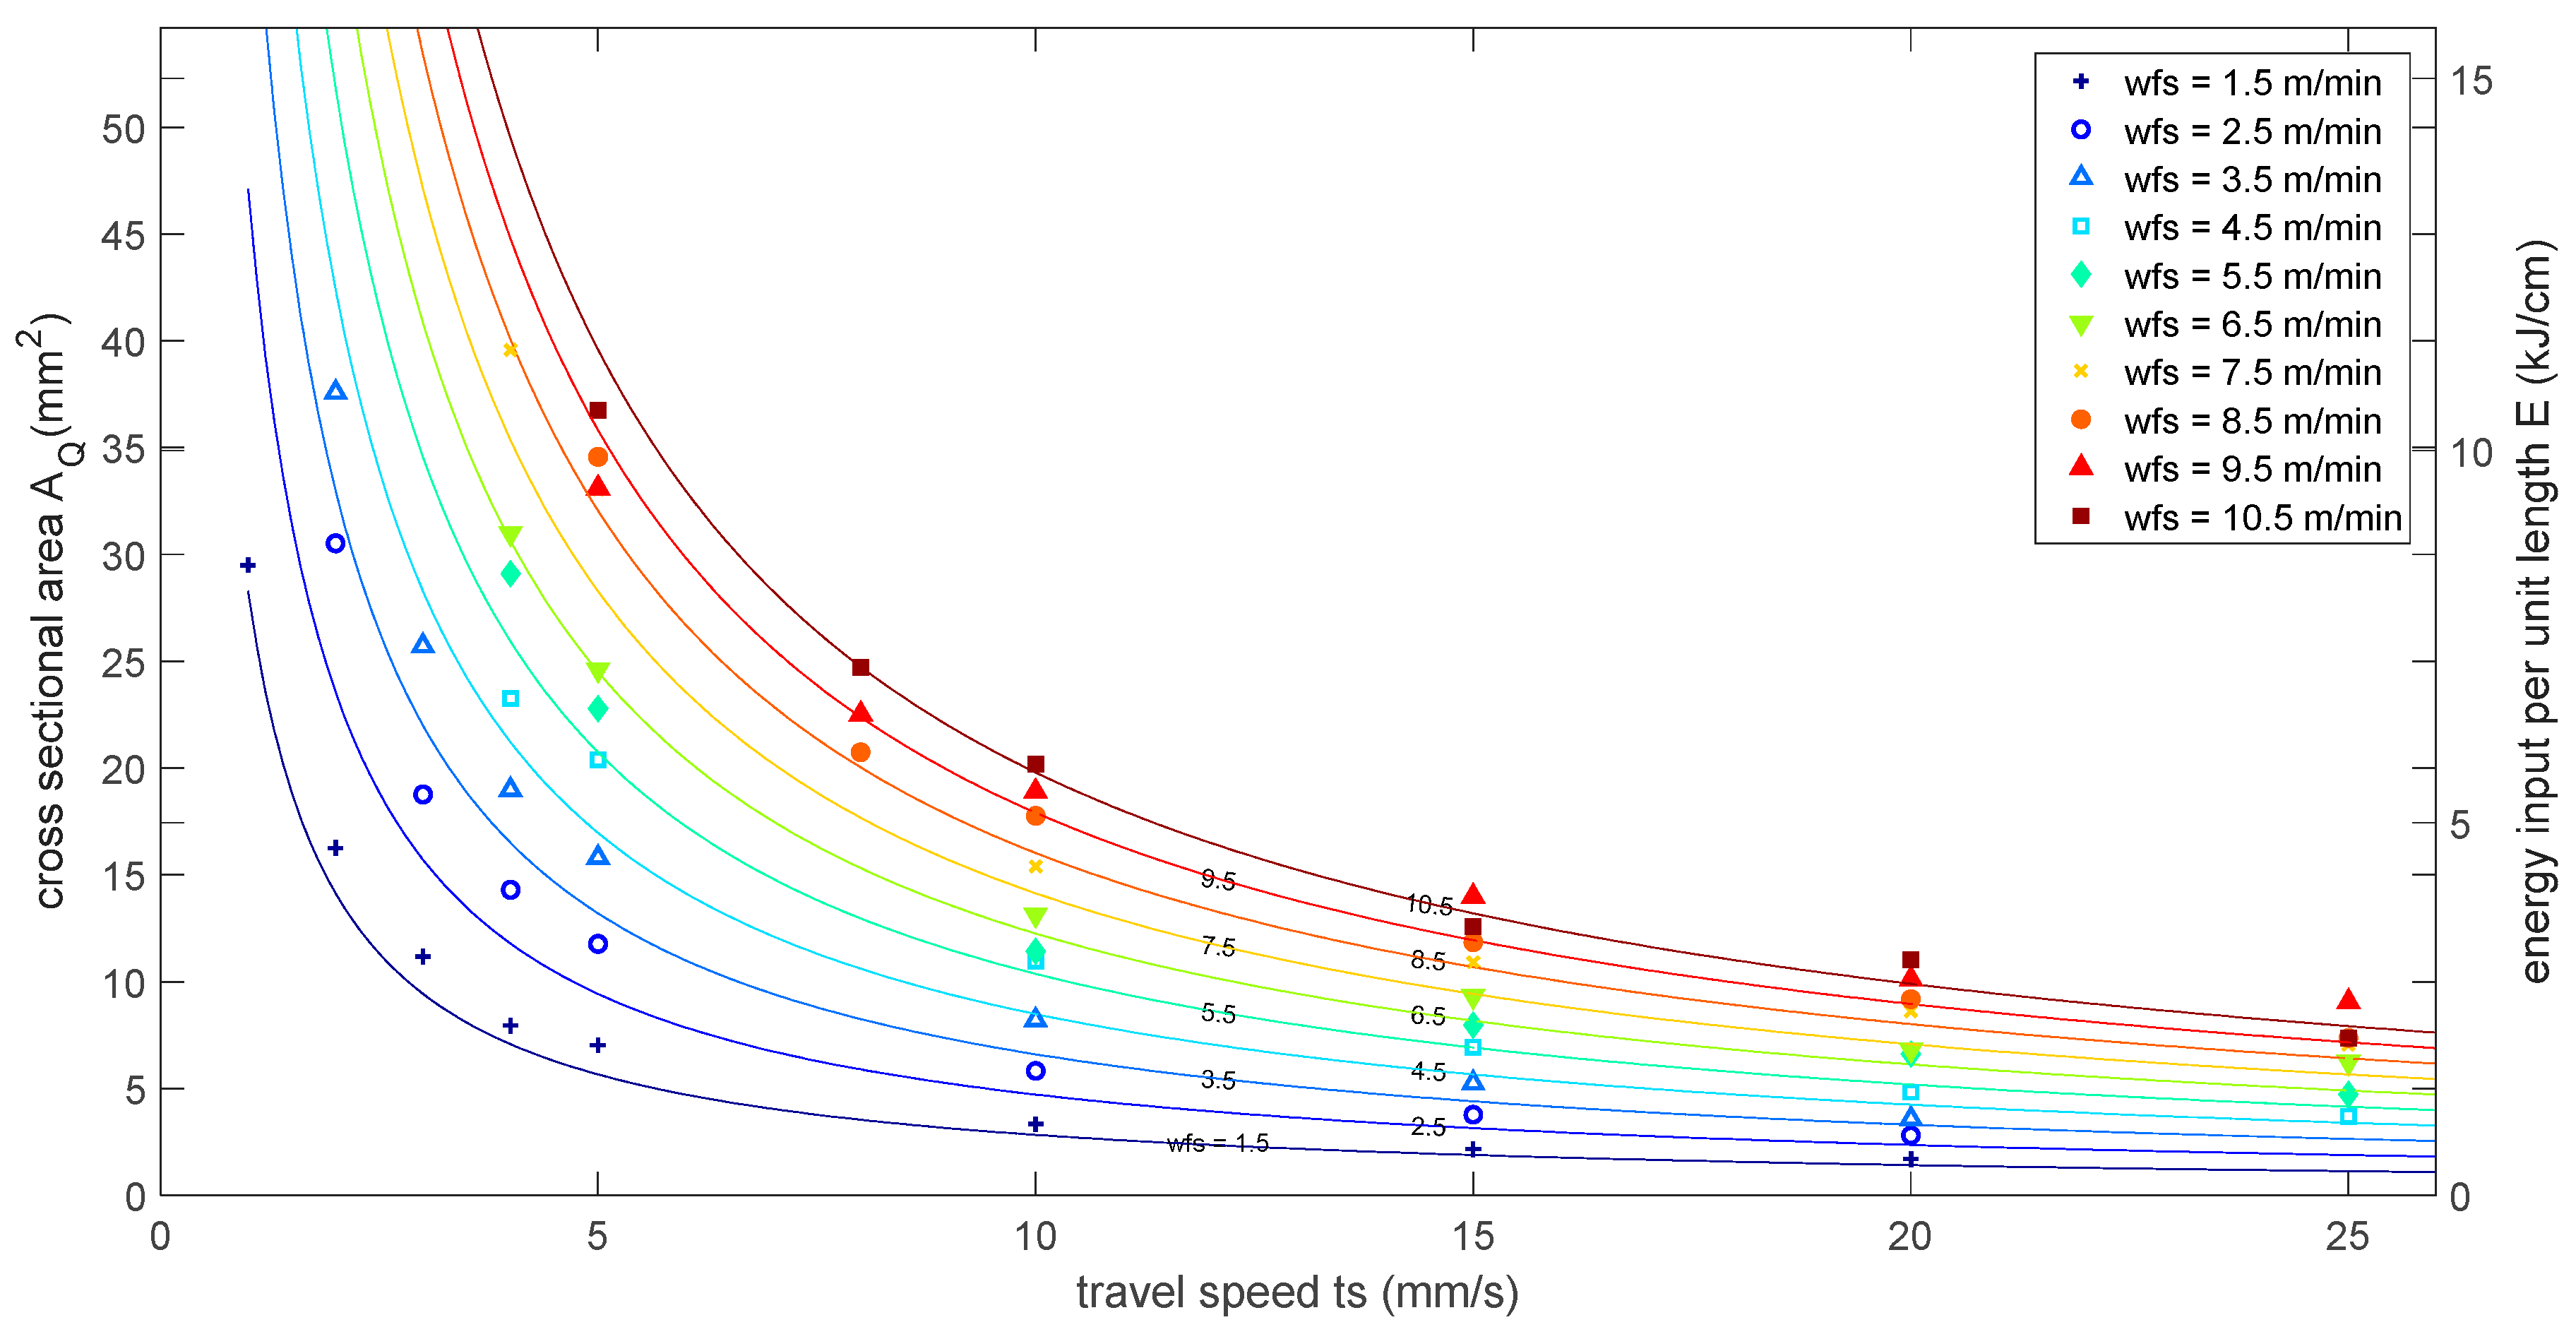
In Figure 2b, a nearly linear behavior between power and wire feed speed () can be seen as the characteristic of the CMT welding power source. The energy input per unit length without consideration of losses is defined as
and thus, it is proportional to the ratio between wire feed speed and travel speed ().
The same applies for the theoretical cross-sectional area of the single weld bead for the quasi-stationary deposition process:
where denotes the deposition rate and the volume of the solid wire per unit length.
This relationship links the material deposition directly to the energy input. This relation is obvious, since the energy is needed to melt the added filler material. For the additive process, it might be helpful to separate these two quantities to incorporate the different heat transport conditions during the buildup. This would require a different process that uses an independent feeding of the filler material, e.g., the tungsten inert gas welding process (TIG) or plasma arc process. Nonetheless, in addition to the aforementioned advantages of the CMT process, the constant wire feed of the CMT process is an asset, since external wire feeding imposes additional challenges regarding equipment, process stability and consistency of the feeding [13]. However, specially-developed power source characteristics may be beneficial to the WAAM process.
3.1.1. Single-Layer and Single-Track Weld Beads
Since the ratio between wire feed speed and travel speed determines the cross-sectional area of the weld bead and the shape of the cross section, the influence of these two parameters on width and height was investigated in a preliminary study. Single track weld beads were performed to determine which combination of these parameters are suitable to achieve a weld bead with a certain width or height. The other parameters were kept constant (Table 3).
Figure 3 shows the theoretical influence of travel speed and wire feed speed on the energy input and the cross-sectional area of a single weld bead (solid lines). The energy input per unit length is calculated by , with , using the linear approximation presented in Figure 2b. The markers indicate the measured cross-sectional area for single weld trials. The qualitative progression of the measured values matches the prediction. The obtained deviation between theoretical and actual cross-sectional area is assumed to be caused by the deviation between adjusted and actual wire feed speed. The actual wire feed speed is dependent on the process control of the CMT power source and was not measured. At least for low values of wire feed speed, the results indicate it to be higher than the adjusted values. In order to choose process parameters, it is more important to estimate the width and the height for a given set of travel speeds and wire feed speeds anyhow. Figure 4 summarizes the measured values of width and height for the single welds. This visualization can serve as a process chart to identify suitable parameters.
3.1.2. Multi-Layer and Multi-Track Welds
The preliminary experiments have shown that the CMT process delivers single track weld beads with a stable geometry for a wide range of parameters. Based on the results of the single weld beads, parameters for multi-layer welds were chosen. Multi-layer and multi-track welds were performed to identify suitable parameter sets for the specified geometry of the demonstrator-part. The following considerations were taken into account for the experiments:
- The crucial parameter for multi-track welds is the overlap between the single beads. It usually can be calculated as a fraction of the width of the single bead. The literature estimates the optimal overlap distance from 0.637 (Cao et al. [17]) to 0.738 (Ding et al. [18]) times the bead width. Previous work has shown that an overlap of 0.66 times the weld bead width is practicable [15].
Table 4 lists the resulting geometry for a 10 layer wall with two tracks for different sets of parameters. Set #2 was chosen for the 8 mm wall segment of the AM-part. Set #4 shows the same height evolution and was therefore chosen for the main wall with 15 mm thickness, using three tracks instead of two. Set #5 may have also been a valid option for the main wall but the height evolution differed greatly from Set #2 and resulted in very rough surface conditions with a risk of being below the targeted wall thickness in some areas. Set #3 was chosen to produce the reference wall structures, since the energy input per unit fell between those of Set #2 and #4.
Figure 5c,f respectively show the applied path strategy for the wall build-up. As discussed before, the weld direction was altered after each layer to achieve uniform height along the longitudinal direction of the wall.
The arrangement of the individual tracks shown for each layer was chosen to improve uniform height development along the transverse direction of the start and end sections. Figure 5 tries to show this effect for different build strategies. Figure 5a–c show the effect of height evolution for three different track sequences for the stationary section of a straight wall, given that the overlap distance is not optimal but too small and results in an increase of height in y-direction. Only configurations (b) and (c) change the direction of the track sequence and will be able to compensate the difference , while sequence (a) will result in an accumulation of material along the y direction. Figure 5d–f shows the same effects for the start- and end section of a four-track wall. Again, only configuration (e) and (f) can help to compensate the height difference, but, as the height difference for the start may not be equal to the height difference for the end of a layer , only track sequence (f) will provide the best result. This strategy can only compensate for too small overlap distances. If the overlap distance is too big, lack of fusion may be the consequence. In addition, the applicability of this technique may also depend on the number of tracks and might not work for a large number of tracks. Overall, it should be mentioned that the effect of the proposed track sequence is a hypothesis that was not investigated systematically, but once applied, the strategy seemed to facilitate a more stable build-up for high walls and overlap distances from 0.66 to 0.75 times the bead width.
3.2. Design Features and Path Strategy
The following section discusses design features of the specified geometry and the strategy which was applied to fabricate the given part.
3.2.1. Corners and Crossings
Crossings entail the problem of material accumulation at the crossing point. The usage of L-shaped welds to build a crossing from opposing angles is evaluated by Mehnen et al. [19]; strategies for T-shaped crossings are discussed by Venturini et al. [20].
The present part only required 90°-corners, but for walls with different wall thicknesses. Figure 6 depicts the strategy which was applied for the fabrication of the demonstrator. As the two meeting walls were built with different parameter sets, not only a change of direction but also of the travel speed was needed. The corner point is prone to material accumulation due to deceleration for the direction change and the sharp turn. For corners with an angle smaller than 90°, the material accumulation at the corner point might even increase and adjustment of the local travel speed might be necessary for compensation. For parameter sets with different wire feed speed, the formation of an end crater might become an issue. This strategy is only practicable if the different parameter sets have the same layer height, which shows the importance of the right choice of parameters using the process chart, as described in Figure 4. In general, it might be necessary to use the same parameters to achieve the same height and overcome different wall thicknesses just by the number of tracks. Nevertheless, by choosing suitable parameters that result in similar height development and match the demanded wall thickness, it is possible to reduce geometric deviation, material input and effort for post processing. For the shown segment parameter, Set #6 with a wire feed speed of 1.5 m/min and a travel speed of 4 mm/s was used to manufacture the single-track wall with a width of 4 mm.
3.2.2. Inclined Walls
Figure 7 shows the two investigated alternatives for angled walls. The slope of a wall in longitudinal direction is denoted by the angle and the slope in transversal direction is denoted by the angle . These angles can lie between 0° and 180°, whereby an angle results in an overhang. Generally, the angle can be inconstant, which can be seen in the present case. While it should be possible to fabricate variant (b) for with the appropriate parameter set, this is not the case for variant (a) as the offset increases with smaller values for . For the depicted example, the travel angle of the weld gun was set to 0° and fabricating the section with a maximum angle α of approx. 70° showed that the arc start was prone to miss the previous weld bead, resulting in an arc ignition error for one track. It was possible to restart the process but longitudinal inclined walls with smaller values of might not be possible to fabricate with the used parameters set. A solution to this problem might be to build a transversal oriented support structure with = α at the end of the wall. For variant (b) it is practical to set the working angle of the torch to if possible [19].
3.3. Mechanical Properties and Microstructure
3.3.1. Manufacturing of the Test Walls
Table 5 summarizes the parameters to produce the reference wall structures. The interpass temperature of 150 °C was measured manually with a temperature probe. The single weld tracks were cleaned with a wire brush. The chosen overlap was for wall structure #1 to #4, which resulted in a wall thickness of roughly 18 mm for the four-track wall. For wall #5, the overlap was increased to and the wall thickness therefore increased to 20 mm. This was done to ensure that there was enough material to machine the Single Edge Notch Bend samples (SENB) with the notch in y direction. As discussed in Section 3.1.2, there is quite a lot of tolerance for the overlap distance when the specified track sequence is applied. This facilitated the manufacturing of a wider wall without changing the welding parameters.
Figure 8 shows the finished test walls and the result of the optical measurement of the wall geometry. Figure 8b shows the false color representation of a best-fit analysis for the wall side with a detail of the top layer and texture of the wall and deviation of the cross section in the middle of the reference wall. It shows good results for the wall dimensions and shape; the base plate, however, shows deviation of more than 2 mm due to thermal induced distortion.
3.3.2. Impact Test and Tensile Test
Figure 9 shows the results for impact testing and the tensile test. The obtained impact work lies between 82 J and 94 J for all samples and shows no significant difference between the orientations xy, xz, zx and zy. Although the measured Charpy values are below the reference values of the all-weld metal according to [12] the results are very stable. A mean value of 87 J was observed with a very low scatter; the results in a different testing direction are very similar with an overall standard deviation of only 3 J.
The tensile test results match the reference values and no difference between the orientations in x- and z-direction can be obtained. Instead there is an observable difference of elongation between samples of wall structure #3 and wall structure #4.
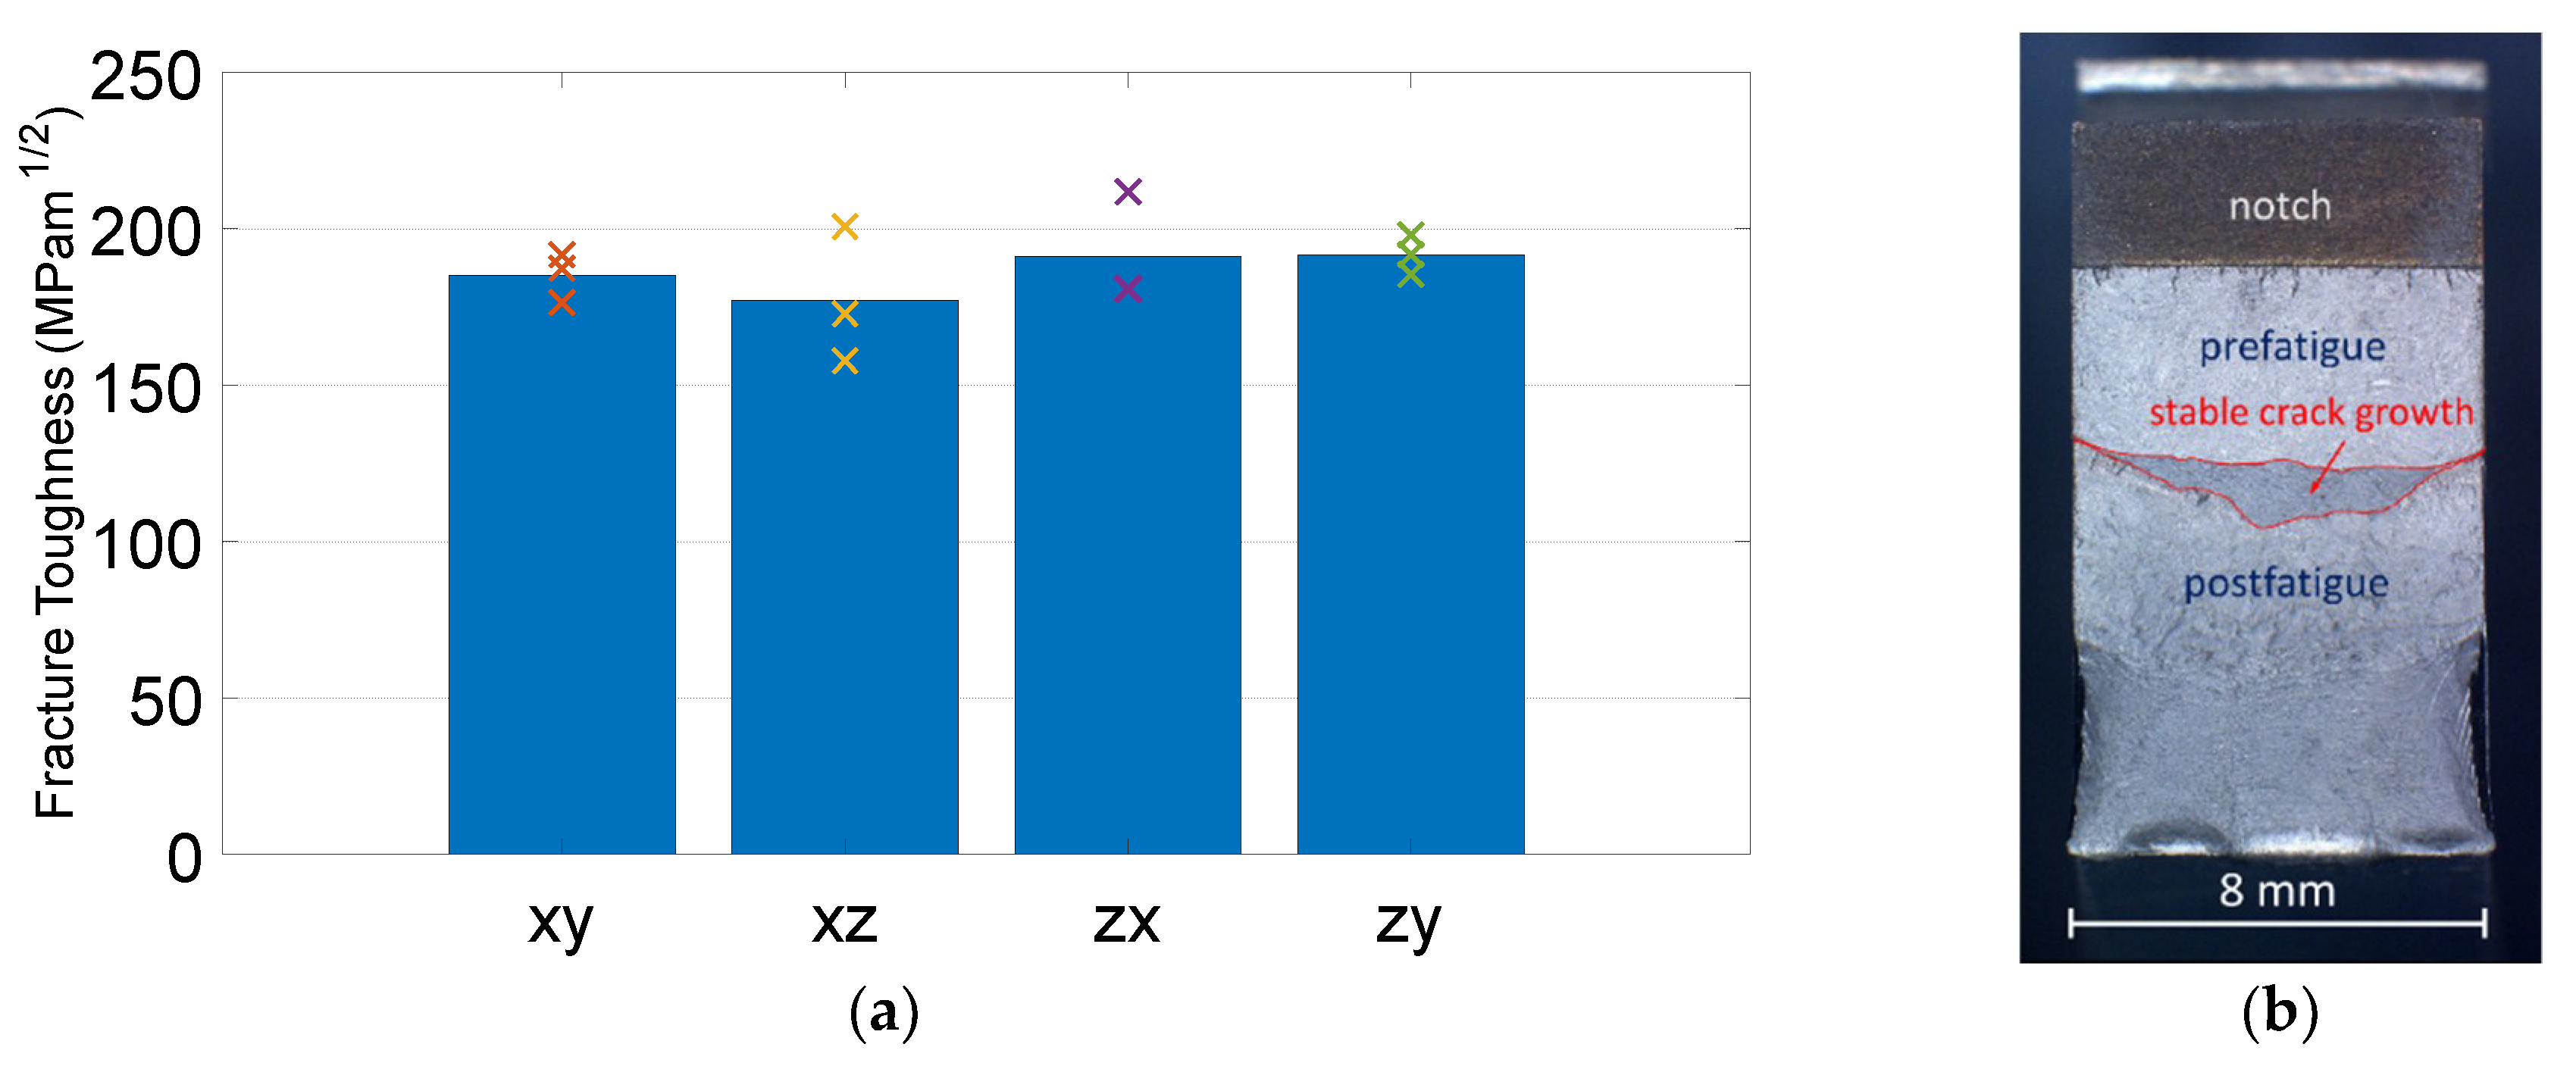
3.3.3. Fracture Toughness
Single Edge Notch Bend specimens (SENB) were used to determine fracture toughness according to ASTM E1820-11 [21,22]. A load was applied on the pre-fatigue-cracked samples, which lead to a stable crack extension. Applied force and crack mouth opening displacement were measured. After unloading, the stable crack growth was marked by post-fatigue-cracking to enable optical crack size measurement. The resistance curve procedure with the normalization data reduction technique was used to determine a J-based resistance curve from each single specimen from the measured data. The critical value JIC was determined from the J-R-curve and fracture toughness KJIC was calculated from JIC. As for the impact test, three samples were used for each of the different notch orientations. The results for KJIC lie within 157 to 211 MPam1/2 and indicate no significant anisotropy. The obtained values can be compared to literature which shows values from 160 to 170 MPam1/2 for weld metal of joint welds [23]. Figure 10 shows the obtained fracture toughness KJIC values and the distinguishable areas of the fracture surface. It can be seen in Figure 10b that the crack front is not straight and that the stable crack growth only involves the central part of the sample. This behavior can be seen for all the samples. In fact, none of the samples met the requirements of ASTM E1820-11 8.5.4 regarding the acceptable deviations of the average crack size. Thus, the results are not valid according to the standard but may still be used to compare the effect of different orientations within this work.
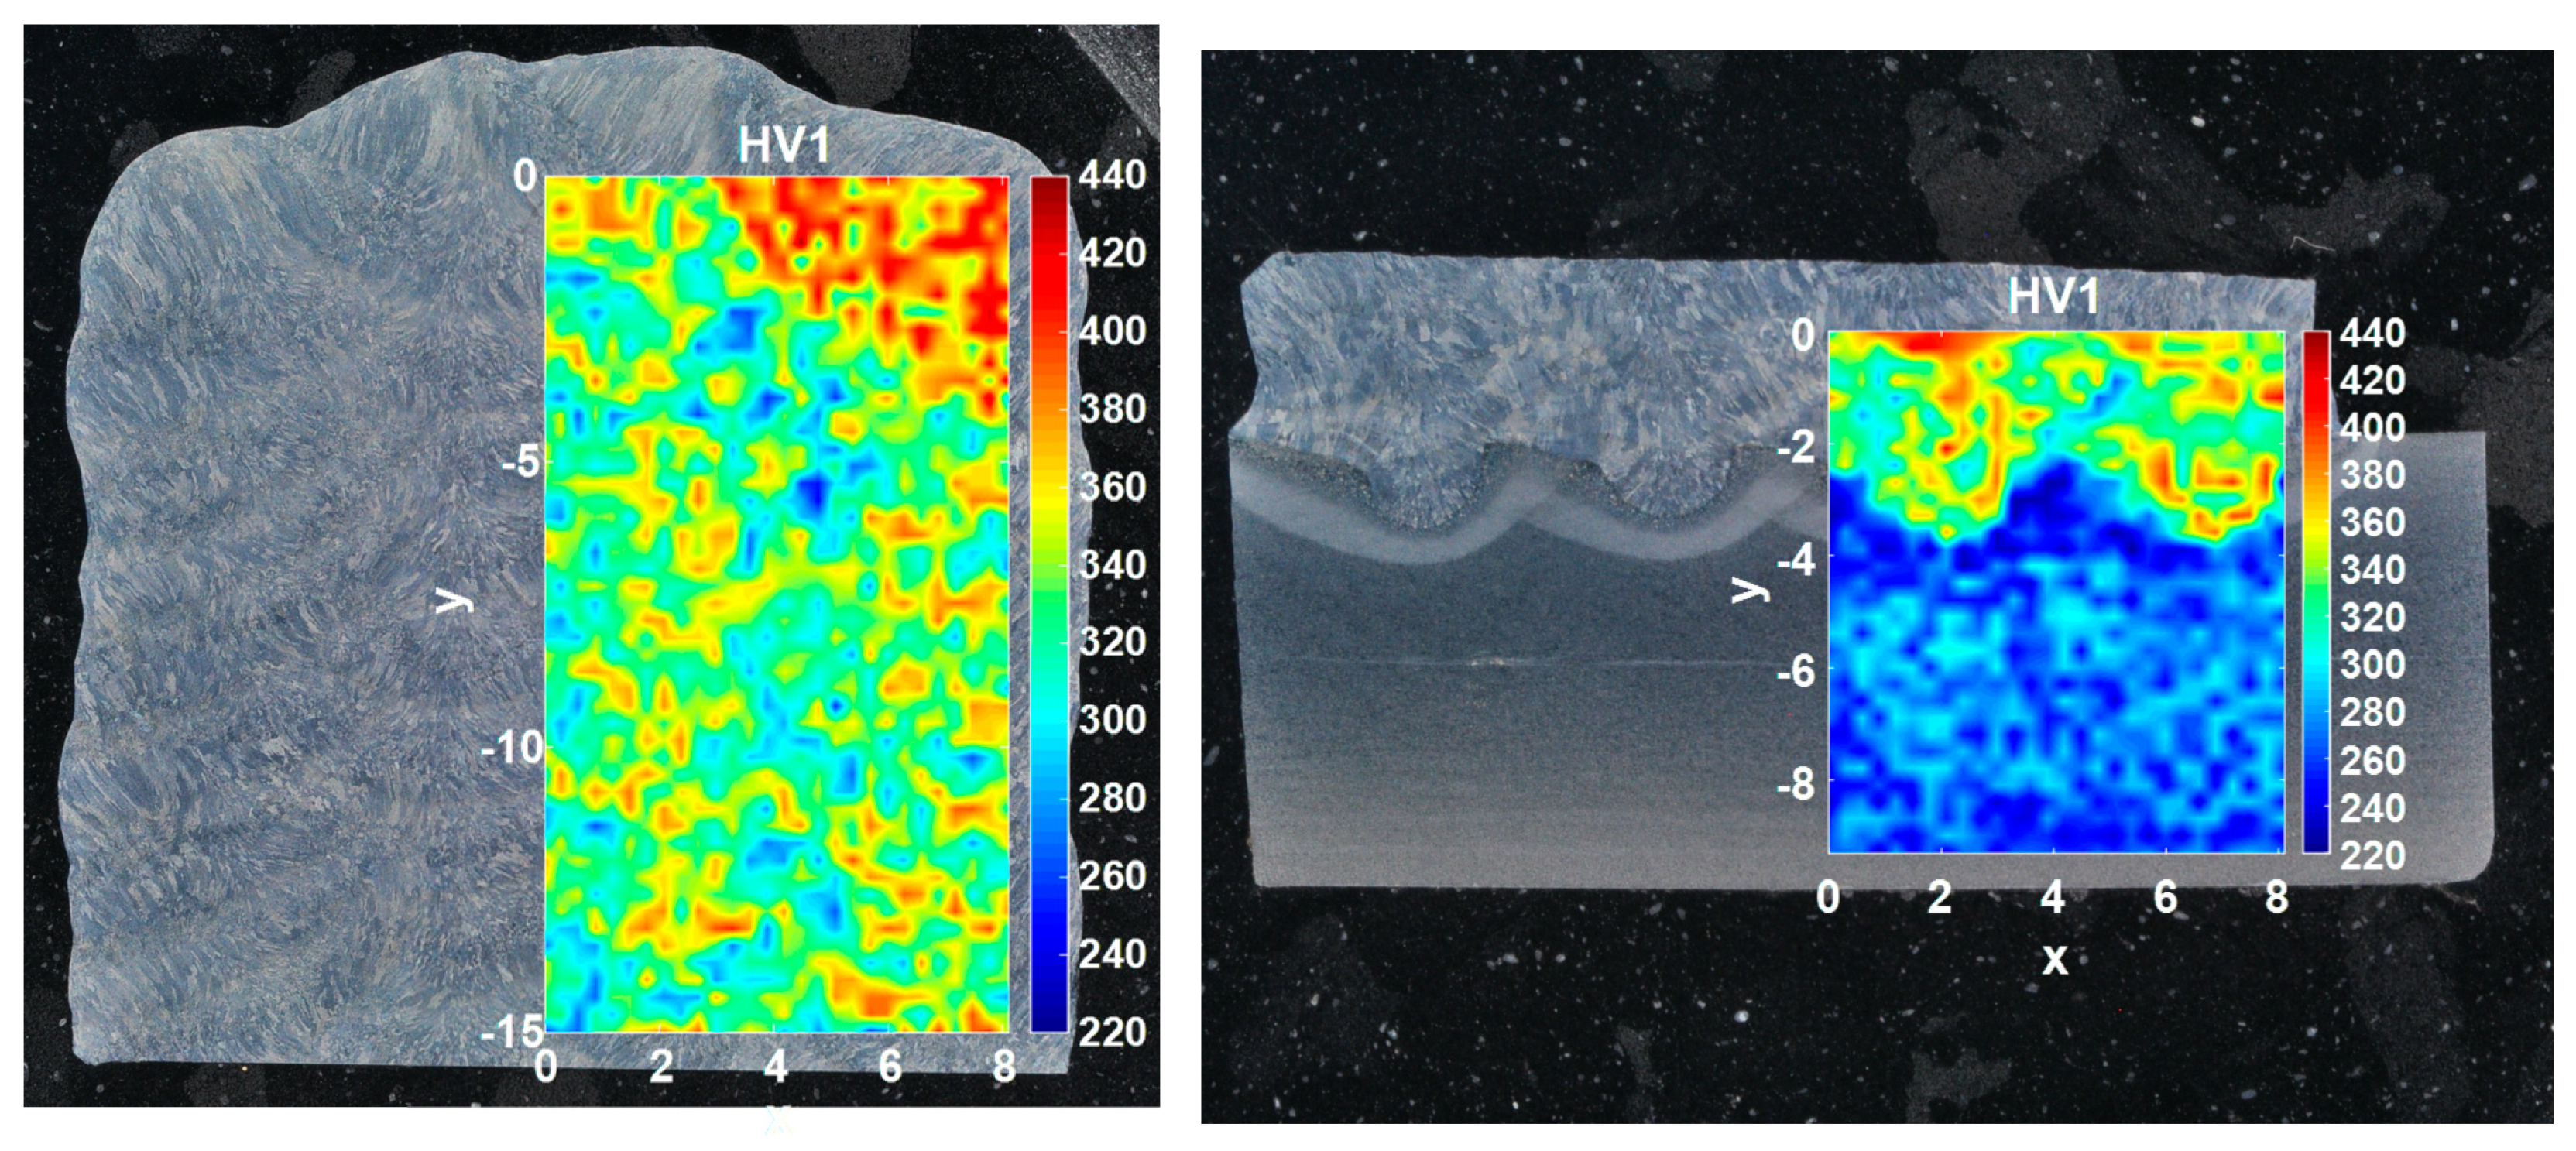
3.3.4. Hardness Testing
For investigation of the hardness along the vertical build direction, a cross-section was taken from sample #5. Vickers Hardness (HV1) was measured for the top-, center- and bottom section. Figure 11 shows the results for the top- and bottom section. A linear interpolation was performed to achieve a resolution of 0.01 mm. The top section shows as expected a peak for the top layer due to lack of tempering. The bottom section shows homogenous values for the base material and a pronounced separation of the weld metal. The heat affected zone of the root passes shows a weak zone due to thermal influence on the thermomechanical processed base metal [24,25].
Hardness values range between 220 HV1 and 440 HV1 with a single outlier of 180 HV1 for the center section. Except for the top- and bottom section, the distribution of the hardness values is similar throughout the wall-cross-section. Comparing the hardness values with the heat affected zones of the weld metal, it is reasonable to assume that the local variation correlates with the local temperature profile.
3.4. Manufacturing of the Exemplary Part
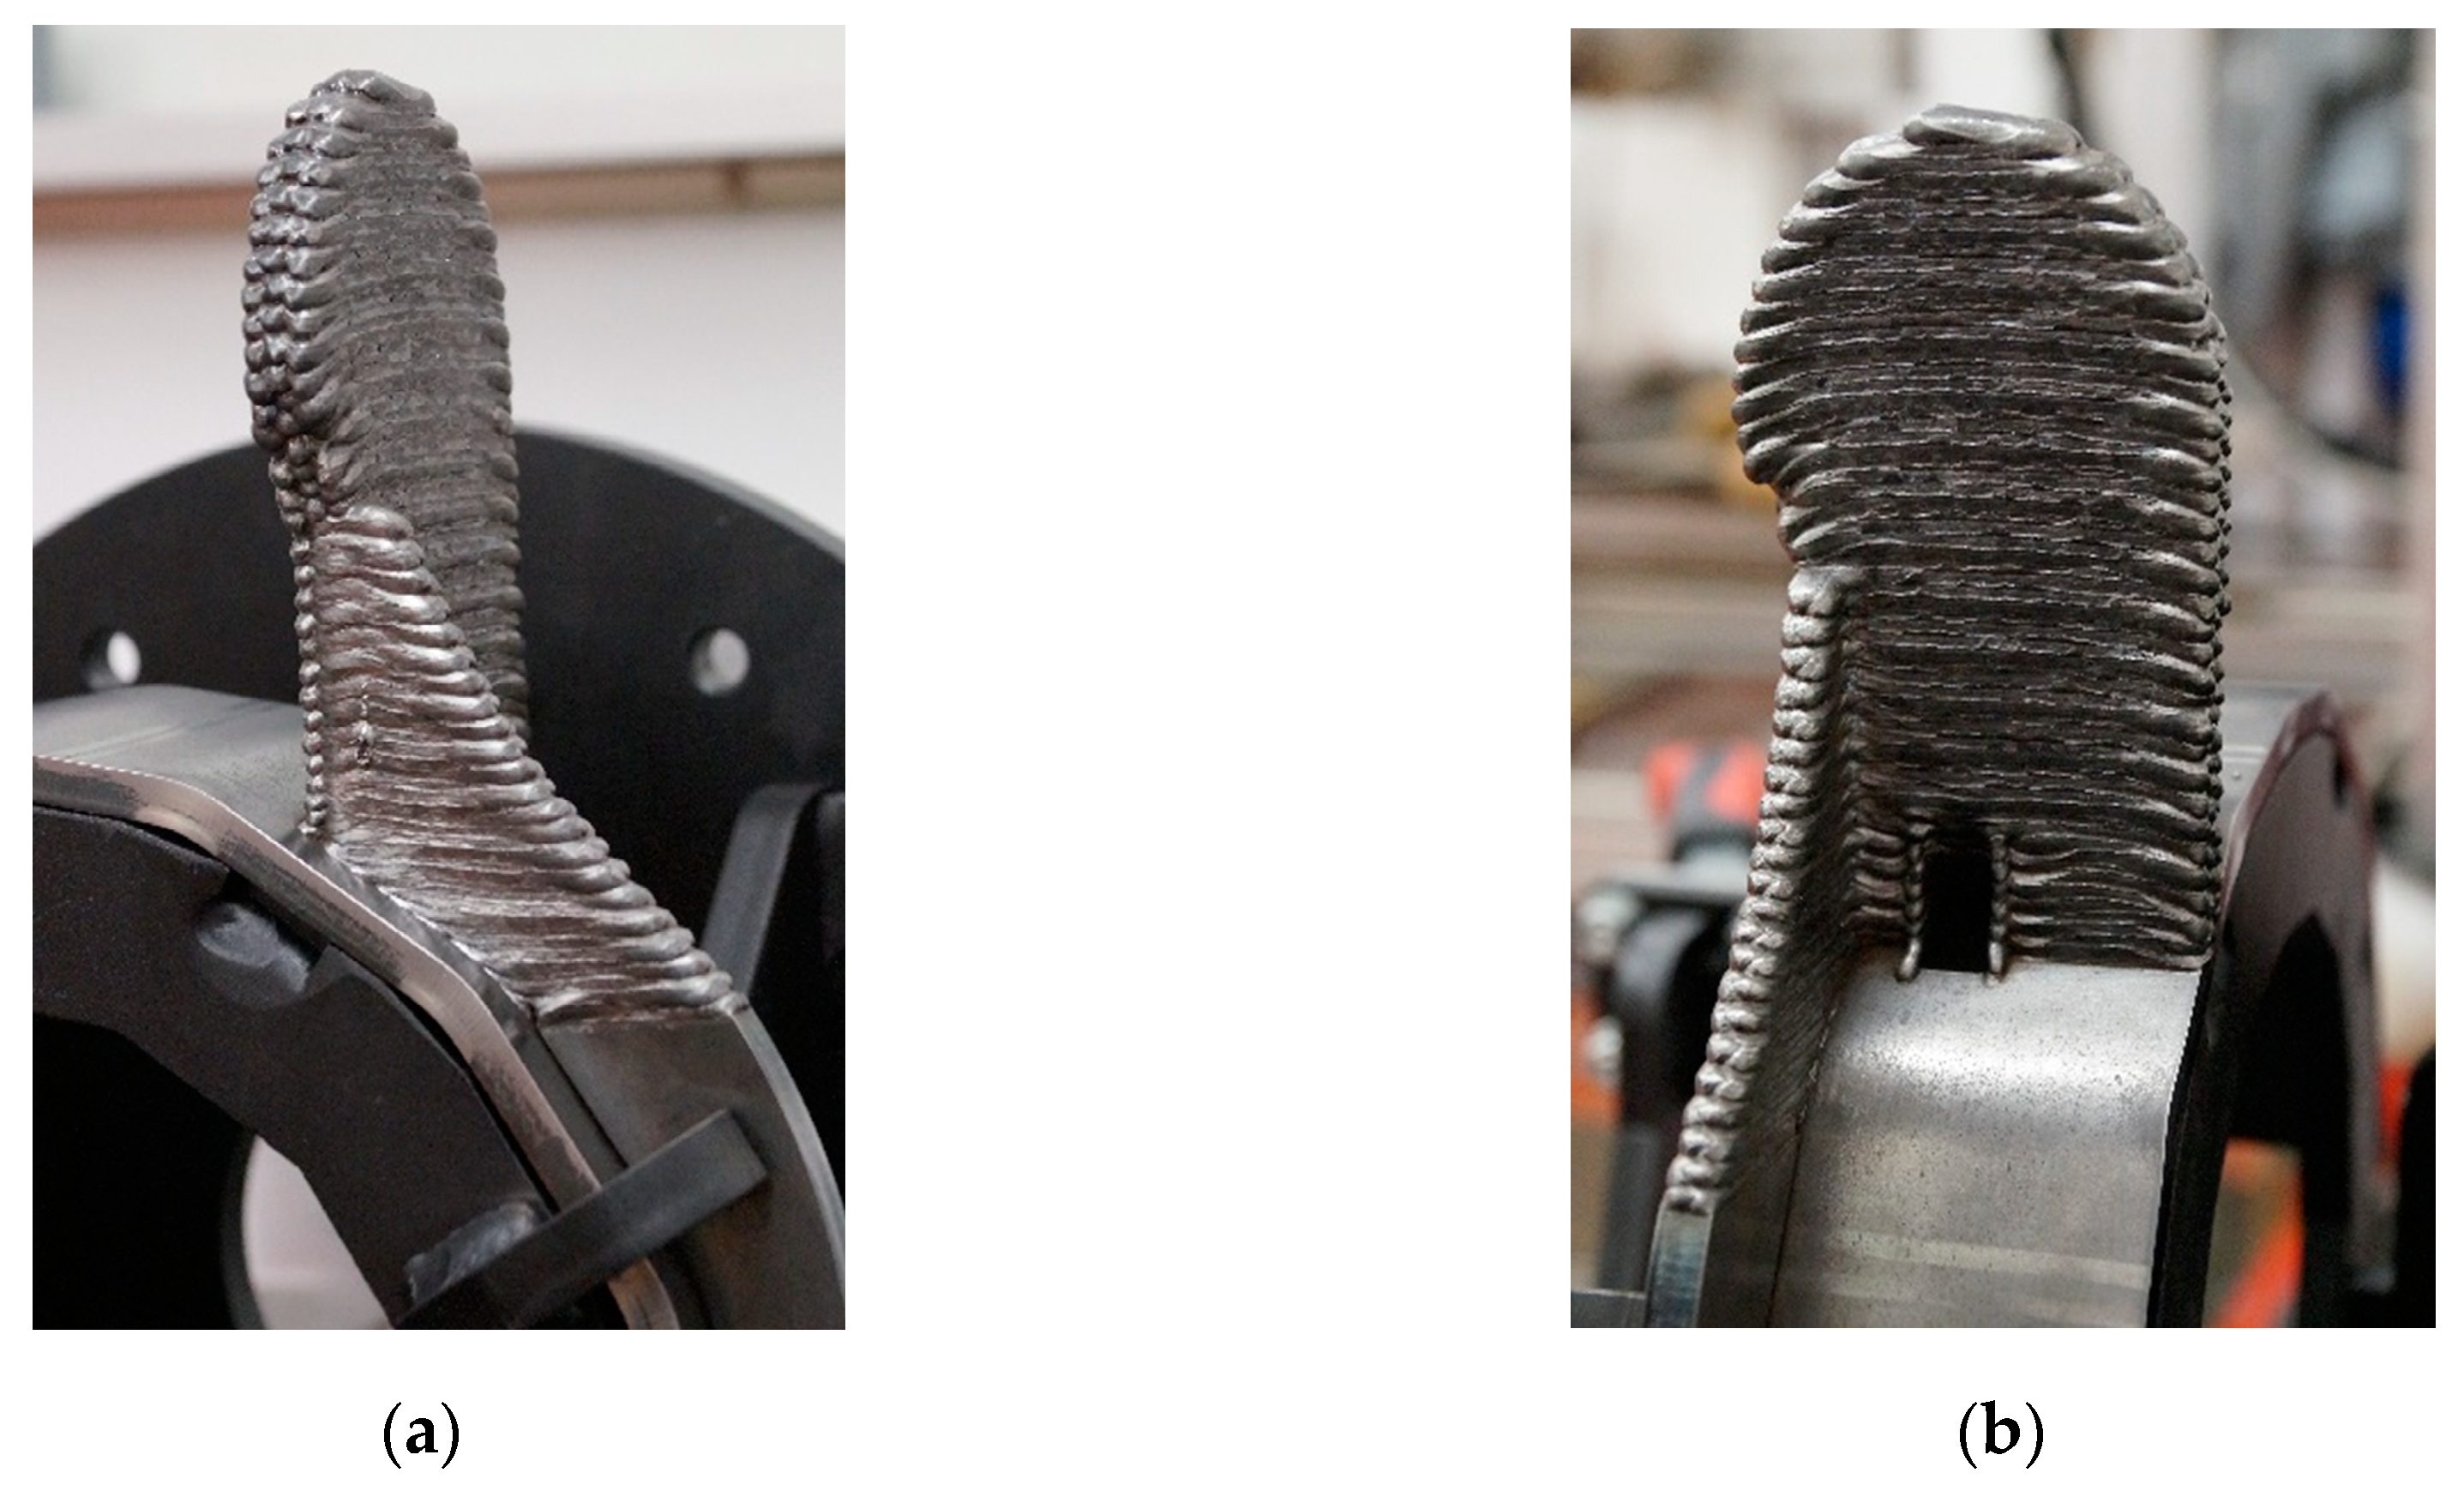
The subassembly is clamped in a fixture. It helped to position the parts of the subassembly accurately and to reduce the distortion during the process. Figure 12 shows the first results of welding trials using the fixture to weld directly on the subassembly.
4. Discussion
Wire feed speed and travel speed were identified as the main influence parameters for the shape of a single weld bead. Based on the theoretical estimation (Figure 3) a suitable parameter window can be estimated. The geometry of single weld beads, particularly the cross-section area, can be estimated based on the process parameters and vice versa. The actual shape as a result of individual settings has to be verified experimentally. This approach enables a faster parameter optimization and could help shorten the time from part design to the start of production when introducing new geometries or materials. Based on the so defined parameters for single walls, multi-track walls were developed. While the overlap distance between the beads seems to be crucial to avoid lack of fusion between welds and to guarantee stable height development along the wall width, it was possible to compensate a too small overlap distance by using an adapted track sequence. Further investigations to verify this effect and to quantify the achievable deviations of the optimum overlap distance and the influence on a stable build-up behavior, by either optical measurements or analysis of cross-section polishes, may be interesting.
Finally, it was possible to show the feasibility of manufacturing corners, overhangs and inclined walls in general. The fabrication of the center wall has shown the challenges of combining such geometry features, not only for path planning but in the present case also regarding accessibility. This issue needs to be addressed within the design of WAAM-parts, as accessibility needs not only to be considered for welding but also for potential post processing steps like milling.
Mechanical characterization of the all-weld-metal in the as-welded condition was performed, using samples from representative multi-track wall structures which were fabricated with a single parameter set. It showed acceptable results with little scatter and no significant signs of anisotropy for the tested orientations. The direction perpendicular to the wall (y, yx, yz) was not tested, however. Results for fracture toughness testing are not valid according to the standard, because the crack growth only involves the central part of the crack front. The reason for this behavior can be explained with the dog-bone model [21]. It shows that the plastic zone at the surface of the sample (plain stress) is larger than in the center (plain strain). In addition, we must consider that we are dealing with additive manufactured material and that residual stresses can have an effect here. According to ASTM E1820-11 7.5 and 9.1.4.2, side grooves are recommended to achieve a deformation impediment on the surface of the sample to ensure a straight crack front. This will be considered for future tests.
Overall, the results for all-weld-metal are promising but cannot replace component testing of the actual part. Residual stresses, connections between walls or the connection between base material and AM-structure are fundamental for the structural integrity of the final part but were not tested yet. Therefore, the next step is going to be the combination of the identified manufacturing strategies to fabricate the defined geometry in Figure 1, followed by an optical measurement of the actual part geometry and a component testing of the final part. Further steps include the investigation of the manufactured fatigue crack growth samples and comparison of the results with literature values [26].
5. Conclusions
- It was possible to provide a process chart for the influence of wire feed speed and travel speed on the width and height of a single weld bead.
- For stable build-up of multi-track walls, overlap distance (0.66 * bead width to 0.75 * bead width) and track sequence are crucial.
- Mechanical testing indicates that it is possible to manufacture all-weld-metal with no significant signs of anisotropy regarding tensile strength, impact work and fracture toughness.
- Preliminary tests show the feasibility of manufacturing geometry features like corners and inclined walls.
Author Contributions
Conceptualization, P.S. and N.E.; methodology, J.P.; software, J.P.; validation, J.P. and T.V.; formal analysis, J.P. and T.V.; investigation, J.P. and T.V.; resources, N.E., P.S. and T.V.; data curation, J.P. and T.V.; writing—original draft preparation, J.P.; writing—review and editing, N.E., P.S. and T.V.; visualization, J.P.; supervision, N.E. and P.S.; project administration, P.S. and N.E.
Funding
The APC was funded by Graz University of Technology Open Access Publishing Fund.
Acknowledgments
This research was partially supported by Österreichischer Austauschdienst (OeAD). The publication of this article was funded by Graz University of Technology Open Access Publishing Fund. A special thanks goes to Florian Pixner for help with the hardness measurements and to Damir Skuhala (University of Maribor) for help with the measurement of fracture toughness.
Conflicts of Interest
The authors declare no conflict of interest.
References
- Handbuch Stahl—Auswahl, Verarbeitung, Anwendung; Bleck, W.; Moeller, E. (Eds.) Hanser: München, Germany, 2017; pp. 404–409. [Google Scholar]
- Hamme, U.; Hauser, J.; Kern, A.; Schriever, U. Einsatz hochfester Baustähle im Mobilkranbau. Stahlbau 2000, 69, 295–305. [Google Scholar] [CrossRef]
- Palfinger, A.G. Nachhaltigkeitsbericht 2008/2009. pp. 61–62. Available online: https://www.palfinger.ag/action/download/download?id=YUVnbWdDT1Vka0k2NklzTjhwL0xjQT09 (accessed on 7 March 2019).
- Ummenhofer, T.; Spannaus, M.; Steidl, G.; Hölbling, W.; Di Rosa, V. Die Anwendung hochfester Feinkornbaustähle im konstruktiven Ingenieurbau. Stahlbau 2013, 82, 236–245. [Google Scholar] [CrossRef]
- US1533300A—Method of making decorative articles—Google Patents. Available online: https://patents.google.com/patent/US1533300 (accessed on 29 January 2019).
- Appleyard, D. Welding Pelton Runners. Available online: https://www.hydroworld.com/articles/print/volume-20/issue-4/articles/turbines-mechanical-components/welding-pelton-runners.html (accessed on 28 January 2019).
- Williams, S.W.; Martina, F.; Addison, A.C.; Ding, J.; Pardal, G.; Colegrove, P. Wire + Arc Additive Manufacturing. Mater. Sci. Technol. 2016, 32, 641–647. [Google Scholar] [CrossRef] [Green Version]
- Bruckner, J. Schweißpraxis aktuell: CMT-Technologie. Cold Metal Transfer—ein neuer Metall-Schutzgas-Schweißprozess; WEKA-Media: Kissing, Germany, 2013; pp. 9–21. [Google Scholar]
- 3DMP-Verfahren, Lichtbogenschweißverfahren, 3D-Scan, CAM-Modelle. GEFERTEC. Available online: http://www.gefertec.de/3dmp-verfahren/ (accessed on 29 April 2018).
- Flynn, J.M.; Shokrani, A.; Newman, S.T.; Dhokia, V. Hybrid additive and subtractive machine tools—Research and industrial developments. Int. J. Mach. Tools Manuf. 2016, 101, 79–101. [Google Scholar] [CrossRef]
- Merklein, M.; Junker, D.; Schaub, A.; Neubauer, F. Hybrid Additive Manufacturing Technologies—An Analysis Regarding Potentials and Applications. Physics Procedia 2016, 83, 549–559. [Google Scholar] [CrossRef]
- Böhler X 90-IG. Available online: http://www.vabw-service.com/documents/boehler/datenblaetter/en/B_Boehler%20X%2090-IG_de_en_5.pdf?cache=1548334803 (accessed on 25 January 2019).
- Fuchs, J. Drahtbasierte additive Fertigung mit dem Elektronenstrahl und einer unlegierten Massivdrahtelektrode (G4Si1). Ph.D. Thesis, Technische Universität Graz, Graz, Austria, December 2016; pp. 23–27, 86–90. [Google Scholar]
- O’Brien, A. (Ed.) Welding Handbook. Volume 2: Welding Processes; Part 1, 9th ed.; American Welding Society: Miami, FL, USA, 2004; pp. 91–92. [Google Scholar]
- Stockinger, J. Additive Fertigung mittels CMT-Prozess für Reparaturarbeiten an Schmiedegesenken. Master’s Thesis, Technische Universität Graz, Graz, Austria, February 2017; pp. 51–52, 67–68. [Google Scholar]
- Xiong, J.; Yin, Z.; Zhang, W. Forming appearance control of arc striking and extinguishing area in multi-layer single-pass GMAW-based additive manufacturing. Int. J. Adv. Manuf. Technol. 2016, 87, 579–586. [Google Scholar] [CrossRef]
- Cao, Y.; Zhu, S.; Liang, X.; Wang, W. Overlapping model of beads and curve fitting of bead section for rapid manufacturing by robotic MAG welding process. Rob. Comput. Integr. Manuf. 2011, 27, 641–645. [Google Scholar] [CrossRef]
- Ding, D.; Pan, Z.; Cuiuri, D.; Li, H. A multi-bead overlapping model for robotic wire and arc additive manufacturing (WAAM). Rob. Comput. Integr. Manuf. 2015, 31, 101–110. [Google Scholar] [CrossRef] [Green Version]
- Mehnen, J.; Ding, J.; Lockett, H.; Kazanas, P. Design study for wire and arc additive manufacture. IJPD 2014, 19, 2–20. [Google Scholar] [CrossRef]
- Venturini, G.; Montevecchi, F.; Scippa, A.; Campatelli, G. Optimization of WAAM Deposition Patterns for T-crossing Features. Procedia CIRP 2016, 55, 95–100. [Google Scholar] [CrossRef] [Green Version]
- Mahler, M. Entwicklung einer Auswertemethode für bruchmechanische Versuche an kleinen Proben auf der Basis eines Kohäsivzonenmodells. Ph.D. Thesis, Karlsruher Institut für Technologie, Karlsruhe, Germany, 28 July 2015; pp. 9–15. [Google Scholar]
- ASTM E1820-11. Standard Test Method for Measurement of Fracture Toughness; ASTM International: West Conshohocken, PA, USA, 2011; Available online: www.astm.org (accessed on 3 June 2019).
- Hajro, I.; Pašić, O.; Burzić, Z. Investigation of elastic-plastic fracture mechanics parameters of quenched and tempered high-strength steel welds. Struct. Integrity Life Integrity Veh. Constr. 2010, 10, 225–230. [Google Scholar]
- Maurer, W.; Ernst, W.; Rauch, R.; Vallant, R.; Enzinger, N. Evaluation of the factors influencing the strength of HSLA steel weld joint with softened HAZ. Weld World 2015, 59, 809–822. [Google Scholar] [CrossRef]
- Rahman, M.; Maurer, W.; Ernst, W.; Rauch, R.; Enzinger, N. Calculation of hardness distribution in the HAZ of micro-alloyed steel. Weld World 2014, 58, 763–770. [Google Scholar] [CrossRef]
- Lukács, J.; Dobosy, Á.; Gáspár, M. Fatigue Crack Propagation Limit Curves for S690QL and S960M High Strength Steels and their Welded Joints. AMR 2018, 1146, 44–56. [Google Scholar] [CrossRef]
Figure 1.
View of the demonstration part.
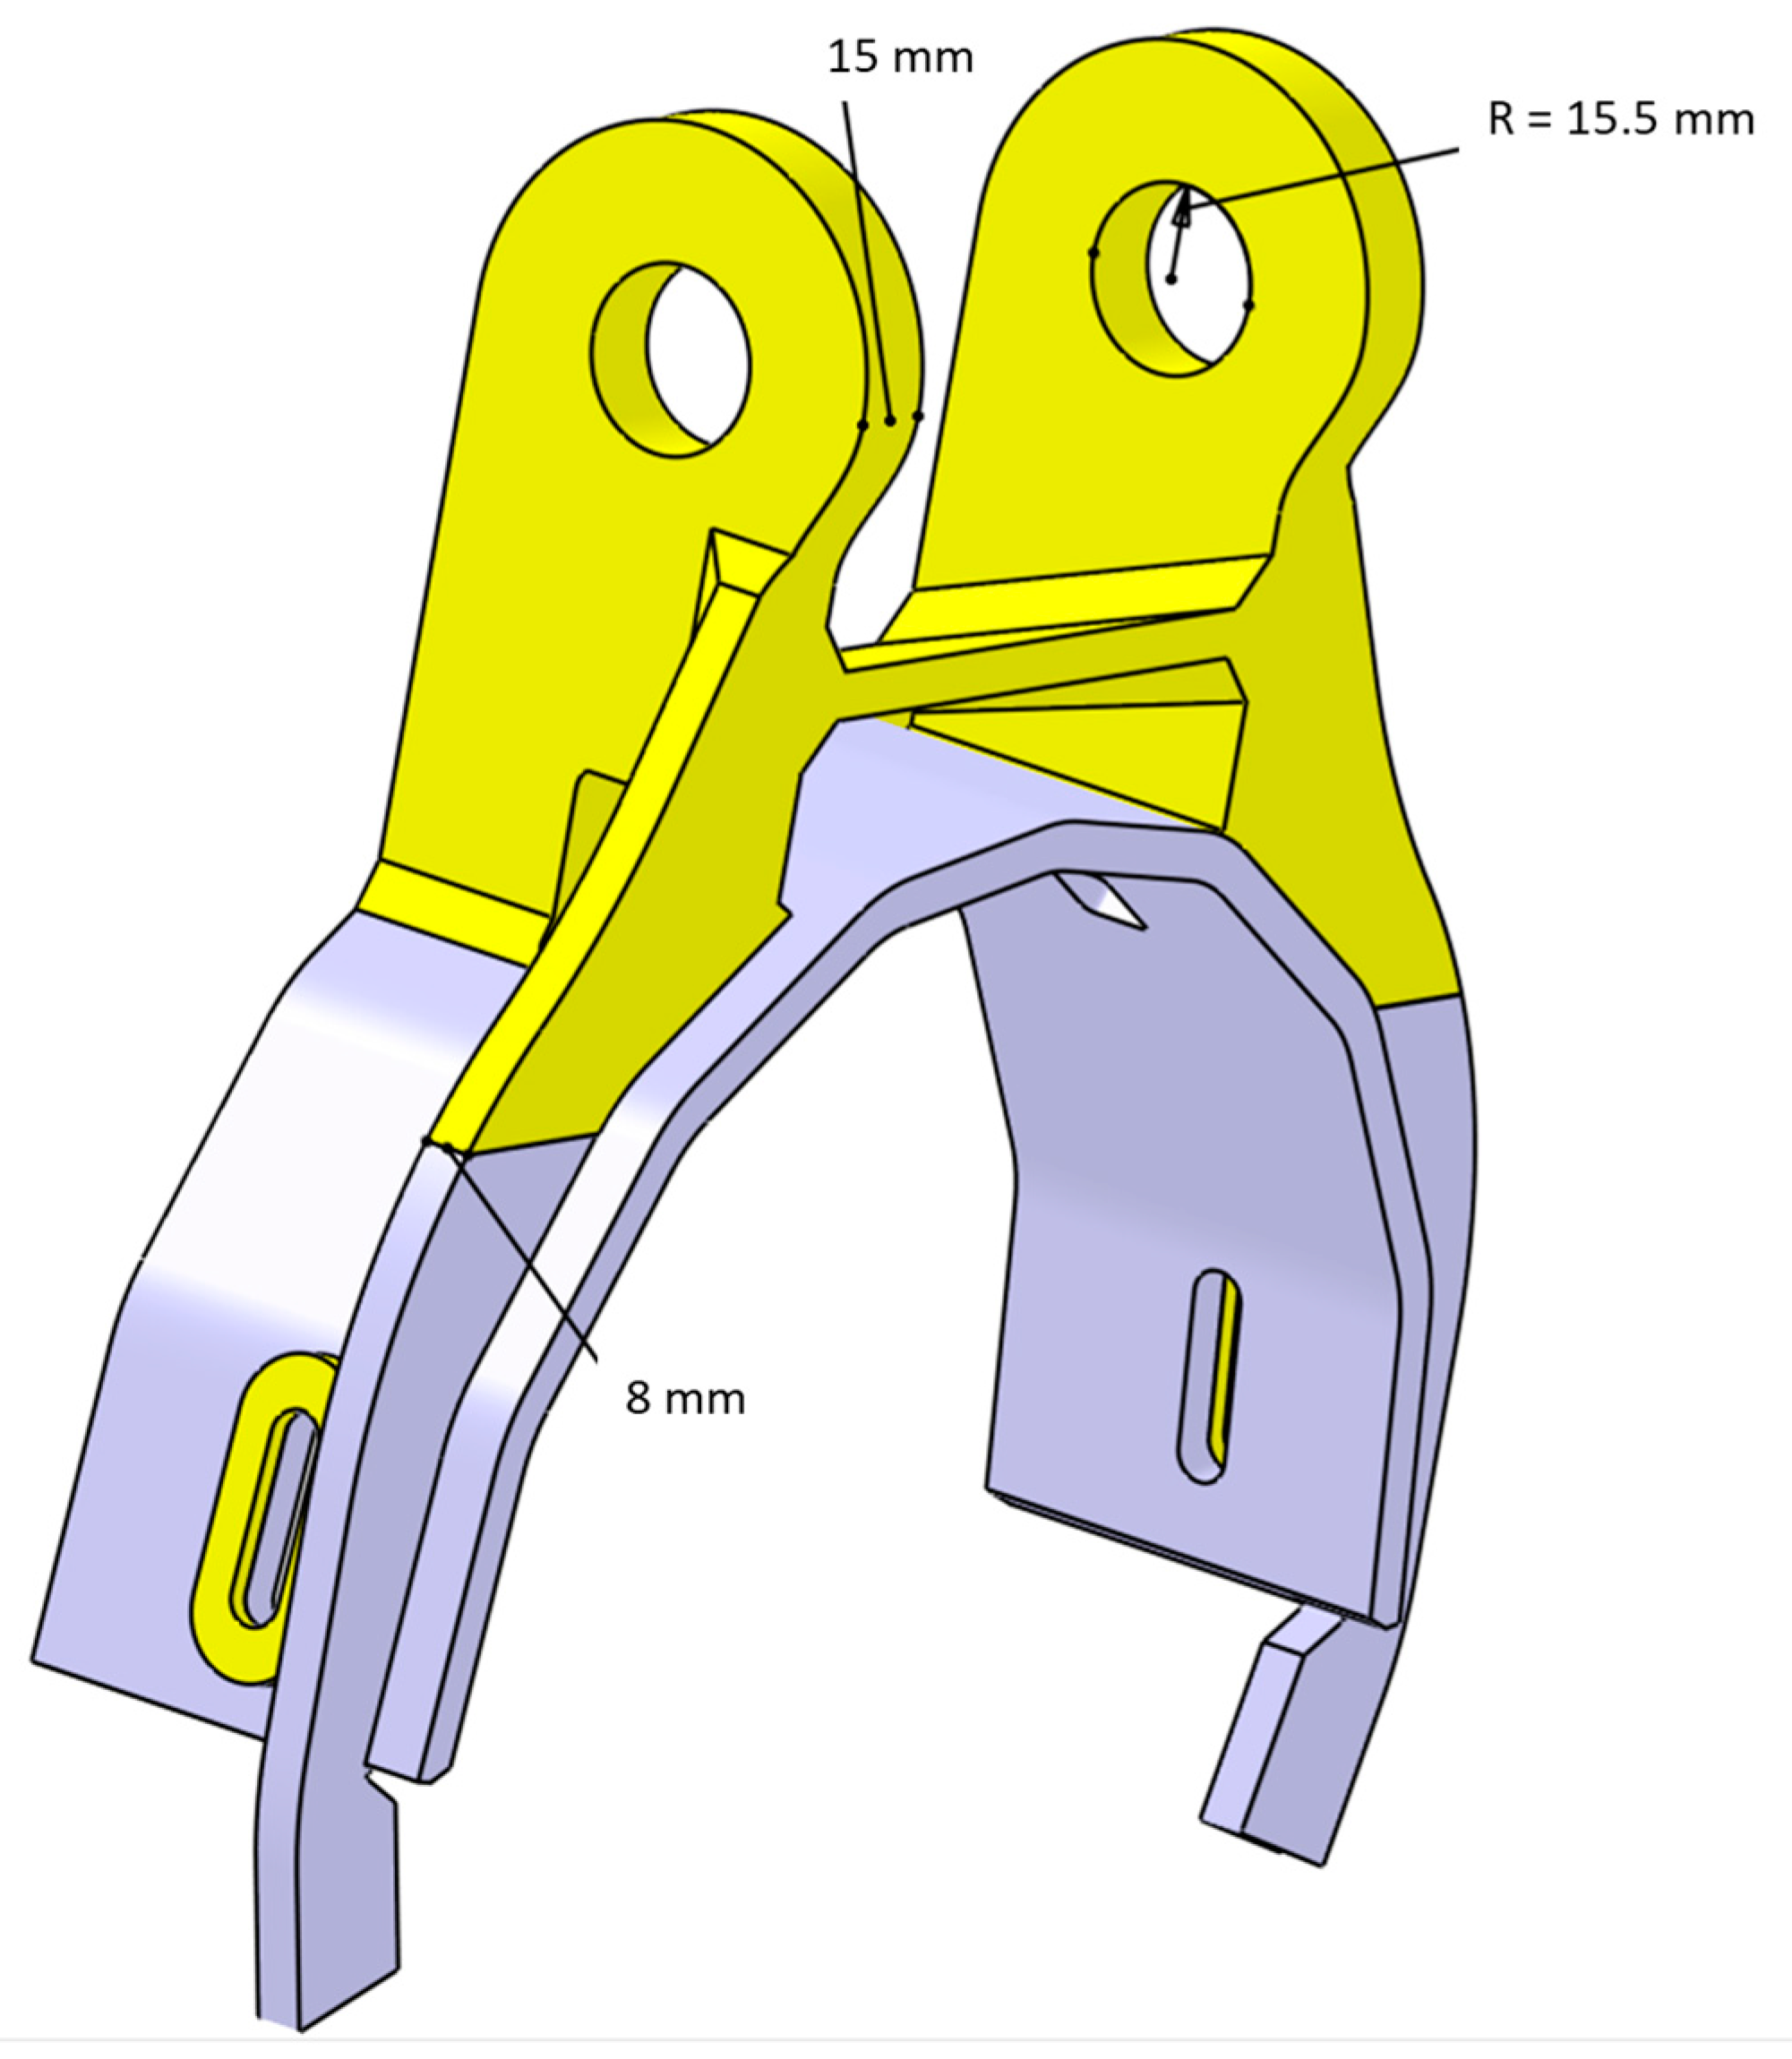
Figure 2.
(a) Illustration of the WAAM (wire + arc additive manufacturing) process with build orientation and the main influencing factors travel speed () and wire feed speed (); (b) Universal CMT (Cold Metal Transfer) characteristic 3148 for steel.
Figure 2.
(a) Illustration of the WAAM (wire + arc additive manufacturing) process with build orientation and the main influencing factors travel speed () and wire feed speed (); (b) Universal CMT (Cold Metal Transfer) characteristic 3148 for steel.

Figure 3.
Theoretical influence of travel speed and wire feed speed on energy input per unit length and cross-sectional area of the single weld bead (solid lines) in comparison with cross-sectional area of weld trials (markers).
Figure 3.
Theoretical influence of travel speed and wire feed speed on energy input per unit length and cross-sectional area of the single weld bead (solid lines) in comparison with cross-sectional area of weld trials (markers).

Figure 4.
Width and height of weld bead profile dependent on travel speed and wire feed speed.

Figure 5.
Path strategy for multitrack welds using the example of a 4-track weld; (a), (b), (c): effect of three different track sequences on the height evolution of the stationary region in the middle of the wall; (d), (e), (f): effect of the same sequences on the start-, respectively end region of the wall.

Figure 6.
(a) Top view of the path strategy for the corner feature of the 15 mm, 8 mm and 4 mm walls of the AM-part; (b) implementation of the strategy in a preliminary test.
Figure 6.
(a) Top view of the path strategy for the corner feature of the 15 mm, 8 mm and 4 mm walls of the AM-part; (b) implementation of the strategy in a preliminary test.
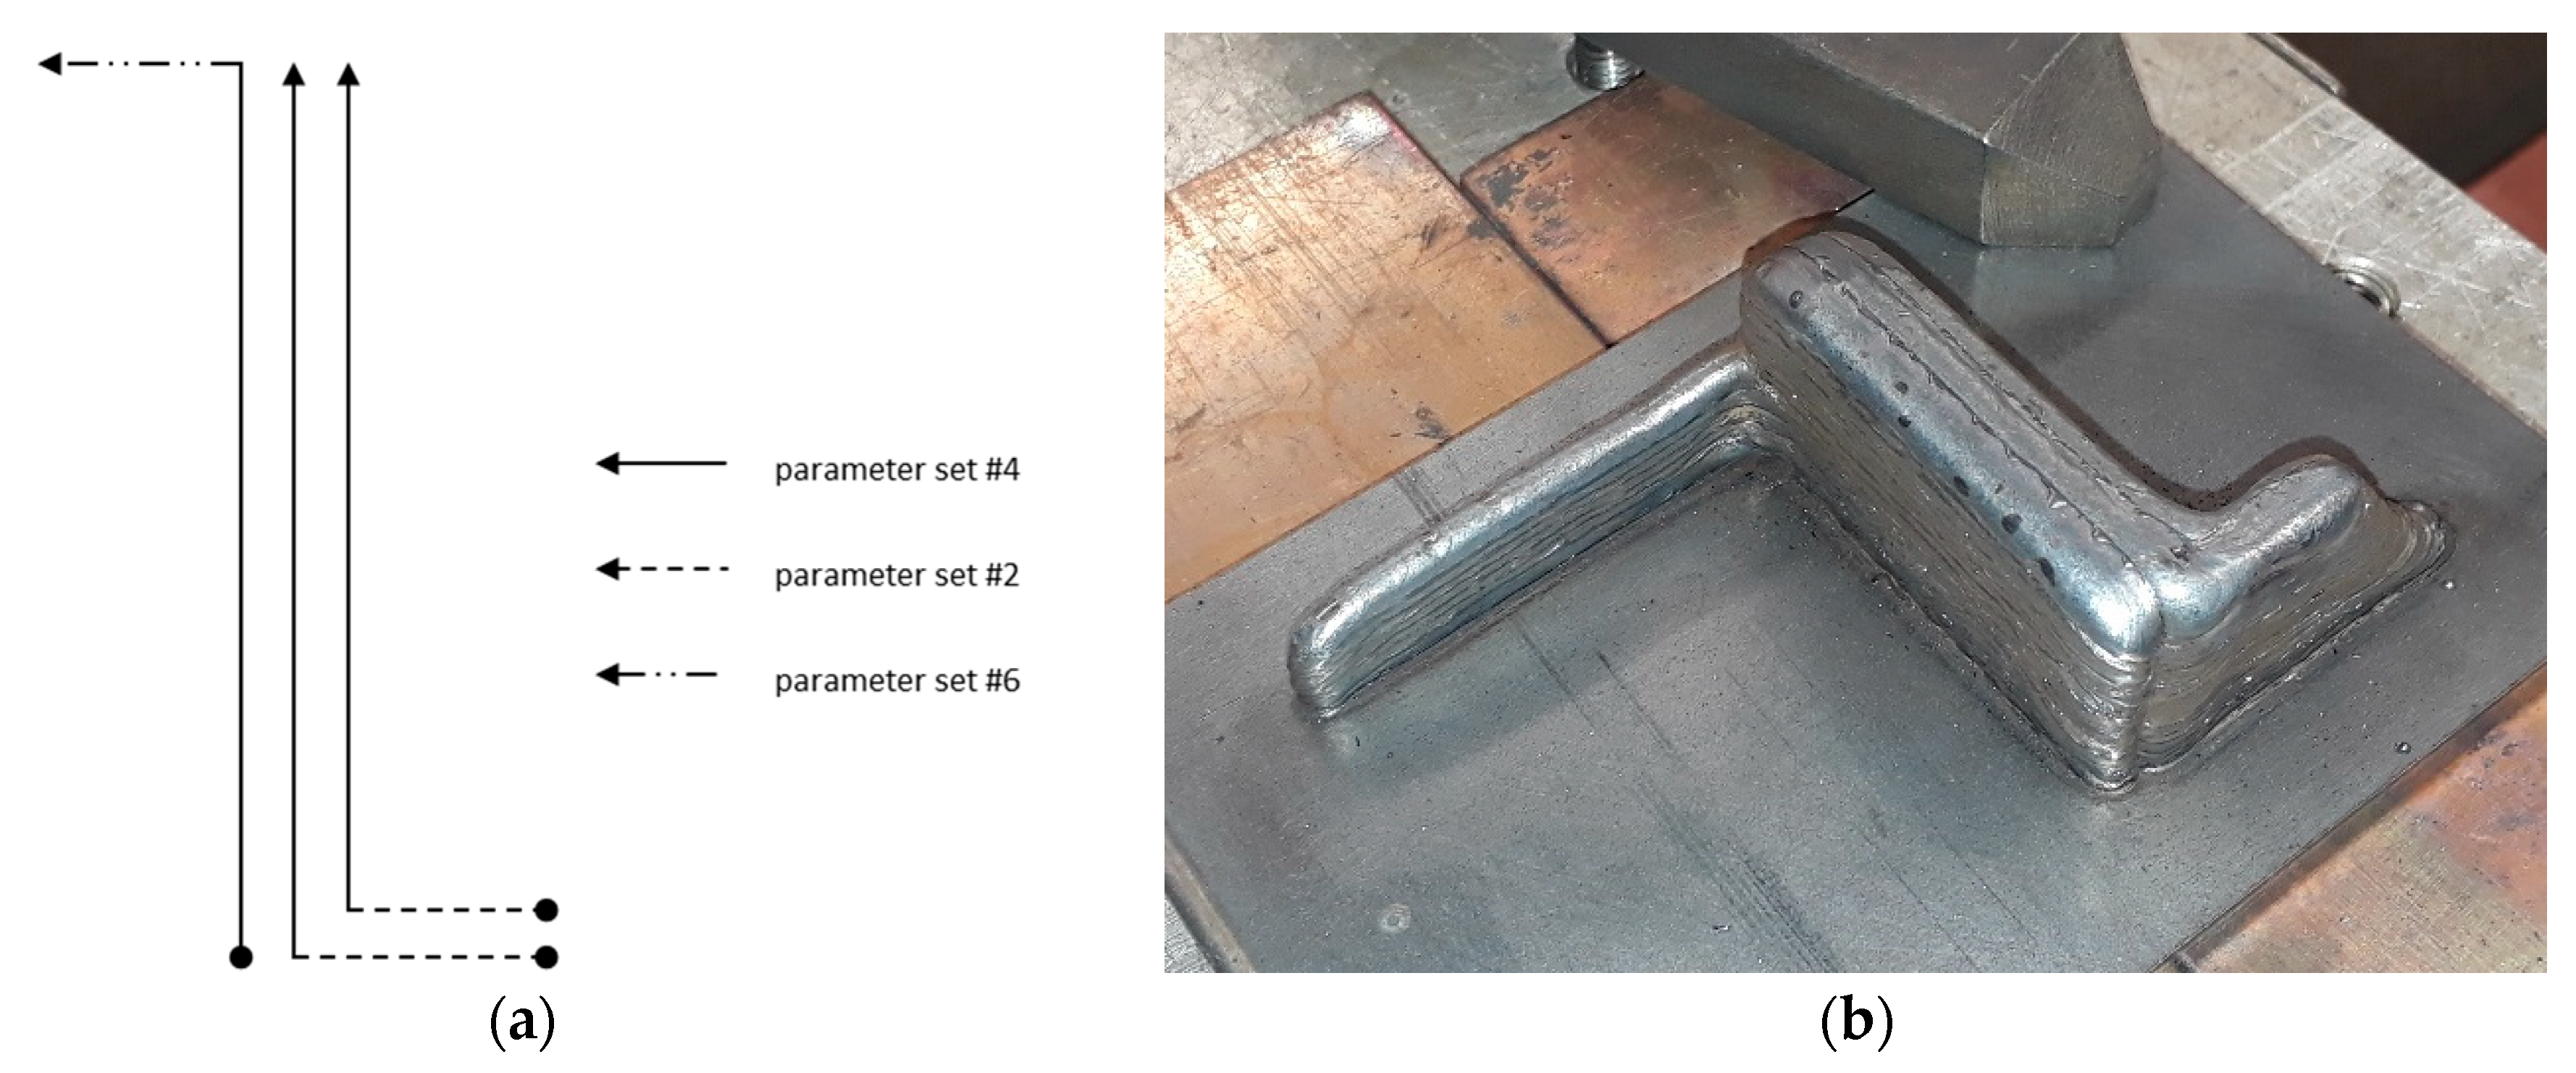
Figure 7.
(a) Inclined wall in longitudinal direction: schematic diagram and use case for the AM-part; (b) inclined wall in transversal direction: schematic diagram and preliminary test.
Figure 7.
(a) Inclined wall in longitudinal direction: schematic diagram and use case for the AM-part; (b) inclined wall in transversal direction: schematic diagram and preliminary test.

Figure 8.
(a) Finished test walls; (b) false color representation of the actual geometry.
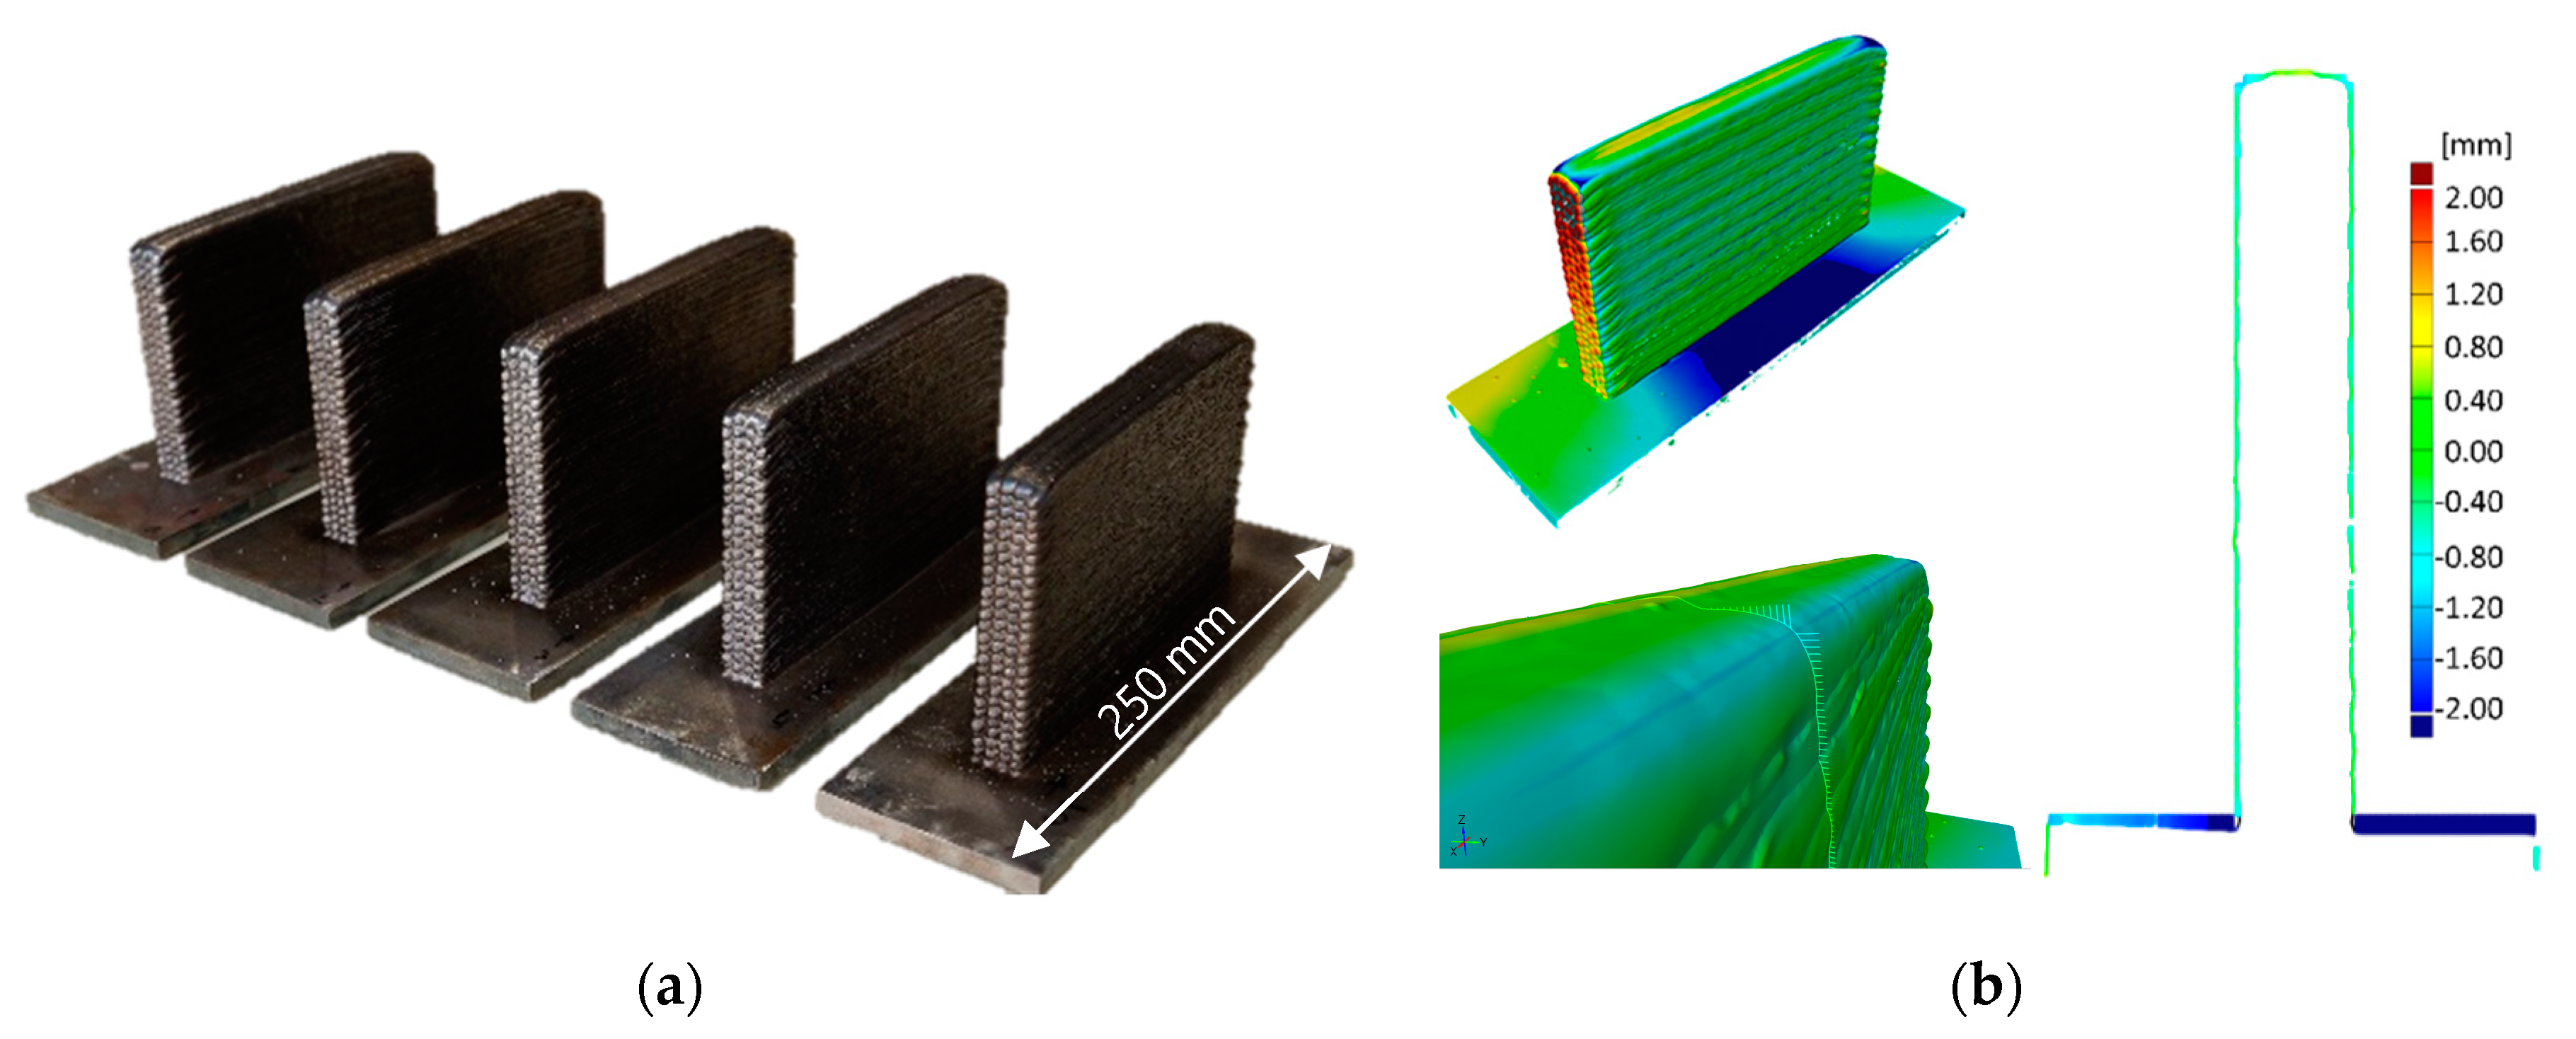
Figure 9.
Results for the mechanical testing: (a) impact energy; (b) stress strain curve.

Figure 10.
(a) Fracture toughness KJIC for three samples per orientation of the notch; (b) fracture surface of specimen #35.
Figure 10.
(a) Fracture toughness KJIC for three samples per orientation of the notch; (b) fracture surface of specimen #35.

Figure 11.
Hardness mapping for the top- and bottom-section. The colormap shows interpolated local Vickers hardness values (HV1) for the given xy-position.
Figure 11.
Hardness mapping for the top- and bottom-section. The colormap shows interpolated local Vickers hardness values (HV1) for the given xy-position.

Figure 12.
(a) Result of the first attempt for manufacturing the AM-part; (b) detailed view of the featured cut-out.
Figure 12.
(a) Result of the first attempt for manufacturing the AM-part; (b) detailed view of the featured cut-out.

Table 1.
Reference analysis of the solid wire Boehler X 90-IG in weight percent, reproduced from [12], with permission from voestalpine Böhler Welding Austria GmbH, 2019.
Table 1.
Reference analysis of the solid wire Boehler X 90-IG in weight percent, reproduced from [12], with permission from voestalpine Böhler Welding Austria GmbH, 2019.
| C | Si | Mn | Cr | Ni | Mo |
|---|---|---|---|---|---|
| 0.1 | 0.8 | 1.8 | 0.35 | 2.25 | 0.6 |
Table 2.
Mechanical properties of all-weld metal for the solid wire Boehler X 90-IG in untreated condition, as welded with shielding gas Ar + 15–25% CO2 (ISO 14175:2008–M21), reproduced from [12], with permission from voestalpine Böhler Welding Austria GmbH, 2019.
Table 2.
Mechanical properties of all-weld metal for the solid wire Boehler X 90-IG in untreated condition, as welded with shielding gas Ar + 15–25% CO2 (ISO 14175:2008–M21), reproduced from [12], with permission from voestalpine Böhler Welding Austria GmbH, 2019.
| Rp0.2, MPa | Rm, MPa | A (L0 = 5d0), % | ISO-V KV + 20 °C, J | ISO-V KV–60 °C, J |
|---|---|---|---|---|
| 915 (≥890) | 960 (≥940–1180) | 20 (≥15) | 130 | ≥47 |
Table 3.
Parameters that were kept constant.
| Electrode Stick-Out | Work Angle [14] | Travel Angle [14] | Gas Flow Rate | Arc Length Correction | Arc Dynamic Correction |
|---|---|---|---|---|---|
| 12 mm | 0° | 0° | 15 L/min | none (0) | none (0) |
Table 4.
Resulting geometry for two-track walls with different parameter-sets and an overlapping of 66% of bead width.
Table 4.
Resulting geometry for two-track walls with different parameter-sets and an overlapping of 66% of bead width.
| # | Wire Feed Speed, wfs, m/min | Travel Speed, ts, mm/s | E Theoret, kJ/cm | Deposition Rate, kg/h | Width, Two Tracks, mm | Height, 10 Layers, mm |
|---|---|---|---|---|---|---|
| 1 | 2.5 | 10 | 1.22 | 1.33 | 7 | 18 |
| 2 | 3.5 | 10 | 1.8 | 1.86 | 8 | 19 |
| 3 | 3.5 | 8 | 2.24 | 1.86 | 10 | 21 |
| 4 | 5 | 10 | 2.7 | 2.66 | 12 | 19 |
| 5 | 8.5 | 10 | 4.7 | 4.53 | 16 | 30 |
Table 5.
Parameters for building the reference wall.
| Length | Width | Height | Tracks | Layers | Wire Feed Speed, wfs | Travel Speed, ts | Interpass Temperature |
|---|---|---|---|---|---|---|---|
| 160 mm | 18 mm | 100 mm | 4 | 50 | 3.5 m/min | 8 mm/s | 150 °C |
© 2019 by the authors. Licensee MDPI, Basel, Switzerland. This article is an open access article distributed under the terms and conditions of the Creative Commons Attribution (CC BY) license (http://creativecommons.org/licenses/by/4.0/).
Share and Cite
MDPI and ACS Style
Plangger, J.; Schabhüttl, P.; Vuherer, T.; Enzinger, N. CMT Additive Manufacturing of a High Strength Steel Alloy for Application in Crane Construction. Metals 2019, 9, 650. https://doi.org/10.3390/met9060650
AMA Style
Plangger J, Schabhüttl P, Vuherer T, Enzinger N. CMT Additive Manufacturing of a High Strength Steel Alloy for Application in Crane Construction. Metals. 2019; 9(6):650. https://doi.org/10.3390/met9060650
Chicago/Turabian StylePlangger, Josef, Peter Schabhüttl, Tomaž Vuherer, and Norbert Enzinger. 2019. "CMT Additive Manufacturing of a High Strength Steel Alloy for Application in Crane Construction" Metals 9, no. 6: 650. https://doi.org/10.3390/met9060650
Note that from the first issue of 2016, this journal uses article numbers instead of page numbers. See further details here.