
Improvement of the Cracking Moment-Based Asphalt Mixture Splitting Test Method and Splitting Strength Research
1
School of Traffic & Transportation Engineering, Changsha University of Science & Technology, Changsha 410114, China
2
Wuhan Comprehensive Transportation Design and Research Institute, Wuhan 430012, China
*
Author to whom correspondence should be addressed.
Buildings 2024, 14(2), 457; https://doi.org/10.3390/buildings14020457
Submission received: 29 December 2023
/
Revised: 29 January 2024
/
Accepted: 2 February 2024
/
Published: 7 February 2024
(This article belongs to the Special Issue Investigation on Different Properties of Bitumen and Asphalt Mixtures Using Advanced Techniques)
Abstract
:The asphalt mixture splitting test is one of the most important methods for measuring asphalt’s tensile properties. To characterize the limitations of the traditional splitting test and the influence of the specimen size and loading conditions on the accuracy of the test, the factors affecting the strength of the splitting test were analyzed to reveal the splitting failure state and establish a unified representation model between the splitting and direct tensile tests. Initially, the moment of specimen cracking was taken as a key indicator, combined with image processing technology, to establish a set of criteria to judge the splitting test. Subsequently, standardized splitting tests were conducted and compared to tests of different specimen sizes and loading methods. Based on the octahedral strength theory, the stress points before and after the improved test were compared to the existing failure criteria. Direct tensile and splitting tests were conducted at different rates, and a unified strength–rate function model was established, realizing the unified representation of direct tensile and splitting tests. The research results indicate that the standardized splitting test is prone to the phenomenon wherein the specimen end face cracks before the center, affecting the accuracy of the test and potentially leading to redundant material strength evaluations. Using a loading method with a “35 mm specimen thickness” and a “0.3 mm rubber gasket + 12.7 mm arc-shaped batten” can essentially achieve the test hypothesis of “cracking at the center first”, resulting in less discrete outcomes and closer alignment to the three-dimensional stress failure state. The tensile and splitting strengths are both power function relationships with the rate as the independent variable, establishing a unified function model of the tensile and failure strengths. The research provides a more reliable testing method and calculation model for asphalt pavement structure design, and it also provides an effective basis for the improvement of splitting tests on materials such as concrete and rock.
1. Introduction
In the loading zone, the stress state on the surface of the asphalt pavement is quite complex. Many scholars have improved the road performance of asphalt mixtures through the improvement of asphalt materials [1]. Based on the influence of different rubber sizes on the waste rubber binder, Ren studied the continuous expansion degradation behavior and chemical rheological properties of crumb-rubber-modified asphalt [2]; Li discussed the influence of different regenerants on the performance of an asphalt mixture through self-developed equipment and proposed the best maintenance conditions [3]. Their research provides a basis for the design of asphalt mixtures. Although many scholars have made great improvements to the performance of asphalt mixtures from the material point of view, their mechanical testing still relies on the traditional test methods. The highest tensile stress and strain occur at the outer boundary of the loading zone, where there is rapid stretching and compression changes in the tangential stress and strain, transitioning from compression to tension [4]. Within the loading area, the pavement mainly experiences compressive stress; outside the loading area, the pavement undergoes radial compression, as well as tangential stretching and compression. Therefore, it is crucial to study the strength characteristics of asphalt mixtures under tensile and compressive stress. Among the strength testing techniques, the splitting test reflects the stress conditions outside the loading zone. Consequently, it is imperative to conduct research on the splitting test of asphalt mixtures. However, due to the stress concentration effect at the loading end during the splitting test, the recorded strength values may not reflect the true tensile strength of the material, necessitating the improvement of the testing techniques.
A common technique for the estimation of the strength and low-temperature cracking resistance of asphalt pavements is the asphalt mix splitting test, often referred to as the indirect tensile test [5,6]. In the same year, Carneiro [7] and Akazawa [8] independently proposed the Brazilian disc test, which led to the development of the splitting test. The theoretical basis of the splitting test method is that, when a cylindrical specimen is subjected to radial compression, a relatively uniform transversal tensile zone appears at its center. A. Fahimifar [9] studied the impact of the boundary conditions and aspect ratios on the tensile splitting strength. By constructing finite element models under various boundary conditions and simulating fatigue tests and direct tensile tests, it was found that the strength of the splitting test was also affected by the location of the load application. Ma Yszko et al. [10] conducted splitting tests on cubic specimens at different load positions. According to the test results, the load applied along the height of the cube produced better results than that applied along the diagonal. When the location of the load application was changed, there was no significant difference in the splitting test results. Some researchers use soft wood spacers (cushions) between the specimen and the loading plate to reduce the impact of stress concentration at the loading end [11]. The 18th Road Conference Proceedings and the Japan Road Association suggest that, in practical engineering applications of the splitting test, rigid pressure plates should be immediately used for the splitting test, which is also the simplest loading technique [12]. Some scholars have found that, when a uniformly distributed load is applied to the specimen and the loading angle between the loading end and the specimen is controlled at around 20°, the specimen will start cracking from the middle [13,14]. Based on these conclusions, some researchers have developed an arc-shaped loading clamp with the same curvature as the specimen for the splitting test [15], and they have conducted a large number of laboratory tests, confirming that, when this loading method is used, some specimens’ cracks start from the center point. However, when the arc-shaped loading clamp does not establish full contact with the circumference of the specimen, stress concentration at the loading end still exists. Therefore, with this improved technique, it is necessary to ensure the processing accuracy of the clamp and the specimen, as well as the alignment of the upper and lower loading clamps. The cost of this test is high, and it has not been widely promoted and accepted. Sarfarazi et al. [16] developed a new instrument that can directly apply tensile stress to the test piece. The disadvantage is that the overall structure of the equipment is complex and the stress at the failure point of the test piece is uneven, making it difficult to obtain accurate strength measurement results. Some researchers have found that the splitting test cannot satisfy the center point cracking hypothesis in theoretical derivation due to stress concentration at the actual loading end, and the strength value obtained from the splitting test stress concentration under cracking does not reflect the real tensile strength [17].
Although many researchers have discussed how to enhance the splitting test, most of these studies only look at one or two criteria and do not comprehensively evaluate multiple elements for a quantitative analysis and comparison. Furthermore, due to a lack of proper assessment means, objectively evaluating the test improvement outcomes is challenging.
This study addresses the question of splitting test accuracy by utilizing digital image processing technology, employing the moment of cracking as a judgement indicator and conducting an improvement study on the splitting test with respect to the specimen size and test loading method, among other aspects. The impact of the improvement is confirmed by comparing the results with the strength theories that are currently in use. Lastly, a suggested splitting test program is provided, which may effectively lower the test error and data dispersion, allow the more precise assessment of asphalt materials’ tensile strength, and serve as a useful guide for the testing of other materials’ tensile strength. The specific research plan is shown in Figure 1.
2. Materials and Testing Methods
2.1. Materials
The objective of this work was to determine the efficacy of an AC-13 fine asphalt mixture. The asphalt employed in this work was SBS (I-D)-modified asphalt; the coarse aggregate was basalt, and the fine aggregate was limestone. Refer to Table 1, Table 2, Table 3 and Table 4 for the results of the asphalt performance index test, aggregate index test, mineral aggregate gradation, and Marshall test at the ideal asphalt aggregate ratio.
2.2. Test Equipment and Process
The test pieces in this research were compacted using an Italian CONTROLS 76-B0252 rotary compactor (Italian Matest Company, Arcore, Italy). The generated test pieces were φ100 mm × 90 mm AC-13 mixed test pieces. Using the surface drying technique, the gross bulk density, porosity, and other aspects of the cut test piece were determined in accordance with the Highway Engineering T0706-2011 Test Code for Asphalt and Asphalt Mixtures [18]. To reach the requisite specimen thickness, the cylindrical specimen created by rotary compaction was further cut with an infrared-controlled cutting machine with a cutting error of less than 0.1 mm. The specimen fabrication process is illustrated in Figure 2.
For the asphalt mixture splitting test, this study utilized a MTS (Material Testing System)—the Landmark Multi-Purpose Material Testing System. The upper and lower compression strips were connected to the loading end to load the specimens. The MTS system measured stress and strain in the vertical direction, while a JM3812 wireless static strain gauge measured the strain on the specimen surface. According to the specifications, the test was loaded utilizing controlled displacement at a rate of 60 mm/min, and the test loading fixture was 12.7 mm arc-shaped batten. The specimen was loaded as shown in Figure 3.
2.3. Judgment of Splitting Failure
The split test is frequently used as an indirect tensile test to assess the tensile qualities of materials, including asphalt, concrete, and rock. During the loading process, the top of the specimen is pressurized, material deformation results in tensile force at the center of the circle, and the material is damaged in tension. Many academic studies have demonstrated that, during the splitting process, once the end of the specimen is loaded, the fracture is always created at the center of the circle first, and it soon penetrates through the entire specimen. At this point, the specimen’s overall damage shape is transformed from perfect tensile damage to compressive damage. This test’s inaccuracy will have a direct impact on the precision of the stress computation, which will result in mistakes when assessing the mechanical characteristics of the materials. Through the collection of the cracking times at the end and center of the specimen, as well as the calculation of the difference between the cracking times of the two, this study aimed to ascertain whether the specimen displayed the damage form of center-first cracking in the ideal scenario.
We pasted strain gauges along the horizontal direction at the center of the circle (channel 1), where the specimen was theoretically subjected to tensile force and the first to crack, and at the end of the specimen, which was prone to stress concentration cracking (channel 2), in order to more intuitively analyze the cracking state of the split specimen. We also pasted strain gauges at the same positions on the other side of the specimen (channel 3 and channel 4). The top portion of the strain gauges for channels 2 and 4 was approximately 9 mm away from the apex of the vertical axis, and the strain gauges were pasted on the horizontal axis at the round center points of the two end faces, as shown in Figure 4. In order to facilitate the strain collection procedure and determine the crack initiation point’s position and timing, as well as the crack penetration sequence, the test additionally employed video equipment to film the whole specimen splitting test process.
In ideal circumstances, the strain gauges at channels 1 and 3 would fail first, followed by the end strain gauges at channels 2 and 4, and finally, the middle of the circle would break when the specimen achieves its maximal strength. The MTS recorded the peak load at this point. In summary, this study led to the following conclusions about the specimen judgement method: ① the moment of failure of the strain gauges at the center of the two end faces is approximately equal; ② the moment of failure of the strain gauges at the center of the circle is approximately equal to the moment of the peak of the MTS force; ③ the strain gauges at the center of the same end face fail before the end strain gauges.
2.4. Results of the Conventional Splitting Test
In line with JTG E20-2011, Chinese Test Procedures for Asphalt and Asphalt Mixtures in Highway Engineering [18], the test was carried out in accordance with Chinese road engineering specifications. A test specimen with a diameter of 100 mm was chosen, using a 12.7 mm arc bead, and the test temperature was set at 15 °C ± 0.5 °C. The loading rate was 50 mm/min. It was advised that the split test piece be 63.5 mm ± 1.3 mm thick. The thickness of this piece was 63.5 mm to be as close to the plane stress condition as feasible. The findings of the tests, which were run in 15 groups in parallel, are displayed in Table 5.
When using the standard test conditions for the split test, it is not always the case that the strain gauges at channels 1 and 3 in the middle of the end face fracture first; in some cases, the fracture time of test specimens close to channels 2 and 4 in the upper loading position is earlier. This information was gathered from the failure times of strain gauges at different positions by the acquisition instrument. In 15 parallel tests, 6 of the split test specimens began to fracture first at the center of the circle and 9 at the location adjacent to the loading point, with considerable dispersion compared to the time of center cracking and the time of failure of the upper strain gauge.
The test process was observed using the VIC-3D digital speckle technique (as shown in Figure 5 and Figure 6), and it was discovered that the test pieces mostly displayed two failure modes; these two failure modes also coincided with the two crack initiation patterns recorded by the digital speckle technique. According to the distance between the circle’s center and the crack tip, Figure 5 demonstrates that, when the center cracks, it is less affected by the stress concentration at the crack tip because of the expansion of the upper end. The center of the circle in Figure 5 cracked “passively”, whereas the center of the circle in Figure 6 cracked actively.
2.5. Shortcomings of the Conventional Splitting Test
According to the previous definition of specimen failure, the data in Table 5 are processed, and the test statistical results of central cracking, top cracking, and undifferentiated central or top cracking are listed in Table 6.
It can be seen from Table 6 that, if the specimen is cracked first from the top, the average strength tested will be reduced to the strength tested by the center crack due to the stress concentration at the top. More importantly, the failure time of the specimen is not fixed, which leads to the large discreteness of the measured strength value, and its standard deviation and coefficient of variation are increased by 248.15% and 264.70% compared to the specimen with the center crack first. Due to the problem of the test method, the test results show errors, which further affects the judgment of researchers on the material properties.
According to the previous definition of specimen failure, it can be seen from the data in Table 5 that, out of the 15 sets of tests that were administered using the conventional test circumstances, only 6 sets (with a pass rate of only 40%) met the assumption of “first crack at the center of the circle”. The test yielded a maximum peak load of 24.928 KN and a minimum load of 20.268 KN, with a 22.97% variation in both values. This indicates that, on the one hand, it is challenging to achieve the optimal damage state within the existing specifications, and, on the other hand, there is a significant amount of fluctuation in the test data, which will result in a significant calculation error.
Table 5 shows that the peak time of the MTS load was later than the crack initiation time of the strain gauge in the center area of each test specimen, even those specimens that cracked first in the center of the circle. The cause of this phenomenon was the stress concentration at the point of contact between the loading strip’s edge and the test specimen, which caused the local asphalt mixture to fail before it did so in the loading strip’s center. To some extent, the magnitude of this erroneous impact can be reflected in the time difference. A larger discrepancy means that the peak load value that the MTS records will be higher, since the middle of the circle is shattered later than the end.
This study then calculated the difference between the strain gauge failure time and the MTS peak load time and the MTS peak load for 6 groups’ central cracks first specimens, as well as their corresponding MTS peak loads, which were plotted as shown in Figure 7.
Figure 7 shows that the average value of the difference between the peak time of the MTS load and the crack initiation time of the effective data center as measured by the strain acquisition instrument was 0.97 s. It is clear that there are issues with the traditional split test method, because previous studies have uniformly taken the average value of the split test data. For the specimen in which the end cracks before the center of the circle, the data are more discrete, and the value obtained will be larger than the true stress value of the specimen. Due to the test circumstances, most researchers pay little attention to this area, which results in a wide range of asphalt mixture splitting test findings that can only be averaged during analysis. As a consequence, the evaluation of asphalt mixtures’ functioning is impacted.
3. Influence of the Splitting Test Conditions and Test Improvement
3.1. Effect of the Specimen Size
According to the Chinese highway specifications, when the nominal maximum particle size of the aggregate is less than or equal to 26.5 mm, the thickness of the test specimen should be taken as 63.5 mm. Some scholars have discovered that the splitting test exhibits significant size effects. Fahimifar A employed numerical simulations to conduct splitting and direct tensile tests under various sizes. The findings indicated that, the smaller the ratio of specimen thickness to diameter, the closer the test results approach those of direct tensile tests [9]. In order to explore the influence of specimens of different thickness on the time of cracking at the center of the circle, 35-mm- and 50-mm-thick cylindrical asphalt mixture specimens were selected for the splitting tests. The test conditions remained the same as in Section 2.3, and six valid data points were obtained. The differences between their strain failure times and the MTS failure time were summarized and processed, as shown in Figure 8 below.
As shown in Figure 8 and Table 7, the average value of the “difference between the moment of strain gauge failure and the moment of peak MTS load” was approximately 0.966 s for a specimen thickness of 35 mm, which was 18.14% less than the specimen thickness of 50 mm and 41.03% less than the specimen thickness of 63.5 mm. The test results show that the difference between the cracking moment at the center of the specimen with a thickness of 35 mm and the peak moment of the MTS load was smaller, and the damage form of the specimen was also closer to the ideal state assumption in which the “center of the circle is the first to crack”. Furthermore, the processing of the test data yielded a coefficient of variation of 0.0178 for the peak MTS load for a specimen thickness of 35 mm, which was 123% lower than the value of 0.0398 for the 50 mm specimen. This suggests that the data dispersion of specimens with a 35 mm size was smaller and more reliable.
The analysis revealed that, the thinner the specimen, the closer it is to the plane stress condition indicated by the theory of the splitting test, resulting in the most satisfying result of a 35 mm splitting specimen, based on our study. When compared to the 50-mm- and 63.5-mm-thick specimens, the time delay from the breakage at the center of the circle to cracking at the edge of the compression strip was shorter in the 35-mm-thick specimen, which is more favorable for further strength analysis and also more conducive to material savings. In conclusion, the suggested size for the splitting test in this study was 35 mm.
3.2. Effect of the Test Loading Fixture
The strength of the split test is significantly impacted by the test fixture as well. Previous array parallel tests on 12.7 mm arc bars have all revealed that the terminal stress concentration eventually cracks. P. Jonsén [17] conducted a rock splitting test by varying the arc of the arc splint. The outcomes demonstrated that altering the clamp’s size could successfully reduce the stress concentration at the end. Therefore, 15 sets of parallel tests were conducted for each of the 19 mm arc bar splitting and rigid pressing plate splitting specimens in this section at the loading rate of 60 mm/min, chosen via earlier testing, maintaining the test specimen thickness of 35 mm and the test temperature of 15 °C. Figure 9, Figure 10, Figure 11 and Figure 12 illustrate the cracking moments and typical damage diagrams of the 19 mm curved compression bar splitting and rigid compression plate splitting specimens.
The rigid plates and the split specimens were in linear contact at the start of the test, and the type of loading was linear loading. Because of the low load value in this state, even if there was stress concentration at the loading end, it was insufficient to induce a macro break. The load gradually increased as the test progressed, and the split specimen was converted from a linear load to a surface load. The uneven deformation of the asphalt mixture itself caused a high degree of stress concentration at the loading end, complex damage occurred at the end face, and the 19 mm curved compression strip specimen was similar to the rigid compression plate specimen. It was found that merely altering the loading fixture did not completely reduce the impact of stress concentration at the loading end.
In line with the valid data points determined in Section 2.2, Figure 13 presents the differences between the MTS peak load and the strain acquisition instrument failure time for the valid data points in both loading modes.
Fifteen parallel splitting experiments were performed using each of the two enhanced loading fixtures, with only six achieving center-first cracking, for a 15% success rate. The success rate was not significantly increased over the specification loading technique, and the test still carried a degree of unpredictability. When the difference between the failure time of the strain gauge and the peak load time of the MTS was considered, the results were decreased by 2.5% for the 19 mm curved bar condition and 34.9% for the rigid plate condition when compared to the specification’s 12.7 mm curved bar. This suggests that the rigid plate, among the three loading fixtures used in this work, may more readily achieve the ideal result of center-first cracking.
3.3. Improvement of the Splitting Test Method
In the previous stage, conventional methods were used to analyze the effects of changing the test conditions and specimen dimensions on the splitting test, and it was discovered that the assumption that the center of the circle would be the first to start splitting in the test process, as deduced by theory, was impossible to achieve. Some researchers in the field of rock and granular launchers have performed the Brazilian disc test by inserting rubber gaskets into the loading end and specimen, which effectively solves the problem of stress concentration in the contact area of the loading end and specimen and ensures that the cleavage test begins from the center of the cleavage [8]. The rubber gasket is intended to improve the splitting outcome at the loading end and asphalt mixture; after loading the rubber gasket, deformation occurs, and the asphalt mixture forms a certain type of curvature. However, it is not possible to apply rubber gaskets of different thicknesses at the loading end of a specific specimen in order to conduct an in-depth analysis. To conduct the asphalt mixture splitting test in this stage, this study used the loading method of 12.7 mm curved compression strips and rigid compression plates, which worked well in the previous experiments. Table 8 lists the individual test improvement techniques, whereas Figure 14 displays the test scheme. The remaining experimental conditions remained the same.
According to the Chinese road engineering standard, the stress at the center point of the split test circle may be determined using the elastic mechanics theory from Equation (1) [18].
where and signify the tension in the x and y directions at the center of the specimen’s circle. The peak load applied to the specimen (KN) is denoted by P, and the area of the specimen exposed to the force is denoted by A (m2).
Because the compressive strength of the asphalt mixture is substantially larger than the tensile strength, the specimen’s center point first exceeds the tensile stress limit to achieve destruction, and the destructive stress equals the tensile stress, as indicated in Equation (2):
where signifies the splitting strength of the specimen.
As can be seen in Figure 15 and Figure 16, this study analyzed the test data and obtained results for the splitting strength, cracking duration, and cracking moment difference of valid specimens under six distinct loading scenarios, in accordance with the judgement method of specimen failure presented in Section 2.3.
The data in Figure 15 reveal that, when the rubber pad thickness increases from 1 mm to 10 mm, there is a significant increase in the failure time, and both the success rates of the test show improvement. Conversely, when the rubber pad thickness increases from 0.3 mm to 1 mm, there is no substantial change in the failure time, but both the success rate of the test and the dispersion of the data decrease. This suggests that both overly thick and overly thin rubber pads can reduce the experimental error. This is a result of the rubber gasket’s buffering effect on the split test force. The stronger the buffering effect, the thicker the rubber gasket. However, if the rubber pad is excessively thick, there will be a loss in the force transmission process, which will result in the measured strength value being lower. As a result, the longer the split failure time and the longer the load transmission time on the rubber gasket, the greater the data dispersion. Compared to rigid loading, the loading method of 0.3 mm rubber mat + curved compression strip can increase the success rate of the test and reduce the dispersion of the data.
The statistical difference between the MTS failure time and the strain gauge failure time at the effective data point is depicted in Figure 16. Although the average time obtained by splitting the 12.7 mm arc bead is shortened to 0.140 s, which significantly lessens the impact of stress concentration, the starting time of the strain gauge is still later than the peak time of the MTS load. This finding suggests that the introduction of rubber gaskets can indeed resolve the issue at the loading end. The starting point of the splitting test can be transferred from the edge of the loading strip to the center area after the thickness of the rubber gasket is reduced, which is consistent with one of the theoretical assumptions of the splitting test. In comparison to the other loading circumstances, the splitting strength values demonstrated a considerable decrease under the loading of a 10 mm rubber gasket + 12.7 mm arc-shaped batten. This shows that, while the rubber mat helps the material to break first in the center of the circle, it also absorbs some of the energy, lowering the splitting strength. As a result, it is important to regulate the rubber mat’s thickness as much as possible within a range that does not impact its splitting strength.
This study processed the test findings using the principle of valid data screening, which is explained in Section 2.3, to create a stress–strain curve for each valid specimen, as shown in Figure 17, in order to better assess the stress patterns of the specimens.
The test findings suggest the “0.3 mm rubber gasket + 12.7 mm arc-shaped batten” combination as a superior splitting test technique for the following reasons:
- (1)
- It is clear from Figure 17 that the enhanced splitting result of the “0.3 mm rubber gasket + 12.7 mm arc-shaped batten” strategy better characterizes the elastic deformation stage in the stress–strain curve than previous techniques, and the test results are generally more trustworthy.
- (2)
- In the cracking test, the “0.3 mm rubber gasket + 12.7 mm arc-shaped batten” can successfully lessen the failure time difference and accomplish the ideal result in which the “center of the circle cracks first”. It also has the most logical strength data, a high success rate, and little data dispersion from the perspective of data analysis.
- (3)
- By comparing the splitting test results for rubber gaskets of various thicknesses, it is discovered that “0.3 mm rubber gasket + 12.7 mm arc-shaped batten” is the most economical and cost-effective.
3.4. Research on the Strength Model of the Asphalt Mixture Splitting Test
This study employed sophisticated digital image techniques to monitor the surface strain during the test in order to gain a better understanding of the failure mode of the split specimen. First, the specimen had to be pretreated with a size grid and dispersant. A high-speed camera was utilized to record the specimen’s deformation during the test; then, the surface strain was processed, and the results were plotted on a graph. Among them, the surface strain of the specimen obtained in the loading mode of “0.3 mm rubber gasket + 12.7 mm arc-shaped batten” is shown in Figure 18.
Figure 18 illustrates that the specimen’s end pressure caused substantial deformation during the initial loading stage. At the core of the specimen’s circle, progressive tensile strain started to form during the middle loading phase. Once the specimen reached a later stage of loading, the center of the circle reached the destructive strength of the material before the end, causing cracking (the point of failure as seen on the strain cloud). The specimen’s interior was subjected to both the pressure descending from the tip and the tensile force caused by the material’s deformation.
According to the current Chinese code, damage occurs when the tensile stress in the center of the circle approaches the material’s maximum tensile limit. The associated strength theory is a one-dimensional strength criterion [19]. However, it is clearly incorrect to simply consider the tensile limit at the split specimen’s center as the destructive load, since the split specimen’s core is, in fact, in a two-dimensional stress state of vertical pressure and transverse tension. The strength model for the splitting test should take into account the impacts of tensile and compressive stresses, since the damage point at the end face is under both of these types of stress.
The octahedral shear stress strength theory takes into account the three-way principal stresses, , in the specimen and is often used to describe the damage of materials under complex stress states, such as asphalt mixtures and concrete. The relationship between the relative normal stress and the relative shear stress of the octahedron of asphalt mixtures can be determined as follows by analyzing the test data points in order to fit the damage meridian equation in the form of a functional equation for the damage criterion of asphalt mixtures [20]:
where coefficients A, B, and are the material parameters and uniaxial compressive strength of asphalt concrete (Mpa). () and () are the values of normal stress and shear stress on the compression meridian. and are the octahedral normal stress and shear stress and are calculated by the formulas below.
Many scholars have studied the failure mechanism of asphalt mixtures through triaxial tests. Huang et al. produced an AC-13C asphalt mixture and conducted triaxial tensile and compressive tests under different loading modes to obtain the octahedral strength theory failure criterion for this type of asphalt mixture, as follows [21]:
Four representative splitting test data of 63.5 mm, 50 mm, 35 mm, and 35 mm + 0.3 mm rubber mats under the loading of 12.7 mm curved compression strips were selected and substituted into Formulas (3) and (4) in order to verify the improvement effect of the splitting test in this study. was obtained in accordance with the requirements of the uniaxial compression test of asphalt mixtures, and the average was 11.4 Mpa. After processing the data points, this study considered them alongside Huang’s suggested damage criterion [21] for the AC-13C asphalt mixture on the hydrostatic pressure surface. Figure 19 presents the findings.
As shown in Figure 19, after optimizing the loading technique and split test specimen size, the data obtained were closer to the damage curve obtained from the triaxial test under the strength criterion of a tensile and compressive composite, thereby reducing the error and increasing the test accuracy when compared to the pre-improvement case.
Although, compared to other test methods, the improved data are closer to the ideal failure state, due to the facts that the splitting tests conducted in this study are all two-dimensional tension compression tests and Huang’s formula is obtained from the tension compression composite test under a three-dimensional stress state, the test data points and failure model still cannot fit well in the stress space, which will also be the focus of future research.
4. Analytical Comparison between the Splitting Test and the Direct Tensile Test at Different Loading Rates
Since the split test center is under mixed compressive and tensile stress, its strength result cannot be purely interpreted as a direct tensile strength value. Nevertheless, the split test is an indirect tensile test often used to assess the tensile qualities of materials. The straightforward splitting test may take the place of the problematic direct tensile test, greatly aiding in the tensile property testing of materials, provided that the splitting test results can be connected to the direct tensile results.
Using the same conditions as in the previous experiment, rectangular specimens of the AC-13C asphalt mixture were cut, measuring 50 mm × 50 mm × 250 mm. Strain gauges were attached to the specimens’ four outside surfaces in order to record the specimens’ breakage moments, and the ends of the specimens were attached to the MTS loading plate using epoxy glue. In order to more accurately analyze the effect of different loading rates on the damage of the specimen, tension force was applied in the form of stress control, and the MTS tension rates were 2 kn/s, 4 kn/s, 6 kn/s, and 8 kn/s, respectively. The splitting test used the recommended loading method described earlier, also in the form of a stress control, with loading rates of 2 kn/s, 4 kn/s, 6 kn/s, and 8 kn/s. The test temperature was 15 °C, as indicated in the specifications. The loading process of the direct tensile test is illustrated in Figure 20, and the specimen after tensile failure is shown in Figure 21.
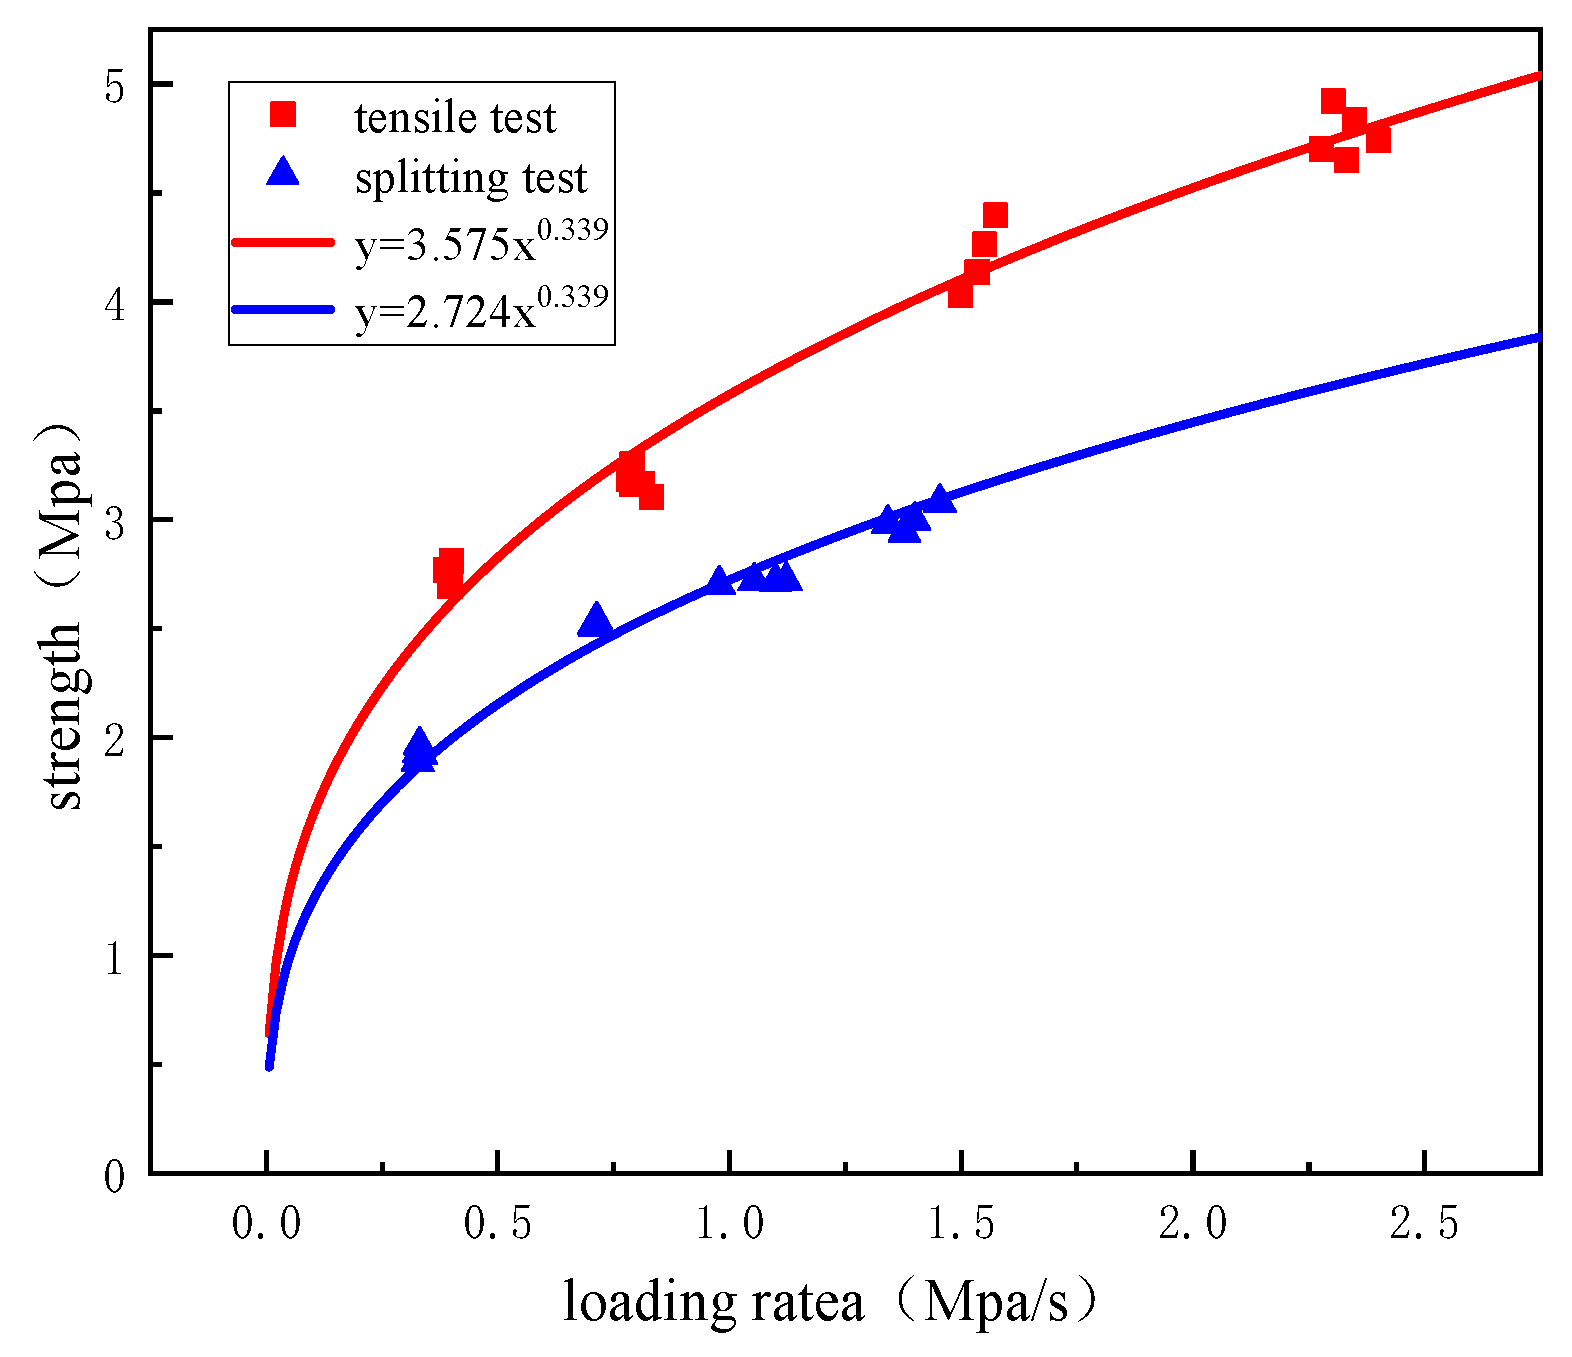
According to the research by Lv [22], the tensile strength of asphalt mixtures exhibits a power function relationship with the rate, as illustrated in Equation (7):
where is the strength (Mpa), is the loading rate (Mpa/s), and are the material parameters.
Substituting the direct tensile test results into Equation (7), the fitting gives the relationship between the strength and loading rate, as shown in Equation (8):
where is the tensile strength (Mpa), and denotes the tensile material parameters (3.575).
The splitting test results were fitted using Equation (7) to determine the strength–loading rate relationship, which is represented in Equation (9). Using the result from Equation (8), is considered to be 0.339.
where is the split strength (Mpa), and denotes the split material parameters (2.724).
Based on Equations (8) and (9), the relationship between the tensile strength () and splitting strength () can be derived, as shown in Equation (10):
The model hypothesis test results of Equations (8) and (9) are shown in Table 9, and the model has good accuracy.
The results of Formulas (8) and (9), as well as all the splitting and tensile tests, are plotted in the strength–rate relationship diagram shown in Figure 22.
Figure 22 shows that the split strength and tensile strength increase initially with an increasing loading rate; the growth rate is first great and then modest, and it then gradually stabilizes, demonstrating a power function trend. The tensile strength is always larger than the splitting strength, as seen in Figure 22, and the two parameters are linearly connected. This also verifies the research presented in Section 3.4. The split test theory regards the transverse ultimate tensile stress at the center of the circle as the indirect tensile breaking strength, but, in reality, the split test is a combination of transverse tensile and longitudinal compression, and the asphalt mixture is more easily damaged than in the direct tensile case. As a result, the indirect tensile strength attained in accordance with the specification will be lower than the direct tensile strength. To minimize errors, the strength–rate unification model derived from the split and tensile test data can be used to quickly determine the direct tensile strength of asphalt mixtures using the split test, greatly simplifying the test procedure and facilitating engineering applications.
5. Conclusions and Recommendations
Based on the analysis of the specimen cracking time, this study used digital image technology to analyze and improve the splitting test of asphalt mixtures. The results can provide a reference for the indirect tensile testing of asphalt mixtures, concrete, and rock.
- According to the “China highway code”, the splitting test of asphalt mixtures was carried out. The end of the sample often breaks before the center of the circle, resulting in stress concentration, and it deviates from the perfect stress state specified in the specifications, resulting in significant errors in the calculation of the splitting strength.
- When using the test strategies of a “35 mm specimen thickness” and “0.3 mm rubber gasket + 12.7 mm arc-shaped batten”, the outcome of the “first crack at the center of the circle” is essentially realized.
- The octahedral strength theory proves that the improved stress point is closer to the existing failure criterion, indicating that the improved splitting test is closer to the ideal failure stress state. In addition, it also successfully reduces the discreteness of the data and improves the success rate of the testing.
- Based on the test results, it is found that there is a power function relationship between the strength and the loading rate, and the unified equations of the tensile and splitting strength rate are constructed. This not only improves the operability but also provides a reference for engineering applications, so that researchers can use the splitting test to quickly estimate the tensile strength of asphalt mixtures.
In future work, the effects of different test loading rates and loading modes on direct and indirect tensile tests will be analyzed. At the same time, the corresponding relationship between the splitting strength and direct tensile strength will be discussed using different strength theories. Finally, the unified direct tension and splitting and fatigue equations will be further established.
Author Contributions
Methodology, H.G. and W.P.; Investigation, H.Y.; Data curation, H.G. and Y.Y.; Writing—original draft, W.P.; Writing—review & editing, H.G. and W.P. All authors have read and agreed to the published version of the manuscript.
Funding
This research and the APC were funded by National Natural Science Foundation of China, grant number: 52078062.
Data Availability Statement
The data presented in this study are available on request from the corresponding author.
Conflicts of Interest
The authors declare no conflicts of interest.
References
- He, Z.; Xie, T.; Yu, H.; Ge, J.; Dai, W.J.C.; Materials, B. Evaluation of quantum dot composite graphene/Titanium oxide enhanced UV aging resistance modified asphalt. Constr. Build. Mater. 2023, 408, 133732. [Google Scholar] [CrossRef]
- Ren, S.; Liu, X.; Lin, P.; Wang, H.; Fan, W.; Erkens, S.J.C.; Materials, B. The continuous swelling-degradation behaviors and chemo-rheological properties of waste crumb rubber modified bitumen considering the effect of rubber size. Constr. Build. Mater. 2021, 307, 124966. [Google Scholar] [CrossRef]
- Li, M.; Ren, S.; Liu, X.; Wu, Z.; Zhang, H.; Fan Xu, J.J.M. A Comprehensive Study on the Rejuvenation Efficiency of Compound Rejuvenators for the Characterization of the Bituminous Binder, Mortar, and Mixture. Materials 2022, 15, 5458. [Google Scholar] [CrossRef] [PubMed]
- Li, S.; Sun, Y.; Xu, L.; Yu, S.; Liang, X.; Ye, J.J.B. Asphalt Layer Cracking Behavior and Thickness Control of Continuously Reinforced Concrete and Asphalt Concrete Composite Pavement. Buildings 2022, 12, 1138. [Google Scholar] [CrossRef]
- Takaikaew, T.; Hoy, M.; Horpibulsuk, S.; Arulrajah, A.; Mohammadinia, A.; Horpibulsuk, J.J.H. Performance improvement of asphalt concretes using fiber reinforcement. Heliyon 2021, 7, e07015. [Google Scholar] [CrossRef]
- Ahmed, K.U.; Geremew, A.; Jemal, A.J.H. The comparative study on the performance of bamboo fiber and sugarcane bagasse fiber as modifiers in asphalt concrete production. Heliyon 2022, 8, e09842. [Google Scholar] [CrossRef]
- Carneiro, F.C. A new method to determine the tensile strength of concrete. In Proceedings of the 5th Meeting of the Brazilian Association for Technical Rules, Lisbon, Portugal, 16 September 1943. [Google Scholar]
- Akazawa, T. New test method for evaluating internal stress due to compression of concrete (the splitting tension test) (part 1). J. Jpn. Soc. Civ. Eng. 1943, 29, 777–787. [Google Scholar]
- Fahimifar, A.; Malekpour, M. Experimental and numerical analysis of indirect and direct tensile strength using fracture mechanics concepts. Bull. Eng. Geol. Environ. 2012, 71, 269–283. [Google Scholar] [CrossRef]
- Małyszko, L.; Kowalska, E.; Bilko, P. Splitting tensile behavior of autoclaved aerated concrete: Comparison of different specimens’ results. Constr. Build. Mater. 2017, 157, 1190–1198. [Google Scholar] [CrossRef]
- ASTM D3967-16; Standard Test Method for Splitting Tensile Strength of Intact Rock Core Specimens. ASTM International: West Conshohocken, PA, USA, 2008.
- Garcia-Fernandez, C.; Gonzalez-Nicieza, C.; Alvarez-Fernandez, M.; Gutierrez-Moizant, R. Analytical and experimental study of failure onset during a Brazilian test. Int. J. Rock Mech. Min. Sci. 2018, 103, 254–265. [Google Scholar] [CrossRef]
- Gutiérrez-Moizant, R.; Ramírez-Berasategui, M.; Santos-Cuadros, S.; García-Fernández, C.J.R.M.; Engineering, R. Computational verification of the optimum boundary condition of the Brazilian tensile test. Rock Mech. Rock Eng. 2018, 51, 3505–3519. [Google Scholar] [CrossRef]
- Erarslan, N.; Williams, D.J. Experimental, numerical and analytical studies on tensile strength of rocks. Int. J. Rock Mech. Min. Sci. 2012, 49, 21–30. [Google Scholar] [CrossRef]
- Gutiérrez-Moizant, R.; Ramírez-Berasategui, M.; Sánchez-Sanz, S.; Santos-Cuadros, S. Experimental verification of the boundary conditions in the success of the Brazilian test with loading arcs. An uncertainty approach using concrete disks. Int. J. Rock Mech. Min. Sci. 2020, 132, 104380. [Google Scholar] [CrossRef]
- Sarfarazi, V.; Haeri, H.; Ebneabbasi, P.; Shemirani, A.B.; Hedayat, A. Determination of tensile strength of concrete using a novel apparatus. Constr. Build. Mater. 2018, 166, 817–832. [Google Scholar] [CrossRef]
- Jonsén, P.; Häggblad, H.; Sommer, K. Tensile strength and fracture energy of pressed metal powder by diametral compression test. Powder Technol. 2007, 176, 148–155. [Google Scholar] [CrossRef]
- Zhang, C.; Yu, H.; Zhu, X.; Yao, D.; Peng, X.; Fan, X. Unified Characterization of Rubber Asphalt Mixture Strength under Different Stress Loading Paths. J. Mater. Civ. Eng. 2024, 36, 04023498. [Google Scholar] [CrossRef]
- Qian, G.; Luo, X.; Yu, H.; Shi, C.; Zhang, C.; Li, P. Evaluation of Material Composition on the Shear Performance of Asphalt Mixtures under Different Test Conditions. Buildings 2023, 13, 936. [Google Scholar] [CrossRef]
- Wang, P.; Elchalakani, M.; Zhou, Y.; Yan, S.-T.; Li, S.-B. A study on the influences of a hygrothermal environment on the compressive strength and failure criteria of asphalt mixtures based on true triaxial tests. Heliyon 2022, 8, e10060. [Google Scholar] [CrossRef] [PubMed]
- Huang, T.; Tang, Y.; Li, M.; Chen, J.; Xie, J.; Lv, S.; Qian, G.; Liu, H. Study on multiple failure criteria of asphalt mixtures in complex stress states. J. Mater. Civ. Eng. 2021, 33, 04021272. [Google Scholar] [CrossRef]
- He, Y.; Lv, S.; Wang, Z.; Ma, H.; Lei, W.; Pu, C.; Meng, H.; Xie, N.; Peng, X. Research on the Modulus Decay Model under a Three-Dimensional Stress State of Asphalt Mixture during Fatigue Damage. Buildings 2023, 13, 2570. [Google Scholar] [CrossRef]
Figure 1.
Research plan.
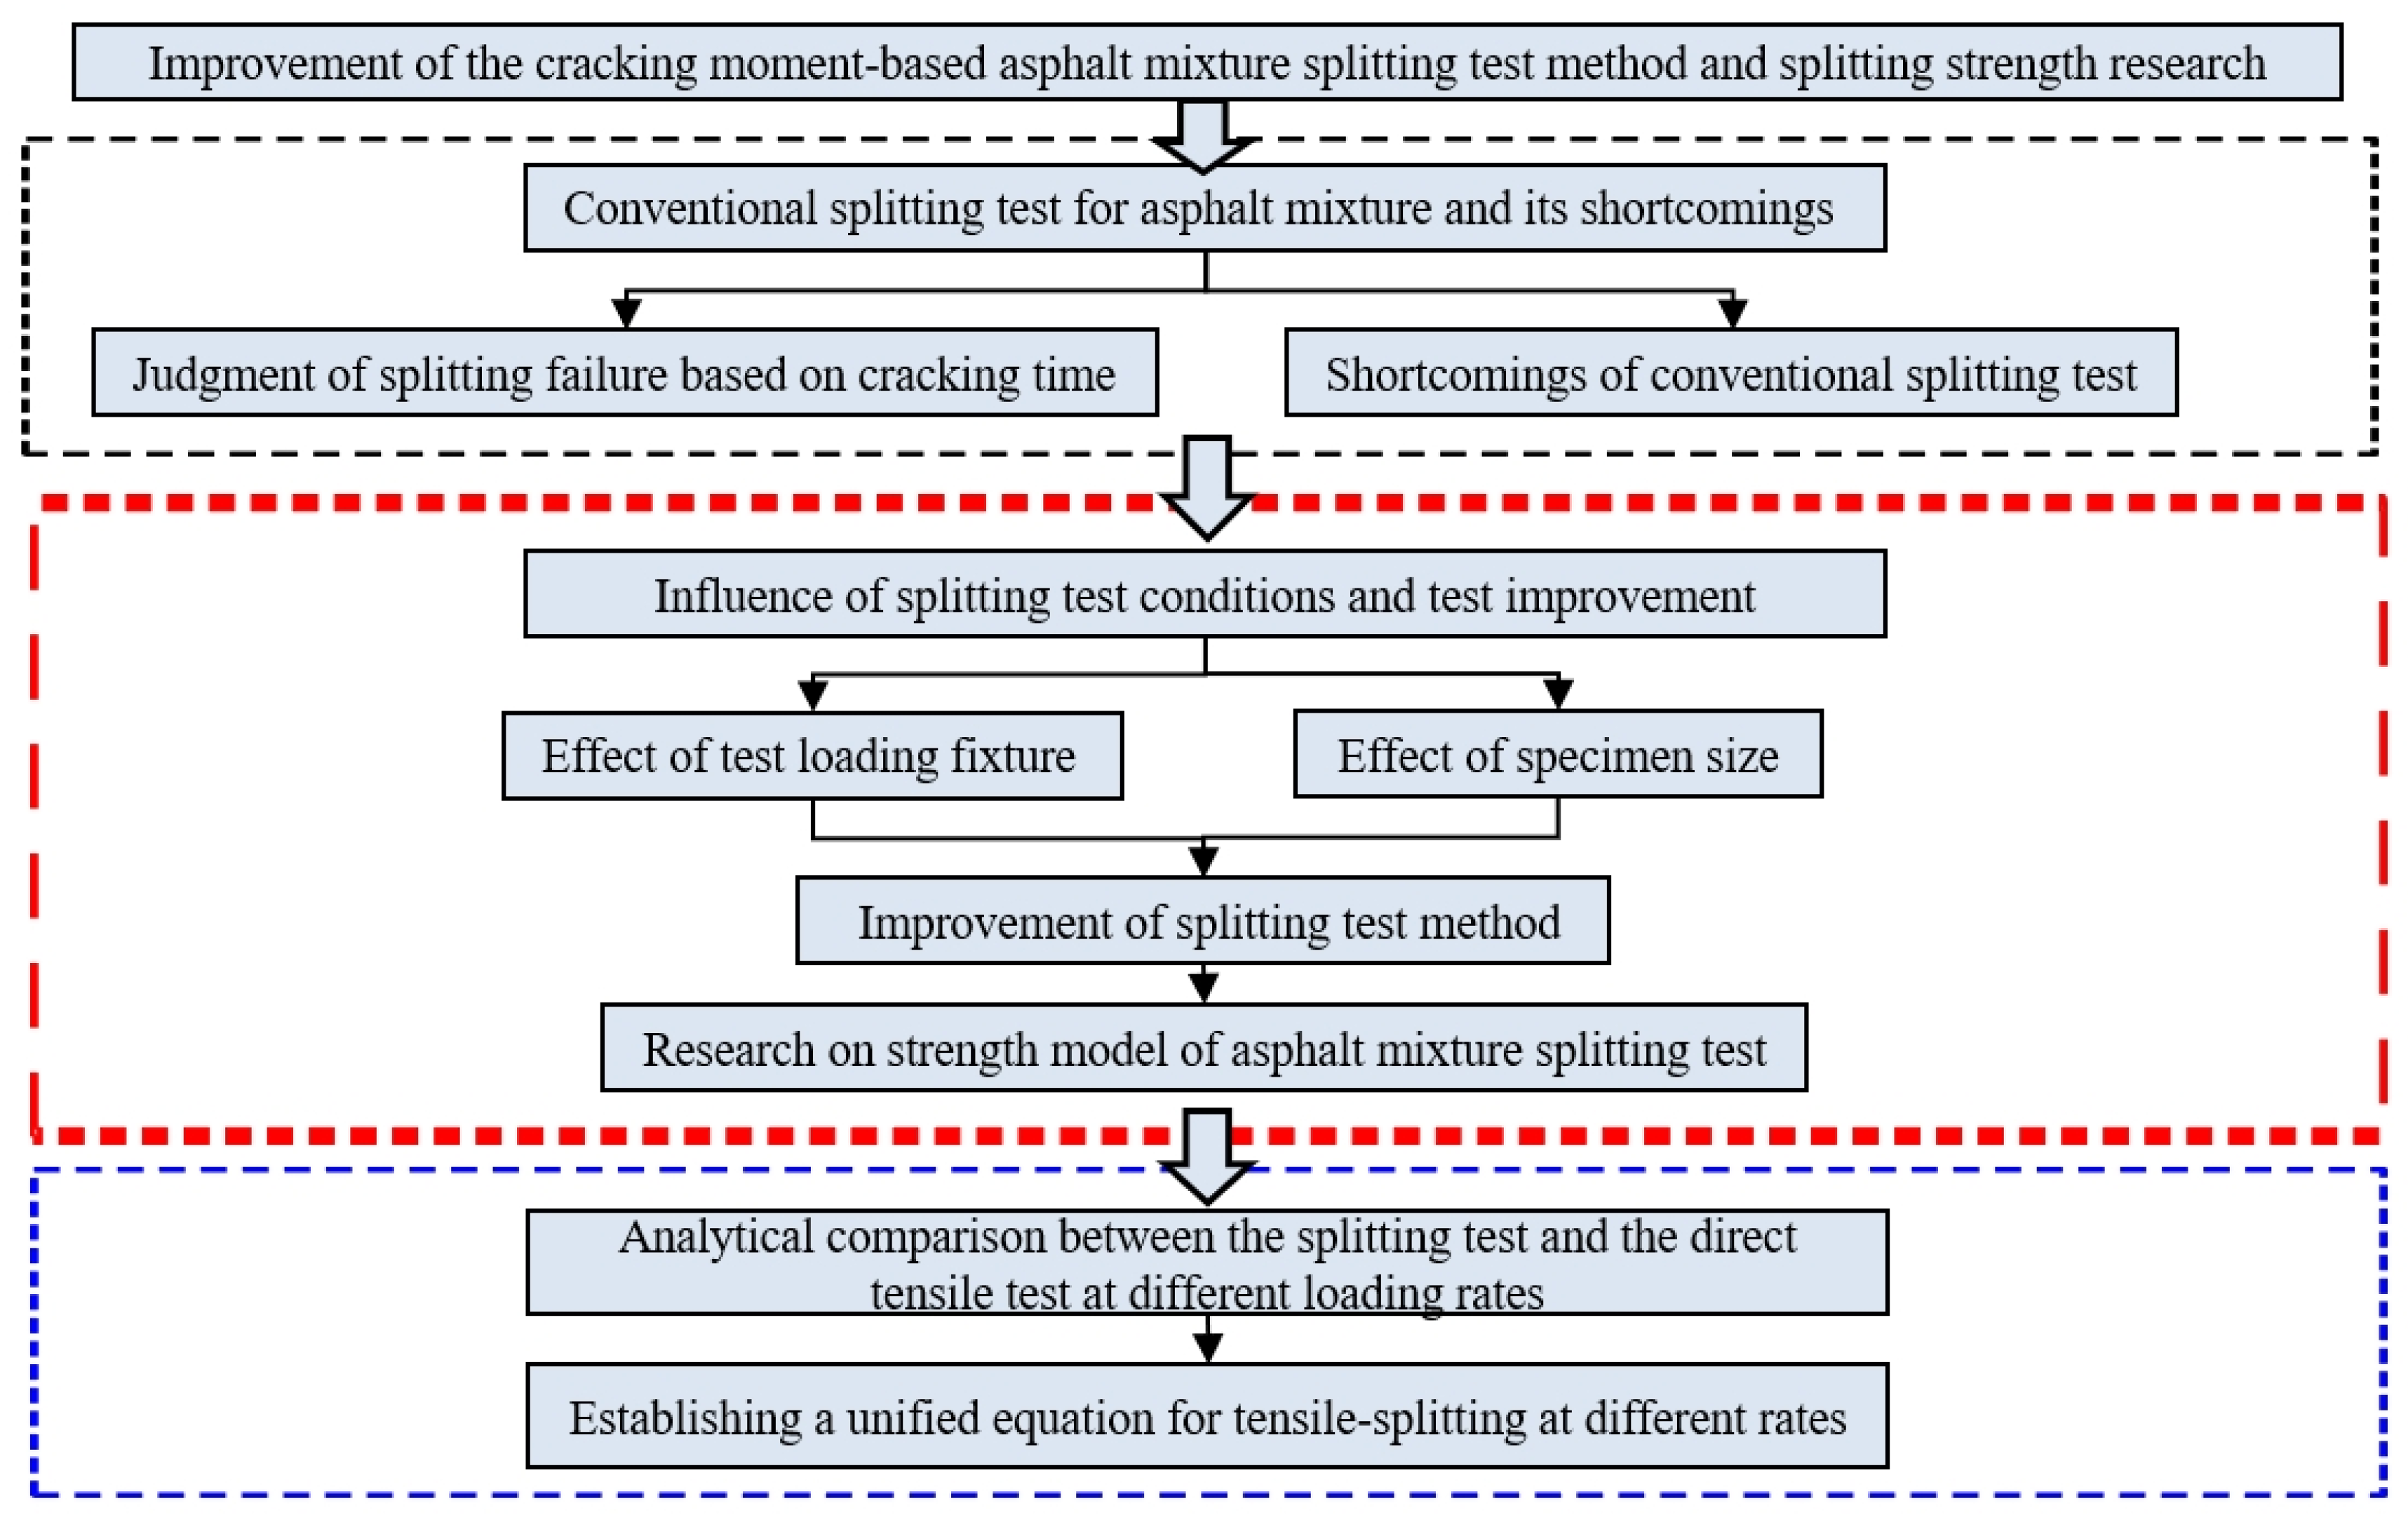
Figure 2.
The specimen fabrication process.
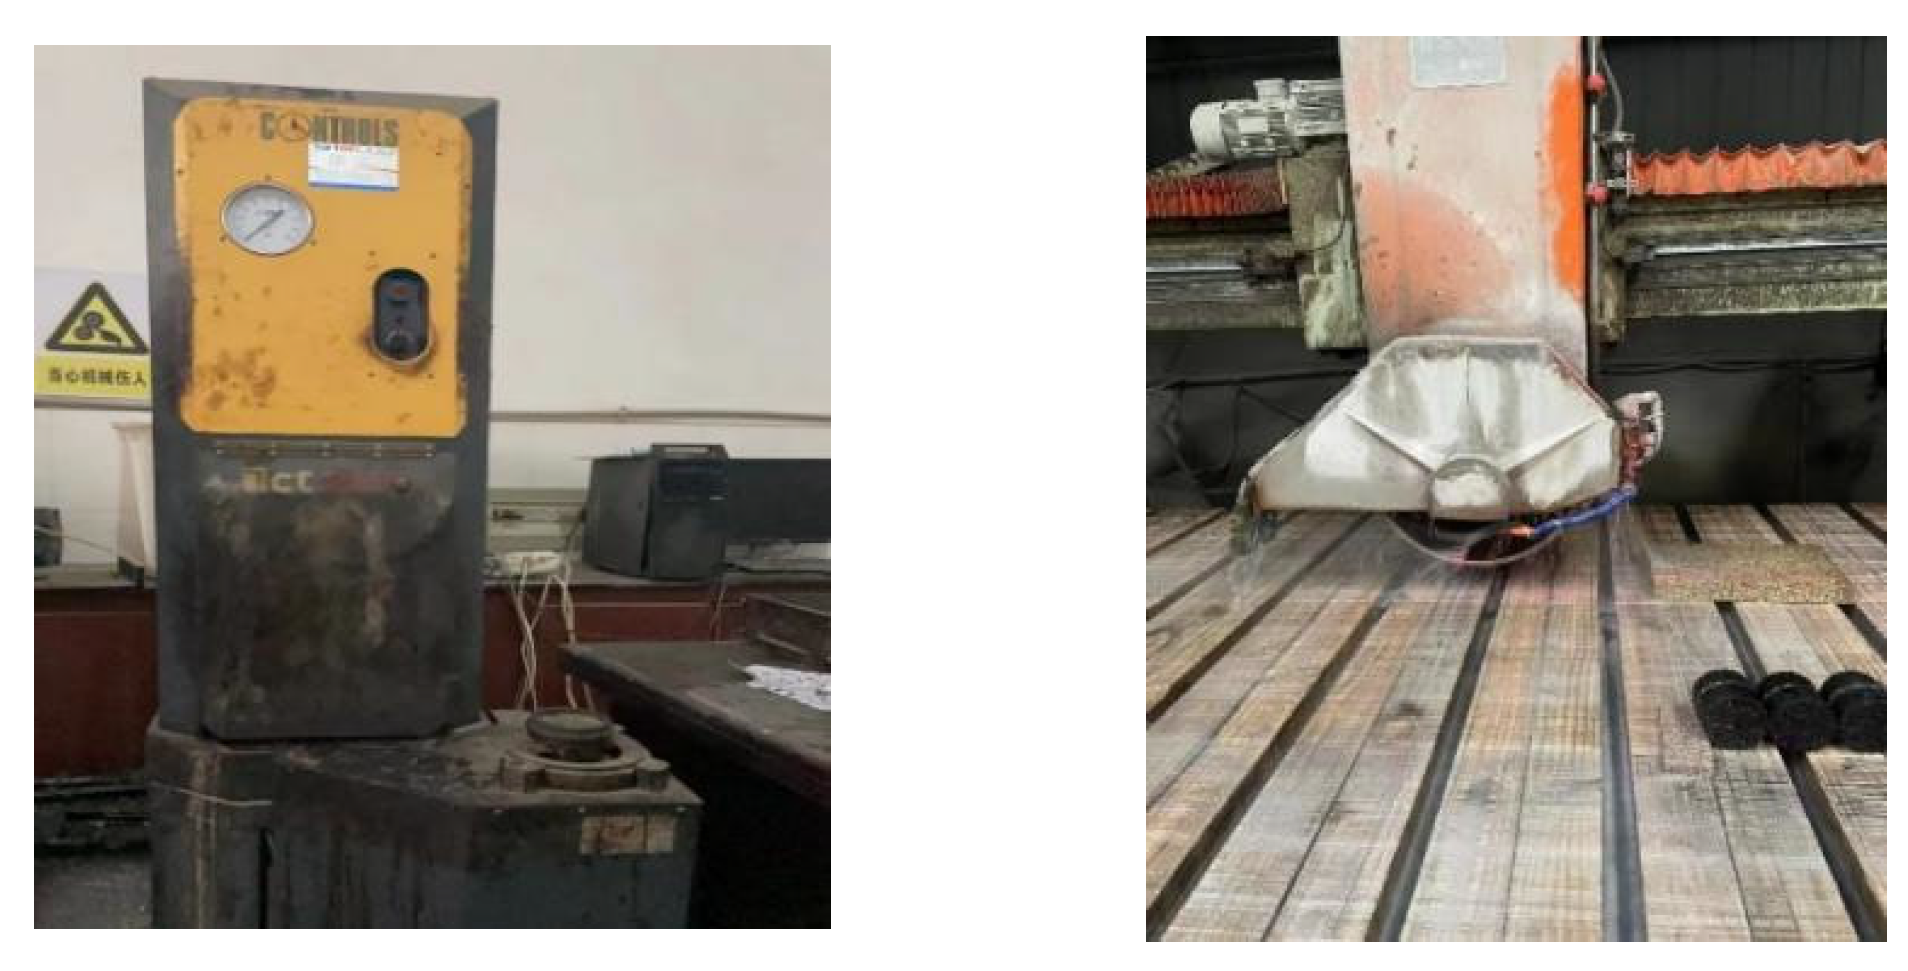
Figure 3.
Example of specimen splitting and loading.
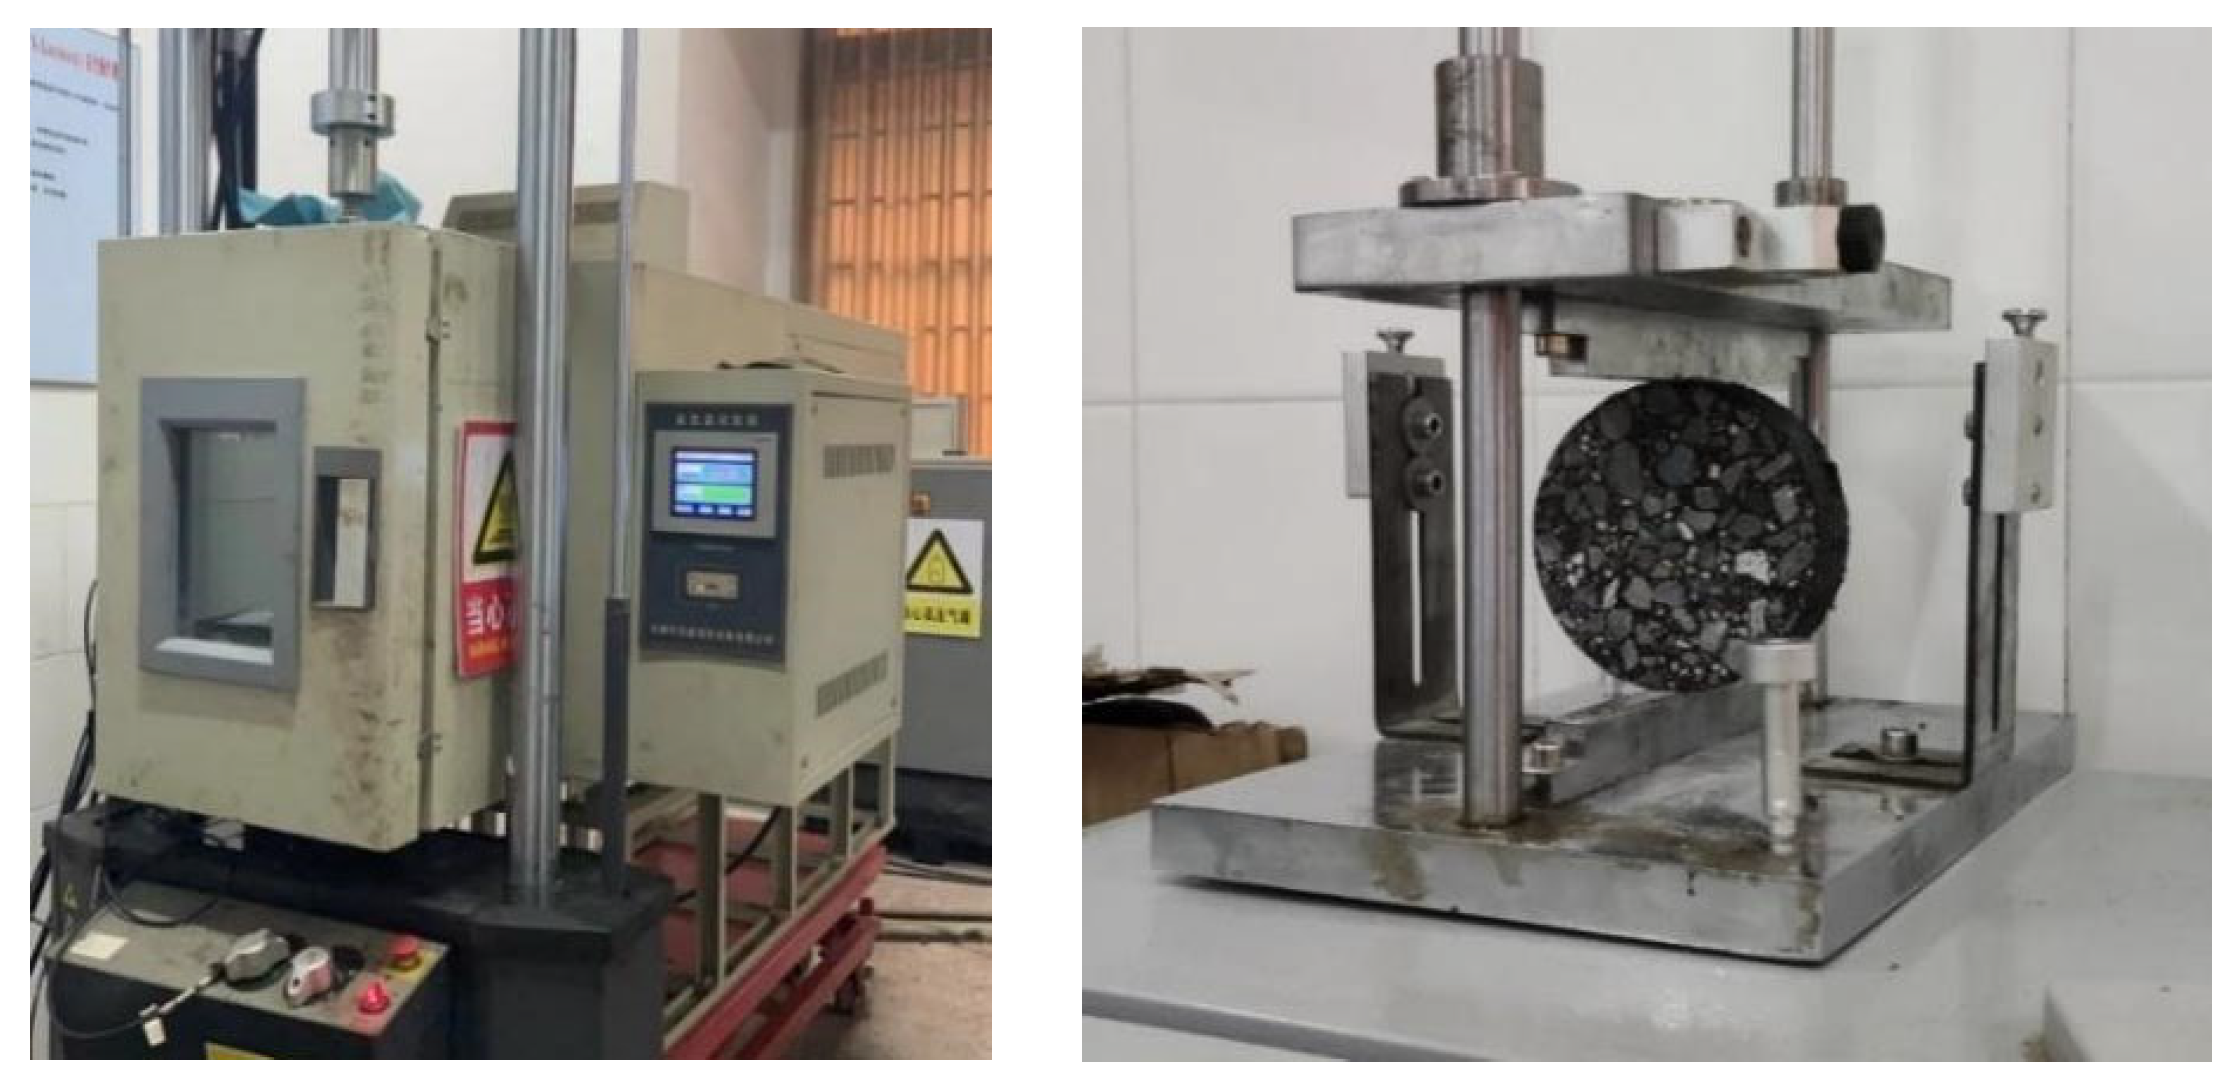
Figure 4.
Distribution of the strain gauges on the specimen.

Figure 5.
Splitting test of test piece 1. (a) Initial stage end stress concentration cracking. (b) The crack starts to expand. (c) The crack extends to the center area. (d) Formation of through cracks.
Figure 5.
Splitting test of test piece 1. (a) Initial stage end stress concentration cracking. (b) The crack starts to expand. (c) The crack extends to the center area. (d) Formation of through cracks.
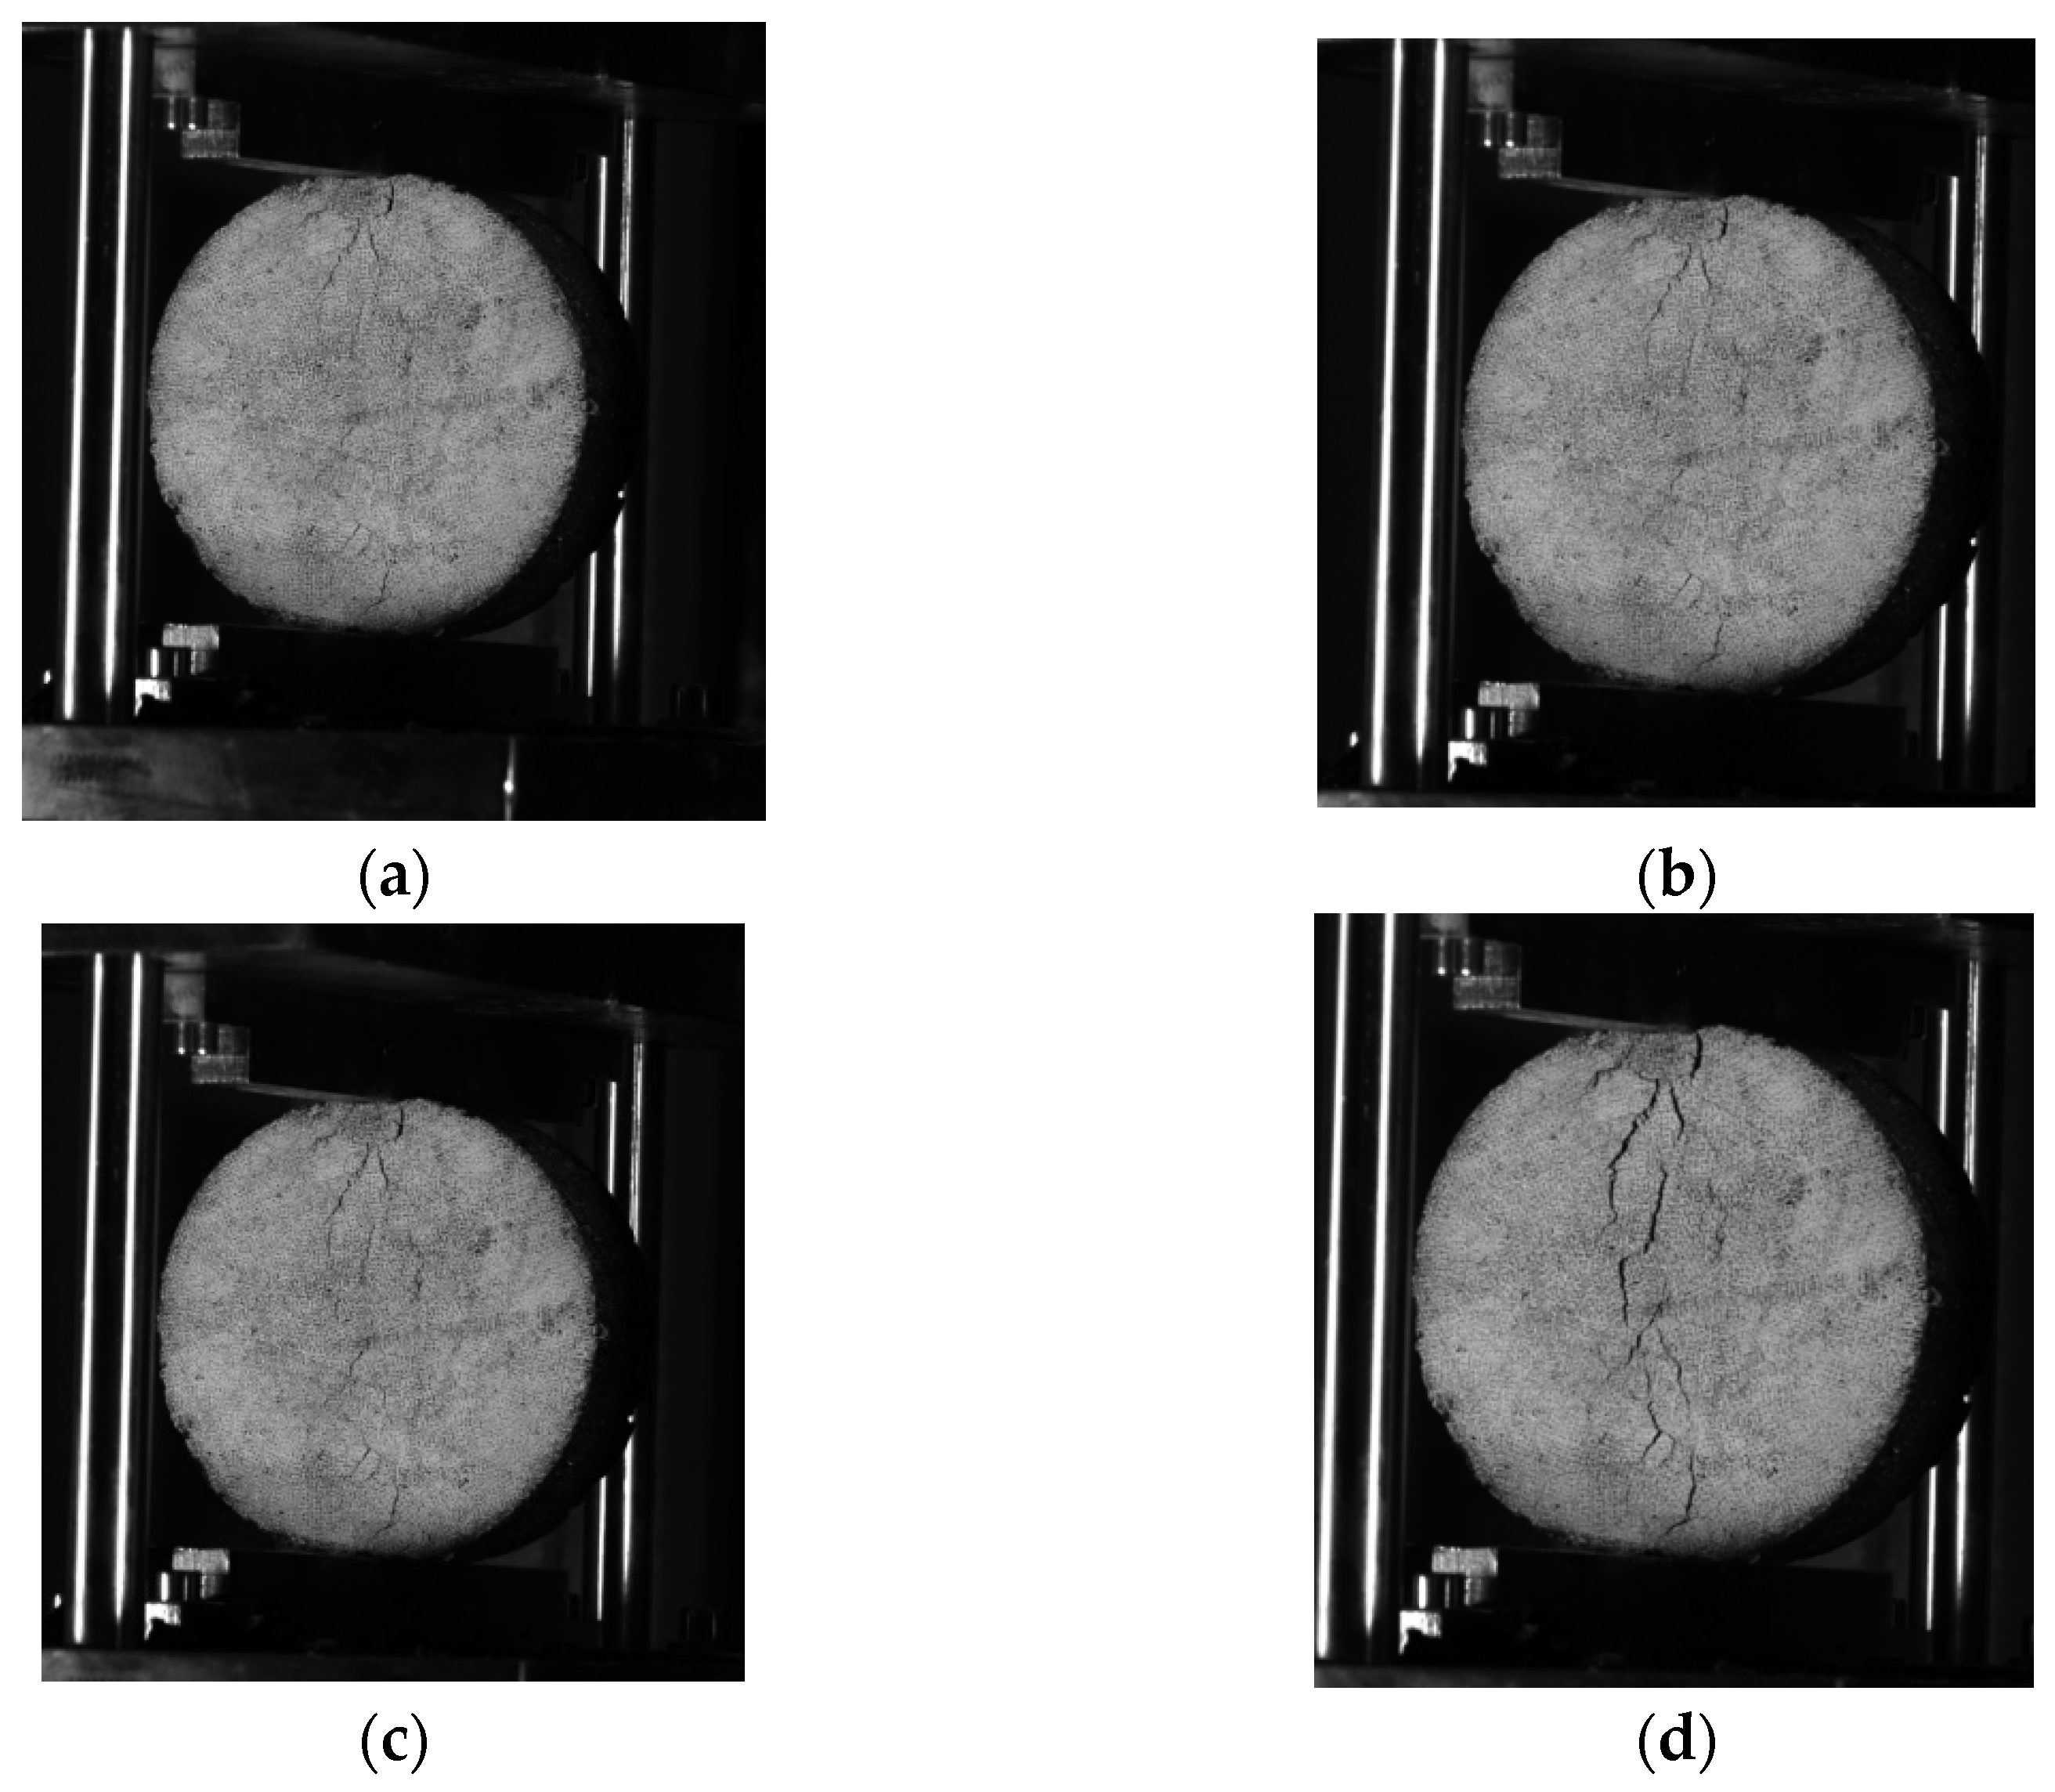
Figure 6.
Splitting test of test piece 2. (a) Initial stage end stress concentration cracking. (b) Cracking at the center of the circle. (c) Crack propagation stage. (d) Formation of through cracks.
Figure 6.
Splitting test of test piece 2. (a) Initial stage end stress concentration cracking. (b) Cracking at the center of the circle. (c) Crack propagation stage. (d) Formation of through cracks.
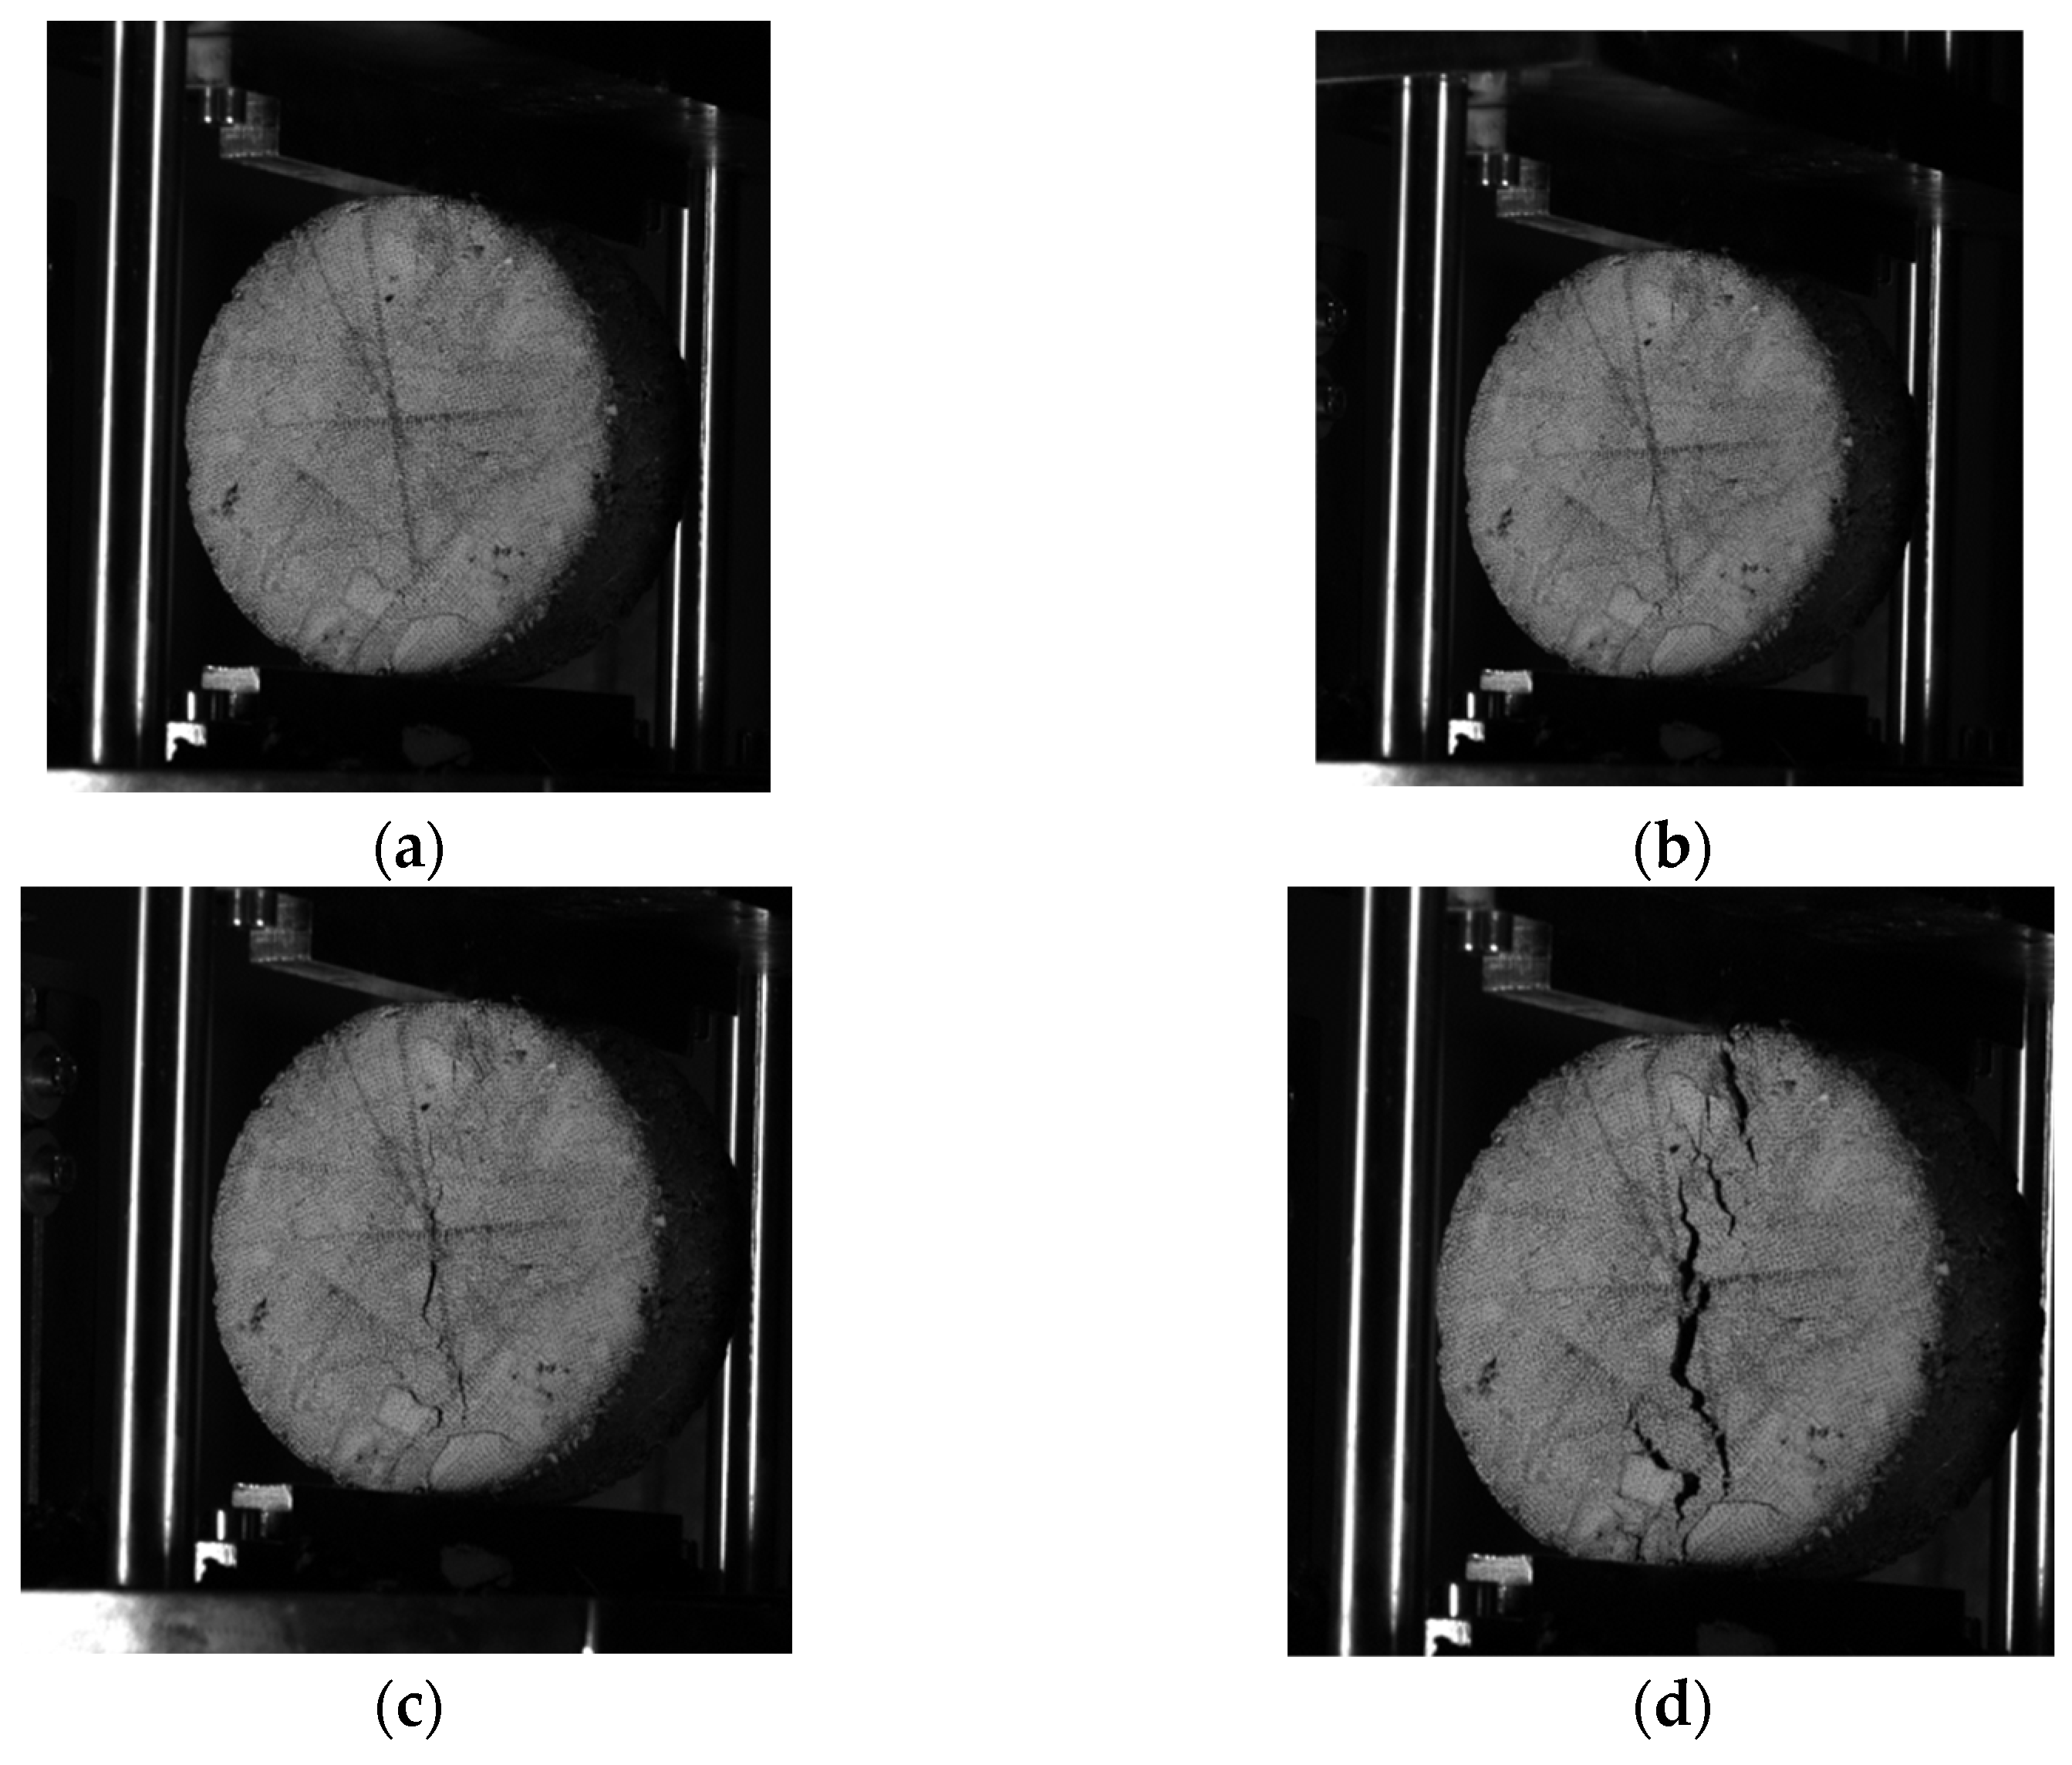
Figure 7.
Time difference and MTS peak load in the specimens of “central cracks first”.
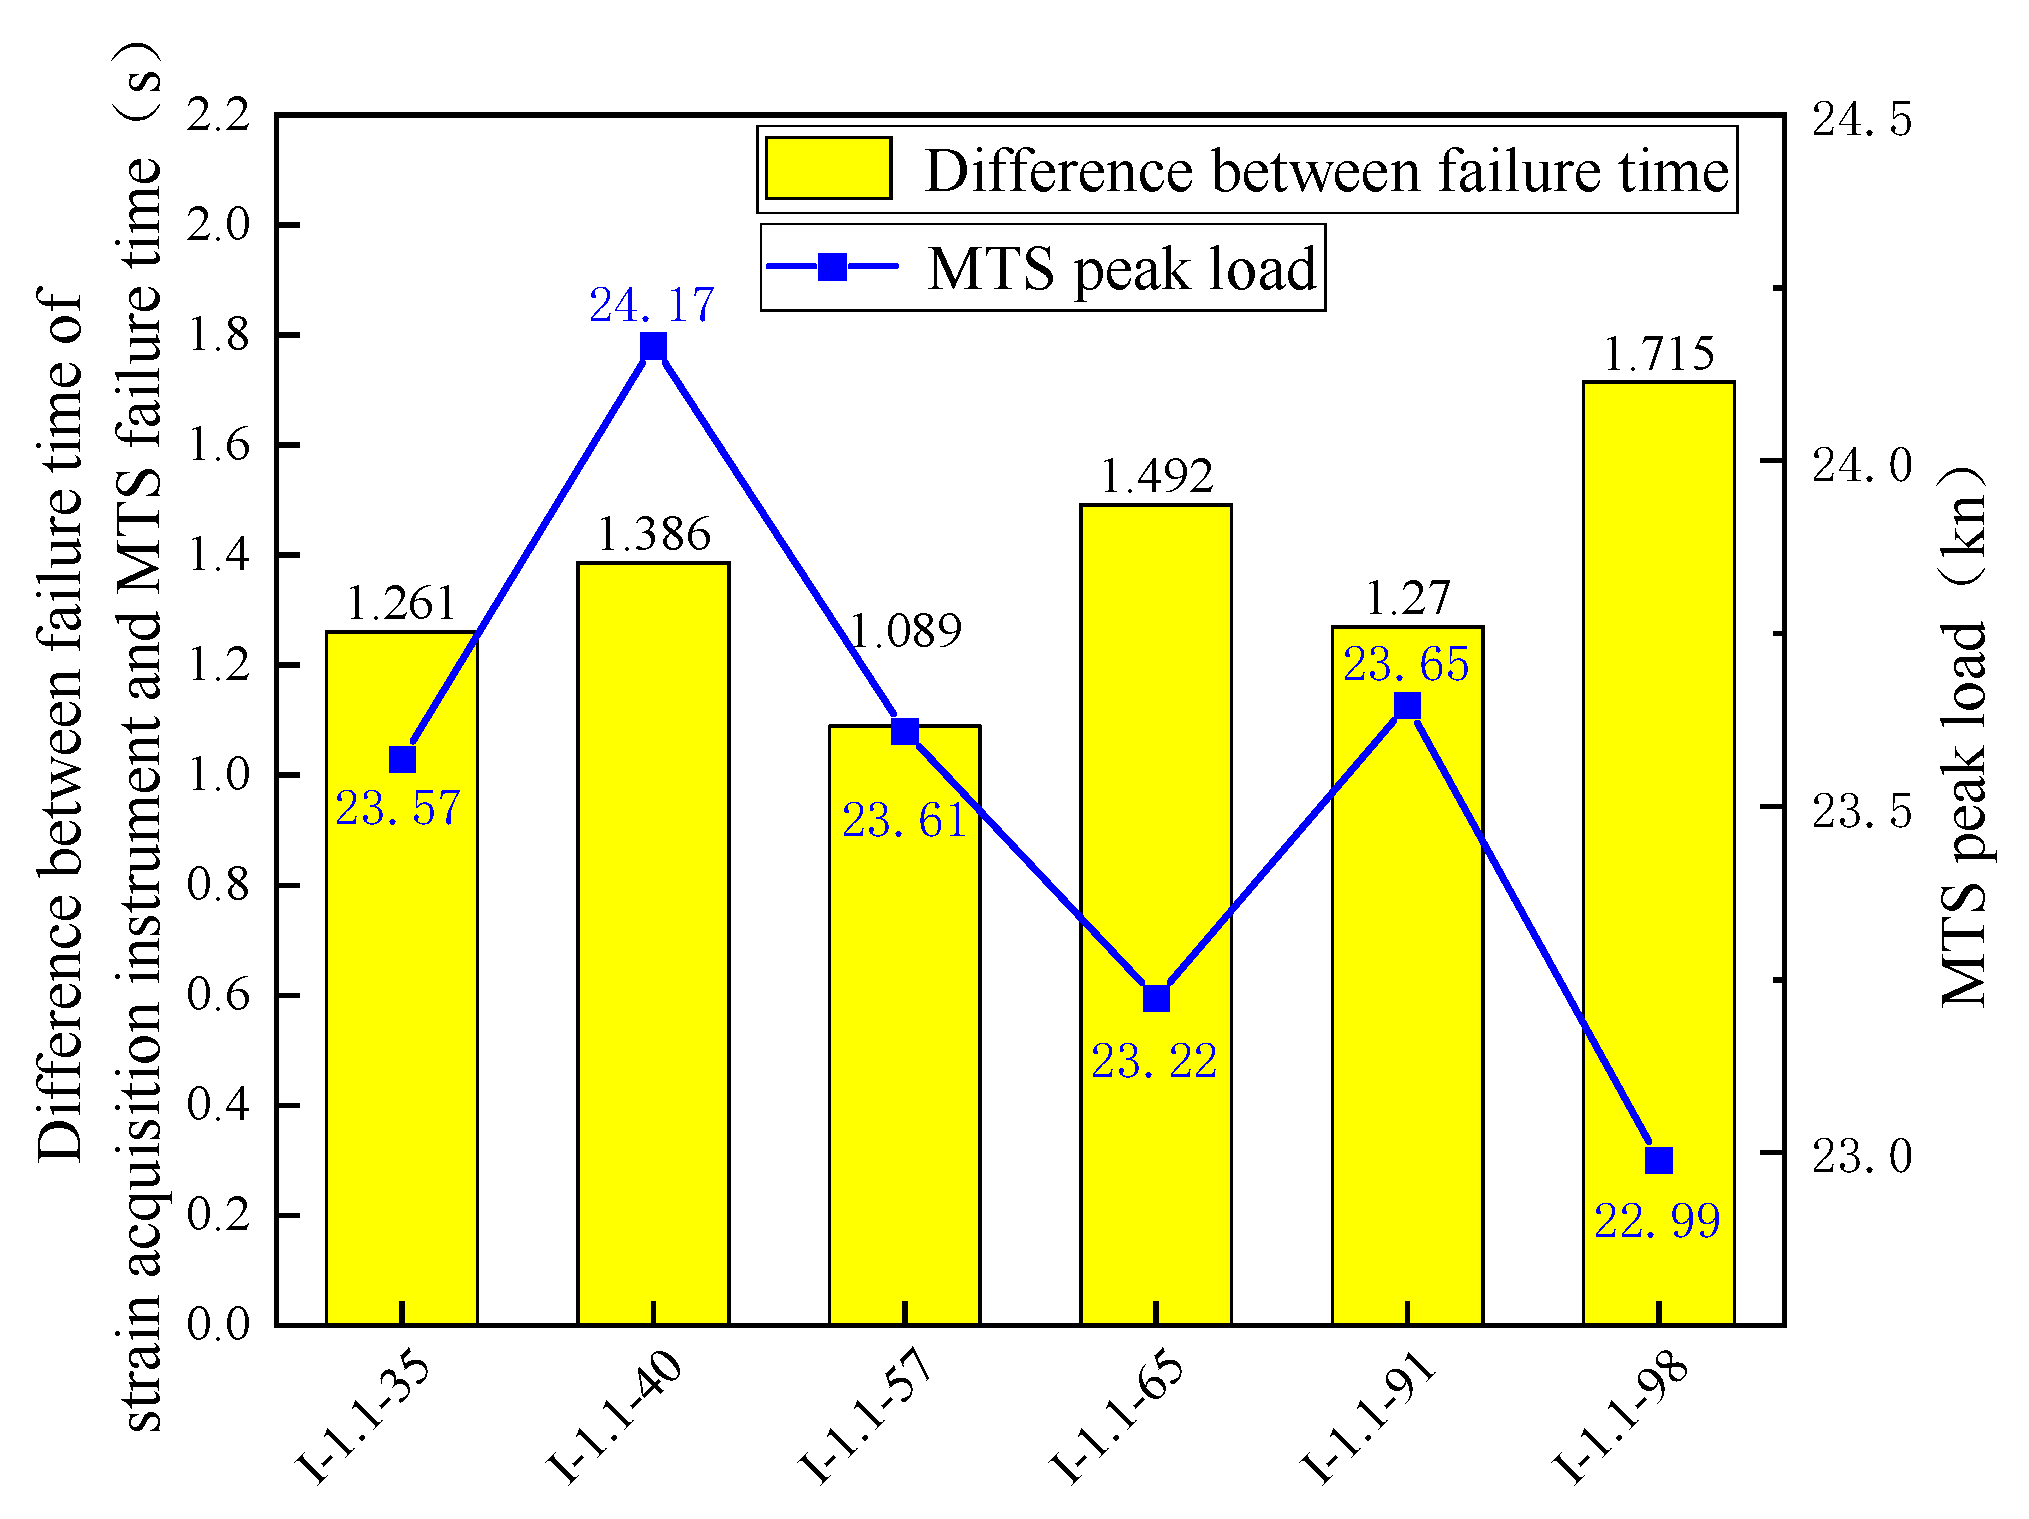
Figure 8.
Time differences for differently sized specimens.

Figure 9.
Starting state of the 19 mm arc bead splitting end face.

Figure 10.
State of the splitting end face of the rigid pressing plate at the time of starting.
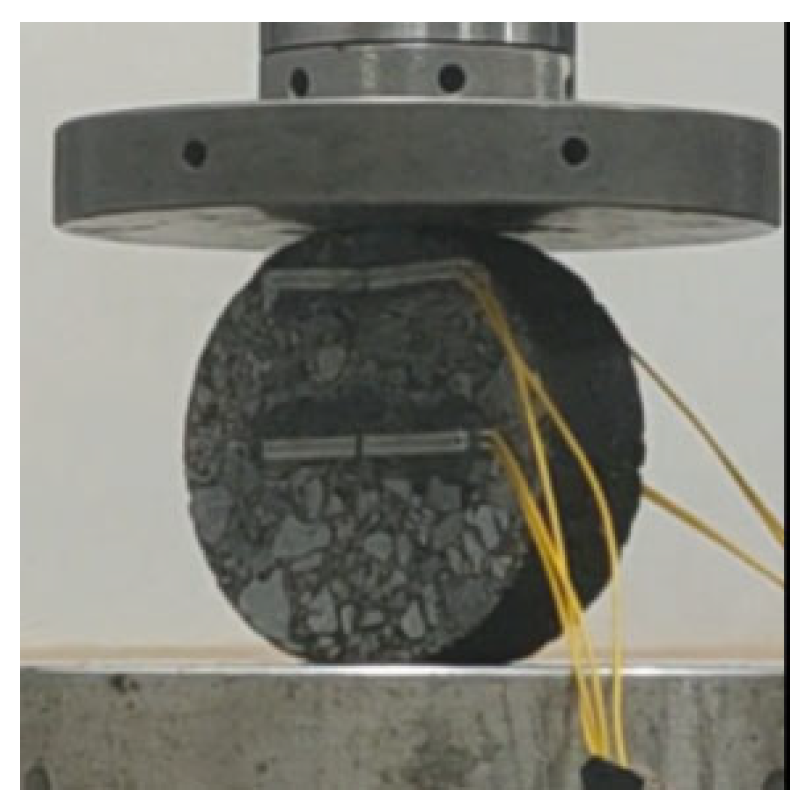
Figure 11.
The 19 mm arc bead splitting failure state.
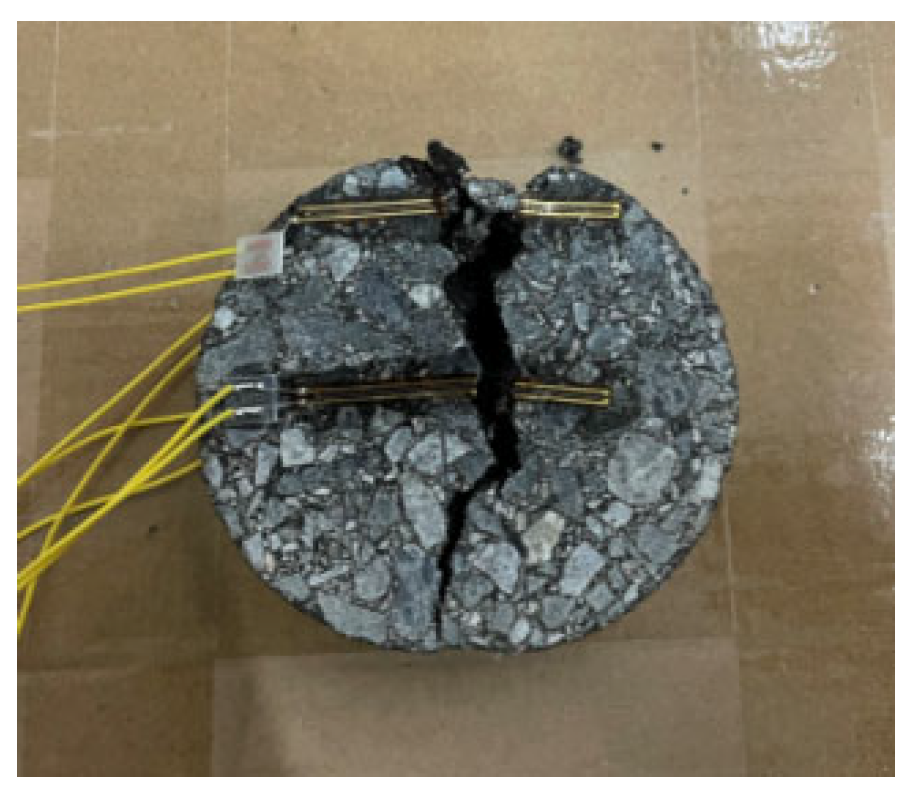
Figure 12.
Splitting failure state of the rigid pressing plate.

Figure 13.
Time difference in various test loading fixtures.
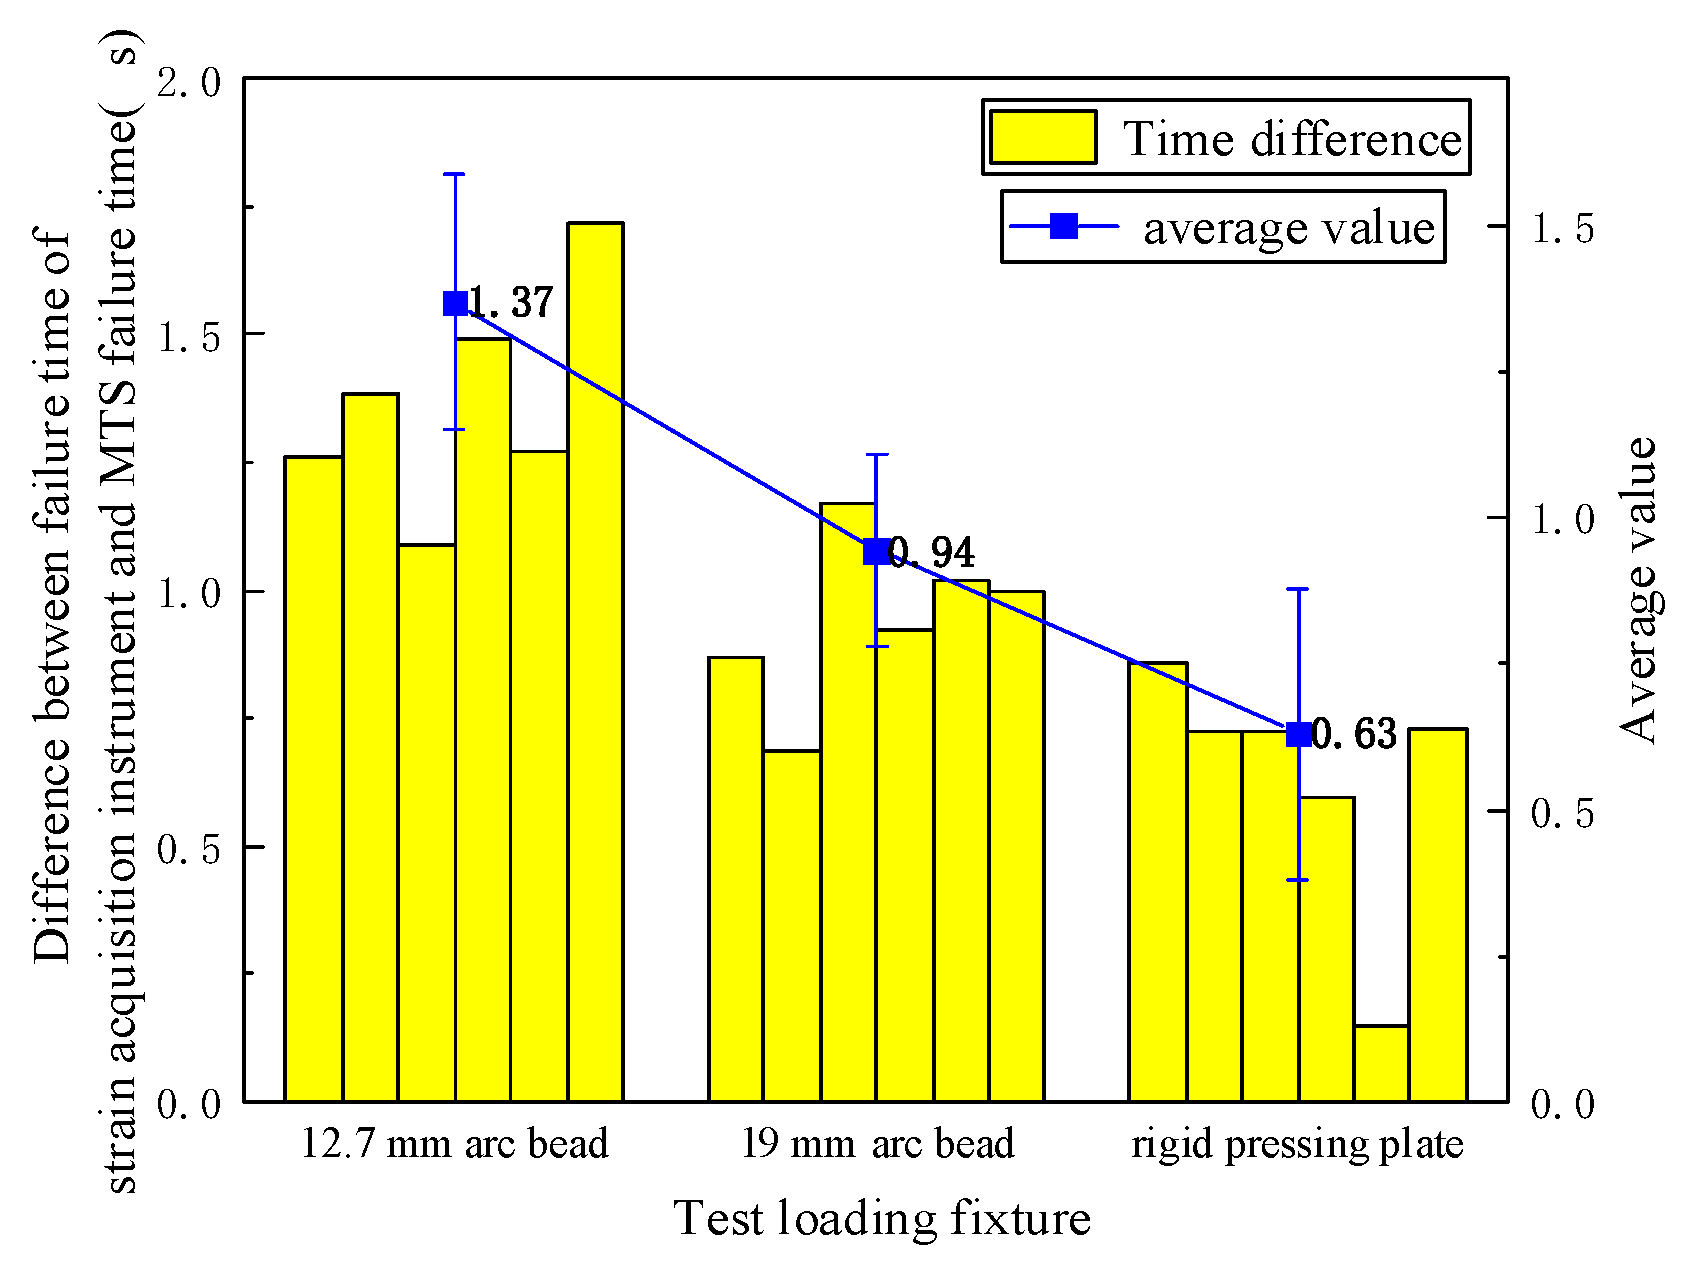
Figure 14.
Principle of rubber gasket splitting test. (a) Initial loading stage of the 12.7 mm arc-shaped batten. (b) Initial loading stage of the rigid pressing plate.
Figure 14.
Principle of rubber gasket splitting test. (a) Initial loading stage of the 12.7 mm arc-shaped batten. (b) Initial loading stage of the rigid pressing plate.

Figure 15.
Scatter plot of the data at the time of cracking.

Figure 16.
Failure time difference between the strain gauge and MTS under different test conditions.
Figure 16.
Failure time difference between the strain gauge and MTS under different test conditions.
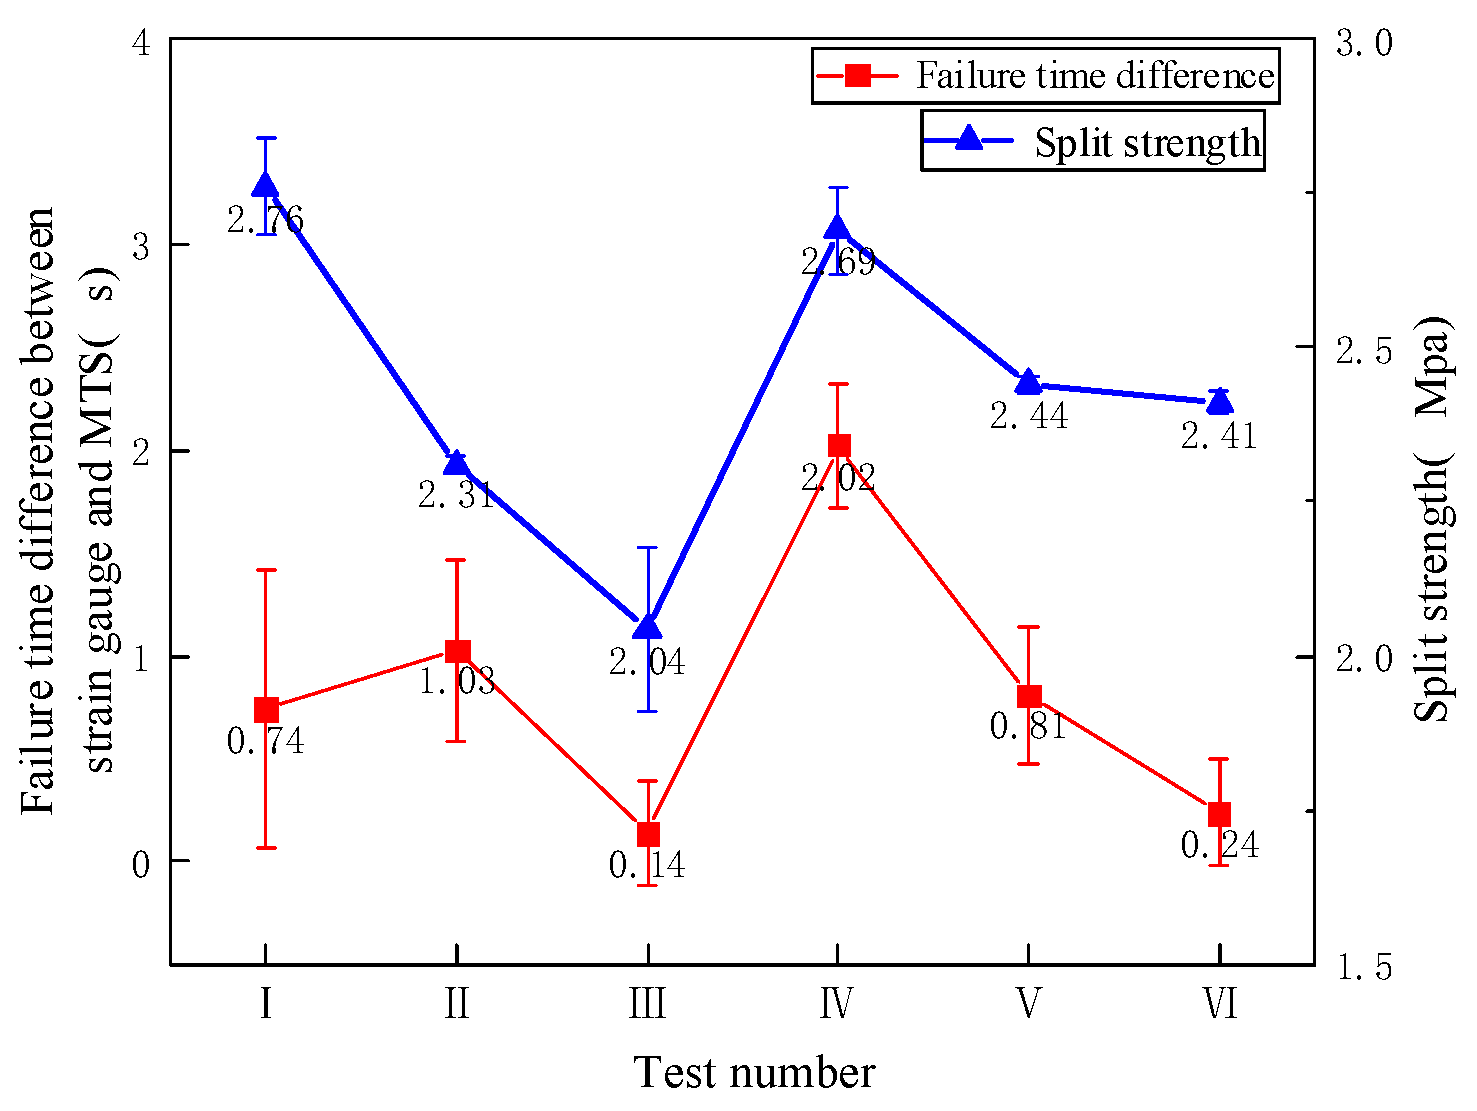
Figure 17.
Stress–strain at the center of a circle with different improvement strategies using rubber gaskets. (a) A 3 mm rubber gasket + rigid pressing plate; (b) 1 mm rubber gasket + rigid pressing plate; (c) 10 mm rubber gasket + 12.7 mm arc-shaped batten; (d) 1 mm rubber gasket + 12.7 mm arc-shaped batten; (e) 0.5 mm rubber gasket + 12.7 mm arc-shaped batten; (f) 0.3 mm rubber gasket + 12.7 mm arc-shaped batten.
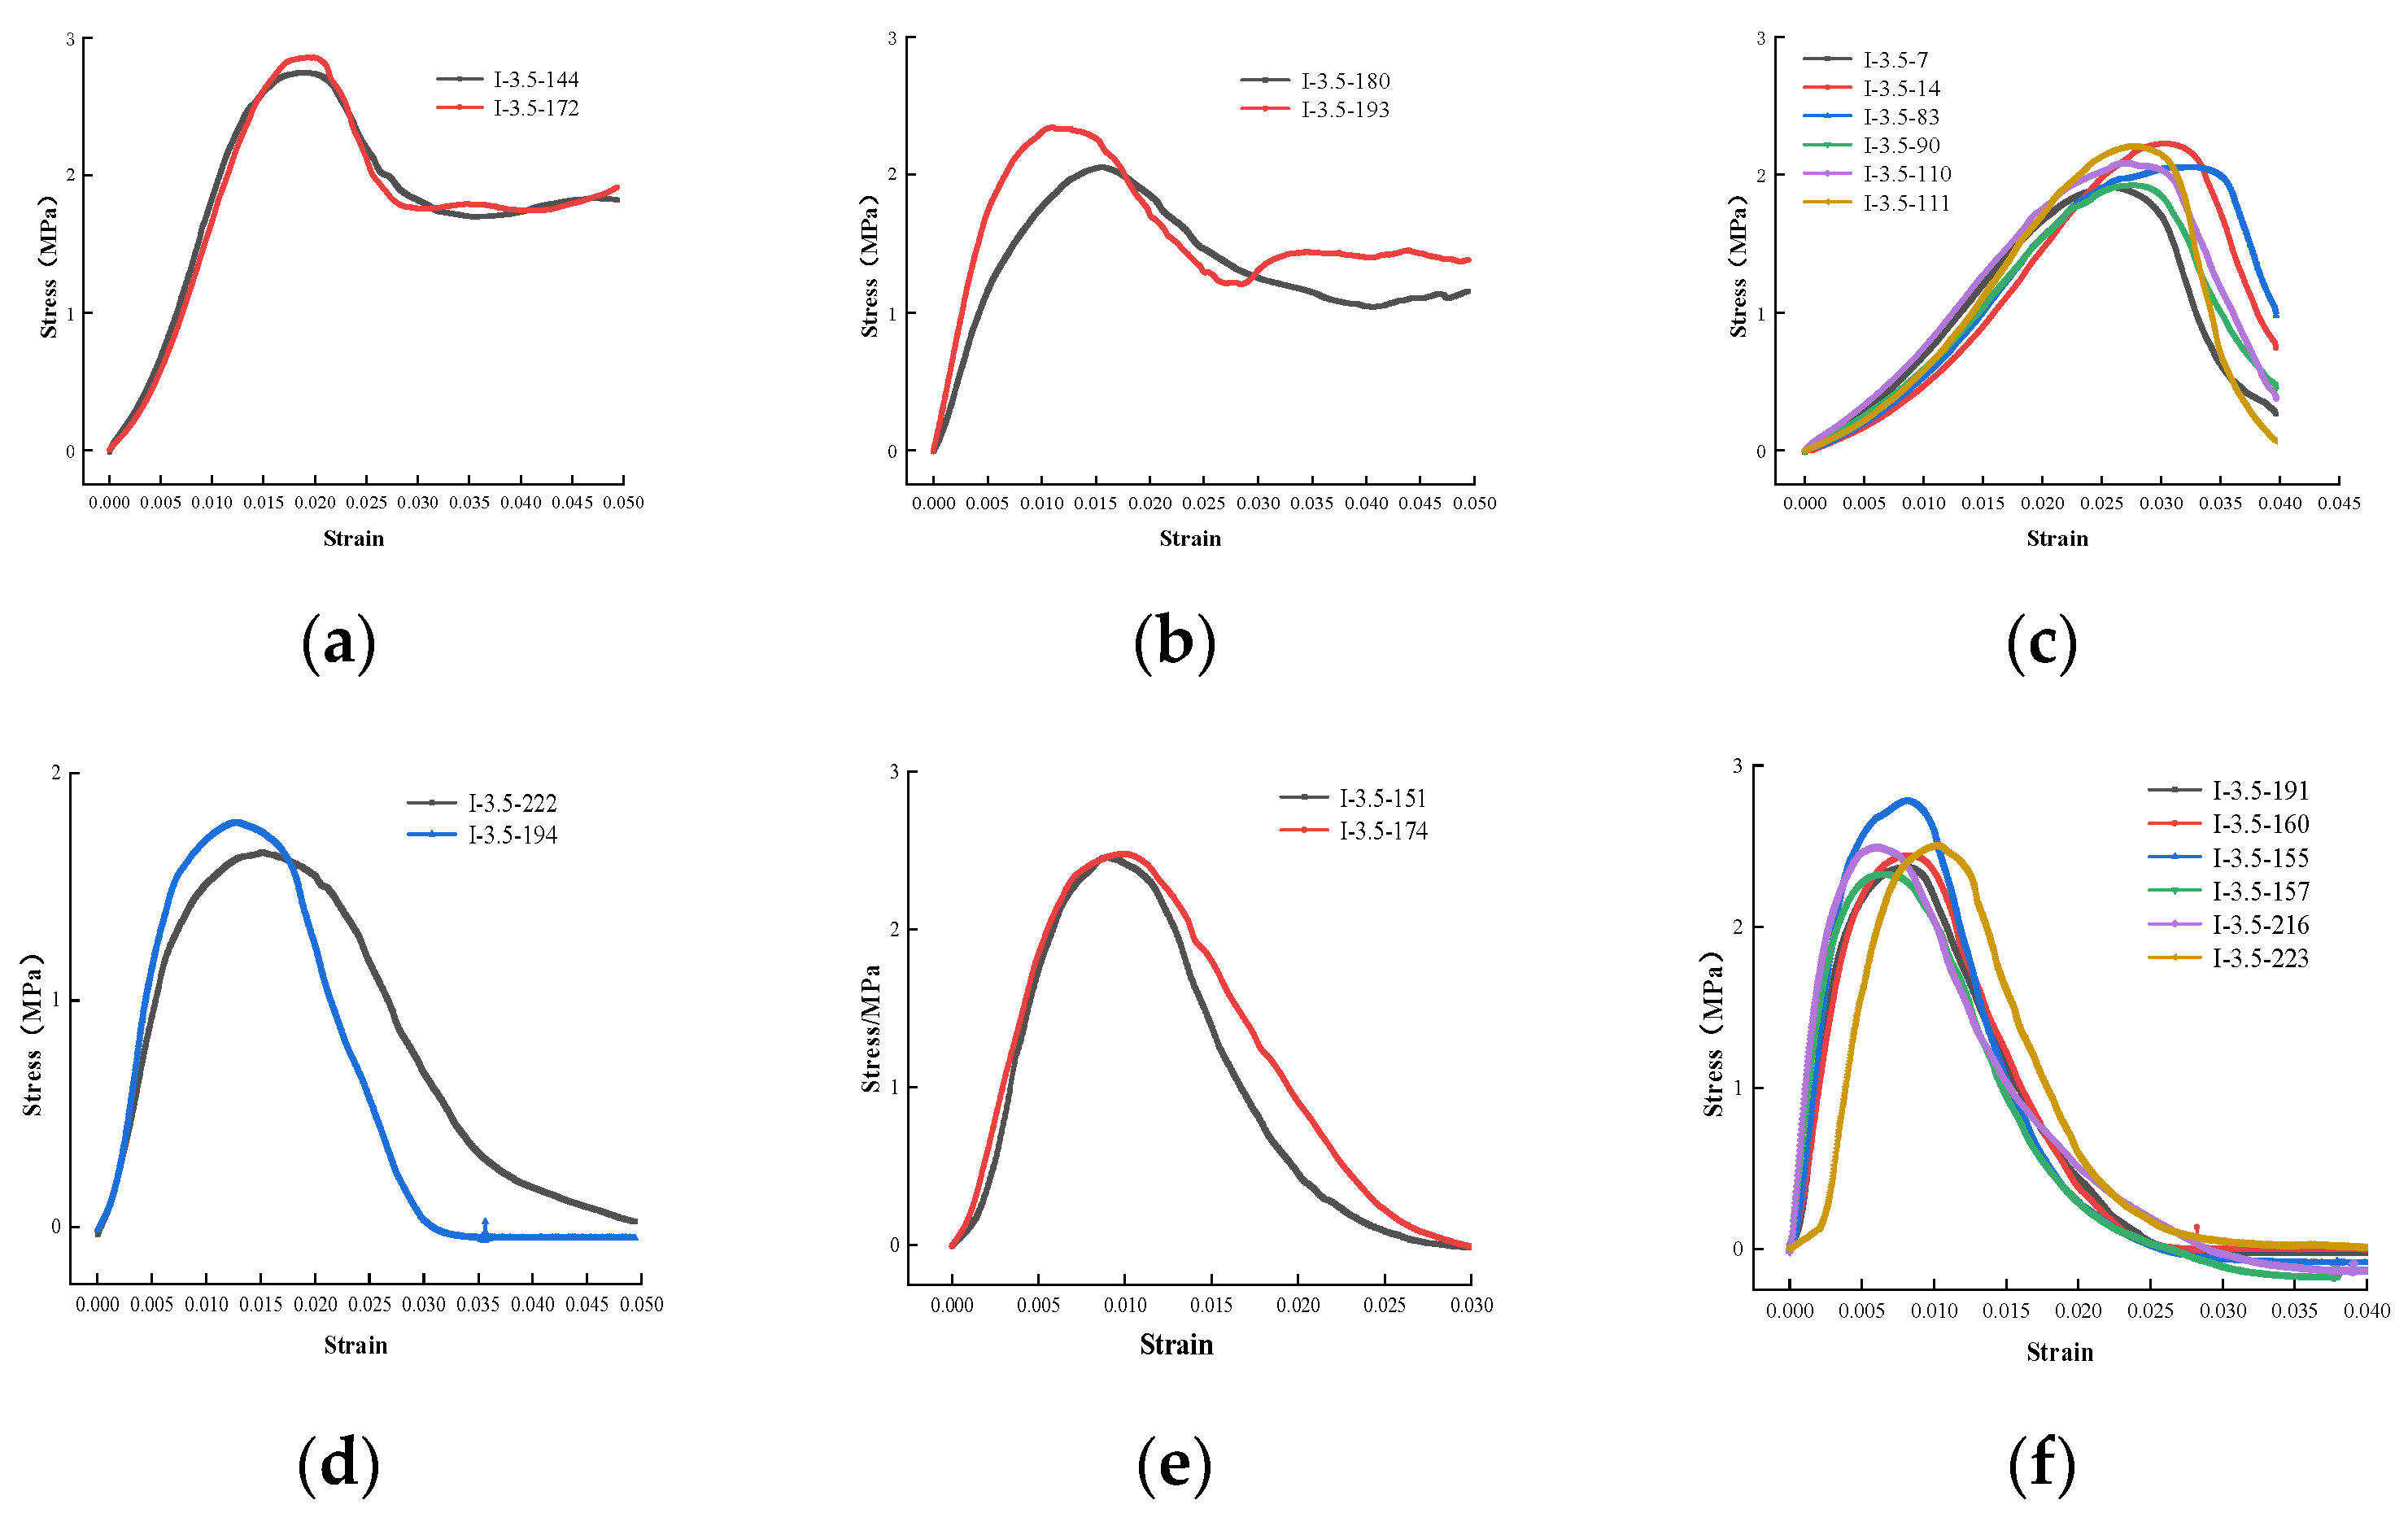
Figure 18.
Displacement cloud maps at different time points.
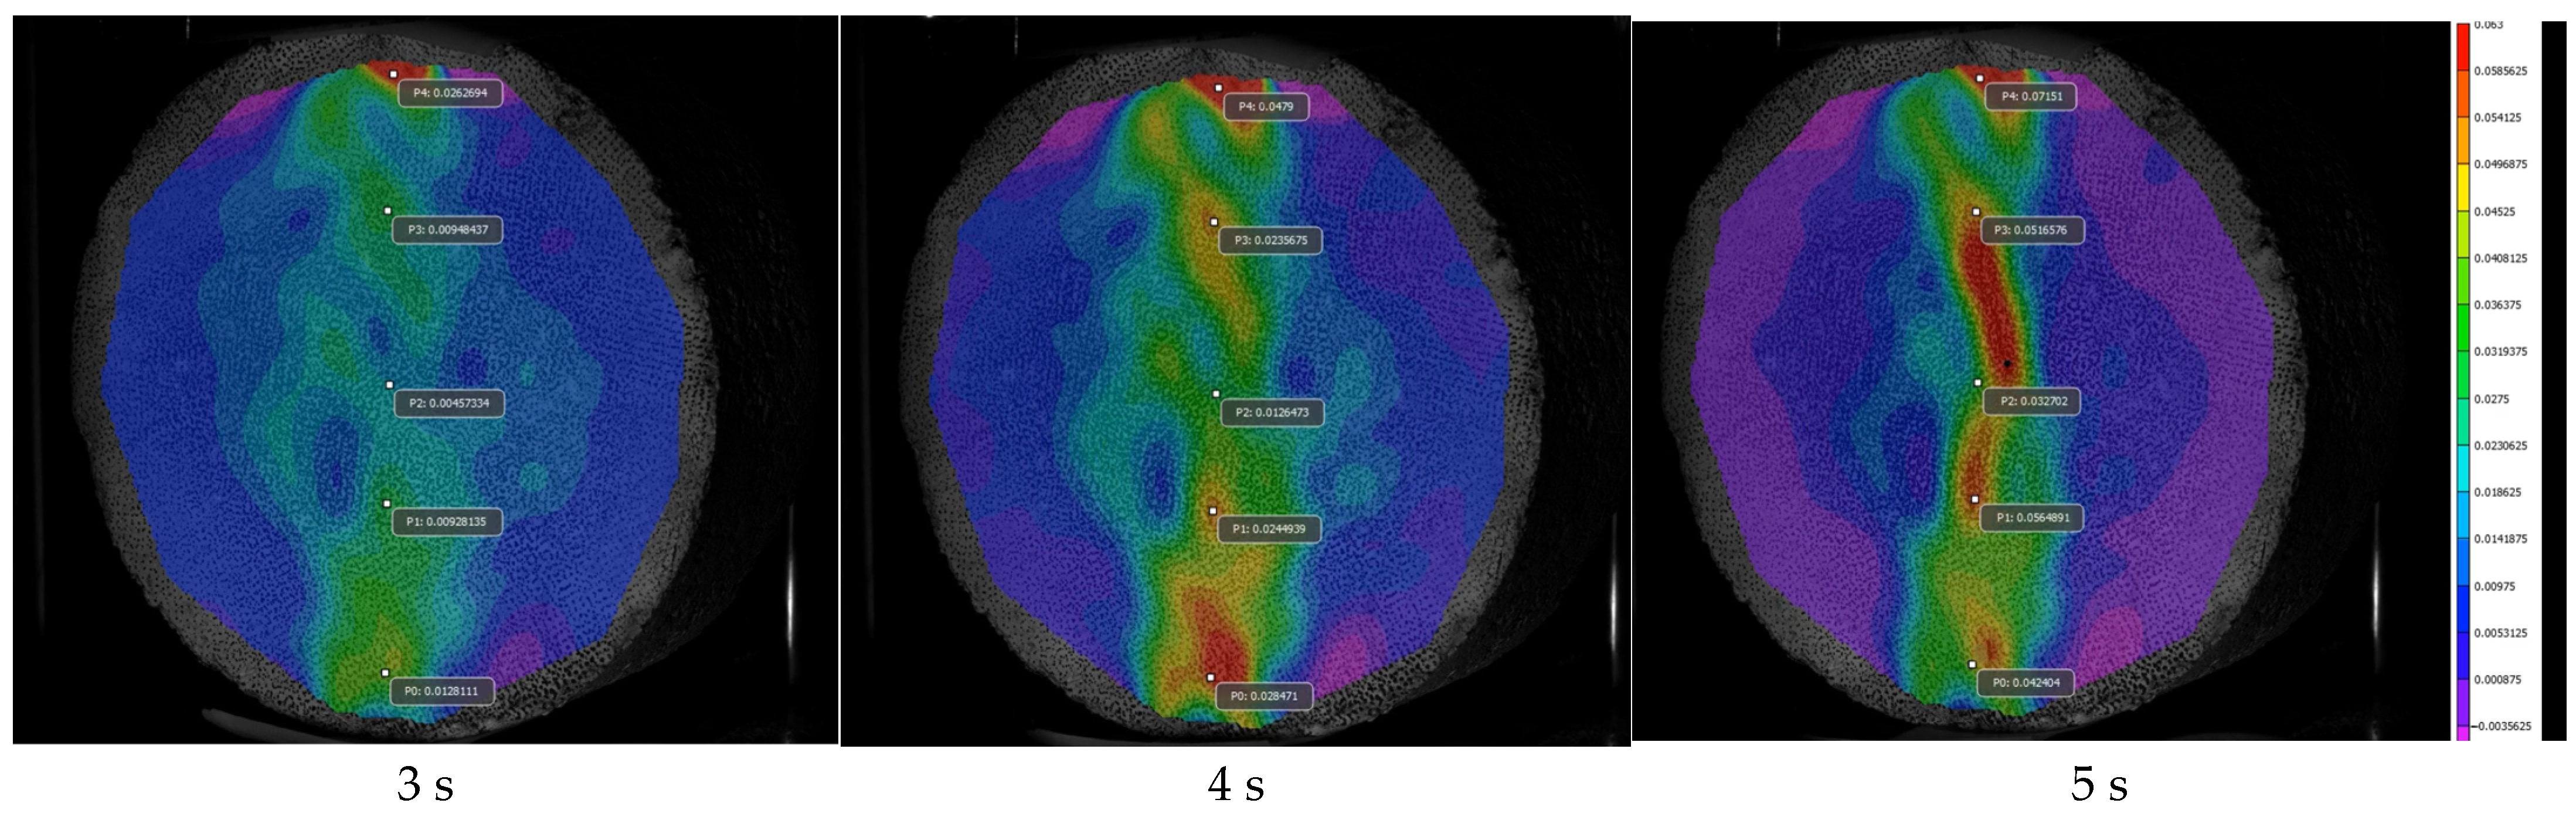
Figure 19.
Damage curves and stress points.

Figure 20.
Tensile test loading process.

Figure 21.
Specimen after loading for the tensile test.
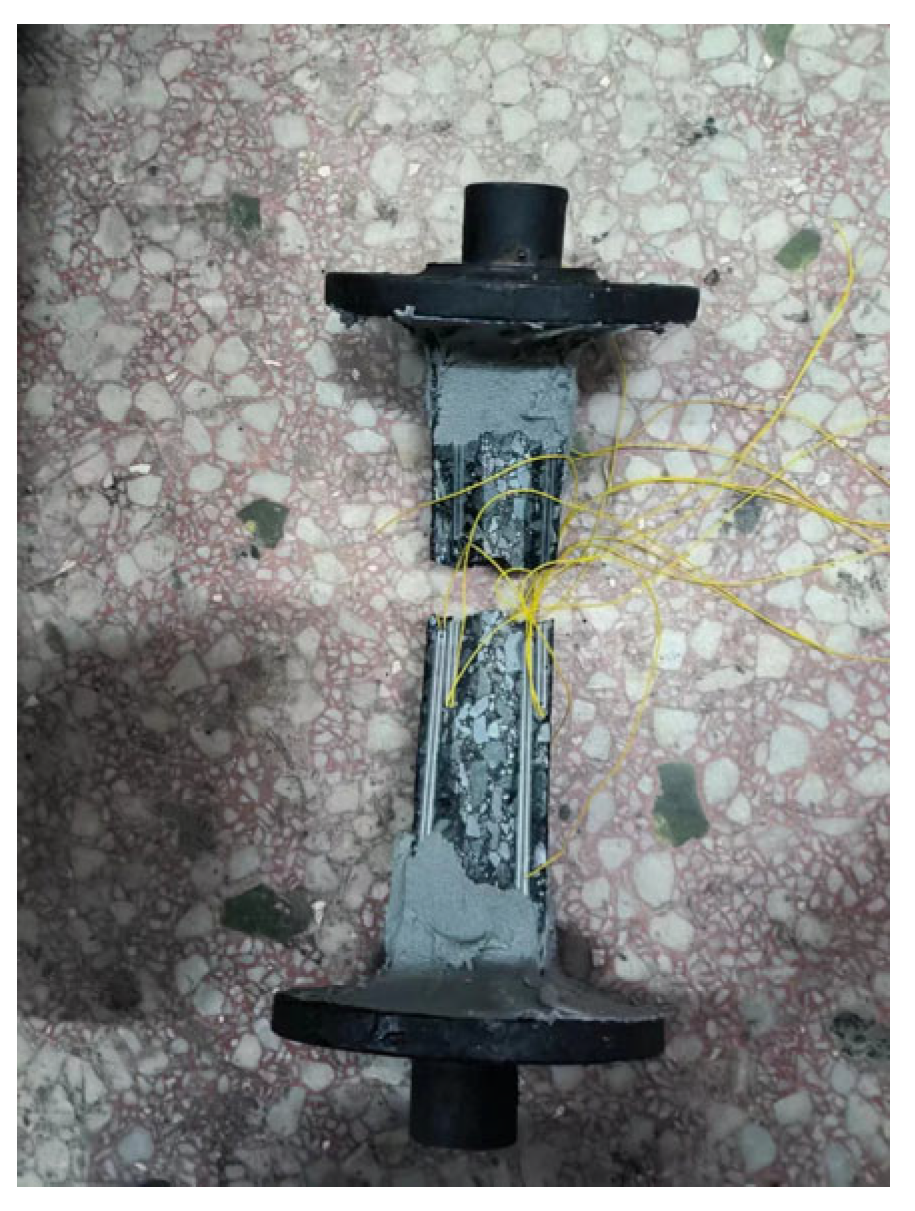
Figure 22.
Strength–rate relationship diagram.

Table 1.
Technical indexes and test results of SBS-modified asphalt.
| Technical Indicators | Technical Requirement | Unit | Detection Result | |
|---|---|---|---|---|
| Penetration (25 °C, 100 g, 5 s) | 30~55 | 0.1 mm | 53 | |
| Penetration index PI | ≥0 | — | 0.21 | |
| Softening point (global method) | ≥75 | °C | 86 | |
| Ductility (5 °C, 5 cm/min) | ≥25 | cm | 31 | |
| Kinematic viscosity 135 °C | ≤3 | Pa·s | 2.2 | |
| Flash point (COC) | ≥230 | °C | 293 | |
| Solubility (trichloroethylene) | ≥99 | % | 99.6 | |
| Elastic recovery (25 °C) | ≥85 | % | 98 | |
| Rotating film oven test (163 °C, 85 min) | Ductility (5 °C) | ≥15 | cm | 17 |
| Mass loss | ≤±1.0 | % | 0.1 | |
| Penetration ratio (25 °C) | ≥65 | % | 67 | |
Table 2.
Technical indexes and test results of coarse aggregate.
| Test Item | Unit | Technical Requirement | Test Result | |||
|---|---|---|---|---|---|---|
| 2.36~4.75 mm | 4.75~9.5 mm | 9.5~13.2 mm | 13.2~16 mm | |||
| Crushing value | % | ≤26 | 10.1 | 10.7 | 11.3 | 11.8 |
| Los Angeles abrasion value | % | ≤28 | 11.2 | 12.8 | 13.9 | 14.2 |
| Apparent relative density | — | ≥2.6 | 2.701 | 2.703 | 2.709 | 2.720 |
| Gross volume Relative density | — | — | 2.649 | 2.660 | 2.686 | 2.698 |
| Water absorption | % | ≤2 | 1.35 | 1.23 | 0.98 | 1.11 |
| Robustness | % | ≤12 | 2.1 | 2.9 | 3.1 | 3.2 |
| Needle and flake content | % | ≤15 | 11.3 | 9.0 | 8.8 | 7.1 |
| Polish value | PSV | ≥42 | 45.9 | 47.2 | 47.6 | 46.5 |
| Soft rock content | % | ≤3 | 1.2 | 1.6 | 2.1 | 1.3 |
Table 3.
AC-13 grading of the asphalt mixture.
| Gradation Type | Mass Percentage (%) Passing through the Following Sieve Openings (Square Sieve, mm) | |||||||||
|---|---|---|---|---|---|---|---|---|---|---|
| 16 | 13.2 | 9.5 | 4.75 | 2.36 | 1.18 | 0.6 | 0.3 | 0.15 | 0.075 | |
| AC-13 | 100 | 95 | 74 | 48.5 | 34 | 23.5 | 15 | 11 | 8.5 | 6 |
Table 4.
SBS Marshall test results of the modified asphalt AC-13 mixture under the optimum asphalt aggregate ratio.
Table 4.
SBS Marshall test results of the modified asphalt AC-13 mixture under the optimum asphalt aggregate ratio.
| Oil Stone Ratio/% | Gross Volume Relative Density/g·cm−3 | Void Fraction/% | Saturation/% | Mineral Aggregate Porosity/% | Stability/kN | Stream Value/0.1 mm |
|---|---|---|---|---|---|---|
| 4.77 | 2.465 | 3.8 | 72.1 | 14.1 | 13.3 | 29.2 |
Table 5.
Summary table of the MTS data and failure time of the strain gauge of the standard test method.
Table 5.
Summary table of the MTS data and failure time of the strain gauge of the standard test method.
| Specimen Number | MTS Peak Load/kN | MTS Moment of Peak Force/s | Channel 1 Failure Time of Strain Gauge/s | Channel 2 Failure Time of Strain Gauge/s | Channel 3 Failure Time of Strain Gauge/s | Channel 4 Failure Time of Strain Gauge/s |
|---|---|---|---|---|---|---|
| I-1.1-3 | 20.268 | 2.051 | 3.063 | 3.125 | 3.594 | 4.125 |
| I-1.1-8 | 24.928 | 1.924 | 3.344 | 3.344 | 4.125 | 3.313 |
| I-1.1-13 | 23.754 | 2.520 | 4.125 | 3.938 | 3.625 | 3.125 |
| I-1.1-35 | 23.569 | 2.178 | 3.439 | 3.758 | 3.495 | 3.652 |
| I-1.1-40 | 24.167 | 2.264 | 3.650 | 3.794 | 3.738 | 3.813 |
| I-1.1-42 | 22.222 | 3.018 | 4.031 | 3.625 | 4.844 | 4.313 |
| I-1.1-43 | 21.501 | 2.305 | 3.719 | 3.438 | 4.094 | 4.125 |
| I-1.1-49 | 23.445 | 2.334 | 6.250 | 7.469 | 3.063 | 3.125 |
| I-1.1-55 | 23.217 | 2.676 | 6.188 | 0.875 | 6.031 | 4.281 |
| I-1.1-57 | 23.609 | 1.885 | 2.974 | 3.530 | 2.986 | 3.717 |
| I-1.1-65 | 23.223 | 2.061 | 3.553 | 4.178 | 3.703 | 3.678 |
| I-1.1-68 | 23.485 | 1.963 | — | 3.656 | 3.199 | 3.594 |
| I-1.1-91 | 23.647 | 2.898 | 4.293 | 4.356 | 4.168 | 4.449 |
| I-1.1-93 | 21.830 | 2.051 | 5.031 | 4.969 | 3.719 | 3.813 |
| I-1.1-98 | 22.989 | 2.879 | 4.594 | 4.794 | 4.644 | 4.648 |
Table 6.
Statistical table of the test data under different working conditions.
| Number of Specimens | Representative Working Conditions | Statistical Results of Peak Load | |||
|---|---|---|---|---|---|
| Average Value/kn | Standard Deviation | Variance | Variation Coefficient | ||
| 15 | Undifferentiated central or top cracks | 23.057 | 1.171 | 1.372 | 0.050 |
| 9 | Top cracks first | 22.739 | 1.407 | 1.979 | 0.062 |
| 6 | Central cracks first | 23.534 | 0.403 | 0.162 | 0.017 |
Table 7.
Statistical table of the test data under different specimen sizes.
| Specimens Size (mm) | Statistical Results of Time Difference | |||
|---|---|---|---|---|
| Average Value | Standard Deviation | Variance | Variation Coefficient | |
| 63.5 | 1.369 | 0.216 | 0.047 | 0.158 |
| 50 | 1.146 | 0.478 | 0.229 | 0.417 |
| 35 | 0.966 | 0.152 | 0.023 | 0.157 |
Table 8.
Improvement of the splitting test with a rubber gasket and the number of parallel tests.
| Test Number | Improvement Strategy | Number of Parallel Tests | Test Success Rate |
|---|---|---|---|
| I | 3 mm rubber gasket + rigid pressing plate | 6 | 33.3% |
| II | 1 mm rubber gasket + rigid pressing plate | 7 | 28.6% |
| III | 10 mm rubber gasket + 12.7 mm arc-shaped batten | 15 | 40% |
| IV | 1 mm rubber gasket + 12.7 mm arc-shaped batten | 7 | 28.6% |
| V | 0.5 mm rubber gasket + 12.7 mm arc-shaped batten | 12 | 16.7% |
| VI | 0.3 mm rubber gasket + 12.7 mm arc-shaped batten | 12 | 41.7% |
Table 9.
Model t-value test.
| Name | Value | Standard Error | T-Value | Probability > |t| |
|---|---|---|---|---|
| 3.575 | 0.039 | 91.631 | 0 | |
| 0.020 | 132.638 | 0 | ||
| 0.339 | 0.016 | 20.754 | 1.844 × 10⁻¹² |
Disclaimer/Publisher’s Note: The statements, opinions and data contained in all publications are solely those of the individual author(s) and contributor(s) and not of MDPI and/or the editor(s). MDPI and/or the editor(s) disclaim responsibility for any injury to people or property resulting from any ideas, methods, instructions or products referred to in the content. |
© 2024 by the authors. Licensee MDPI, Basel, Switzerland. This article is an open access article distributed under the terms and conditions of the Creative Commons Attribution (CC BY) license (https://creativecommons.org/licenses/by/4.0/).
Share and Cite
MDPI and ACS Style
Guan, H.; Pan, W.; Yang, H.; Yang, Y. Improvement of the Cracking Moment-Based Asphalt Mixture Splitting Test Method and Splitting Strength Research. Buildings 2024, 14, 457. https://doi.org/10.3390/buildings14020457
AMA Style
Guan H, Pan W, Yang H, Yang Y. Improvement of the Cracking Moment-Based Asphalt Mixture Splitting Test Method and Splitting Strength Research. Buildings. 2024; 14(2):457. https://doi.org/10.3390/buildings14020457
Chicago/Turabian StyleGuan, Hongxin, Wang Pan, Hairong Yang, and Yuxuan Yang. 2024. "Improvement of the Cracking Moment-Based Asphalt Mixture Splitting Test Method and Splitting Strength Research" Buildings 14, no. 2: 457. https://doi.org/10.3390/buildings14020457
Note that from the first issue of 2016, this journal uses article numbers instead of page numbers. See further details here.