
Experimental Study on Erosion Modeling of Architectural Red Sandstone under the Action of the Natural Environment

1
CCCC Seven Carp Ancient Town (Ganzhou) Cultural Tourism Co., Ganzhou 341005, China
2
School of Resource and Safety Engineering, Central South University, Changsha 410083, China
*
Author to whom correspondence should be addressed.
Buildings 2024, 14(4), 1168; https://doi.org/10.3390/buildings14041168
Submission received: 6 March 2024
/
Revised: 16 April 2024
/
Accepted: 18 April 2024
/
Published: 21 April 2024
(This article belongs to the Section Building Structures)
Abstract
:When buildings are exposed to erosion from the natural environment, erosion behaviors such as surface damage and structural instability occur, which greatly affect the aesthetic value and service life of the buildings. The study of erosion behaviors and the establishment of a suitable erosion model are constructive references for the protection and restoration of buildings. In order to establish a suitable erosion model for architectural red sandstone, two types of red sandstone specimens were selected in this paper to carry out dry and wet cycle tests. Combining the theoretical analysis and the actual erosion situation, a unidirectional corrosion model is proposed to describe the erosion of buildings by the natural environment. In this model, it is assumed that only the outer surface of the building is in contact with external erosion factors for a long period of time, so this situation can be considered a unidirectional erosion process. The paper uses XRD, SEM, and ultrasonic methods to record changes in the properties of the red sandstone samples. Finally, the rationality of the unidirectional erosion model was verified numerically. The test results show that the red sandstone specimens subjected to erosion by the natural environment will be accompanied by the development of defects, such as cracks, fissures, and holes, as well as the generation of fresh material. The demarcation point of different erosion stages exists in both the in-service red sandstone specimens and the fresh red sandstone specimens, which is consistent with the results of the unidirectional erosion model. In this paper, a calculation model for the demarcation point of different erosion stages is established, and the model estimation shows that the demarcation point of different erosion stages of the in-service red sandstone sample is 1.1528 cm from the erosion surface, and the demarcation point of different erosion stages of the fresh red sandstone sample is 1.67 cm.
1. Introduction
When buildings are exposed to the natural environment over a long period of time, the structural stability of the building is reduced through a series of physical and chemical reactions. At the same time, surface rusting, masonry spalling, and other conditions occur, a process usually referred to as erosion damage [1,2]. One of the major causes of erosion damage to buildings is acid rain. The building materials are weathered by the salt, alkali, acid, and other substances in the acid rain, causing oxidation, hydrolysis, hydration, dissolution, carbonation, and other processes to occur, accelerating the damage to the whole structure of the building [3,4,5]. South China belongs to a region with a lot of acid rain, and the buildings suffer from the severe test of sulfate erosion all year round. Therefore, research on the erosion process of buildings in this region under the action of the natural environment, the changes that occur before and after erosion, and the erosion model can provide data support for the protection and restoration of buildings.
There has been a lot of research on the damage to buildings by erosion of the natural environment, and the main research directions include the erosion damage mechanism, the performance of building materials, and the protection and repair of buildings. Weitang et al. [6,7] investigated the relationship between surface contaminants on limestone buildings and local rainfall. It was found that the amount of pollution was not only related to the amount of rainfall but also to the intensity of rainfall, wind speed, wind direction, and the location of the wall. They carried out numerical simulation experiments to compare the amount of pollution obtained from the model with the actual measured values. It was found that walls with relatively little wind rainfall tend to have less pollution, and the model was used to provide useful information for the conservation of historic buildings. According to Aykut Erkal et al. [8], the weather load (WDR) on building facades is directly proportional to the amount of rainfall. Their study comprehensively documented the erosive effects of physical raindrops on various building masonry surfaces, taking into account value, hazard, vulnerability, and exposure. The results indicate that unfired clay bricks are more vulnerable to erosion due to their low bond strength under the same conditions. According to Raffaella Striani [9] and other researchers, wind erosion (or sand erosion) is a significant cause of weathering and degradation of buildings. It can cause spalling, cracking, and erosion on the surfaces of cultural heritage buildings. Experimental studies have shown that solvent-based coatings are effective in protecting cultural heritage from wind and sand erosion due to their high hydrophobicity, low capillary water absorption, and permeability. Oscar Julian et al. [10] identified two ways in which buildings are eroded by rainfall: direct erosion, such as mechanical scouring and immersion, and indirect erosion, such as freezing and thawing cycles, chemical corrosion, and biodegradation. The extent of erosion is influenced by various factors, including the water resistance, pore structure, and material composition of building materials. Fábio Vidal et al. [11] investigated the corrosion of building materials, particularly metals, and the degradation of stone through long-term experiments. The results showed that exposure to acidic pollutants over extended periods is the primary cause of metal corrosion and stone degradation. The experiment identified nitrogen oxides, sulfur dioxide, and some particulate matter as the main acidic pollutants at the time of the study. Research has shown that pollutants react with moisture in the air to produce carbonate and sulfate ions. These ions then chemically react with calcium and iron elements in the rock, significantly accelerating the rate of metal corrosion and stone degradation [12,13]. As the research is carried out, the sulfate erosion test becomes the focus of the research direction. The direction of the test is mainly to use sulfate to conduct erosion tests on common materials, such as concrete, steel, and so on, to study the changes in the properties of the eroded materials. The results of the study are mostly that the erosion of sulfate ions will lead to the reduction in the mechanical strength and service life of metals, concrete, and other construction materials [14,15]. Some scholars have also used the mechanism of sulfate erosion for the protection of cultural heritage, exploring the effect of sulfate erosion on natural stone as a basis for determining the degree of damage to cultural heritage [16]. It is found that sulfate has a strong erosive effect on building materials, resulting in damage to the appearance and value of the building and a reduction in structural stability.
Concrete is a widely used and easily accessible material nowadays. Therefore, research on concrete erosion by sulfate is rapidly developing. For instance, References [17,18,19] studied the erosion mechanism of sulfate on different types of concrete and the resulting damage through simulation tests. This research has revealed the role of the natural environment and the basic laws of concrete erosion caused by sulfate. Consequently, it can be used to predict the service life of concrete more accurately. References [20,21] investigated the concrete damage model caused by sulfate erosion. They used a layered damage model to describe the concrete damage law and measured the degree of erosion as the relative degree of damage. As research progressed, an intrinsic model of concrete subjected to acidic environments was proposed, and the concrete stage erosion model gained widespread recognition [22,23]. It has been proposed that concrete erosion by acidic environments occurs in three stages: the spalling layer, eroded zone, and uneroded zone. Research on concrete erosion by sulfuric acid has gradually formed a system. However, concrete was not used in the construction of some special buildings, especially ancient ones. Furthermore, ancient buildings were constructed using materials that have lower performance capabilities than concrete. Therefore, it is necessary to conduct a study on the effects of sulfate erosion on these materials.
Red sandstone is a popular building material due to its red color, which is well-suited to Chinese culture, and its ease of mining. Numerous ancient buildings in southern China, including the Palace of Longevity, the Temple of the Immortal Lady, and the Shrine of the First Scholar, were constructed using red sandstone. However, red sandstone has high porosity, low strength, and poor durability. Therefore, compared to other types of buildings, red sandstone buildings are more susceptible to damage caused by erosion of the natural environment [24,25]. Current studies on red sandstone mainly focus on its weathering mechanism and the change in mechanical properties [26,27,28], and there are few studies on red sandstone erosion by sulfate. This paper utilizes the erosion model of concrete under sulfate erosion to investigate the erosion of red sandstone by sulfate. A unidirectional erosion model is proposed to characterize the erosion of building facades. Additionally, the concept of the demarcation point of different erosion stages is introduced.
Red sandstone is a common building material because of its red color, which is compatible with Chinese culture, and it is easy to extract. Many ancient buildings in southern China were built with red sandstone, such as the Wanshou Palace, the Xianniang Temple, and the Scholarship Shrine, etc. However, red sandstone has high porosity, low strength, and poor durability, so compared with other types of buildings, red sandstone buildings are more susceptible to damage caused by the erosion of the natural environment [24,25]. Most of the current studies on red sandstone are focused on the weathering mechanism of red sandstone and the change rule of mechanical properties [26,27,28], and there are few studies on red sandstone erosion by sulfate. Therefore, this paper draws on the erosion model of concrete under sulfate erosion to study the situation of red sandstone erosion by sulfate. A unidirectional erosion model is proposed to characterize the erosion of building facades, and the concept of the demarcation point of different erosion stages is also proposed.
2. Test Materials and Programs
2.1. Specimen Selection and Preparation
This paper examines the performance changes and erosion modeling resulting from the use of architectural red sandstone in natural environments. The specimens used in this study were obtained from Qi Li Ancient Town, Ganzhou City, Jiangxi Province. Both in-service red sandstone specimens and fresh red sandstone specimens were selected. The red sandstone used in construction was sourced from a pier in Qi Li ancient town, which was built at the same time as Wanshou Palace and has a history of over 600 years. The fresh red sandstone specimen is of the same type as the local quarry’s red sandstone. The significance of the test lies in the comparison between fresh red sandstone specimens and in-service red sandstone specimens that have been subjected to erosion by the natural environment for a long time. The specimens were divided into two categories, each with four groups of specimens. They were numbered and labeled according to their exposed surfaces. Category 1 refers to the in-service red sandstone specimen, while Category 2 pertains to the fresh red sandstone specimen. Each specimen measures 10 cm × 10 cm in length and width, as illustrated in Figure 1 below. The test aims to simulate the erosion of red sandstone walls exposed to the external environment. It solely considers the impact of sulfate ions on the construction of red sandstone, thus representing a unidirectional dry and wet cycle erosion process. The erosion liquid used was a sodium sulfate solution with a pH of 1, and its pH value was determined using a PHS-25 digital pH meter. Sponge pieces with specimens of equal number were prepared, each measuring 10 cm × 10 cm × 1 cm.
2.2. Experimental Programme and Test Methods
In order to obtain reliable data, physical model simulation tests were carried out in this paper. Using the water-absorbing properties of sponge sheets to simulate the external erosive environment, wet and dry cycle tests were carried out on two types of red sandstone. Following the test method described in references [23,29], all specimens processed were dried in a drying oven at a temperature of 80 °C for 24 h and cooled for 1 h. The sponge sheet saturated with sulfate solution was placed on top of the machined specimens to erode the specimens for 24 h, which is one dry and one wet cycle. The experiment found that after one cycle, the ultrasonic data change is small, so take every two cycles to measure and record the ultrasonic velocity of the specimen and twenty wet and dry cycles to obtain ten sets of data.
The longitudinal wave speed is calculated by measuring the distance L of the acoustic wave through the specimen and the traveling time t of the acoustic wave [30,31], and then the longitudinal wave speed is calculated by the following formula:
where VP is the longitudinal wave speed, unit m/s. L is the thickness of the specimen, unit m. t is the acoustic wave traveling time, unit s. t1 is the time when the acoustic wave is received by the receiving transducer, and t0 is the transducer docking start-up delay time. Some of the test instruments and test procedures are shown in Figure 2 below:
The ultrasonic test uses an HS-CS1H ultrasonic parameter tester produced by Xiangtan Tianhong Electronics Research Institute (Xiangtan, China) using a plane probe with a probe frequency of 1 MHz. Before the test, the transmitting and receiving probes and test samples at the measuring point were uniformly coated with a coupling agent and affixed to a good probe to collect and record the ultrasonic velocity data at the measuring point. The longitudinal first wave method is used to define the ultrasonic properties of the material, and each pair of measurement points collects three times the data to take the average value. Then, clean the instrument and specimen after the end of the test. Using Changsha Mining and Metallurgy Institute Inspection Company’s (Changsha, China) model JSM-IT500LV scanning electron microscope for SEM analysis, the image is collected at 20 kV and 40 µA current, the working distance is generally 10 mm with an image magnification of ×5~×300,000. The XRD phase analysis was carried out using a D8 ADVANCEX X-ray diffractometer from the Changsha Institute of Mining and Metallurgy Inspection Company (Changsha, China), which uses a Vante detector with a resolution of better than 25 percent, a minimum step size of 0.0001, and a maximum output power of 3 kW.
3. Test Results and Discussion
3.1. Microtest Analyses of Fresh Red Sandstone and In-Service Sandstone
In order to study the physicochemical changes of the red sandstone specimens under the erosion of the natural environment, this paper selects one piece of fresh red sandstone specimens and in-service red sandstone specimens for initial state XRD and SEM microanalysis. A comparative analysis of compositional differences and the microstructure between the fresh red sandstone samples and the in-service red sandstone samples was performed. Specimens numbered 14 and 24 were selected for XRD and SEM microanalysis with SEM magnifications of 100, 500, and 2000 scans, respectively. The results obtained are shown in Figure 3 and Figure 4 below.
Based on the analysis in Figure 3, it is found that the main substances contained in the fresh red sandstone specimen are quartz, feldspar, and mica. The in-service red sandstone specimen mainly contains quartz, feldspar, mica, and calcite, with more calcite than the fresh red sandstone specimen. This suggests that the red sandstone has undergone chemical changes when it was eroded by the natural environment, and fresh substances have been produced. From the analysis in Figure 4, it was found that the microstructure of the fresh red sandstone specimen is smooth as a whole, without obvious defects, particles, cracks, and other defects, and the overall bonding between the particles is tight. The microstructure of the in-service red sandstone specimen is granular, with an uneven particle size distribution and obvious development of defects, compared to the microstructure of the fresh red sandstone specimen, where flocculents, holes, cracks, and other defects significantly increased. It shows that the erosion of the red sandstone specimens by the natural environment is accompanied by the development of defects, such as cracks, fissures, holes, etc., as well as the transformation and generation of fresh substances. The results of the analysis are shown in Table 1 below.
3.2. Study of Ultrasonic Velocity and Cut-Off Points of Different Erosion Stages in Red Sandstone Specimens
3.2.1. Erosion Modeling of Red Sandstone Specimens Subjected to Unidirectional Acidic Wet and Dry Cycles
Numerous studies have shown that the erosion of all concrete in offshore buildings and platforms presents a “sandwich” erosion model. The main reason for the formation of this erosion model is the presence of erosion factors on both the internal and external exposed surfaces of concrete members, resulting in a higher degree of erosion on the exterior than on the interior [19,32,33]. Offshore buildings are subject to multi-directional or even omni-directional erosion due to tidal action on the building. In contrast, non-offshore buildings have few erosion factors from the rest of the exposed surfaces, and only the external surfaces are in contact with external erosion factors for a long period of time, so this situation can be considered as a unidirectional erosion process. In this way, this paper proposes an erosion model for building red sandstone subjected to unidirectional erosion, defined as the unidirectional erosion model, as shown in Figure 5.
The “sandwich” erosion model is more complex because all external surfaces are subject to different erosion conditions, and it is suitable for fully exposed building components, such as bridge piers and marine platforms. The unidirectional erosion model is applicable to some components of house-like buildings, such as the exterior walls of the house and the roof. As these components often have only one external surface in direct contact with the erosion environment, the rest of the parts are infinite elements. The contact erosion factor is small compared to the external environment, making the unidirectional erosion model theoretically feasible.
Based on previous studies, it was found that both the “sandwich” erosion model and the unidirectional erosion model roughly divide the erosion process of eroded components into eroded and non-eroded areas. Because the exfoliation layer needs a long time to reach the erosion, and the exfoliation layer structure is extremely unstable, it will be detached directly from the component, so it is considered that there is no exfoliation layer on the building components. In this paper, the erosion zone and the non-erosion zone are regarded as the two stages of the erosion of building components, and the erosion process of building components is simulated by the unidirectional dry and wet cycling test under an acidic environment. Based on the principle that ultrasonic waves have different propagation speeds in different erosion stages, the different erosion stages of red sandstone specimens are reflected by the change in ultrasonic wave speed. It is verified that there are two different erosion stages, the erosion zone, and the non-erosion zone, under the unidirectional dry and wet cyclic erosion in an acidic environment, and the demarcation point of the two erosion stages is calculated.
3.2.2. Change Rule of Ultrasonic Velocity in Red Sandstone Specimens
In this paper, the ultrasonic velocities of two types of red sandstone specimens, fresh and old, were tested under unidirectional erosive conditions in an acidic environment, and 10 sets of data were measured according to the test program described above. However, when testing the initial ultrasonic velocity of the specimens, it was found that there were differences in the ultrasonic data obtained, even for the same type of specimen. Therefore, to facilitate the analysis of ultrasonic variation, the ultrasonic velocity was normalized [34,35]. The normalized ultrasonic velocity is defined as VijB, and the ultrasonic velocity obtained from the nth wet and dry cycle of specimen number j in group i during the wet and dry cycle test is Vij(n). The calculation formula is shown in (2) as follows:
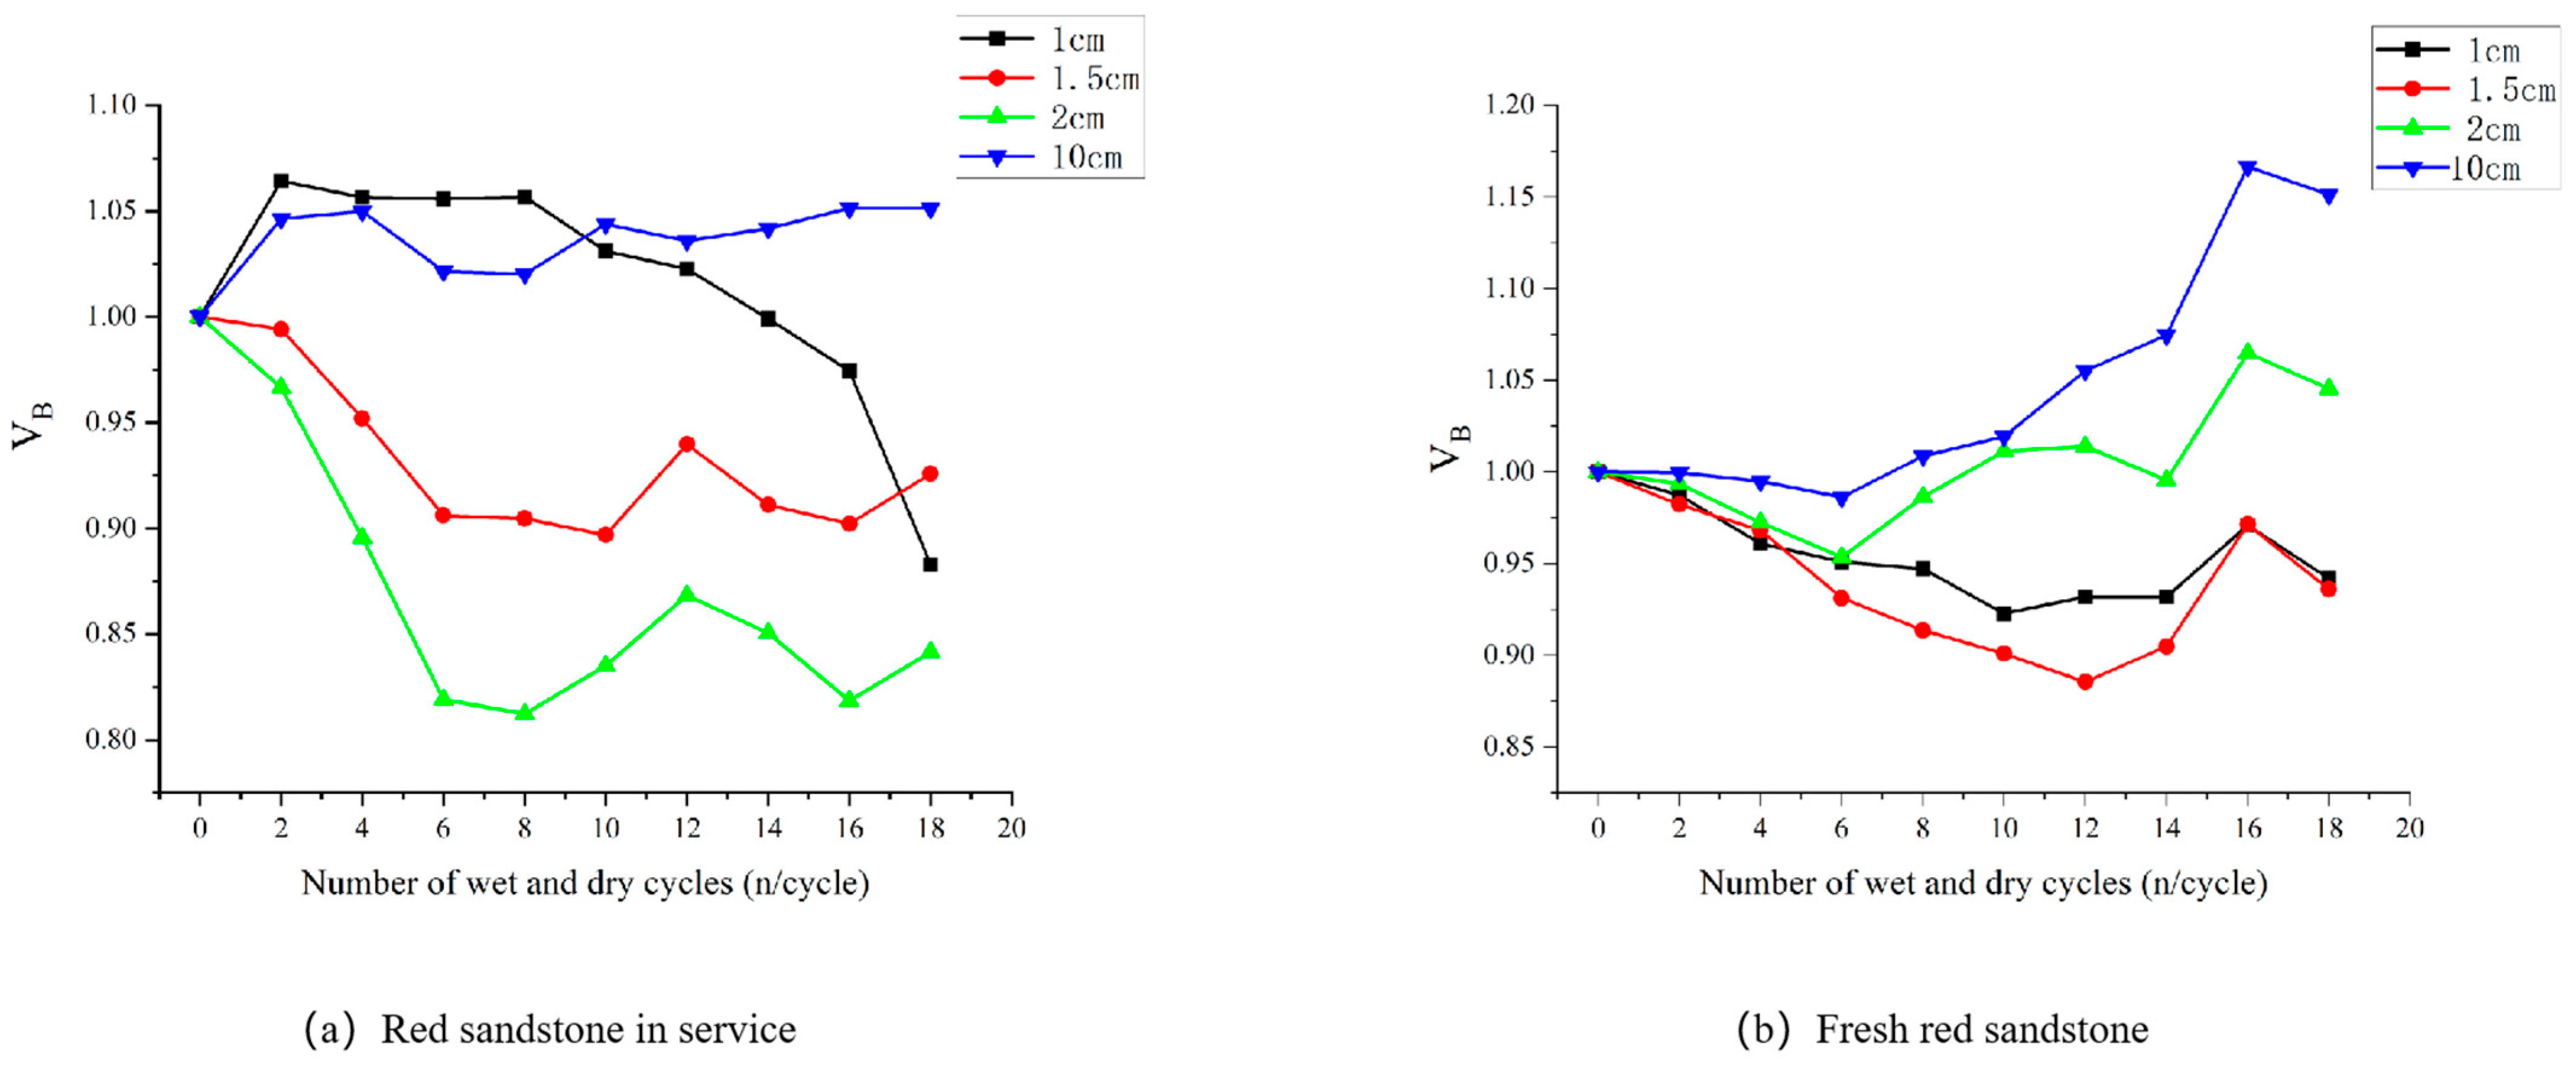
A total of eight specimens from two groups were subjected to twenty wet and dry cycles, and the ultrasonic data were normalized to obtain the ultrasonic variations shown in Figure 6.
The test results show that there is a difference in the law of ultrasonic wave decay between in-service red sandstone and fresh red sandstone when they are eroded in an acidic environment, and the law of the change in the ultrasonic wave in the two types of red sandstone specimens is related to the thickness of the specimens. The ultrasonic wave velocity of sample No. 11 (thickness of 1 cm) shows a tendency to increase and then decrease, while samples No. 12 (thickness of 1.5 cm) and No. 13 (thickness of 3 cm) show the opposite situation. Specimens No. 12 and No. 13 both show a tendency for the ultrasonic wave velocity to decrease and then increase. The two patterns of change are similar, but the change in amplitude of specimen No. 13 is greater. No. 14 (thickness of 10cm) specimens of ultrasonic wave velocity changes in the magnitude of the smaller, ultrasonic wave velocity of about 1.025. However, there is also a tendency for the ultrasonic wave speed to first decrease and then slowly increase. Within acceptable error, the only variable for the four specimens was specimen thickness. Specimen No. 11 and specimen No. 12 are the two sides of the ultrasonic wave change law shift, so it is assumed that there is an inflection point at 1–1.5 cm from the erosion surface in the service red sandstone. In the inflection point position at both ends of the specimen, the ultrasonic velocity change law changes abruptly, in which the number 11 specimen and 12, 13, 14 specimens of ultrasonic change law are different. This paper defines the inflection point as the demarcation point of two different erosion stages. Consistent with the analysis results in 3.2.1 above, that is, there are two erosion stages when the red sandstone is eroded, and the ultrasonic velocity at the demarcation point of the two erosion stages has a sudden change.
Compared to the in-service red sandstone, the change rule of the ultrasonic wave velocity in different thicknesses of the fresh red sandstone samples is more similar, and the total ultrasonic wave velocity of all samples shows a tendency to first decrease and then increase. However, the pattern of change is also related to the thickness of the sample. Specimens No. 21 (thickness 1 cm) and No. 22 (thickness 1.5 cm) show that ultrasonic wave velocity first decreases rapidly and then increases slowly, and specimen No. 22 shows a larger decrease in amplitude. The ultrasonic wave velocity of specimens No. 23 (thickness 2 cm) and No. 24 (thickness 10 cm) decreased a little and then increased rapidly. Just like the red sandstone specimens in service, the fresh red sandstone specimens also show a shift in the ultrasonic wave change law. From the change pattern in the image, it can be seen that the ultrasonic wave velocity of specimens No. 22 and No. 23 has changed, so it is assumed that the demarcation point of the different erosion stages of the fresh red sandstone specimens is 1.5–2 cm away from the erosion surface. The position of the demarcation points of the different erosion stages of the fresh red sandstone samples is deeper than that of the red sandstone samples in use. The possible reason for this is that the in-service red sandstone has been subjected to erosion by the natural environment for a period of time, and its internal structure is denser and less capable of physicochemical reactions with sulfate before it is completely disintegrated. On the other hand, the freshly formed red sandstone has a looser structure, and when it is subjected to dry and wet cycles of acid solutions, the changes that occur are more intense and the solution penetrates deeper, so the location of the demarcation point of its different stages of erosion is deeper.
It was also found that the ultrasonic velocity of the in-service red sandstone specimens 12, 13, and 14 reached the lowest value at the eighth wet/dry cycle when the ultrasonic velocity of specimen No. 11 started to decrease sharply. For the fresh red sandstone specimens, the ultrasonic velocity of specimens No. 21 and 22 reached the lowest value at the 12th wet/dry cycle, and the increasing trend of the ultrasonic wave of specimens No. 23 and 24 became slower. All the specimens showed a shift in the trend of ultrasonic wave changes, with the shift in the in-service red sandstone specimens occurring at the eighth wet/dry cycle and the shift in the fresh red sandstone specimens occurring at the twelfth wet/dry cycle. The above results show that the location of the demarcation point of the different erosion stages of the fresh red sandstone specimens is deeper, i.e., the eroded area is thicker, and there are more substances that can physicochemically and chemically react with the sulfate. Therefore, the number of wet and dry cycles required to change the lithology of the red sandstone specimen to the eroded level was higher when the test was conducted. The theoretical analysis of the law is consistent with the actual data law, indicating that the analytical conclusions of this paper have a certain degree of rationality.
3.3. A Study of the Demarcation Points of Different Erosion Stages of Red Sandstone Specimens
According to the above study, it is found that there is a demarcation point in different erosion stages of red sandstone specimens, which can be expressed by the inflection point of ultrasonic change. In order to further study the location of this point, this paper establishes a computational model, taking the thickness of the specimen and the number of dry and wet cycles as the independent variables and the ultrasonic velocity of the specimen as the dependent variable. The obtained model is shown in Equation (3) as follows:
Considering the ultrasonic velocity H as a function of the specimen thickness x and the number of wet and dry cycles n, the mathematical tool was used to fit the data in Figure 2, and the results were obtained as shown in Figure 7.
According to Section 3.2.2, the change in ultrasonic waves in red sandstone subjected to erosion can be divided into two stages, so the exponential model was chosen to fit the data, and the function model at different thicknesses was obtained, as well as the R2 of the model, as shown in Table 2 below.
H1 represents the red sandstone specimen classified as 1, i.e., it represents the in-service red sandstone specimen, and from the fitting effect, the fitting effect of specimens 11, 12, and 13 are all better, but the fitting effect of specimen 14 is poor. The possible reason for this is that the red sandstone specimens have been subjected to different forms of damage and erosion during the service period, so their internal structure and properties have been changed. What can also be found is that in the fitting curve obtained for specimen number 11, the trend of change is different from the other curves, and the trend of the change in the exponential function model is directly related to the positive and negative of parameter b. Therefore, in order to study the location of the inflection point of ultrasonic change, the value of parameter b in the function model obtained from specimens 11, 12, and 13 was selected and fitted with the specimen thickness x again, i.e., defining a function on b and x, as shown in equation (4).
b = g(x)
The model with the largest R2 was chosen as the final model when b = 0, which is the position of the inflection point of ultrasonic variation. Because of the poor fitting of specimen 14, the b-value of the function obtained for specimens 11, 12, and 13 was chosen to fit the data with their thicknesses to obtain the following function:
b = 2.508 × 10⁴ × e^ (−8.227x) − 1.904
When b = 0, x = 1.1528, the ultrasonic change rule of both sides of the in-service red sandstone specimen changes, that is, the point is considered to be the inflection point of ultrasonic change for the in-service red sandstone specimen.
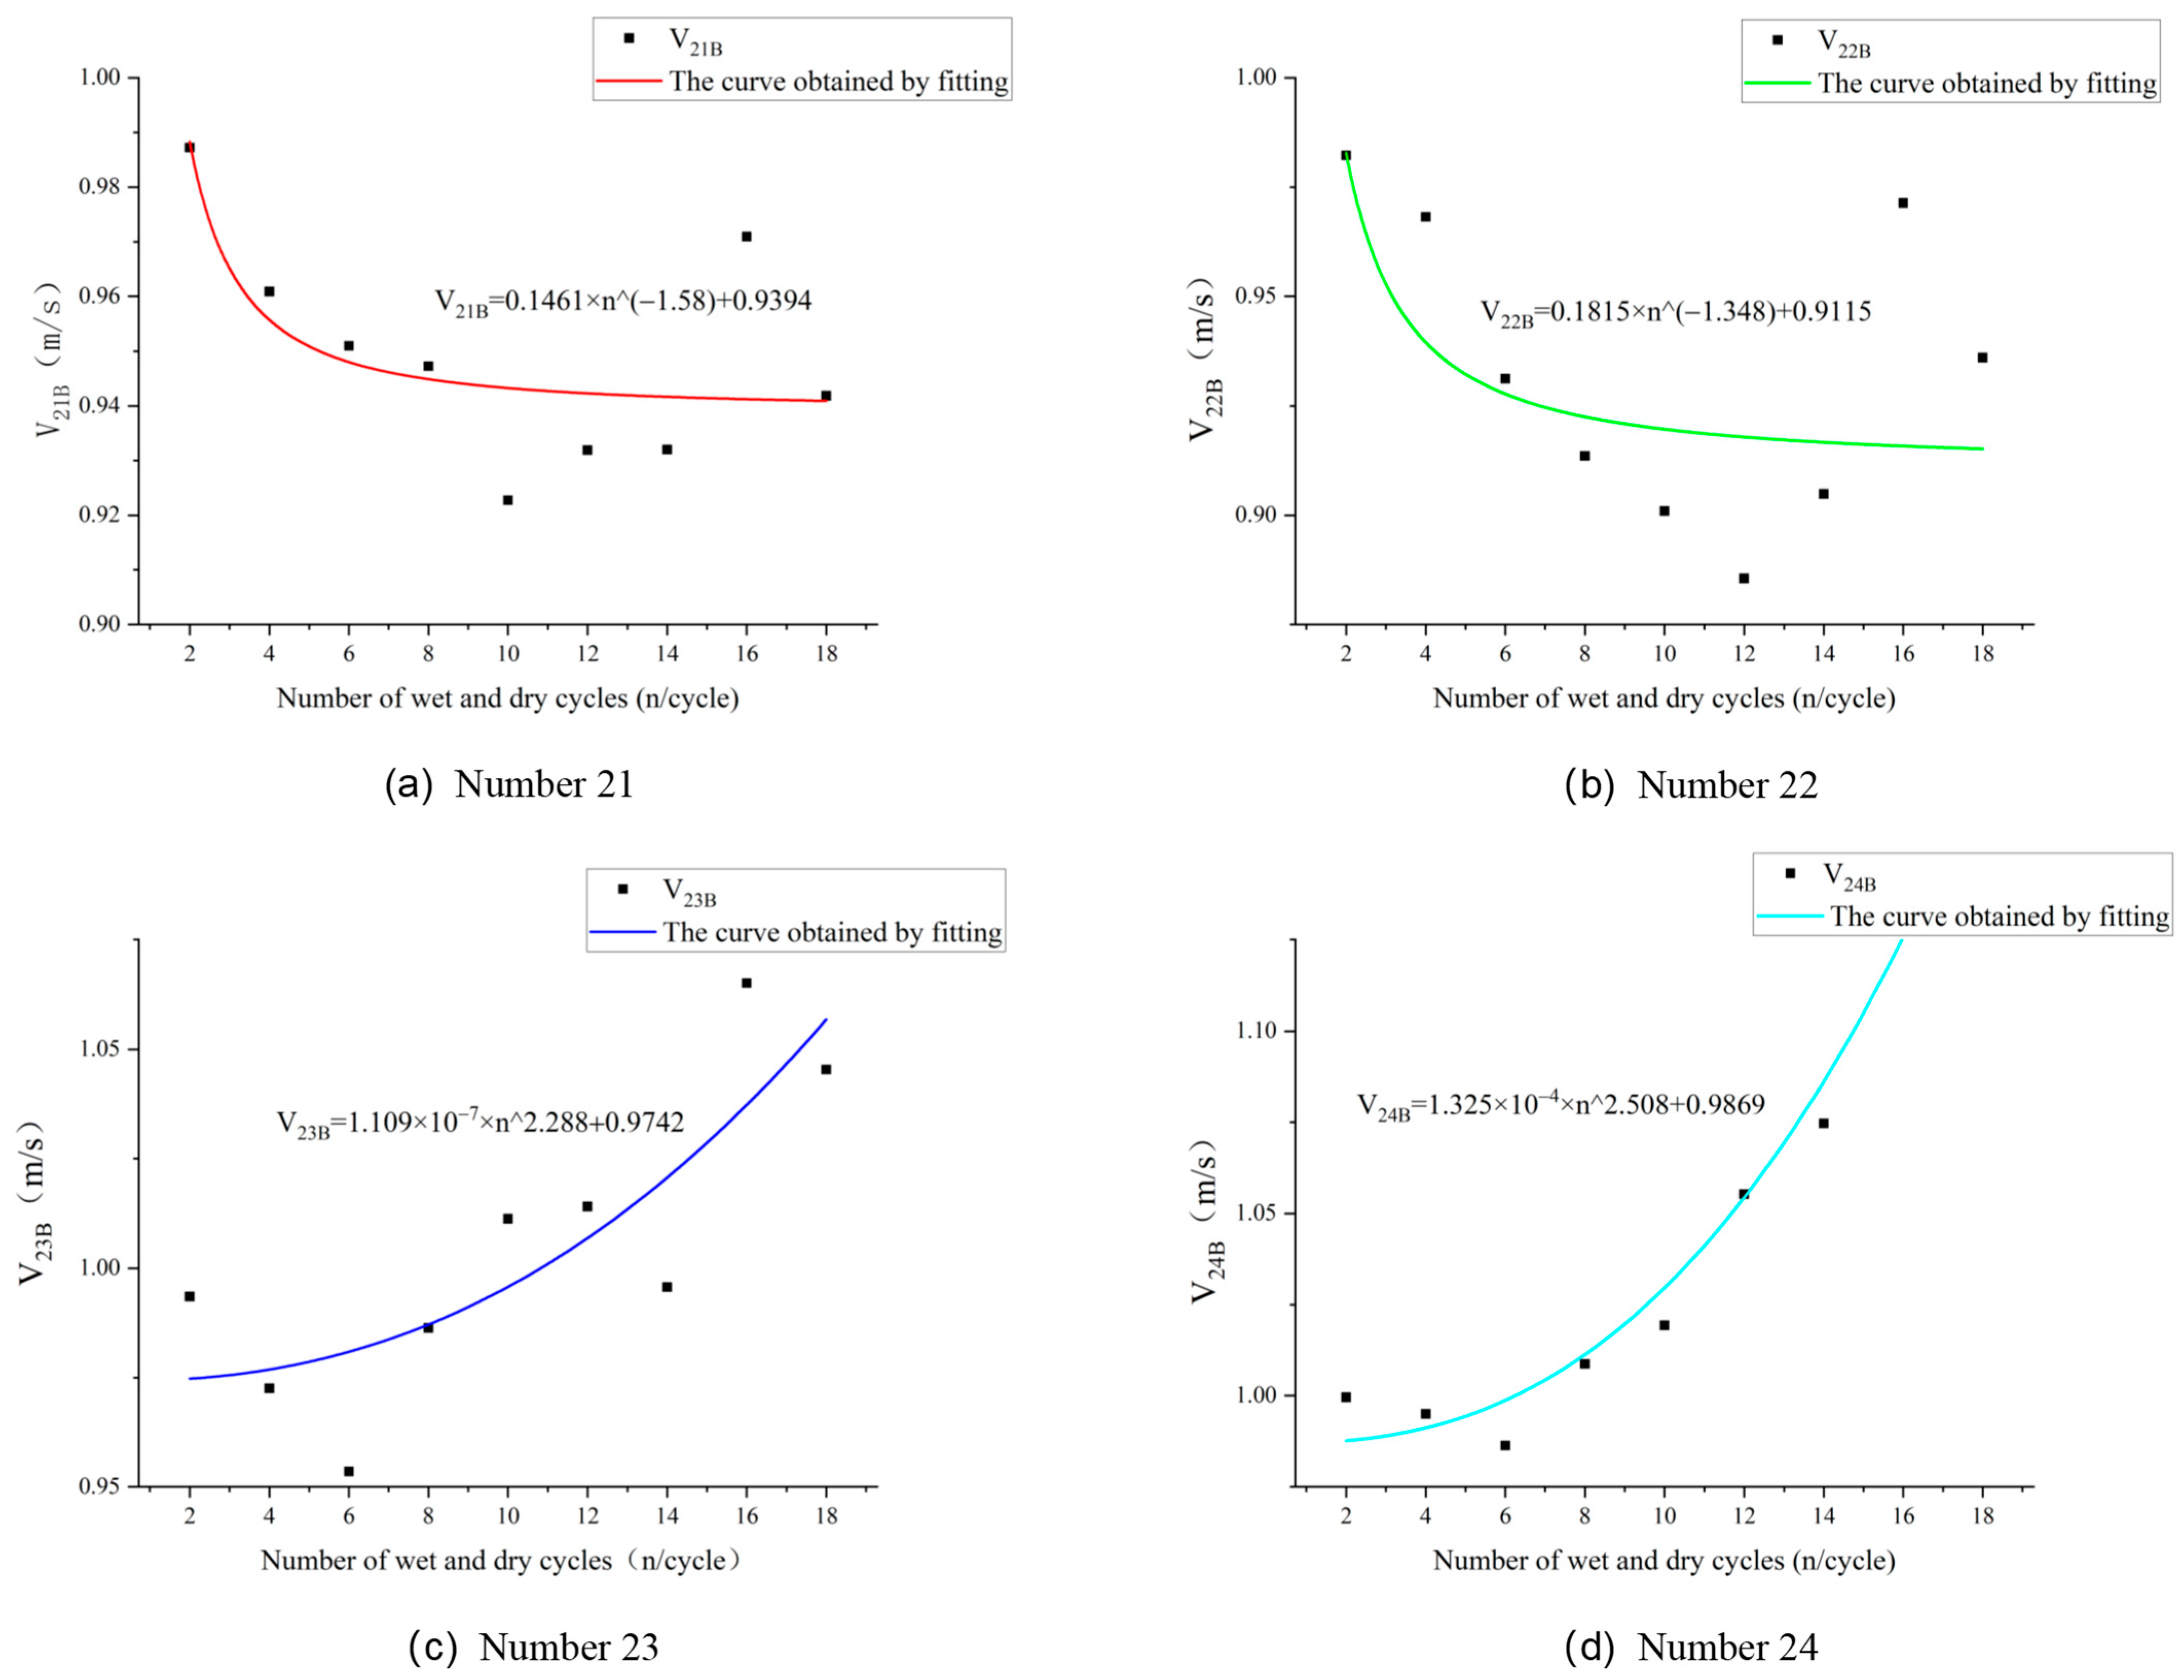
Similarly, the ultrasonic data of the fresh red sandstone was fitted and used to derive the inflection point of ultrasonic variation. The fitted graph obtained is shown in Figure 8.
The fitting results were found to be better for specimens 21, 23, and 24, especially specimen 24, which was fitted with R2 and reached 0.9258, as shown in Table 3. By comparing R2, it was found that the smaller the thickness of the in-service red sandstone specimens, the better the fitting effect, but the specimens with a thickness of 10 cm were poorly fitted. On the contrary, the fresh red sandstone specimen with a thickness of 10 cm was well fitted, while the specimen with a smaller thickness was poorly fitted. The possible reason for this is that the in-service red sandstone specimens are subjected to different forms of damage from the acidic environment than the fresh red sandstone specimens. The in-service red sandstone specimens tend to have more physical expansion damage, whereas the fresh red sandstone specimens tend to have more damage caused by chemical reactions [36,37]. However, no matter what form of damage, its ultrasonic change rule has a strong relationship with the thickness of the specimen, which also indicates that the erosion of red sandstone by the acidic environment has a stage, independent of its form of damage. This paper shows that it is feasible to study the ultrasonic change rule of red sandstone and estimate the location of the cut-off point of different erosion stages of red sandstone specimens from the data level, and it has general applicability.
In order to preserve the same variables as the in-service red sandstone specimens, three of the best-fitting function models were selected, i.e., specimens 21, 22, and 23 were chosen for inflection point estimation using the model in Equation (4), and the function obtained was
When b = 0, x = 1.673 is obtained, and at this point, the ultrasonic change rule of both sides of the in-service red sandstone specimen changes, which is considered to be the inflection point of ultrasonic change.
A comparison of the data shows that the demarcation points for the different stages of erosion of the freshly produced red sandstone samples are deeper than those of the in-service red sandstone samples, which is consistent with the results analyzed in Section 3.2.2. The inflection points of the ultrasonic change in the in situ red sandstone sample fall outside the 1–1.5 cm interval, which has some deviation from the results analyzed in Section 3.2.1, but the deviation is small. The fresh red sandstone samples, on the other hand, are consistent with the results analyzed in Section 3.2.1 and fall within the 1.5–2 cm interval.
In this study, a unidirectional erosion model for building facades was developed. The erosion phases of the red sandstone specimen were confirmed at the data level by simulation tests, and the boundary between the two different erosion phases was calculated using the law of ultrasonic velocity variation. This point is the boundary between the eroded and uneroded parts of the building façade when exposed to the natural environment. Furthermore, the calculation model established in this paper calculates the distance of the erosion stage boundary from the eroded surface of different types of specimens, so that the calculated values can be used to quantify the degree of erosion of the building façade. In building maintenance or heritage protection, the theoretical model in this paper can be used to calculate the depth of erosion by the natural environment, i.e., the thickness of the eroded portion, of the building facade to be protected using similar tests. Therefore, the unidirectional erosion model and the demarcation point calculation method proposed in this paper have a certain reference value in the field of building maintenance or heritage protection.
4. Conclusions
(1) A comparison of XRD and SEM images of in-service red sandstone specimens and fresh red sandstone specimens shows that the erosion of red sandstone specimens by the natural environment is accompanied by the development of defects, such as cracks, fissures, and holes, as well as the transformation and generation of fresh materials.
(2) By referring to the “sandwich” erosion model of concrete and taking into account that most of the buildings only have external walls that are exposed to external erosion factors for a long period of time, this paper proposes a unidirectional erosion model through theoretical analyses and the existence of different erosion phases when building facades are subjected to erosion.
(3) By analyzing the ultrasonic change rule of in-service red sandstone specimens and fresh red sandstone specimens, it is found that there are inflection points in their ultrasonic change rules. The ultrasonic wave speeds of the specimens on both sides of the inflection point change abruptly, and the inflection point of ultrasonic change is defined as the demarcation point of different erosion stages.
(4) The demarcation point of different erosion stages exists for both the in-service red sandstone specimen and the fresh red sandstone specimen. The cut-off point for different erosion stages for the in-service red sandstone specimen was estimated by the model to be 1.1528 cm from the erosion surface, while the cut-off points for different erosion stages for the freshly produced red sandstone specimen was 1.673 cm from the erosion surface.
(5) The unidirectional erosion model and the calculation method of demarcation points of different erosion stages proposed in this paper have certain reference values for building maintenance and cultural heritage protection. This paper provides a theoretical model, it should be noted that for different materials or different environments the computational model is not universal and the computational model needs to be re-obtained through similar experiments.
Author Contributions
Conceptualization, J.Z.; Methodology, T.A. and K.C.; Validation, H.Z., T.A. and K.C.; Formal analysis, J.Z.; Investigation, S.Z.; Resources, S.Z., H.Z. and R.L.; Data curation, S.Z.; Writing—original draft, T.A.; Writing—review & editing, H.Z. and K.C.; Visualization, R.L.; Supervision, J.Z. and H.Z.; Project administration, R.L.; Funding acquisition, S.Z. All authors have read and agreed to the published version of the manuscript.
Funding
This research received no external funding.
Data Availability Statement
Data will be made available upon request. The data are not publicly available due to privacy.
Acknowledgments
We thank the School of Resource and Safety Engineering, Central South University, and Dunwen Liu and Tang Yu for providing the subject matter for this research and for reviewing the paper.
Conflicts of Interest
Authors Shuisheng Zeng, Jun Zhang, Huanlin Zhang and Rutian Li were employed by the company CCCC Seven Carp Ancient Town (Ganzhou) Cultural Tourism Co. The remaining authors declare that the research was conducted in the absence of any commercial or financial relationships that could be construed as a potential conflict of interest.
References
- Fatoric, S.; Seekamp, E. Are cultural heritage and resources threatened by climate change? A systematic literature review. Clim. Chang. 2017, 142, 227–254. [Google Scholar] [CrossRef]
- Herring, R.; Dyer, K.; Martin, F.; Ward, C. The increasing importance of leading edge erosion and a review of existing protection solutions. Renew. Sustain. Energy Rev. 2019, 115, 109382. [Google Scholar] [CrossRef]
- Wei, J.; Chen, Q.; Du, J.; Liu, K.; Jiang, K. Study on the Durability of Acid Rain Erosion-Resistant Asphalt Mixtures. Materials 2022, 15, 1849. [Google Scholar] [CrossRef] [PubMed]
- Zhang, Y.; Gu, L.; Li, W.; Zhang, Q. Effect of acid rain on economic loss of concrete structures in Hangzhou, China. Int. J. Low-Carbon Technol. 2019, 14, 89–94. [Google Scholar] [CrossRef]
- Wang, Y.; Niu, D.; Song, Z. Effect of Acid Rain Erosion on Steel Fiber Reinforced Concrete. J. Wuhan Univ. Technol. 2017, 32, 121–128. [Google Scholar] [CrossRef]
- Tang, W.; Davidson, C.I.; Finger, S.; Vance, K. Erosion of limestone building surfaces caused by wind-driven rain: 1. Field measurements. Atmos. Environ. 2004, 38, 5589–5599. [Google Scholar] [CrossRef]
- Tang, W.; Davidson, C.I. Erosion of limestone building surfaces caused by wind-driven rain: 2. Numerical modeling. Atmos. Environ. 2004, 38, 5601–5609. [Google Scholar] [CrossRef]
- Erkal, A.; Ayala, D.D.; Sequeira, L. Assessment of wind-driven rain impact, related surface erosion and surface strength reduction of historic building materials. Build. Environ. 2012, 57, 336–348. [Google Scholar] [CrossRef]
- Striani, R.; Cappai, M.; Casnedi, L.; Esposito Corcione, C.; Pia, G. Coating’s influence on wind erosion of porous stones used in the Cultural Heritage of Southern Italy: Surface characterisation and resistance. Case Stud. Constr. Mater. 2022, 17, e1501. [Google Scholar] [CrossRef]
- Esteban-Cantillo, O.J.; Menendez, B.; Quesada, B. Climate change and air pollution impacts on cultural heritage building materials in Europe and Mexico. Sci. Total Environ. 2024, 921, 170945. [Google Scholar] [CrossRef]
- Vidal, F.; Vicente, R.; Mendes Silva, J. Review of environmental and air pollution impacts on built heritage: 10 questions on corrosion and soiling effects for urban intervention. J. Cult. Herit. 2019, 37, 273–295. [Google Scholar] [CrossRef]
- Sesana, E.; Gagnon, A.S.; Ciantelli, C.; Cassar, J.A.; Hughes, J.J. Climate change impacts on cultural heritage: A literature review. WIREs Clim. Chang. 2021, 12, e710. [Google Scholar] [CrossRef]
- Tanaka, H.; Inoue, M.; Ishikawa, T.; Nakayama, T. Simulating study of atmospheric corrosion of steels in a coastal industrial zone: Effect of SO32− on the formation of β-FeOOH rust particles synthesized from FeCl3 solutions. Corros. Sci. 2016, 112, 241–245. [Google Scholar] [CrossRef]
- Janfeshan Araghi, H.; Nikbin, I.M.; Rahimi Reskati, S.; Rahmani, E.; Allahyari, H. An experimental investigation on the erosion resistance of concrete containing various PET particles percentages against sulfuric acid attack. Constr. Build. Mater. 2015, 77, 461–471. [Google Scholar] [CrossRef]
- Lindgren, M.; Siljander, S.; Suihkonen, R.; Pohjanne, P.; Vuorinen, J. Erosion–corrosion resistance of various stainless steel grades in high-temperature sulfuric acid solution. Wear 2016, 364–365, 10–21. [Google Scholar] [CrossRef]
- Wang, X.; Wang, W.; Liu, Q.; Wang, S.; Luo, H.; Ji, S.; Zhu, J. Effects of metakaolin on sulfate and sulfuric acid resistance of grouting restoration materials. Constr. Build. Mater. 2022, 349, 128714. [Google Scholar] [CrossRef]
- Liu, P.; Chen, Y.; Yu, Z.; Lu, Z. Effect of sulfate solution concentration on the deterioration mechanism and physical properties of concrete. Constr. Build. Mater. 2019, 227, 116641. [Google Scholar] [CrossRef]
- Kawamoto, T. Deformation and fracturing behaviour of discontinuous rock mass damage mechanics theory. Int. J. Numer. Anal. Methods Geomech. 1988, 12, 1–30. [Google Scholar] [CrossRef]
- Jung, Y.S. Advancement of Erosion Testing, Modeling, and Design of Concrete Pavement Subbase Layers. Ph.D. Thesis, Texas A&M University, College Station, TX, USA, 2010. [Google Scholar]
- Pan, H.; Si, X.; Zhao, Q. Damage evolution model of early disturbed concrete under sulfate attack and its experimental verification. Dyna-Bilbao 2018, 93, 52–59. [Google Scholar] [CrossRef]
- Du, B.; Bai, H.; Zhai, M.; He, S. Experimental Study on Dynamic Compression Characteristics of Red Sandstone under Wetting-Drying Cycles. Adv. Civ. Eng. 2020, 2020, 6688202. [Google Scholar] [CrossRef]
- Sun, W.; Du, B.; Cheng, Q. Experimental Study of the Dynamic Mechanical Behavior and Degradation Mechanism of Red Sandstone in Acid Dry-Wet Cycles. Geofluids 2023, 2023, 5541567. [Google Scholar] [CrossRef]
- Dong, Q.; Sun, X.; Lei, N.; Liu, B. Effect of Dry-Wet Cycling on the Degradation Characteristics and Mechanisms of Red Sandstone. Geofluids 2023, 2023, 9950331. [Google Scholar] [CrossRef]
- Zhang, J.J. Study of the Fissures, Volume Change and Permeability of Expansive Soil under Wetting and Drying Cycles. Master’s Dissertation, South China University of Technology, Guangzhou, China, 2010. [Google Scholar]
- Zhang, X.; Qian, C.; Chen, H.; Liang, C.; Kang, W. Calculation of Expansion Stresses and Strains in Concrete under Sulfate Crystallization Attack in Dry-Wet Cycles Environments. J. Mater. Civ. Eng. 2021, 33. [Google Scholar] [CrossRef]
- Guo, J.; Liu, P.; Wu, C.; Wang, K. Effect of Dry-Wet Cycle Periods on Properties of Concrete under Sulfate Attack. Appl. Sci. 2021, 11, 888. [Google Scholar] [CrossRef]
- Wang, K.; Xu, G.; Li, S.; Ge, C. Geo-environmental characteristics of weathering deterioration of red sandstone relics: A case study in Tongtianyan Grottoes, Southern China. Bull. Eng. Geol. Environ. 2018, 77, 1515–1527. [Google Scholar] [CrossRef]
- Yang, Y.; Song, L.; Wang, J.; Yue, L.; Shi, E.; Wang, Z.; Yang, T. Impact of Acid, Salt, and Wetting-Drying Cycles on Weathering Deterioration of the Red Sandstone Used for Leshan Giant Buddha China. Int. J. Archit. Herit. 2024, 13, 123–149. [Google Scholar] [CrossRef]
- Wen, C.P.; Yuan, X.Q. Hyperbolic Consolidation Creep Model of Weathered Red Sandstone Coarse-Grained Soil Under the Wet and Dry Cycles Conditions. Geotech. Geol. Eng. 2022, 40, 5103–5113. [Google Scholar] [CrossRef]
- Basu, A.; Aydin, A. Evaluation of ultrasonic testing in rock material characterization. Geotech. Test. J. 2006, 29, 117–125. [Google Scholar] [CrossRef]
- Hou, H.; Hu, D.; Zhou, H.; Lu, J.; Zhang, F. A chemo-mechanical coupling model for concrete lining subjected to external sulfate attack. Eur. J. Environ. Civ. Eng. 2021, 25, 2674–2691. [Google Scholar] [CrossRef]
- Liao, K.; Zhang, Y.; Zhang, W.; Wang, Y.; Zhang, R. Modeling constitutive relationship of sulfate-attacked concrete. Constr. Build. Mater. 2020, 260, 119902. [Google Scholar] [CrossRef]
- Min, H.; Sui, L.; Xing, F.; Tian, H.; Zhou, Y. An effective transport model of sulfate attack in concrete. Constr. Build. Mater. 2019, 216, 365–378. [Google Scholar] [CrossRef]
- Zhou, X.; Shen, F.; Berto, F. Experimental study on triaxial creep behavior of red sandstone under different pore pressures based on ultrasonic measurement. Fatigue Fract. Eng. Mater. Struct. 2022, 45, 2388–2402. [Google Scholar] [CrossRef]
- Zhang, G.; Wang, L.; Liu, Z.; Wu, N. Experimental Study on Mechanical Properties and Deterioration Mechanism of Red Sandstone from the Panjiatuo Landslide under Action of Acidic Drying-Wetting Cycles. Appl. Sci. 2023, 13, 5955. [Google Scholar] [CrossRef]
- Tang, Z.C.; Zhang, Q.Z.; Zhang, Y. Cyclic Drying-Wetting Effect on Shear Behaviors of Red Sandstone Fracture. Rock Mech. Rock Eng. 2021, 54, 2595–2613. [Google Scholar] [CrossRef]
- Cao, R.; Fang, L.; Qiu, X.; Lin, H.; Li, X.; Li, W. Damage deterioration mechanism and damage constitutive modelling of red sandstone under cyclic thermal-cooling treatments. Arch. Civ. Mech. Eng. 2022, 22, 188. [Google Scholar] [CrossRef]
Figure 1.
Sponge sheet with red sandstone specimen.
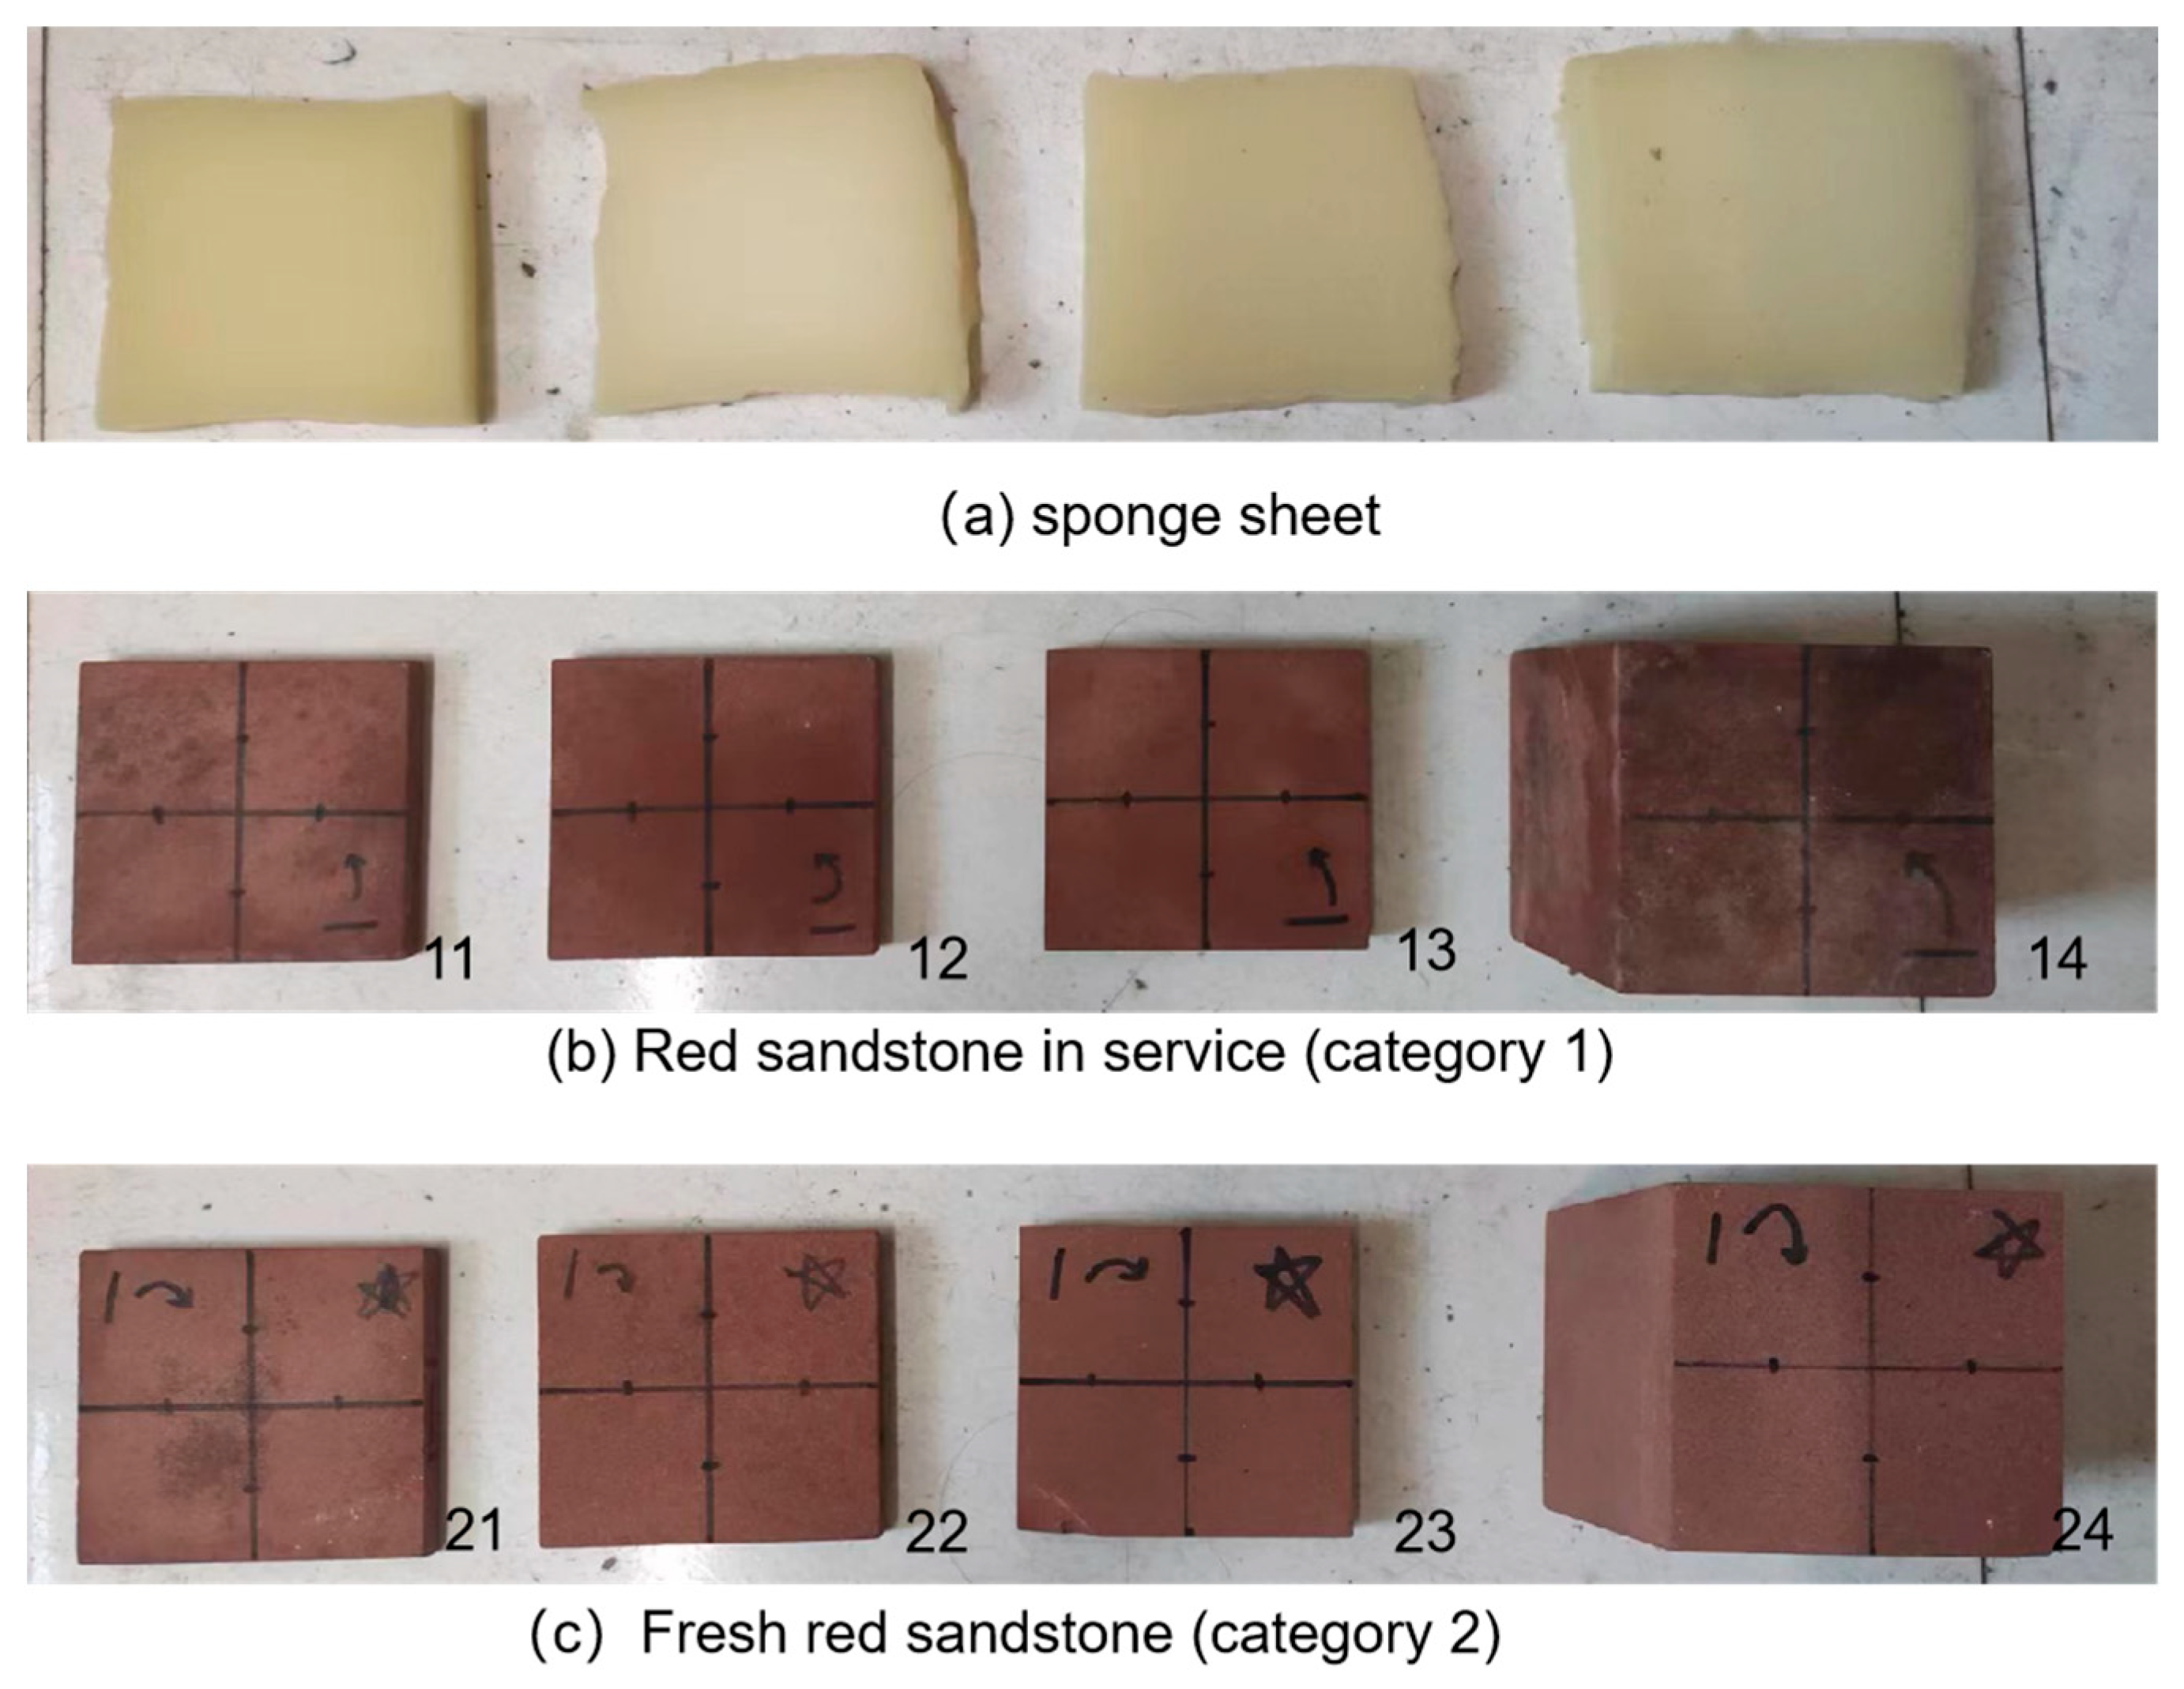
Figure 2.
Ultrasonic wave velocity, XRD, and SEM test plots.

Figure 3.
XRD spectrum of red sandstone specimens. (a) XRD spectrum of red sandstone specimen 14. (b) XRD spectrum of red sandstone specimen 24.
Figure 3.
XRD spectrum of red sandstone specimens. (a) XRD spectrum of red sandstone specimen 14. (b) XRD spectrum of red sandstone specimen 24.
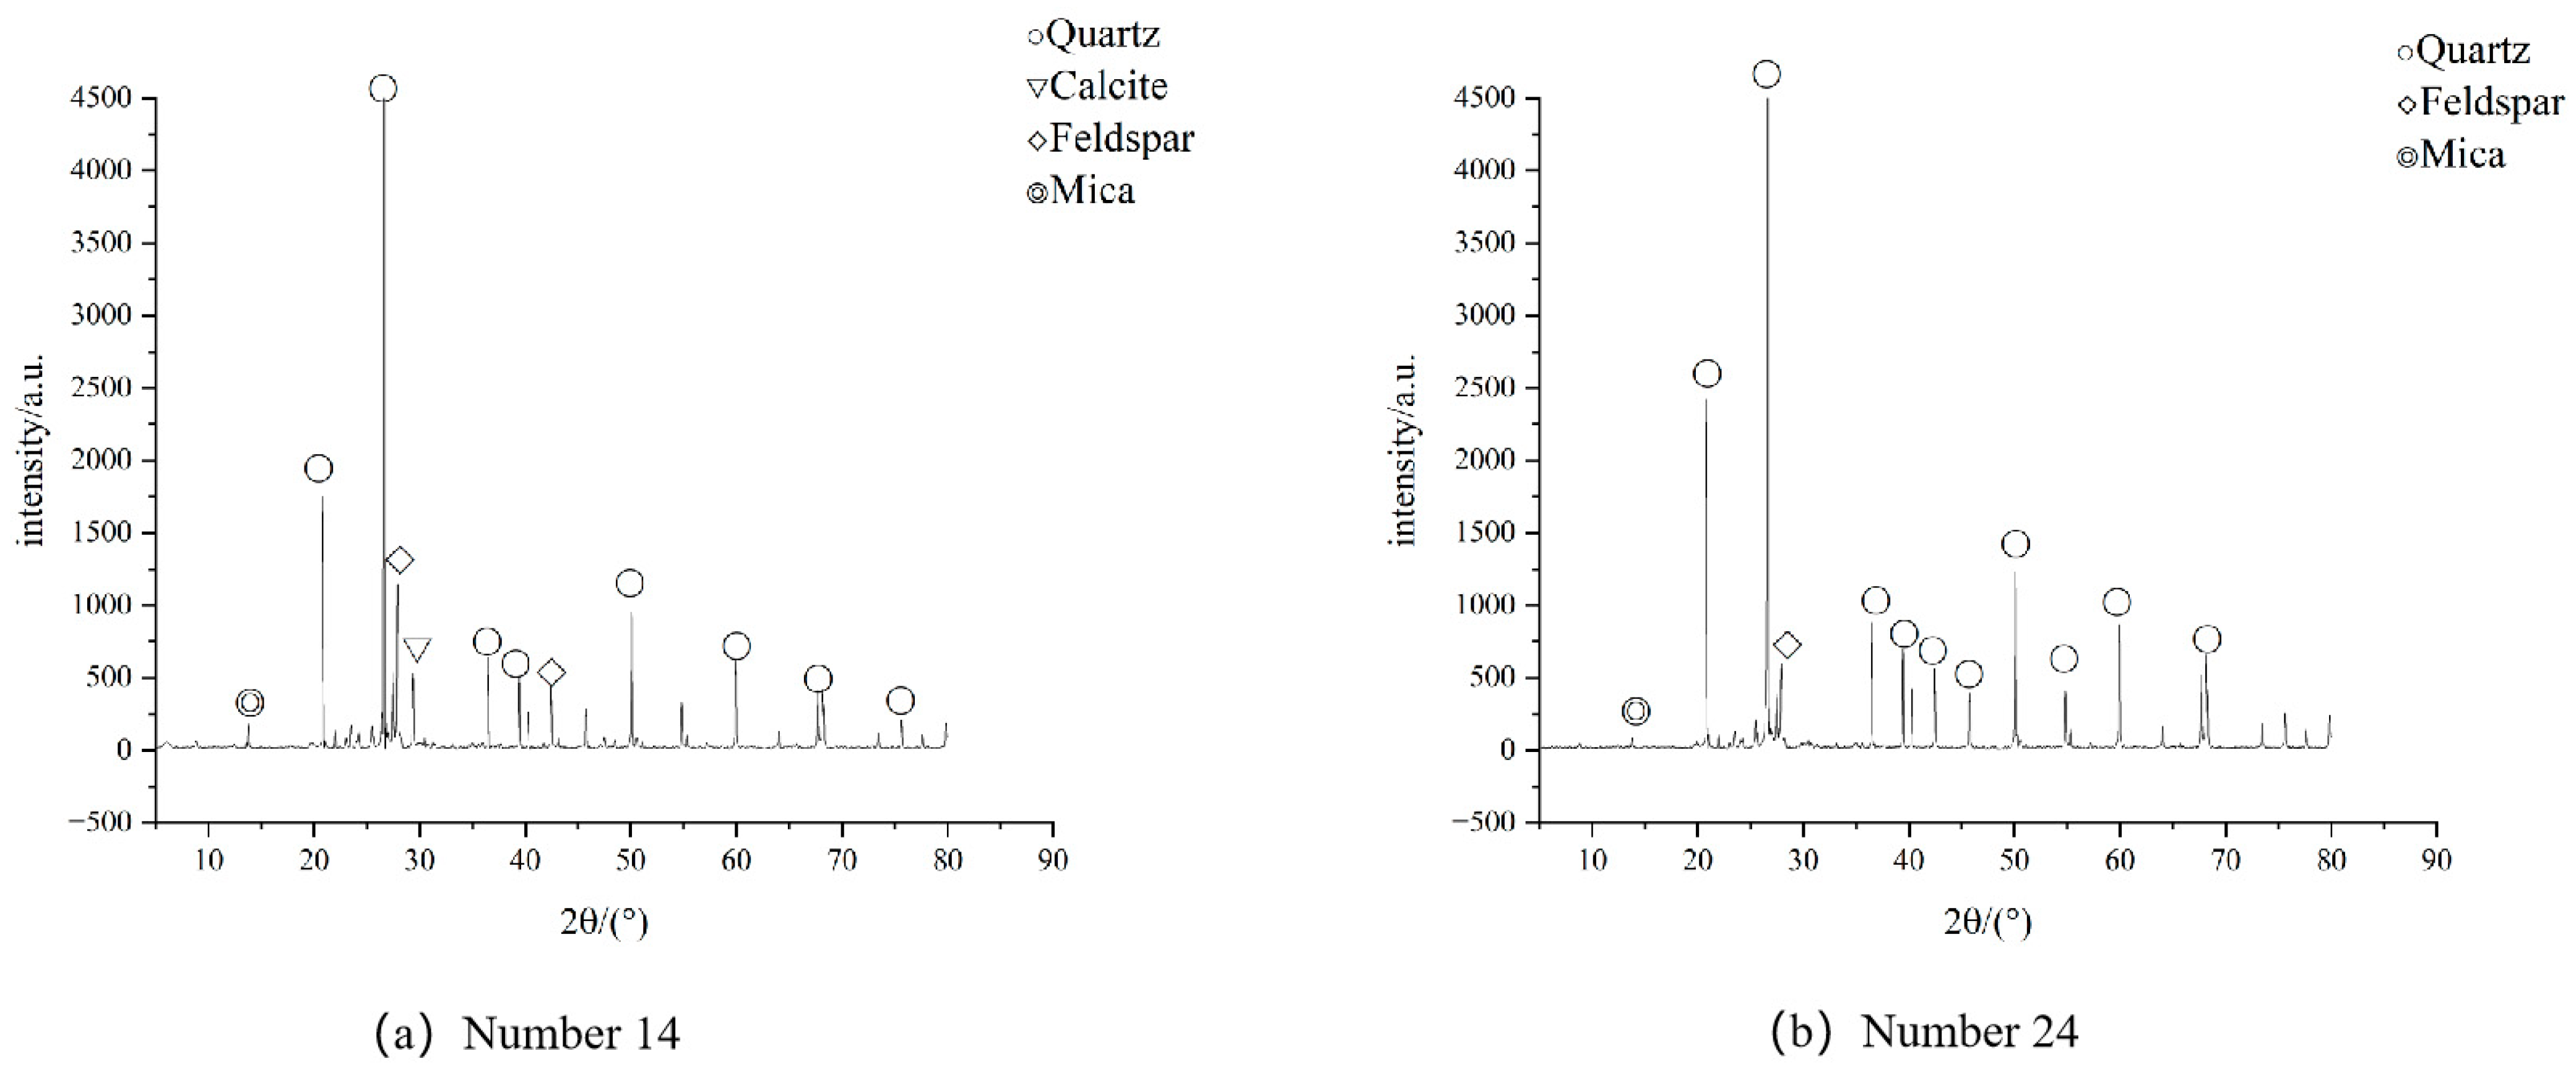
Figure 4.
SEM images of red sandstone specimens. (a) SEM image of red sandstone specimen 14 (×100, ×500 and ×2000). (b) SEM image of red sandstone specimen 24 (×100, ×500 and ×2000).
Figure 4.
SEM images of red sandstone specimens. (a) SEM image of red sandstone specimen 14 (×100, ×500 and ×2000). (b) SEM image of red sandstone specimen 24 (×100, ×500 and ×2000).

Figure 5.
Two erosion models for eroded building elements.
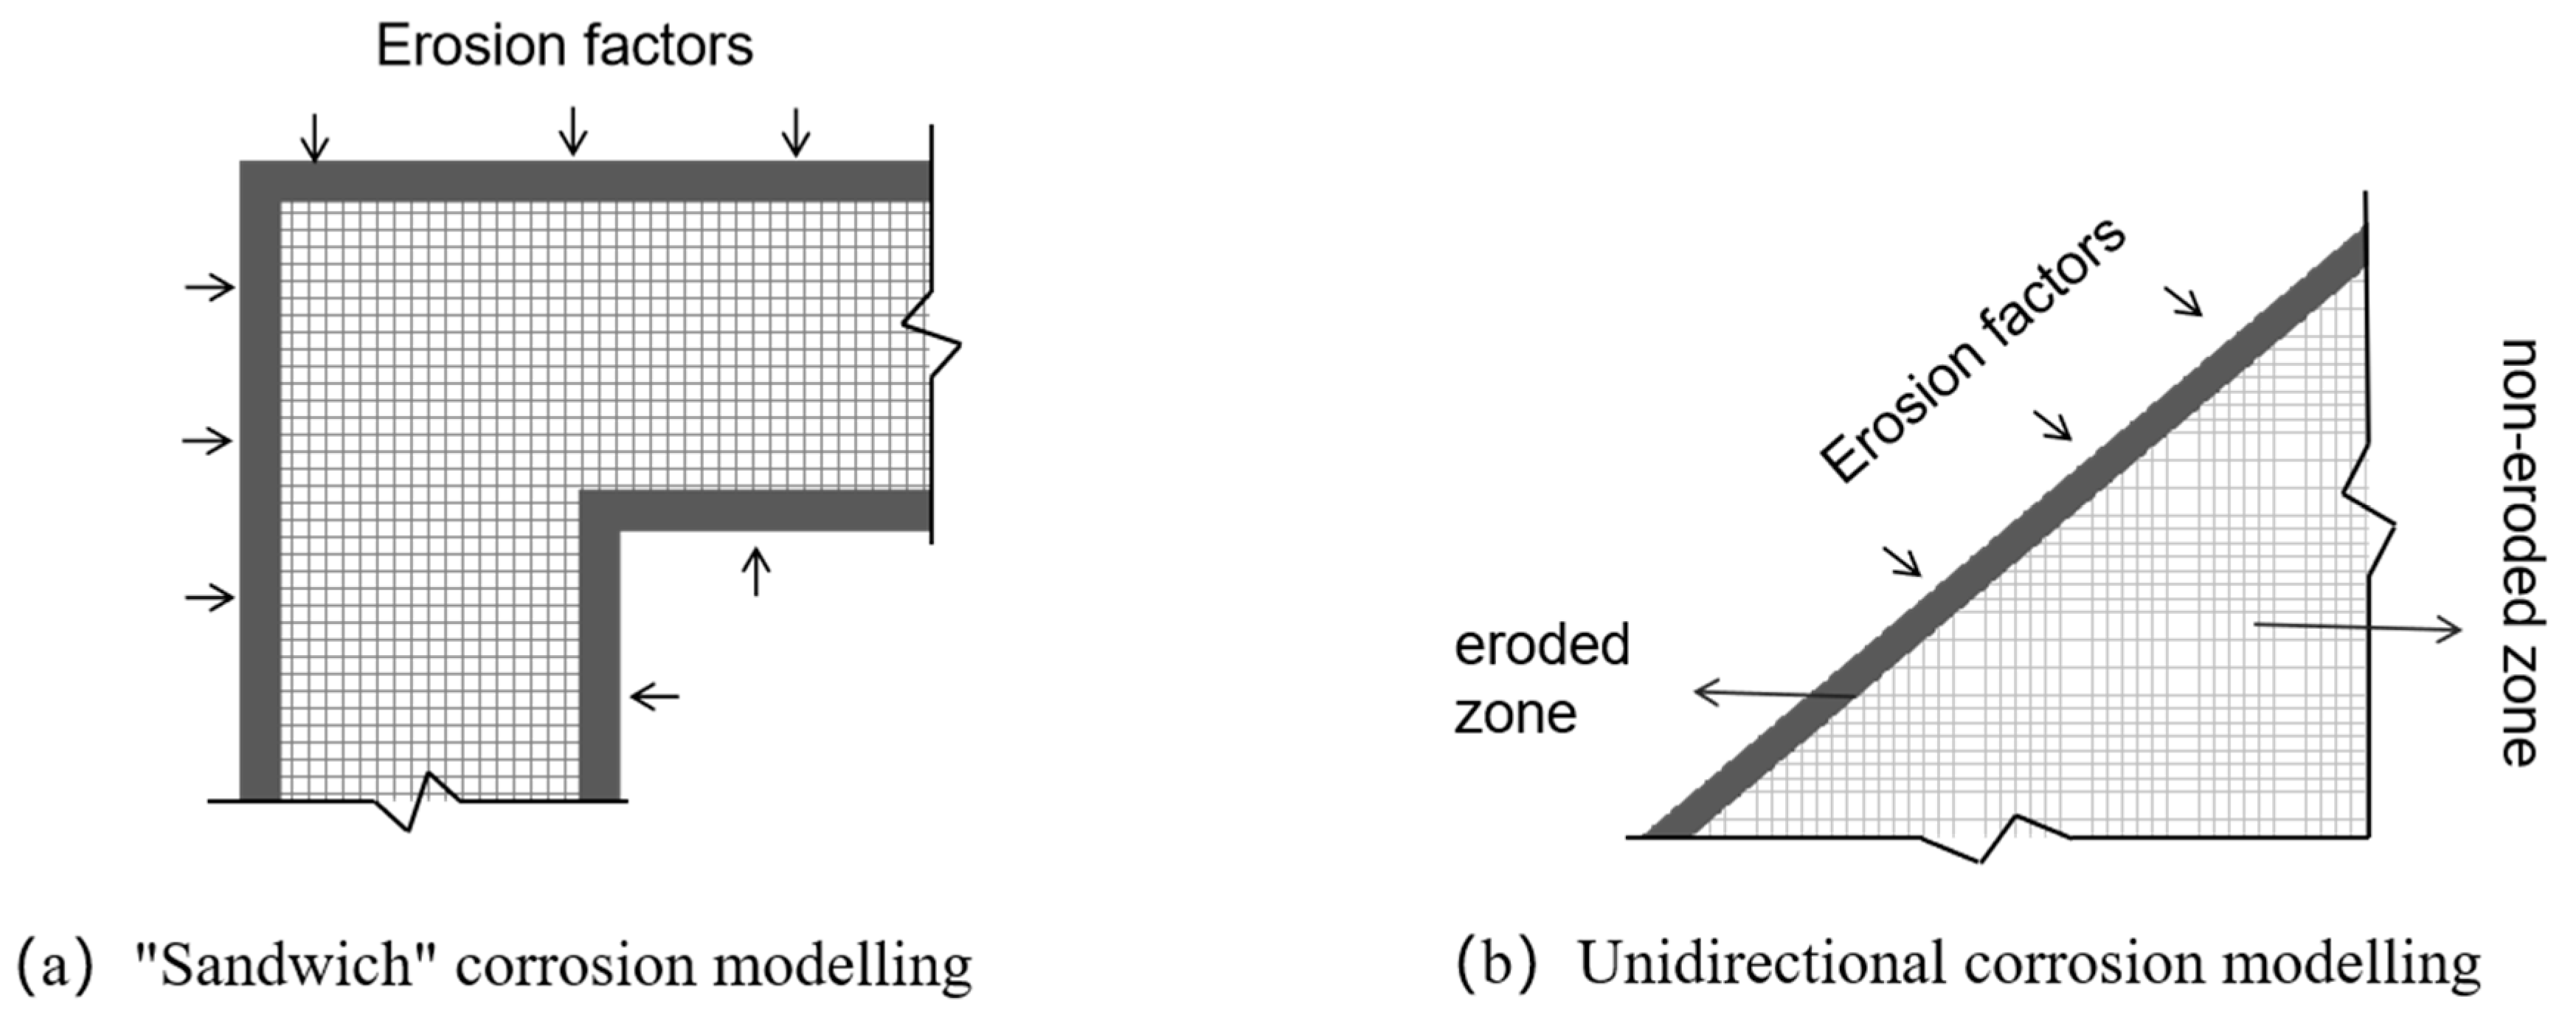
Figure 6.
Variation of ultrasonic velocity in red sandstone specimens under acidic dry and wet cycles. (a) Ultrasonic velocity variations in in-service red sandstone specimens. (b) Ultrasonic velocity variations in fresh red sandstone specimens.
Figure 6.
Variation of ultrasonic velocity in red sandstone specimens under acidic dry and wet cycles. (a) Ultrasonic velocity variations in in-service red sandstone specimens. (b) Ultrasonic velocity variations in fresh red sandstone specimens.

Figure 7.
Relationship between ultrasonic velocity and the number of wet and dry cycles for in-service red sandstone specimens. (a) Relationship between ultrasonic velocity and the number of wet and dry cycles for sandstone specimen 11. (b) Relationship between ultrasonic velocity and the number of wet and dry cycles for sandstone specimen 12. (c) Relationship between ultrasonic velocity and the number of wet and dry cycles for sandstone specimen 13. (d) Relationship between ultrasonic velocity and the number of wet and dry cycles for sandstone specimen 14.
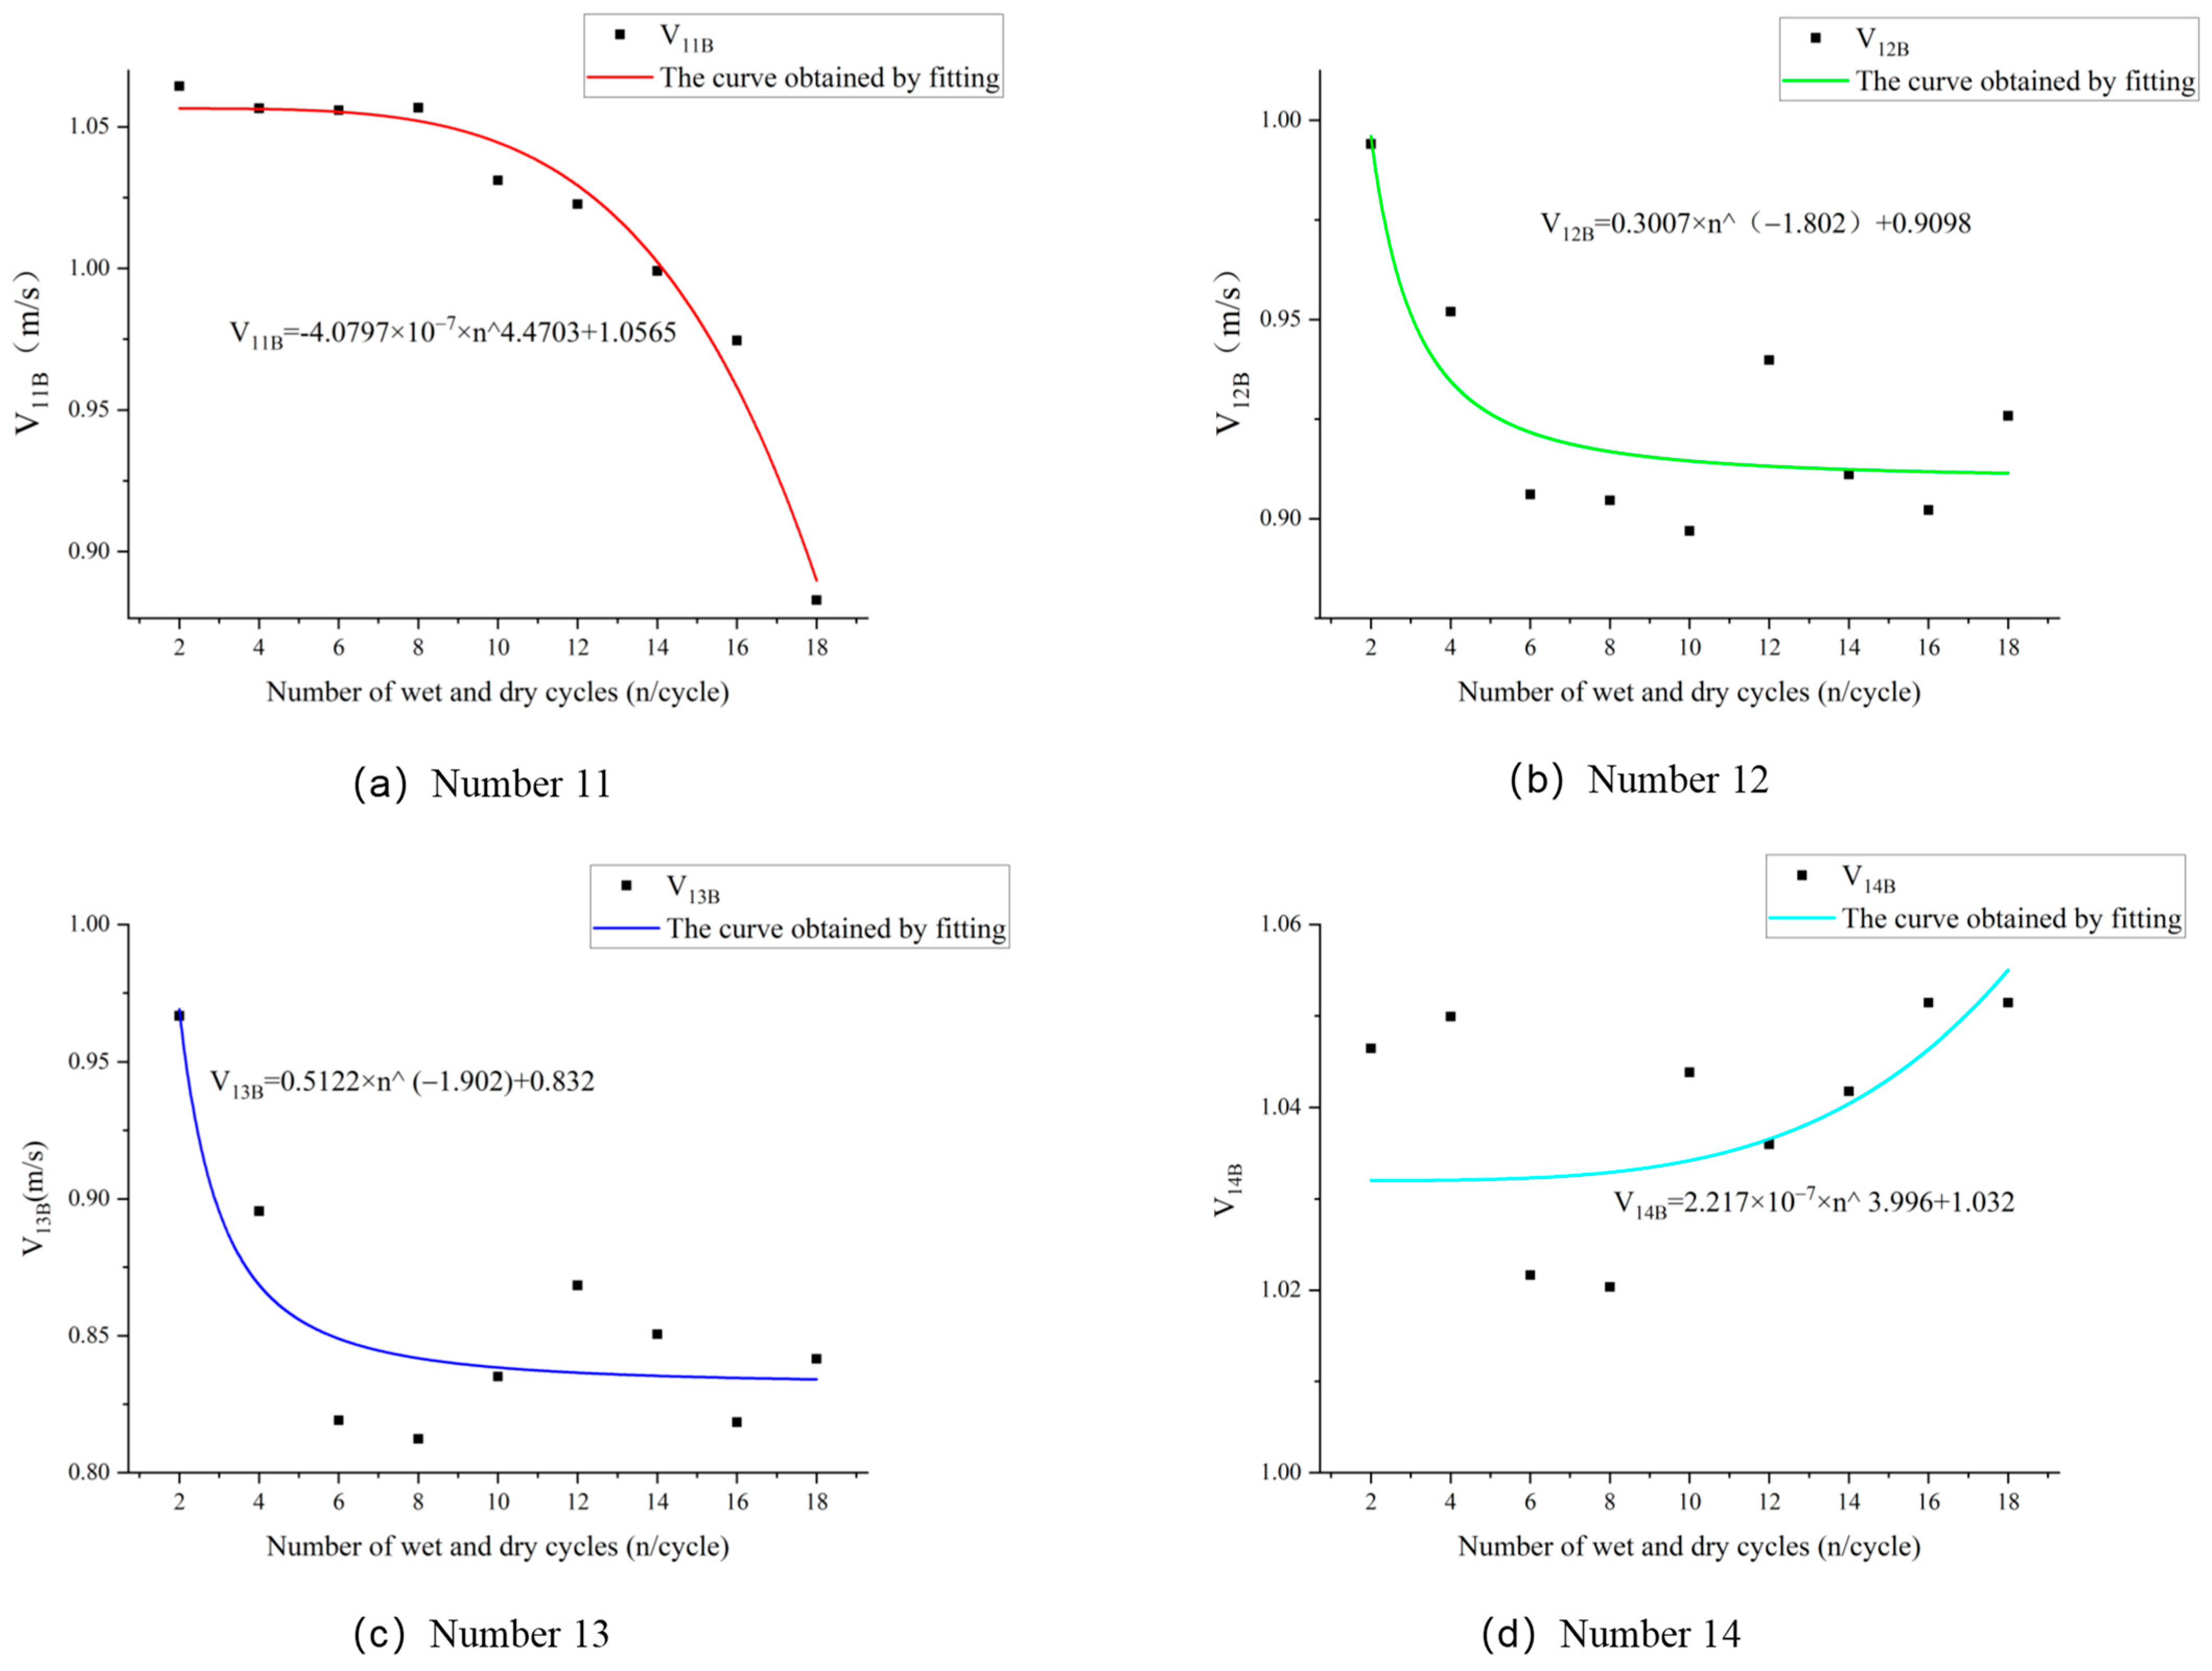
Figure 8.
Relationship between ultrasonic velocity and the number of wet and dry cycles for fresh red sandstone specimens. (a) Relationship between ultrasonic velocity and the number of wet and dry cycles for sandstone specimen 21. (b) Relationship between ultrasonic velocity and the number of wet and dry cycles for sandstone specimen 22. (c) Relationship between ultrasonic velocity and the number of wet and dry cycles for sandstone specimen 23. (d) Relationship between ultrasonic velocity and the number of wet and dry cycles for sandstone specimen 24.


Table 1.
Major substances and micro-distribution of different red sandstone specimens.
| Serial Number | Main Substances | Micro-Distribution |
|---|---|---|
| 14 | Quartz, feldspar, and mica | Overall smooth with no obvious defects, cracks, or other defects |
| 24 | Quartz, feldspar, mica, and calcite | Significant increase in defects such as granularity, flocculation, holes, etc. |
Table 2.
Model of ultrasonic velocity as a function of the number of wet and dry cycles for red sandstone specimens in service.
Table 2.
Model of ultrasonic velocity as a function of the number of wet and dry cycles for red sandstone specimens in service.
| Specimen Number | Fit a Function Model | R2 |
|---|---|---|
| 11 | H1(1, n) = -4.0797 × 10⁻⁷ × n^ 4.4703 + 1.0565 | 0.9767 |
| 12 | H1(1.5, n) = 0.3007 × n^ (−1.802) + 0.9098 | 0.7649 |
| 13 | H1(2, n) = 0.5122 × n^ (−1.902) + 0.832 | 0.7898 |
| 14 | H1(10, n) = 2.217 × 10⁻⁷ × n^ 3.996 + 1.032 | 0.5636 |
Table 3.
Fitted model of ultrasonic velocity and the number of wet and dry cycles of fresh red sandstone specimens.
Table 3.
Fitted model of ultrasonic velocity and the number of wet and dry cycles of fresh red sandstone specimens.
| Specimen Number | Fit a Function Model | R2 |
|---|---|---|
| 21 | H2(1, n) = 0.1461 × n^ (−1.58) + 0.9394 | 0.5734 |
| 22 | H2(1.5, n) = 0.1815 × n^ (−1.348) + 0.9115 | 0.4569 |
| 23 | H2(2, n) = 1.109 × 10⁻⁴ × n^ 2.288 + 0.9742 | 0.6945 |
| 24 | H2(10, n) = 1.325 × 10⁻⁴ × n^ 2.508 + 0.9869 | 0.9258 |
Disclaimer/Publisher’s Note: The statements, opinions and data contained in all publications are solely those of the individual author(s) and contributor(s) and not of MDPI and/or the editor(s). MDPI and/or the editor(s) disclaim responsibility for any injury to people or property resulting from any ideas, methods, instructions or products referred to in the content. |
© 2024 by the authors. Licensee MDPI, Basel, Switzerland. This article is an open access article distributed under the terms and conditions of the Creative Commons Attribution (CC BY) license (https://creativecommons.org/licenses/by/4.0/).
Share and Cite
MDPI and ACS Style
Zeng, S.; Zhang, J.; Zhang, H.; Li, R.; Ao, T.; Cao, K. Experimental Study on Erosion Modeling of Architectural Red Sandstone under the Action of the Natural Environment. Buildings 2024, 14, 1168. https://doi.org/10.3390/buildings14041168
AMA Style
Zeng S, Zhang J, Zhang H, Li R, Ao T, Cao K. Experimental Study on Erosion Modeling of Architectural Red Sandstone under the Action of the Natural Environment. Buildings. 2024; 14(4):1168. https://doi.org/10.3390/buildings14041168
Chicago/Turabian StyleZeng, Shuisheng, Jun Zhang, Huanlin Zhang, Rutian Li, Tao Ao, and Kunpeng Cao. 2024. "Experimental Study on Erosion Modeling of Architectural Red Sandstone under the Action of the Natural Environment" Buildings 14, no. 4: 1168. https://doi.org/10.3390/buildings14041168
Note that from the first issue of 2016, this journal uses article numbers instead of page numbers. See further details here.