Article

Automated Reinforcement during Large-Scale Additive Manufacturing: Structural Assessment of a Dual Approach

1
Bert S Turner Department of Construction Management, Louisiana State University, Baton Rouge, LA 70803, USA
2
Virginia Transportation Research Council, Charlottesville, VA 22903, USA
3
Division of Electrical and Computer Engineering, Louisiana State University, Baton Rouge, LA 70803, USA
*
Author to whom correspondence should be addressed.
Buildings 2024, 14(4), 1167; https://doi.org/10.3390/buildings14041167
Submission received: 30 March 2024 / Revised: 14 April 2024 / Accepted: 16 April 2024 / Published: 20 April 2024
(This article belongs to the Special Issue Advances in the 3D Printing of Concrete)

Abstract

:
Automated and seamless integration of reinforcement is one of the main unresolved challenges in large-scale additive construction. This study leverages a dual-reinforcement solution consisting of high-dosage steel fiber (up to 2.5% by volume) and short vertical reinforcements as a complementary reinforcement technique for 3D-printed elements. The mechanical performance of the printing material was characterized by measuring the compressive, flexural, and uniaxial tensile strengths of mold-cast specimens. Furthermore, the flexural performance of the plain and fiber-reinforced 3D-printed beams was evaluated in the three main loading directions (X, Y, and Z-directions in-plane). In addition, short vertical threaded reinforcements were inserted into the fiber-reinforced 3D-printed beams tested in the Z-direction. The experimental results revealed the superior flexural performance of the fiber-reinforced beams loaded in the longitudinal directions (X and Y). Moreover, the threaded reinforcement significantly increases the flexural strength and ductility of beams loaded along the interface, compared to the control. Overall, the proposed dual-reinforcement approach, which exhibited notably less porosity compared to the mold-cast counterpart, holds great potential as a reinforcement solution for 3D-printed structures without the need for manual operations.

1. Introduction

Traditional construction heavily depends on manual labor, leading to low and stagnant productivity levels [1,2]. In recent years, specialized robotic construction techniques such as construction 3D printing (C3DP) have gained popularity for their large-scale, automated construction capabilities in sectors like housing, infrastructure, and beyond [3,4,5,6]. C3DP offers significant economic benefits by reducing the construction time, waste, and costs associated with traditional methods, such as formwork expenses and labor-intensive activities [7,8,9,10]. In extrusion-based C3DP, cementitious materials are commonly used following a careful selection of ingredients, well-tailored mixture proportions, and optimized 3D-printing process parameters [11,12]. However, efficient and effective incorporation of reinforcement into the 3D-printed structures, without significantly increasing the construction time and cost, remains a major challenge and has been the focus of numerous recent studies [13,14].
To improve the structural integrity of 3D-printed structures, different reinforcement strategies from manual to automated implementations were proposed and investigated in previous studies. Manual implementation of traditional reinforcements in 3D printing may result in insufficient structural performance, often due to inadequate execution precision [15]. Some researchers also adopted the post-integration of traditional reinforcement; however, automating this construction process is complex and not feasible in the near future [16,17]. In-process (in-line) reinforcement is an interesting possibility for integrating reinforcement during the layer-by-layer deposition process. It can be achieved by adding continuous reinforcement such as entrained cables, barbs, and tapes [18,19,20,21]. Furthermore, it can also be achieved by using discrete reinforcing elements such as fibers that can be premixed with the printing materials [22,23,24,25,26,27,28]. The process of adding short discrete fibers eliminates the need for additional hardware and systems for reinforcement installation, avoiding the complexities associated with other reinforcing techniques.
Fiber characteristics such as type, length, and dosages can significantly impact the strength behavior of 3D-printed cementitious materials. However, printing at high doses of fibers can lead to increased viscosity and present challenges like potential clogging of printing nozzles. In a recent study by the authors, mixtures with 2.5% vol. steel fibers were 3D printed using a 40 mm × 20 mm specialty nozzle without printability issues and revealed a flexural strength of 129% compared to the control [29,30]. This was the highest steel fiber dosage that has been incorporated into printing mixtures, surpassing the previous maximum of 2.1% based on the existing literature [27]. Similar to fiber dosage, fiber length influences the printability and performance of the mixtures. Pham et al. found that longer fibers aligned better and prevented brittle failure in both cast and printed specimens [28]. Arunothayan et al. studied 3D-printed UHPFRC with 6 mm steel fibers (up to 2% volume) and observed a superior flexural performance with up to 39% improvement, mainly due to fiber alignment parallel to the printing direction compared to the mold-cast specimens [31]. However, apart from its effect on the layer-by-layer printing process, fibers’ preferential alignment to the printing direction can lead to anisotropy. Singh et al. observed the anisotropic behavior given by the reduction in compressive strength in the following order: 90° > 45° > 0° loading direction, for 3D-printed mixtures with 13 mm steel fibers [32]. The results of previous studies provide no evidence of fibers vertically bridging across the printed layers [8,28,33,34].
Insertion of discrete reinforcement elements during the layer-deposition process can vertically bridge 3D-printed layers. However, Marchment and Sanjayan observed that inserting a 350 mm long, 7 mm diameter rebar into a 3D-printed wall led to a significant decrease in bond strength due to disturbances and voids created during the process [35]. This result underlines the importance of a seamless reinforcement insertion process. Park et al. studied interlayer reinforcement inserted in 3D-printed specimens with and without overlapping. Anisotropic properties were observed in all specimens, indicating further research is needed to understand the effects of overlapping [36]. Marchment and Sanjayan investigated center- and off-center-lapping for lengths of 20, 17, 14, and 11 times the bar diameter (7 mm diameter deformed steel bar) and found that a minimum lap of 20 times diameter was necessary for the 3D-printed specimen to achieve a flexural strength comparable to that of a single rebar [35]. Some researchers also explored short discrete reinforcement elements such as screws, nails, U-nails, staples, etc. [37,38,39]. U-nails’ (1–3 mm) penetration at layer interfaces improves bonding strength significantly but factors such as nail spacing, depth, and thickness significantly affect the strength [38]. To avoid void creation during the insertion process, Marchment and Sanjayan adopted a paste-coated penetration technique and the results showed that paste on rebar filled the voids in only the top 47–56% portion of a 350 mm bar length [40]. The penetration process created additional cavities around the reinforcement in addition to the porosity of the printing material [35]. Hass et al. explored helical screw-type reinforcements and screwing mechanisms that can improve bond strength, potentially creating fewer voids; however, they recommended further investigation is needed using different materials to establish its effectiveness [41]. Hence, the penetrative reinforcement integration approach requires careful design of the automated insertion system and the reinforcement details and specifications.
Although previous studies have investigated the performance of these reinforcement techniques at different lengths, the potential of adopting a complementary reinforcement approach has not been well explored. As such, this paper focuses on the fresh-state properties and mechanical performance of 3D-printed steel fiber-reinforced materials with very high dosages of steel fiber. Next, the fiber-reinforced 3D-printed elements were further strengthened with vertical discontinuous threaded reinforcements inserted using an automated insertion device. The proposed reinforcement approach is studied under different loading directions to provide insights into its effectiveness for structural applications of C3DP.

2. Materials and Methods

2.1. Materials

The printing mixture ingredients were selected following the authors’ previous work to achieve the desired printability properties and performance [30]. ASTM C150 Type I/II Portland cement was used as the binder [42]. Table 1 shows the chemical composition of the Portland cement used in this study. Silica sand with a maximum nominal particle size of 1 mm was used as the aggregate, and ADVA Cast 585 superplasticizer was used to achieve the desired flowability properties.
In this study, two types of reinforcement were considered, namely, discrete steel fibers and threaded stainless steel mini-rods. ASTM 820 Type 1 [43] brass-coated straight 13 mm steel fibers with a 0.2 mm diameter (aspect ratio = 65) were used in this study. The physical and mechanical properties of steel fiber are presented in Table 2. The details of threaded reinforcement elements are presented in Section 2.5.2.

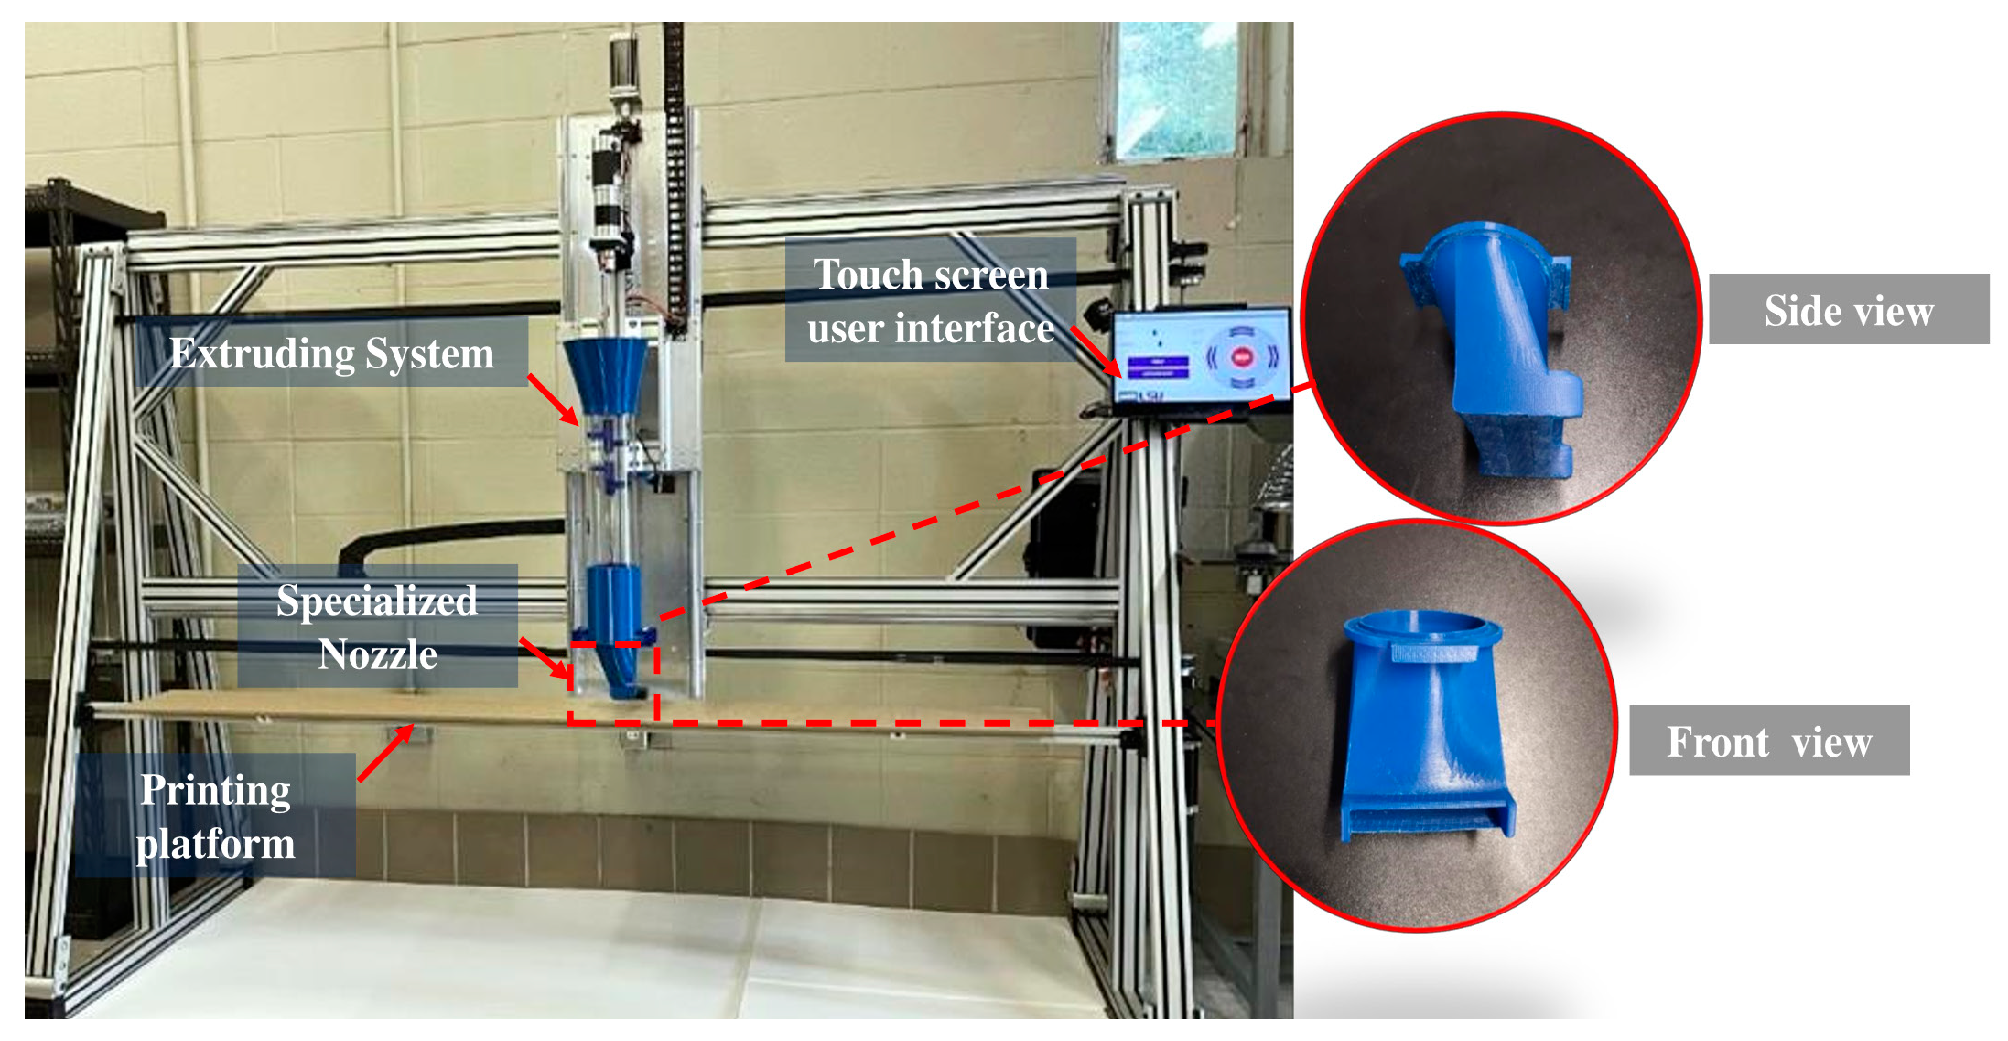
2.2. 3D-Printing System

A gantry-style linear concrete printing platform developed at Louisiana State University (LSU) was used for fabricating specimens (Figure 1). The embedded closed-loop extrusion system ensures consistent and uniform fabrication of high-quality specimens. This printer has a build envelope of 2100 mm (L) × 900 mm (H). The printing system is designed such that various nozzle configurations can be quickly attached to the extrusion system. The printer is also equipped with a touchscreen user interface to precisely control the extruder movement (printing speed) and the extrusion rate. To fabricate 3D-printed beams, a specialized rectangular nozzle was designed with a 100 (L) × 25 (H) mm opening, equipped with side trowels to improve the surface quality of the extruded layers. The selected nozzle dimension allows the printing of the exact width of the beam specimens. Hence, the contours of the printed elements are achieved with fewer tool paths, eliminating the occurrence of defects from adjacent layers if a smaller nozzle dimension is used.
To automate threaded bar insertion into the 3D-printed beams, an electromechanical module was designed, developed, and integrated into the extrusion system (Figure 2). The device was equipped with a 200-step bipolar stepper motor controlled by an Arduino microcontroller with an ATmega328P processor. As a result, the reinforcement insertion process was conducted at a consistent insertion speed, resulting in a higher quality of reinforced specimens. After initial testing and evaluation, an insertion speed of 3 mm/s (vertical) was selected to minimize the voids created during the insertion process.

2.3. Mixing and Material Preparation

In a previous study by the authors [30], the printability and mechanical performance of 33 different plain and fiber-reinforced mixtures were evaluated. Based on the results, two mixtures were selected as the printing materials used to fabricate the test specimens in this study (Table 3).
A 20-L planetary mixer operated at a fixed speed of 80 RPM was used to prepare the printing material. The cement and sand were initially mixed in a dry state to achieve a homogenous mixture. After 2 min, water was gradually added to the mixture. The mixing process was then continued for 3 min, and the superplasticizer was added. Finally, steel fibers were added (if applicable) and the mixture was mixed for 5 additional minutes.

2.4. Characterization Tests: Conventional Mold-Cast Specimens

The properties of the printing materials were evaluated through a systematic experimental program. First, the fresh and mechanical properties of mixtures were examined using mold-cast specimens. Next, 3D-printed specimens were fabricated out of these materials and were tested. The experimental program includes fresh properties such as flowability and printability; as well as the mechanical properties such as flexural strength of the standard 3D-printed beams, including beams with threaded reinforcement.

2.4.1. Fresh Properties

Wet density and flowability tests were conducted to assess the fresh properties of the two mixtures. The wet density test involved determining the mass of a given volume of the freshly mixed mixtures. Additionally, the flowability of the mixtures was measured using a flow table test according to ASTM C1437 [44].

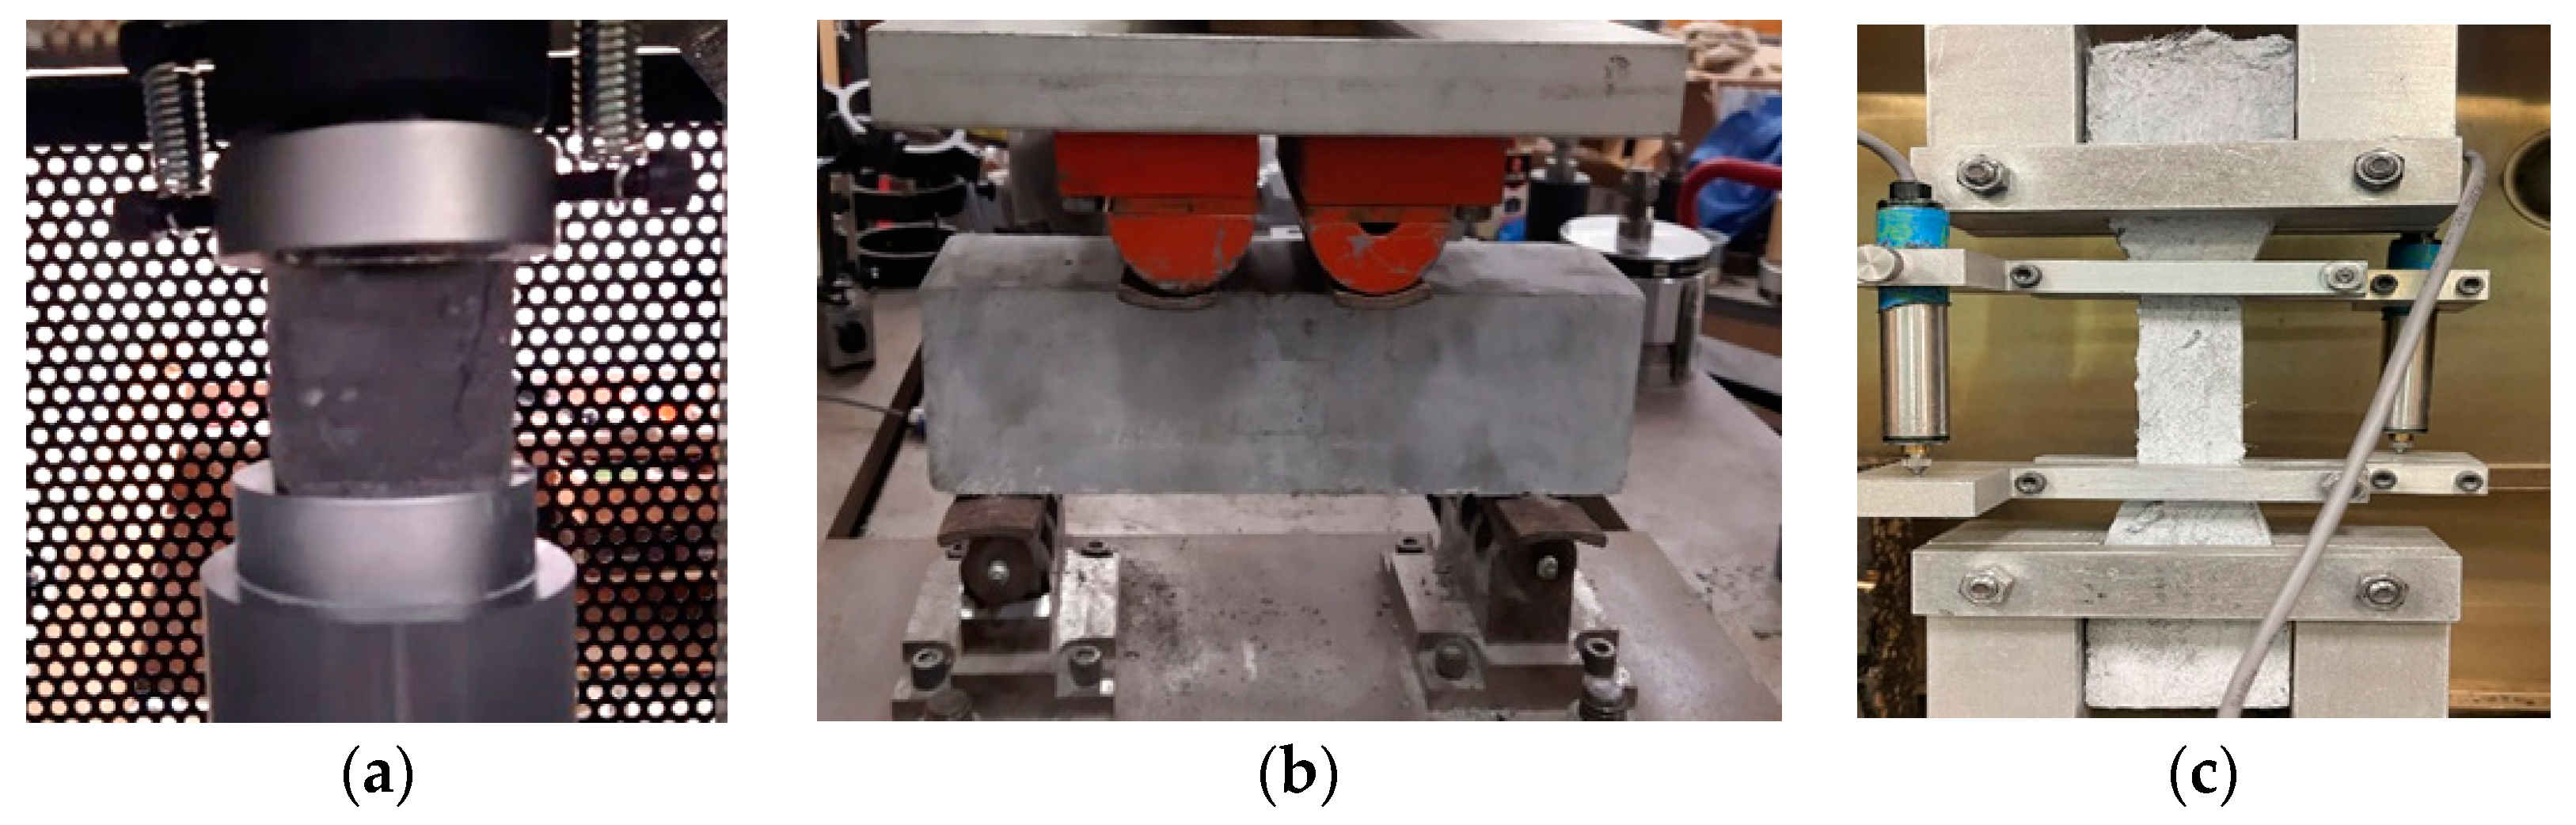
2.4.2. Mechanical Properties

The mechanical properties were assessed to evaluate the performance of the mixtures, and different tests were conducted to evaluate properties such as compressive strength, flexural strength, and tensile strength. The setups for these tests are presented in Figure 3. To evaluate the compressive strength of the two mixtures, tests were conducted following the guidelines stated in ASTM C109 specifications [45]. For this test, mold-cast cubes measuring 50 mm × 50 mm × 50 mm were prepared and tested after 28 days. To evaluate flexural performance, 4-point bending tests (using third-point loading) were conducted according to ASTM C78 [46] and ASTM C1609 [47] for plain and steel fiber-reinforced mixtures, respectively. Six mold-cast beams (F0-MC and F2.5-MC) were fabricated to perform the tests. The flexural tests were conducted using a 500kN MTS hydraulic servo-control system. A closed-loop displacement control system was used, with the rate set to 0.076 mm/min for ASTM C1609. For ASTM C78, the load was applied at a rate of 3.6 kN/min. Two magnetic arms were used to hold the linear variable differential transducers (LVDTs) on both sides of the specimens during the ASTM C1609 test. These LVDTs were used to measure the mid-point displacement of the specimens during the test.
Equation (1) was used to determine the maximum flexural tensile stress ( f i ), occurring at the bottom of the beam, for any given load ( P i ). Using the same equation, the Modulus of Rupture (MOR) or flexural tensile strength ( f p ) was calculated by setting P i equal to the peak load ( P p ).
f i = P i L b d 2
where L is the effective beam span (300 mm), and b and d are the width and depth of the beam, respectively.
The deflection capacity or deflection at peak load ( δ p )   was obtained from the experimental data. Additionally, the toughness ( T 150 100 ) of the beams up to a deflection of L/150 (i.e., 2 mm deflection in load-deflection curves) was calculated following ASTM C1609—only for the fiber-reinforced beams. Equation 1 was also used to calculate the MOR for unreinforced beams using the peak load obtained from ASTM C78. Next, the uniaxial tensile test was carried out to evaluate the tensile performance of the printing materials. Then, 28-day mold-cast dumbbell-shaped specimens were used for both mixtures, with 3 specimens tested for each mixture. The testing protocol followed the guidelines outlined by the Japan Society of Civil Engineers (JSCE) [48]. Experimental tests were carried out by a servo-hydraulic machine with a tensile capacity of 250 kN connected to a computer to record tensile strength, tensile strain capacity, and dissipated energy. The uniaxial tensile test was performed by controlling the displacement of the loading head at a constant rate of 0.5 mm/min. The displacement was recorded using two LVDTs attached to the specimen, one on each side. The toughness ( G T v ) of each material is calculated using Equation (2).
G T _ v = 0 ε l i m σ ε d ε
where σ ( ε ) is the tensile stress vs. strain relation, and ε l i m is the limiting strain (considered 2.5%).

2.5. Characterization Tests: 3D-Printed Specimens

2.5.1. Printable Fresh Properties

The flowability of the printable mixtures was measured using a flow table test. Based on initial trials, it was observed that average flow values lower than 170 mm result in nozzle blockage or poor surface quality due to tearing, and flow values higher than 185 mm result in considerable layer deformations. Hence, an acceptable flowability range of 170–185 mm was determined for printing materials.
The print quality and shape stability of mixtures were also evaluated [49]. Print quality was assessed based on the dimensional accuracy and consistency of the printed layers and the surface quality of each layer. Printing parameters were carefully adjusted to prevent under-extrusion or over-extrusion, and to minimize deformations in the layers. The dimensions of the printed layers were measured to ensure conformity and consistency, with a layer height of 25 mm and a layer width of 100 mm, corresponding to the nozzle dimensions. A 40 mm/s printing speed and a 5 mm clearance between the nozzle and the previous layer were used for fabricating all specimens. The shape stability of the layers was evaluated based on the deformation of the first layer after the deposition of two subsequent layers, with no more than 10% maximum variation in each layer.
Since the actual object dimension influences the selection of the optimal nozzle size used for the printing process, this study additionally evaluates how nozzle dimensions affect the shape stability of the printed layers. As such, the shape stability results from this study were compared to the results from the authors’ earlier study where a smaller nozzle dimension (40 mm (W) × 20 mm (H)) was employed (with similar test configurations and at a printing speed of 50 mm/s) [29,30]. In all cases, a variable flow rate (80 to 160 RPM) was adopted to ensure desirable layer dimensions and consistent material flow given changes in material rheology over time.

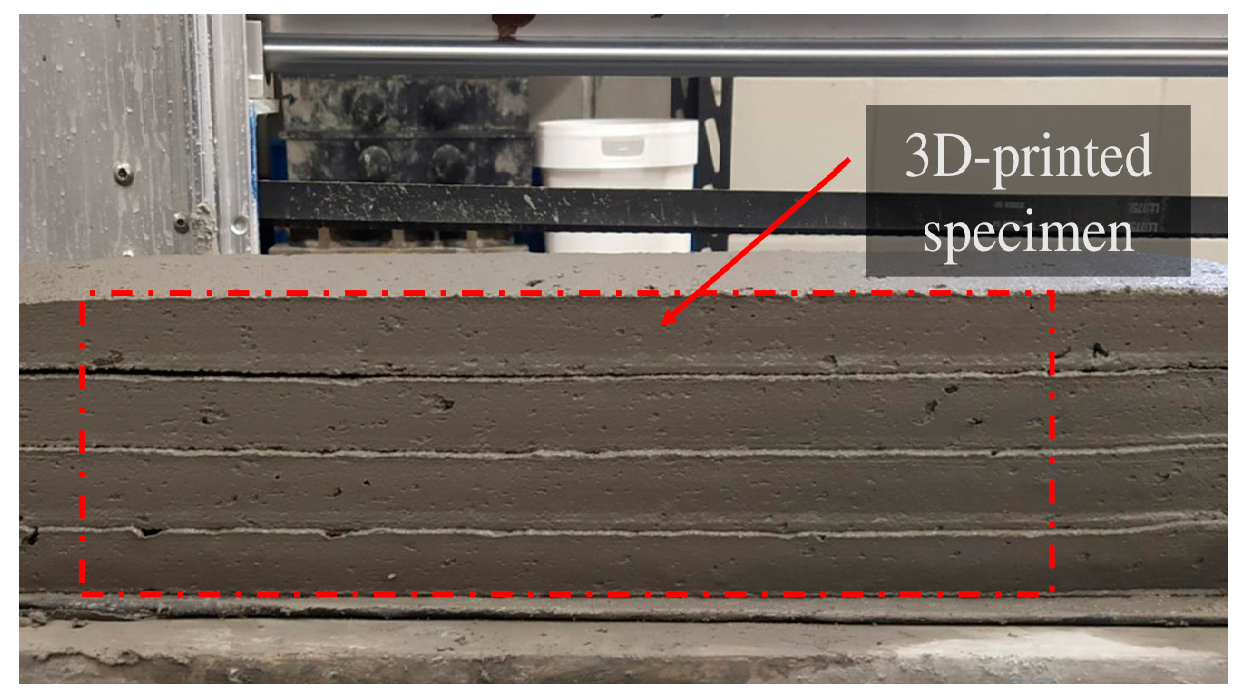
2.5.2. Fabrication of the Test Beams

A total of 21 3D-printed beams (100 mm × 100 mm × 350 mm) were fabricated, according to ASTM C1609 and ASTM C78 specifications. Plain beams were 3D printed and tested under different loading directions (F0-3DP-X, F0-3DP-Y, and F0-3DP-Z). Similarly, steel fiber-reinforced beams were tested under different loading directions (F2.5-3DP-X, F2.5-3DP-Y, and F2.5-3DP-Z). Beams with threaded reinforcement (F2.5-3DP-Z-TR) were tested in the Z direction only (Figure 4). In all cases, three replicates were fabricated and tested.
X- and Y-direction beams were extracted from 4-layer 500 mm long printed specimens. The extraction process was conducted within 2 h after printing by cutting the two ends of the beam using a rotary cutting device. Figure 5 shows 3D-printed beams for testing in X and Y directions.
For the Z-direction beams, 14-layer 500 mm long wall specimens were 3D printed, and then beams with the desired dimensions were extracted within 2 h of the printing process. A maximum of 3 min of interlayer time gap was maintained during the fabrication of all specimens, to prevent cold joint formation and potential impacts on the structural performance of 3D-printed elements. Figure 6 shows the extraction process of the Z-direction beams from the 14-layer elements.
The beams with threaded vertical reinforcement were printed and tested similarly to the unreinforced specimens, except for the automated insertion of the vertical reinforcement during fabrication. Preliminary experimentation was carried out to select the reinforcement element before conducting the main experiments with the automated insertion device to investigate potential issues such as void creation or deformations in the layers during the insertion process.
Multiple reinforcing elements were tested, including a 40 Grade 10 mm rebar (with both flat and sharpened tips) and threaded screws of different diameters with a sharpened tip or with a flat end. Figure 7 shows a few examples of manually inserted vertical reinforcement elements. The aim was to inspect, compare, and determine the effect of different configurations on void creation and layer deformations of the printed layers, considering the reported issues in previous studies [50,51,52]. The results showed that reinforcement elements with a flat tip resulted in significant voids and deformations in the printed layers, especially in the case of steel fiber-reinforced layers. In terms of reinforcement diameter, it was observed that 6 mm is the maximum size that resulted in minimal void creation and deformation of 3D-printed layers. Larger reinforcement diameters resulted in visible voids and significant layer deformations. Additionally, threaded reinforcement elements were found to create smaller voids when simultaneous rotational and translational movements were applied. The use of threaded reinforcement with a pointed tip reduces void creation compared to flat-end reinforcements. Moreover, it was observed that the manual insertion process created inconsistencies and difficulty in maintaining an upright orientation, leading to an imperfect implementation. These initial findings led to the selection of a threaded, tapered-point 6 mm reinforcement element. Finally, trial experiments were conducted to test the effectiveness of the automated insertion device for placing 6 mm diameter and 150 mm long reinforcement. The automated insertion process resulted in fewer visible voids as expected (Figure 7d) compared to the manual processes using similar reinforcing elements. This observation was further examined by quantitative evaluation of the voids using an X-ray micro-CT scanning technique.
Figure 8 shows the selected reinforcement element based on the preliminary trials: a 304 stainless steel threaded bar with a minimum tensile strength of 500 MPa, 150 mm length, 6 mm diameter, 1 mm thread pitch, with a pointed tip angle of 26.5°.
The 3D-printed beams were designed with the selected 6 mm diameter threaded reinforcement. Design specifications from ACI 318 were considered during the reinforcement design for the 3D-printed beams [53]. This study only considered the placement of the threaded reinforcement for tensile reinforcement purposes when tested in the Z direction. However, shear or additional reinforcement may be added to the beam to improve its strength and ductility, or to meet other specific design requirements which are not within the scope of this study. Figure 9 shows the reinforcement design implemented in this study. The first reinforcement element was inserted after the deposition of the initial six layers, each 25 mm thick, followed by reinforcing elements inserted every four layers. The top 5 mm of the screw was left out to allow for a better connection to the following layers while avoiding conflicts with the nozzle movement during the deposition of the following layers. To avoid collision with the previous reinforcement element, a 5 mm gap between the subsequent reinforcements was designed. An experiment by Marchment and Sanjayan investigated different center- and off-center-lapped lap lengths and concluded that a minimum lap of 20 times the bar diameter was required for a 350 mm long rebar with a diameter of 7 mm [54]. However, another study by the same authors observed that penetrating a 350 mm long rebar can create poor bonding in single penetration due to stiff concrete materials [35]. As such, in the present study, 150 mm was considered as the maximum length of penetration. Park et al. used two different lapping lengths of 20 mm and 40 mm, which is approximately 6 and 13 times of rebar diameter (3 mm), respectively, for 100–300 mm length reinforcement [36]. These studies show that different lapping lengths could be required based on reinforcement characteristics. An effective lapping of 55 mm was implemented in the current study (approx. 8 times the diameter), with the reinforcement placed at least 19 mm from the beam edge—see Figure 10.

2.5.3. Mechanical Properties

To evaluate the mechanical properties of the 3D-printed beams, a flexural strength test was performed using 4-point bending tests following the same testing standard (ASTM C78 and ASTM C1609) as used for mold-cast beams. The beams with vertical threaded reinforcement were tested according to ASTM C1609. These beams were tested in three different loading orientations as shown in Figure 11. During the ASTM C1609 test, two magnetic arm hands were employed at the midspan, as stated before, to securely hold the LVDTs. These arms aim to address the possible cross-sectional variations in the 3D-printed beams compared to the attached mounting fixture.
All 3D printed and mold-cast specimens were covered by a plastic sheet at room temperature for 24 h and then placed inside a lime-saturated water tank (20 ± 2 °C) until the 28-day age.

2.6. CT Scanning of 3D-Printed Specimens

To determine the distribution of voids surrounding the threaded reinforcing elements, X-ray micro-CT scanning was conducted using a SCANCO Medical AG scanner (model µCT 40), manufactured in Basserdorf, Switzerland. The imaging procedure employed a tube voltage of 55 kV and a tube current of 145 µA. The Digital Imaging and Communications (DICOM) data were reconstructed for 3D visualization and analysis using Avizo 2021 version 1 (software developed by Thermo Fisher Scientific). The imaging output was a 16-bit grayscale image map. These images were divided into 3D pixels (or voxels) with a voxel resolution of 36 µm. The percentage void (or porosity) of a sample was calculated by dividing the number of void or pore voxels by the total number of voxels. The binarization image separated the voids from the solid skeleton. To calculate it, the model was first binarized into a map that included voxels with a value of 0 (pore) or 1 (concrete matrix and reinforcement), and thresholding values for these components were investigated from the gray value curve using ImageJ version 1.54i. From the initial grayscale analysis, it was observed that the gray value of voids was below 6000 and the gray value of the cement matrix and threaded reinforcement was above 10,000. Accordingly, a threshold value of 8000 was considered to separate voids from surrounding threaded reinforcement and reinforced cement matrix. Three-dimensional pore structure analysis was performed on each specimen to calculate connected porosity (consisting of effective voids) and total porosity or percentage voids. This analysis aimed to quantify the voids created during the proposed reinforcement insertion process. Figure 12 shows the analysis framework to calculate pores surrounding the reinforcement.
For the CT scan imaging, four fiber-reinforced specimens with threaded reinforcement were prepared. Two of these specimens (CT-F2.5-MC-1 and CT-F2.5-MC-2) were obtained from mold-cast specimens while the other two specimens (CT-F2.5-3DP-1 and CT-F2.5-3DP-2) were extracted from a 6-layer 3D-printed specimen. Results of a previous study by Wang et al. showed better reinforcement-concrete bonding as a result of lower cavities in mold-cast concrete compared to 3D-printed concrete [55]. To evaluate the created voids during the automated reinforcement penetration process, the results were compared to the mold-cast specimens prepared with pre-installed reinforcement. A customized mold was designed, and 3D printed with Acrylonitrile Butadiene Styrene (ABS) polymer measuring 75 mm × 75 mm × 150 mm. The 150 mm threaded reinforcement was placed inside the mold before the fiber-reinforced cementitious material with an average flow value of 182 mm was then poured into the mold and compacted to remove the entrapped air. The two samples were extracted, CT-F2.5-MC-1 from the top 60 mm of the specimen and CT-F2.5-MC-2 from the bottom 60 mm of the specimen. Two other samples were extracted from a 6-layer 3D-printed specimen which incorporated threaded reinforcement inserted using the semi-automated device. Similarly, CT-F2.5-3DP-1 was extracted at a depth of 60 mm from the top, and CT-F2.5-3DP-2 from the bottom layers (Figure 13). Each extracted specimen measured 20 mm × 30 mm × 60 mm. For analysis, a Region of Interest (ROI) of 14 mm × 20 mm × 60 mm was selected with a threaded reinforcement at the center.

3. Results and Discussions

3.1. Characterization Tests: Conventional Mold-Cast Specimens

Table 4 presents information regarding the wet density of the selected mixtures. The average wet density of the mixture with a steel fiber dosage of 2.5% (by volume) was measured as 2397 kg/m3, while the plain mixtures had an average wet density of 2283 kg/m3. These observations highlight that the inclusion of steel fibers in the mixtures resulted in a higher density, which potentially could impact the deformations in 3D-printed elements made of fiber-reinforced materials. For the mold-cast specimens, the same workability range as the printing materials (170–185mm flow range) was targeted to ensure sufficient flowability of the mixtures without any segregation.
The compressive strength values for the two studied mixtures are presented in Table 4. The results revealed that the incorporation of steel fiber at 2.5% by volume helped to reach a compressive strength of 73.3 MPa, while the plain mixture only reached a compressive strength of 48.6 MPa. The fiber-reinforced mixture demonstrated a considerable 51% improvement in compressive strength compared to the control mixture. The inclusion of steel fibers in the mixture, especially at high dosages, evidently helped to distribute internal stresses when the load was applied. As a result, this improved the resistance against crack growth and collectively led to an increase in compressive strength.
The flexural strength of the two mixtures is also presented in Table 4. It was observed that the inclusion of 2.5% steel fibers improved flexural strength by 39% (for the mold-cast specimens). From Table 4, the deflection capacity of the fiber-reinforced beam was observed at 0.886 mm, while the plain beam showed a near-zero deflection capacity due to sudden brittle failure—hence, it is not included in Table 4. Similarly, the toughness value of the fiber-reinforced beam was measured as 38.502 J, while the plain beams revealed a negligible toughness capacity, as anticipated. The inclusion of steel fibers reinforced the tensile zone of the beam, controlled crack growth, and enhanced the ductility of these beams. The special brass coating on the used steel fiber seems to have promoted the interfacial bond strength between the fibers and the surrounding matrix. Hence, it might have contributed to stress transfer between the fiber and the matrix and enhanced the overall strength and integrity of the fiber-reinforced composites.
Next, the plain and fiber-reinforced mold-cast dumbbell-shaped specimens were tested for the uniaxial tensile strength test (UTT). Table 4 shows the first-cracking strength, tensile strength, strain capacity, and toughness of these specimens. The results reveal that the fiber-reinforced specimens outperform the control specimens in terms of first-crack strength and peak strength. Furthermore, a significantly higher strain (0.62%) was observed at peak load for F2.5 specimens, in contrast to the control specimens where the strain capacity was negligible. Control specimens showed a brittle failure upon first cracking. The test results show a considerable 132% improvement in tensile strength as a result of 2.5% steel fiber addition. A total dissipated energy of 4.76 KJ/m2 was also measured for the fiber-reinforced F2.5 specimens. This confirms the superior tensile strength and post-cracking behavior of the fiber-reinforced mixtures compared to the plain control specimens.

3.2. Characterization Tests: 3D-Printed Specimens

3.2.1. Fresh Properties

The printability and shape stability of the two selected mixtures were previously studied by the authors using a 40 mm × 20 mm nozzle [29,30]. In this study, the shape stability of the deposited layers was assessed using a wider 100 mm × 25 mm nozzle, which was designed and used for the fabrication of standard 3D-printed beams. The results in Figure 14 show the bottom layer deformations during the shape stability test for both printing mixtures. It was observed that using the new nozzle (100 mm × 25 mm) with the same printing materials results in improved shape stability and smaller deformations compared to the previous nozzle (40 mm × 20 mm), both in the presence and absence of a high dosage of steel fiber.
This observation is justified by the impact of the nozzle design and the aspect ratio of the printed layers, defined as the ratio of the width to the height of each layer. When using a 100 mm × 25 mm nozzle with an aspect ratio of 4:1, less deformation was observed compared to the smaller nozzle with an aspect ratio of 2:1. Figure 14 shows that the use of the smaller nozzle with the fiber-reinforced material (F2.5) resulted in a considerable 15% bottom layer deformation. The F2.5 mixture has a higher unit weight and different rheological properties due to a greater HRWRA dosage compared to the plain F0 mixture. When printing the highly reinforced F2.5 mixture, a wider nozzle with a higher aspect ratio proved effective in achieving a more uniform load distribution across the horizontal plane, which reduced layer deformations compared to the nozzle with a smaller aspect ratio. It should be mentioned that the addition of steel fibers at a high dosage affects the rheological properties of the mixture and significantly increases its viscosity, resulting in reduced extrudability or nozzle blockage issues. Increasing the superplasticizer dosage increases the flowability of the cementitious matrix of the fiber-reinforced materials necessary to ensure continuous extrudability, which in turn increases the plastic deformations [29,30]. In summary, the observations from this study confirmed the positive impact of the use of a wider nozzle with a higher aspect ratio on the extrudability (preventing nozzle blockage) and shape stability of steel fiber-reinforced 3D-printed concrete.

3.2.2. Mechanical Properties

Flexural strength: The Modulus of Rupture (MOR) of the 3D printed fiber-reinforced and plain beams is presented in Figure 15. For plain 3D-printed beams, the MOR of F0-3DP-X beams was measured as 6.19 MPa, which is 29% and 41% higher than the F0-3DP-Y and F0-3DP-Z beams, respectively. The observed anisotropy in the 3D-printed plain specimens is mainly due to the orientation of the beam and the layer interfaces relative to the loading direction. Compared to the X direction, the observed lower strength values in the Y and Z directions are attributed to the lower bond strength and the weak interfaces aligned vertically in the plane as the loading direction. In contrast, the interfaces of X-direction plain beams are aligned along the length of the layer, with the load acting perpendicular to the interfaces. Overall, the 3D-printed beams underperformed compared to mold-cast F0-MC beams in all cases when no steel fiber was incorporated. The average MOR for the highest-performing 3D-printed beams (F0-3DP-X) was 14% lower than the average MOR of the mold-cast beams (F0-MC). The inferior performance of the 3D-printed plain beams compared to mold-cast beams is attributed to the printing process creating multiple weak bonding interfaces between the layers compared to the monolithic mold-cast specimens. Compared to mold-cast concrete, the lack of vibration in 3D-printed concrete is also likely to contribute to the lower mechanical strength of 3D-printed beams due to a potentially higher porosity in the absence of compaction [56]. Concerning fiber-reinforced beams, the average MOR of the F2.5-3DP-X and F2.5-3DP-Y beams containing steel fibers was 14.67 MPa and 13.37 MPa, respectively, which is 137% and 179% higher than the respective plain printed beams tested in the same directions. The superior performance of the F2.5-3DP-X and F2.5-3DP-Y beams is attributed to the more uniform alignment of the steel fibers in the printing direction [30,57,58,59]. In contrast to the plain beams where samples in the Y direction showed approximately a 29% reduction in strength compared to the X-direction beams, the steel fibers were effective in achieving significantly higher and relatively similar mechanical performance in the X and Y directions (a 9% reduction in the Y direction relative to X). F2.5-3DP-Y beams had strength values comparable with the X-direction printed samples due to the steel fibers’ alignment in the printing direction, which helps transfer the stress across the beam. Interestingly, unlike the plain mixtures, the MOR of the F2.5-3DP-X and F2.5-3DP-Y was higher (46% and 33%, respectively) compared to the mold-cast F2.5-MC beams. This is attributed to the random distribution and orientation of steel fibers in the mold-cast beams resulting in a lower strength than the 3D-printed fiber-reinforced beams in both the X and Y directions [60]. Z-direction beams, on the other hand, exhibited inferior performance compared to both mold-cast beams and 3D-printed beams in X and Y directions. The average MOR of F2.5-3DP-Z beams was 10% lower than plain F0-3DP-Z beams, which was anticipated due to the layered nature of the 3D-printed specimen and the large number of interfaces in the Z-direction beams parallel to the loading direction. The inferior performance of F2.5-3DP-Z beams compared to the other two directions, however, is attributed to the steel fibers being aligned in the direction of printing, without penetration across the layers, leaving the interfaces unreinforced. When these interfaces are tested perpendicular to the direction of loading, the lack of fiber-bridging action leads to a decrease in flexural strength [61]. In the authors’ previous study, for the same mixture, it was observed that the steel fiber orientation number was up to 0.810 (where a value of 1 represents fibers parallel to the printing direction) with an average orientation angle of 37.5°. These findings verified the induced orientation of the fibers (almost parallel to the printing direction) and the absence of fiber in the layer interfaces (i.e., fibers do not cross between the layers) [30].
Considering the inferior performance of the F2.5-3DP-Z beams, vertical threaded reinforcements were investigated to address the unreinforced interface issue and improve the structural performance of 3D-printed beams. As such, three F2.5-3DP-Z-TR beams were designed, and the automated insertion module was used during the printing process to insert the threaded reinforcement elements as previously described (Figure 11). The results presented in Figure 15 show that the average flexural strength of F2.5-3DP-Z-TR beams was 42% higher than that of F2.5-3DP-Z beams. For F2.5-3DP-Z-TR beams, the threaded reinforcement enhanced the interlayer bonding between different layers as well as provided tensile reinforcement in the tensile region of the beam when the loading was applied in the Z direction. The threaded reinforcement in the Z direction prevented the occurrence of cracks and split separation between the layers prior to the peak load [62,63]. By reinforcing the concrete matrix with steel fibers and threaded reinforcement, the load was distributed more evenly through the beam, resulting in an improved overall flexural performance. Despite the improvements, the addition of vertical reinforcing elements to the Z-TR beams did not result in a mechanical performance comparable to the X- and Y-direction fiber-reinforced 3D-printed beams or mold-cast beams—approximately 61% lower flexural strength was measured for F2.5-3DP-Z-TR beams compared to mold-cast beams.
Figure 16 presents the flexural tensile stress versus mid-span deflection curves for the mold-cast and 3D-printed beams in each loading direction. The addition of steel fibers significantly improved the load-carrying capacity and deflection-hardening behavior of the 3D-printed beams after the first crack. Particularly, the post-cracking behavior of the F2.5-3DP-X and F2.5-3DP-Y beams was significantly improved. After the first-cracking load, the curves exhibited a nonlinear behavior and some peak points prior to reaching the ultimate load. Furthermore, beyond the ultimate load, specimens exhibited a ductile deflection softening behavior without sudden failure (i.e., suppressing brittle failure). On the other hand, F2.5-3DP-Z beams exhibited brittle interfacial bond failure upon reaching the peak stress, as illustrated by the total and immediate loss of load-carrying capacity post-peak shown in Figure 16d. This is due to the loading applied parallel to the unreinforced interfaces. Considering the induced fiber alignment, no significant contributions to the flexural performance of 3D-printed beams were achieved in the Z direction and contributed to the shear failure observed in the F2.5-3DP-Z beams. The flexural tensile stress-deflection curves for the beams with threaded reinforcement (F2.5-3DP-Z-TR) are presented in Figure 16e. The beams with threaded reinforcement at the interfaces undergo relatively larger plastic deformations before the ultimate load. After the peak load, a sudden drop in the loading and bond failure between the interlayers was observed. Thereafter, the bridging effect of the vertical reinforcement at the interlayer was visible as the stress gradually started to increase. The lower strength values in the Z direction with threaded reinforcement showed that slippage failure occurred after the peak loading was reached [63]. However, comparing Figure 16d,e reveals a noticeable improvement in the ductility as a result of vertical reinforcement addition, which allows the beams to absorb more energy before complete failure. Furthermore, the immediate post-peak brittle failure observed for the F2.5-3DP-Z beams was suppressed in the F2.5-3DP-Z-TR beams by the bridging effect of the reinforcement, which provides residual strength capacity and is important for structural safety purposes.
Toughness and deflection capacity: The flexural toughness ( T 150 100 ) values of the F2.5 mixtures were determined following ASTM C1609 by calculating the area under the load-deflection curves, and the results are presented in Figure 17. It is observed that the F2.5-3DP-X and F2.5-3DP-Y beams outperformed both the F2.5-3DP-Z and F2.5-MC specimens in this regard. Flexural toughness was found to be 104% and 66% higher in the X and Y directions, respectively, compared to the mold-cast counterparts. Adding steel fibers to the 3D-printed beams significantly improved flexural toughness, thereby increasing their resistance to crack widening and preventing a brittle failure similar to Figure 16d. The induced fiber alignment caused by the extrusion pressure is the main contributing factor in achieving higher flexural toughness. On the other hand, the F2.5-3DP-Z beams showed a premature failure before reaching the 2 mm deflection. The value presented in Figure 17 is evidence that the F2.5-3DP-Z beams exhibited the lowest toughness, emphasizing their inferior performance in terms of toughness. However, the 3D-printed F2.5-3DP-Z-TR beams with threaded reinforcement showed enhanced toughness properties up to 2 mm deflection (306% improvement compared to F2.5-3DP-Z), although the measured toughness value was still 59% lower than that of the F2.5-MC beams. While significant improvements were observed as a result of adding vertical elements, the threaded reinforcement changed the failure behavior of the Z-direction beams. Further reinforcement design optimization and improvement are needed to achieve higher levels of flexural performance. Figure 17b shows the deflection capacity of mold-cast and 3D-printed beam specimens. It is observed that the average deflection capacity of F2.5-3DP-Z-TR beams (1.77 mm) is 99% higher than F2.5-MC beams and 68% higher than F2.5-3DP-Z beams. The presence of threaded reinforcement helped to prevent early cracking and enable more deflection before reaching the limit and improved the deflection capacity of the 3D-printed beams, compared to mold-cast and 3D-printed beams without threaded reinforcement. Based on the results, although threaded reinforcement did not significantly increase the flexural strength, the impact on the ductility was relatively significant and the proposed approach (with further optimization) seems to hold great potential in addressing the brittle behavior of 3D-printed beams in the Z direction.
Crack patterns: In Figure 18, the failure patterns of the mold-cast and printed specimens are presented. F0-3DP-X, F0-3DP-Y, and F0-MC (beams without steel fibers) exhibited brittle or complete failure in flexure when the load reached the peak value and the load-bearing capacity immediately dropped to zero. Additionally, the F2.5-3DP-X, F2.5-3DP-Y, and F2.5-MC beams (with steel fibers) showed a crack-bridging behavior and exhibited a nonlinear behavior in flexure that allows them to resist further load after reaching the peak value [64]. In contrast, F0-3DP-Z and F2.5-3DP-Z beams (Z-direction beams, in general) showed shear failure (or bond failure) as the dominant failure mode. This was because the load was applied parallel to the interface of the beam, causing shear failure and splitting at the layer interfaces. Both mold-cast and 3D-printed beams tested in different orientations showed a single crack in the plane of failure. The only exception to this was observed for the F2.5-3DP-Z-TR beams with threaded reinforcement, which confirms the positive impact of the added reinforcement on the structural performance of 3D-printed beams. Slippage failure was recognized as the main factor for the failure of the F2.5-3DP-Z-TR beams, rather than reinforcement yielding. Other than the required development length of reinforcement, another potential contributing factor regarding the slippage failure is a weaker bonding between stainless steel reinforcement and concrete that was used in this study, compared to the traditional carbon steel reinforcement [65].

3.3. CT Scanning of 3D-Printed Specimens

From the reconstructed 3D images, the total and connected porosity or percent voids surrounding the reinforcement area were calculated—see Figure 19. The results indicate that the total porosity of the mold-cast CT-MC-TR-1 (top) and CT-MC-TR-2 (bottom) specimens were 7.94% and 7.12%, respectively, while the porosity of the 3D-printed CT-3DP-TR-1 (top) and 3DP-TR-2 (bottom) specimens was 6.30% and 4.36%, respectively. These data suggest that the insertion process of threaded reinforcement via the automated device in 3D-printed specimens resulted in a comparable (or even slightly lower) overall porosity in the vicinity of the threaded reinforcement. The acceptable porosity levels in the 3D-printed specimens can mainly be attributed to the adopted insertion process and the screwing mechanism which involves both rotational and translational movements. The mold-cast CT-MC-TR-1 and CT-MC-TR-2 specimens had very similar total porosity values and no difference was observed between the top and bottom sections of the threaded reinforcement. It should be noted that the flowability range of 170–185 mm of the mixtures to prepare mold-cast specimens was the same as for the 3D-printable mixture, despite vibration being provided on mold-cast specimens during preparation. The porosity of CT-3DP-TR-1 and CT-3DP-TR-2 specimens were extracted from different locations of a 6-layer specimen printed having a varying layer deposition time. The results show that as the depth of the penetrated screw increased, a lower porosity was observed near the threaded reinforcement in the printed specimen. This observation implies the importance of reinforcement insertion time relative to the setting time of 3D-printed concrete, and its likely influence on the resulting cavities around the reinforcement, which is more critical for longer reinforcement elements and faster-setting printing materials. Connected porosity, or interconnected voids (capillary channels) within the hardened matrix surrounding the reinforcement area, was also presented in Figure 19. The results showed that the connected porosity was 4.06% and 1.38% for the 3DP-TR-1 and 3DP-TR-2 specimens, respectively. This indicates that lower connected voids were created during the insertion process compared to the mold-cast specimens, similar to the total porosity, which showed both higher total and connected porosity.
To determine the porosity due to the use of the threaded reinforcement, 2D pore structure analysis was performed on 11 CT slices uniformly spaced 5 mm along the Z axis of all specimens concerning the original 150 mm reinforcement (Figure 20). The proportion of pore area to the entire CT image area indicates the specimens’ 2D porosity. The 2D porosity changes little along with the depth of the threaded portion of the reinforcement for CT-MC-TR-1 and CT-3DP-TR-1 specimens. But at the middle portion of the threaded reinforcement for mold-cast specimens, higher porosity was observed. The 2D porosity of CT-3DP-TR-2 specimens presented a slightly higher porosity at the tip area. Overall, the areas near the threaded segment (TR-1) had higher porosity levels than those near the tip area (TR-2). This can be attributed to the tip region making initial cutting contact with less disturbance to the steel fiber-reinforced matrix, while the rotation of the threaded portion creates more area of disturbance within the matrix, which was amplified by the discrete short fibers. Visible voids were observed at the top of the threaded reinforcement during the manual insertion of the reinforcement as discussed in the previous section; the screwing mechanism developed using an automated device gradually decreased the voids in the top portion of the threaded reinforcement.
Figure 21 shows the voids in the threaded and tip area for the CT-3DP-TR-2 specimen. From the threaded portion, voids were observed on only two sides of the threaded reinforcement. This was due to the rotational force applied to the threaded reinforcement, which allowed the threaded reinforcement to rotate around its longitudinal axis. The rotational movement of the thread reinforcement generates a torque that engages tightly with the surrounding fresh material containing steel fibers. Axial forces were developed between the threads and the material, perpendicular to the reinforcement’s axis, and forces applied through rotations break the locking mechanisms on the two sides which created voids in the threaded portion of the reinforcement. In addition, with the increase in depth, a steeper tip allowed the reinforcement to produce more force for a given torque, which created voids in the tip area. Moreover, the tip of the reinforcement penetrated the lower layers with stiffer material compared to the last few layers at the top that were more recently deposited, justifying the presence of more voids in the tip area.
Technical and Economic Feasibility: The short vertical reinforcements utilized in this study were inserted using a semi-automated process, where the reinforcement placement was controlled with a toggle switch. Therefore, this approach has the potential for full automation by adding a continuous reinforcement feeding system. In consequence, an optimal toolpath for reinforcement insertion in predetermined locations of the freshly printed layers is required in addition to the toolpath generated for the layer-by-layer deposition process. Hence, the machine codes for the layerwise construction process will include optimal and sequential g-codes for both processes. Printing parameters such as traverse speed should be also carefully selected considering the impact of the reinforcement insertion process on the overall printing duration. Material design considerations also become critical to maximize the printing window of the printing material so that potential issues and defects such as cold joints can be avoided. Our preliminary testing using various steel reinforcement types shows the feasibility of automated rebar insertion with minimal void creation. The proposed dual reinforcement approach has the potential to improve the cost-effectiveness of 3D printed structures by increasing the construction speed and automation level.

4. Conclusions

Two complementary reinforcement techniques for C3DP were investigated in this study, namely, steel fiber reinforcement at a high dosage (2.5% by volume) and automated threaded reinforcement insertion. The following are the main findings of this study:
  • The compressive strength, flexural strength, and uniaxial tensile strength of steel fiber-reinforced specimens outperformed the control plain mold-cast specimens.
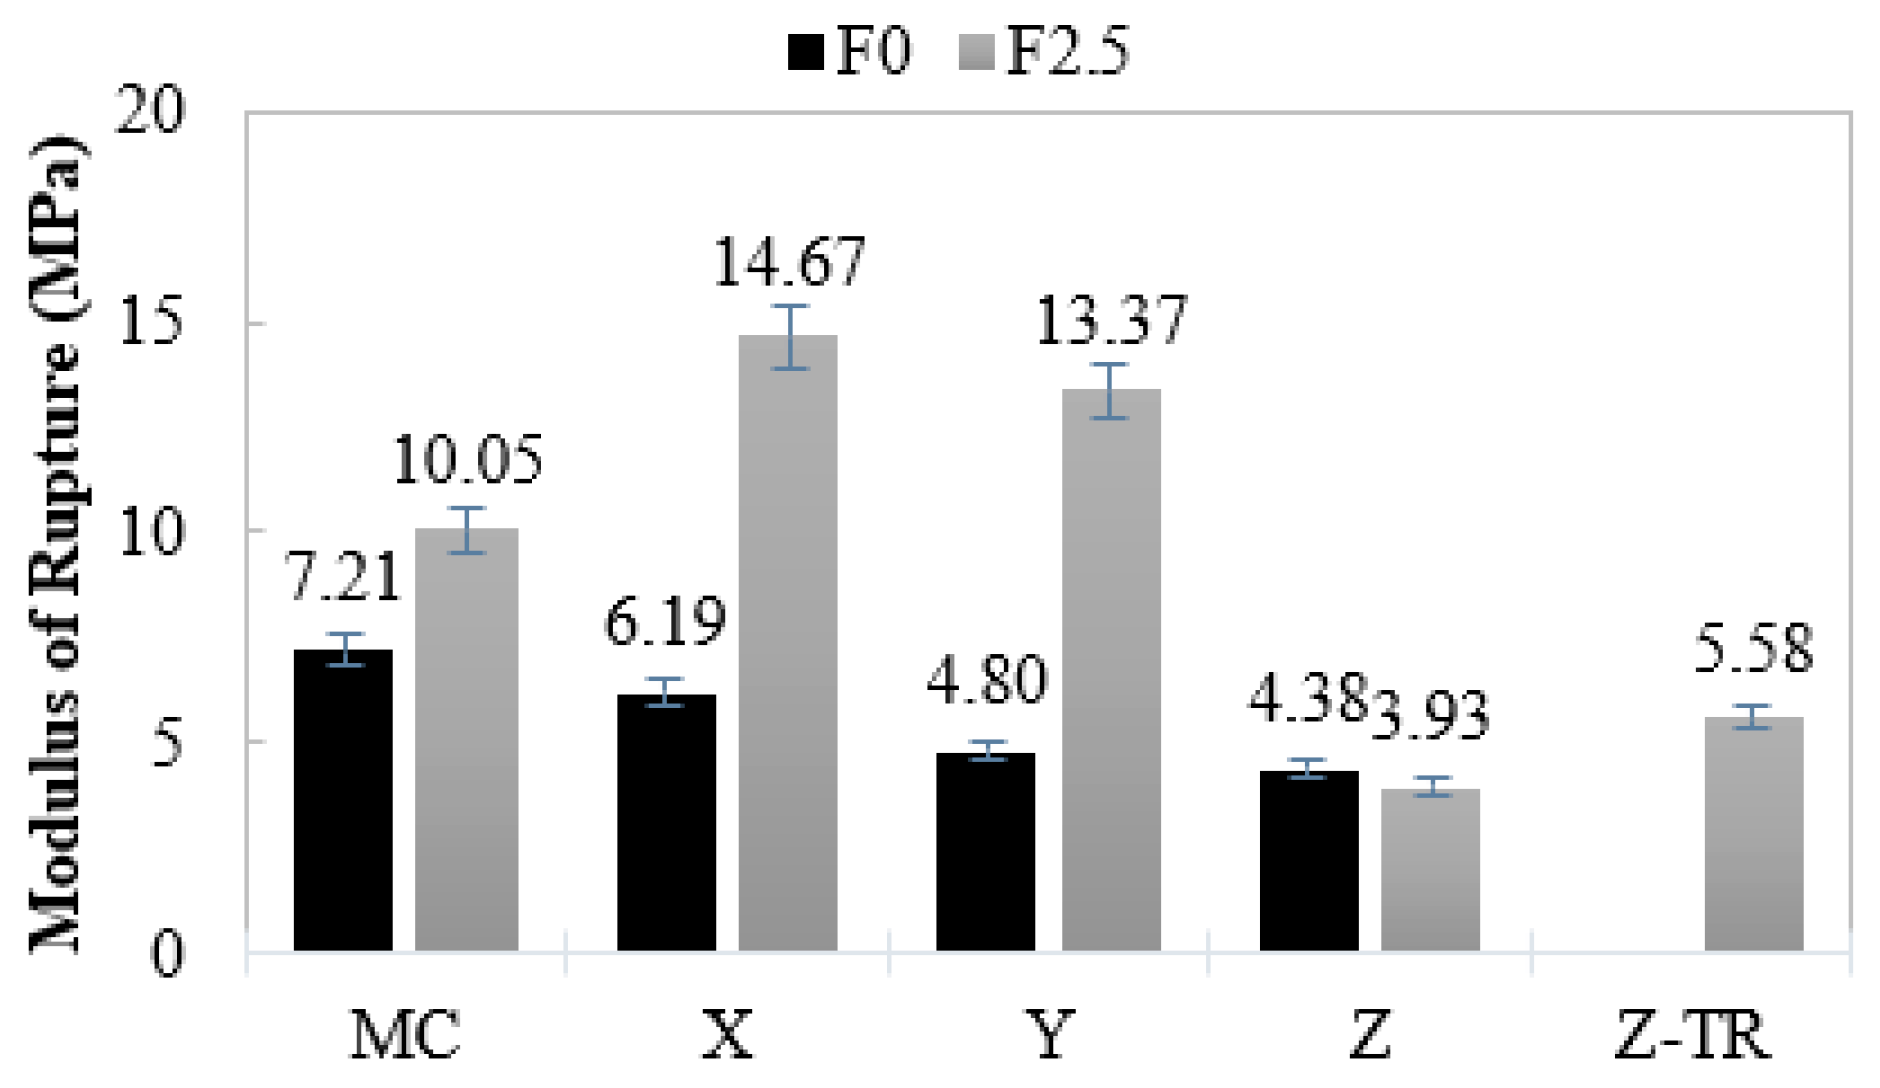
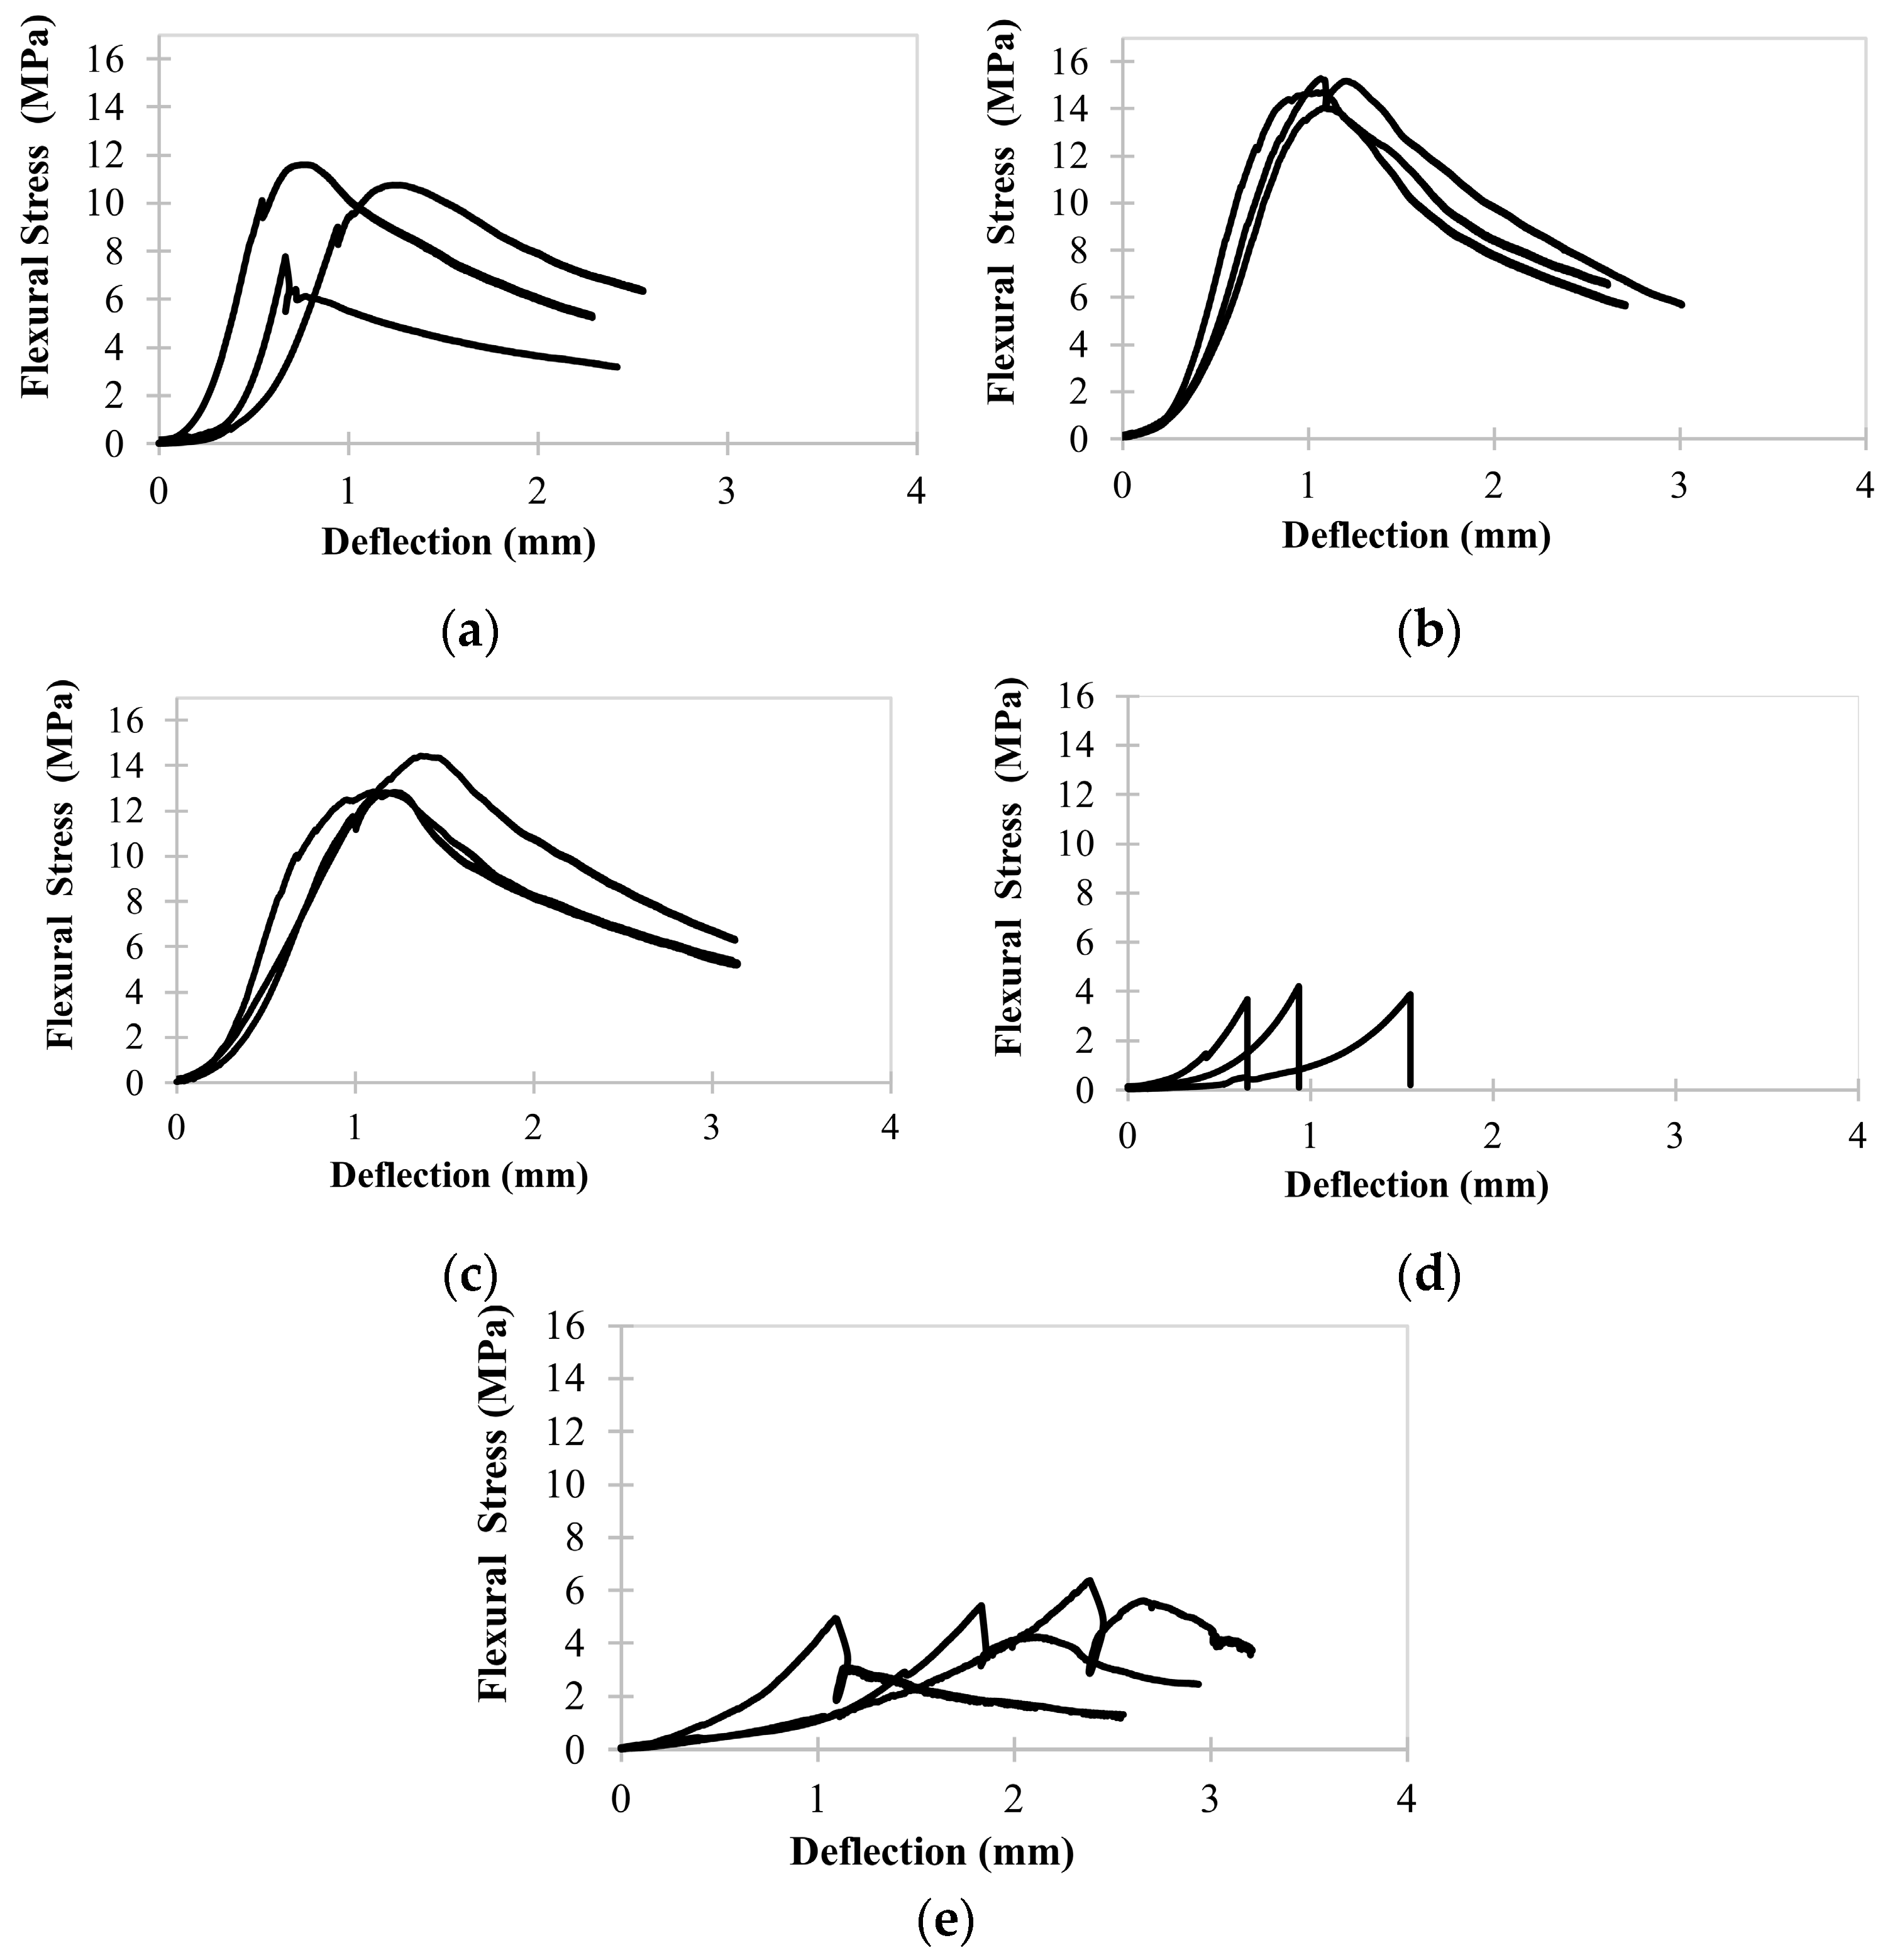
  • Plain 3D-printed beams exhibited anisotropic behavior and lower flexural strength relative to the mold-cast plain beams. The addition of steel fibers at 2.5 vol.% significantly improved the flexural strength in the X and Y directions, surpassing that of both plain and fiber-reinforced mold-cast beams. The improved performance in these directions is attributed to the high steel fiber dosage and the extrusion-induced fiber alignment in the longitudinal (printing) direction.
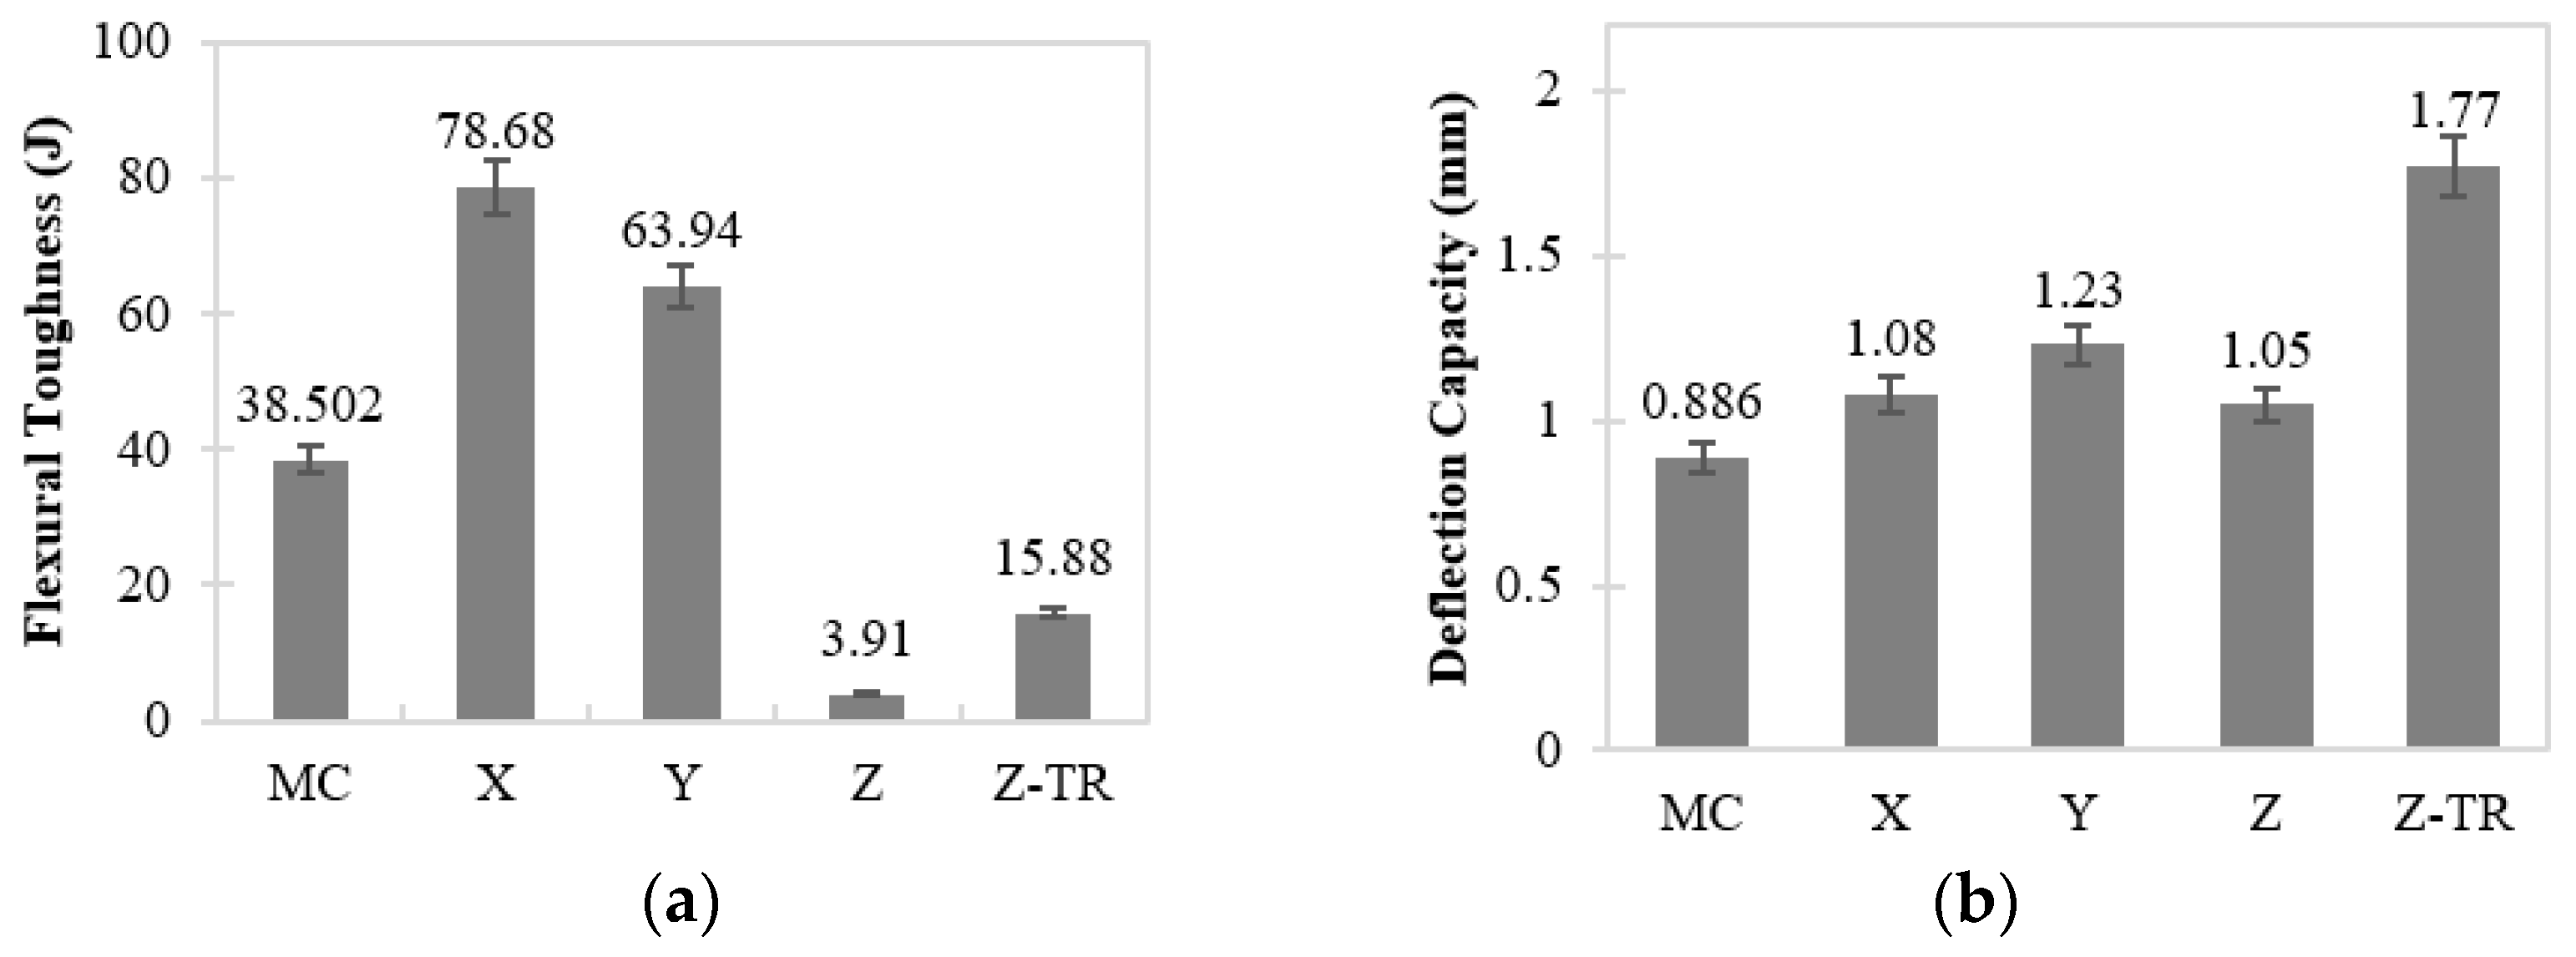
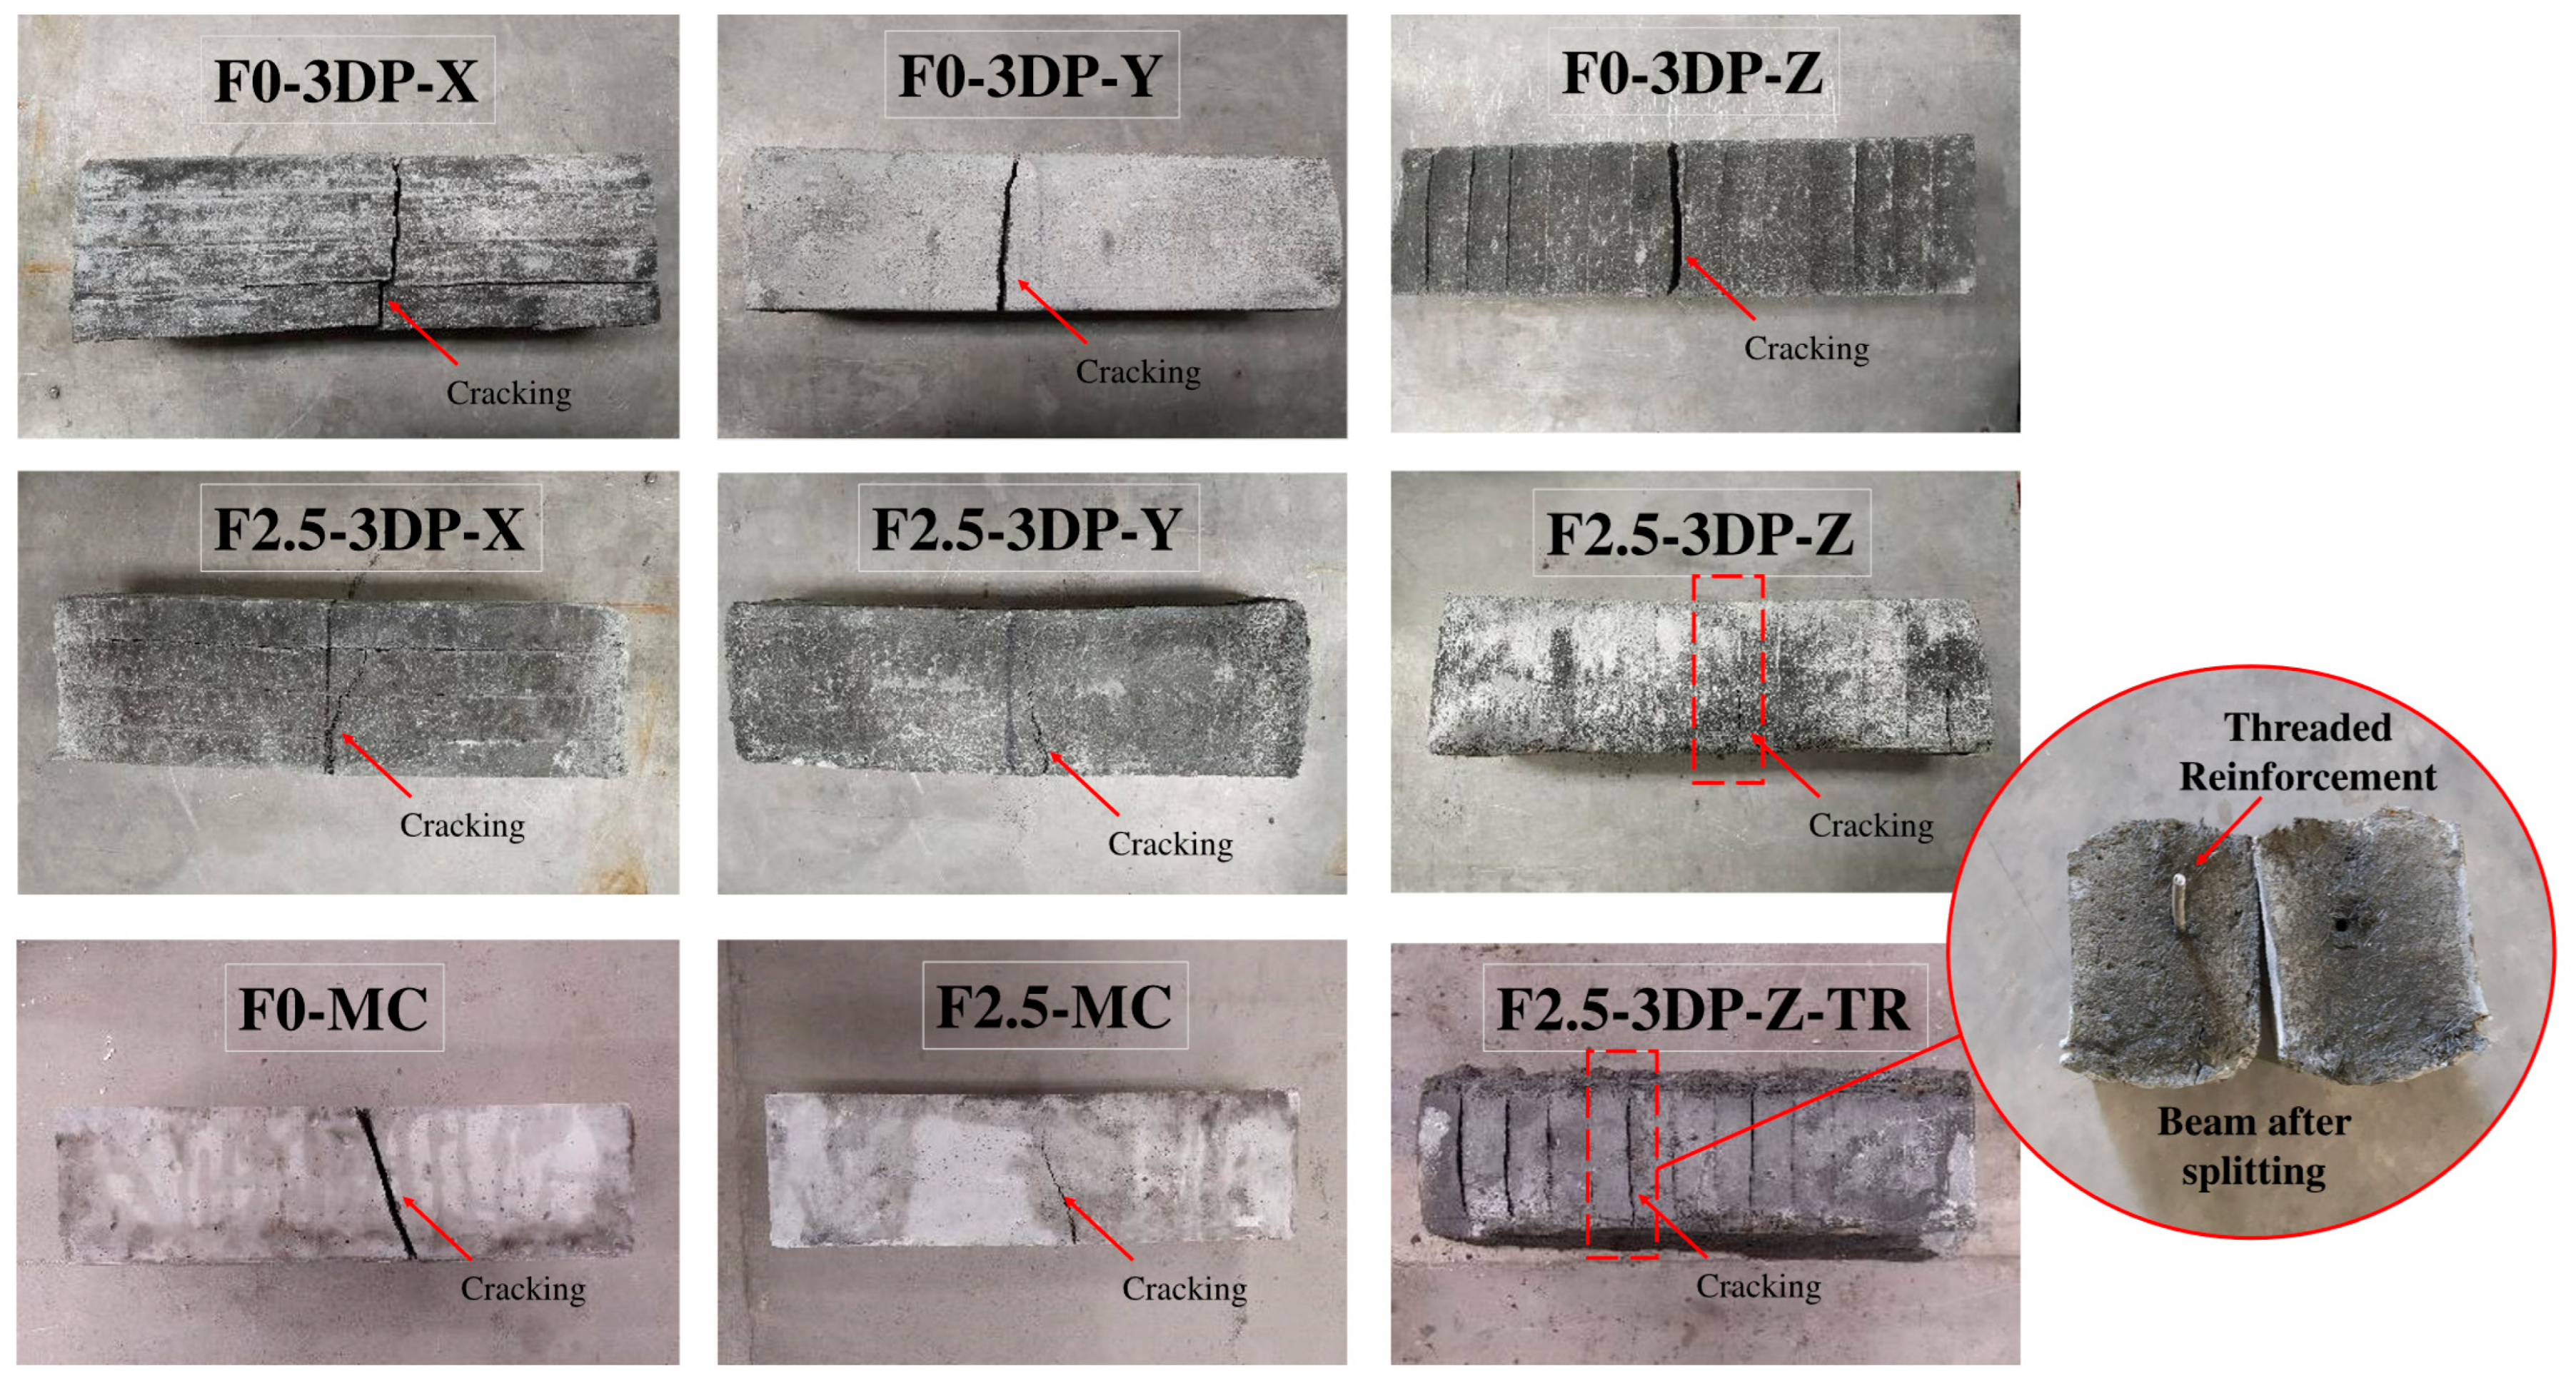
  • Anisotropic behavior was also observed in printed fiber-reinforced beams; particularly, the Z-direction beams exhibited poor flexural performance due to the presence of unreinforced interfaces. Interestingly, 3D-printed fiber-reinforced beams tested both in the X and Y directions outperformed fiber-reinforced mold-cast beams in terms of flexural strength and toughness and exhibited superior post-cracking behavior. On the other hand, fiber-reinforced beams tested in the Z direction produced lower flexural strength and toughness relative to mold-cast beams and displayed brittle shear failure at the interface.
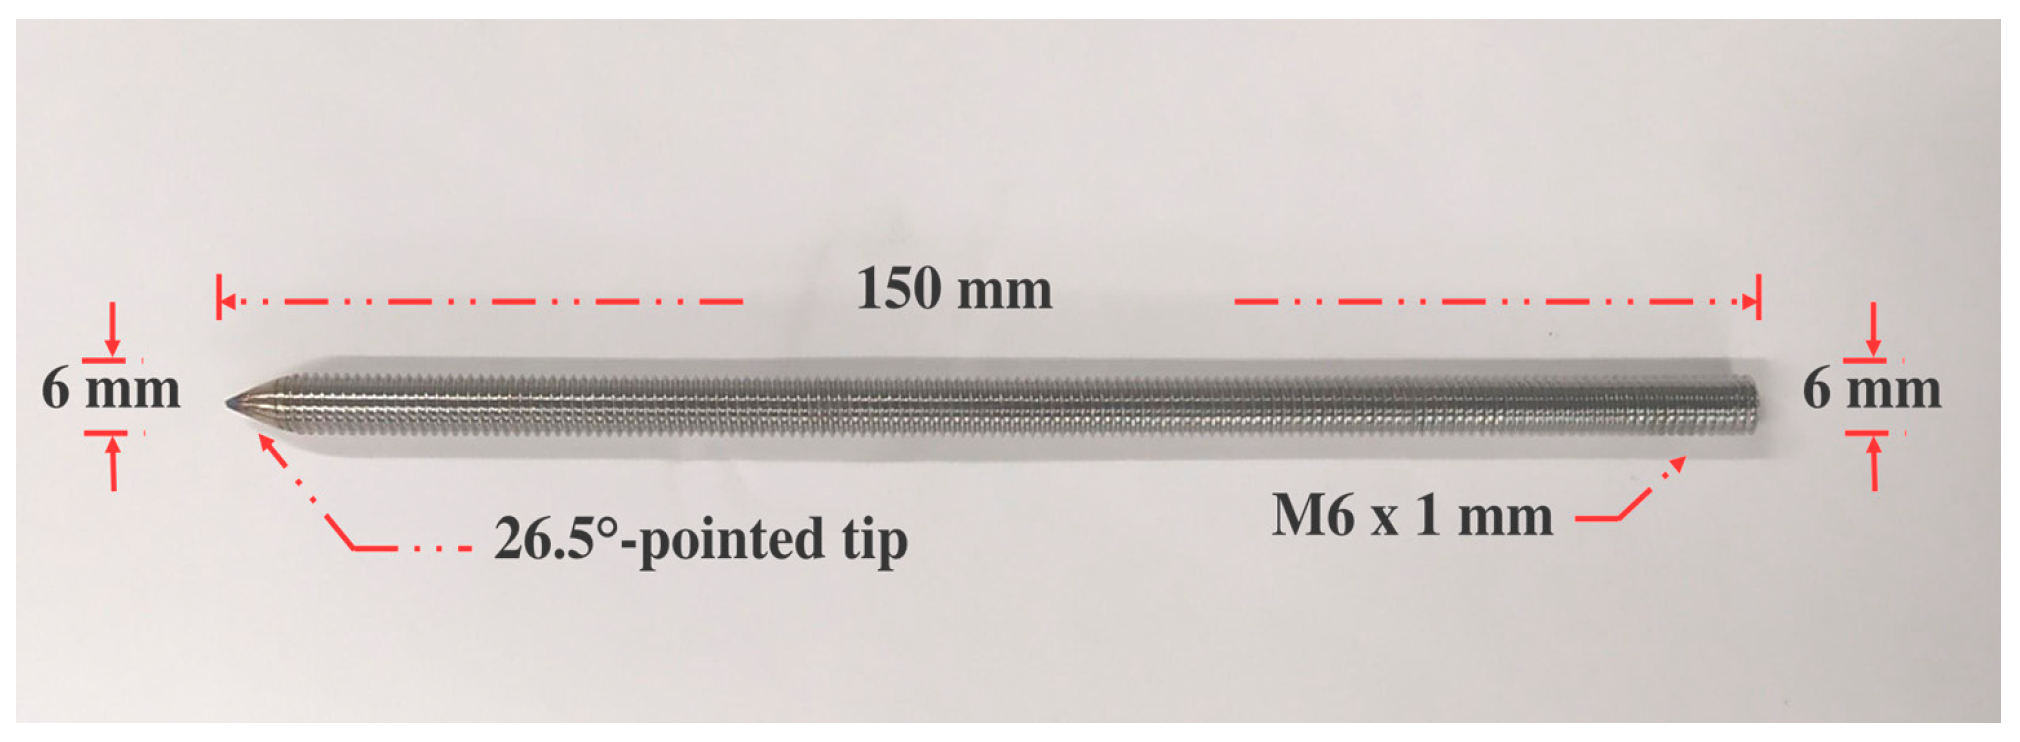
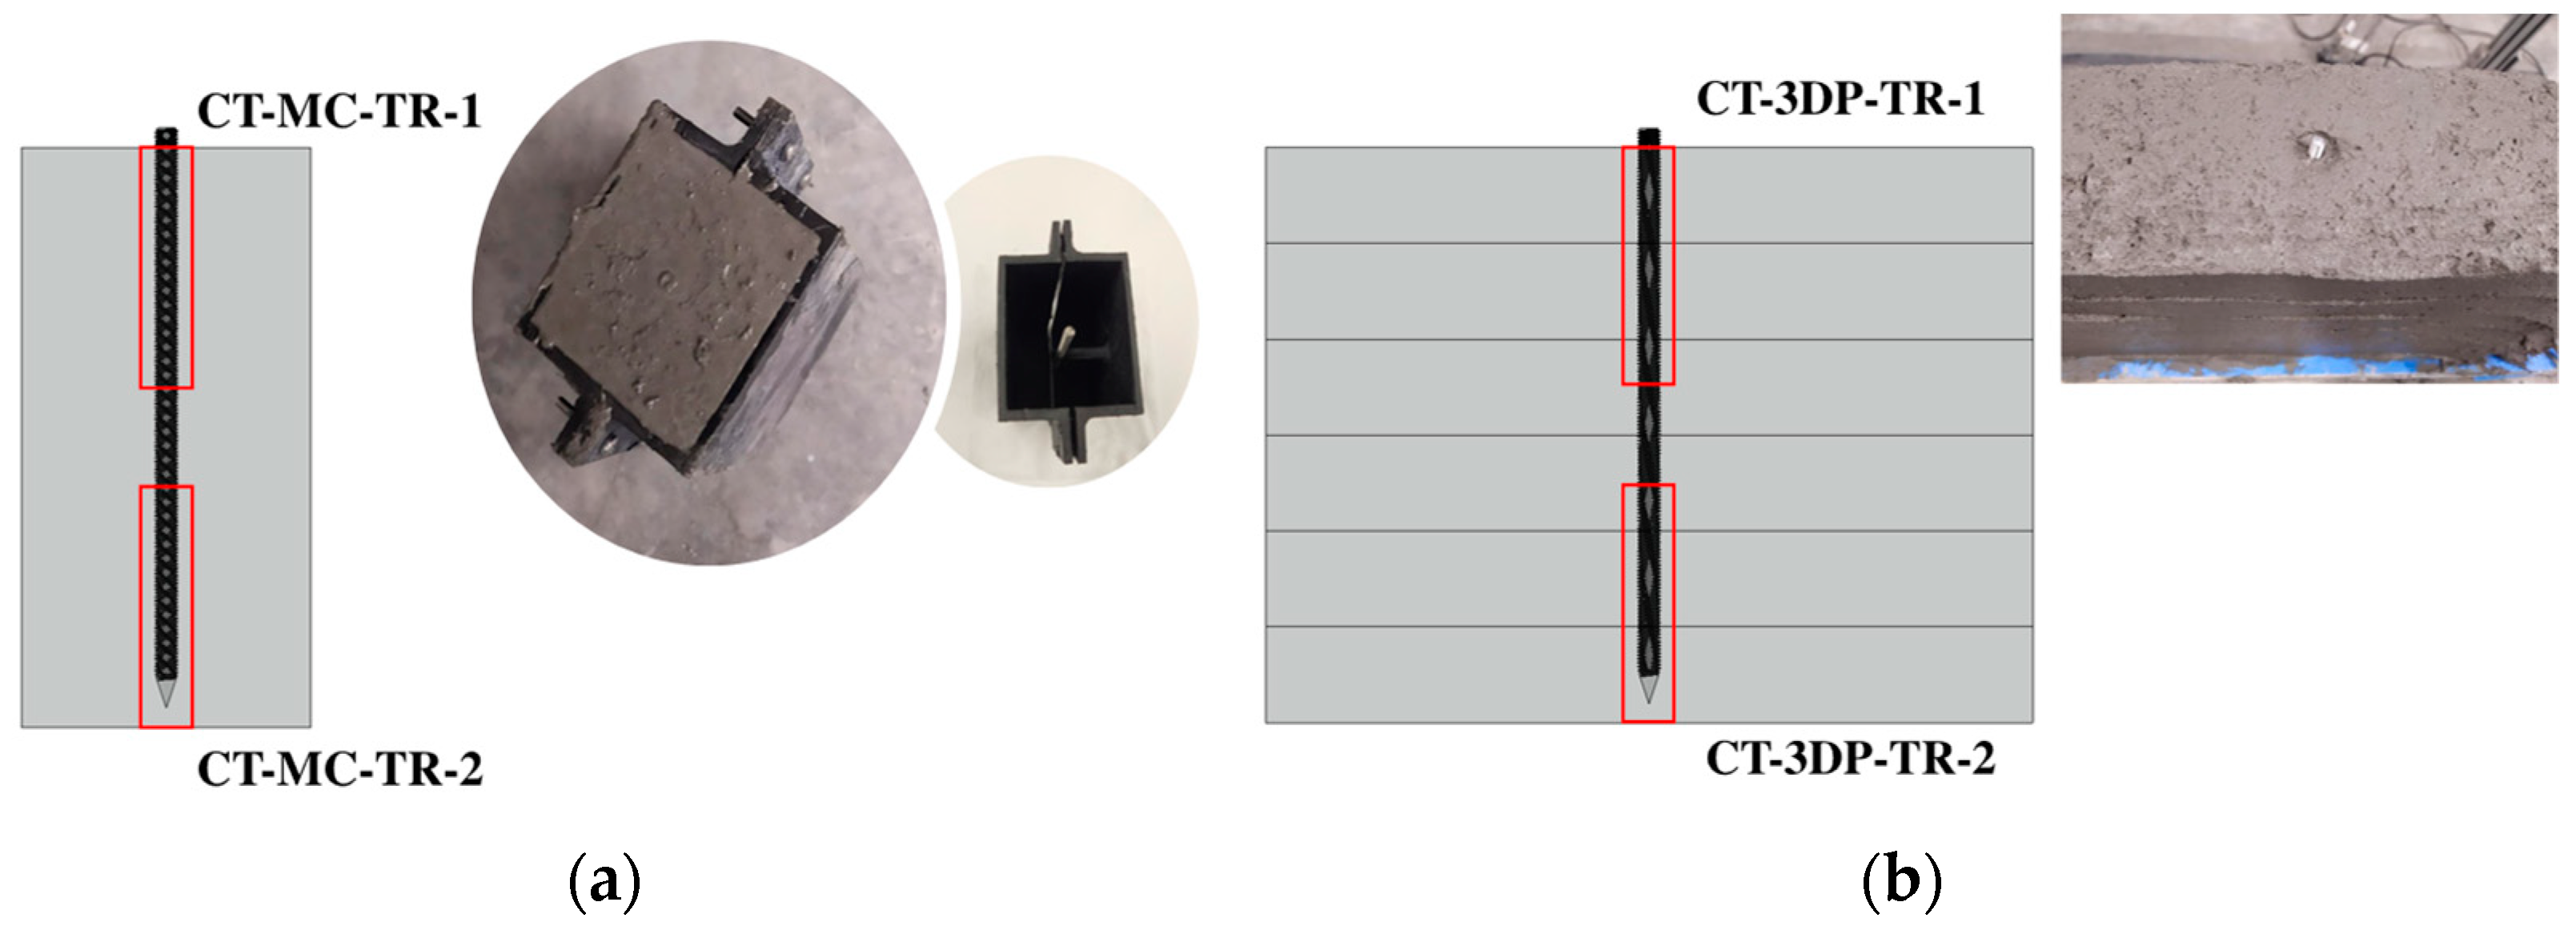
  • Adding threaded reinforcement improved the flexural strength of the 3D-printed specimens in the Z direction to some extent; however, this was not comparable to the strength levels of the X- and Y-direction beams. Furthermore, the incorporation of threaded reinforcement substantially enhanced ductility (i.e., increased deflection capacity by 99% compared to mold-cast beams), thus eliminating the brittle failure mechanism of the Z-direction beams. Overall, threaded reinforcement reduced negative effects induced by the printing process.
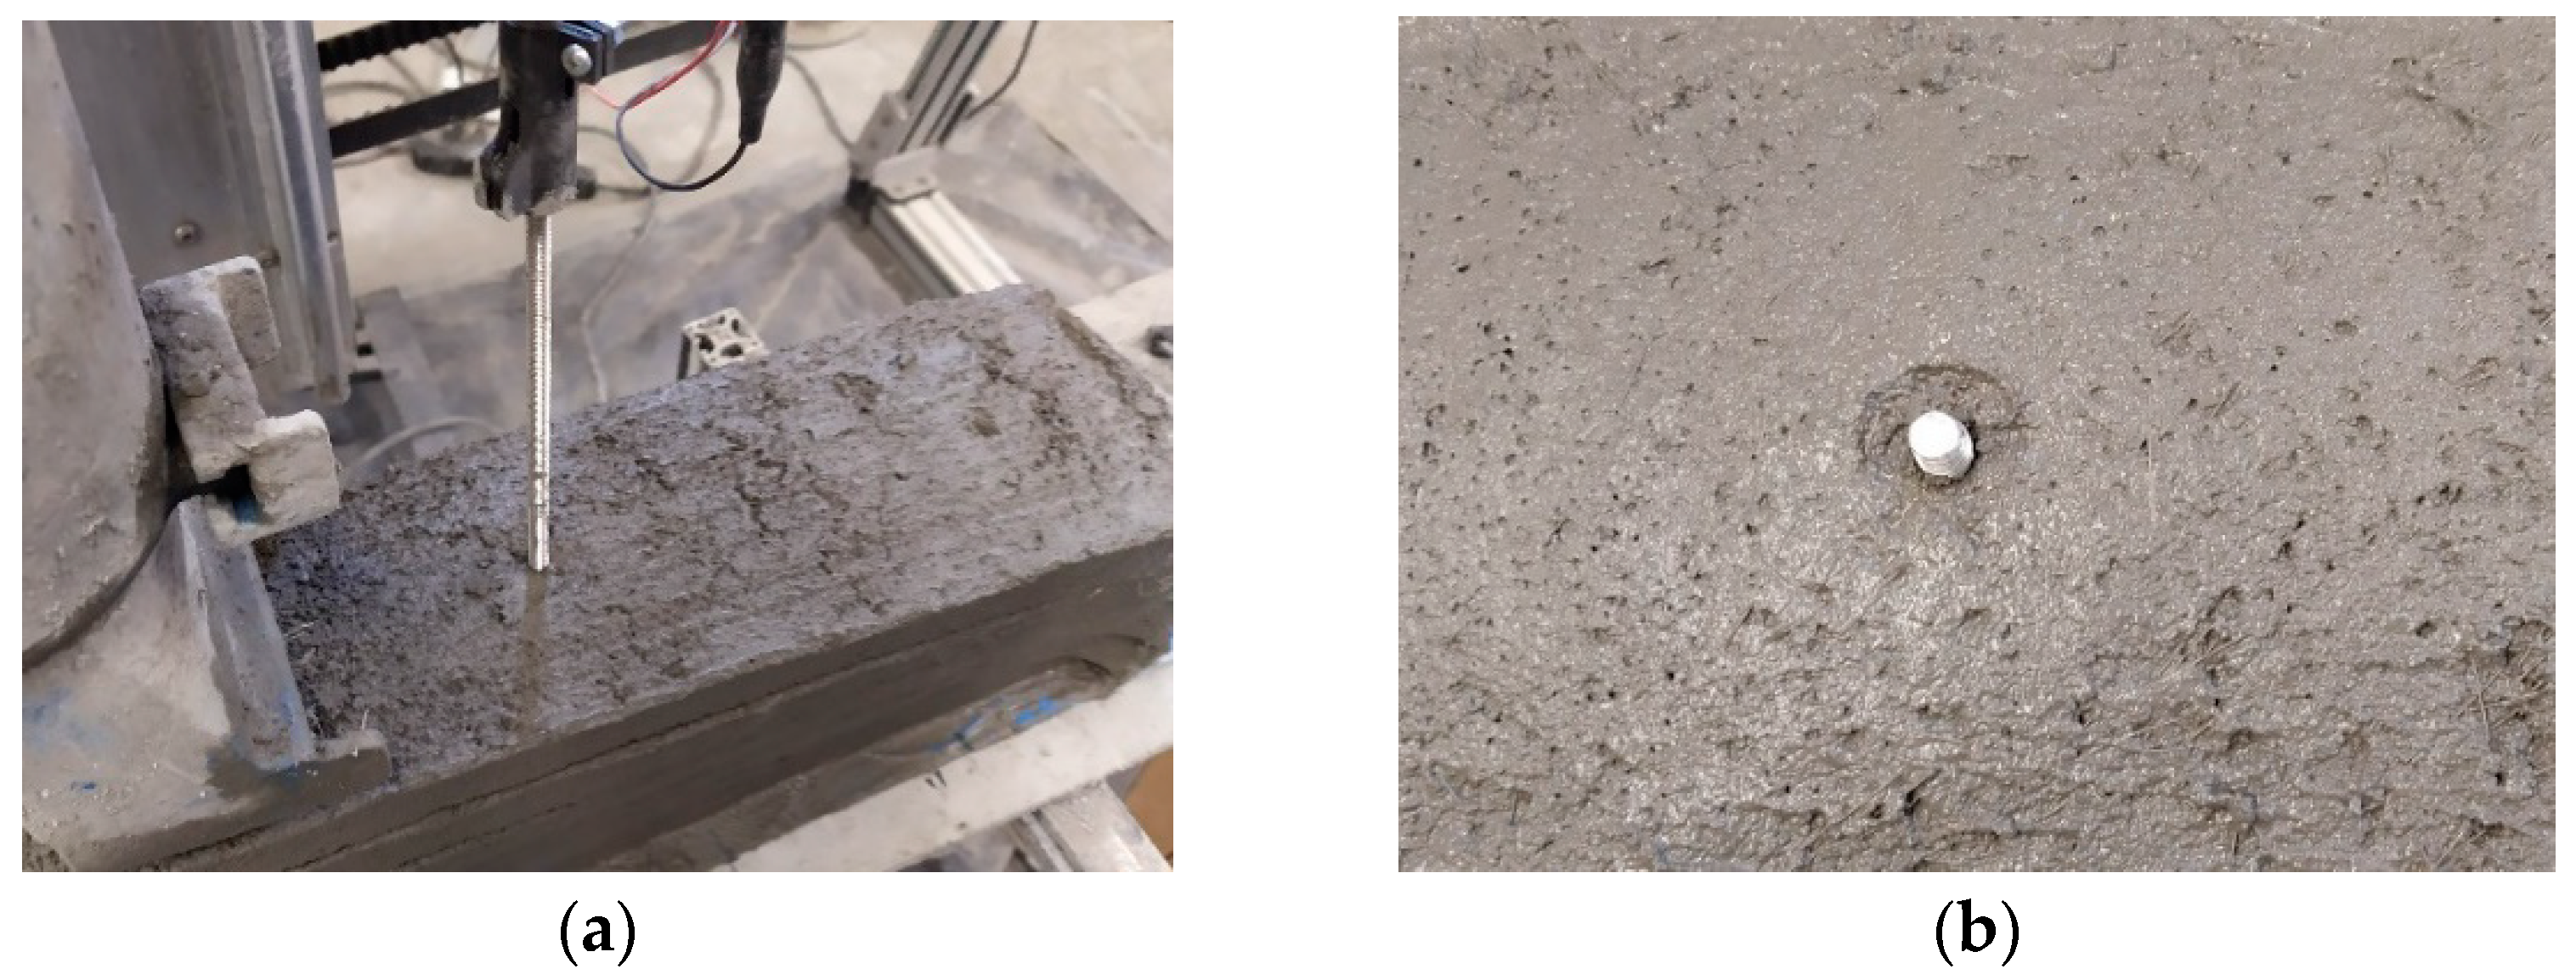
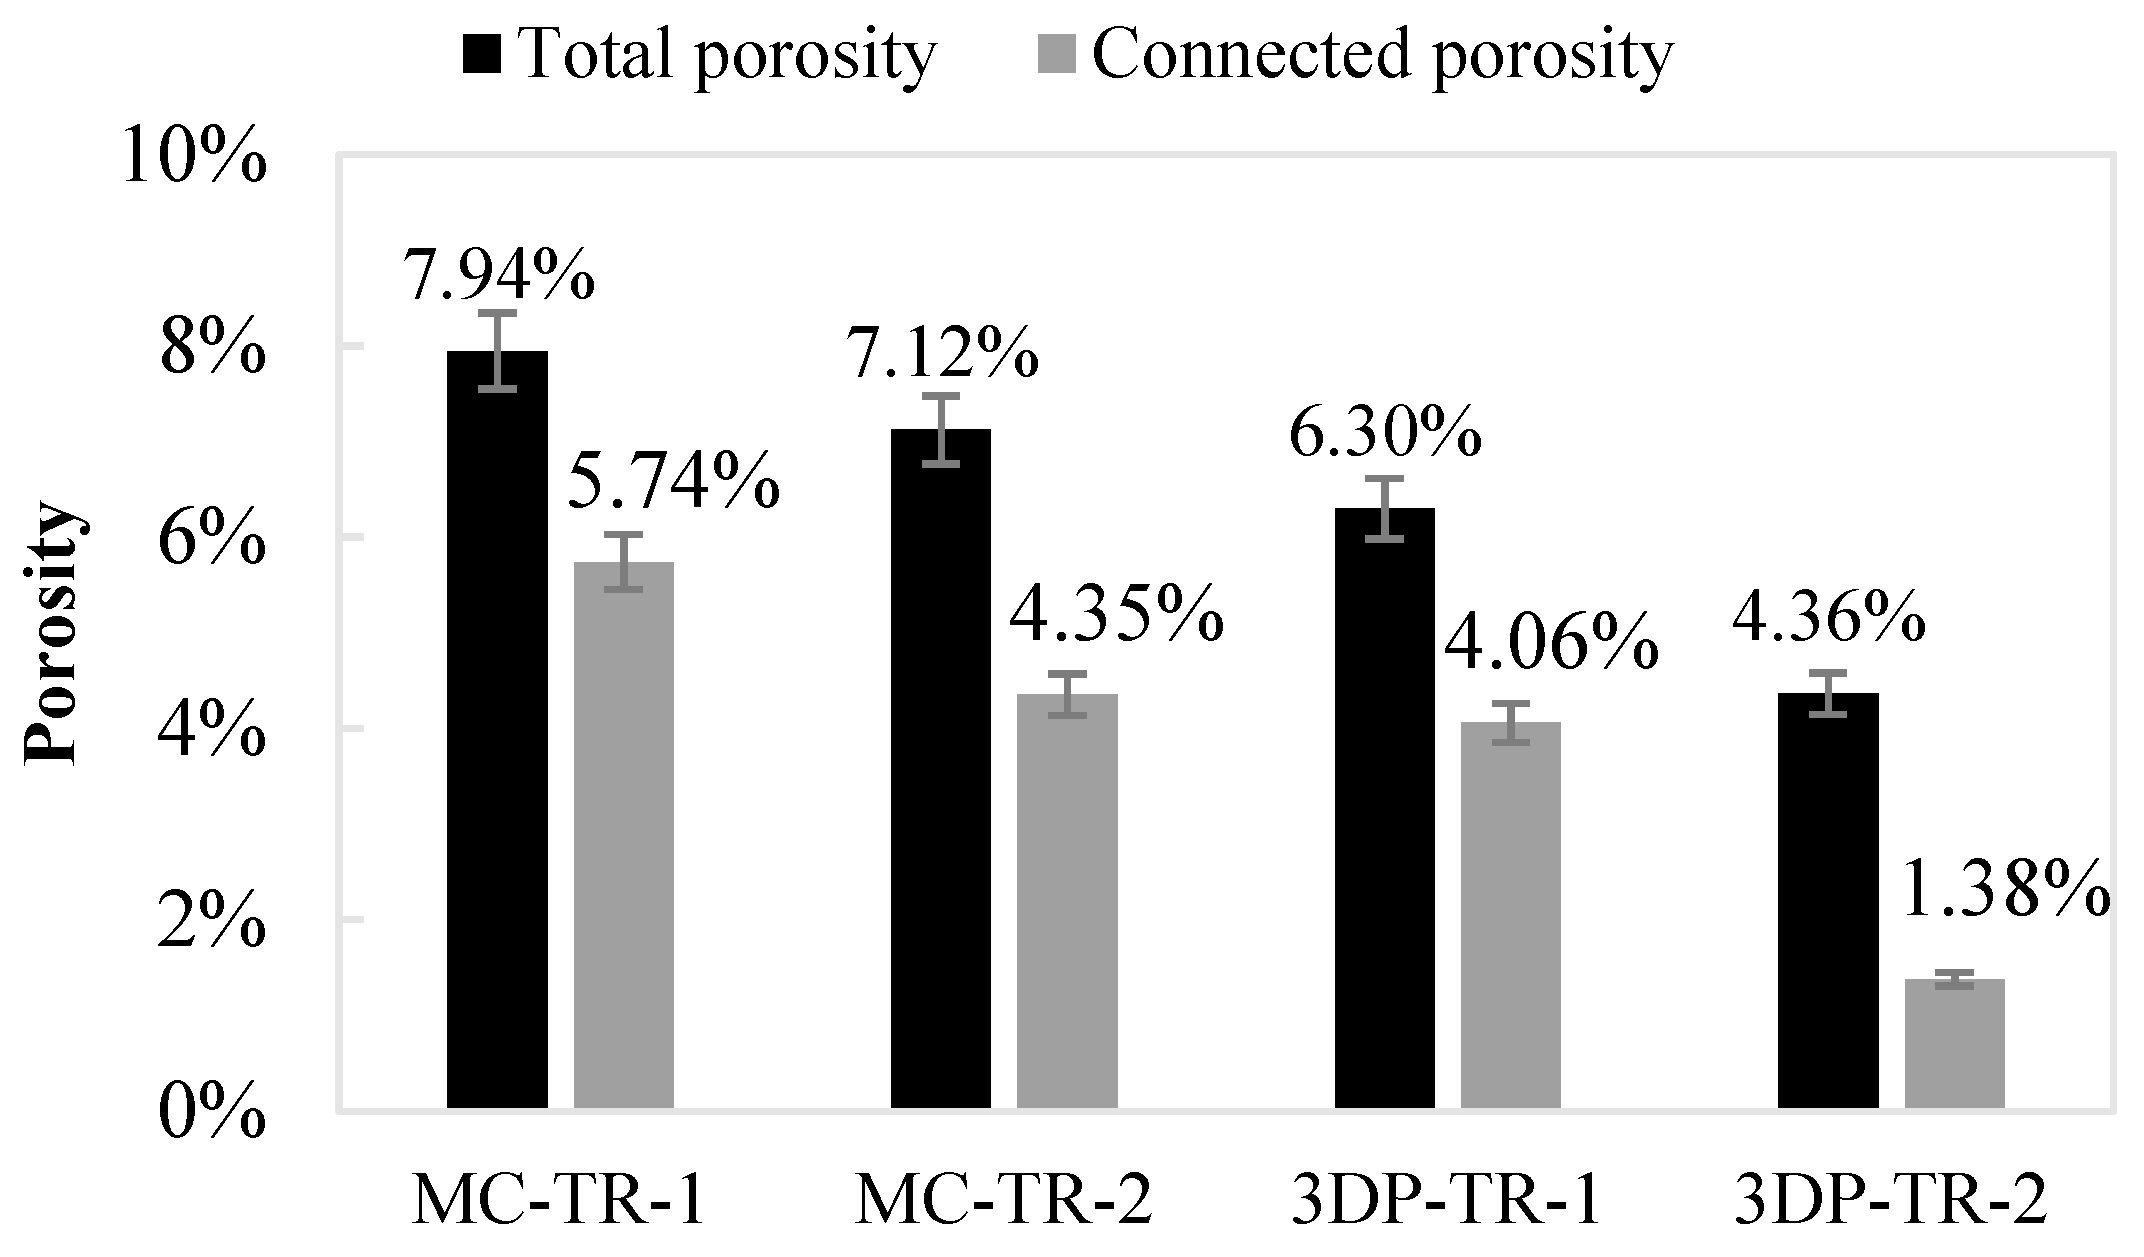
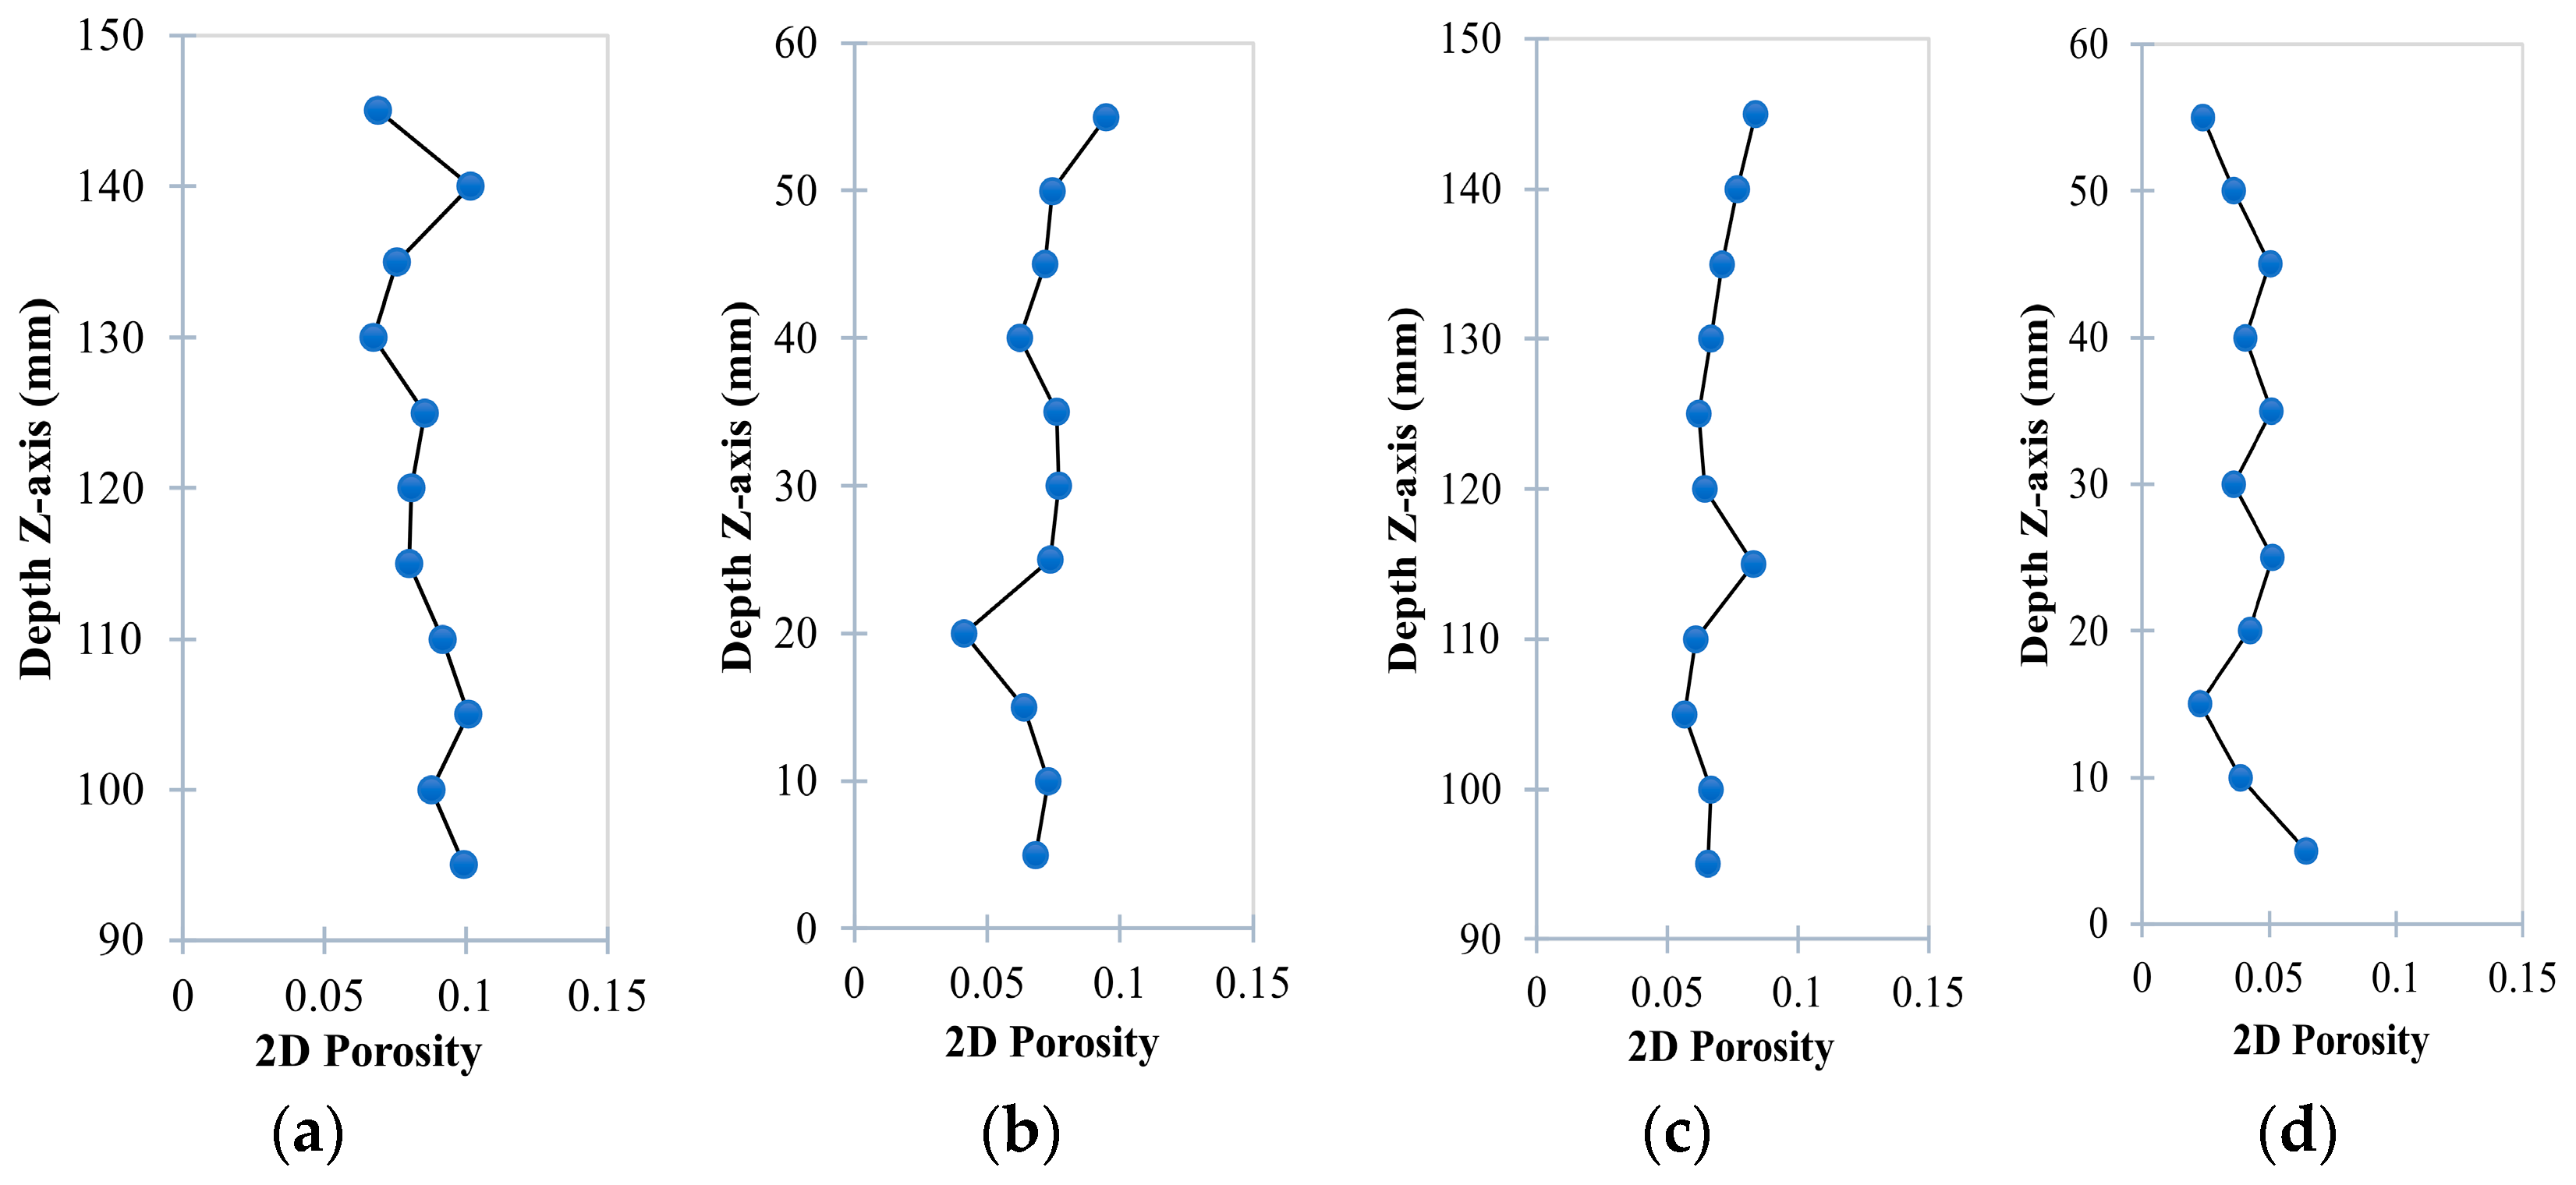
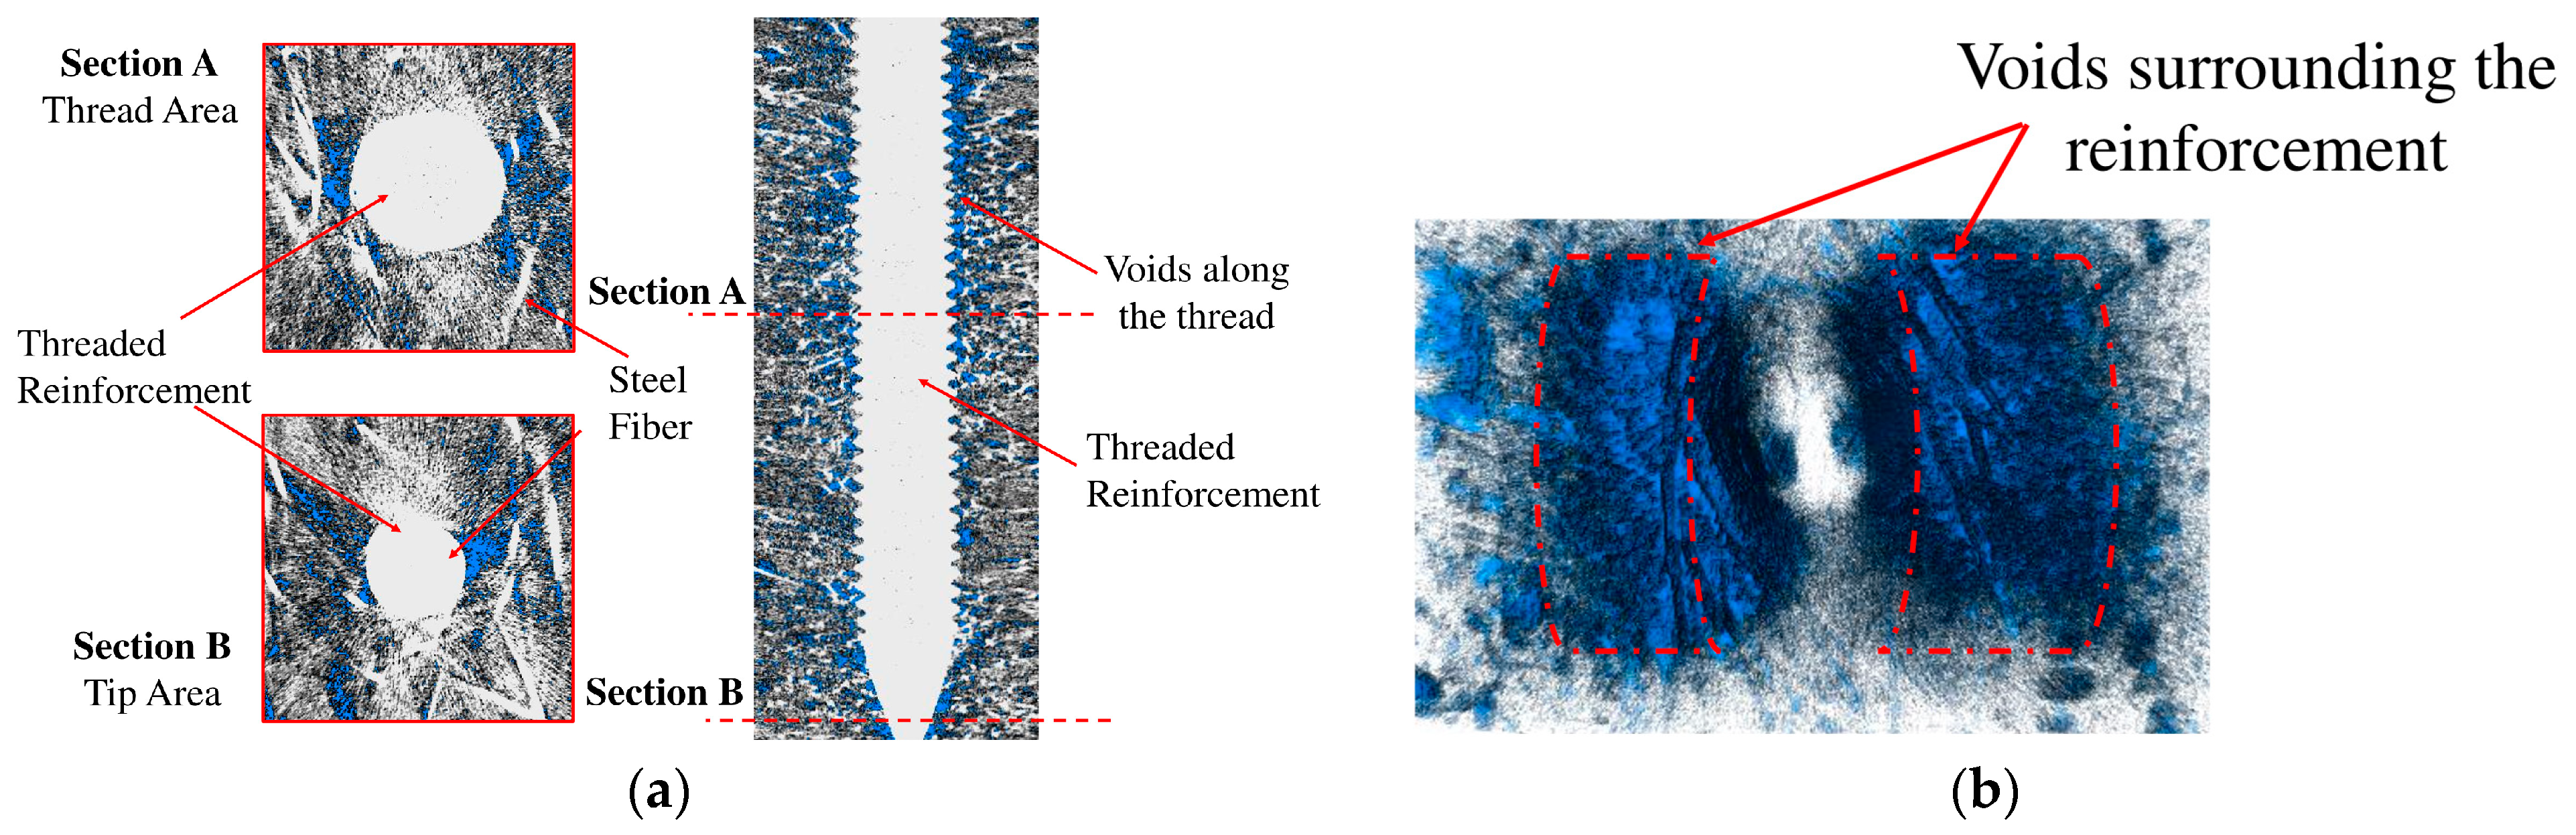
  • X-ray CT scans of 3D-printed and mold-cast fiber-reinforced specimens with threaded reinforcement show that the proposed reinforcement insertion process (simultaneous rotation and translation of the threaded reinforcement element) does not lead to a higher porosity or the creation of additional voids in the 3D-printed element.
Overall, the proposed dual-reinforcement technique has great potential to improve the strength and post-cracking properties of 3D-printed specimens. One limitation of the study lies in its narrow focus on the mechanical performance of only one type of short vertical reinforcement, despite initially testing various reinforcements. Additionally, the study lacks extensive exploration of the impact of the reinforcement diameter, length, and lapping techniques on the structural performance. Future research should also consider these gaps by investigating a broader range of reinforcement materials and design configurations. Pull-out tests should also be conducted to evaluate the bond behavior between the discrete reinforcement and matrix.

Author Contributions

Conceptualization, H.A. and A.K.; methodology, H.A. and A.K.; formal analysis, H.A.; investigation, H.A. and I.G.; writing—original draft preparation, H.A.; writing—review and editing, H.A., I.G., D.G., G.A., H.N., M.H. and A.K.; visualization, H.A.; supervision, A.K.; project administration, A.K.; funding acquisition, A.K. All authors have read and agreed to the published version of the manuscript.

Funding

This research was funded by the Transportation Consortium of South-Central States (TranSET) university transportation center—US Department of Transportation—through project 21CLSU01.

Data Availability Statement

The data that support the findings of this study are included in the paper. Further inquiries can be directed to the corresponding author.

Acknowledgments

The authors express their gratitude for the support provided by the Louisiana Transportation Research Center (LTRC).

Conflicts of Interest

The authors declare no conflicts of interest. The funders had no role in the design of the study; in the collection, analyses, or interpretation of data; in the writing of the manuscript; or in the decision to publish the results.

References

  1. Seyrfar, A.; Ataei, H.; Osman, I. Robotics and Automation in Construction (RAC): Priorities and Barriers toward Productivity Improvement in Civil Infrastructure Projects. In Automation and Robotics in the Architecture, Engineering, and Construction Industry; Springer: Cham, Swizerland, 2022; pp. 59–71. [Google Scholar] [CrossRef]
  2. García de Soto, B.; Agustí-Juan, I.; Joss, S.; Hunhevicz, J. Implications of Construction 4.0 to the workforce and organizational structures. Int. J. Constr. Manag. 2019, 22, 205–217. [Google Scholar] [CrossRef]
  3. Khoshnevis, B. Contour crafting: A new rapid prototyping process. In Proceedings of the International Conference on Rapid Prototyping, Chapel Hill, NC, USA, 24–26 June 1997; pp. 13–22. [Google Scholar]
  4. Giwa, I.; Moore, D.; Fiske, M.; Kazemian, A. Planetary Construction 3D Printing Using Lunar and Martian In Situ Materials. In Earth and Space 2022: Space Exploration, Utilization, Engineering, and Construction in Extreme Environments—Selected Papers from the 18th Biennial International Conference on Engineering, Science, Construction, and Operations in Challenging Environments; 2023; pp. 817–831. Available online: https://ascelibrary.org/doi/10.1061/9780784484470.069 (accessed on 29 March 2024).
  5. Kazemian, A.; Giwa, I.; Ekenel, M. Large-Scale Additive Manufacturing for Automated Construction—An Overview. In Additive Manufacturing Design and Applications; ASM International: Materials Park, OH, USA, 2023; pp. 1–8. [Google Scholar] [CrossRef]
  6. Giwa, I.; Hebert, M.; Lamendola, J.; Fiske, M.; Kazemian, A. Planetary Robotic Construction Using Large-Scale 3D Printing with Sulfur Concrete. In Construction Research Congress; 2024; pp. 586–596. Available online: https://ascelibrary.org/doi/abs/10.1061/9780784485262.060 (accessed on 29 March 2024).
  7. Bos, F.; Wolfs, R.; Ahmed, Z.; Salet, T. Additive manufacturing of concrete in construction: Potentials and challenges of 3D concrete printing. Virtual Phys. Prototyp. 2016, 11, 209–225. [Google Scholar] [CrossRef]
  8. Buswell, R.A.; Leal de Silva, W.R.; Jones, S.Z.; Dirrenberger, J. 3D printing using concrete extrusion: A roadmap for research. Cem. Concr. Res. 2018, 112, 37–49. [Google Scholar] [CrossRef]
  9. Wangler, T.; Roussel, N.; Bos, F.P.; Salet, T.A.M.; Flatt, R.J. Digital Concrete: A Review. Cem. Concr. Res. 2019, 123, 105780. [Google Scholar] [CrossRef]
  10. De Schutter, G.; Lesage, K.; Mechtcherine, V.; Nerella, V.N.; Habert, G.; Agusti-Juan, I. Vision of 3D printing with concrete—Technical, economic and environmental potentials. Cem. Concr. Res. 2018, 112, 25–36. [Google Scholar] [CrossRef]
  11. Mechtcherine, V.; van Tittelboom, K.; Kazemian, A.; Kreiger, E.; Nematollahi, B.; Nerella, V.N.; Santhanam, M.; de Schutter, G.; Van Zijl, G.; Lowke, D.; et al. A roadmap for quality control of hardening and hardened printed concrete. Cem. Concr. Res. 2022, 157, 106800. [Google Scholar] [CrossRef]
  12. Perrot, A.; Rangeard, D.; Pierre, A. Structural built-up of cement-based materials used for 3D-printing extrusion techniques. Mater. Struct./Mater. Constr. 2016, 49, 1213–1220. [Google Scholar] [CrossRef]
  13. Kazemian, A.; Seylabi, E.; Ekenel, M. Concrete 3D Printing: Challenges and Opportunities for the Construction Industry. In Innovation in Construction: A Practical Guide to Transforming the Construction Industry; Springer: Cham, Swizerland, 2022; pp. 277–299. [Google Scholar] [CrossRef]
  14. Asprone, D.; Menna, C.; Bos, F.P.; Salet, T.A.M.; Mata-Falcón, J.; Kaufmann, W. Rethinking reinforcement for digital fabrication with concrete. Cem. Concr. Res. 2018, 112, 111–121. [Google Scholar] [CrossRef]
  15. Gebhard, L.; Bischof, P.; Anton, A.; Mata-Falcón, J.; Dillenburger, B.; Kaufmann, W. Pre-installed Reinforcement for 3D Concrete Printing. In Third RILEM International Conference on Concrete and Digital Fabrication; RILEM Bookseries; Springer: Cham, Swizerland, 2022; Volume 37, pp. 430–435. [Google Scholar] [CrossRef]
  16. Asprone, D.; Auricchio, F.; Menna, C.; Mercuri, V. 3D printing of reinforced concrete elements: Technology and design approach. Constr. Build. Mater. 2018, 165, 218–231. [Google Scholar] [CrossRef]
  17. Vantyghem, G.; De Corte, W.; Shakour, E.; Amir, O. 3D printing of a post-tensioned concrete girder designed by topology optimization. Autom. Constr. 2020, 112, 103084. [Google Scholar] [CrossRef]
  18. Bos, F.P.; Ahmed, Z.Y.; Jutinov, E.R.; Salet, T.A.M. Experimental exploration of metal cable as reinforcement in 3D printed concrete. Materials 2017, 10, 1314. [Google Scholar] [CrossRef] [PubMed]
  19. Li, Z.; Wang, L.; Ma, G. Mechanical improvement of continuous steel microcable reinforced geopolymer composites for 3D printing subjected to different loading conditions. Compos. Part B Eng. 2020, 187, 107796. [Google Scholar] [CrossRef]
  20. Scheurer, M.; Quenzel, P.; Nölke, P.; Reuter-Schniete, J.; Gries, T. Investigating the feasibility of using carbon fiber tapes as reinforcement for 3D concrete printing. Civ. Eng. Des. 2021, 3, 136–142. [Google Scholar] [CrossRef]
  21. Hojati, M.; Memari, A.M.; Zahabi, M.; Wu, Z.; Li, Z.; Park, K.; Nazarian, S.; Duarte, J.P. Barbed-wire reinforcement for 3D concrete printing. Autom. Constr. 2022, 141, 104438. [Google Scholar] [CrossRef]
  22. Panda, B.; Chandra Paul, S.; Jen Tan, M. Anisotropic mechanical performance of 3D printed fiber reinforced sustainable construction material. Mater. Lett. 2017, 209, 146–149. [Google Scholar] [CrossRef]
  23. Ma, G.; Li, Z.; Wang, L.; Wang, F.; Sanjayan, J. Mechanical anisotropy of aligned fiber reinforced composite for extrusion-based 3D printing. Constr. Build. Mater. 2019, 202, 770–783. [Google Scholar] [CrossRef]
  24. Sun, X.; Zhou, J.; Wang, Q.; Shi, J.; Wang, H. PVA fibre reinforced high-strength cementitious composite for 3D printing: Mechanical properties and durability. Addit. Manuf. 2022, 49, 102500. [Google Scholar] [CrossRef]
  25. Shafighfard, T.; Cender, T.A.; Demir, E. Additive manufacturing of compliance optimized variable stiffness composites through short fiber alignment along curvilinear paths. Addit. Manuf. 2021, 37, 101728. [Google Scholar] [CrossRef]
  26. Ye, J.; Cui, C.; Yu, J.; Yu, K.; Dong, F. Effect of polyethylene fiber content on workability and mechanical-anisotropic properties of 3D printed ultra-high ductile concrete. Constr. Build. Mater. 2021, 281, 122586. [Google Scholar] [CrossRef]
  27. Bos, F.P.; Bosco, E.; Salet, T.A.M. Ductility of 3D printed concrete reinforced with short straight steel fibers. Virtual Phys. Prototyp. 2018, 14, 160–174. [Google Scholar] [CrossRef]
  28. Pham, L.; Tran, P.; Sanjayan, J. Steel fibres reinforced 3D printed concrete: Influence of fibre sizes on mechanical performance. Constr. Build. Mater. 2020, 250, 118785. [Google Scholar] [CrossRef]
  29. Ahmed, H.; Giwa, I.; Game, D.E.; Hebert, M.; Noorvand, H.; Arce, G.A.; Hassan, M.; Kazemian, A. Studying Steel Fiber Reinforcement for 3D Printed Elements and Structures. In Proceedings of the Tran-SET 2022, San Antonio, TX, USA, 31 August–2 September 2022; pp. 299–309. [Google Scholar] [CrossRef]
  30. Giwa, I.; Game, D.; Ahmed, H.; Noorvand, H.; Arce, G.; Hassan, M.; Kazemian, A. Performance and Macrostructural Characterization of 3D Printed Steel Fiber Reinforced Cementitious Materials. Constr. Build. Mater. 2023, 369, 130593. [Google Scholar] [CrossRef]
  31. Arunothayan, A.R.; Nematollahi, B.; Ranade, R.; Bong, S.H.; Sanjayan, J.G.; Khayat, K.H. Fiber orientation effects on ultra-high performance concrete formed by 3D printing. Cem. Concr. Res. 2021, 143, 106384. [Google Scholar] [CrossRef]
  32. Singh, A.; Liu, Q.; Xiao, J.; Lyu, Q. Mechanical and Macrostructural Properties of 3D Printed Concrete Dosed with Steel Fibers under Different Loading Direction. Constr. Build. Mater. 2022, 323, 126616. [Google Scholar] [CrossRef]
  33. Lu, B.; Weng, Y.; Li, M.; Qian, Y.; Leong, K.F.; Tan, M.J.; Qian, S. A Systematical Review of 3D Printable Cementitious Materials. Constr. Build. Mater. 2019, 207, 477–490. [Google Scholar] [CrossRef]
  34. Mesnil, R.; Poussard, V.; Sab, K.; Caron, J.F. On the geometrical origin of the anisotropy in extrusion-based 3d printed structures. Eng. Struct. 2023, 275, 115082. [Google Scholar] [CrossRef]
  35. Marchment, T.; Sanjayan, J. Bond Properties of Reinforcing Bar Penetrations in 3D Concrete Printing. Autom. Constr. 2020, 120, 103394. [Google Scholar] [CrossRef]
  36. Park, J.; Bui, Q.-T.; Lee, J.; Joh, C.; Yang, I.-H. Interlayer Strength of 3D-Printed Mortar Reinforced by Postinstalled Reinforcement. Materials 2021, 14, 6630. [Google Scholar] [CrossRef] [PubMed]
  37. Perrot, A.; Jacquet, Y.; Rangeard, D.; Courteille, E.; Sonebi, M. Nailing of Layers: A Promising Way to Reinforce Concrete 3D Printing Structures. Materials 2020, 13, 1518. [Google Scholar] [CrossRef]
  38. Wang, L.; Ma, G.; Liu, T.; Buswell, R.; Li, Z. Interlayer Reinforcement of 3D Printed Concrete by the In-Process Deposition of U-Nails. Cem. Concr. Res. 2021, 148, 106535. [Google Scholar] [CrossRef]
  39. Cao, X.; Yu, S.; Zheng, D.; Cui, H. Nail planting to enhance the interface bonding strength in 3D printed concrete. Autom. Constr. 2022, 141, 104392. [Google Scholar] [CrossRef]
  40. Marchment, T.; Sanjayan, J. Reinforcement method for 3D concrete printing using paste-coated bar penetrations. Autom. Constr. 2021, 127, 103694. [Google Scholar] [CrossRef]
  41. Hass, L.; Bos, F.P.; Salet, T.A.M. Characterizing the bond properties of automatically placed helical reinforcement in 3D printed concrete. Constr. Build. Mater. 2022, 355, 129228. [Google Scholar] [CrossRef]
  42. ASTM C150-07; Standard Specification for Portland Cement. ASTM: West Conshohocken, PA, USA, 2018; Volume 04.
  43. ASTM A820-96; Standard Specification for Steel Fibers for Fiber-Reinforced Concrete. ASTM: West Conshohocken, PA, USA, 1996.
  44. ASTM C1437-20; Standard Test Method for Flow of Hydraulic Cement Mortar. ASTM: West Conshohocken, PA, USA, 2020.
  45. ASTM C109/C109M-20; Standard Test Method for Compressive Strength of Hydraulic Cement Mortars (Using 2-in. or [50-Mm] Cube Specimens). ASTM: West Conshohocken, PA, USA, 2020.
  46. ASTM C78-09; Standard Test Method for Flexural Strength of Concrete (Using Simple Beam with Third-Point Loading). ASTM: West Conshohocken, PA, USA, 2009.
  47. ASTM C1609/C1609M-12; Standard Test Method for Flexural Performance of Fiber-Reinforced Concrete (Using Beam With Third-Point Loading). ASTM: West Conshohocken, PA, USA, 2012.
  48. JSCE Recommendations for Design and Construction of High Performance Fiber Reinforced Cement Composites with Multiple Fine Cracks (HPFRCC). Concrete Engineereing Series 2008, 82, Testing Method 6–10. Available online: https://www.jsce.or.jp/committee/concrete/e/newsletter/newsletter12/Yokota.pdf (accessed on 29 March 2024).
  49. Kazemian, A.; Yuan, X.; Cochran, E.; Khoshnevis, B. Cementitious materials for construction-scale 3D printing: Laboratory testing of fresh printing mixture. Constr. Build Mater. 2017, 145, 639–647. [Google Scholar] [CrossRef]
  50. Nishiwaki, T.; Miyata, Y.; Furue, S.; Fukatsu, S.; Kajita, H. Reinforcing Interlayers of Three-Dimensional-Printed Mortar Using Metal Fiber Insertion. ACI Mater. J. 2021, 118, 331–340. [Google Scholar] [CrossRef]
  51. Bester, F.; van den Heever, M.; Kruger, J.; Cho, S.; van Zijl, G. Steel Fiber Links in 3D Printed Concrete. In Second RILEM International Conference on Concrete and Digital Fabrication; RILEM Bookseries; Springer: Cham, Swizerland, 2020; Volume 28, pp. 398–406. [Google Scholar] [CrossRef]
  52. Matthäus, C.; Kofler, N.; Kränkel, T.; Weger, D.; Gehlen, C. Interlayer Reinforcement Combined with Fiber Reinforcement for Extruded Lightweight Mortar Elements. Materials 2020, 13, 4778. [Google Scholar] [CrossRef] [PubMed]
  53. ACI CODE-318-19(22); Building Code Requirements for Structural Concrete and Commentary. ACI: Farmington Hills, MI, USA, 2022.
  54. Marchment, T.; Sanjayan, J. Lap Joint Reinforcement for 3D Concrete Printing. J. Struct. Eng. 2022, 148, 04022063. [Google Scholar] [CrossRef]
  55. Wang, Z.; Jia, L.; Deng, Z.; Zhang, C.; Zhang, Z.; Chen, C.; Pan, J.; Zhang, Y. Bond behavior between steel bars and 3D printed concrete: Effect of concrete rheological property, steel bar diameter and paste coating. Constr. Build. Mater. 2022, 349, 128708. [Google Scholar] [CrossRef]
  56. Kruger, J.; du Plessis, A.; van Zijl, G. An investigation into the porosity of extrusion-based 3D printed concrete. Addit. Manuf. 2021, 37, 101740. [Google Scholar] [CrossRef]
  57. Arunothayan, A.R.; Nematollahi, B.; Ranade, R.; Bong, S.H.; Sanjayan, J. Development of 3D-printable ultra-high performance fiber-reinforced concrete for digital construction. Constr. Build. Mater. 2020, 257, 119546. [Google Scholar] [CrossRef]
  58. Ogura, H.; Naidu Nerella, V.; Mechtcherine, V. Developing and Testing of Strain-Hardening Cement-Based Composites (SHCC) in the Context of 3D-Printing. Materials 2018, 11, 1375. [Google Scholar] [CrossRef] [PubMed]
  59. Zhu, B.; Pan, J.; Nematollahi, B.; Zhou, Z.; Zhang, Y.; Sanjayan, J. Development of 3D printable engineered cementitious composites with ultra-high tensile ductility for digital construction. Mater. Des. 2019, 181, 108088. [Google Scholar] [CrossRef]
  60. Kang, S.T.; Lee, B.Y.; Kim, J.K.; Kim, Y.Y. The effect of fibre distribution characteristics on the flexural strength of steel fibre-reinforced ultra high strength concrete. Constr. Build. Mater. 2011, 25, 2450–2457. [Google Scholar] [CrossRef]
  61. Le, T.T.; Austin, S.A.; Lim, S.; Buswell, R.A.; Law, R.; Gibb, A.G.F.; Thorpe, T. Hardened properties of high-performance printing concrete. Cem. Concr. Res. 2012, 42, 558–566. [Google Scholar] [CrossRef]
  62. Yazici, Ş.; Arel, H.Ş. The Effect of Steel Fiber on the Bond between Concrete and Deformed Steel Bar in SFRCs. Constr. Build. Mater. 2013, 40, 299–305. [Google Scholar] [CrossRef]
  63. Garcia-Taengua, E.; Martí-Vargas, J.R.; Serna, P. Bond of reinforcing bars to steel fiber reinforced concrete. Constr. Build. Mater. 2016, 105, 275–284. [Google Scholar] [CrossRef]
  64. Mahmud, G.H.; Yang, Z.; Hassan, A.M.T. Experimental and Numerical Studies of Size Effects of Ultra High Performance Steel Fibre Reinforced Concrete (UHPFRC) Beams. Constr. Build. Mater. 2013, 48, 1027–1034. [Google Scholar] [CrossRef]
  65. Rabi, M.; Shamass, R.; Cashell, K.A. Structural performance of stainless steel reinforced concrete members: A review. Constr. Build. Mater. 2022, 325, 126673. [Google Scholar] [CrossRef]
Figure 1. Concrete printing system and the nozzle used in this study.
Buildings 14 01167 g001
Figure 2. Developed reinforcement insertion device integrated with the printhead.
Buildings 14 01167 g002
Figure 3. Test setup for (a) Compressive strength test; (b) 4-point bending tests according to ASTM C78; (c) Uniaxial tensile test.
Buildings 14 01167 g003
Figure 4. Testing 3D-printed beams in X, Y, and Z directions.
Buildings 14 01167 g004
Figure 5. 3D-printed specimen for testing in X and Y directions.
Buildings 14 01167 g005
Figure 6. (a) 3D-printed wall specimen for testing in the Z direction; (b) The extraction process of the beams.
Buildings 14 01167 g006
Figure 7. Examples of different reinforcement types and the resulting voids: (a) 10 mm rebar with a flat tip; (b) 10 mm rebar with tapered tip; (c) 6 mm threaded bar with a tapered tip; (d) 6 mm threaded reinforcement (selected for the main experiments).
Buildings 14 01167 g007
Figure 8. Dimensions of the stainless steel threaded reinforcement used in this study.
Buildings 14 01167 g008
Figure 9. The designed reinforcement configuration for F2.5-3DP-Z-TR beams.
Buildings 14 01167 g009
Figure 10. (a) Discontinuous threaded reinforcement insertion during the 3D-printing process; (b) Inserted threaded reinforcement with minimal resulting voids.
Buildings 14 01167 g010
Figure 11. 4-point bending tests for beams in (a) X direction, (b) Y direction, and (c) Z direction following ASTM C1609.
Buildings 14 01167 g011
Figure 12. ROI selection and segmentation of 2D slices.
Buildings 14 01167 g012
Figure 13. (a) Mold-cast reinforced specimen; (b) 3D-printed reinforced specimen used for the CT scanning process.
Buildings 14 01167 g013
Figure 14. The effect of nozzle size on the shape stability of plain and fiber-reinforced printing materials.
Buildings 14 01167 g014
Figure 15. The flexural strength of 3D-printed and mold-cast beams.
Buildings 14 01167 g015
Figure 16. Flexural stress vs. deflection curves (a) F2.5-MC; (b) F2.5-3DP-X; (c) F2.5-3DP-Y; (d) F2.5-3DP-Z; (e) F2.5-3DP-Z-TR.
Buildings 14 01167 g016
Figure 17. (a) Flexural toughness T 150 100   and (b) deflection capacity of F2.5 mixtures.
Buildings 14 01167 g017
Figure 18. The cracking pattern of mold-cast and 3D-printed beams.
Buildings 14 01167 g018
Figure 19. Total and connected porosity of mold-cast and 3D-printed specimens.
Buildings 14 01167 g019
Figure 20. 2D porosity distribution along the Z axis of the threaded reinforcement (a) CT-MC-TR-1; (b) CT-MC-TR-2; (c) CT-3DP-TR-1; (d) CT-3DP-TR-2.
Buildings 14 01167 g020
Figure 21. Illustration of void creation (a) 2D CT slides; (b) 3D volume rendering (top view).
Buildings 14 01167 g021
Table 1. Chemical oxide composition of Portland cement (% by mass).
MaterialSiO2Al2O3Fe2O3CaOMgOSO3LOI
Cement20.04.33.164.32.13.33.1
Table 2. Physical and mechanical properties of steel fiber.
Fiber TypeLength (mm)Diameter (mm)Aspect RatioElastic Modulus (GPa)Tensile Strength (MPa)Density (g/cm3)Fracture Elongation (%)
Brass-Coated Straight Steel130.26521028507.82.3
Table 3. Mixture proportions of the selected mixtures used in the study.
Mixture IDPortland Cement
kg/m3
W/C 1SSD 2 Sand (S)
kg/m3
HRWRA
% 3
Fiber
kg/m3
[vol.%]
F08180.3511450.020 [0.0]
F2.57980.3511170.22190 [2.5]
1 Water to cement ratio. 2 Saturated surface dried. 3 Percentage of Portland cement by mass.
Table 4. The results of conventional characterization tests.
IDWet DensityFlow
Table
Value
f c Flexural PropertiesTensile Properties
MOR δ p T 150 100 First-Cracking StrengthTensile StrengthStrain at Peak Stress G T v
kg/m3mmMPaMPammJouleMPaMPa%KJ/m2
F02259170–18548.67.21--2.042.040.01-
F2.52397170–18573.310.050.88638.5023.224.740.624.76
Note: f c = Compressive strength; δp = Deflection capacity; T 150 100 and G T v = Toughness values from the flexural strength test and uniaxial strength test, respectively.
Disclaimer/Publisher’s Note: The statements, opinions and data contained in all publications are solely those of the individual author(s) and contributor(s) and not of MDPI and/or the editor(s). MDPI and/or the editor(s) disclaim responsibility for any injury to people or property resulting from any ideas, methods, instructions or products referred to in the content.

