The Extraction of Roof Feature Lines of Traditional Chinese Village Buildings Based on UAV Dense Matching Point Clouds

 ,
,
Abstract
:1. Introduction
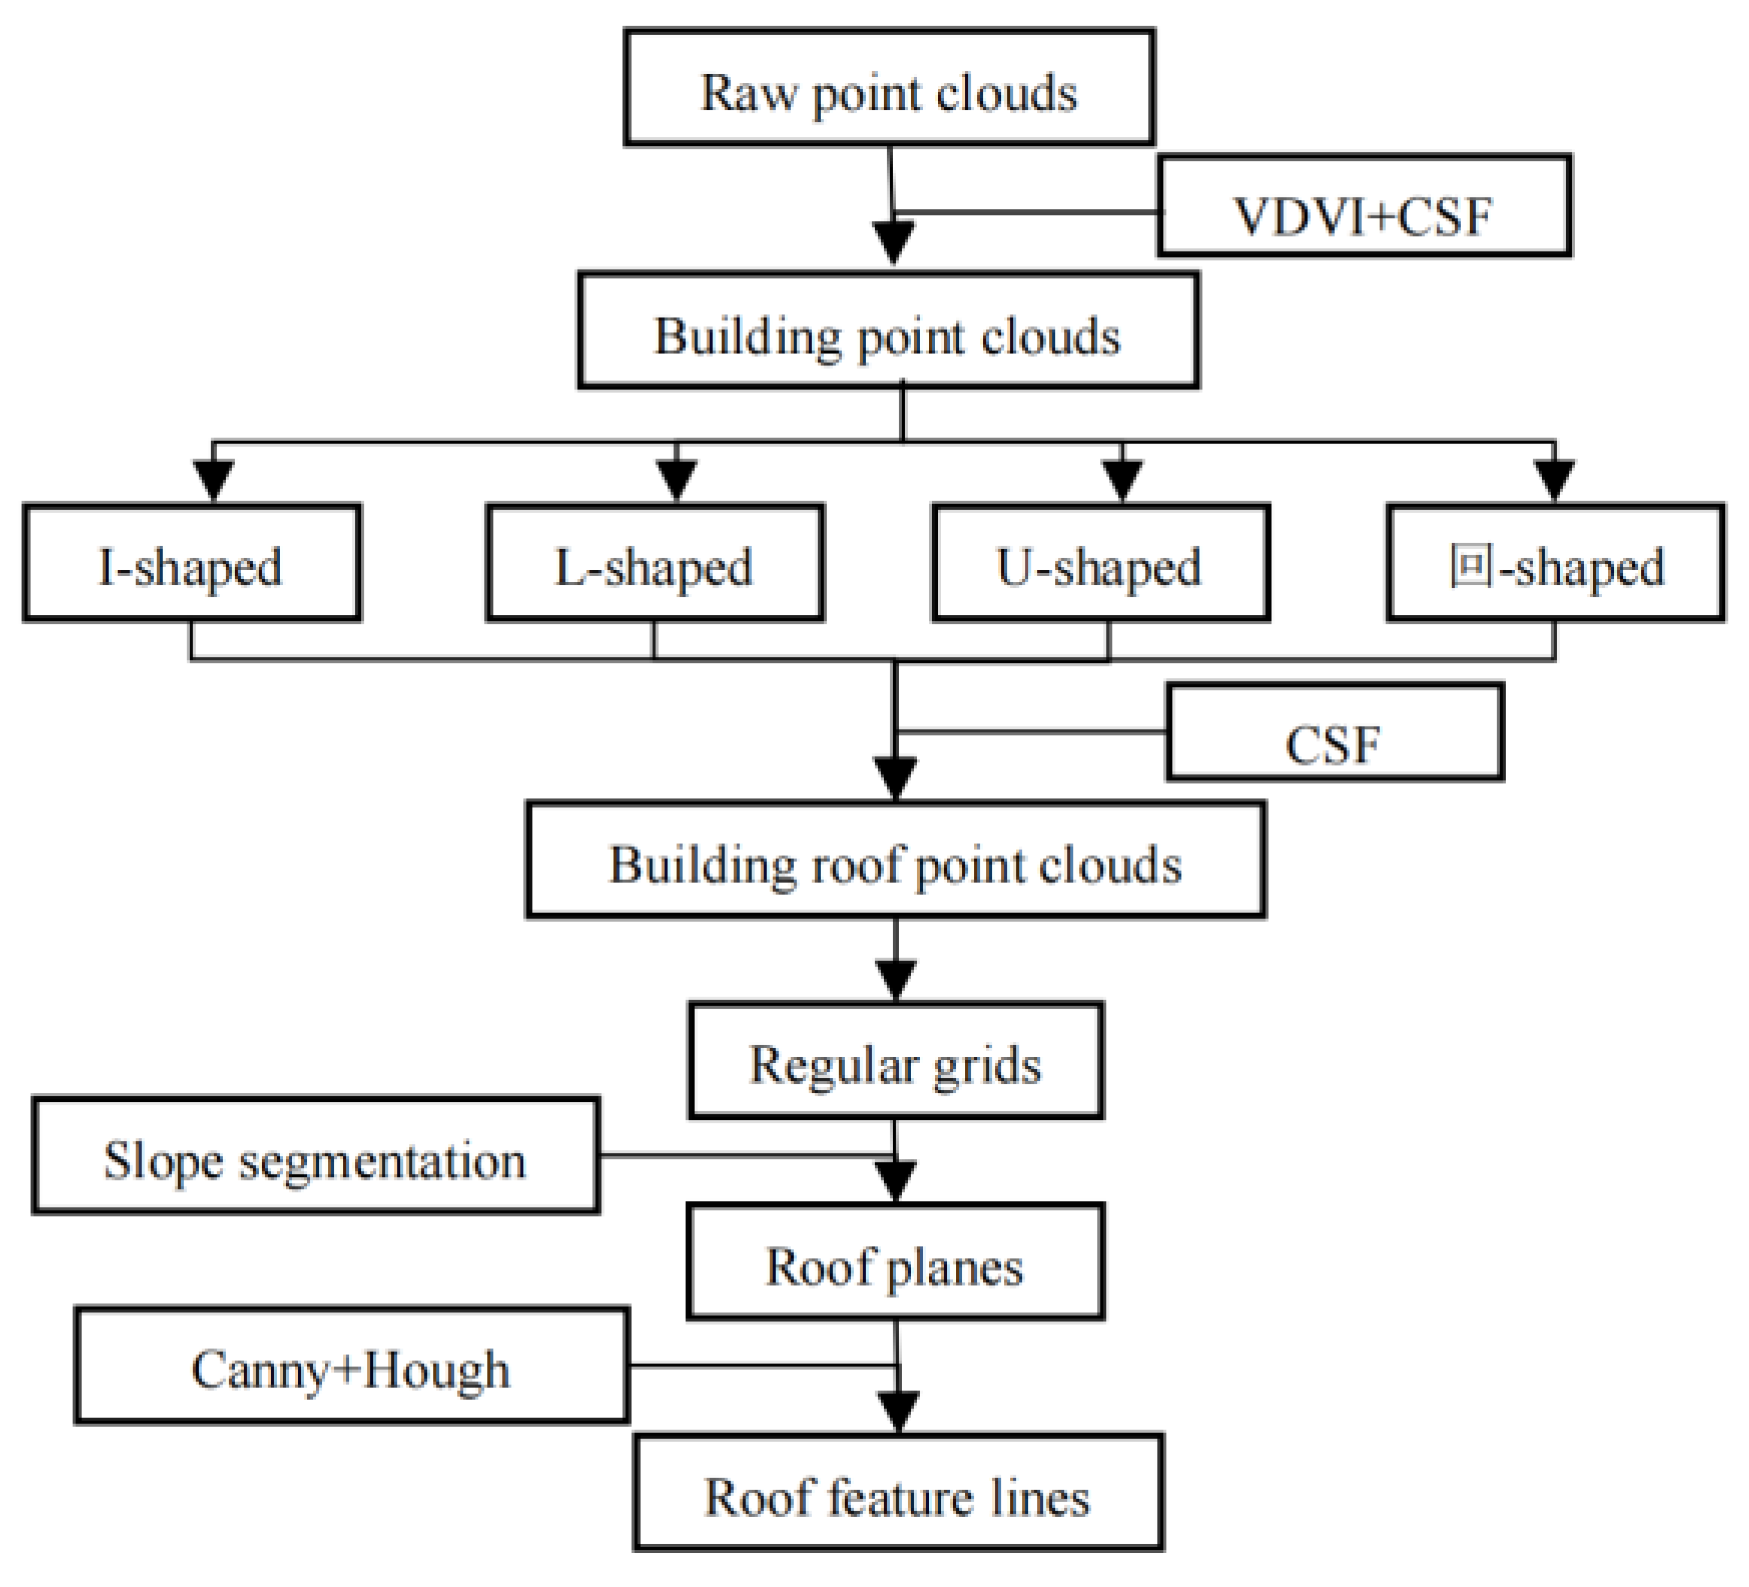
2. Methods
2.1. Building Point Cloud Extraction
2.1.1. VDVI
2.1.2. CSF Algorithm
2.2. Roof point Cloud Segmentation
2.2.1. Roof Point Cloud Extraction
2.2.2. Slope Segmentation
2.3. Feature Line Extraction
3. Experimental Results and Analysis
3.1. Experimental Data
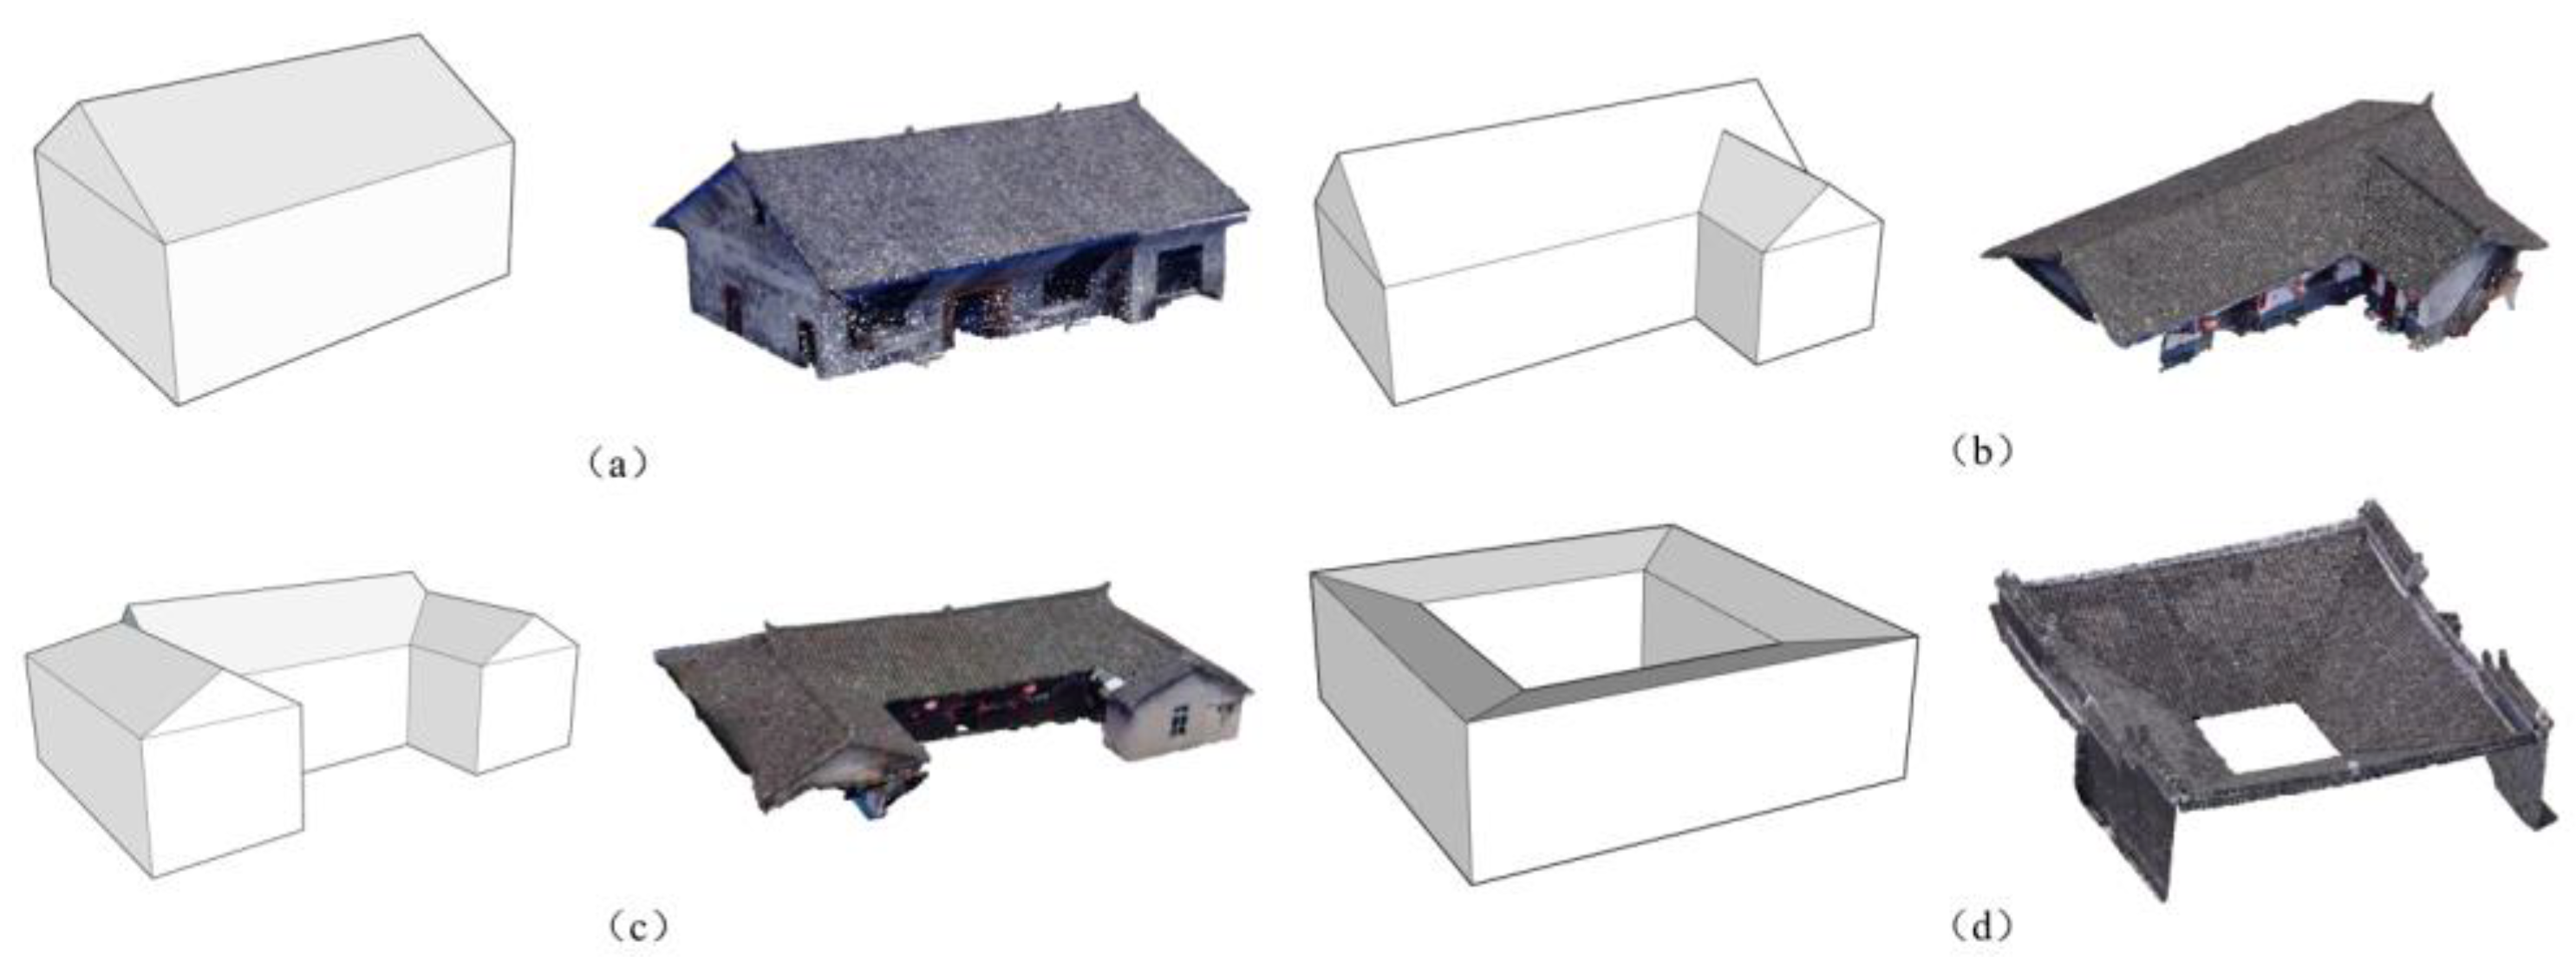
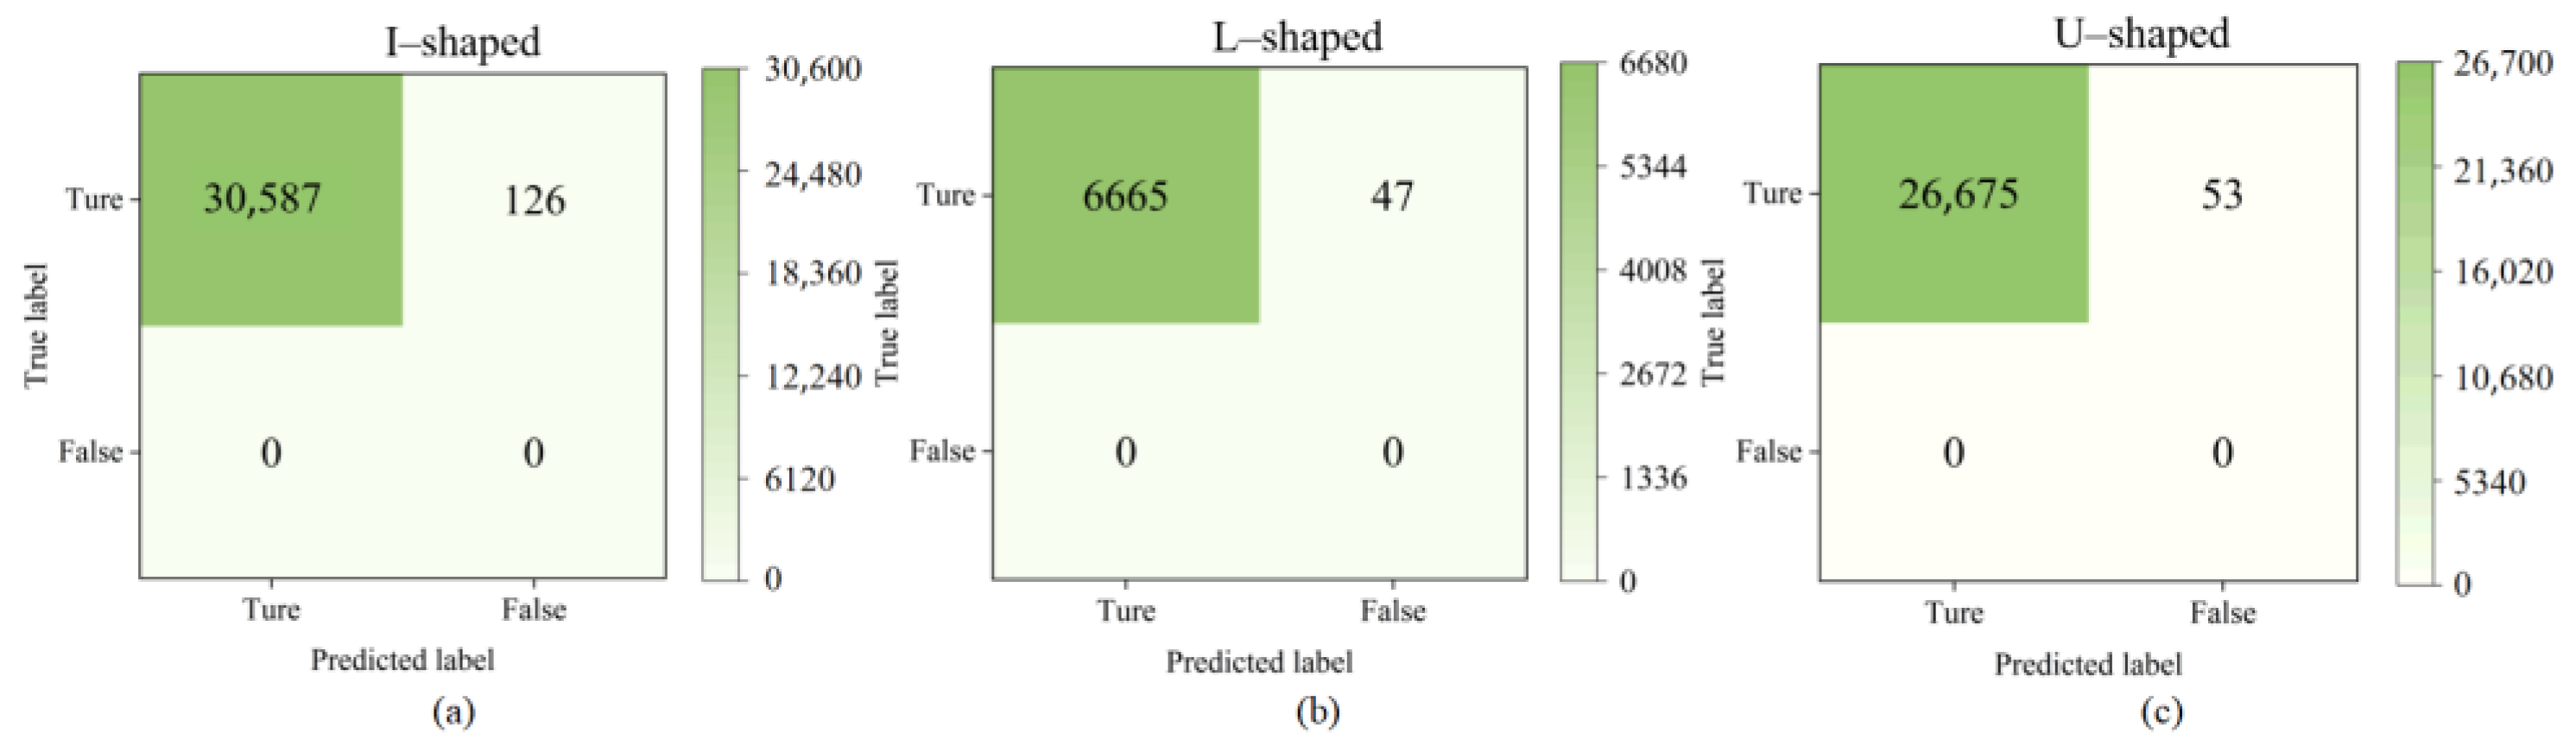
3.2. Building Point Cloud Extraction and Typology
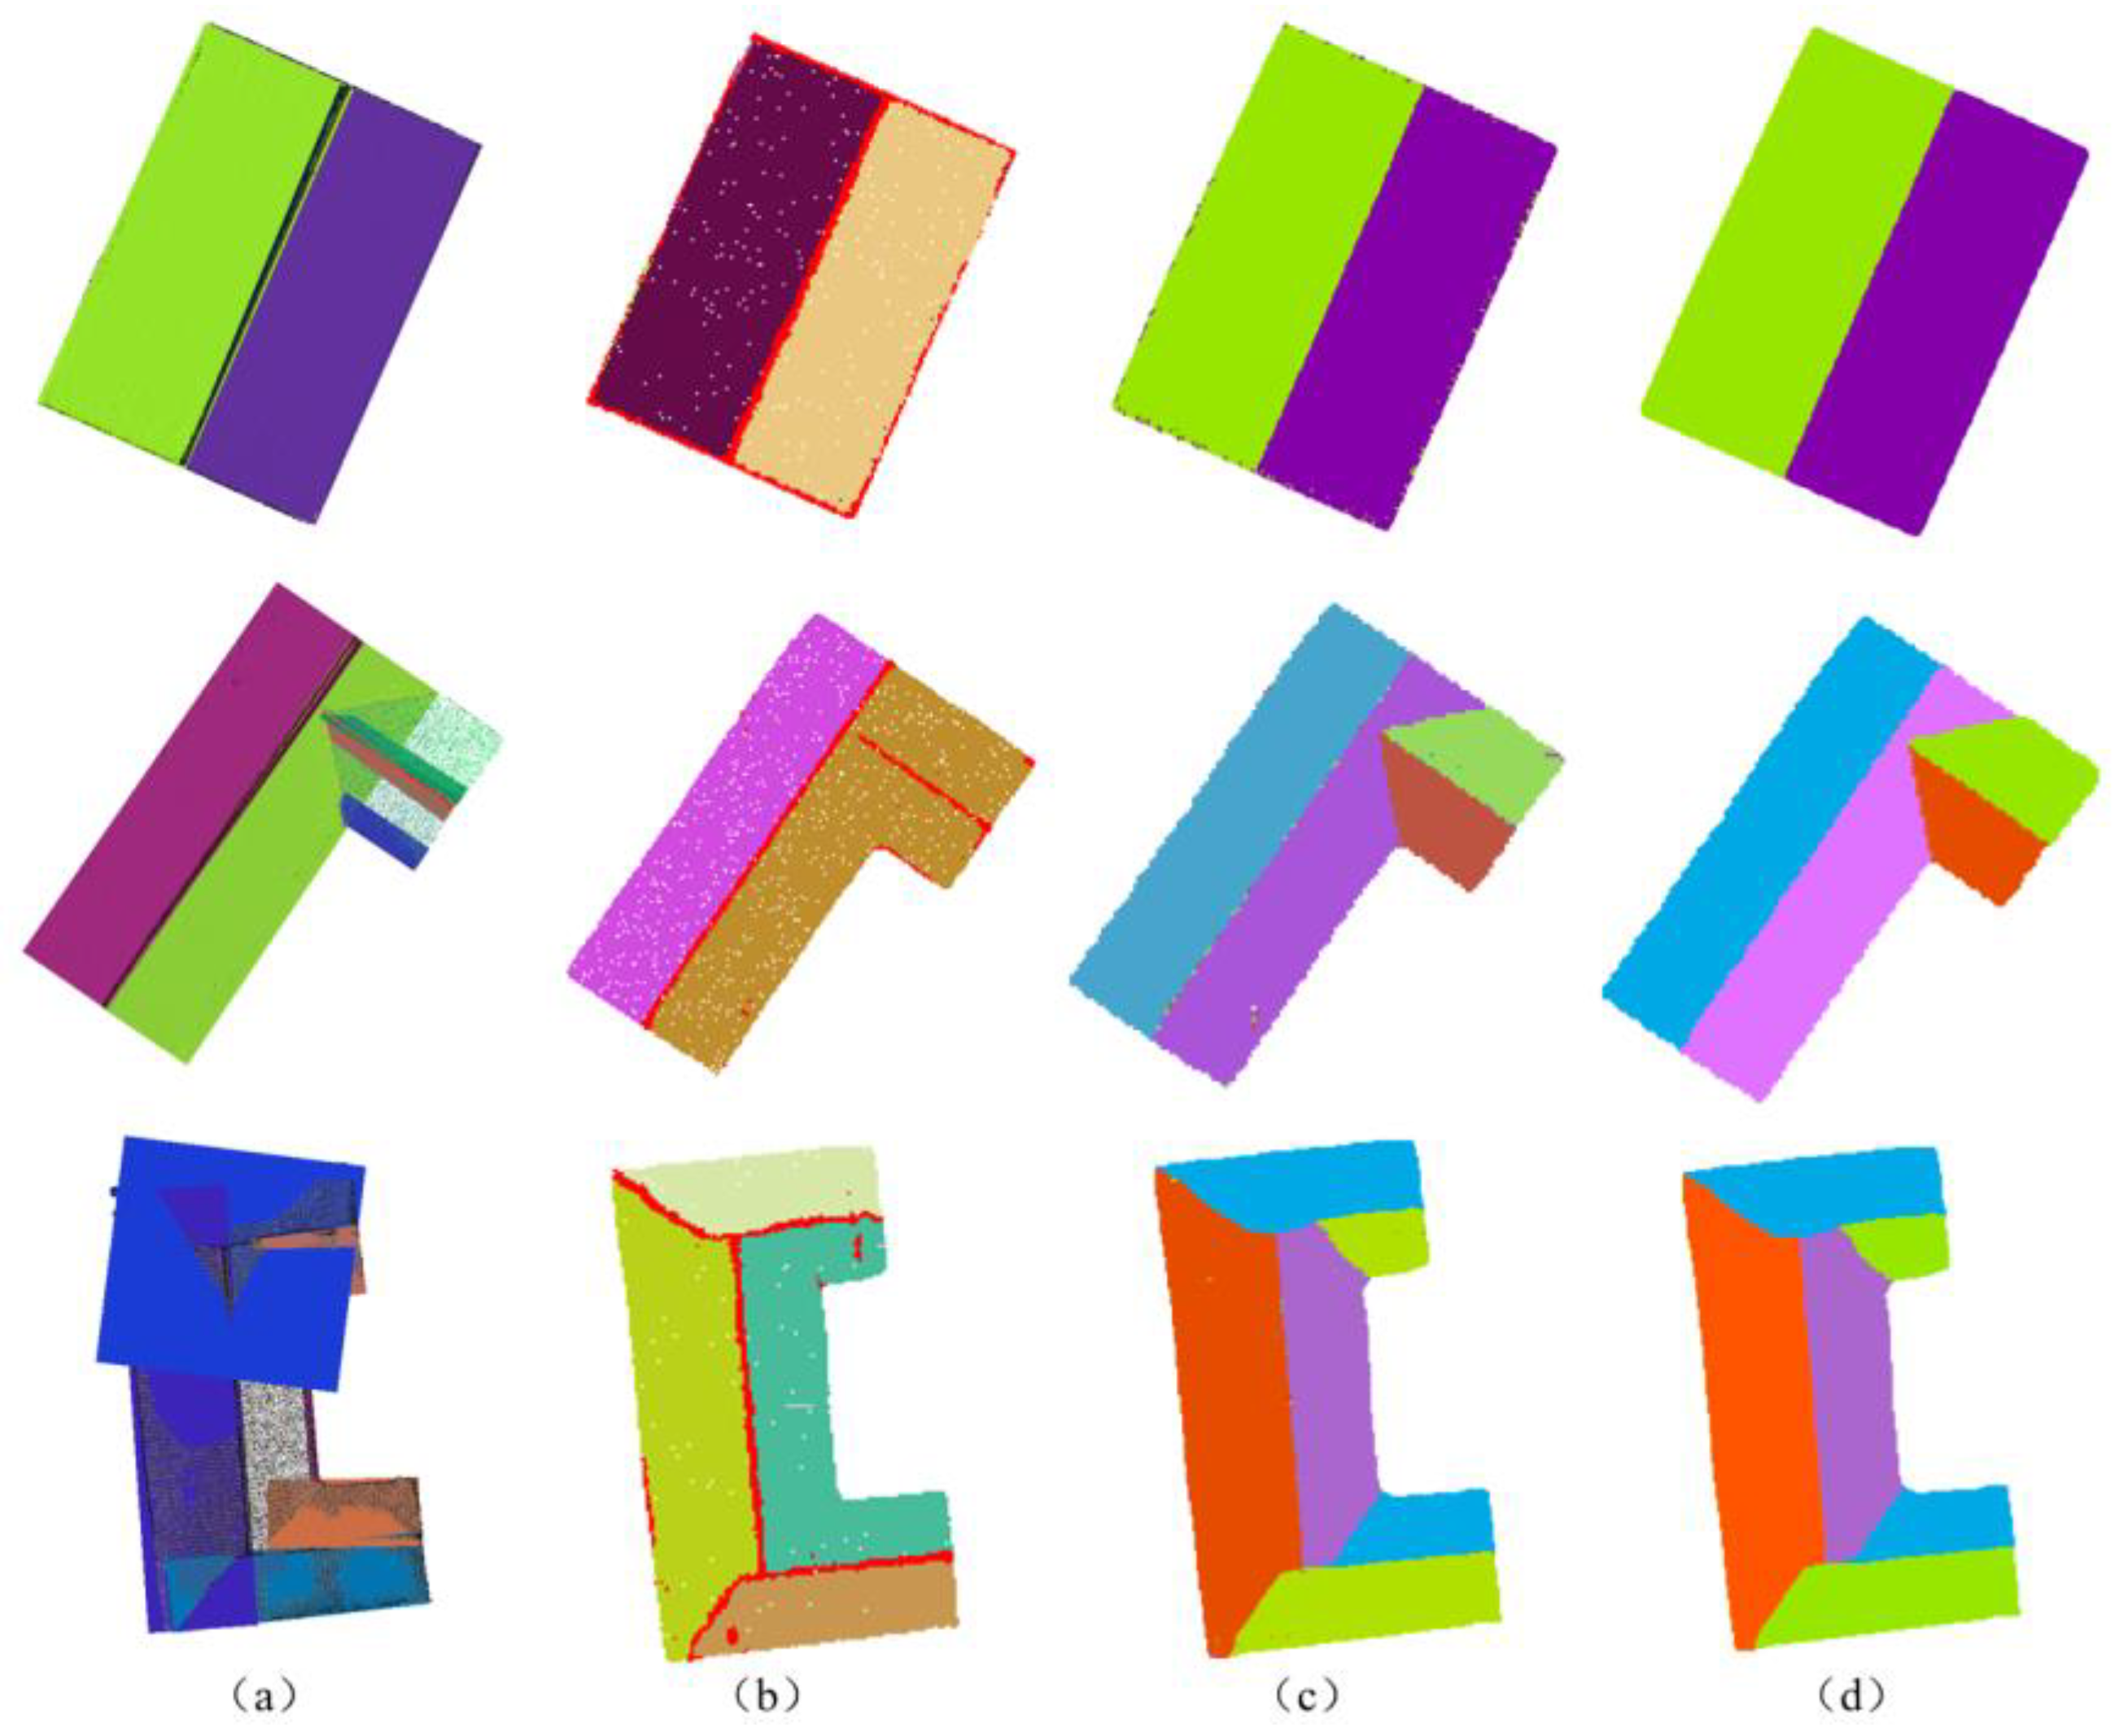
3.3. Roof Extraction and Slope Segmentation
3.4. Feature Line Extraction and Regularisation
4. Conclusions
Author Contributions
Funding
Data Availability Statement
Conflicts of Interest
References
- Jia, B.C.; Wang, L.; Li, J.Y.; Zuo, X. A Deformation Monitoring Method of Brick-Concrete Building Based on 3D Laser Scanning and Wall Length. Appl. Laser 2024, 44, 56–65. [Google Scholar]
- Wang, L. Application of 3D information expression method of ancient buildings based on point cloud data and BIM. J. Phys. Conf. Ser. 2021, 2037, 012127. [Google Scholar] [CrossRef]
- Van Nguyen, S.; Le, S.T.; Tran, M.K.; Tran, H.M. Reconstruction of 3D digital heritage objects for VR and AR applications. J. Inf. Telecommun. 2022, 6, 254–269. [Google Scholar] [CrossRef]
- Huo, P.P.; Hou, M.L.; Yang, S.; Hou, Q.; Zhou, Q.; Li, A.; Yang, S. Automatic extraction of building rooftop outlines using airborne LiDAR: A review. Geomat. World 2019, 26, 1–13. [Google Scholar]
- Che, D.; Su, M.; Ma, B.; Chen, F.; Liu, Y.; Wang, D.; Sun, Y.A. Three-Dimensional Triangle Mesh Integration Method for Oblique Photography Model Data. Buildings 2023, 13, 2266. [Google Scholar] [CrossRef]
- Dadras, M.; Shafri, H.Z.; Ahmad, N.; Pradhan, B.; Safarpour, S. Spatio-temporal analysis of urban growth from remote sensing data in Bandar Abbas City, Iran. Egypt. J. Remote Sens. Space Sci. 2015, 18, 35–52. [Google Scholar] [CrossRef]
- Du, J.L.; Chen, D.; Zhang, Z.X.; Zhang, L.Q. Research progress of building reconstruction via airborne point clouds. J. Remote Sens. 2019, 23, 374–391. [Google Scholar] [CrossRef]
- Yang, B.S.; Dong, Z. Progress and perspective of point cloud intelligence. Acta Geod. Cartogr. Sin. 2019, 48, 1575–1585. [Google Scholar] [CrossRef]
- Tang, Z.; Peng, Y.; Li, J.; Li, Z. UAV 3D Modeling and Application Based on Railroad Bridge Inspection. Buildings 2023, 14, 26. [Google Scholar] [CrossRef]
- Farmakis, I.; Karantanellis, E.; Hutchinson, D.J.; Vlachopoulos, N.; Marinos, V. Superpixel and Supervoxel Segmentation Assessment of Landslides Using UAV-Derived Models. Remote Sens. 2022, 14, 5668. [Google Scholar] [CrossRef]
- Yan, J.; Yang, Y.B.; He, Y.J.; Huang, W.X.; Tian, Y.F. Accuracy analysis of 3D modeling of UAV photogrammetry and topographic survey. Bull. Surv. Mapp. 2023, 69, 54–58. [Google Scholar]
- Mateos, R.M.; Azañón, J.M.; Roldán, F.J.; Notti, D.; Pérez-Peña, V.; Galve, J.P.; Pérez-García, J.L.; Colomo, C.M.; Gómez-López, J.M.; Montserrat, O.; et al. The combined use of PSInSAR and UAV photogrammetry techniques for the analysis of the kinematics of a coastal landslide affecting an urban area (SE Spain). Landslides 2017, 14, 743–754. [Google Scholar] [CrossRef]
- Wallace, L.; Lucieer, A.; Malenovský, Z.; Turner, D.; Vopěnka, P. Assessment of forest structure using two UAV techniques:a comparison of airborne laser scanning and structure from motion (SfM) point clouds. Forests 2016, 7, 62. [Google Scholar] [CrossRef]
- Alidoost, F.; Arefi, H. An image-based technique for 3D building reconstruction using multi-view UAV images. Int. Arch. Photogramm. Remote Sens. Spat. Inf. Sci. 2015, 40, 43–46. [Google Scholar] [CrossRef]
- Guo, H.; Su, C.; Xian, J.; Huang, Z.J. Interstorey shear force calibration method for seismic analysis of energy-dissipation building structures. Build. Struct. 2023, 53, 106–113. [Google Scholar]
- Wang, L.; Nagarajaiah, S.; Shi, W.; Zhou, Y. Seismic performance improvement of base-isolated structures using a semi-active tuned mass damper. Eng. Struct. 2022, 271, 114963. [Google Scholar] [CrossRef]
- Wang, L.; Zhou, Y.; Nagarajaiah, S.; Shi, W. Bi-directional semi-active tuned mass damper for torsional asymmetric structural seismic response control. Eng. Struct. 2023, 294, 116744. [Google Scholar] [CrossRef]
- Ma, Y.; Zhang, Y.; Lei, X.; Wang, J.; Sun, Q.; Zhou, H. Structural Monitoring and Seismic Resilience Evaluation of Buildings. Sci. Technol. Rev. 2017, 35, 77–83. [Google Scholar]
- Wang, Q.; Kim, M.K. Applications of 3D point cloud data in the construction industry: A fifteen-year review from 2004 to 2018. Adv. Eng. Inform. 2019, 39, 306–319. [Google Scholar] [CrossRef]
- Wang, J.L.; Wu, D.; Cui, X. The Building Roof Feature Line Extraction Based on Dense Matching Point Cloud. Geomat. Spat. Inf. Technol. 2022, 45, 253–256+260+264. [Google Scholar]
- Jabri, S.; Zhang, Y.; Alaeldin, S. Stereo-based building detection in very high resolution satellite imagery using IHScolor system. In Proceedings of the 2014 IEEE Geoscience and Remote Sensing Symposium, Quebec City, QC, Canada, 13–18 July 2014; pp. 2301–2304. [Google Scholar]
- Huang, X.; Zhang, L. A Multidirectional and Multiscale Morphological Index for Automatic Building Extraction from Multispectral GeoEye-1 Imagery. Photogramm. Eng. Remote Sens. 2011, 77, 721–732. [Google Scholar] [CrossRef]
- Wu, Y.; Wang, L.Y.; Hu, C.X.; Cheng, L. Extraction of building contours from airborne LiDAR point cloud using variable radius Alpha Shapes method. J. Image Graph. 2021, 26, 0910–0923. [Google Scholar]
- Lyu, S.; Li, J.Y.; Li, J.J. Performance Evaluation and Modification Suggestion Method of the Building Form Based on Machine Learning. Archit. J. 2019, 66, 31–37. [Google Scholar]
- Omati, M.; Sahebi, M.R.; Aghababaei, H. The comparative study of three nonparametric methods of SAR tomography for building reconstruction. Adv. Space Res. 2022, 69, 1743–1751. [Google Scholar] [CrossRef]
- Zhou, H.; Che, A.; Shuai, X.; Cao, Y. Seismic vulnerability assessment model of civil structures using machine learning algorithms: A case study of the 2014 Ms6.5 Ludian earthquake. Nat. Hazards 2024, 120, 1–28. [Google Scholar] [CrossRef]
- Aloisio, A.; De Santis, Y.; Irti, F.; Pasca, D.P.; Scimia, L.; Fragiacomo, M. Machine learning predictions of code-based seismic vulnerability for reinforced concrete and masonry buildings: Insights from a 300-building database. Eng. Struct. 2024, 301, 117295. [Google Scholar] [CrossRef]
- Zhu, P.; Li, S.; Zhang, L.; Li, Y. Multitask learning-based building extraction from high-resolution remote sensing images. J. Geo-Inf. Sci. 2013, 23, 514–523. [Google Scholar]
- Long, J.; Shelhamer, E.; Darrell, T. Fully Convolutional Networks for Semantic Segmentation. IEEE Trans. Pattern Anal. Mach. Intell. 2015, 39, 640–651. [Google Scholar]
- Charles, R.Q.; Su, H.; Kaichun, M.; Leonidas, J.G. PointNet: Deep Learning on Point Sets for 3D Classification and Segmentation. In Proceedings of the IEEE Conference on Computer Vision and Pattern Recognition, Honolulu, HI, USA, 21–26 July 2017; pp. 77–85. [Google Scholar]
- Fang, Q.H.; Huang, Y.; Li, H. A review of 3D reconstruction methods applied in buildings. Intell. Build. Smart City 2020, 27, 10–14. [Google Scholar]
- Huang, X.; Sohn, G.; Wang, X.; Zhang, F. Roof detection using LiDAR data based on points’ normal with weight. Geomat. Inf. Sci. Wuhan Univ. 2009, 34, 24–27. [Google Scholar]
- Gu, Y.F.; Cao, Z.M.; Dong, L.M. A hierarchical energy minimization method for building roof segmentation from airborne LiDAR data. Multimed. Tools Appl. 2017, 76, 4197–4210. [Google Scholar] [CrossRef]
- Ma, X.; Luo, W.; Chen, M.; Li, J.; Yan, X.; Zhang, X.; Wei, W. A Fast Point Cloud Segmentation Algorithm Based on Region Growth. In Proceedings of the 2019 18th International Conference on Optical Communications and Networks (ICOCN), Huangshan, China, 5–8 August 2019; pp. 1–2. [Google Scholar]
- Xu, Y.; Yao, W.; Hoegner, L.; Stilla, U. Segmentation of building roofs from airborne LiDAR point clouds using robust voxel-based region growing. Remote Sens. Lett. 2017, 8, 1062–1071. [Google Scholar] [CrossRef]
- Wang, Y.Q. Research on Building Extraction and Model Regularization from LiDAR Data. Master’s Thesis, Nanjing University, Nanjing, China, 2013. [Google Scholar]
- Saglam, A.; Makineci, H.B.; Baykan, O.; Baykan, N. Clustering-based plane refitting of non-planar patches for voxel-based 3D point cloud segmentation using K-means clustering. Int. Inf. Eng. Technol. Assoc. 2020, 37, 1019–1027. [Google Scholar] [CrossRef]
- Ywata, Y. Adaptive random sample consensus approach for segmentation of building roof in air-borne laser scanning point cloud. Int. J. Remote Sens. 2020, 41, 2047–2061. [Google Scholar]
- Liu, Y.K.; Li, Y.Q.; Liu, H.Y.; Sun, D.; Zhao, S.B. An Improved RANSAC Algorithm for Point Cloud Segmentation of Complex Building Roofs. J. Geo-Inf. Sci. 2021, 23, 1497–1507. [Google Scholar]
- Xu, J.; Li, J. Optimal RANSAC method for segmentation of complex building roof planes. Geomat. Inf. Sci. Wuhan Univ. 2023, 48, 1531–1537. [Google Scholar]
- Jiang, T.P.; Wang, Y.P.; Zhang, L.Q.; Liang, C.; Sun, J. A LiDAR point cloud hierarchical semantic segmentation method combining CNN and MRF. Acta Geod. Cartogr. Sin. 2021, 50, 215–225. [Google Scholar]
- Liu, P.L.; Deng, Y.Y. Digitized protection: A new way to protect historical and cultural towns and villages. J. Peking Univ. (Philos. Soc. Sci.) 2017, 54, 104–110. [Google Scholar]
- Song, G.T.; Zhao, Y.Q.; Wang, S. Research on protection and application of real 3D digitization of traditional village based on oblique photogrammetry. Constr. Sci. Technol. 2021, 20, 61–65. [Google Scholar]
- Wang, X.Q.; Wang, M.M.; Wang, S.Q.; Wu, Y.D. Extraction of vegetation information from visible unmanned aerial vehicle images. Trans. Chin. Soc. Agric. Eng. 2015, 31, 152–157+159+158. [Google Scholar]
- Cui, W.X.; Li, J.R.; Si, Q.C.; Wang, R.; Luo, X.Y.; Yang, F. Research on Extraction Method of Desert Shrub Coverage Based on UAV Visible Light Data. Res. Soil Water Conserv. 2021, 28, 175–182+189. [Google Scholar]
- Du, M.M.; Roshanianfard, A.; Liu, Y.C. Inversion of Wheat Tiller Density Based on Visible-Band Images of Drone. Spectrosc. Spectr. Anal. 2021, 41, 3828–3836. [Google Scholar]
- Zhang, W.M.; Qi, J.B.; Wan, P.; Wang, H.T.; Yan, G.J. An easy-to-use airborne LiDAR data filtering method based on cloth simulation. Remote Sens. 2016, 8, 501. [Google Scholar] [CrossRef]
- Zou, Z.; Zou, J.G.; Hu, H.Y. Comparative Analysis on Different Airborne Li DAR Point Cloud Filtering Algorithms. J. Geomat. 2021, 46, 52–56. [Google Scholar]
- Cai, S.; Zhang, W.; Liang, X.; Wan, P.; Qi, J.; Yu, S.; Yan, G.; Shao, J. Filtering Airborne LiDAR Data Through Complementary ClothSimulation and Progressive TIN Densification Filters. Remote Sens. 2019, 11, 1037. [Google Scholar] [CrossRef]
- Li, F.; Zhu, H.; Luo, Z.; Shen, H.; Li, L. An Adaptive Surface Interpolation Filter Using Cloth Simulation and Relief Amplitude for Airborne Laser Scanning Data. Remote Sens. 2021, 13, 2938. [Google Scholar] [CrossRef]
- Zhang, F.; Li, H.S.; Jiang, T. Digital Elevation Model Generation in LiDAR Point Cloud Based on Cloth Simulation Algorithm. Laser Optoelectron. Prog. 2020, 57, 114–121. [Google Scholar]
- Wang, G.; Wang, Q.; Liu, S.T. Method of building extraction from UAV oblique photography point cloud based on cloth simulation. Bull. Surv. Mapp. 2020, 66, 97–100. [Google Scholar]
- Zhao, C.; Zhang, B.M.; Chen, X.W.; Guo, H.T.; Lu, J. Accurate and Automatic Building Roof Extraction Using Neighborhood Information of Point Clouds. Acta Geod. Cartogr. Sin. 2017, 46, 1123–1134. [Google Scholar]
- Canny, J. A Computational Approach to Edge Detection. IEEE Trans. Pattern Anal. Mach. Intell. 1986; PAMI-8, 679–698. [Google Scholar]
- Li, J.; Wang, H.; Yan, K.; Yan, X.D.; Yang, L. Improved canny algorithm for image edge enhancement. J. Geomat. Sci. Technol. 2021, 38, 398–403. [Google Scholar]
- Gong, S.J.; Li, G.Q.; Zhang, Y.J.; Li, C.; Yu, L. Application of static gesture segmentation based on an improved canny operator. J. Eng. 2019, 3, 543–546. [Google Scholar] [CrossRef]


| Parameter | Value | Parameter | Value |
|---|---|---|---|
| Heading overlap | 80% | Parallax overlap | 78% |
| Flight height | 100 m | Flight time | 84 min |
| Image resolution | 1.5 cm | Number of control points | 6 |
| RANSAC | Region Segmentation Algorithm | Slope Segmentation Algorithm | ||||
|---|---|---|---|---|---|---|
| Total Number of Extracted Roof Slope Surfaces | Number of Correctly Extracted Roof Slope Surfaces | Total Number of Extracted Roof Slope Surfaces | Number of Correctly Extracted Roof Slope Surfaces | Total Number of Extracted Roof Slope Surfaces | Number of Correctly Extracted Roof Slope Surfaces | |
| I-shaped | 4 | 2 | 2 | 2 | 2 | 2 |
| L-shaped | 7 | 2 | 2 | 1 | 4 | 4 |
| U-shaped | 8 | 4 | 4 | 3 | 6 | 6 |
Disclaimer/Publisher’s Note: The statements, opinions and data contained in all publications are solely those of the individual author(s) and contributor(s) and not of MDPI and/or the editor(s). MDPI and/or the editor(s) disclaim responsibility for any injury to people or property resulting from any ideas, methods, instructions or products referred to in the content. |
© 2024 by the authors. Licensee MDPI, Basel, Switzerland. This article is an open access article distributed under the terms and conditions of the Creative Commons Attribution (CC BY) license (https://creativecommons.org/licenses/by/4.0/).
Share and Cite
Zhou, W.; Fu, X.; Deng, Y.; Yan, J.; Zhou, J.; Liu, P. The Extraction of Roof Feature Lines of Traditional Chinese Village Buildings Based on UAV Dense Matching Point Clouds. Buildings 2024, 14, 1180. https://doi.org/10.3390/buildings14041180
Zhou W, Fu X, Deng Y, Yan J, Zhou J, Liu P. The Extraction of Roof Feature Lines of Traditional Chinese Village Buildings Based on UAV Dense Matching Point Clouds. Buildings. 2024; 14(4):1180. https://doi.org/10.3390/buildings14041180
Chicago/Turabian StyleZhou, Wenlong, Xiangxiang Fu, Yunyuan Deng, Jinbiao Yan, Jialu Zhou, and Peilin Liu. 2024. "The Extraction of Roof Feature Lines of Traditional Chinese Village Buildings Based on UAV Dense Matching Point Clouds" Buildings 14, no. 4: 1180. https://doi.org/10.3390/buildings14041180